the 2014 cefor nomis ocean hull report reports/2014/2014 cefor... · the 2014 cefor nomis ocean...
TRANSCRIPT

THE 2014 CEFOR NOMIS OCEAN HULL REPORT(VESSELS WITH REGISTERED IMO NUMBER)
Nordic Marine Insurance Statistics as of 31 December 2014
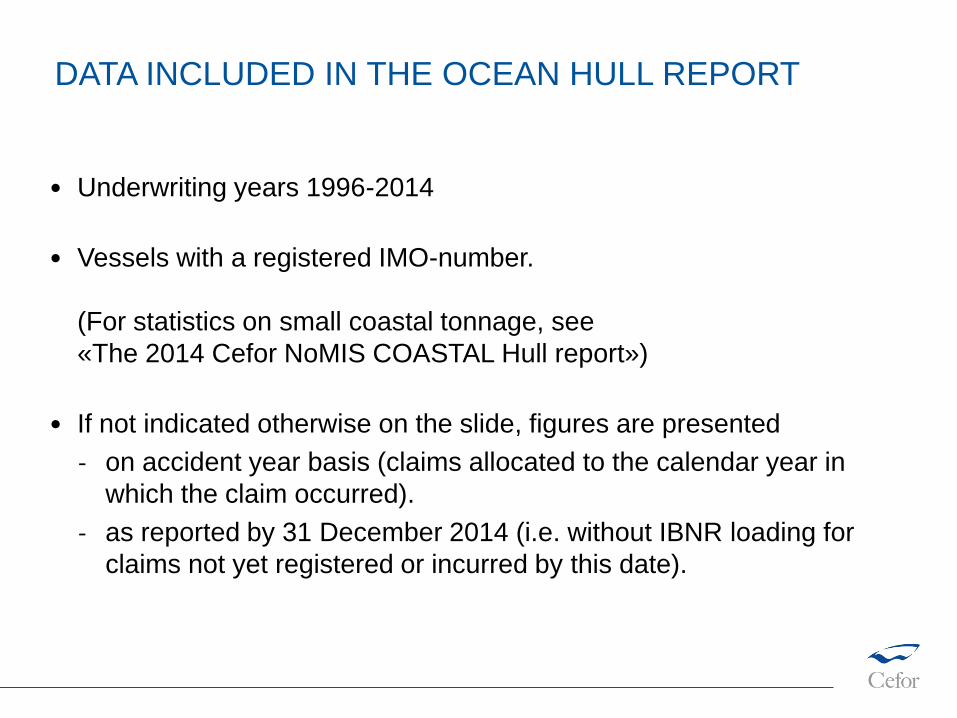
DATA INCLUDED IN THE OCEAN HULL REPORT
• Underwriting years 1996-2014
• Vessels with a registered IMO-number.
(For statistics on small coastal tonnage, see
«The 2014 Cefor NoMIS COASTAL Hull report»)
• If not indicated otherwise on the slide, figures are presented
‐ on accident year basis (claims allocated to the calendar year in
which the claim occurred).
‐ as reported by 31 December 2014 (i.e. without IBNR loading for
claims not yet registered or incurred by this date).

Part 1 Introduction (Contents / NoMIS history / Definitions)
Part 2 Cefor position in the global hull insurance market 2013/
Cefor hull insurance market 2014/ Cefor share of World fleet
Part 3 NoMIS portfolio Key figures
Part 4 Key figures by age group
Part 5 Key figures by vessel type group
Part 6 Key figures by size group
Part 7 Key figures by sum insured layers
(Part 4-7: Distribution of number of vessels / Claim frequency / Claim cost per vessel /
per Sum Insured / per gross ton)
2014 NOMIS – OCEAN HULL – PART 1AS OF 31 DECEMBER 2014

Part 8 Distribution by flag and classification society
•Distribution of number of vessels by flag, 16 largest
•Distribution of number of vessels by classification society, 6 largest
Part 9 Exposure curves
•Sum Insured bands
(<5, <20, <100, and >100 MUSD; for partial claims / all claims)
•Explanations
Part 10 – Cost Driving Factors Inflation Index (by date of loss)
Legal disclaimer Cefor provides the statistics material in this presentation for general information purposes only. All
key figures are derived from the Cefor portfolio, which reflects a minor part of the world fleet, the selection of ships
being biased by Nordic underwriting preferences. Therefore Cefor can accept no responsibility and shall not be
liable for any loss which may arise from reliance upon the information provided.
With reference to Commission Regulation (EU) No 267/2010 of 24 March 2010 (EU Block Exemption), it is further
stressed that the statistical data presented in this publication is non-binding in its character.
2014 NOMIS – OCEAN HULL – PART 1AS OF 31 DECEMBER 2014
The Nordic Marine Insurance Statistics (NoMIS) is a joint database project of Cefor members active in the Hull &
Machinery market to compile insurance data and vessel characteristics for statistical purposes, administered by Cefor.
From its foundation in 1985 until 1997, the data was compiled by appointing Cefor a facultative reinsurer to which
members of the Norwegian Hull Agreement ceded 0.1% of their H&M insurance. Premium and claims information was
exchanged via Borderaux, the lead insurer providing details of each claim.
In 1996, the hull agreement was discontinued, but the statistics cooperation continued.
In 1998, steps were taken to update the NoMIS’ database electronically instead of manually.
From December 1999, Cefor could produce up-to-date hull figures on a monthly basis. The database was extended the
database substantially by including non-lead business.
From 2000, also business back to underwriting year 1995 was updated electronically. In the following years, several
new major Cefor members joined the NoMIS cooperation, reporting retrospective data from 1995 underwriting year.
In 2009, data from Gjensidige and Tryg was integrated, dating back to underwriting years 2000 and 2003 respectively.
In 2012, data from Alandia was integrated, dating back to underwriting year 2005. Further, If extended their scope of
reporting to include all Nordic business.
By 31st December 2014, in all 206,421 vessel years (vessels with IMO-number) and 62,604 claims were registered on
underwriting years 1985 through 2014.
The NoMIS statistics in this report comprise data from the following marine insurers: Alandia, Bluewater (until 2008),
Codan, Gjensidige, If, Gard, NEMI (until 2009), Norwegian Hull Club, Swedish Club, Tryg (until 2009), Zurich (until
2002).
2014 NOMIS – OCEAN HULL – PART 1AS OF 31 DECEMBER 2014
All amounts are presented in USD.
Rate of exchange applicable to convert the figures from the original currencies into USD:
Insured values: av. rate of exchange of the month the insurance coverage gets into force
Paid claims: av. rate of exchange of the month of the payment transaction
Outstanding claims: av. rate of exchange of December 2014
Underwriting year = year in which the insurance policy attaches
All claims are net of any applicable deductibles.
Total Claims = Paid claims + Outstanding claims
TLO (total losses) = claims in excess of 75% of the Sum Insured
Partial Losses = all claims <= 75% of the Sum Insured
IBNR (”Incurred but not reported”) = reserve for claims adjustments and registration backlog
2014 NOMIS – OCEAN HULL – PART 1AS OF 31 DECEMBER 2014

Types of vessels specified
Vessel Type group Vessels Types included Lloyd’s List Intelligence Code
BULK Bulk, Ore, Cement BAC, BBU, BCB, BCE, BOR, BWC
CAR/RORO Car Carrier, RoRo MVE, URC, URR
CARGO Dry Cargo, General Cargo, Reefers, GCT, GGC, GPC, GRF, MLV
Pallett Vessels, Animal Transport Vessels
CHEM./PRODUCT Chemical Carriers, Product / Acid / Edible Oil / TAC, TCH, TCO, TEO, TFJ, TFO
Fish Oil / Fruit Juice / Wine / Molasses / TMO, TPD, TWA, TWN, TWT
Waste/ Water Tankers
CONTAINER Container UCC, UCR
FISHING Fishing vessels FFC, FFF, FFP, FFS, FTR,FWF,FWH
LNG/LPG Gas Carriers LNG, LPG, LNG/LPG LBK, LCN, LNG, LPG, LNP
OBO Combined Vessels Bulk, Ore, Oil COO, CBO
OTHER any other ships and floating units, any codes not specifically defined otherwise,
like Barges, Cranes, Floating Storage, Floating Production, Pollution Control
Vessels, Mud boat, Research vessels, Cable, Seismic Search vessel, Flo/Flo, etc.
2014 NOMIS – OCEAN HULL – PART 1AS OF 31 DECEMBER 2014
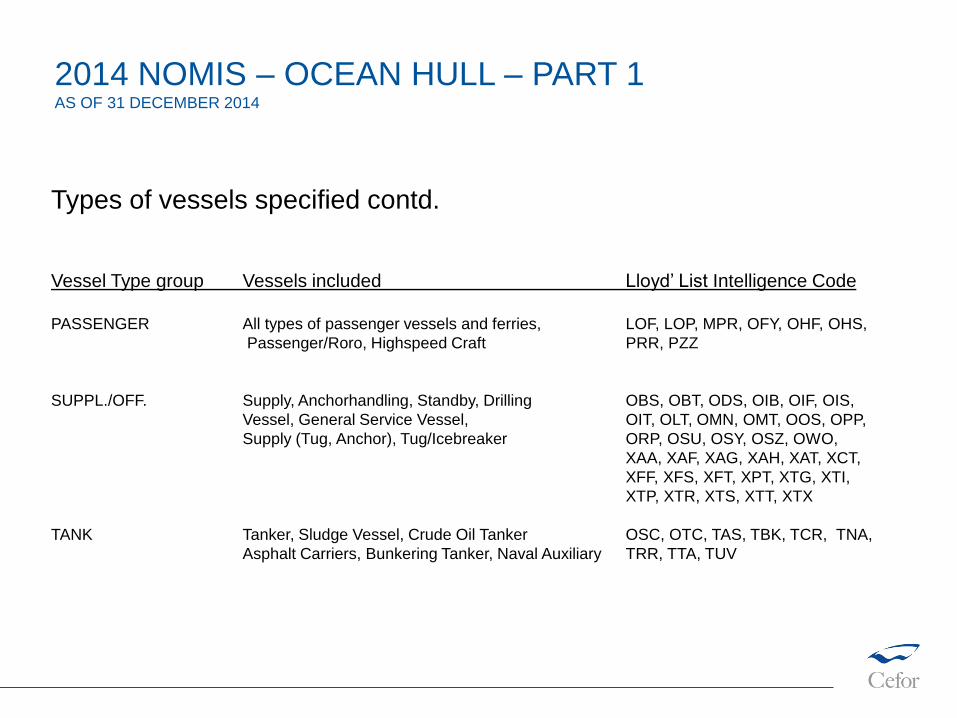
Types of vessels specified contd.
Vessel Type group Vessels included Lloyd’ List Intelligence Code
PASSENGER All types of passenger vessels and ferries, LOF, LOP, MPR, OFY, OHF, OHS,
Passenger/Roro, Highspeed Craft PRR, PZZ
SUPPL./OFF. Supply, Anchorhandling, Standby, Drilling OBS, OBT, ODS, OIB, OIF, OIS,
Vessel, General Service Vessel, OIT, OLT, OMN, OMT, OOS, OPP,
Supply (Tug, Anchor), Tug/Icebreaker ORP, OSU, OSY, OSZ, OWO,
XAA, XAF, XAG, XAH, XAT, XCT,
XFF, XFS, XFT, XPT, XTG, XTI,
XTP, XTR, XTS, XTT, XTX
TANK Tanker, Sludge Vessel, Crude Oil Tanker OSC, OTC, TAS, TBK, TCR, TNA,
Asphalt Carriers, Bunkering Tanker, Naval Auxiliary TRR, TTA, TUV
2014 NOMIS – OCEAN HULL – PART 1AS OF 31 DECEMBER 2014

Alandia4.2% Codan
11.3%
Gard30.9%
Gerling7.1%
Gjensidige4.0%
If6.2%
Møretrygd1.5%
Norwegian Hull Club
26.4%
Swedish Club7.7%
Tromstrygd0.6%
Brazil3.9%
China10.4%
France4.1%
Germany2.1%Italy
3.5%
Japan8.3%
Korea, Republic of3.7%
Mexico2.0%
Netherlands4.0%
Singapore2.5%
Spain2.7%
USA3.2%
Rest of the World18.8%
UK (IUA)5.8%
UK (Lloyd's)16.0%
Nordic (Cefor)9.3%
Distribution of Global Marine Hull* Premium 2013
World Cefor
* The «hull» premium on this slide includes both ocean and coastal hull business for all hull-related insurance types
(Hull, hull interest, freight interest, loss of hire, builder’s risk, fishing (catch & gear)).
** Lloyd’s premium includes also proportional and facultative reinsurance. Other countries’ premium includes only direct business.
Source Global Marine Premium: IUMI ”Global Marine Insurance Report” by Astrid Seltmann, published September 2014
**
2014 NOMIS – OCEAN HULL – PART 2AS OF 31 DECEMBER 2014
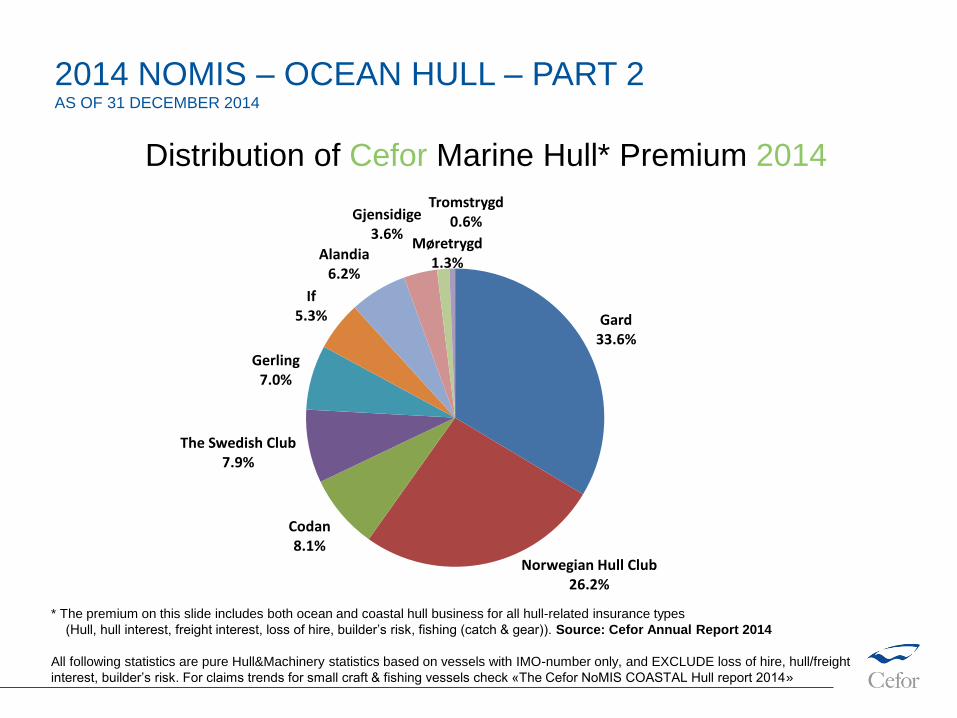
Gard33.6%
Norwegian Hull Club26.2%
Codan8.1%
The Swedish Club7.9%
Gerling7.0%
If5.3%
Alandia6.2%
Gjensidige3.6%
Møretrygd1.3%
Tromstrygd0.6%
Distribution of Cefor Marine Hull* Premium 2014
* The premium on this slide includes both ocean and coastal hull business for all hull-related insurance types
(Hull, hull interest, freight interest, loss of hire, builder’s risk, fishing (catch & gear)). Source: Cefor Annual Report 2014
All following statistics are pure Hull&Machinery statistics based on vessels with IMO-number only, and EXCLUDE loss of hire, hull/freight
interest, builder’s risk. For claims trends for small craft & fishing vessels check «The Cefor NoMIS COASTAL Hull report 2014»
2014 NOMIS – OCEAN HULL – PART 2AS OF 31 DECEMBER 2014

Year of Build 1000-3999 4000-6999 7000-10000 >10000 Grand Total
Cefor share
2009-2014 10% 22% 21% 37% 28%
2004-2008 11% 21% 38% 45% 33%
1999-2003 17% 27% 31% 51% 38%
1994-1998 13% 12% 22% 41% 27%
1989-1993 9% 11% 8% 26% 15%
1984-1988 5% 5% 13% 20% 9%
<1984 or (blank) 2% 3% 2% 11% 4%
World fleet
2009-2014 3,465 1,519 897 9,710 15,591
2004-2008 2,595 1,033 1,047 5,330 10,005
1999-2003 1,455 669 346 3,351 5,821
1994-1998 1,622 795 350 2,497 5,264
1989-1993 1,878 584 266 1,118 3,846
1984-1988 2,091 533 166 875 3,665
<1984 or (blank) 6,893 1,453 502 1,296 10,144
Total Cefor share 8% 15% 23% 38% 23%
Total World fleet 19,999 6,586 3,574 24,177 54,336
Cefor market participation as % of World Fleet – IMO-number ships > 1,000 gross ton
1) “Cefor share” calculated as the number of vessels partly or wholly covered by Cefor members in 2013/2014, divided by the total number
of ships with registered IMO-number in the world fleet. World fleet count as according to Lloyd’s List Intelligence “World Fleet Update” as
of January 2015.
1)
2014 NOMIS – OCEAN HULL – PART 2AS OF 31 DECEMBER 2014
or unknown
or unknown

2014 NOMIS – OCEAN HULL – PART 3AS OF 31 DECEMBER 2014
5,982
6,9527,410
7,0786,690
7,0957,656
8,426
9,729
10,828
12,067
13,306
12,530
10,524
9,4779,827
11,140
12,09112,393
0
2,000
4,000
6,000
8,000
10,000
12,000
14,000
19
96
19
97
19
98
19
99
20
00
20
01
20
02
20
03
20
04
20
05
20
06
20
07
20
08
20
09
20
10
20
11
20
12
20
13
20
14
Number of vesselsby year of exposure
Includes all insured vessels per underwriting year (renewed & new business).
2014 NOMIS – OCEAN HULL – PART 3AS OF 31 DECEMBER 2014
0
5,000,000
10,000,000
15,000,000
20,000,000
25,000,000
30,000,000
35,000,000
40,000,000
19
95
19
96
19
97
19
98
19
99
20
00
20
01
20
02
20
03
20
04
20
05
20
06
20
07
20
08
20
09
20
10
20
11
20
12
20
13
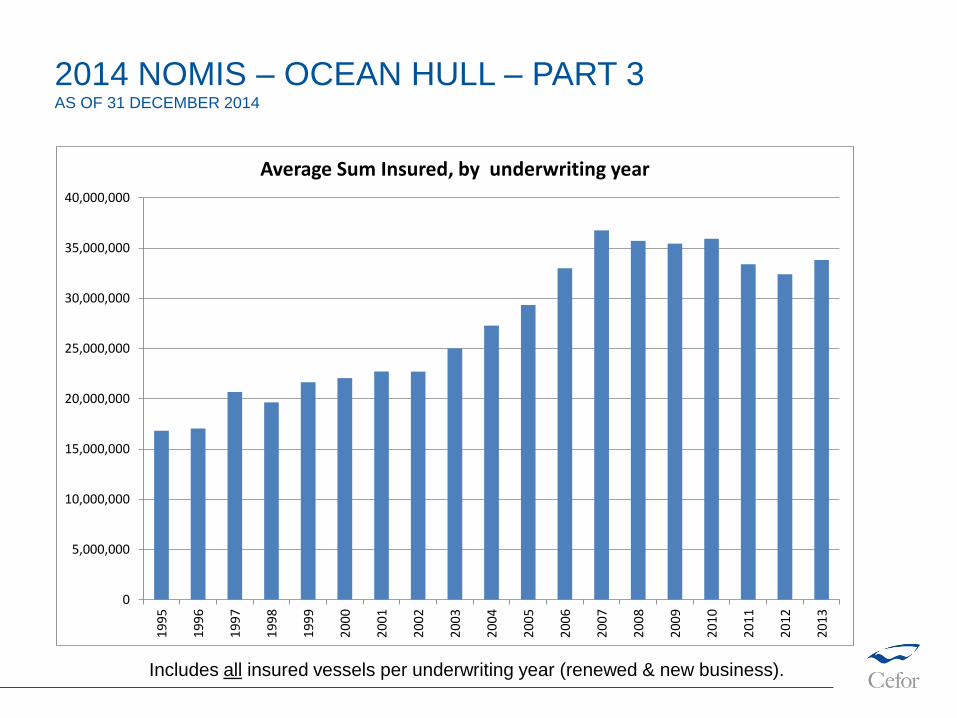
Average Sum Insured, by underwriting year

50%
100%
150%
200%
250%
1995
1996
1997
1998
1999
2000
2001
2002
2003
2004
2005
2006
2007
2008
2009
2010
2011
2012
2013
2014
Index of evolution of average Sum insured and gross ton1995=100%
Index Average Sum Insured Index Average gross ton
Includes all insured vessels per underwriting year (renewed and new business).
2014 NOMIS – OCEAN HULL – PART 3AS OF 31 DECEMBER 2014

6.0% 6.2%
3.1%
8.6%
5.0%
-14.6%
-9.0%
-3.7%
-7.2%
-4.9% -5.2%
-20.0%
-15.0%
-10.0%
-5.0%
0.0%
5.0%
10.0%
15.0%2
00
4
200
5
200
6
200
7
200
8
200
9
201
0
201
1
201
2
2013
201
4
Average annual change in insured values on renewed vessels
Based on renewals only in respective year – excluding new business. In stable market conditions, one
would expect to see some reduction in the insured value on renewed vessels due to the aging factor.
2014 NOMIS – OCEAN HULL – PART 3AS OF 31 DECEMBER 2014
2014 NOMIS – OCEAN HULL – PART 3AS OF 31 DECEMBER 2014
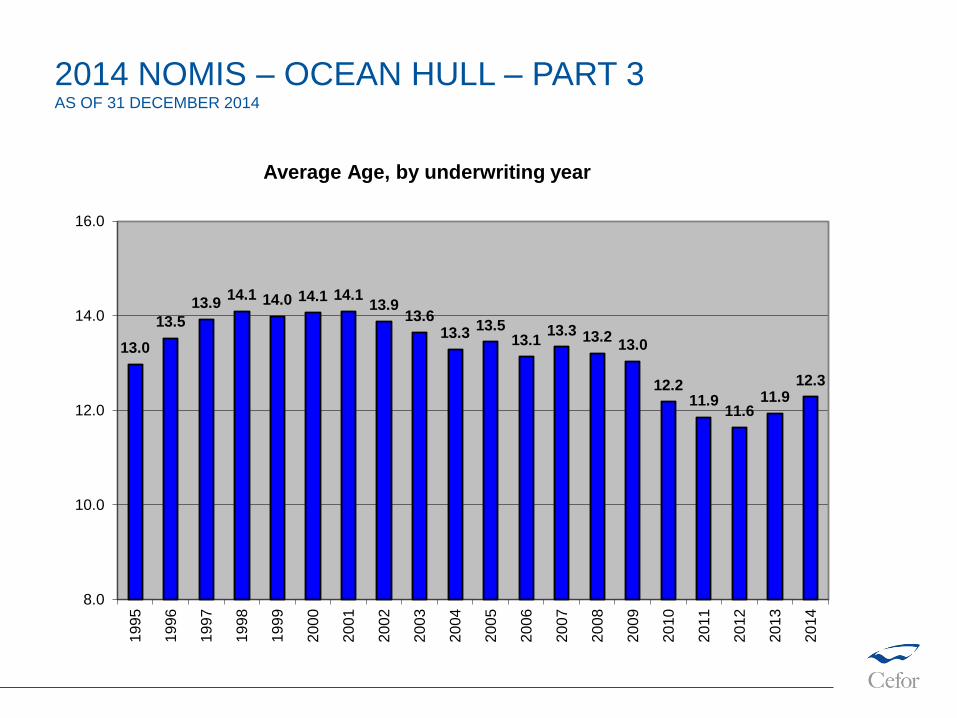
13.0
13.5
13.914.1 14.0 14.1 14.1
13.913.6
13.313.5
13.113.3 13.2
13.0
12.211.9
11.611.9
12.3
8.0
10.0
12.0
14.0
16.0
1995
1996
1997
1998
1999
2000
2001
2002
2003
2004
2005
2006
2007
2008
2009
2010
2011
2012
2013
2014
Average Age, by underwriting year
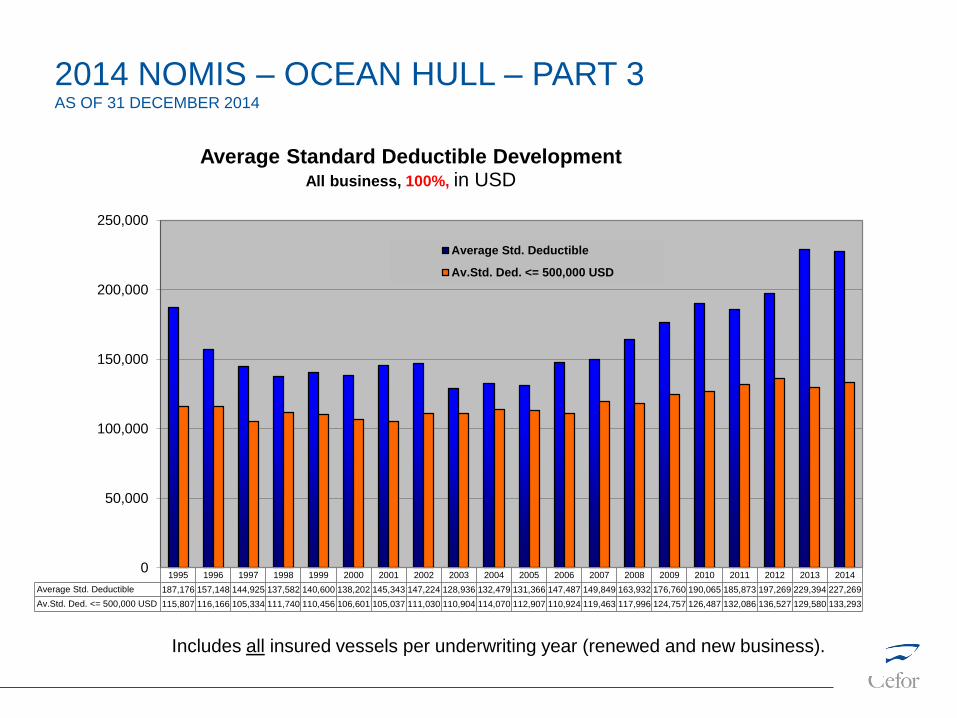
1995 1996 1997 1998 1999 2000 2001 2002 2003 2004 2005 2006 2007 2008 2009 2010 2011 2012 2013 2014
Average Std. Deductible 187,176 157,148 144,925 137,582 140,600 138,202 145,343 147,224 128,936 132,479 131,366 147,487 149,849 163,932 176,760 190,065 185,873 197,269 229,394 227,269
Av.Std. Ded. <= 500,000 USD 115,807 116,166 105,334 111,740 110,456 106,601 105,037 111,030 110,904 114,070 112,907 110,924 119,463 117,996 124,757 126,487 132,086 136,527 129,580 133,293
0
50,000
100,000
150,000
200,000
250,000
Average Standard Deductible DevelopmentAll business, 100%, in USD
Average Std. Deductible
Av.Std. Ded. <= 500,000 USD
Includes all insured vessels per underwriting year (renewed and new business).
2014 NOMIS – OCEAN HULL – PART 3AS OF 31 DECEMBER 2014

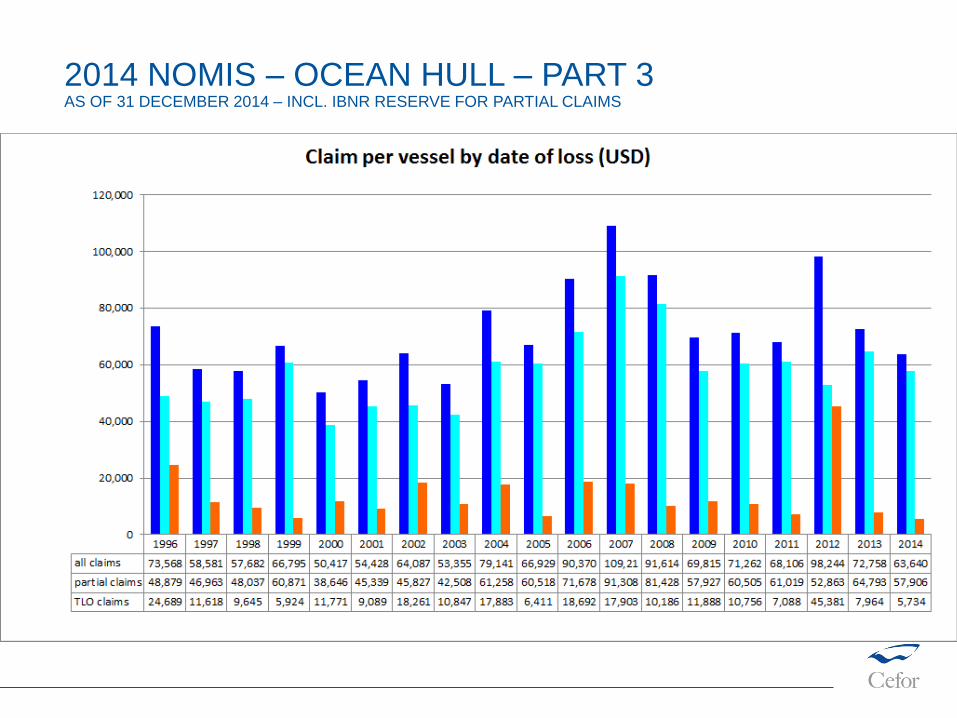
1996 1997 1998 1999 2000 2001 2002 2003 2004 2005 2006 2007 2008 2009 2010 2011 2012 2013 2014
> 50 MUSD 0 0 0 0 0 0 0 0 6,812 0 6,469 4,065 0 0 14,068 0 35,136 10,059 0
30 <= 50 MUSD 12,278 0 4,054 9,460 0 0 9,200 0 0 0 5,595 13,813 6,224 3,846 0 7,231 10,075 0 3,095
10 <= 30 MUSD 5,718 5,784 5,303 8,949 3,017 7,116 8,656 9,751 15,709 7,359 17,489 19,682 13,897 8,124 5,785 5,769 7,709 10,207 8,054
5 <= 10 MUSD 8,841 9,541 7,093 9,720 11,346 2,594 6,170 3,993 8,227 15,543 7,631 12,127 11,136 7,484 6,809 9,002 6,020 10,463 4,383
1 <= 5 MUSD 22,745 22,080 18,660 18,242 15,540 21,986 18,492 17,636 25,319 18,883 26,134 27,701 29,123 25,504 18,314 19,428 18,754 19,549 17,964
<= 1 MUSD 23,986 21,177 22,572 20,423 20,515 22,731 21,571 21,975 23,075 25,144 27,052 31,823 31,234 24,858 26,285 26,677 20,550 21,237 19,646
IBNR 0 0 0 0 0 0 0 0 0 0 0 0 0 0 0 0 0 1,389 10,314
0
20,000
40,000
60,000
80,000
100,000
120,000
USD Claim per vessel, by date of loss
Claim bands:
2014 NOMIS – OCEAN HULL – PART 3AS OF 31 DECEMBER 2014

38.2%
1.9%
11.0%
23.7%
8.8%
0.6%2.5%
13.3%
2009-2013
Machinery
Fire/Explosion
Collision
Contact
Grounding
Ice
Heavy weather
Other / unknown
37.2%
2.6%
11.7%
24.2%
9.8%
0.1%1.9%
12.4%
2014
Machinery
Fire/Explosion
Collision
Contact
Grounding
Ice
Heavy weather
Other / unknown
Distribution of number of claims by type of claim
2014 NOMIS – OCEAN HULL – PART 3AS OF 31 DECEMBER 2014 – PAID & OUTSTANDING AS REPORTED, NO IBNR RESERVE ADDED
Total number of claims:
2009-2013: 6,112 2014: 1,231

33.7%
13.2%
13.4%
7.6%
23.9%
0.2%
1.6% 6.4%
2009-2013
Machinery
Fire/Explosion
Collision
Contact
Grounding
Ice
Heavy weather
Other / unknown
31.6%
15.6%
13.1%
10.7%
16.5%
0.0%1.6%
11.0%
2014
Machinery
Fire/Explosion
Collision
Contact
Grounding
Ice
Heavy weather
Other / unknown
Distribution of claims cost by type of claim
2014 NOMIS – OCEAN HULL – PART 3AS OF 31 DECEMBER 2014 – PAID & OUTSTANDING AS REPORTED, NO IBNR RESERVE ADDED
Total cost of claims in USD million:
2009-2013: 1,823.1 2014: 658.6

Comment: Claims < 10.000 USD account for about half of all claims. Registration of these may vary over time
and by company and will thus influence the registered frequency. In addition any increase/decrease of
insurance deductibles will have impact on the registered frequency
1996 1997 1998 1999 2000 2001 2002 2003 2004 2005 2006 2007 2008 2009 2010 2011 2012 2013 2014
all claims 29.8 29.9 32.9 32.2 30.1 28.6 29.3 28.8 29.7 28.7 28.9 31.5 33.5 28.5 26.6 28.7 25.2 24.3 26.4
> 10,000 USD 13.5 12.9 14.0 14.1 12.8 13.4 13.0 13.6 14.2 14.4 15.0 16.6 16.7 13.4 13.1 14.0 12.4 12.4 13.3
>500,000 USD 2.73 2.24 2.21 2.02 1.87 2.18 2.12 1.97 2.61 2.43 3.01 3.49 3.42 2.74 2.62 2.79 2.09 2.36 1.96
0.0%
5.0%
10.0%
15.0%
20.0%
25.0%
30.0%
35.0%
40.0%
Claim frequency by date of loss (%)
2014 NOMIS – OCEAN HULL – PART 3AS OF 31 DECEMBER 2014 – INCL. IBNR RESERVE FOR FREQUENCY OF PARTIAL CLAIMS

0.00%
0.05%
0.10%
0.15%
0.20%
0.25%
0.30%
0.00%
5.00%
10.00%
15.00%
20.00%
25.00%
30.00%
35.00%1
99
6
19
97
19
98
19
99
20
00
20
01
20
02
20
03
20
04
20
05
20
06
20
07
20
08
20
09
20
10
20
11
20
12
20
13
20
14
Claim frequency, by date of loss
partial claims <75% SI (left axis) TLO claims >75% SI (right axis)(dotted line incl. IBNR)
2014 NOMIS – OCEAN HULL – PART 3AS OF 31 DECEMBER 2014 – INCL. IBNR RESERVE FOR FREQUENCY OF PARTIAL CLAIMS
2014 NOMIS – OCEAN HULL – PART 3AS OF 31 DECEMBER 2014 – INCL. IBNR RESERVE FOR PARTIAL CLAIMS
2014 NOMIS – OCEAN HULL – PART 3AS OF 31 DECEMBER 2014 – INCL. IBNR RESERVE FOR PARTIAL CLAIMS
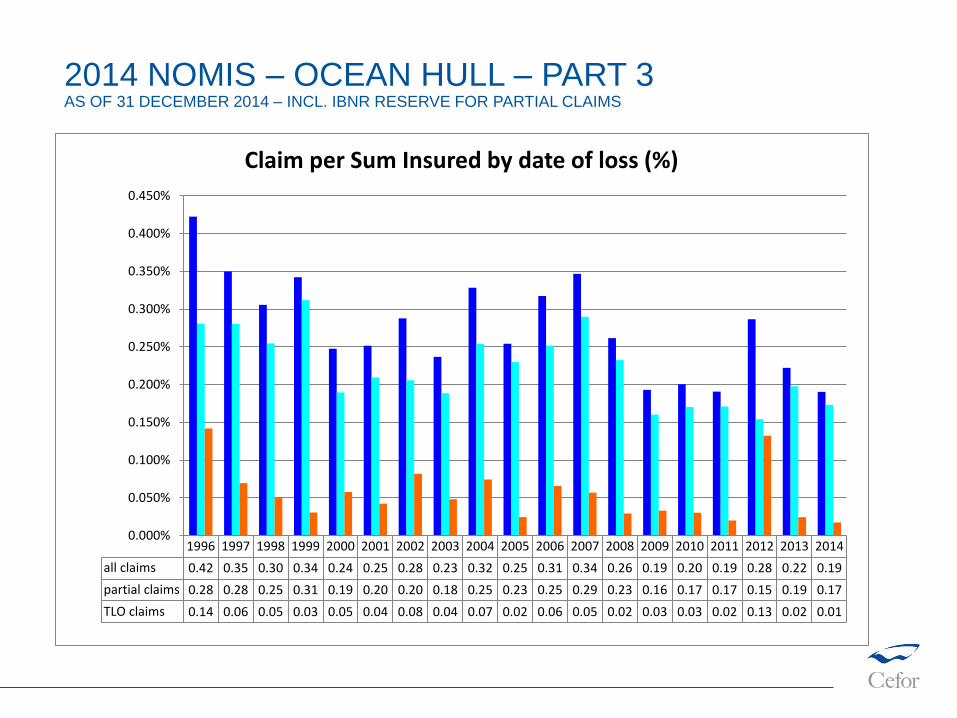
1996 1997 1998 1999 2000 2001 2002 2003 2004 2005 2006 2007 2008 2009 2010 2011 2012 2013 2014
all claims 0.42 0.35 0.30 0.34 0.24 0.25 0.28 0.23 0.32 0.25 0.31 0.34 0.26 0.19 0.20 0.19 0.28 0.22 0.19
partial claims 0.28 0.28 0.25 0.31 0.19 0.20 0.20 0.18 0.25 0.23 0.25 0.29 0.23 0.16 0.17 0.17 0.15 0.19 0.17
TLO claims 0.14 0.06 0.05 0.03 0.05 0.04 0.08 0.04 0.07 0.02 0.06 0.05 0.02 0.03 0.03 0.02 0.13 0.02 0.01
0.000%
0.050%
0.100%
0.150%
0.200%
0.250%
0.300%
0.350%
0.400%
0.450%
Claim per Sum Insured by date of loss (%)
25
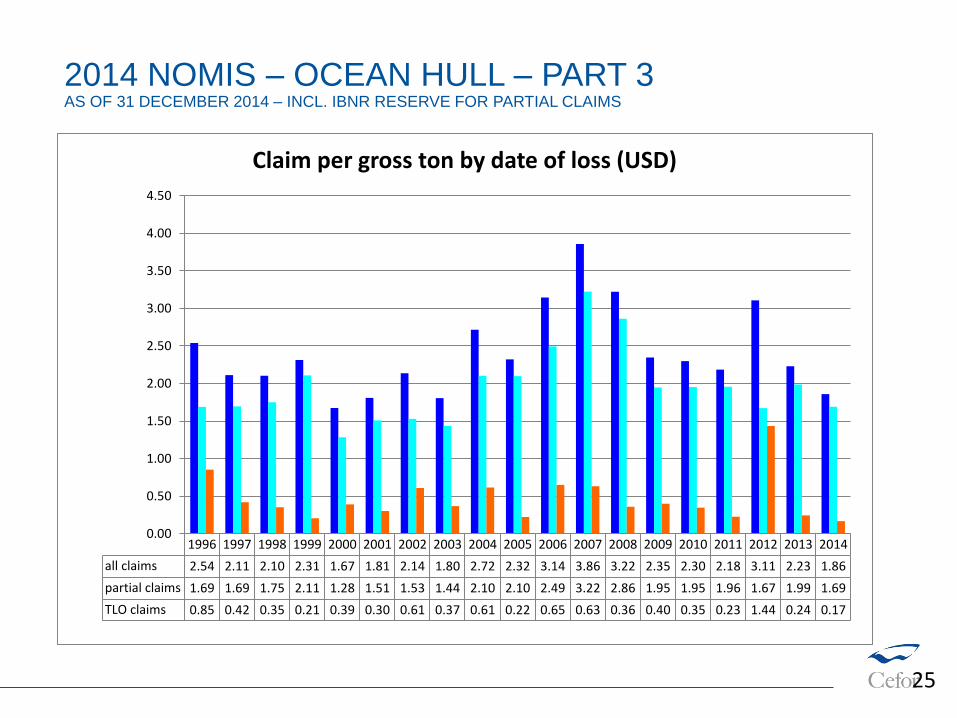
1996 1997 1998 1999 2000 2001 2002 2003 2004 2005 2006 2007 2008 2009 2010 2011 2012 2013 2014
all claims 2.54 2.11 2.10 2.31 1.67 1.81 2.14 1.80 2.72 2.32 3.14 3.86 3.22 2.35 2.30 2.18 3.11 2.23 1.86
partial claims 1.69 1.69 1.75 2.11 1.28 1.51 1.53 1.44 2.10 2.10 2.49 3.22 2.86 1.95 1.95 1.96 1.67 1.99 1.69
TLO claims 0.85 0.42 0.35 0.21 0.39 0.30 0.61 0.37 0.61 0.22 0.65 0.63 0.36 0.40 0.35 0.23 1.44 0.24 0.17
0.00
0.50
1.00
1.50
2.00
2.50
3.00
3.50
4.00
4.50
Claim per gross ton by date of loss (USD)
2014 NOMIS – OCEAN HULL – PART 3AS OF 31 DECEMBER 2014 – INCL. IBNR RESERVE FOR PARTIAL CLAIMS

26
2014 NOMIS – OCEAN HULL – PART 3AS OF 31 DECEMBER 2014 – INCL. IBNR RESERVE FOR PARTIAL CLAIMS
1996 1997 1998 1999 2000 2001 2002 2003 2004 2005 2006 2007 2008 2009 2010 2011 2012 2013 2014
all claims 246,946 196,079 175,327 207,186 167,386 190,324 219,030 185,004 266,798 233,554 312,911 346,817 273,156 245,278 267,700 237,518 389,353 299,645 241,337
excl. total losses 165,465 158,028 146,855 189,643 129,202 159,406 157,606 148,001 207,662 212,003 249,479 291,352 243,481 204,468 227,564 213,254 210,025 267,940 220,067
0
50,000
100,000
150,000
200,000
250,000
300,000
350,000
400,000
450,000
Average claim amount per individual claim (USD) by date of loss
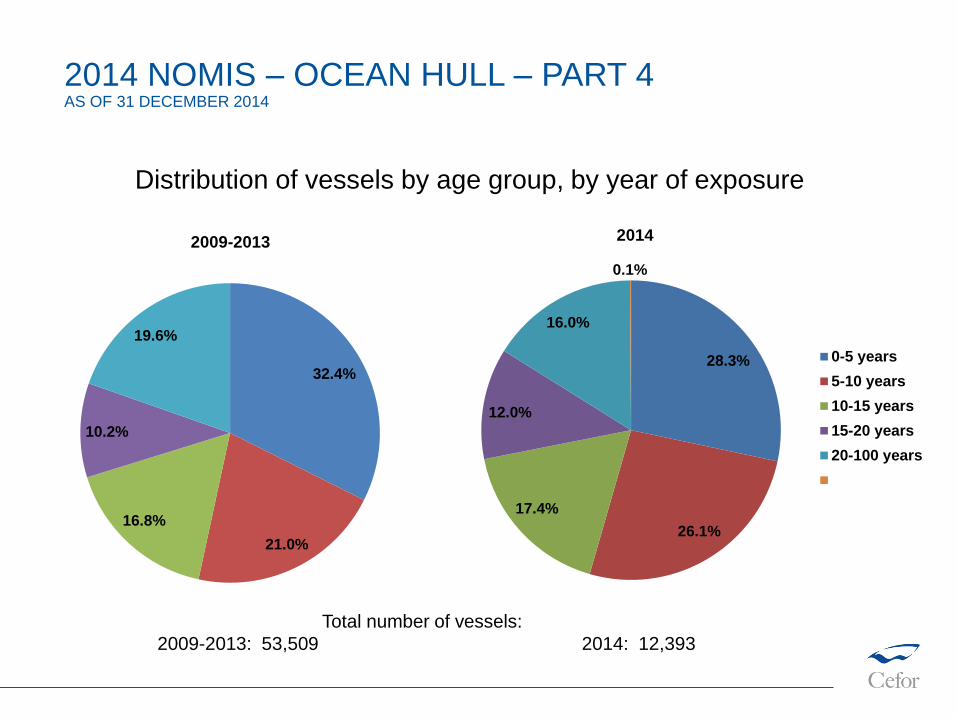
32.4%
21.0%
16.8%
10.2%
19.6%
2009-2013
0-5 years
5-10 years
10-15 years
15-20 years
20-100 years
28.3%
26.1%
17.4%
12.0%
16.0%
0.1%
2014
0-5 years
5-10 years
10-15 years
15-20 years
20-100 years
Distribution of vessels by age group, by year of exposure
2014 NOMIS – OCEAN HULL – PART 4AS OF 31 DECEMBER 2014
Total number of vessels:
2009-2013: 53,509 2014: 12,393
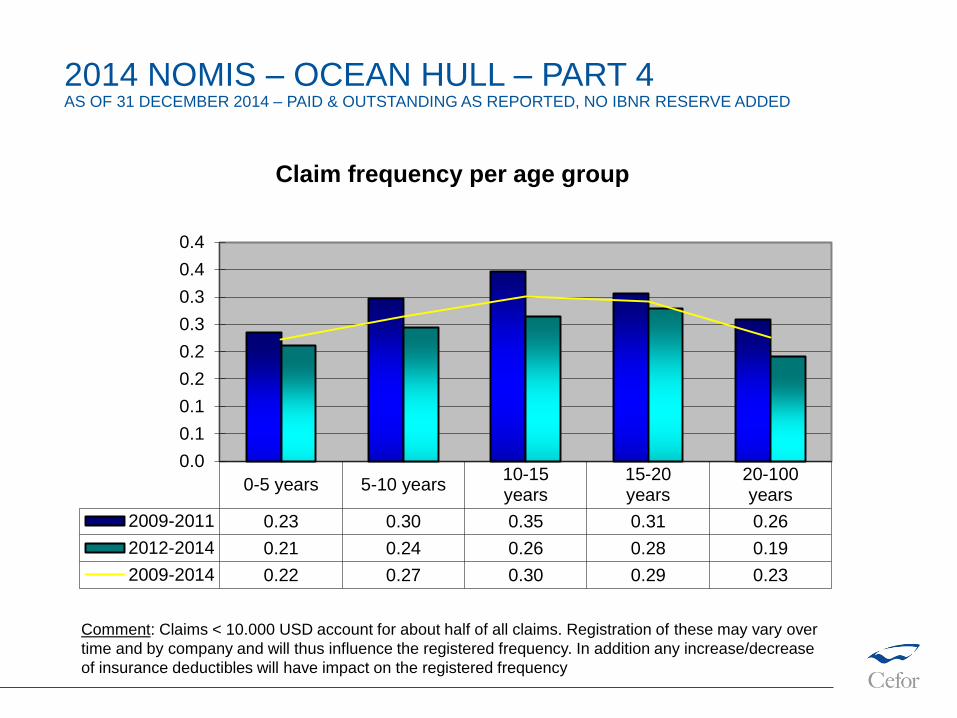
Comment: Claims < 10.000 USD account for about half of all claims. Registration of these may vary over
time and by company and will thus influence the registered frequency. In addition any increase/decrease
of insurance deductibles will have impact on the registered frequency
2014 NOMIS – OCEAN HULL – PART 4AS OF 31 DECEMBER 2014 – PAID & OUTSTANDING AS REPORTED, NO IBNR RESERVE ADDED
0-5 years 5-10 years10-15years
15-20years
20-100years
2009-2011 0.23 0.30 0.35 0.31 0.26
2012-2014 0.21 0.24 0.26 0.28 0.19
2009-2014 0.22 0.27 0.30 0.29 0.23
0.0
0.1
0.1
0.2
0.2
0.3
0.3
0.4
0.4
Claim frequency per age group

0-5 years 5-10 years10-15years
15-20years
20-100years
2009-2011 58,612 81,915 69,230 90,913 66,887
2012-2014 56,288 102,544 82,442 81,391 50,856
2009-2014 57,373 94,231 76,495 85,496 59,171
0
20,000
40,000
60,000
80,000
100,000
120,000
Claim per vessel per age groupin USD
2014 NOMIS – OCEAN HULL – PART 4AS OF 31 DECEMBER 2014 – PAID & OUTSTANDING AS REPORTED, NO IBNR RESERVE ADDED

2014 NOMIS – OCEAN HULL – PART 4AS OF 31 DECEMBER 2014 – PAID & OUTSTANDING AS REPORTED, NO IBNR RESERVE ADDED
0-5 years 5-10 years10-15years
15-20years
20-100years
2009-2011 0.110% 0.186% 0.224% 0.407% 0.535%
2012-2014 0.115% 0.277% 0.280% 0.409% 0.389%
2009-2014 0.113% 0.237% 0.254% 0.408% 0.463%
0.0%
0.1%
0.2%
0.3%
0.4%
0.5%
0.6%
Claim per Sum Insured per age group
2014 NOMIS – OCEAN HULL – PART 4AS OF 31 DECEMBER 2014 – PAID & OUTSTANDING AS REPORTED, NO IBNR RESERVE ADDED
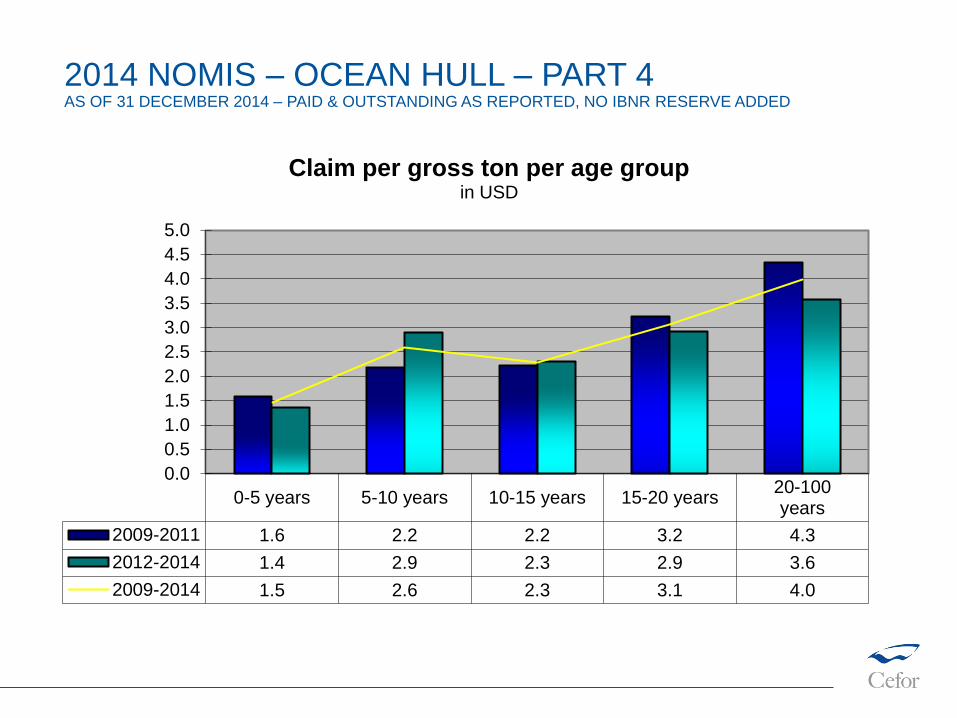
0-5 years 5-10 years 10-15 years 15-20 years20-100years
2009-2011 1.6 2.2 2.2 3.2 4.3
2012-2014 1.4 2.9 2.3 2.9 3.6
2009-2014 1.5 2.6 2.3 3.1 4.0
0.0
0.5
1.0
1.5
2.0
2.5
3.0
3.5
4.0
4.5
5.0
Claim per gross ton per age groupin USD

2014 NOMIS – OCEAN HULL – PART 4AS OF 31 DECEMBER 2014 – PAID & OUTSTANDING AS REPORTED, NO IBNR RESERVE ADDED
0-5 years 5-10 years10-15years
15-20years
20-100years
2009-2011 249,546 275,814 199,979 296,460 258,847
2012-2014 266,876 420,705 312,703 291,630 266,711
2009-2014 258,324 355,317 254,306 293,825 262,043
0
50,000
100,000
150,000
200,000
250,000
300,000
350,000
400,000
450,000
Average claim amount per age groupin USD

18%
6%
10%
12%
18%
2%
4%
0%
5%
6%
11%
8%
2009-2013
Bulk
Car/RoRo
Cargo
Chem./Prod.
Container
Fishing
LNG/LPG
OBO
Other
Passenger
Suppl./Off.
Tank
21%
6%
9%
12%20%
2%
3%
0%
4%
6%
10%
7%
2014
Bulk
Car/RoRo
Cargo
Chem./Prod.
Container
Fishing
LNG/LPG
OBO
Other
Passenger
Suppl./Off.
Tank
Distribution of vessels by vessel type, by year of exposure
2014 NOMIS – OCEAN HULL – PART 5AS OF 31 DECEMBER 2014
Total number of vessels:
2009-2013: 53,509 2014: 12,393

Bulk CargoCont./Car/
RoRoPassenger Tank Supply/Off
2009-2011 0.22 0.32 0.38 0.27 0.25 0.16
2012-2014 0.18 0.31 0.30 0.25 0.20 0.15
2009-2014 0.20 0.31 0.34 0.26 0.22 0.15
0.0
0.1
0.2
0.3
0.4
0.5
Claim frequency per vessel type group
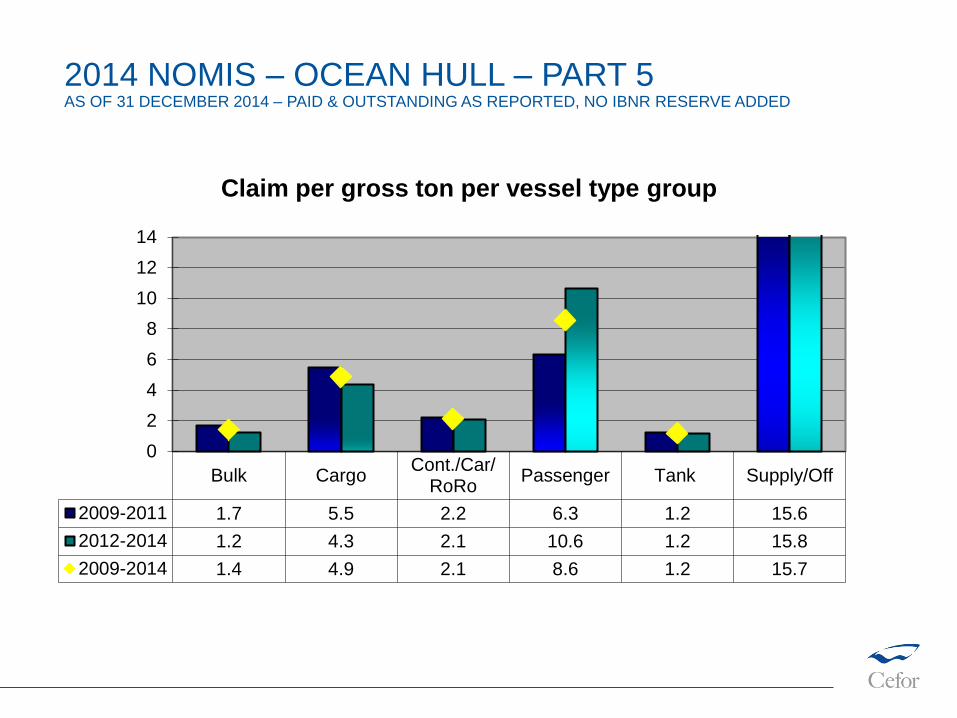
”Tank” includes in this and the following slides: Chemical/Product, LNG/LPG, OBO and other tank vessels,
Claims < 10.000 USD account for about half of all claims. Registration of these may vary over time and by
company and will thus influence the registered frequency. In addition any increase/decrease of insurance
deductibles has impact on the registered frequency
2014 NOMIS – OCEAN HULL – PART 5AS OF 31 DECEMBER 2014 – PAID & OUTSTANDING AS REPORTED, NO IBNR RESERVE ADDED
2014 NOMIS – OCEAN HULL – PART 5AS OF 31 DECEMBER 2014 – PAID & OUTSTANDING AS REPORTED, NO IBNR RESERVE ADDED
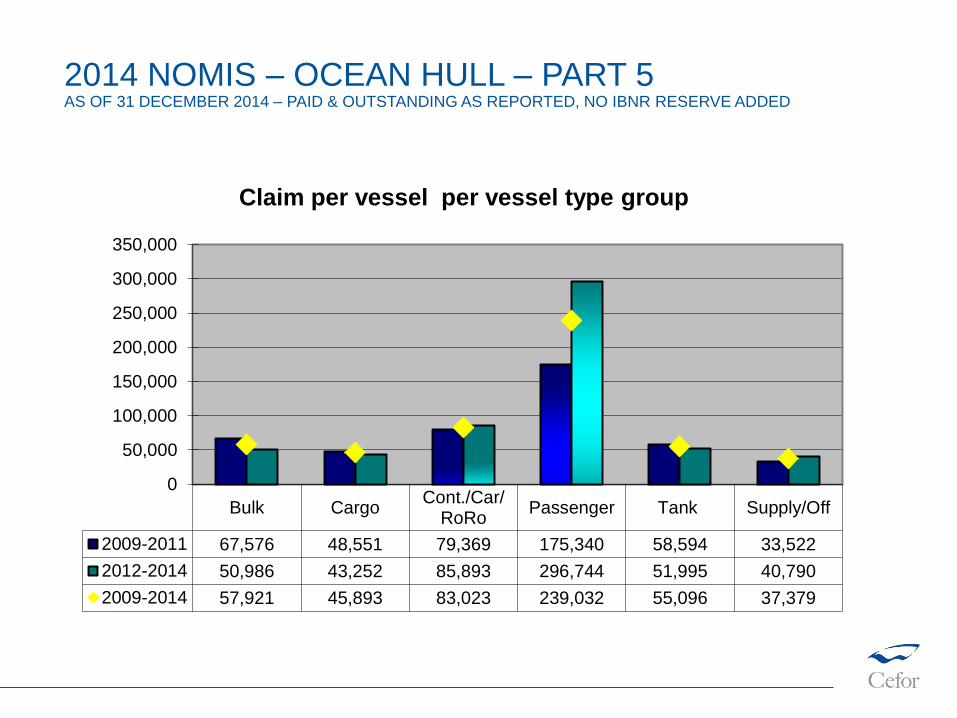
Bulk CargoCont./Car/
RoRoPassenger Tank Supply/Off
2009-2011 67,576 48,551 79,369 175,340 58,594 33,522
2012-2014 50,986 43,252 85,893 296,744 51,995 40,790
2009-2014 57,921 45,893 83,023 239,032 55,096 37,379
0
50,000
100,000
150,000
200,000
250,000
300,000
350,000
Claim per vessel per vessel type group

2014 NOMIS – OCEAN HULL – PART 5AS OF 31 DECEMBER 2014 – PAID & OUTSTANDING AS REPORTED, NO IBNR RESERVE ADDED
Bulk CargoCont./Car/
RoRoPassenger Tank Supply/Off
2009-2011 0.216% 0.432% 0.216% 0.207% 0.140% 0.144%
2012-2014 0.189% 0.360% 0.244% 0.367% 0.150% 0.150%
2009-2014 0.201% 0.395% 0.232% 0.289% 0.145% 0.147%
0.0%
0.1%
0.2%
0.3%
0.4%
0.5%
Claim per Sum Insured per vessel type group
2014 NOMIS – OCEAN HULL – PART 5AS OF 31 DECEMBER 2014 – PAID & OUTSTANDING AS REPORTED, NO IBNR RESERVE ADDED
Bulk CargoCont./Car/
RoRoPassenger Tank Supply/Off
2009-2011 1.7 5.5 2.2 6.3 1.2 15.6
2012-2014 1.2 4.3 2.1 10.6 1.2 15.8
2009-2014 1.4 4.9 2.1 8.6 1.2 15.7
0
2
4
6
8
10
12
14
Claim per gross ton per vessel type group
2014 NOMIS – OCEAN HULL – PART 5AS OF 31 DECEMBER 2014 – PAID & OUTSTANDING AS REPORTED, NO IBNR RESERVE ADDED
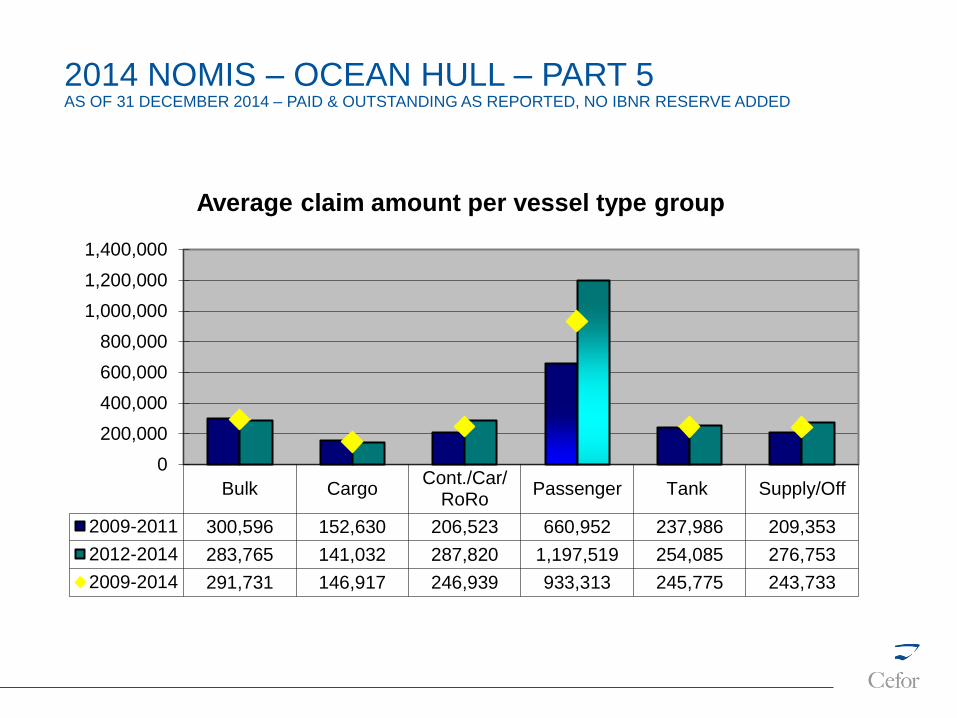
Bulk CargoCont./Car/
RoRoPassenger Tank Supply/Off
2009-2011 300,596 152,630 206,523 660,952 237,986 209,353
2012-2014 283,765 141,032 287,820 1,197,519 254,085 276,753
2009-2014 291,731 146,917 246,939 933,313 245,775 243,733
0
200,000
400,000
600,000
800,000
1,000,000
1,200,000
1,400,000
Average claim amount per vessel type group

11.0%
15.0%
9.7%
12.1%
13.7%
10.6%
6.6%
5.3%
8.6%
4.1%3.0%
0.2%
2009-2013
< 1,000
1,000-5,000
5,000-10,000
10,000-20,000
20,000-30,000
30,000-40,000
40,000-50,000
50,000-60,000
60,000-90,000
90,000-120,000
120,000-170,000
>= 170,000
8.8%
14.2%
9.6%
11.0%
14.0%
11.5%
7.5%
5.6%
8.8%
5.3%3.2%
0.4%
2014
< 1,000
1,000-5,000
5,000-10,000
10,000-20,000
20,000-30,000
30,000-40,000
40,000-50,000
50,000-60,000
60,000-90,000
90,000-120,000
120,000-170,000
>= 170,000
Distribution of vessels by GT size group, by year of exposure
Gross ton:
2014 NOMIS – OCEAN HULL – PART 6AS OF 31 DECEMBER 2014
Total number of vessels:
2009-2013: 53,509 2014: 12,393

Comment: Claims < 10.000 USD account for about half of all claims. Registration of these may vary over time
and by company and will thus influence the registered frequency. In addition any increase/decrease of
insurance deductibles will have impact on the registered frequency
2014 NOMIS – OCEAN HULL – PART 6AS OF 31 DECEMBER 2014 – PAID & OUTSTANDING AS REPORTED, NO IBNR RESERVE ADDED
< 1,0001,000-5,000
5,000-10,000
10,000-20,000
20,000-30,000
30,000-40,000
40,000-50,000
50,000-60,000
60,000-90,000
90,000-120,000
120,000-
170,000
>=170,000
2009-2011 0.17 0.28 0.40 0.34 0.34 0.28 0.27 0.23 0.22 0.11 0.15 0.07
2012-2014 0.15 0.25 0.36 0.28 0.30 0.25 0.20 0.18 0.16 0.09 0.12 0.03
2009-2014 0.16 0.26 0.38 0.31 0.32 0.26 0.23 0.20 0.19 0.10 0.13 0.04
0.0
0.1
0.2
0.3
0.4
0.5
Claim frequency per GT size group
2014 NOMIS – OCEAN HULL – PART 6AS OF 31 DECEMBER 2014 – PAID & OUTSTANDING AS REPORTED, NO IBNR RESERVE ADDED
< 1,0001,000-5,000
5,000-10,000
10,000-20,000
20,000-30,000
30,000-40,000
40,000-50,000
50,000-60,000
60,000-90,000
90,000-120,000
120,000-170,000
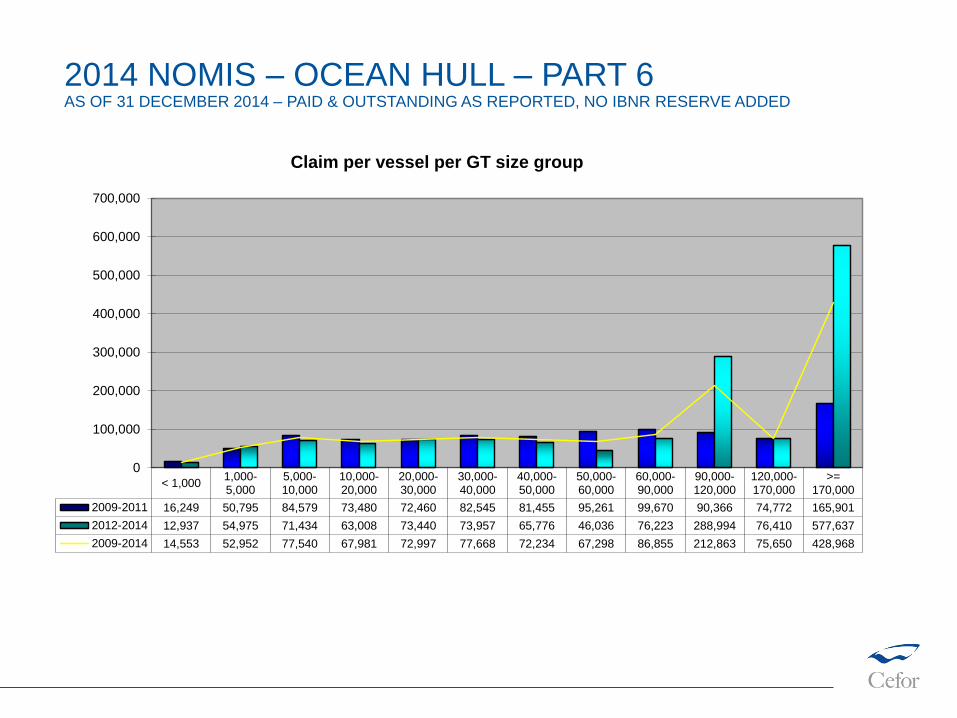
>=170,000
2009-2011 16,249 50,795 84,579 73,480 72,460 82,545 81,455 95,261 99,670 90,366 74,772 165,901
2012-2014 12,937 54,975 71,434 63,008 73,440 73,957 65,776 46,036 76,223 288,994 76,410 577,637
2009-2014 14,553 52,952 77,540 67,981 72,997 77,668 72,234 67,298 86,855 212,863 75,650 428,968
0
100,000
200,000
300,000
400,000
500,000
600,000
700,000
Claim per vessel per GT size group

2014 NOMIS – OCEAN HULL – PART 6AS OF 31 DECEMBER 2014 – PAID & OUTSTANDING AS REPORTED, NO IBNR RESERVE ADDED
< 1,0001,000-5,000
5,000-10,000
10,000-20,000
20,000-30,000
30,000-40,000
40,000-50,000
50,000-60,000
60,000-90,000
90,000-120,000
120,000-
170,000
>=170,000
2009-2011 0.470% 0.308% 0.340% 0.275% 0.241% 0.214% 0.180% 0.199% 0.146% 0.070% 0.079% 0.083%
2012-2014 0.335% 0.305% 0.286% 0.253% 0.280% 0.236% 0.171% 0.109% 0.136% 0.299% 0.078% 0.398%
2009-2014 0.397% 0.306% 0.311% 0.264% 0.261% 0.225% 0.175% 0.151% 0.141% 0.195% 0.078% 0.259%
0.00%
0.05%
0.10%
0.15%
0.20%
0.25%
0.30%
0.35%
0.40%
0.45%
0.50%
Claim per Sum Insured per GT size group

2014 NOMIS – OCEAN HULL – PART 6AS OF 31 DECEMBER 2014 – PAID & OUTSTANDING AS REPORTED, NO IBNR RESERVE ADDED
< 1,0001,000-5,000
5,000-10,000
10,000-20,000
20,000-30,000
30,000-40,000
40,000-50,000
50,000-60,000
60,000-90,000
90,000-120,000
120,000-
170,000
>=170,000
2009-2011 40.2 17.4 11.3 4.8 2.9 2.4 1.9 1.7 1.3 0.9 0.5 0.9
2012-2014 31.8 18.4 9.5 4.1 2.9 2.2 1.5 0.8 1.0 3.0 0.5 3.1
2009-2014 35.9 17.9 10.4 4.4 2.9 2.3 1.7 1.2 1.2 2.2 0.5 2.3
0.0
5.0
10.0
15.0
20.0
25.0
30.0
35.0
40.0
45.0
Claim per GT per GT size group
< 1,0001,000-5,000
5,000-10,000
10,000-20,000
20,000-30,000
30,000-40,000
40,000-50,000
50,000-60,000
60,000-90,000
90,000-120,000
120,000-170,000
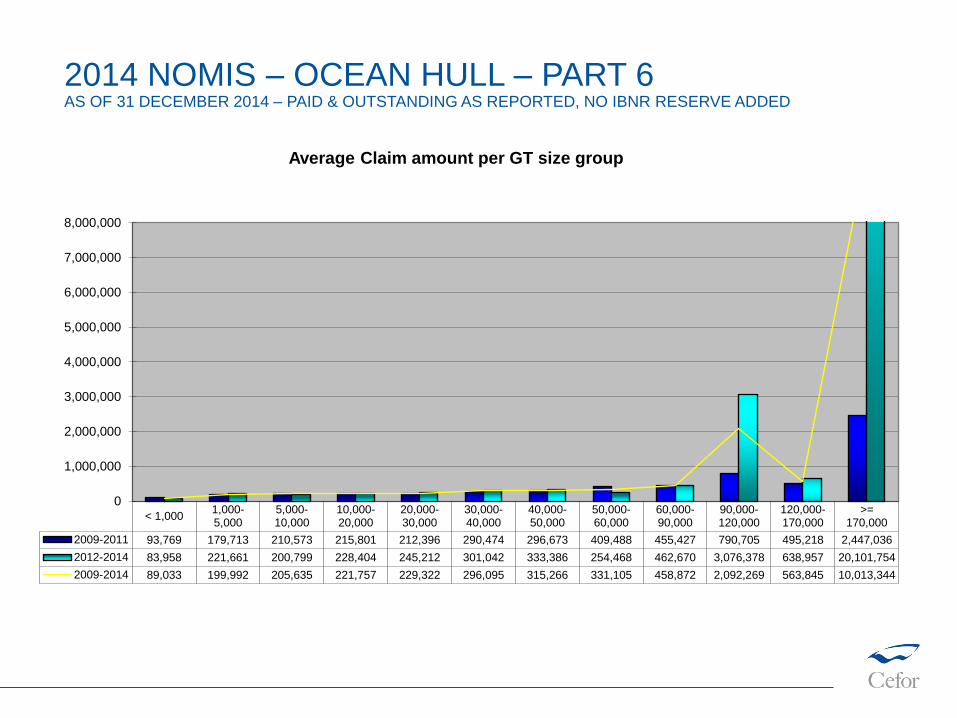
>=170,000
2009-2011 93,769 179,713 210,573 215,801 212,396 290,474 296,673 409,488 455,427 790,705 495,218 2,447,036
2012-2014 83,958 221,661 200,799 228,404 245,212 301,042 333,386 254,468 462,670 3,076,378 638,957 20,101,754
2009-2014 89,033 199,992 205,635 221,757 229,322 296,095 315,266 331,105 458,872 2,092,269 563,845 10,013,344
0
1,000,000
2,000,000
3,000,000
4,000,000
5,000,000
6,000,000
7,000,000
8,000,000
Average Claim amount per GT size group
2014 NOMIS – OCEAN HULL – PART 6AS OF 31 DECEMBER 2014 – PAID & OUTSTANDING AS REPORTED, NO IBNR RESERVE ADDED
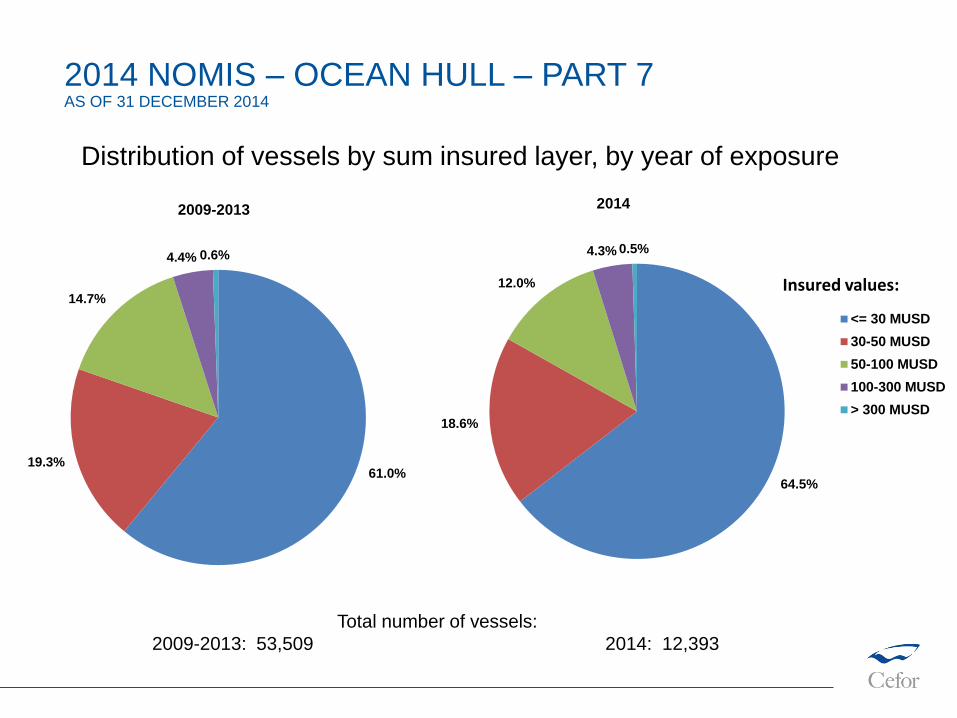
61.0%19.3%
14.7%
4.4% 0.6%
2009-2013
<= 30 MUSD
30-50 MUSD
50-100 MUSD
100-300 MUSD
> 300 MUSD
64.5%
18.6%
12.0%
4.3% 0.5%
2014
<= 30 MUSD
30-50 MUSD
50-100 MUSD
100-300 MUSD
> 300 MUSD
Distribution of vessels by sum insured layer, by year of exposure
Insured values:
2014 NOMIS – OCEAN HULL – PART 7AS OF 31 DECEMBER 2014
Total number of vessels:
2009-2013: 53,509 2014: 12,393
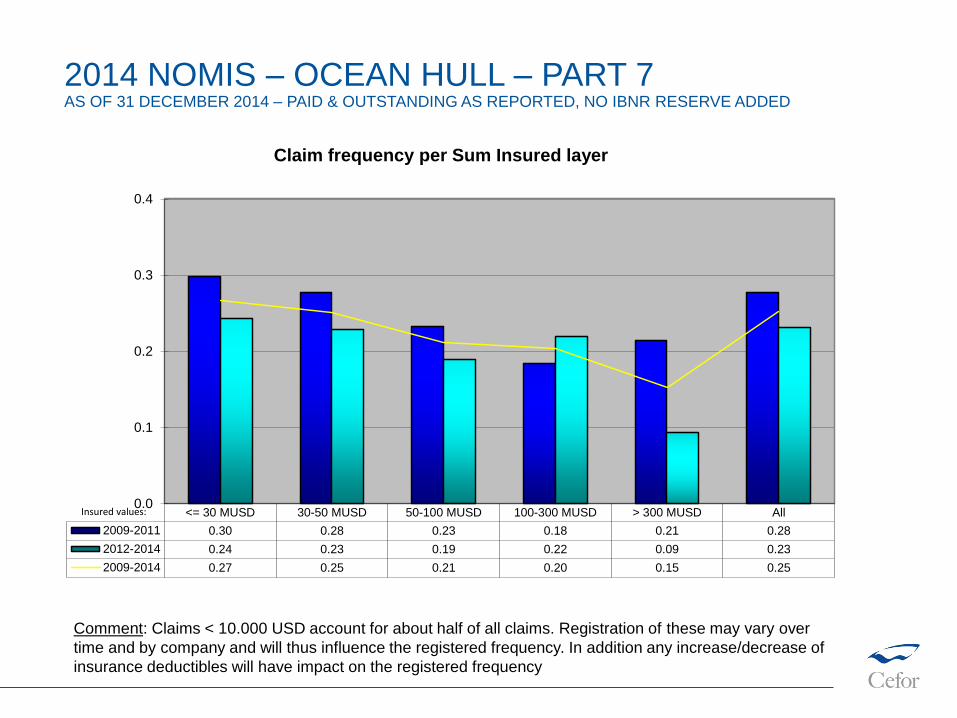
<= 30 MUSD 30-50 MUSD 50-100 MUSD 100-300 MUSD > 300 MUSD All
2009-2011 0.30 0.28 0.23 0.18 0.21 0.28
2012-2014 0.24 0.23 0.19 0.22 0.09 0.23
2009-2014 0.27 0.25 0.21 0.20 0.15 0.25
0.0
0.1
0.2
0.3
0.4
Claim frequency per Sum Insured layer
Comment: Claims < 10.000 USD account for about half of all claims. Registration of these may vary over
time and by company and will thus influence the registered frequency. In addition any increase/decrease of
insurance deductibles will have impact on the registered frequency
Insured values:
2014 NOMIS – OCEAN HULL – PART 7AS OF 31 DECEMBER 2014 – PAID & OUTSTANDING AS REPORTED, NO IBNR RESERVE ADDED

Insured values:
2014 NOMIS – OCEAN HULL – PART 7AS OF 31 DECEMBER 2014 – PAID & OUTSTANDING AS REPORTED, NO IBNR RESERVE ADDED
<= 30 MUSD 30-50 MUSD 50-100 MUSD 100-300 MUSD > 300 MUSD All
2009-2011 56,530 77,326 87,184 79,173 551,745 69,712
2012-2014 46,973 87,899 61,201 215,939 1,944,372 73,481
2009-2014 51,161 82,982 74,549 152,026 1,250,344 71,763
0
200,000
400,000
600,000
800,000
1,000,000
1,200,000
1,400,000
1,600,000
1,800,000
2,000,000
2,200,000
Claim per vessel per Sum Insured layer

<= 30 MUSD 30-50 MUSD 50-100 MUSD 100-300 MUSD > 300 MUSD All
2009-2011 0.431% 0.195% 0.129% 0.051% 0.135% 0.195%
2012-2014 0.339% 0.226% 0.091% 0.142% 0.453% 0.220%
2009-2014 0.378% 0.211% 0.110% 0.099% 0.298% 0.208%
0.00%
0.05%
0.10%
0.15%
0.20%
0.25%
0.30%
0.35%
0.40%
0.45%
0.50%
Claim per Sum Insured per Sum Insured layer
Insured values:
2014 NOMIS – OCEAN HULL – PART 7AS OF 31 DECEMBER 2014 – PAID & OUTSTANDING AS REPORTED, NO IBNR RESERVE ADDED

<= 30 MUSD 30-50 MUSD 50-100 MUSD 100-300 MUSD > 300 MUSD All
2009-2011 3.8 1.9 1.4 1.0 5.3 2.3
2012-2014 2.4 2.0 1.0 2.7 18.5 2.2
2009-2014 2.9 2.0 1.2 1.9 12.0 2.3
0.0
2.0
4.0
6.0
8.0
10.0
12.0
14.0
16.0
18.0
20.0
Claim per GT per Sum Insured layer
Insured values:
2014 NOMIS – OCEAN HULL – PART 7AS OF 31 DECEMBER 2014 – PAID & OUTSTANDING AS REPORTED, NO IBNR RESERVE ADDED

<= 30 MUSD 30-50 MUSD 50-100 MUSD 100-300 MUSD > 300 MUSD All
2009-2011 189,813 279,099 374,004 429,457 2,577,640 250,980
2012-2014 193,238 383,760 323,530 984,424 20,976,343 317,138
2009-2014 191,564 330,119 352,075 748,897 8,162,961 283,997
0
5,000,000
10,000,000
15,000,000
20,000,000
25,000,000
Average Claim amount per Sum Insured layer
Insured values:
2014 NOMIS – OCEAN HULL – PART 7AS OF 31 DECEMBER 2014 – PAID & OUTSTANDING AS REPORTED, NO IBNR RESERVE ADDED
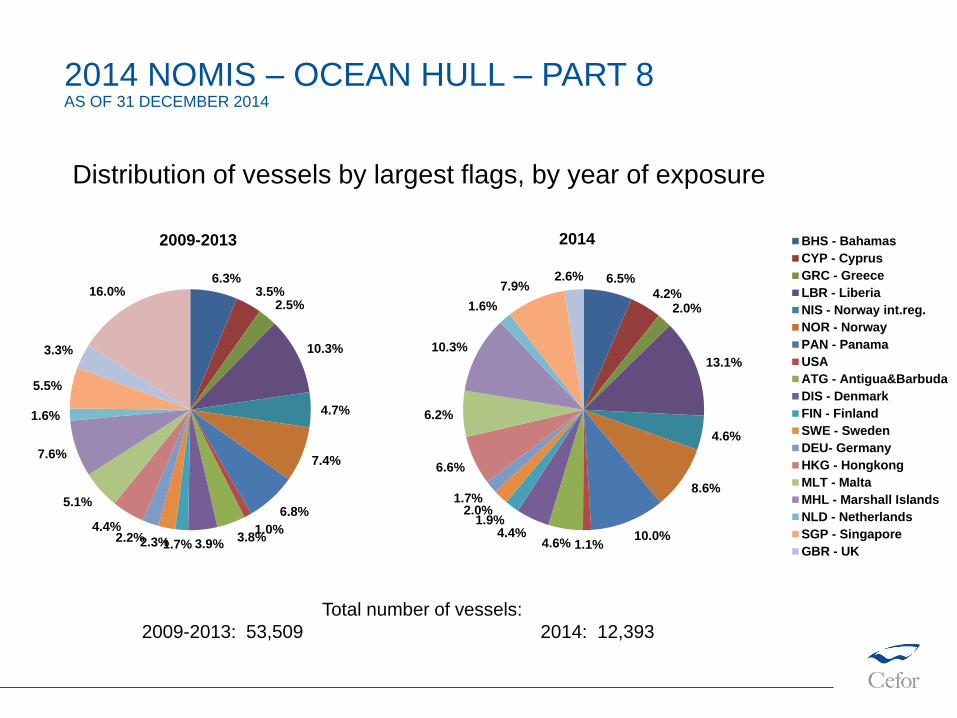
Distribution of vessels by largest flags, by year of exposure
2014 NOMIS – OCEAN HULL – PART 8AS OF 31 DECEMBER 2014
Total number of vessels:
2009-2013: 53,509 2014: 12,393
6.3%3.5%
2.5%
10.3%
4.7%
7.4%
6.8%
1.0%3.8%
3.9%1.7%2.3%2.2%4.4%
5.1%
7.6%
1.6%
5.5%
3.3%
16.0%
2009-2013 BHS - Bahamas
CYP - Cyprus
GRC - Greece
LBR - Liberia
NIS - Norway int.reg.
NOR - Norway
PAN - Panama
USA
ATG - Antigua&Barbuda
DIS - Denmark
FIN - Finland
SWE - Sweden
DEU- Germany
HKG - Hongkong
MLT - Malta
MHL - Marshall Islands
NLD - Netherlands
SGP - Singapore
GBR - UK
other
6.5%
4.2%2.0%
13.1%
4.6%
8.6%
10.0%1.1%4.6%
4.4%1.9%
2.0%1.7%
6.6%
6.2%
10.3%
1.6%
7.9%2.6%
2014 BHS - Bahamas
CYP - Cyprus
GRC - Greece
LBR - Liberia
NIS - Norway int.reg.
NOR - Norway
PAN - Panama
USA
ATG - Antigua&Barbuda
DIS - Denmark
FIN - Finland
SWE - Sweden
DEU- Germany
HKG - Hongkong
MLT - Malta
MHL - Marshall Islands
NLD - Netherlands
SGP - Singapore
GBR - UK

11.4%
9.0%
42.4%
18.8%
7.0%
11.3%
2009-2013
American Bureau
Bureau Veritas
DNV-GL
Lloyd's Register
Nippon Kaiji Kyokai
others
11.1%
9.6%
43.2%
15.5%
9.1%
11.5%
2014
American Bureau
Bureau Veritas
DNV-GL
Lloyd's Register
Nippon Kaiji Kyokai
others
Distribution of vessels by classification society, by year of exposure
2014 NOMIS – OCEAN HULL – PART 8AS OF 31 DECEMBER 2014
Total number of vessels:
2009-2013: 53,509 2014: 12,393

10% 20% 30% 40% 50% 60% 70% 80% 90%100%
0-5 Mio USD 0.632 0.806 0.894 0.945 0.974 0.989 0.999 1.000 1.000 1.000
5-20 Mio USD 0.748 0.879 0.936 0.968 0.988 0.998 1.000 1.000 1.000 1.000
20-75 Mio USD 0.852 0.940 0.974 0.986 0.995 1.000 1.000 1.000 1.000 1.000
> 75 Mio USD 0.804 0.912 0.975 0.993 1.000 1.000 1.000 1.000 1.000 1.000
100% 1.000 1.000 1.000 1.000 1.000 1.000 1.000 1.000 1.000 1.000
50%
60%
70%
80%
90%
100%
110%
Ce
din
g c
om
pa
ny's
re
ten
tio
n o
f c
laim
s
(in
% o
f to
tal
cla
ims
)
Ceding company's retention as % of SI
Exposure curves by Sum InsuredPartial Claims only (<=75%SI)
Sum Insured:
PA claims in % of all claims* :
0-5 MUSD: 75%
5-20 MUSD: 87%
20-75 MUSD: 80%
> 75 MUSD: 69%*
* «all claims» includes Costa
Concordia cost; PA% for claims
>75 MUSD is therefore relative low
2014 NOMIS – OCEAN HULL – PART 9AS OF 31 DECEMBER 2014, PAID & OUTSTANDING AS REPORTED
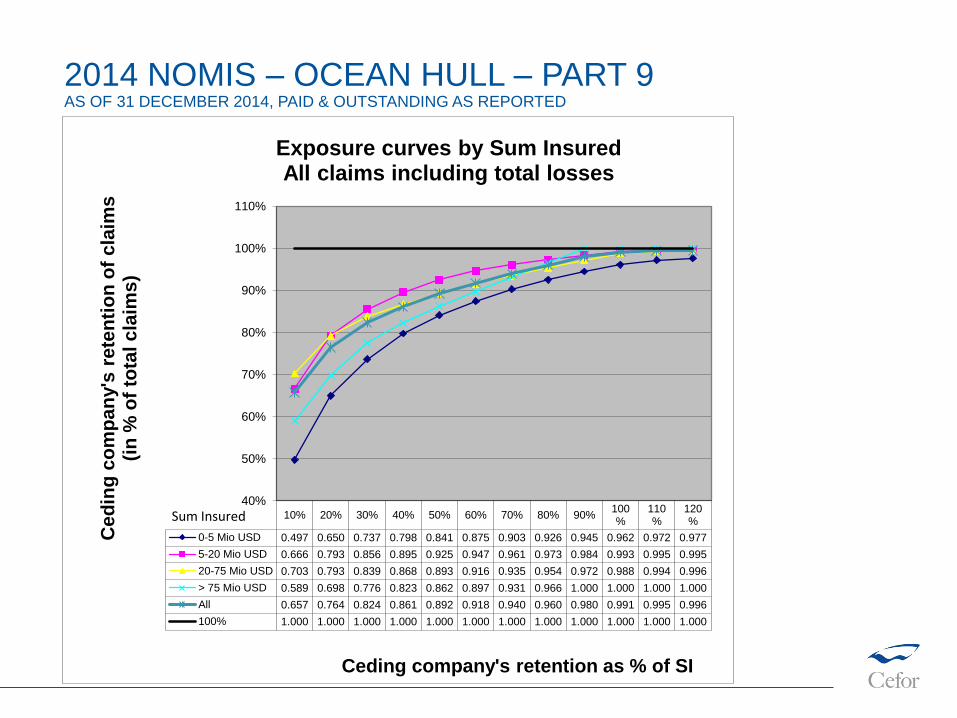
10% 20% 30% 40% 50% 60% 70% 80% 90%100%
110%
120%
0-5 Mio USD 0.497 0.650 0.737 0.798 0.841 0.875 0.903 0.926 0.945 0.962 0.972 0.977
5-20 Mio USD 0.666 0.793 0.856 0.895 0.925 0.947 0.961 0.973 0.984 0.993 0.995 0.995
20-75 Mio USD 0.703 0.793 0.839 0.868 0.893 0.916 0.935 0.954 0.972 0.988 0.994 0.996
> 75 Mio USD 0.589 0.698 0.776 0.823 0.862 0.897 0.931 0.966 1.000 1.000 1.000 1.000
All 0.657 0.764 0.824 0.861 0.892 0.918 0.940 0.960 0.980 0.991 0.995 0.996
100% 1.000 1.000 1.000 1.000 1.000 1.000 1.000 1.000 1.000 1.000 1.000 1.000
40%
50%
60%
70%
80%
90%
100%
110%
Ce
din
g c
om
pa
ny's
re
ten
tio
n o
f c
laim
s
(in
% o
f to
tal c
laim
s)
Ceding company's retention as % of SI
Exposure curves by Sum InsuredAll claims including total losses
Sum Insured
2014 NOMIS – OCEAN HULL – PART 9AS OF 31 DECEMBER 2014, PAID & OUTSTANDING AS REPORTED

Exposure Curves
• Exposure curves are used by reinsurers to price excess of loss reinsurance.
• The curves indicate the ceding company's retained share of PA claims after ceding
claims in excess of a given percentage of a vessel’s sum insured.
• The curves should be applied on individual vessels or groups of vessels with similar
values and written shares.
• The curves are calculated for 100% values. In applications the choice of curve should
thus also be based on 100% values.
• The curves are based on USD claims amounts. Due to exchange rate fluctuations,
the ratio between claim cost and insured value may deviate in the original currency.
Exposure Curves technicalities
• The curves are based on H&M covers only for vessels with valid IMO-No.
• The curves are based on claims incurred in the years 2009-2014
(13,249 partial claims; 13,298 claims in all; only claims with cost > 1USD included)
• The curves are calculated as follows:
x = percentage retained
C = Individual claims 1)
V = Vessel value
f(x) = Σ min[C, V*x]/ Σ C
1) First set of exposure curves: based on partial claims only; Second set of exposure curves: based on
all claims, including total losses / claims exceeding the Sum Insured
2014 NOMIS – OCEAN HULL – PART 9AS OF 31 DECEMBER 2014, PAID & OUTSTANDING AS REPORTED
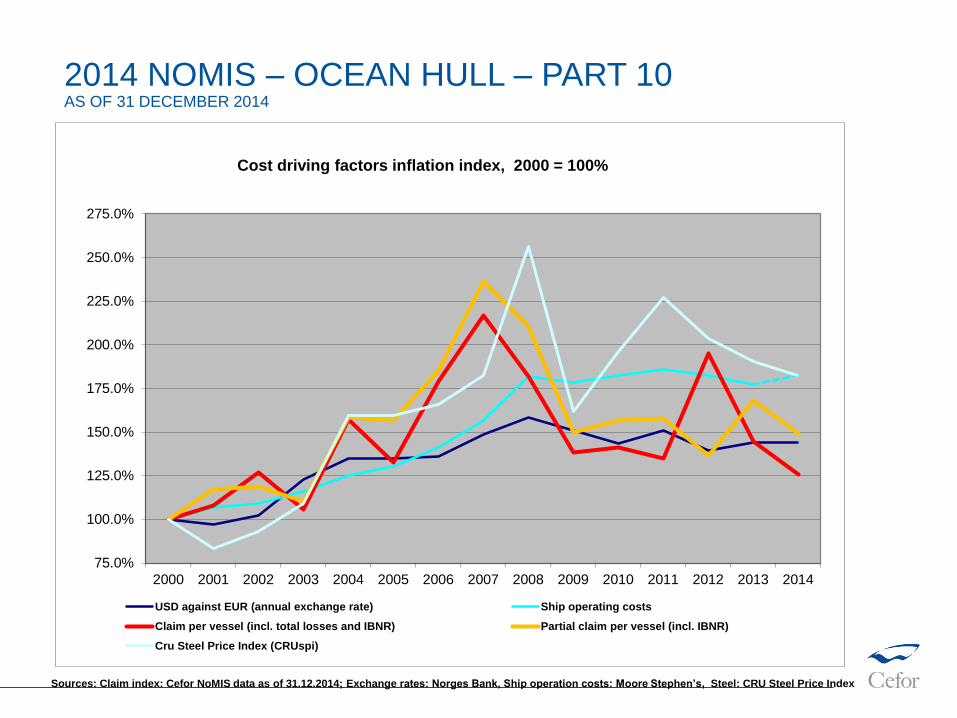
Sources: Claim index: Cefor NoMIS data as of 31.12.2014; Exchange rates: Norges Bank, Ship operation costs: Moore Stephen’s, Steel: CRU Steel Price Index
2014 NOMIS – OCEAN HULL – PART 10AS OF 31 DECEMBER 2014
75.0%
100.0%
125.0%
150.0%
175.0%
200.0%
225.0%
250.0%
275.0%
2000 2001 2002 2003 2004 2005 2006 2007 2008 2009 2010 2011 2012 2013 2014
Cost driving factors inflation index, 2000 = 100%
USD against EUR (annual exchange rate) Ship operating costs
Claim per vessel (incl. total losses and IBNR) Partial claim per vessel (incl. IBNR)
Cru Steel Price Index (CRUspi)

Cefor marine insurance statistics publications at www.cefor.no/statistics :
• Cefor Annual Report 2014
• The 2014 Cefor NoMIS OCEAN Hull Report
• The 2014 Cefor NoMIS COASTAL Hull Report
• Half-yearly Claims Update Fact Sheet
• All Cefor statistics are available for download from the statistics section of the Cefor
website: www.cefor.no/statistics
(check the “NoMIS” section – Nordic Marine Insurance Statistics)
Other marine insurance statistics:
• IUMI (International Union of Marine Insurance) – Statistics issued by IUMI’s Facts &
Figures Committee: http://www.iumi.com/index.php/committees/facts-a-figures-committee/statistics
NOMIS REPORTS 2014: