the 2013 state of women-owned businesses report lane home collection member since 2001 ... t his...
TRANSCRIPT
The 2013 State of Women-Owned Businesses Reportcommissioned by American Express OPEN
A Summary of Important Trends, 1997–2013
BeTh GerSTeIn
BrIllIAnT eArTh
MeMBer SInce 2010
MArTInA ArfwIdSon
And Gun nowAk
fAce STockholM
MeMBer SInce 1994
eleAnor rAMoS
lITTle TwIG
MeMBer SInce 1998
JeSSIcA BenneTT
AlIce lAne hoMe collecTIon
MeMBer SInce 2001
leAh Brown
A10 clInIcAl SoluTIonS, Inc.
MeMBer SInce 1998
This report was commissioned by American Express OPEN and published in
March of 2013. The information contained in this report was prepared from
sources and data that we believe to be reliable, but we make no representation
as to its accuracy or completeness and we assume neither responsibility nor liability
for any damages of any type resulting from any errors or omissions. The report is
provided solely for informational purposes and is not to be construed as providing
advice, recommendations, endorsements, representations or warranties of any kind
whatsoever. Opinions and analysis contained in this report represent the opinions and
analysis of Womenable, a research, program and policy development consultancy,
and do not necessarily represent the opinions or analysis of American Express
Company or any of its affiliates, subsidiaries or divisions (including, without limitation,
American Express OPEN).
Our sincere thanks are extended to the Economic Census Branch of the Company
Statistics Division of the U.S. Census Bureau, which provided invaluable insights
during the preparation of this analysis.
Visit openforum.com/womensbusinessreport

Introduction . . . . . . . . . . . . . . . . . . . . . . . . . . . . . . . . . . . . . . . 1
executive Summary . . . . . . . . . . . . . . . . . . . . . . . . . . . . . . . . . . 2
national Trends . . . . . . . . . . . . . . . . . . . . . . . . . . . . . . . . . . . . . 2
Geographic Trends . . . . . . . . . . . . . . . . . . . . . . . . . . . . . . . . . . . 2
Industry Trends . . . . . . . . . . . . . . . . . . . . . . . . . . . . . . . . . . . . . 3
firms owned by women of color . . . . . . . . . . . . . . . . . . . . . . . . . . 4
The Issue of Growth . . . . . . . . . . . . . . . . . . . . . . . . . . . . . . . . . . 5
women-owned Businesses in the united States in 2013 . . . . . . . . . . . . . 7
A Brief history of the Business census: data Improvements, definitional changes . . . . . . . . . . . . . . . . . . . . . 9
State Trends . . . . . . . . . . . . . . . . . . . . . . . . . . . . . . . . . . . . . . 10
Metropolitan Area Trends . . . . . . . . . . . . . . . . . . . . . . . . . . . . . . . 14
Industry Trends. . . . . . . . . . . . . . . . . . . . . . . . . . . . . . . . . . . . . 17
firms owned by women of color: Taking the Stage . . . . . . . . . . . . . . . 20
African American women-owned firms . . . . . . . . . . . . . . . . . . . . . 21
Asian American women-owned firms. . . . . . . . . . . . . . . . . . . . . . . 22
latina-owned firms . . . . . . . . . . . . . . . . . . . . . . . . . . . . . . . . . 23
native American/Alaska native women-owned firms . . . . . . . . . . . . . 24
native hawaiian/Pacific Islander women-owned firms . . . . . . . . . . . . 25
The Issue of Growth: A Tale of Two cities. . . . . . . . . . . . . . . . . . . . . . 26
Growth Along the employment Size Spectrum . . . . . . . . . . . . . . . . . 27
Growth Along the revenue Size Spectrum . . . . . . . . . . . . . . . . . . . . 28
observations: women-owned firms as unsung heroines . . . . . . . . . . . . 30
Study Methodology . . . . . . . . . . . . . . . . . . . . . . . . . . . . . . . . . . 31
Acknowledgements . . . . . . . . . . . . . . . . . . . . . . . . . . . . . . . . . . 32
Summary Tables . . . . . . . . . . . . . . . . . . . . . . . . . . . . . . . . . . . . 33
TABlE Of CONTENTS
1
THE STaTE of WomEn-oWnEd BuSinESSES, 2013
Introduction
With this publication, American Express
OPEN provides stakeholders in the women’s
enterprise development community with
its third annual investigation into the state of women-
owned businesses in the United States, building upon
the growing interest and commentary generated by our
previous reports, published in each of the past
two years.
This up-to-date analysis not only reinforces trends we
have been seeing in this and other research—that the
number of women-owned firms continues to rise at rates
exceeding the national average, yet they remain smaller
than the average firm—we are pleased to expand upon our
earlier efforts to gain a greater understanding of issues
surrounding business growth. And new this year is a look
at the remarkable growth in the number and economic
clout of firms owned by women of color.
Among the most important findings in this report:
• The number and economic contributions of women-
owned firms continue to grow. The rate of growth in
the number of women-owned enterprises over the past
16 years remains higher than the national average.
Between 1997 and 2013, the number of women-owned
firms is growing at 1½ times the national average.
• Over the past six years, since the depth of the U.S.
recession, the only businesses that have provided
a net increase in employment are large, publicly
traded corporations… and privately held majority
women-owned firms. In all other privately held firms,
employment has declined over the 2007–2013 period.
• Since 1997, the growth in the number and economic
contributions of firms owned by women of color is
nothing short of remarkable. Comprising just 17% of
women-owned firms 16 years ago, firms owned by
women of color now account for one in three women-
owned firms in the U.S.
• Comparing trends in the number and revenue
accomplishments of women-owned and all firms by
industries finds that women-owned firms are exceeding
overall sector growth in eight of the 13 most populous
industries, and in two of those industries (construction
and transportation) women business owners are
standing toe-to-toe with their competitors in terms of
revenue accomplishments.
• The states with the fastest growth in the number,
employment and revenues of women-owned
firms are the District of Columbia, North Dakota,
Nevada, Wyoming and Georgia. The fastest growing
metropolitan areas for women-owned firms are San
Antonio TX, Portland OR, Houston TX, Riverside CA,
and Washington DC/MD/VA.
It is our hope that these up-to-date insights, based upon
published information from the U.S. Census Bureau, will
spark debate and discussion—and will draw particular
attention to the growing diversity in women-owned
enterprises, both in terms of the sectors in which they
operate AND with respect to the ethnic diversity of women
business owners.
further, it is our goal to add to the body of knowledge of
where growth leads and where it lags, thereby pointing
the way to areas where policy and programmatic support
can help even more women-owned firms to reach their
full potential.
2
THE STaTE of WomEn-oWnEd BuSinESSES, 2013
Executive Summary
nATIonAl TrendS
• As of 2013, it is estimated that there are over 8.6
million women-owned businesses in the United States,
generating over $1.3 trillion in revenues and employing
nearly 7.8 million people.
• Between 1997 and 2013, when the number of
businesses in the United States increased by 41%, the
number of women-owned firms increased by 59%—a
rate 1½ times the national average. Indeed, the growth
in the number (up 59%), employment (up 10%) and
revenues (up 63%) of women-owned firms over the
past 16 years exceeds the growth rates of all but the
largest, publicly traded firms—topping the growth rates
in number, employment and revenue of all privately held
businesses over this period.
• Despite the fact that the number of women-owned
firms continues to grow at a rate exceeding the national
average, and now accounts for 29% of all enterprises,
women-owned firms only employ 6% of the country’s
workforce and contribute just under 4% of business
revenues—roughly the same share they contributed in
1997. When large, publicly traded firms are excluded,
women owned firms comprise 30% of the privately held
firm population and contribute 14% of employment and
11% of revenues.
• Combining equally owned firms with women-owned
enterprises finds that women-owned and equally owned
firms number nearly 13.6 million as of 2013, generate
over $2.7 trillion in revenues, and employ nearly 15.9
million people. Together, these firms represent 46% of
U.S. firms and contribute 13% of total employment and
8% of firm revenues.1
• As most of us know, job growth has been largely stagnant
since the recession of 2007-09. According to our
estimates, private sector employment has risen by 5.3
million jobs since January of 2007 (just 4% growth in
total private sector employment over the entire period).
Over the past six years, the net increase of 5.3 million jobs
is accounted for by a 5.9 million increase in employment
among large, publicly traded corporations and a 569,000
decline in employment among smaller, privately held
companies. The only bright spot in recent years with
respect to privately held company job growth has been
among women-owned firms. They have added an
estimated 175,000 jobs to the U.S. economy since 2007.
GeoGrAPhIc TrendS
• Nationally, the number of women-owned firms has
increased by 59% since 1997. The states with the fastest
growth in the number of women-owned firms over the
past 16 years are: Georgia (up 112%), Texas (93%),
North Carolina (91%), louisiana (94%) and Nevada
(84%). The states with the lowest growth in the number
of women-owned firms between 1997 and 2013 are:
Alaska (12%), West Virginia (23%), Iowa (23%), Ohio
(27%) and Kansas (27%).
• In terms of growth in combined economic clout,
however—meaning averaging together the rankings in
growth in the number, revenues and employment of
women-owned firms—the states in which all of these
measures combined place women-owned firms in a
much better than average position over the 1997 to
2013 period are the District of Columbia, North Dakota,
1 Changes in the way that equally owned firms have been defined over time guard against an accurate reporting of trends in the growth of women-owned and equally owned firms over time.
3
THE STaTE of WomEn-oWnEd BuSinESSES, 2013
Nevada, Wyoming and Georgia. The five states at the
bottom of the combined ranking are: Iowa, Ohio, Vermont,
Rhode Island and Maine.
• looking in more geographic detail at the top 25 most
populous metropolitan areas finds the greatest number
of women-owned businesses to be located in: New York
NY/NJ, with 663,200 women-owned firms as of 2013;
los Angeles CA, 432,300; Chicago Il, 308,000; Miami
fl, 229,800; and Washington DC/MD/VA, 209,700.
• Averaging together the 11-year growth rankings2 in
the number, revenue and employment of women-
owned firms in the 25 largest metropolitan areas in
the country—to look at combined economic clout—
finds that San Antonio TX, Portland OR, Houston TX,
Riverside CA, and Washington DC/MD/VA are the top
metro areas for women-owned businesses.
InduSTry TrendS
• Women-owned firms continue to diversify into all
industries. The industries with the highest concentration
of women-owned firms are: health care and social
assistance (53% of firms in this sector are women-
owned, compared to a 29% share overall), educational
services (45%), other services (41%), and administrative
support and waste management services (44%). The
industries with the lowest concentration of women-
owned firms (in industries contributing 2% or more of
the business population) are construction (where just
7% of firms are women-owned), transportation and
warehousing (11%) and finance and insurance (20%).
All other industries are close to the 29% share in all
industries—again illustrating that women-owned firms
are staking a claim in all sectors of the U.S. economy.
• looking at the distribution of women-owned firms
by industry sector finds that the greatest number of
women-owned firms is found in health care and social
assistance (including doctors and dentists, residential
care facilities and child care providers)—17% of women-
owned firms own health care or social services-related
businesses. Other top sectors for women-owned
firms include other services, with 15% of women-
owned firms in that grouping; professional/scientific/
technical services (including attorneys, accountants,
public relations and human resources/organizational
development consulting) 14%; retail trade, 11%; and
administrative support and waste management
services, 10%.
• The fastest growth in the number of women-owned
firms over the past 11 years3 has been in education
services (up 113%), administration and waste services
(up 58%), health care and social assistance (up
45%), and transportation and warehousing (up 40%).
Comparing the growth in the number of women-owned
firms to that of all firms in each industry sector since
2002 finds that women-owned firms are exceeding
overall sector growth rates in eight of the 13 most
populous industries.4 In order from widest to narrowest
growth gap they are: administrative support and
waste services (up 58% among women-owned firms
compared to 29% growth overall in the sector, for a
29-point gap), wholesale trade (12-point gap), other
services (9-point gap), real estate (9 points), finance
and insurance (7-point gap), health care and social
assistance (+4), professional/scientific/technical
services (+3), and arts/entertainment/ recreation (+3).
2 The boundaries of metropolitan areas were changed after the 2000 census, thus metropolitan area trends can only be analyzed back as far as the 2002 economic census.
3 Unlike the other national and state-level trends reported in this publication, which go back to 1997, industry trends are just reported back as far as the 2002 Census, due to changes in industry classification between 1997 and 2002 (from SIC codes to NAICS codes).
4 Six industry groups, comprising 2% or less of the business population, are excluded from this analysis, but are included in the summary tables at the back of this report.
4
THE STaTE of WomEn-oWnEd BuSinESSES, 2013
• How are women-owned firms doing with respect to
economic clout across industries? This year’s analysis
examines the share of women-owned and all firms
in each industry that are “high economic impact,”
meaning that they are generating $500,000 or more
in annual revenues. Taking a look at the share of these
firms across major industry groups finds that women-
owned firms are standing toe-to-toe with their industry
peers—meaning that an equal share of women-owned
firms in the sector are generating in excess of half a
million dollars in revenues annually—in two industries:
construction, where 13% of women-owned firms and
11% of all construction firms are pulling in $500,000+
per year; and in transportation and warehousing,
where 6% of each are generating $500,000 or more
in revenues.
• It’s also important to call out the women-owned firms
with the greatest number of high economic impact
firms. Relative to the overall 4% of women-owned firms
surpassing the $500,000 revenue mark, women-
owned firms in three industries—wholesale trade (19%),
construction (13%) and accommodation and food
services (11%)—are those most likely to be making a
high economic impact.
fIrMS owned By woMen of color
• In 1997, there were just under 1 million (929,445) firms
owned by women of color, accounting for
one in six (17%) women-owned firms. That number has
skyrocketed to an estimated 2,677,700 as of 2013, now
comprising one in three (31%) women-owned firms.
• firms owned by African American women number an
estimated 1,119,400 as of 2013. These 1.1 million firms
employ 272,000 workers in addition to the owner and
generate an estimated $44.9 billion in revenue. African
American women own fully 49% of all African American-
owned firms, employ 28% of the workers employed by
African American-owned firms, and contribute 28%
of the revenue generated by African American-owned
businesses. While nationally African American women
comprise 13% of all women-owned firms, African
American women comprise the greatest share of all
women-owned firms in Georgia (34%), Maryland (31%),
and Illinois (21%).
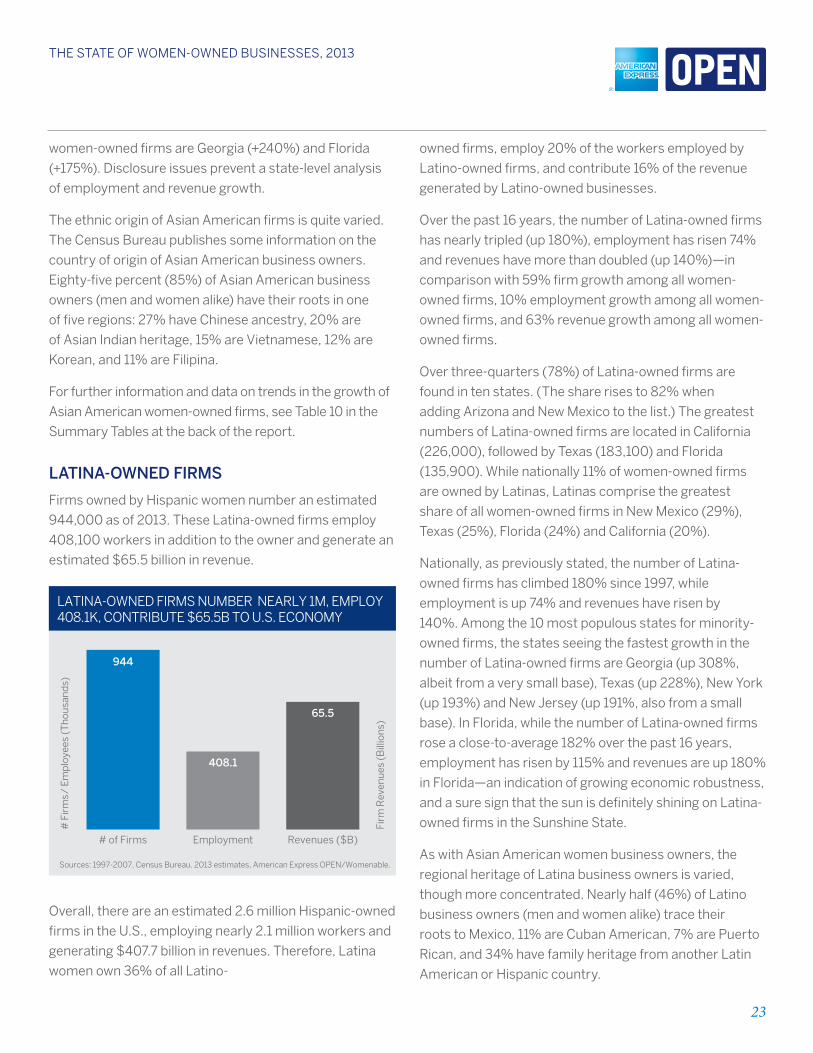
• firms owned by latinas number an estimated 944,000
as of 2013. These firms employ 408,100 workers in
addition to the owner and generate an estimated $65.5
billion in revenue. latina women own 36% of all latino-
owned firms, employ 20% of the workers employed by
latino-owned firms, and contribute 16% of the revenue
generated by latino-owned businesses. While nationally
11% of women-owned firms are owned by latinas,
latinas comprise the greatest share of all women-
owned firms in New Mexico (29%), Texas (25%), florida
(24%) and California (20%).
• firms owned by Asian American women number an
estimated 620,300 as of 2013. These firms employ
649,000 workers in addition to the owner and
generate an estimated $105 billion in revenue. Asian
American women own 35% of all Asian American-
owned firms, employ 21% of the workers employed
by Asian American-owned firms, and contribute 18%
of the revenue generated by Asian American-owned
businesses. While nationally Asian American women
own 7% of women-owned firms, the greatest share of
Asian American women-owned firms (compared to all
women-owned firms in the state) can be found in Hawaii
(54%), California (17%), New Jersey and New York
(both 10%).
• firms owned by Native American or Alaska Native
women number an estimated 111,400 as of 2013. These
firms employ 44,900 workers in addition to the owner
and generate an estimated $9.6 billion in revenue.
Native American/Alaska Native women own fully 45% of
all Native American/Alaska Native-owned firms, employ
31% of the workers, and contribute 28% of the revenue
generated by Native American/Alaska Native-owned
businesses. While nationally Native American/Alaska
5
THE STaTE of WomEn-oWnEd BuSinESSES, 2013
Native women comprise just 1% of women-owned firms,
that share rises to 10% in Oklahoma, 9% in New Mexico
and 3% in Arizona.
• firms owned by Native Hawaiian or Pacific Islander
women number an estimated 18,200 as of 2013. These
firms employ 14,100 workers in addition to the owner
and generate an estimated $1.8 billion in revenue.
Native Hawaiian/Pacific Islander women own 41% of all
Native Hawaiian/Pacific Islander-owned firms, employ
36% of the workers, and contribute 25% of the revenue
generated by Native Hawaiian/Pacific Islander owned
businesses. Native Hawaiian/Pacific Islander women-
owned firms comprise less than 1% of the women-
owned business population in California and florida,
however. In Hawaii, 12% of women-owned firms are
majority owned by Native Hawaiians or natives of other
Pacific Islands.
• While firms owned by women of color are smaller than
non-minority women-owned businesses both in terms
of average employment and revenues, their growth in
number and economic clout is generally far outpacing
that of all women-owned firms. Indeed, the growth in
the number of African American (up 258% from 1997 to
2013), Asian American (+156%), latina (+180%), Native
American/Alaska Native (108%), and Native Hawaiian/
Pacific Islander (+216%) women-owned firms all top
the growth in the number of non-minority women-
owned firms (+32%) over the past 16 years. Growth in
employment (except among Native American/Alaska
Native women-owned firms) and revenue growth are
also stronger among firms owned by women of color
than among non-minority women-owned firms. While
this is, in part, due to growth from a smaller base
number, it does indicate that business ownership is an
ever more commonplace pursuit among women of color.
The ISSue of GrowTh
• The tale of women’s business ownership and growth is,
in many ways, a tale of two cities—faster than average
growth over time, yet a snapshot-in-time comparison
revealing a significant disparity in firm size. Business
growth in general is likewise a tale of two cities: despite
the frequently heralded claim that small businesses
are the backbone of the U.S. economy, they have
been taking a back seat to the largest, publicly traded
companies for the past decade or more in terms of
contributions to economic growth.
• In our inaugural 2011 report we found that, over
the 1997 to 2011 period, women-owned firms were
actually keeping up the pace in terms of revenue and
employment growth—when compared to the overall
average revenue and employment growth—all along
the business size spectrum, up until what was termed
the “Heartbreak Hill” of the entrepreneurial marathon:
the 100-employee threshold and the million-dollar
revenue mark. When comparing the growth in number,
employment and revenues of women-owned firms with
those of their peers along the full spectrum of business
size, women-owned firms matched or exceeded growth
rates up until the 100-employee threshold or the million-
dollar revenue mark.
• In our 2012 analysis, we took a look at growth in the
number of firms along the revenue and employment
spectrum in two distinct time periods (1997 to 2002
and 2007 to 2012) and found growth patterns to be very
similar, not only across both time periods but between
women-owned and all firms of similar sizes. We also
found that there were distinct dips in firm growth—
growth pains, if you will—at the 5-9 employee and
$250,000-$499,999 revenue levels.
• In 2013, we again examine the employment and revenue
growth of women-owned firms with their peers all along
the employment and revenue size continuum. Between
1997 and 2013, women-owned firms are largely
keeping up the pace as they grow, but only to a point.
6
THE STaTE of WomEn-oWnEd BuSinESSES, 2013
Employment growth is similar among firms with one to
four employees, women-owned firm growth dips well
below average in the five to nine employee size class,
but then matches, then exceeds, average employment
growth up until the 100-employee mark, at which they
fall far off the pace. Similarly, the revenue growth of
women-owned firms over the past 16 years exceeds the
national average in every single business revenue size
class—up until the million-dollar mark.
• Some of this gender growth gap at the very high end
of business accomplishment is an artifact of definition.
When privately held, majority women-owned firms
are compared with their peers along the business size
spectrum, we are largely comparing like with like all the
way along until the 100+ employee level and the million-
dollar mark—at which time the “all U.S. firms” pool is
much more likely to be dominated by very large, publicly
traded corporations.
• So it remains important to understand in greater detail
what progress—or peril—may be occurring among
the most accomplished women-owned businesses in
the U.S. economy, a population that cannot be readily
examined using published Census data figures. Indeed,
in a recent analysis drawing upon unpublished Census
data of firms with $1 million or more in revenues—
Growing Under the Radar: An Exploration of the
Achievements of Million-Dollar Women-Owned firms—
the number of women-owned businesses with $10
million or more in revenues was found to have grown by
57% between 2002 and 2012, a rate 47% faster than all
$10M+ businesses.
• However, it is also the case that businesses founded and
led by women are growing above and beyond the 51%+
ownership definition. Women business owners who
have sought and obtained outside equity investment to
spur their companies to a higher level of growth, or who
have shared equity ownership with senior managers in
their companies, may no longer meet the definitional
criteria for a “woman-owned business”—even though
these women may still run the company on a day-to-day
basis and be a plurality owner of the company. We need
to better understand this growth/ownership journey,
and attempt to quantify the heretofore unmeasured
economic contributions of this important segment of
the woman business owner population.
7
THE STaTE of WomEn-oWnEd BuSinESSES, 2013
Women-Owned Businesses in the United States in 2013
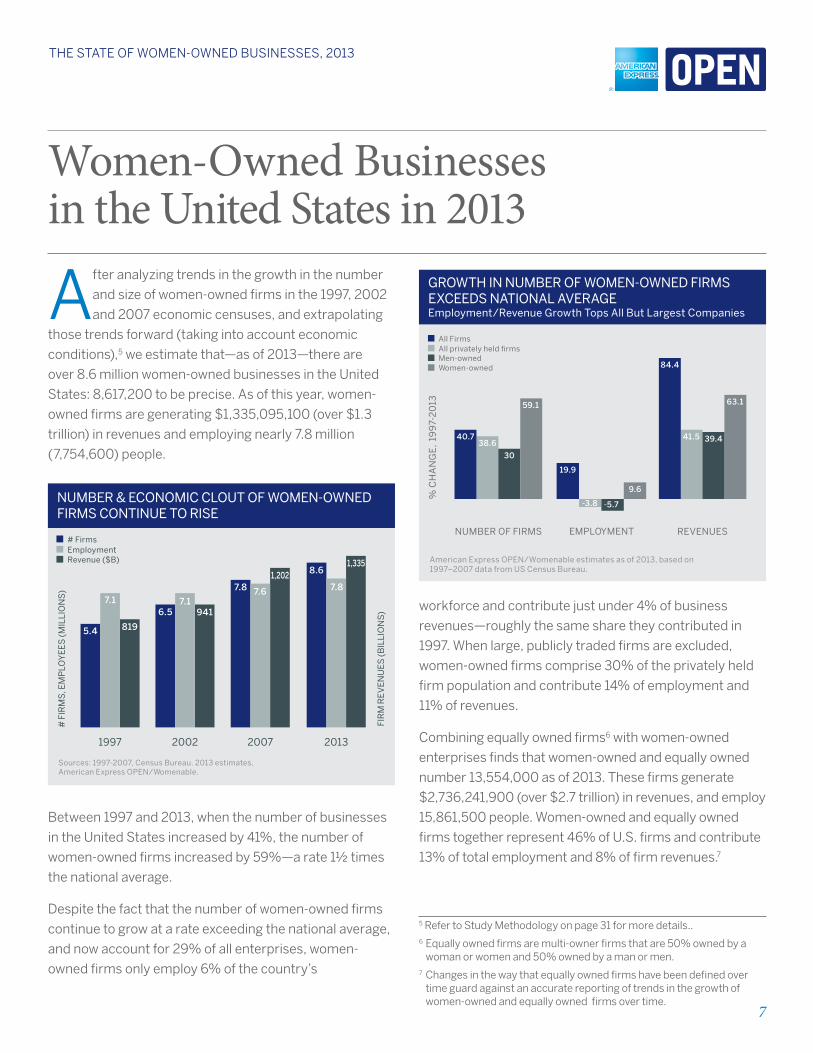
After analyzing trends in the growth in the number
and size of women-owned firms in the 1997, 2002
and 2007 economic censuses, and extrapolating
those trends forward (taking into account economic
conditions),5 we estimate that—as of 2013—there are
over 8.6 million women-owned businesses in the United
States: 8,617,200 to be precise. As of this year, women-
owned firms are generating $1,335,095,100 (over $1.3
trillion) in revenues and employing nearly 7.8 million
(7,754,600) people.
5.4 819
7.16.5
7.1
7.8 7.6
8.6
7.8
941
1,2021,335
1997 2002 2007 2013
# Firms
# F
IRM
S, E
MP
LOY
EE
S (
MIL
LIO
NS
)
FIR
M R
EV
EN
UE
S (
BIL
LIO
NS
)
Sources: 1997-2007, Census Bureau. 2013 estimates,American Express OPEN/Womenable.
EmploymentRevenue ($B)
NUMBER & ECONOMIC CLOUT OF WOMEN-OWNED FIRMS CONTINUE TO RISE
Between 1997 and 2013, when the number of businesses
in the United States increased by 41%, the number of
women-owned firms increased by 59%—a rate 1½ times
the national average.
Despite the fact that the number of women-owned firms
continue to grow at a rate exceeding the national average,
and now account for 29% of all enterprises, women-
owned firms only employ 6% of the country’s
GROWTH IN NUMBER OF WOMEN-OWNED FIRMSEXCEEDS NATIONAL AVERAGEEmployment/Revenue Growth Tops All But Largest Companies
40.7
30
59.1
38.6
NUMBER OF FIRMS
19.9
9.6
-3.8 -5.7
EMPLOYMENT
41.5
84.4
39.4
63.1
REVENUES
American Express OPEN/Womenable estimates as of 2013, based on 1997–2007 data from US Census Bureau.
All Firms
% C
HA
NG
E,
199
7-2
013
All privately held firmsMen-owned Women-owned
workforce and contribute just under 4% of business
revenues—roughly the same share they contributed in
1997. When large, publicly traded firms are excluded,
women-owned firms comprise 30% of the privately held
firm population and contribute 14% of employment and
11% of revenues.
Combining equally owned firms6 with women-owned
enterprises finds that women-owned and equally owned
number 13,554,000 as of 2013. These firms generate
$2,736,241,900 (over $2.7 trillion) in revenues, and employ
15,861,500 people. Women-owned and equally owned
firms together represent 46% of U.S. firms and contribute
13% of total employment and 8% of firm revenues.7
5 Refer to Study Methodology on page 31 for more details.. 6 Equally owned firms are multi-owner firms that are 50% owned by a
woman or women and 50% owned by a man or men.7 Changes in the way that equally owned firms have been defined over
time guard against an accurate reporting of trends in the growth of women-owned and equally owned firms over time.
8
THE STaTE of WomEn-oWnEd BuSinESSES, 2013
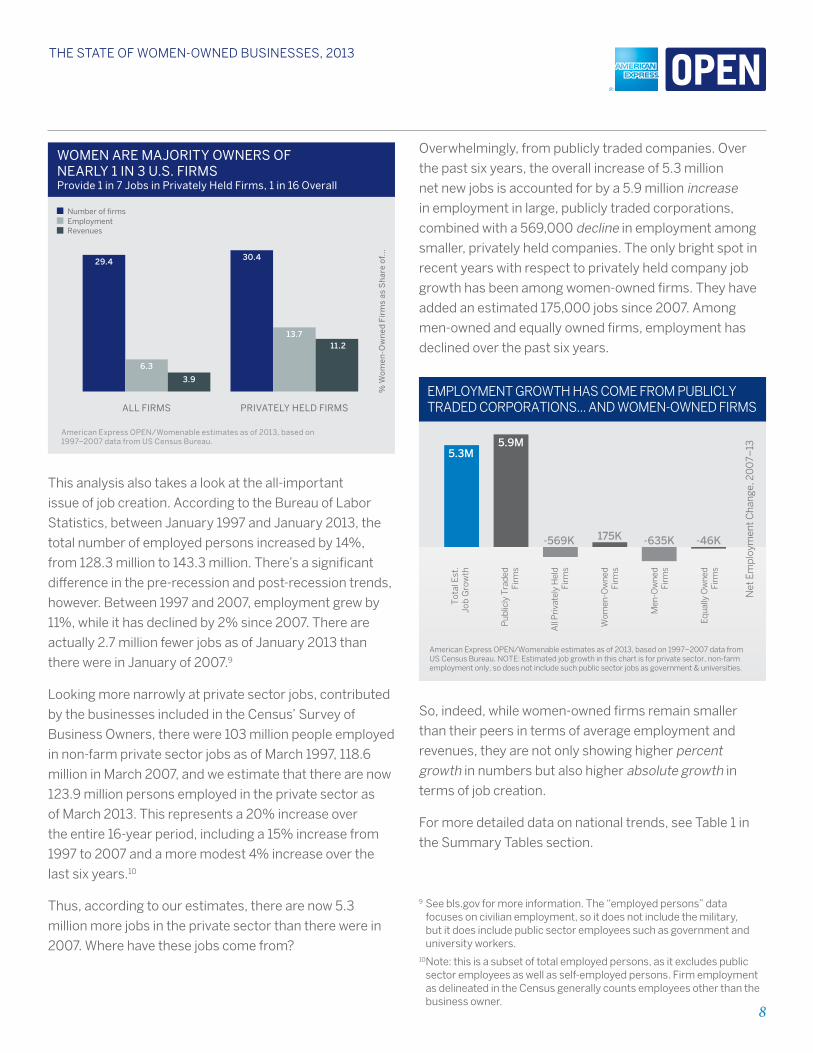
WOMEN ARE MAJORITY OWNERS OF NEARLY 1 IN 3 U.S. FIRMSProvide 1 in 7 Jobs in Privately Held Firms, 1 in 16 Overall
29.4
6.3
3.9
30.4
13.711.2
ALL FIRMS PRIVATELY HELD FIRMS
American Express OPEN/Womenable estimates as of 2013, based on 1997–2007 data from US Census Bureau.
Number of firms
% W
om
en-O
wn
ed F
irm
s as
Sh
are
of.
..
EmploymentRevenues
This analysis also takes a look at the all-important
issue of job creation. According to the Bureau of labor
Statistics, between January 1997 and January 2013, the
total number of employed persons increased by 14%,
from 128.3 million to 143.3 million. There’s a significant
difference in the pre-recession and post-recession trends,
however. Between 1997 and 2007, employment grew by
11%, while it has declined by 2% since 2007. There are
actually 2.7 million fewer jobs as of January 2013 than
there were in January of 2007.9
looking more narrowly at private sector jobs, contributed
by the businesses included in the Census’ Survey of
Business Owners, there were 103 million people employed
in non-farm private sector jobs as of March 1997, 118.6
million in March 2007, and we estimate that there are now
123.9 million persons employed in the private sector as
of March 2013. This represents a 20% increase over
the entire 16-year period, including a 15% increase from
1997 to 2007 and a more modest 4% increase over the
last six years.10
Thus, according to our estimates, there are now 5.3
million more jobs in the private sector than there were in
2007. Where have these jobs come from?
Overwhelmingly, from publicly traded companies. Over
the past six years, the overall increase of 5.3 million
net new jobs is accounted for by a 5.9 million increase
in employment in large, publicly traded corporations,
combined with a 569,000 decline in employment among
smaller, privately held companies. The only bright spot in
recent years with respect to privately held company job
growth has been among women-owned firms. They have
added an estimated 175,000 jobs since 2007. Among
men-owned and equally owned firms, employment has
declined over the past six years.
5.3M5.9M
-569K 175K -635K -46K
Net
Em
plo
ymen
t Cha
nge,
20
07–
13
EMPLOYMENT GROWTH HAS COME FROM PUBLICLY TRADED CORPORATIONS... AND WOMEN-OWNED FIRMS
Tot
al E
st.
Job
Gro
wth
Pub
licly
Tra
ded
Firm
s
All
Pri
vate
ly H
eld
Firm
s
Wom
en-O
wne
dFi
rms
Men
-Ow
ned
Firm
s
Equ
ally
Ow
ned
Firm
s
American Express OPEN/Womenable estimates as of 2013, based on 1997–2007 data from US Census Bureau. NOTE: Estimated job growth in this chart is for private sector, non-farm employment only, so does not include such public sector jobs as government & universities.
So, indeed, while women-owned firms remain smaller
than their peers in terms of average employment and
revenues, they are not only showing higher percent
growth in numbers but also higher absolute growth in
terms of job creation.
for more detailed data on national trends, see Table 1 in
the Summary Tables section.
9 See bls.gov for more information. The “employed persons” data focuses on civilian employment, so it does not include the military, but it does include public sector employees such as government and university workers.
10 Note: this is a subset of total employed persons, as it excludes public sector employees as well as self-employed persons. firm employment as delineated in the Census generally counts employees other than the business owner.
9
THE STaTE of WomEn-oWnEd BuSinESSES, 2013
A Brief History of the Business Census: Data Improvements, Definitional Changes
As we move into an analysis of trends by state,
metropolitan area, industry, race and business
size, it is important to note why this report only
includes data from the three most recent business census
surveys, when the Census Bureau first provided sex-
disaggregated business counts in the 1977 census.
The reason lies in the progress made over time by the
Census Bureau in industry inclusion and in the changes
that have been made in how the gender of business
ownership is determined.
As summarized in Table 2 in the Summary Tables section,
there have been a variety of definitional changes that
have affected the number, share, and economic clout of
women-owned businesses. The first Census to include
an accounting of women-owned firms, in 1977, was
experimental and included only some industries. In fact,
only with the 1992 Survey of Women-Owned Business
Enterprises (SWOBE, now referred to as SBO: Survey
of Business Owners) census were all women-owned
firms—including C corporations—included in the count.
That census also marked the only time that publicly
traded women-owned firms were tabulated. The
difficulty of determining the gender of ownership of
publicly traded firms led to their being put into a
separate category thereafter.
The threshold of ownership has also changed over
time. Prior to 1997, firms with 50% or more ownership
by a woman or women were counted as women-owned.
Starting with the 1997 census, that threshold was raised
to 51% or more, to match government procurement
definitions. Thus, the separate equally owned category
was born.
While Table 1 in the Summary Tables section of this
report does offer an estimate of the number and
economic contributions of “women-owned and
equally owned firms,” this report will not focus on that
population—because the method for determining equal
ownership (which has, in our view, improved accuracy)
has differed in each of the past three censuses. In
1997, equal ownership was determined at the company
level through administrative records. Starting in 2002,
ownership was determined at the personal rather than at
the company level, by asking the gender of the top three
owners of the firm (virtually all firms have three or fewer
owners). This methodological improvement resulted in
a drop in the count of equally owned firms from 1997 to
2002. Then, in 2007, the gender of the top four owners
of the firm was used to determine gender status of
ownership, resulting in an increase in equally owned firms.
Therefore, while it may interest some to know the number
and size of women-owned and equally owned firms in
each of these census years—and in our 2013 estimates—
care should be taken not to ascribe changes over time in
the women-owned and equally owned firm population to
anything other than definitional differences.
It is also important to note that, due to changes in industry
definitions and metropolitan area boundaries after the
1997 SBO, the analysis of trends at the industry and
metropolitan area level can only go back as far as the
2002 census survey.
10
THE STaTE of WomEn-oWnEd BuSinESSES, 2013
State Trends
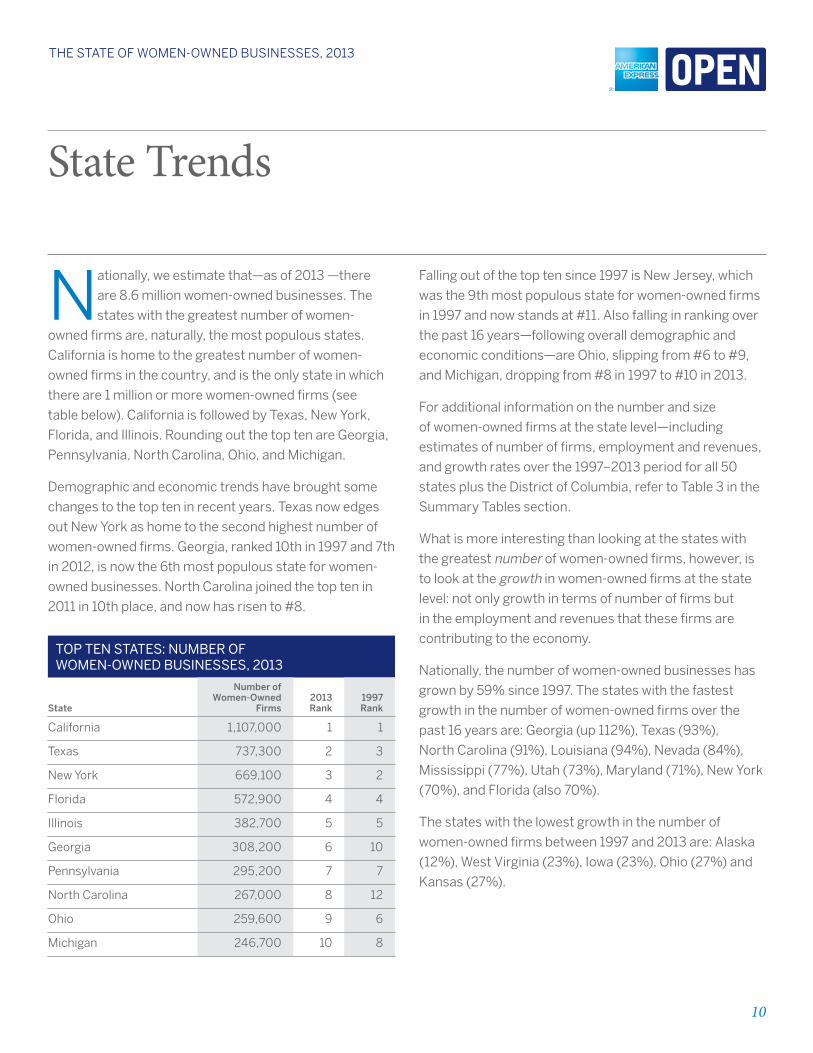
Nationally, we estimate that—as of 2013 —there
are 8.6 million women-owned businesses. The
states with the greatest number of women-
owned firms are, naturally, the most populous states.
California is home to the greatest number of women-
owned firms in the country, and is the only state in which
there are 1 million or more women-owned firms (see
table below). California is followed by Texas, New York,
florida, and Illinois. Rounding out the top ten are Georgia,
Pennsylvania, North Carolina, Ohio, and Michigan.
Demographic and economic trends have brought some
changes to the top ten in recent years. Texas now edges
out New York as home to the second highest number of
women-owned firms. Georgia, ranked 10th in 1997 and 7th
in 2012, is now the 6th most populous state for women-
owned businesses. North Carolina joined the top ten in
2011 in 10th place, and now has risen to #8.
Top Ten STaTeS: number of Women-oWned buSineSSeS, 2013
State
number of women-owned
firms2013 rank
1997 rank
California 1,107,000 1 1
Texas 737,300 2 3
New York 669,100 3 2
florida 572,900 4 4
Illinois 382,700 5 5
Georgia 308,200 6 10
Pennsylvania 295,200 7 7
North Carolina 267,000 8 12
Ohio 259,600 9 6
Michigan 246,700 10 8
falling out of the top ten since 1997 is New Jersey, which
was the 9th most populous state for women-owned firms
in 1997 and now stands at #11. Also falling in ranking over
the past 16 years—following overall demographic and
economic conditions—are Ohio, slipping from #6 to #9,
and Michigan, dropping from #8 in 1997 to #10 in 2013.
for additional information on the number and size
of women-owned firms at the state level—including
estimates of number of firms, employment and revenues,
and growth rates over the 1997–2013 period for all 50
states plus the District of Columbia, refer to Table 3 in the
Summary Tables section.
What is more interesting than looking at the states with
the greatest number of women-owned firms, however, is
to look at the growth in women-owned firms at the state
level: not only growth in terms of number of firms but
in the employment and revenues that these firms are
contributing to the economy.
Nationally, the number of women-owned businesses has
grown by 59% since 1997. The states with the fastest
growth in the number of women-owned firms over the
past 16 years are: Georgia (up 112%), Texas (93%),
North Carolina (91%), louisiana (94%), Nevada (84%),
Mississippi (77%), Utah (73%), Maryland (71%), New York
(70%), and florida (also 70%).
The states with the lowest growth in the number of
women-owned firms between 1997 and 2013 are: Alaska
(12%), West Virginia (23%), Iowa (23%), Ohio (27%) and
Kansas (27%).
11
THE STaTE of WomEn-oWnEd BuSinESSES, 2013
Top Ten STaTeS for Women-oWned firmS: a ranKinG of GroWTh in number & economic clouT
State number revenue employmentcombined rank,
2013 combined rank,
2012
District of Columbia 13 1 1 1 1
North Dakota 16 4 2 2 5
Nevada 5 9 9 3 1
Wyoming 20 3 6 4 1
Georgia 1 21 13 5 8
Arizona 21 12 3 6 4
Virginia 15 8 15 7 6
Maryland 8 20 10 7 7
Utah 7 5 29 9 11
Idaho 27 13 5 10 13
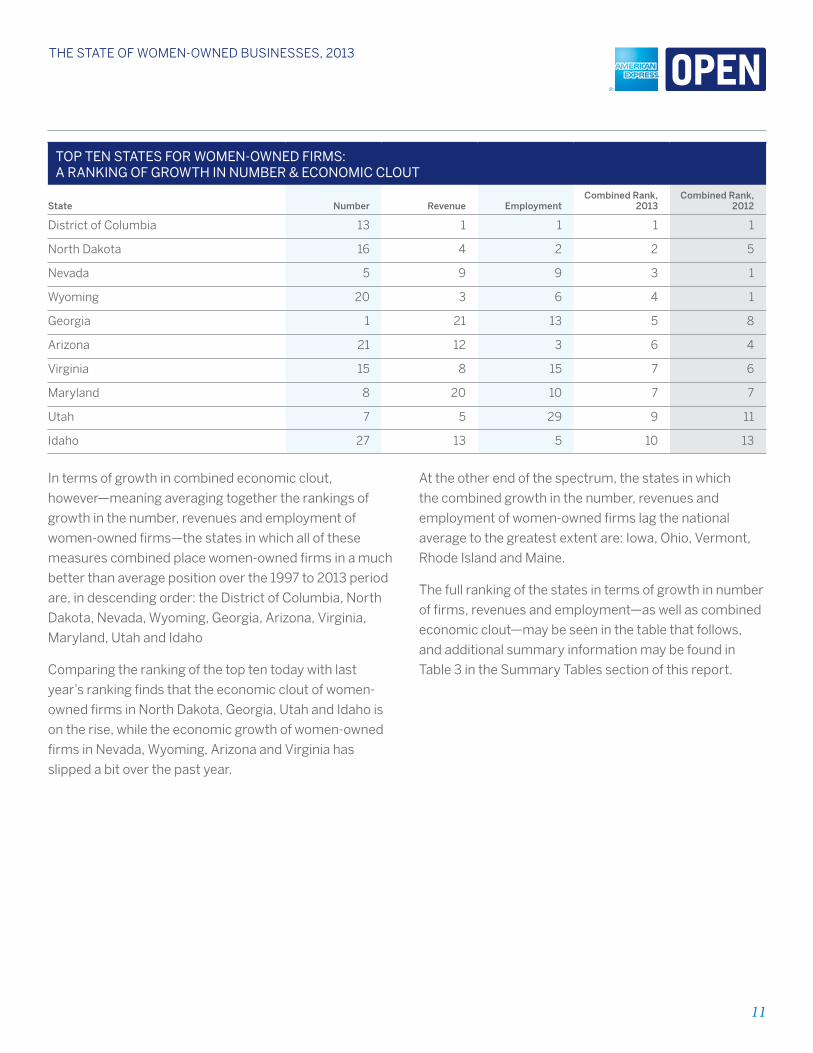
In terms of growth in combined economic clout,
however—meaning averaging together the rankings of
growth in the number, revenues and employment of
women-owned firms—the states in which all of these
measures combined place women-owned firms in a much
better than average position over the 1997 to 2013 period
are, in descending order: the District of Columbia, North
Dakota, Nevada, Wyoming, Georgia, Arizona, Virginia,
Maryland, Utah and Idaho
Comparing the ranking of the top ten today with last
year’s ranking finds that the economic clout of women-
owned firms in North Dakota, Georgia, Utah and Idaho is
on the rise, while the economic growth of women-owned
firms in Nevada, Wyoming, Arizona and Virginia has
slipped a bit over the past year.
At the other end of the spectrum, the states in which
the combined growth in the number, revenues and
employment of women-owned firms lag the national
average to the greatest extent are: Iowa, Ohio, Vermont,
Rhode Island and Maine.
The full ranking of the states in terms of growth in number
of firms, revenues and employment—as well as combined
economic clout—may be seen in the table that follows,
and additional summary information may be found in
Table 3 in the Summary Tables section of this report.
12
THE STaTE of WomEn-oWnEd BuSinESSES, 2013
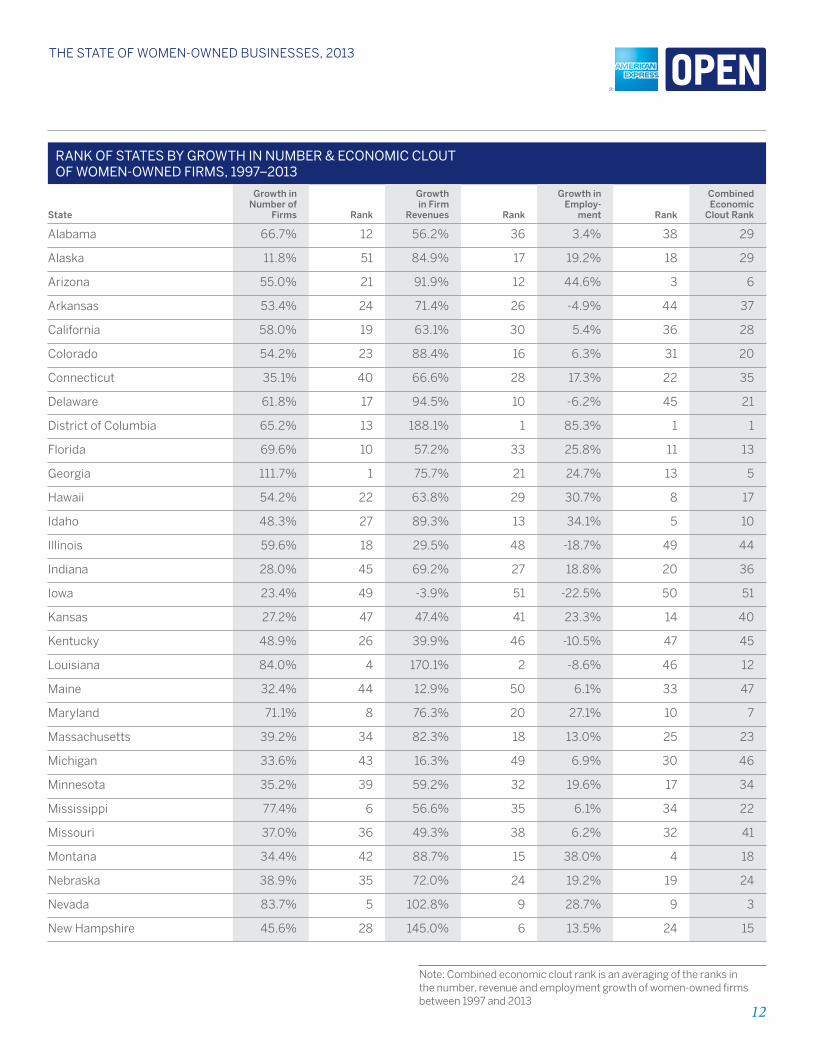
ranK of STaTeS by GroWTh in number & economic clouT of Women-oWned firmS, 1997–2013
State
Growth in number of
firms rank
Growth in firm
revenues rank
Growth in employ-
ment rank
combined economic
clout rank
Alabama 66.7% 12 56.2% 36 3.4% 38 29
Alaska 11.8% 51 84.9% 17 19.2% 18 29
Arizona 55.0% 21 91.9% 12 44.6% 3 6
Arkansas 53.4% 24 71.4% 26 -4.9% 44 37
California 58.0% 19 63.1% 30 5.4% 36 28
Colorado 54.2% 23 88.4% 16 6.3% 31 20
Connecticut 35.1% 40 66.6% 28 17.3% 22 35
Delaware 61.8% 17 94.5% 10 -6.2% 45 21
District of Columbia 65.2% 13 188.1% 1 85.3% 1 1
florida 69.6% 10 57.2% 33 25.8% 11 13
Georgia 111.7% 1 75.7% 21 24.7% 13 5
Hawaii 54.2% 22 63.8% 29 30.7% 8 17
Idaho 48.3% 27 89.3% 13 34.1% 5 10
Illinois 59.6% 18 29.5% 48 -18.7% 49 44
Indiana 28.0% 45 69.2% 27 18.8% 20 36
Iowa 23.4% 49 -3.9% 51 -22.5% 50 51
Kansas 27.2% 47 47.4% 41 23.3% 14 40
Kentucky 48.9% 26 39.9% 46 -10.5% 47 45
louisiana 84.0% 4 170.1% 2 -8.6% 46 12
Maine 32.4% 44 12.9% 50 6.1% 33 47
Maryland 71.1% 8 76.3% 20 27.1% 10 7
Massachusetts 39.2% 34 82.3% 18 13.0% 25 23
Michigan 33.6% 43 16.3% 49 6.9% 30 46
Minnesota 35.2% 39 59.2% 32 19.6% 17 34
Mississippi 77.4% 6 56.6% 35 6.1% 34 22
Missouri 37.0% 36 49.3% 38 6.2% 32 41
Montana 34.4% 42 88.7% 15 38.0% 4 18
Nebraska 38.9% 35 72.0% 24 19.2% 19 24
Nevada 83.7% 5 102.8% 9 28.7% 9 3
New Hampshire 45.6% 28 145.0% 6 13.5% 24 15
Note: Combined economic clout rank is an averaging of the ranks in the number, revenue and employment growth of women-owned firms between 1997 and 2013
13
THE STaTE of WomEn-oWnEd BuSinESSES, 2013
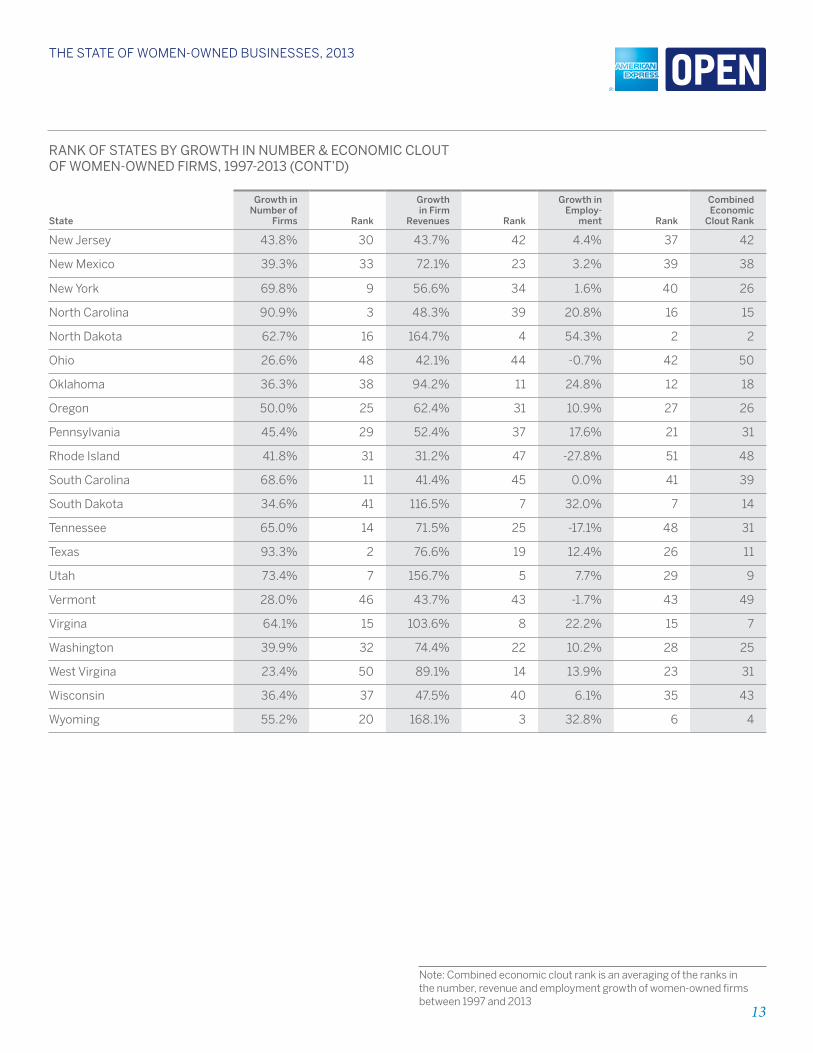
ranK of STaTeS by GroWTh in number & economic clouT of Women-oWned firmS, 1997-2013 (conT’d)
State
Growth in number of
firms rank
Growth in firm
revenues rank
Growth in employ-
ment rank
combined economic
clout rank
New Jersey 43.8% 30 43.7% 42 4.4% 37 42
New Mexico 39.3% 33 72.1% 23 3.2% 39 38
New York 69.8% 9 56.6% 34 1.6% 40 26
North Carolina 90.9% 3 48.3% 39 20.8% 16 15
North Dakota 62.7% 16 164.7% 4 54.3% 2 2
Ohio 26.6% 48 42.1% 44 -0.7% 42 50
Oklahoma 36.3% 38 94.2% 11 24.8% 12 18
Oregon 50.0% 25 62.4% 31 10.9% 27 26
Pennsylvania 45.4% 29 52.4% 37 17.6% 21 31
Rhode Island 41.8% 31 31.2% 47 -27.8% 51 48
South Carolina 68.6% 11 41.4% 45 0.0% 41 39
South Dakota 34.6% 41 116.5% 7 32.0% 7 14
Tennessee 65.0% 14 71.5% 25 -17.1% 48 31
Texas 93.3% 2 76.6% 19 12.4% 26 11
Utah 73.4% 7 156.7% 5 7.7% 29 9
Vermont 28.0% 46 43.7% 43 -1.7% 43 49
Virgina 64.1% 15 103.6% 8 22.2% 15 7
Washington 39.9% 32 74.4% 22 10.2% 28 25
West Virgina 23.4% 50 89.1% 14 13.9% 23 31
Wisconsin 36.4% 37 47.5% 40 6.1% 35 43
Wyoming 55.2% 20 168.1% 3 32.8% 6 4
Note: Combined economic clout rank is an averaging of the ranks in the number, revenue and employment growth of women-owned firms between 1997 and 2013
14
THE STaTE of WomEn-oWnEd BuSinESSES, 2013
Metropolitan Area Trends
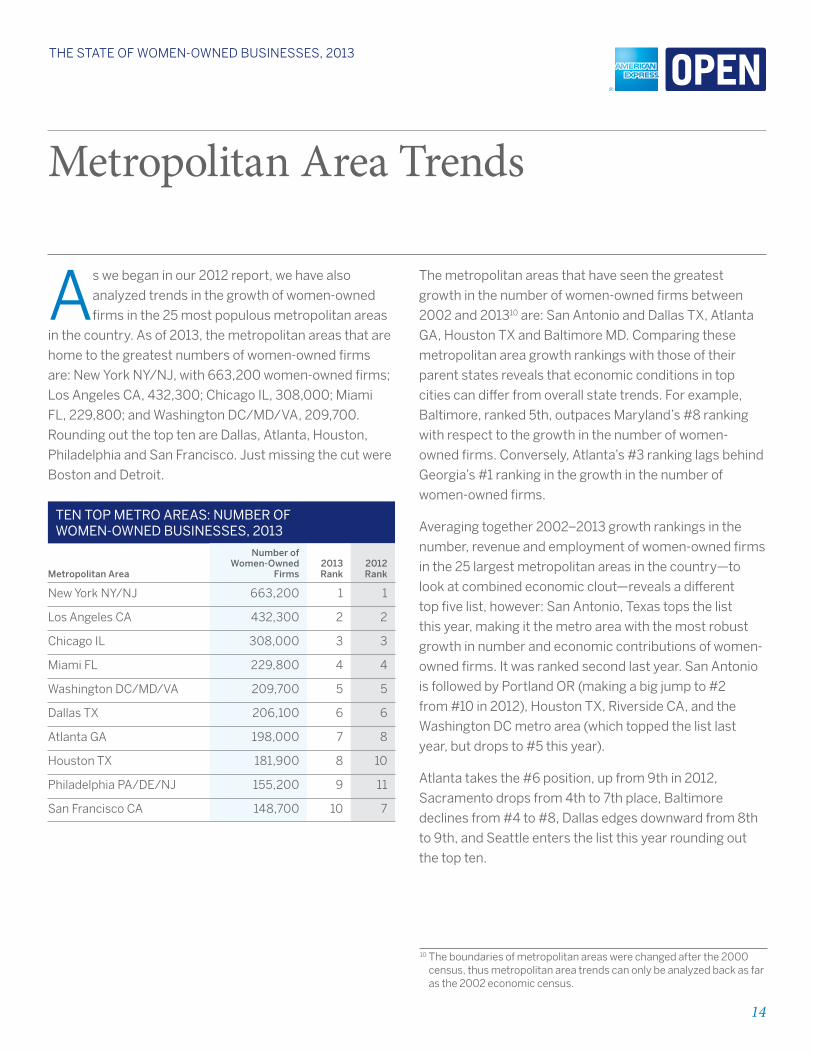
As we began in our 2012 report, we have also
analyzed trends in the growth of women-owned
firms in the 25 most populous metropolitan areas
in the country. As of 2013, the metropolitan areas that are
home to the greatest numbers of women-owned firms
are: New York NY/NJ, with 663,200 women-owned firms;
los Angeles CA, 432,300; Chicago Il, 308,000; Miami
fl, 229,800; and Washington DC/MD/VA, 209,700.
Rounding out the top ten are Dallas, Atlanta, Houston,
Philadelphia and San francisco. Just missing the cut were
Boston and Detroit.
The metropolitan areas that have seen the greatest
growth in the number of women-owned firms between
2002 and 201310 are: San Antonio and Dallas TX, Atlanta
GA, Houston TX and Baltimore MD. Comparing these
metropolitan area growth rankings with those of their
parent states reveals that economic conditions in top
cities can differ from overall state trends. for example,
Baltimore, ranked 5th, outpaces Maryland’s #8 ranking
with respect to the growth in the number of women-
owned firms. Conversely, Atlanta’s #3 ranking lags behind
Georgia’s #1 ranking in the growth in the number of
women-owned firms.
Averaging together 2002–2013 growth rankings in the
number, revenue and employment of women-owned firms
in the 25 largest metropolitan areas in the country—to
look at combined economic clout—reveals a different
top five list, however: San Antonio, Texas tops the list
this year, making it the metro area with the most robust
growth in number and economic contributions of women-
owned firms. It was ranked second last year. San Antonio
is followed by Portland OR (making a big jump to #2
from #10 in 2012), Houston TX, Riverside CA, and the
Washington DC metro area (which topped the list last
year, but drops to #5 this year).
Atlanta takes the #6 position, up from 9th in 2012,
Sacramento drops from 4th to 7th place, Baltimore
declines from #4 to #8, Dallas edges downward from 8th
to 9th, and Seattle enters the list this year rounding out
the top ten.
Ten Top meTro areaS: number of Women-oWned buSineSSeS, 2013
Metropolitan Area
number of women-owned
firms2013 rank
2012 rank
New York NY/NJ 663,200 1 1
los Angeles CA 432,300 2 2
Chicago Il 308,000 3 3
Miami fl 229,800 4 4
Washington DC/MD/VA 209,700 5 5
Dallas TX 206,100 6 6
Atlanta GA 198,000 7 8
Houston TX 181,900 8 10
Philadelphia PA/DE/NJ 155,200 9 11
San francisco CA 148,700 10 7
10 The boundaries of metropolitan areas were changed after the 2000 census, thus metropolitan area trends can only be analyzed back as far as the 2002 economic census.
15
THE STaTE of WomEn-oWnEd BuSinESSES, 2013
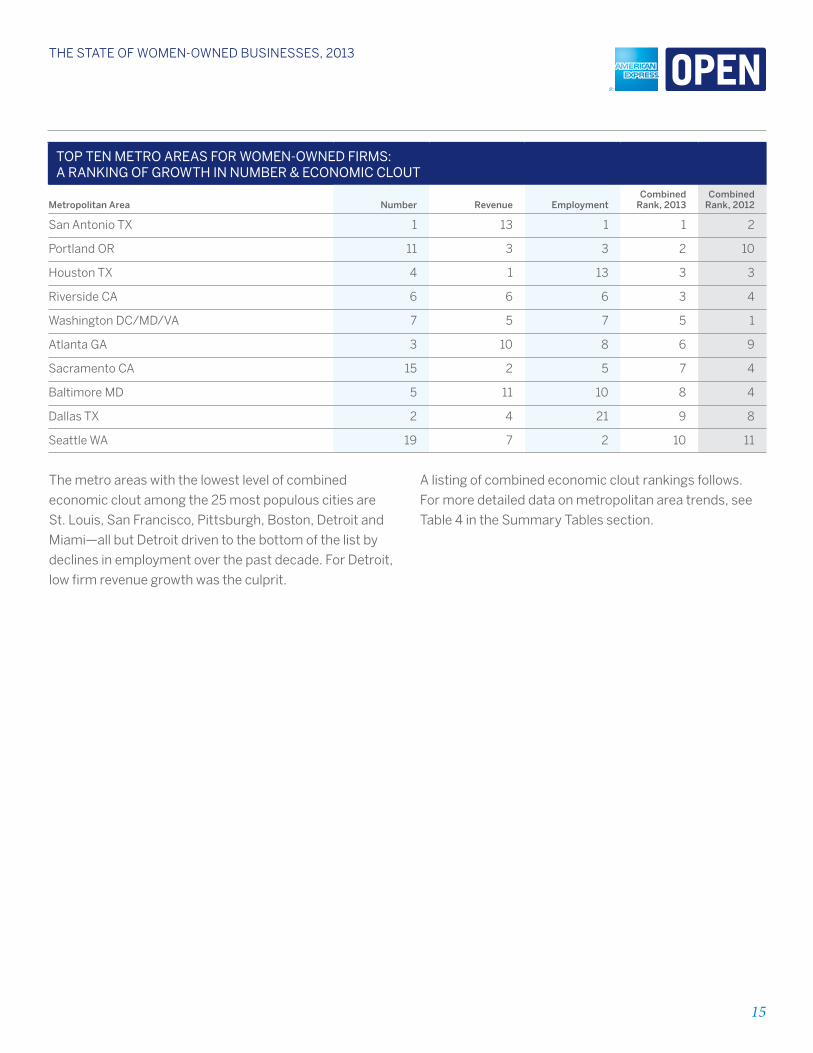
Top Ten meTro areaS for Women-oWned firmS: a ranKinG of GroWTh in number & economic clouT
Metropolitan Area number revenue employmentcombined
rank, 2013combined
rank, 2012
San Antonio TX 1 13 1 1 2
Portland OR 11 3 3 2 10
Houston TX 4 1 13 3 3
Riverside CA 6 6 6 3 4
Washington DC/MD/VA 7 5 7 5 1
Atlanta GA 3 10 8 6 9
Sacramento CA 15 2 5 7 4
Baltimore MD 5 11 10 8 4
Dallas TX 2 4 21 9 8
Seattle WA 19 7 2 10 11
The metro areas with the lowest level of combined
economic clout among the 25 most populous cities are
St. louis, San francisco, Pittsburgh, Boston, Detroit and
Miami—all but Detroit driven to the bottom of the list by
declines in employment over the past decade. for Detroit,
low firm revenue growth was the culprit.
A listing of combined economic clout rankings follows.
for more detailed data on metropolitan area trends, see
Table 4 in the Summary Tables section.
16
THE STaTE of WomEn-oWnEd BuSinESSES, 2013
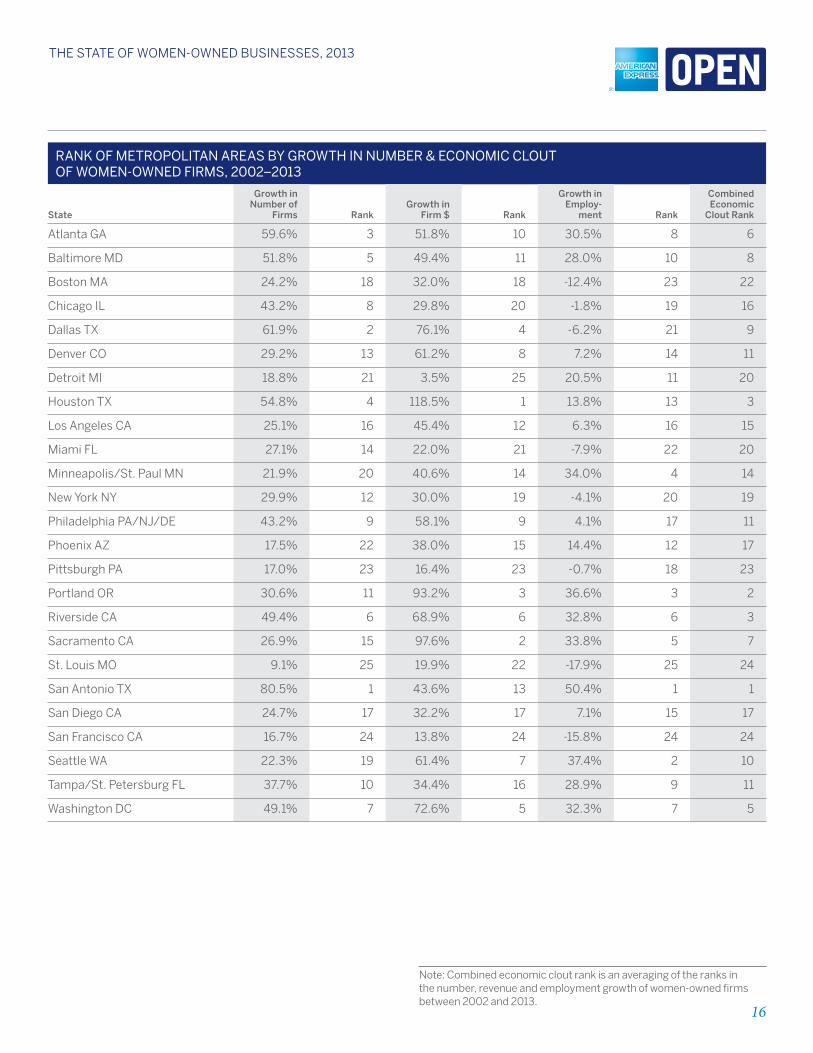
ranK of meTropoliTan areaS by GroWTh in number & economic clouT of Women-oWned firmS, 2002–2013
State
Growth in number of
firms rank Growth in
firm $ rank
Growth in employ-
ment rank
combined economic
clout rank
Atlanta GA 59.6% 3 51.8% 10 30.5% 8 6
Baltimore MD 51.8% 5 49.4% 11 28.0% 10 8
Boston MA 24.2% 18 32.0% 18 -12.4% 23 22
Chicago Il 43.2% 8 29.8% 20 -1.8% 19 16
Dallas TX 61.9% 2 76.1% 4 -6.2% 21 9
Denver CO 29.2% 13 61.2% 8 7.2% 14 11
Detroit MI 18.8% 21 3.5% 25 20.5% 11 20
Houston TX 54.8% 4 118.5% 1 13.8% 13 3
los Angeles CA 25.1% 16 45.4% 12 6.3% 16 15
Miami fl 27.1% 14 22.0% 21 -7.9% 22 20
Minneapolis/St. Paul MN 21.9% 20 40.6% 14 34.0% 4 14
New York NY 29.9% 12 30.0% 19 -4.1% 20 19
Philadelphia PA/NJ/DE 43.2% 9 58.1% 9 4.1% 17 11
Phoenix AZ 17.5% 22 38.0% 15 14.4% 12 17
Pittsburgh PA 17.0% 23 16.4% 23 -0.7% 18 23
Portland OR 30.6% 11 93.2% 3 36.6% 3 2
Riverside CA 49.4% 6 68.9% 6 32.8% 6 3
Sacramento CA 26.9% 15 97.6% 2 33.8% 5 7
St. louis MO 9.1% 25 19.9% 22 -17.9% 25 24
San Antonio TX 80.5% 1 43.6% 13 50.4% 1 1
San Diego CA 24.7% 17 32.2% 17 7.1% 15 17
San francisco CA 16.7% 24 13.8% 24 -15.8% 24 24
Seattle WA 22.3% 19 61.4% 7 37.4% 2 10
Tampa/St. Petersburg fl 37.7% 10 34.4% 16 28.9% 9 11
Washington DC 49.1% 7 72.6% 5 32.3% 7 5
Note: Combined economic clout rank is an averaging of the ranks in the number, revenue and employment growth of women-owned firms between 2002 and 2013.
17
THE STaTE of WomEn-oWnEd BuSinESSES, 2013
Industry Trends
Women-owned firms are starting and growing
businesses in all industries, diversifying
into sectors previously described as “non-
traditional” for women. While our analysis within industry
sectors can go back only to the 2002 census due to
changes in industry classification,12 we can see that
there is an evening-out in the concentration of women-
owned firms. While there are still below average shares of
women-owned firms in construction (7%), transportation
and warehousing (11%) and finance and insurance (20%),
in most other industries women-owned firms are close
to or exceeding their overall 29% share of the business
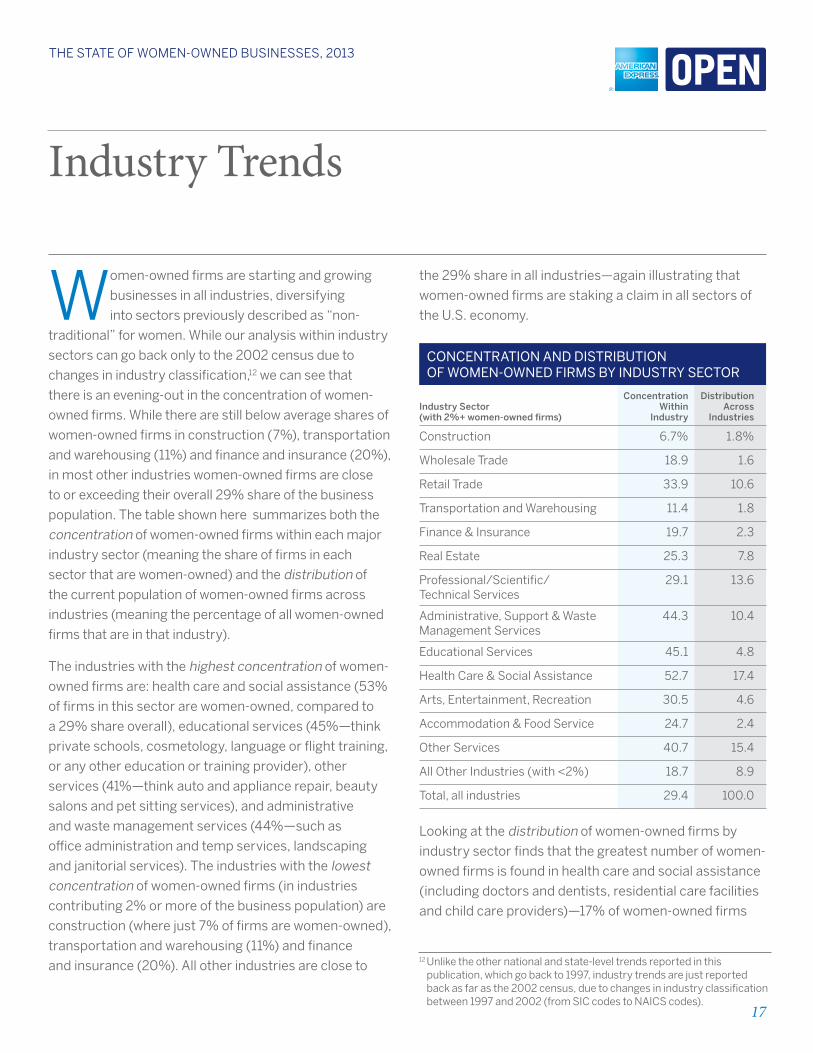
population. The table shown here summarizes both the
concentration of women-owned firms within each major
industry sector (meaning the share of firms in each
sector that are women-owned) and the distribution of
the current population of women-owned firms across
industries (meaning the percentage of all women-owned
firms that are in that industry).
The industries with the highest concentration of women-
owned firms are: health care and social assistance (53%
of firms in this sector are women-owned, compared to
a 29% share overall), educational services (45%—think
private schools, cosmetology, language or flight training,
or any other education or training provider), other
services (41%—think auto and appliance repair, beauty
salons and pet sitting services), and administrative
and waste management services (44%—such as
office administration and temp services, landscaping
and janitorial services). The industries with the lowest
concentration of women-owned firms (in industries
contributing 2% or more of the business population) are
construction (where just 7% of firms are women-owned),
transportation and warehousing (11%) and finance
and insurance (20%). All other industries are close to
the 29% share in all industries—again illustrating that
women-owned firms are staking a claim in all sectors of
the U.S. economy.
concenTraTion and diSTribuTion of Women-oWned firmS by induSTry SecTor
Industry Sector (with 2%+ women-owned firms)
concentration within
Industry
distribution Across
Industries
Construction 6.7% 1.8%
Wholesale Trade 18.9 1.6
Retail Trade 33.9 10.6
Transportation and Warehousing 11.4 1.8
finance & Insurance 19.7 2.3
Real Estate 25.3 7.8
Professional/Scientific/ Technical Services
29.1 13.6
Administrative, Support & Waste Management Services
44.3 10.4
Educational Services 45.1 4.8
Health Care & Social Assistance 52.7 17.4
Arts, Entertainment, Recreation 30.5 4.6
Accommodation & food Service 24.7 2.4
Other Services 40.7 15.4
All Other Industries (with <2%) 18.7 8.9
Total, all industries 29.4 100.0
looking at the distribution of women-owned firms by
industry sector finds that the greatest number of women-
owned firms is found in health care and social assistance
(including doctors and dentists, residential care facilities
and child care providers)—17% of women-owned firms
12 Unlike the other national and state-level trends reported in this publication, which go back to 1997, industry trends are just reported back as far as the 2002 census, due to changes in industry classification between 1997 and 2002 (from SIC codes to NAICS codes).
18
THE STaTE of WomEn-oWnEd BuSinESSES, 2013
own health care or social services-related businesses.
Other top sectors for women-owned firms include
other services, with 15% of women-owned firms in that
grouping; professional/scientific/technical services
(including attorneys, accountants, public relations
and human resources/organizational development
consulting) 14%; retail trade, 11%; and administrative,
support and waste management services, 10%.
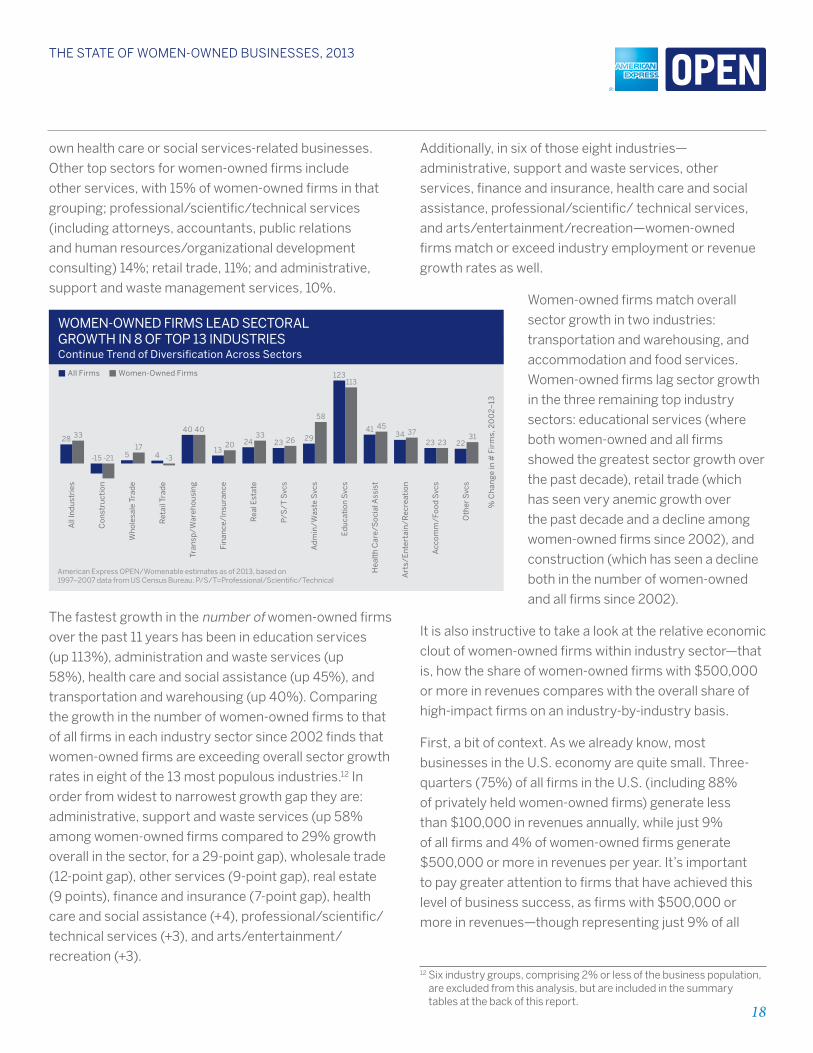
WOMEN-OWNED FIRMS LEAD SECTORAL GROWTH IN 8 OF TOP 13 INDUSTRIES �
% C
han
ge
in #
Fir
ms,
20
02–
13
American Express OPEN/Womenable estimates as of 2013, based on 1997–2007 data from US Census Bureau. P/S/T=Professional/Scientific/Technical
Continue Trend of Diversification Across Sectors
All Firms Women-Owned Firms
All
Ind
ust
ries
Co
nst
ruct
ion
Wh
ole
sale
Tra
de
Ret
ail T
rad
e
Tran
sp/
War
eho
usi
ng
Fin
ance
/In
sura
nce
Rea
l Est
ate
P/S
/T
Svc
s
Ad
min
/W
aste
Svc
s
Ed
uca
tio
n S
vcs
Hea
lth
Car
e/S
oci
al A
ssis
t
Art
s/E
nte
rtai
n/R
ecre
atio
n
Acc
om
m/F
oo
d S
vcs
Oth
er S
vcs
3328
-21-15
174 -35
4040
2013
3324 2623
58
29
11328
4541
123
232331
22
3734
The fastest growth in the number of women-owned firms
over the past 11 years has been in education services
(up 113%), administration and waste services (up
58%), health care and social assistance (up 45%), and
transportation and warehousing (up 40%). Comparing
the growth in the number of women-owned firms to that
of all firms in each industry sector since 2002 finds that
women-owned firms are exceeding overall sector growth
rates in eight of the 13 most populous industries.12 In
order from widest to narrowest growth gap they are:
administrative, support and waste services (up 58%
among women-owned firms compared to 29% growth
overall in the sector, for a 29-point gap), wholesale trade
(12-point gap), other services (9-point gap), real estate
(9 points), finance and insurance (7-point gap), health
care and social assistance (+4), professional/scientific/
technical services (+3), and arts/entertainment/
recreation (+3). 12 Six industry groups, comprising 2% or less of the business population,
are excluded from this analysis, but are included in the summary tables at the back of this report.
Additionally, in six of those eight industries—
administrative, support and waste services, other
services, finance and insurance, health care and social
assistance, professional/scientific/ technical services,
and arts/entertainment/recreation—women-owned
firms match or exceed industry employment or revenue
growth rates as well.
Women-owned firms match overall
sector growth in two industries:
transportation and warehousing, and
accommodation and food services.
Women-owned firms lag sector growth
in the three remaining top industry
sectors: educational services (where
both women-owned and all firms
showed the greatest sector growth over
the past decade), retail trade (which
has seen very anemic growth over
the past decade and a decline among
women-owned firms since 2002), and
construction (which has seen a decline
both in the number of women-owned
and all firms since 2002).
It is also instructive to take a look at the relative economic
clout of women-owned firms within industry sector—that
is, how the share of women-owned firms with $500,000
or more in revenues compares with the overall share of
high-impact firms on an industry-by-industry basis.
first, a bit of context. As we already know, most
businesses in the U.S. economy are quite small. Three-
quarters (75%) of all firms in the U.S. (including 88%
of privately held women-owned firms) generate less
than $100,000 in revenues annually, while just 9%
of all firms and 4% of women-owned firms generate
$500,000 or more in revenues per year. It’s important
to pay greater attention to firms that have achieved this
level of business success, as firms with $500,000 or
more in revenues—though representing just 9% of all
19
THE STaTE of WomEn-oWnEd BuSinESSES, 2013
businesses—contribute fully 91% of all private sector
employment and 96% of all business revenue in the
U.S. economy.
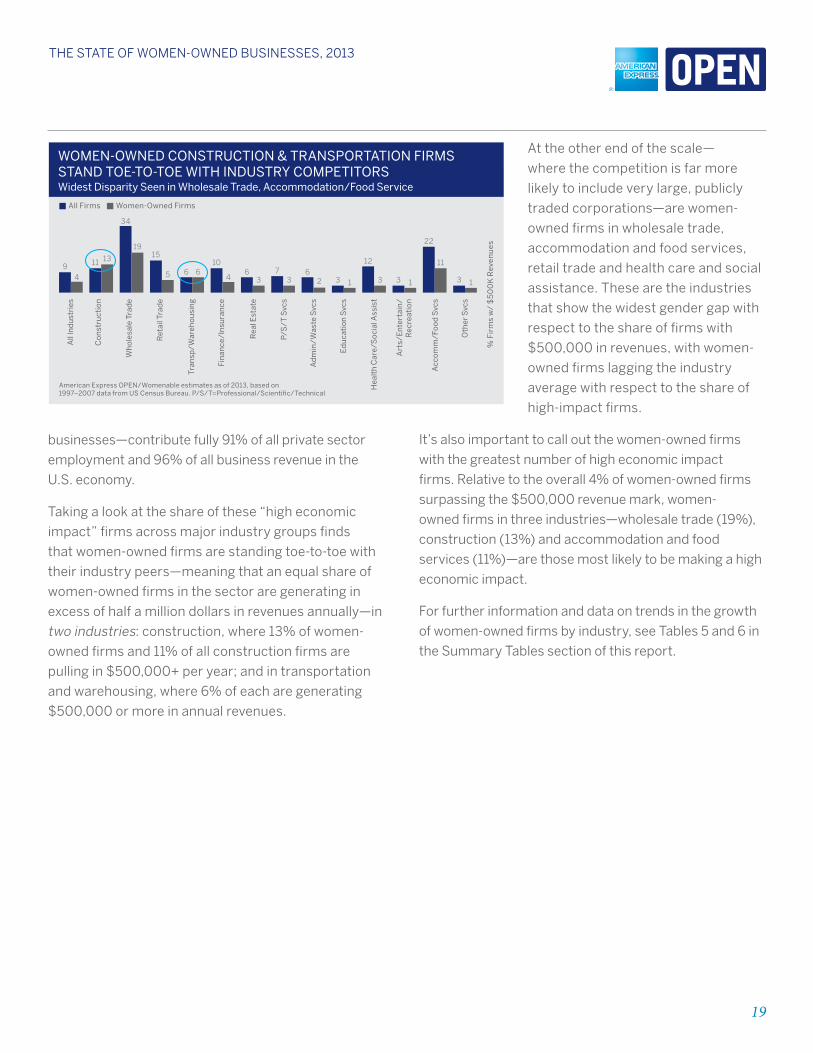
Taking a look at the share of these “high economic
impact” firms across major industry groups finds
that women-owned firms are standing toe-to-toe with
their industry peers—meaning that an equal share of
women-owned firms in the sector are generating in
excess of half a million dollars in revenues annually—in
two industries: construction, where 13% of women-
owned firms and 11% of all construction firms are
pulling in $500,000+ per year; and in transportation
and warehousing, where 6% of each are generating
$500,000 or more in annual revenues.
At the other end of the scale—
where the competition is far more
likely to include very large, publicly
traded corporations—are women-
owned firms in wholesale trade,
accommodation and food services,
retail trade and health care and social
assistance. These are the industries
that show the widest gender gap with
respect to the share of firms with
$500,000 in revenues, with women-
owned firms lagging the industry
average with respect to the share of
high-impact firms.
It’s also important to call out the women-owned firms
with the greatest number of high economic impact
firms. Relative to the overall 4% of women-owned firms
surpassing the $500,000 revenue mark, women-
owned firms in three industries—wholesale trade (19%),
construction (13%) and accommodation and food
services (11%)—are those most likely to be making a high
economic impact.
for further information and data on trends in the growth
of women-owned firms by industry, see Tables 5 and 6 in
the Summary Tables section of this report.
WOMEN-OWNED CONSTRUCTION & TRANSPORTATION FIRMS STAND TOE-TO-TOE WITH INDUSTRY COMPETITORS
% F
irm
s w
/ $
50
0K
Rev
enu
es
American Express OPEN/Womenable estimates as of 2013, based on 1997–2007 data from US Census Bureau. P/S/T=Professional/Scientific/Technical
Widest Disparity Seen in Wholesale Trade, Accommodation/Food Service
All Firms
Ret
ail T
rad
e
Art
s/E
nte
rtai
n/
Rec
reat
ion
Wh
ole
sale
Tra
de
Co
nst
ruct
ion
All
Ind
ust
ries
Tran
sp/
War
eho
usi
ng
Fin
ance
/In
sura
nce
Rea
l Est
ate
P/S
/T
Svc
s
Ed
uca
tio
n S
vcs
Hea
lth
Car
e/S
oci
al A
ssis
t
Acc
om
m/F
oo
d S
vcs
Oth
er S
vcs
Women-Owned Firms
Ad
min
/W
aste
Svc
s
94
11 13
34
1915
5 6 610
46
37
36
2 3 1
12
3 3 1
22
11
3 1
20
THE STaTE of WomEn-oWnEd BuSinESSES, 2013
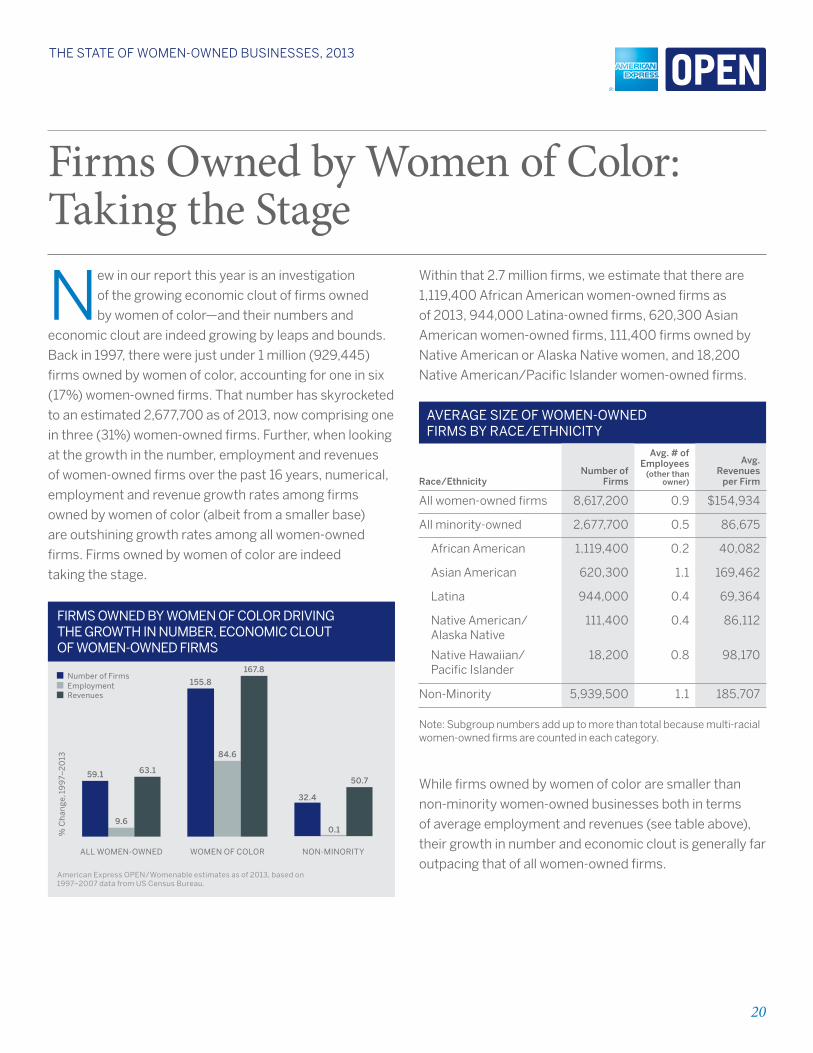
Firms Owned by Women of Color: Taking the Stage
New in our report this year is an investigation
of the growing economic clout of firms owned
by women of color—and their numbers and
economic clout are indeed growing by leaps and bounds.
Back in 1997, there were just under 1 million (929,445)
firms owned by women of color, accounting for one in six
(17%) women-owned firms. That number has skyrocketed
to an estimated 2,677,700 as of 2013, now comprising one
in three (31%) women-owned firms. further, when looking
at the growth in the number, employment and revenues
of women-owned firms over the past 16 years, numerical,
employment and revenue growth rates among firms
owned by women of color (albeit from a smaller base)
are outshining growth rates among all women-owned
firms. firms owned by women of color are indeed
taking the stage.
FIRMS OWNED BY WOMEN OF COLOR DRIVING THE GROWTH IN NUMBER, ECONOMIC CLOUT OF WOMEN-OWNED FIRMS
59.1 63.1
9.6
155.8
167.8
84.6
ALL WOMEN-OWNED WOMEN OF COLOR NON-MINORITY
American Express OPEN/Womenable estimates as of 2013, based on 1997–2007 data from US Census Bureau.
Number of Firms
% C
han
ge,
19
97–
20
13
EmploymentRevenues
32.4
50.7
0.1
Within that 2.7 million firms, we estimate that there are
1,119,400 African American women-owned firms as
of 2013, 944,000 latina-owned firms, 620,300 Asian
American women-owned firms, 111,400 firms owned by
Native American or Alaska Native women, and 18,200
Native American/Pacific Islander women-owned firms.
averaGe Size of Women-oWned firmS by race/eThniciTy
race/ethnicitynumber of
firms
Avg. # of employees
(other than owner)
Avg. revenues per firm
All women-owned firms 8,617,200 0.9 $154,934
All minority-owned 2,677,700 0.5 86,675
African American 1,119,400 0.2 40,082
Asian American 620,300 1.1 169,462
latina 944,000 0.4 69,364
Native American/ Alaska Native
111,400 0.4 86,112
Native Hawaiian/ Pacific Islander
18,200 0.8 98,170
Non-Minority 5,939,500 1.1 185,707
Note: Subgroup numbers add up to more than total because multi-racial women-owned firms are counted in each category.
While firms owned by women of color are smaller than
non-minority women-owned businesses both in terms
of average employment and revenues (see table above),
their growth in number and economic clout is generally far
outpacing that of all women-owned firms.
21
THE STaTE of WomEn-oWnEd BuSinESSES, 2013
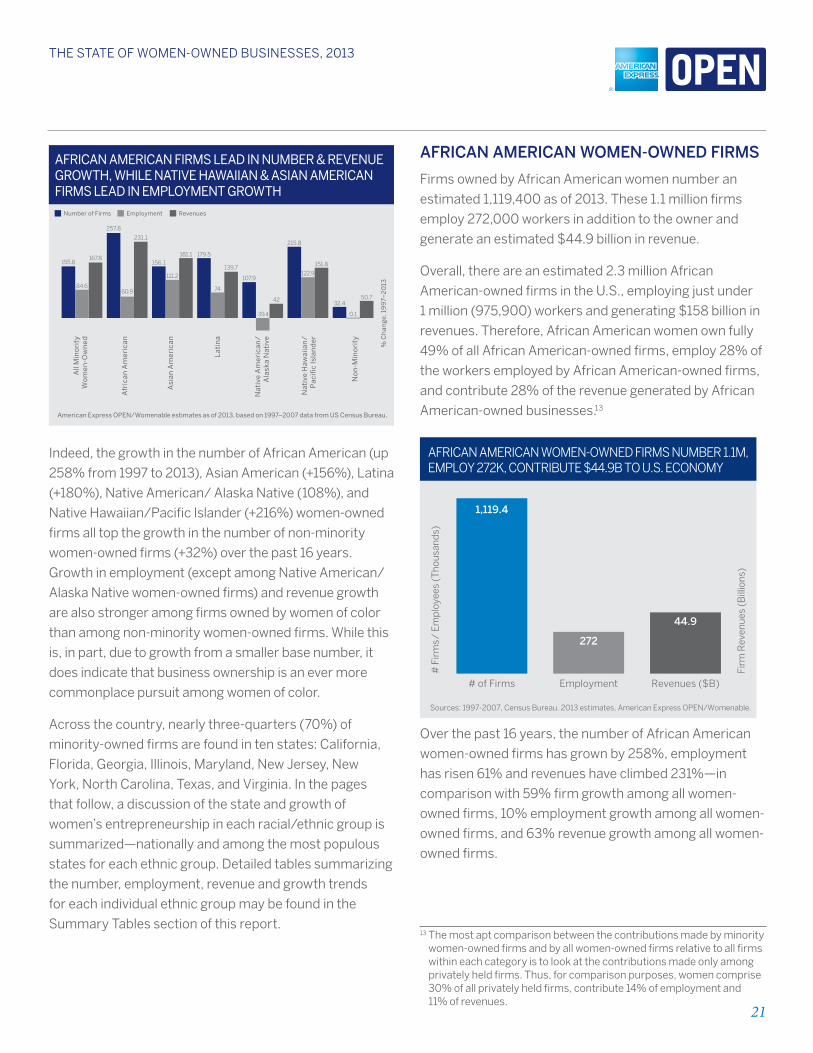
AFRICAN AMERICAN FIRMS LEAD IN NUMBER & REVENUEGROWTH, WHILE NATIVE HAWAIIAN & ASIAN AMERICAN FIRMS LEAD IN EMPLOYMENT GROWTH
% C
han
ge,
19
97–
20
13
American Express OPEN/Womenable estimates as of 2013, based on 1997–2007 data from US Census Bureau.
Number of Firms Employment Revenues
No
n-M
ino
rity
84.6
167.8
257.8
231.1
156.1181.1 179.5
74
139.7
107.9
-39.4
42
215.8
122.9
151.8
32.4
0.1
50.7
111.2
60.9
155.8
All
Min
ori
tyW
om
en-O
wn
ed
Lat
ina
Asi
an A
mer
ican
Afr
ican
Am
eric
an
Nat
ive
Haw
aiia
n/
Pac
ific
Isla
nd
er
Nat
ive
Am
eric
an/
Ala
ska
Nat
ive
Indeed, the growth in the number of African American (up
258% from 1997 to 2013), Asian American (+156%), latina
(+180%), Native American/ Alaska Native (108%), and
Native Hawaiian/Pacific Islander (+216%) women-owned
firms all top the growth in the number of non-minority
women-owned firms (+32%) over the past 16 years.
Growth in employment (except among Native American/
Alaska Native women-owned firms) and revenue growth
are also stronger among firms owned by women of color
than among non-minority women-owned firms. While this
is, in part, due to growth from a smaller base number, it
does indicate that business ownership is an ever more
commonplace pursuit among women of color.
Across the country, nearly three-quarters (70%) of
minority-owned firms are found in ten states: California,
florida, Georgia, Illinois, Maryland, New Jersey, New
York, North Carolina, Texas, and Virginia. In the pages
that follow, a discussion of the state and growth of
women’s entrepreneurship in each racial/ethnic group is
summarized—nationally and among the most populous
states for each ethnic group. Detailed tables summarizing
the number, employment, revenue and growth trends
for each individual ethnic group may be found in the
Summary Tables section of this report.
AfrIcAn AMerIcAn woMen-owned fIrMS
firms owned by African American women number an
estimated 1,119,400 as of 2013. These 1.1 million firms
employ 272,000 workers in addition to the owner and
generate an estimated $44.9 billion in revenue.
Overall, there are an estimated 2.3 million African
American-owned firms in the U.S., employing just under
1 million (975,900) workers and generating $158 billion in
revenues. Therefore, African American women own fully
49% of all African American-owned firms, employ 28% of
the workers employed by African American-owned firms,
and contribute 28% of the revenue generated by African
American-owned businesses.13
Firm
Rev
enue
s (B
illio
ns)
# F
irm
s/ E
mp
loye
es (
Tho
usan
ds)
AFRICAN AMERICAN WOMEN-OWNED FIRMS NUMBER 1.1M, EMPLOY 272K, CONTRIBUTE $44.9B TO U.S. ECONOMY
1,119.4
# of Firms
272
Employment
44.9
Revenues ($B)
Sources: 1997-2007, Census Bureau. 2013 estimates, American Express OPEN/Womenable.
Over the past 16 years, the number of African American
women-owned firms has grown by 258%, employment
has risen 61% and revenues have climbed 231%—in
comparison with 59% firm growth among all women-
owned firms, 10% employment growth among all women-
owned firms, and 63% revenue growth among all women-
owned firms.
13 The most apt comparison between the contributions made by minority women-owned firms and by all women-owned firms relative to all firms within each category is to look at the contributions made only among privately held firms. Thus, for comparison purposes, women comprise 30% of all privately held firms, contribute 14% of employment and 11% of revenues.
22
THE STaTE of WomEn-oWnEd BuSinESSES, 2013
Nearly two-thirds (65%) of African American women-
owned firms are found in ten states. The greatest
numbers of African American women-owned firms are
located in New York (122,600), followed by Georgia
(104,300) and Texas (94,800). While African American
women comprise 13% of all women-owned firms
nationally, African American women comprise the
greatest share of all women-owned firms in Georgia
(34%), Maryland (31%), and Illinois (21%).
Nationally, as previously stated, the number of African
American women-owned firms has climbed 258% since
1997, while employment is up 61% and revenues have
risen by 231%. Among the 10 most populous states
for minority-owned firms, the states seeing the fastest
growth in the number of African American women-owned
firms are Georgia (up 408%), Texas (up 357%), and Illinois
(up 307%). In North Carolina, while the number of African
American women-owned firms has increased by 265%
over the past 16 years, employment has risen by 358%
and revenues are up 406%, making African American
women-owned firms in the Tar Heel State among the
most economically robust in the U.S.
for further information and data on trends in the growth
of African American women-owned firms, see Table 9 in
the Summary Tables at the back of the report.
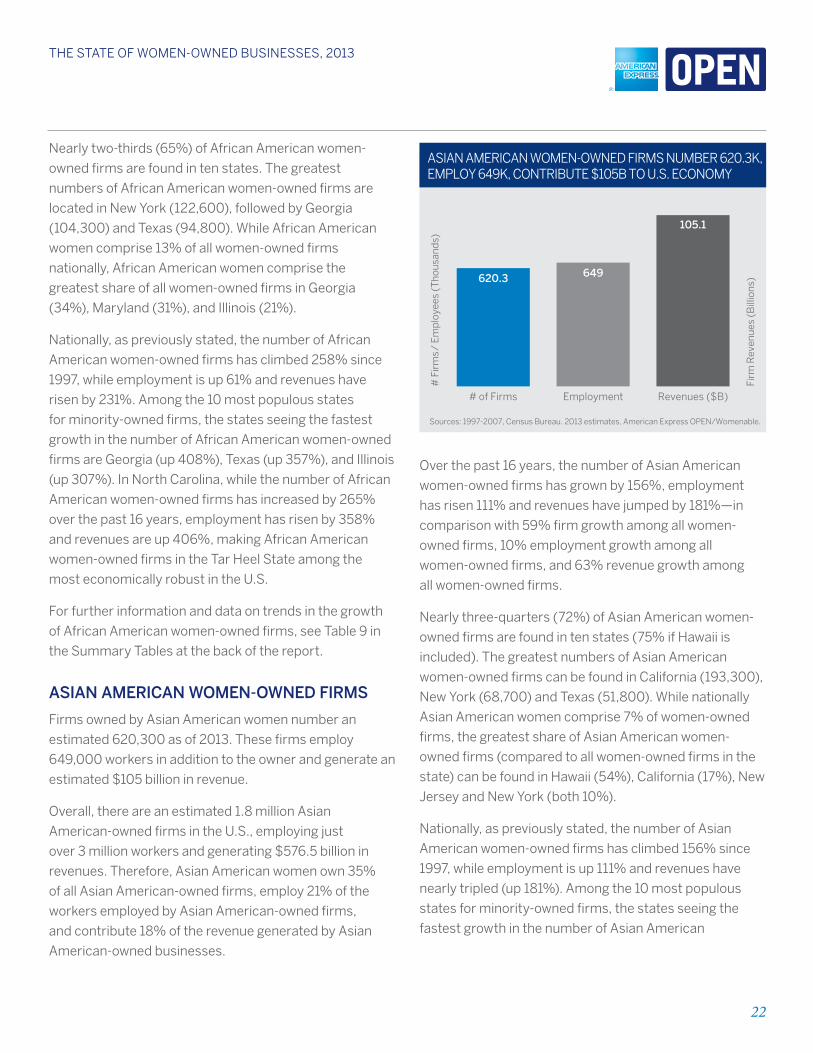
ASIAn AMerIcAn woMen-owned fIrMS
firms owned by Asian American women number an
estimated 620,300 as of 2013. These firms employ
649,000 workers in addition to the owner and generate an
estimated $105 billion in revenue.
Overall, there are an estimated 1.8 million Asian
American-owned firms in the U.S., employing just
over 3 million workers and generating $576.5 billion in
revenues. Therefore, Asian American women own 35%
of all Asian American-owned firms, employ 21% of the
workers employed by Asian American-owned firms,
and contribute 18% of the revenue generated by Asian
American-owned businesses.
Firm
Rev
enue
s (B
illio
ns)
# F
irm
s/ E
mp
loye
es (
Tho
usan
ds)
ASIAN AMERICAN WOMEN-OWNED FIRMS NUMBER 620.3K, EMPLOY 649K, CONTRIBUTE $105B TO U.S. ECONOMY
620.3
# of Firms
649
Employment
105.1
Revenues ($B)
Sources: 1997-2007, Census Bureau. 2013 estimates, American Express OPEN/Womenable.
Over the past 16 years, the number of Asian American
women-owned firms has grown by 156%, employment
has risen 111% and revenues have jumped by 181%—in
comparison with 59% firm growth among all women-
owned firms, 10% employment growth among all
women-owned firms, and 63% revenue growth among
all women-owned firms.
Nearly three-quarters (72%) of Asian American women-
owned firms are found in ten states (75% if Hawaii is
included). The greatest numbers of Asian American
women-owned firms can be found in California (193,300),
New York (68,700) and Texas (51,800). While nationally
Asian American women comprise 7% of women-owned
firms, the greatest share of Asian American women-
owned firms (compared to all women-owned firms in the
state) can be found in Hawaii (54%), California (17%), New
Jersey and New York (both 10%).
Nationally, as previously stated, the number of Asian
American women-owned firms has climbed 156% since
1997, while employment is up 111% and revenues have
nearly tripled (up 181%). Among the 10 most populous
states for minority-owned firms, the states seeing the
fastest growth in the number of Asian American
23
THE STaTE of WomEn-oWnEd BuSinESSES, 2013
women-owned firms are Georgia (+240%) and florida
(+175%). Disclosure issues prevent a state-level analysis
of employment and revenue growth.
The ethnic origin of Asian American firms is quite varied.
The Census Bureau publishes some information on the
country of origin of Asian American business owners.
Eighty-five percent (85%) of Asian American business
owners (men and women alike) have their roots in one
of five regions: 27% have Chinese ancestry, 20% are
of Asian Indian heritage, 15% are Vietnamese, 12% are
Korean, and 11% are filipina.
for further information and data on trends in the growth of
Asian American women-owned firms, see Table 10 in the
Summary Tables at the back of the report.
lATInA-owned fIrMS
firms owned by Hispanic women number an estimated
944,000 as of 2013. These latina-owned firms employ
408,100 workers in addition to the owner and generate an
estimated $65.5 billion in revenue.
Firm
Rev
enue
s (B
illio
ns)
# F
irm
s/ E
mp
loye
es (
Tho
usan
ds)
LATINA-OWNED FIRMS NUMBER NEARLY 1M, EMPLOY 408.1K, CONTRIBUTE $65.5B TO U.S. ECONOMY
944
# of Firms
408.1
Employment
65.5
Revenues ($B)
Sources: 1997-2007, Census Bureau. 2013 estimates, American Express OPEN/Womenable.
Overall, there are an estimated 2.6 million Hispanic-owned
firms in the U.S., employing nearly 2.1 million workers and
generating $407.7 billion in revenues. Therefore, latina
women own 36% of all latino-
owned firms, employ 20% of the workers employed by
latino-owned firms, and contribute 16% of the revenue
generated by latino-owned businesses.
Over the past 16 years, the number of latina-owned firms
has nearly tripled (up 180%), employment has risen 74%
and revenues have more than doubled (up 140%)—in
comparison with 59% firm growth among all women-
owned firms, 10% employment growth among all women-
owned firms, and 63% revenue growth among all women-
owned firms.
Over three-quarters (78%) of latina-owned firms are
found in ten states. (The share rises to 82% when
adding Arizona and New Mexico to the list.) The greatest
numbers of latina-owned firms are located in California
(226,000), followed by Texas (183,100) and florida
(135,900). While nationally 11% of women-owned firms
are owned by latinas, latinas comprise the greatest
share of all women-owned firms in New Mexico (29%),
Texas (25%), florida (24%) and California (20%).
Nationally, as previously stated, the number of latina-
owned firms has climbed 180% since 1997, while
employment is up 74% and revenues have risen by
140%. Among the 10 most populous states for minority-
owned firms, the states seeing the fastest growth in the
number of latina-owned firms are Georgia (up 308%,
albeit from a very small base), Texas (up 228%), New York
(up 193%) and New Jersey (up 191%, also from a small
base). In florida, while the number of latina-owned firms
rose a close-to-average 182% over the past 16 years,
employment has risen by 115% and revenues are up 180%
in florida—an indication of growing economic robustness,
and a sure sign that the sun is definitely shining on latina-
owned firms in the Sunshine State.
As with Asian American women business owners, the
regional heritage of latina business owners is varied,
though more concentrated. Nearly half (46%) of latino
business owners (men and women alike) trace their
roots to Mexico, 11% are Cuban American, 7% are Puerto
Rican, and 34% have family heritage from another latin
American or Hispanic country.
24
THE STaTE of WomEn-oWnEd BuSinESSES, 2013
for further information and data on trends in the growth
of latina-owned firms, see Table 11 in the Summary
Tables at the back of the report.
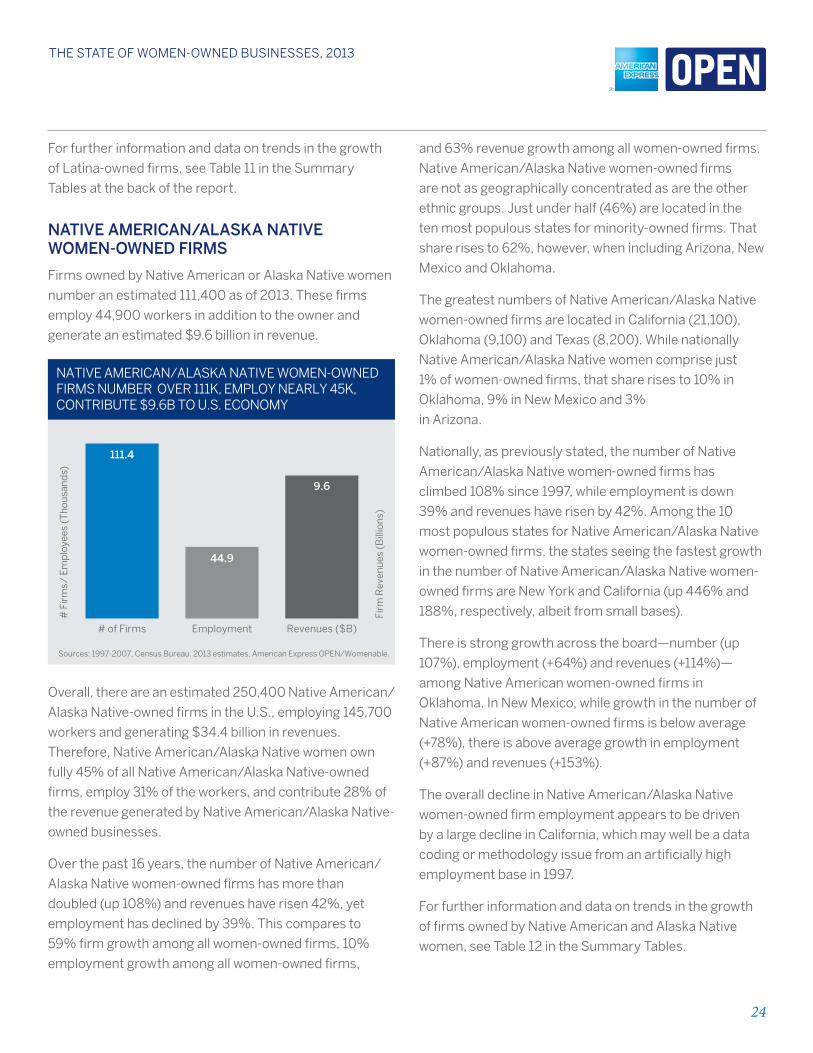
nATIVe AMerIcAn/AlASkA nATIVe woMen-owned fIrMS
firms owned by Native American or Alaska Native women
number an estimated 111,400 as of 2013. These firms
employ 44,900 workers in addition to the owner and
generate an estimated $9.6 billion in revenue.
Firm
Rev
enue
s (B
illio
ns)
# F
irm
s/ E
mp
loye
es (
Tho
usan
ds)
NATIVE AMERICAN/ALASKA NATIVE WOMEN-OWNED FIRMS NUMBER OVER 111K, EMPLOY NEARLY 45K, CONTRIBUTE $9.6B TO U.S. ECONOMY
111.4
# of Firms
44.9
Employment
9.6
Revenues ($B)
Sources: 1997-2007, Census Bureau. 2013 estimates, American Express OPEN/Womenable.
Overall, there are an estimated 250,400 Native American/
Alaska Native-owned firms in the U.S., employing 145,700
workers and generating $34.4 billion in revenues.
Therefore, Native American/Alaska Native women own
fully 45% of all Native American/Alaska Native-owned
firms, employ 31% of the workers, and contribute 28% of
the revenue generated by Native American/Alaska Native-
owned businesses.
Over the past 16 years, the number of Native American/
Alaska Native women-owned firms has more than
doubled (up 108%) and revenues have risen 42%, yet
employment has declined by 39%. This compares to
59% firm growth among all women-owned firms, 10%
employment growth among all women-owned firms,
and 63% revenue growth among all women-owned firms.
Native American/Alaska Native women-owned firms
are not as geographically concentrated as are the other
ethnic groups. Just under half (46%) are located in the
ten most populous states for minority-owned firms. That
share rises to 62%, however, when including Arizona, New
Mexico and Oklahoma.
The greatest numbers of Native American/Alaska Native
women-owned firms are located in California (21,100),
Oklahoma (9,100) and Texas (8,200). While nationally
Native American/Alaska Native women comprise just
1% of women-owned firms, that share rises to 10% in
Oklahoma, 9% in New Mexico and 3%
in Arizona.
Nationally, as previously stated, the number of Native
American/Alaska Native women-owned firms has
climbed 108% since 1997, while employment is down
39% and revenues have risen by 42%. Among the 10
most populous states for Native American/Alaska Native
women-owned firms, the states seeing the fastest growth
in the number of Native American/Alaska Native women-
owned firms are New York and California (up 446% and
188%, respectively, albeit from small bases).
There is strong growth across the board—number (up
107%), employment (+64%) and revenues (+114%)—
among Native American women-owned firms in
Oklahoma. In New Mexico, while growth in the number of
Native American women-owned firms is below average
(+78%), there is above average growth in employment
(+87%) and revenues (+153%).
The overall decline in Native American/Alaska Native
women-owned firm employment appears to be driven
by a large decline in California, which may well be a data
coding or methodology issue from an artificially high
employment base in 1997.
for further information and data on trends in the growth
of firms owned by Native American and Alaska Native
women, see Table 12 in the Summary Tables.
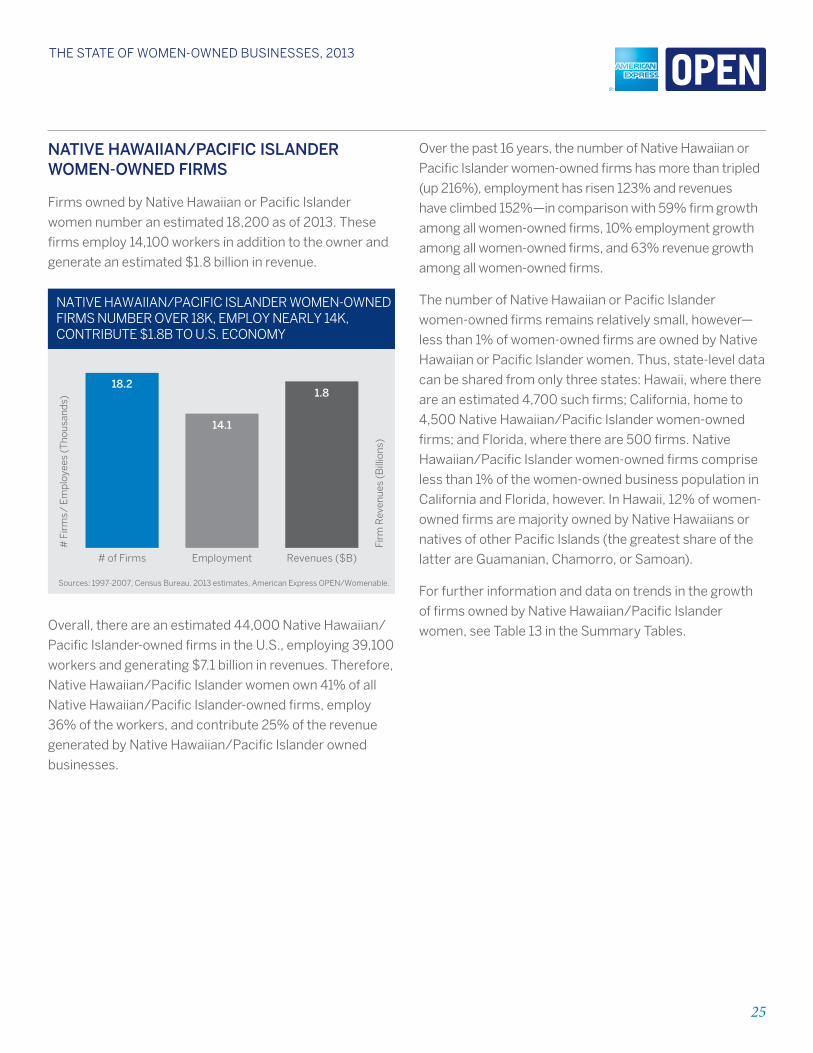
25
THE STaTE of WomEn-oWnEd BuSinESSES, 2013
nATIVe hAwAIIAn/PAcIfIc ISlAnder woMen-owned fIrMS
firms owned by Native Hawaiian or Pacific Islander
women number an estimated 18,200 as of 2013. These
firms employ 14,100 workers in addition to the owner and
generate an estimated $1.8 billion in revenue.
Firm
Rev
enue
s (B
illio
ns)
# F
irm
s/ E
mp
loye
es (
Tho
usan
ds)
NATIVE HAWAIIAN/PACIFIC ISLANDER WOMEN-OWNED FIRMS NUMBER OVER 18K, EMPLOY NEARLY 14K, CONTRIBUTE $1.8B TO U.S. ECONOMY
18.2
# of Firms
14.1
Employment
1.8
Revenues ($B)
Sources: 1997-2007, Census Bureau. 2013 estimates, American Express OPEN/Womenable.
Overall, there are an estimated 44,000 Native Hawaiian/
Pacific Islander-owned firms in the U.S., employing 39,100
workers and generating $7.1 billion in revenues. Therefore,
Native Hawaiian/Pacific Islander women own 41% of all
Native Hawaiian/Pacific Islander-owned firms, employ
36% of the workers, and contribute 25% of the revenue
generated by Native Hawaiian/Pacific Islander owned
businesses.
Over the past 16 years, the number of Native Hawaiian or
Pacific Islander women-owned firms has more than tripled
(up 216%), employment has risen 123% and revenues
have climbed 152%—in comparison with 59% firm growth
among all women-owned firms, 10% employment growth
among all women-owned firms, and 63% revenue growth
among all women-owned firms.
The number of Native Hawaiian or Pacific Islander
women-owned firms remains relatively small, however—
less than 1% of women-owned firms are owned by Native
Hawaiian or Pacific Islander women. Thus, state-level data
can be shared from only three states: Hawaii, where there
are an estimated 4,700 such firms; California, home to
4,500 Native Hawaiian/Pacific Islander women-owned
firms; and florida, where there are 500 firms. Native
Hawaiian/Pacific Islander women-owned firms comprise
less than 1% of the women-owned business population in
California and florida, however. In Hawaii, 12% of women-
owned firms are majority owned by Native Hawaiians or
natives of other Pacific Islands (the greatest share of the
latter are Guamanian, Chamorro, or Samoan).
for further information and data on trends in the growth
of firms owned by Native Hawaiian/Pacific Islander
women, see Table 13 in the Summary Tables.
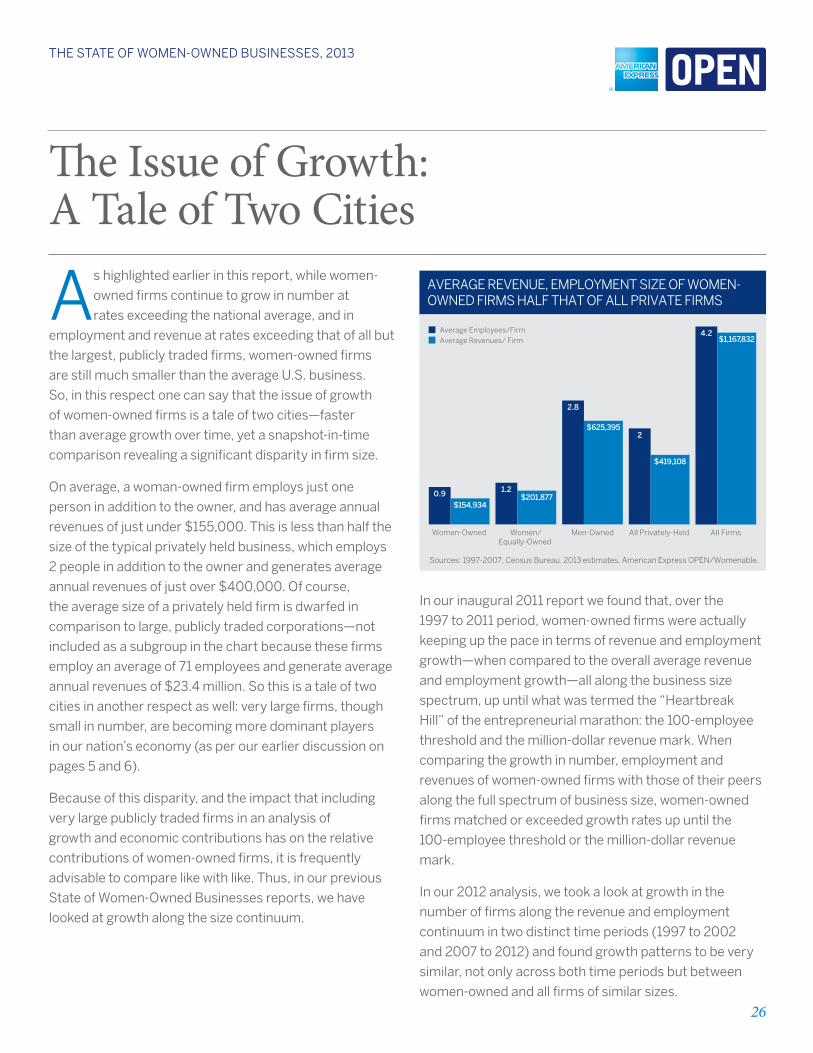
26
THE STaTE of WomEn-oWnEd BuSinESSES, 2013
The Issue of Growth: A Tale of Two Cities
As highlighted earlier in this report, while women-
owned firms continue to grow in number at
rates exceeding the national average, and in
employment and revenue at rates exceeding that of all but
the largest, publicly traded firms, women-owned firms
are still much smaller than the average U.S. business.
So, in this respect one can say that the issue of growth
of women-owned firms is a tale of two cities—faster
than average growth over time, yet a snapshot-in-time
comparison revealing a significant disparity in firm size.
On average, a woman-owned firm employs just one
person in addition to the owner, and has average annual
revenues of just under $155,000. This is less than half the
size of the typical privately held business, which employs
2 people in addition to the owner and generates average
annual revenues of just over $400,000. Of course,
the average size of a privately held firm is dwarfed in
comparison to large, publicly traded corporations—not
included as a subgroup in the chart because these firms
employ an average of 71 employees and generate average
annual revenues of $23.4 million. So this is a tale of two
cities in another respect as well: very large firms, though
small in number, are becoming more dominant players
in our nation’s economy (as per our earlier discussion on
pages 5 and 6).
Because of this disparity, and the impact that including
very large publicly traded firms in an analysis of
growth and economic contributions has on the relative
contributions of women-owned firms, it is frequently
advisable to compare like with like. Thus, in our previous
State of Women-Owned Businesses reports, we have
looked at growth along the size continuum.
$419,108
All Firms
4.2$1,167,832
Average Employees/FirmAverage Revenues/ Firm
Sources: 1997-2007, Census Bureau. 2013 estimates, American Express OPEN/Womenable.
Men-Owned
2.8
$625,395
All Privately-Held
2
$419,108
Women/Equally-Owned
1.2$201,877
Women-Owned
0.9
$154,934
AVERAGE REVENUE, EMPLOYMENT SIZE OF WOMEN-OWNED FIRMS HALF THAT OF ALL PRIVATE FIRMS
In our inaugural 2011 report we found that, over the
1997 to 2011 period, women-owned firms were actually
keeping up the pace in terms of revenue and employment
growth—when compared to the overall average revenue
and employment growth—all along the business size
spectrum, up until what was termed the “Heartbreak
Hill” of the entrepreneurial marathon: the 100-employee
threshold and the million-dollar revenue mark. When
comparing the growth in number, employment and
revenues of women-owned firms with those of their peers
along the full spectrum of business size, women-owned
firms matched or exceeded growth rates up until the
100-employee threshold or the million-dollar revenue
mark.
In our 2012 analysis, we took a look at growth in the
number of firms along the revenue and employment
continuum in two distinct time periods (1997 to 2002
and 2007 to 2012) and found growth patterns to be very
similar, not only across both time periods but between
women-owned and all firms of similar sizes.
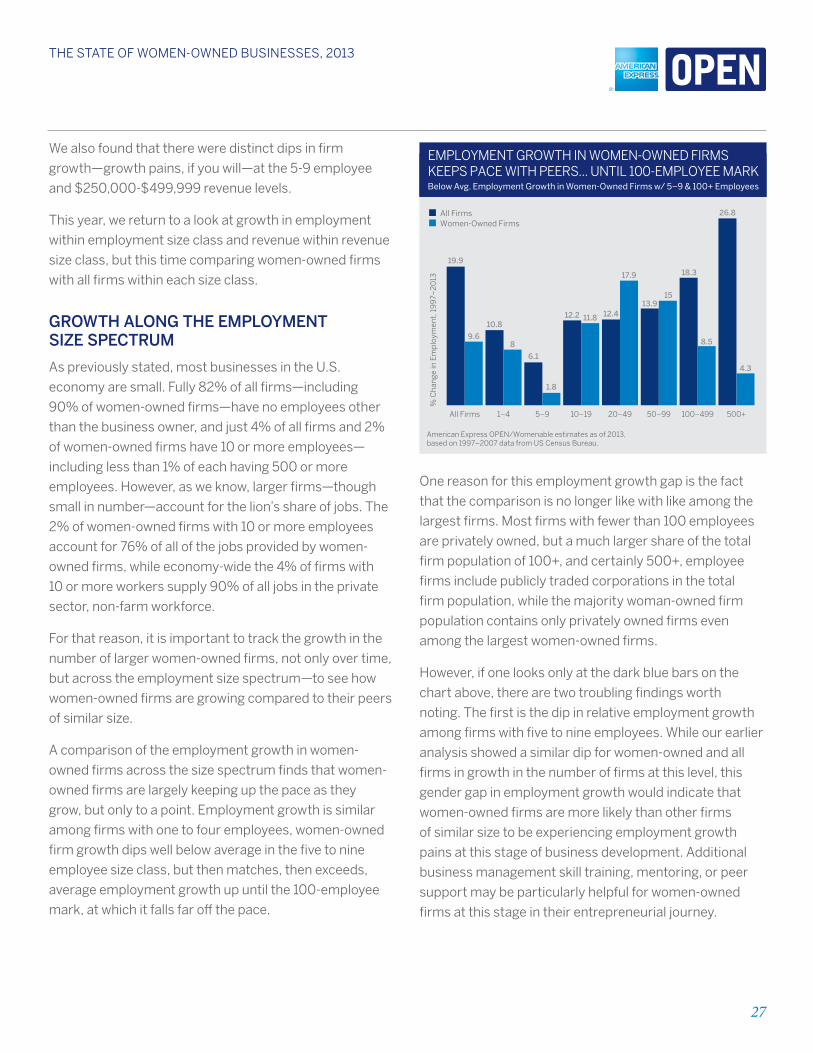
27
THE STaTE of WomEn-oWnEd BuSinESSES, 2013
We also found that there were distinct dips in firm
growth—growth pains, if you will—at the 5-9 employee
and $250,000-$499,999 revenue levels.
This year, we return to a look at growth in employment
within employment size class and revenue within revenue
size class, but this time comparing women-owned firms
with all firms within each size class.
GrowTh AlonG The eMPloyMenT SIze SPecTruM
As previously stated, most businesses in the U.S.
economy are small. fully 82% of all firms—including
90% of women-owned firms—have no employees other
than the business owner, and just 4% of all firms and 2%
of women-owned firms have 10 or more employees—
including less than 1% of each having 500 or more
employees. However, as we know, larger firms—though
small in number—account for the lion’s share of jobs. The
2% of women-owned firms with 10 or more employees
account for 76% of all of the jobs provided by women-
owned firms, while economy-wide the 4% of firms with
10 or more workers supply 90% of all jobs in the private
sector, non-farm workforce.
for that reason, it is important to track the growth in the
number of larger women-owned firms, not only over time,
but across the employment size spectrum—to see how
women-owned firms are growing compared to their peers
of similar size.
A comparison of the employment growth in women-
owned firms across the size spectrum finds that women-
owned firms are largely keeping up the pace as they
grow, but only to a point. Employment growth is similar
among firms with one to four employees, women-owned
firm growth dips well below average in the five to nine
employee size class, but then matches, then exceeds,
average employment growth up until the 100-employee
mark, at which it falls far off the pace.
All Firms
19.9
9.6
20–49
12.4
17.9
50–99
13.915
100–499
18.3
8.5
500+
26.8
4.3
10–19
12.2 11.8
1–4
10.8
8
5–9
6.1
1.8
All FirmsWomen-Owned Firms
American Express OPEN/Womenable estimates as of 2013, based on 1997–2007 data from US Census Bureau.
% C
han
ge in
Em
plo
ymen
t, 1
99
7–2
013
EMPLOYMENT GROWTH IN WOMEN-OWNED FIRMS KEEPS PACE WITH PEERS... UNTIL 100-EMPLOYEE MARKBelow Avg. Employment Growth in Women-Owned Firms w/ 5–9 & 100+ Employees
One reason for this employment growth gap is the fact
that the comparison is no longer like with like among the
largest firms. Most firms with fewer than 100 employees
are privately owned, but a much larger share of the total
firm population of 100+, and certainly 500+, employee
firms include publicly traded corporations in the total
firm population, while the majority woman-owned firm
population contains only privately owned firms even
among the largest women-owned firms.
However, if one looks only at the dark blue bars on the
chart above, there are two troubling findings worth
noting. The first is the dip in relative employment growth
among firms with five to nine employees. While our earlier
analysis showed a similar dip for women-owned and all
firms in growth in the number of firms at this level, this
gender gap in employment growth would indicate that
women-owned firms are more likely than other firms
of similar size to be experiencing employment growth
pains at this stage of business development. Additional
business management skill training, mentoring, or peer
support may be particularly helpful for women-owned
firms at this stage in their entrepreneurial journey.
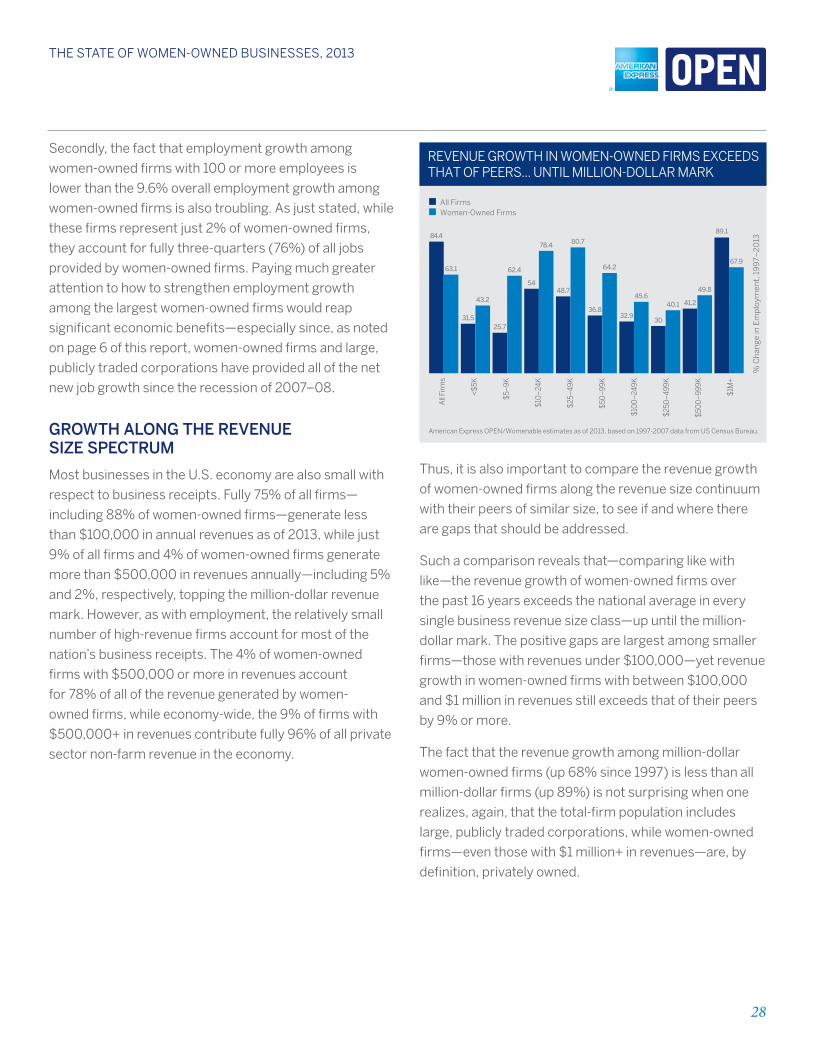
28
THE STaTE of WomEn-oWnEd BuSinESSES, 2013
Secondly, the fact that employment growth among
women-owned firms with 100 or more employees is
lower than the 9.6% overall employment growth among
women-owned firms is also troubling. As just stated, while
these firms represent just 2% of women-owned firms,
they account for fully three-quarters (76%) of all jobs
provided by women-owned firms. Paying much greater
attention to how to strengthen employment growth
among the largest women-owned firms would reap
significant economic benefits—especially since, as noted
on page 6 of this report, women-owned firms and large,
publicly traded corporations have provided all of the net
new job growth since the recession of 2007–08.
GrowTh AlonG The reVenue SIze SPecTruM
Most businesses in the U.S. economy are also small with
respect to business receipts. fully 75% of all firms—
including 88% of women-owned firms—generate less
than $100,000 in annual revenues as of 2013, while just
9% of all firms and 4% of women-owned firms generate
more than $500,000 in revenues annually—including 5%
and 2%, respectively, topping the million-dollar revenue
mark. However, as with employment, the relatively small
number of high-revenue firms account for most of the
nation’s business receipts. The 4% of women-owned
firms with $500,000 or more in revenues account
for 78% of all of the revenue generated by women-
owned firms, while economy-wide, the 9% of firms with
$500,000+ in revenues contribute fully 96% of all private
sector non-farm revenue in the economy.
$10
–24
K
$25
–49
K
$50
–99
K
$10
0–
249K
$25
0–
499K
$50
0–
999K
$1M
+
All
Firm
s
84.4
63.1
31.5
43.2
25.7
62.4
54
78.4
48.7
80.7
36.8
64.2
32.9
45.6
30
40.1 41.2
49.8
67.9
89.1
<$5K
$5–
9K
All FirmsWomen-Owned Firms
American Express OPEN/Womenable estimates as of 2013, based on 1997-2007 data from US Census Bureau.
% C
han
ge in
Em
plo
ymen
t, 1
99
7–2
013
REVENUE GROWTH IN WOMEN-OWNED FIRMS EXCEEDS THAT OF PEERS... UNTIL MILLION-DOLLAR MARK
Thus, it is also important to compare the revenue growth
of women-owned firms along the revenue size continuum
with their peers of similar size, to see if and where there
are gaps that should be addressed.
Such a comparison reveals that—comparing like with
like—the revenue growth of women-owned firms over
the past 16 years exceeds the national average in every
single business revenue size class—up until the million-
dollar mark. The positive gaps are largest among smaller
firms—those with revenues under $100,000—yet revenue
growth in women-owned firms with between $100,000
and $1 million in revenues still exceeds that of their peers
by 9% or more.
The fact that the revenue growth among million-dollar
women-owned firms (up 68% since 1997) is less than all
million-dollar firms (up 89%) is not surprising when one
realizes, again, that the total-firm population includes
large, publicly traded corporations, while women-owned
firms—even those with $1 million+ in revenues—are, by
definition, privately owned.
29
THE STaTE of WomEn-oWnEd BuSinESSES, 2013
While comparing women-owned firms with their peers
along the size continuum yields positive findings, it is
worth looking at how revenue growth in women-owned
firms of different sizes compare with the growth of
women-owned firms in general. This analysis points out
that revenue growth for women-owned firms in the very
smallest size class (under $5,000 in revenues) and among
mid-sized firms from $100,000 to $1 million in sales fall
below the overall 63% increase in women-owned firm
revenues over the past 16 years. Revenue growth is
lowest (+40%) among women-owned firms with
$250,000 to $499,999.
While this is still very positive revenue growth—and beats
the 30% growth among all firms of similar size—this dip
is reflective of the analysis in our 2012 report, which
pointed out the “growth pains” for women-owned
businesses at the 5-9 employee and $250,000–499,999
revenue marks. This is the point at which entrepreneurs
are making the transition from “jack of all trades” to
CEO—hiring senior managers, delegating day-to-day
responsibilities, and building management systems.
This is another point in a firm’s growth journey at which
women business owners would benefit from education,
mentoring, and peer support.
for more detailed data on trends by revenue and
employment size of firm, see Tables 7 and 8 in the
Summary Tables section.
30
THE STaTE of WomEn-oWnEd BuSinESSES, 2013
Observations: Women-Owned Firms as Unsung Heroines
With each year, the State of Women-Owned
Businesses reports contribute new and
timely insights concerning the growth and
development of the nation’s women-owned businesses.
first, these annual reports provide up-to-date estimates
of the number and the economic contributions of women-
owned enterprises—at the national level as well as by
industry, state, and major metropolitan area. And—new
this year—we unveil an accounting of the remarkable rise
in the number and economic contributions of firms owned
by women of color.
Second, this publication expands our knowledge of the
issue of business growth by taking a detailed and nuanced
look at the economic contributions and growth of women-
owned enterprises all along the business size continuum.
In this, we have shed light on the fact that the growth in
number, revenue and employment of women-owned firms
match their peers all along the size spectrum—up until
they reach the 100-employee threshold and the million-
dollar revenue mark.
Some of this gender growth gap at the very high end
of business accomplishment is an artifact of definition.
When privately held, majority women-owned firms
are compared with their peers along the business size
spectrum, we are largely comparing like with like all the
way along until the 100+ employee level and the million-
dollar mark—at which time the “all U.S. firms” pool is
much more likely to be dominated by very large, publicly
traded corporations.
So it remains important to understand in greater detail
what progress—or peril—may be occurring among the
most accomplished businesses in the U.S. economy,
a population that cannot be readily examined using
published Census data figures. Indeed, in a recent
analysis drawing upon unpublished Census data of firms
with $1 million or more in revenues—Growing Under the
Radar: An Exploration of the Achievements of Million-
Dollar Women-Owned firms—the number of women-
owned businesses with $10 million or more in revenues
was found to have grown by 57% between 2002 and 2012,
a rate 47% faster than all $10M+ businesses.
However, it is also the case that many women-founded
and -led businesses are growing above and beyond the
51%+ ownership definition. Women business owners who
have sought and obtained outside equity investment to
spur their companies to a higher level of growth, or who
have shared equity ownership with senior managers in
their companies, may no longer meet the definitional
criteria for a “woman-owned business”—even though
she may still run the company on a day-to-day basis
and be a plurality owner of the company. We need to
better understand this growth/ownership journey, and
attempt to quantify the heretofore unmeasured economic
contributions of this important segment of the woman
business owner population.
finally and importantly, this report points out that, in
the six years since the beginning of the recession in
2007, private sector job growth in the United States
has come from two main sources: large, publicly traded
corporations… and privately owned majority women-
owned businesses. So, in many ways one can say that
women-owned enterprises are the unsung heroines
of the small business sector. It behooves all of us to
better understand their growth It behooves all of us
to better understand their growth journey, address
their growth challenges, and help even more women-
owned businesses to scale new heights of business
accomplishment.
31
THE STaTE of WomEn-oWnEd BuSinESSES, 2013
Study Methodology
This report is based on data from the United States
Census Bureau, specifically their quinquennial
business census, the Survey of Business
Owners (SBO), which is conducted every five years,
in years ending in 2 and 7. Data from the past three
Census surveys—1997, 2002, and 2007—were collated,
analyzed and extrapolated forward to 2013, factoring
in relative changes in Gross Domestic Product (GDP)
not only nationally but also at industry and state levels.
And, because the most geographically precise GDP
data are available down to the state level, state figures
were applied to estimates of recent changes at the
metropolitan area level. All GDP data were obtained from
the Bureau of Economic
Analysis (www.bea.gov), another bureau within the
U.S. Department of Commerce.
Specifically, growth in GDP from 1997 to 2007 ($8.3 to
$14 trillion) was compared to that from 2007 to the fourth
quarter of 2012 ($14 to $15.7 trillion). Relative annual
growth rates were then used to estimate the growth in
the number of firms over the 2007 to 2013 period—thus
bending a straight-line extrapolation downward in keeping
with slower economic growth during the period.14 This was
done at the national level and by applying actual gross
state and industry-level output figures (both of which
were available up to the fourth quarter of 2011).
for detailed information on the 2002 and 2007 economic
censuses, visit: http://www.census.gov/econ/census07/
www/get_data.html. (The 1997 economic census is no
longer available electronically.) A preview of changes for
the 2012 economic census (which will be published in
2014-15) may be found at: http://www.census.gov/econ/
census12/.
14 for example, national annual GDP growth during the 2007-2013 period was 57.8% of the annual GDP growth between 1997 and 2007, and just 48.6% of growth from 2002 to 2007.
32
THE STaTE of WomEn-oWnEd BuSinESSES, 2013
Acknowledgements
This report is commissioned and provided by
American Express OPEN. American Express
OPEN is the leading payment card issuer for
small businesses in the United States and supports
business owners with products and services to help them
run and grow their businesses. This includes business
charge and credit cards that deliver purchasing power,
flexibility, rewards, and savings on business services
from an expanded lineup of partners and online tools and
services designed to help improve profitability.
learn more at www.OPEN.com and connect with us at
www.openforum.com and www.twitter.com/openforum.
American Express is a global services company, providing
customers with access to products, insights and
experiences that enrich lives and build business success.
learn more at www.americanexpress.com and connect
with us on www.facebook.com/americanexpress,
www.twitter.com/americanexpress and www.youtube.
com/americanexpress.
This report was prepared for American Express OPEN
by Womenable, a research, program and policy
development consultancy whose mission is to improve
the environment for women-owned businesses
worldwide. Womenable pursues this mission by working
with the stewards of women’s entrepreneurship around
the world—policy makers, multi-lateral organizations,
corporate decision makers, entrepreneurial support
organizations and the women’s business community—
to evaluate, implement and improve policies and
programs to support women’s enterprise development.
learn more at www.womenable.com.
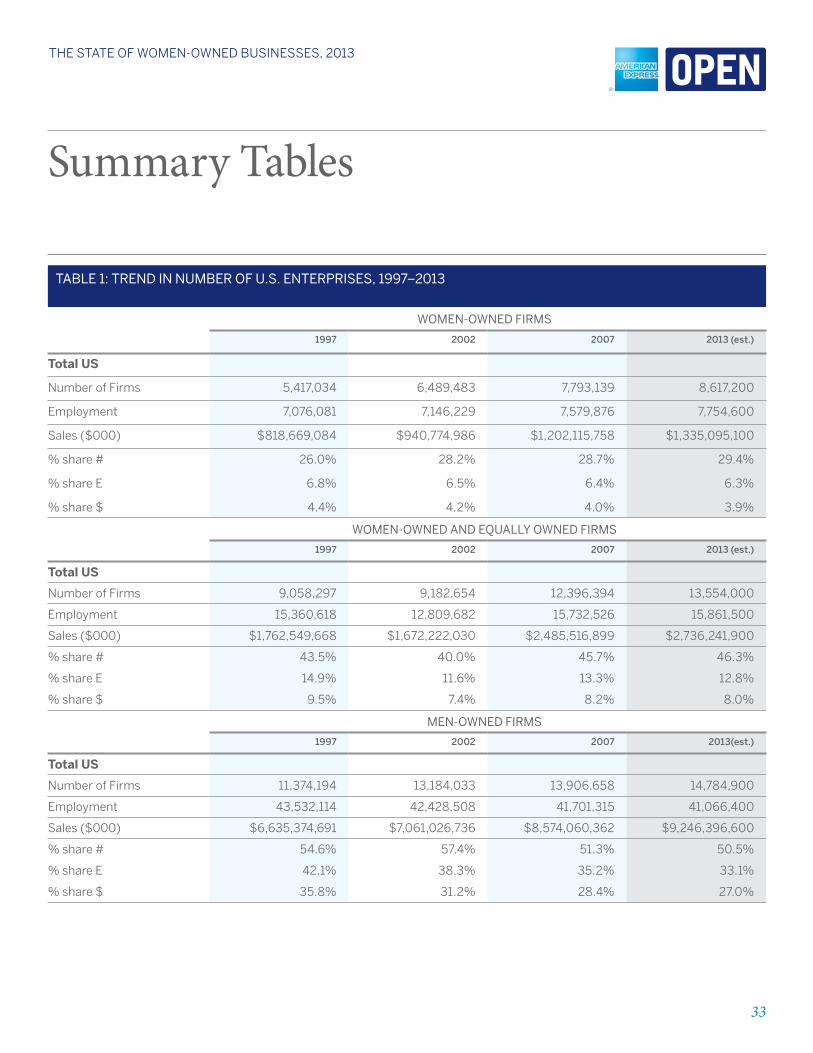
33
THE STaTE of WomEn-oWnEd BuSinESSES, 2013
Summary Tables
Table 1: Trend in number of u.S. enTerpriSeS, 1997–2013
Women-oWned firmS
1997 2002 2007 2013 (est.)
Total US
Number of firms 5,417,034 6,489,483 7,793,139 8,617,200
Employment 7,076,081 7,146,229 7,579,876 7,754,600
Sales ($000) $818,669,084 $940,774,986 $1,202,115,758 $1,335,095,100
% share # 26.0% 28.2% 28.7% 29.4%
% share E 6.8% 6.5% 6.4% 6.3%
% share $ 4.4% 4.2% 4.0% 3.9%
Women-oWned and eQually oWned firmS
1997 2002 2007 2013 (est.)
Total US
Number of firms 9,058,297 9,182,654 12,396,394 13,554,000
Employment 15,360,618 12,809,682 15,732,526 15,861,500
Sales ($000) $1,762,549,668 $1,672,222,030 $2,485,516,899 $2,736,241,900
% share # 43.5% 40.0% 45.7% 46.3%
% share E 14.9% 11.6% 13.3% 12.8%
% share $ 9.5% 7.4% 8.2% 8.0%
men-oWned firmS
1997 2002 2007 2013(est.)
Total US
Number of firms 11,374,194 13,184,033 13,906,658 14,784,900
Employment 43,532,114 42,428,508 41,701,315 41,066,400
Sales ($000) $6,635,374,691 $7,061,026,736 $8,574,060,362 $9,246,396,600
% share # 54.6% 57.4% 51.3% 50.5%
% share E 42.1% 38.3% 35.2% 33.1%
% share $ 35.8% 31.2% 28.4% 27.0%
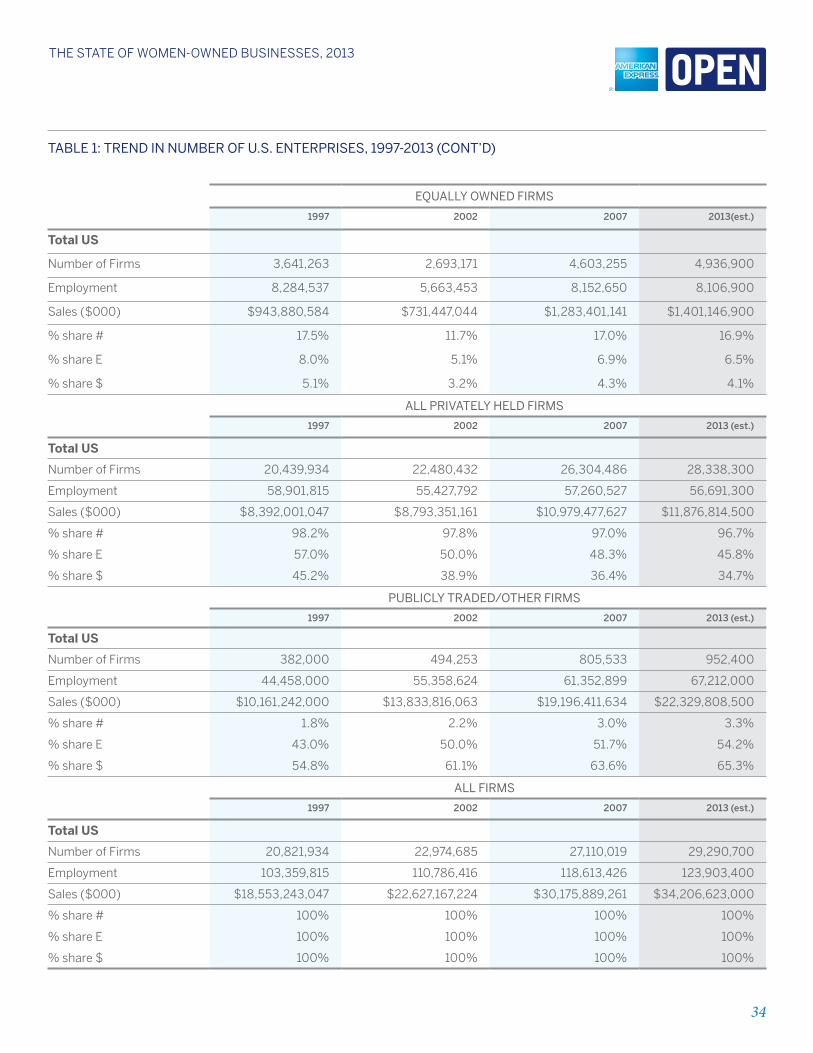
34
THE STaTE of WomEn-oWnEd BuSinESSES, 2013
Table 1: Trend in number of u.S. enTerpriSeS, 1997-2013 (conT’d)
eQually oWned firmS
1997 2002 2007 2013(est.)
Total US
Number of firms 3,641,263 2,693,171 4,603,255 4,936,900
Employment 8,284,537 5,663,453 8,152,650 8,106,900
Sales ($000) $943,880,584 $731,447,044 $1,283,401,141 $1,401,146,900
% share # 17.5% 11.7% 17.0% 16.9%
% share E 8.0% 5.1% 6.9% 6.5%
% share $ 5.1% 3.2% 4.3% 4.1%
all privaTely held firmS
1997 2002 2007 2013 (est.)
Total US
Number of firms 20,439,934 22,480,432 26,304,486 28,338,300
Employment 58,901,815 55,427,792 57,260,527 56,691,300
Sales ($000) $8,392,001,047 $8,793,351,161 $10,979,477,627 $11,876,814,500
% share # 98.2% 97.8% 97.0% 96.7%
% share E 57.0% 50.0% 48.3% 45.8%
% share $ 45.2% 38.9% 36.4% 34.7%
publicly Traded/oTher firmS
1997 2002 2007 2013 (est.)
Total US
Number of firms 382,000 494,253 805,533 952,400
Employment 44,458,000 55,358,624 61,352,899 67,212,000
Sales ($000) $10,161,242,000 $13,833,816,063 $19,196,411,634 $22,329,808,500
% share # 1.8% 2.2% 3.0% 3.3%
% share E 43.0% 50.0% 51.7% 54.2%
% share $ 54.8% 61.1% 63.6% 65.3%
all firmS
1997 2002 2007 2013 (est.)
Total US
Number of firms 20,821,934 22,974,685 27,110,019 29,290,700
Employment 103,359,815 110,786,416 118,613,426 123,903,400
Sales ($000) $18,553,243,047 $22,627,167,224 $30,175,889,261 $34,206,623,000
% share # 100% 100% 100% 100%
% share E 100% 100% 100% 100%
% share $ 100% 100% 100% 100%
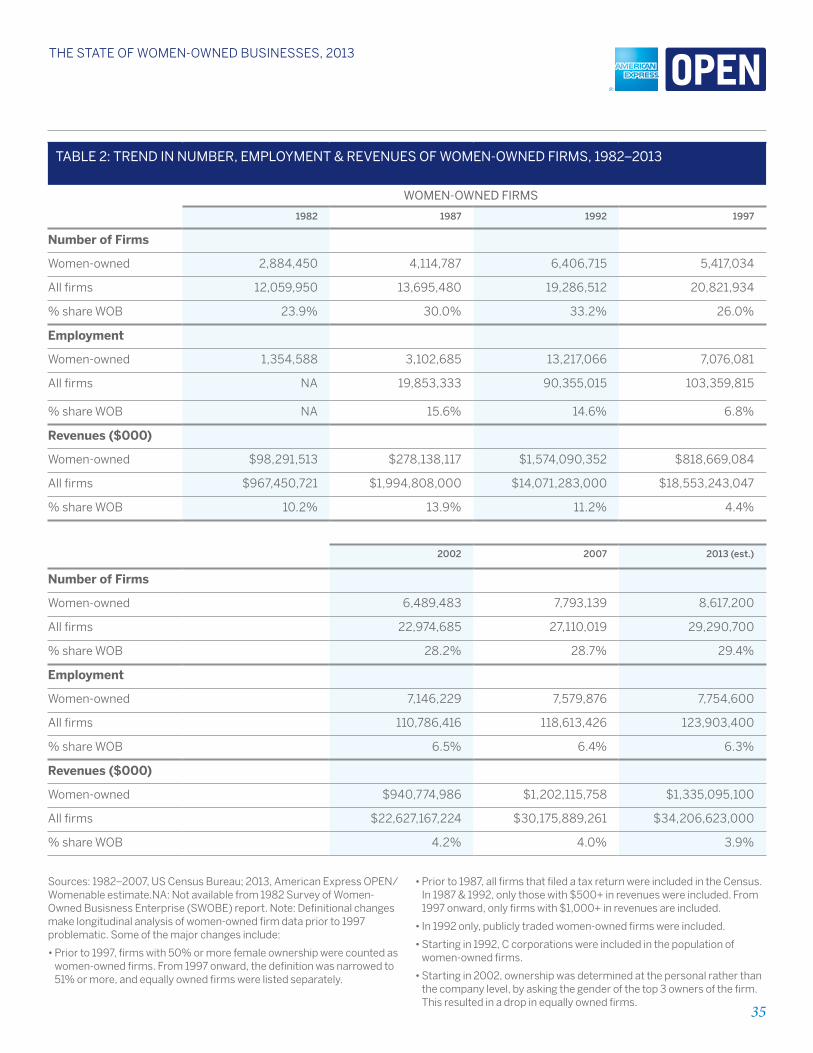
35
THE STaTE of WomEn-oWnEd BuSinESSES, 2013
Table 2: Trend in number, employmenT & revenueS of Women-oWned firmS, 1982–2013
Women-oWned firmS
1982 1987 1992 1997
Number of Firms
Women-owned 2,884,450 4,114,787 6,406,715 5,417,034
All firms 12,059,950 13,695,480 19,286,512 20,821,934
% share WOB 23.9% 30.0% 33.2% 26.0%
Employment
Women-owned 1,354,588 3,102,685 13,217,066 7,076,081
All firms NA 19,853,333 90,355,015 103,359,815
% share WOB NA 15.6% 14.6% 6.8%
Revenues ($000)
Women-owned $98,291,513 $278,138,117 $1,574,090,352 $818,669,084
All firms $967,450,721 $1,994,808,000 $14,071,283,000 $18,553,243,047
% share WOB 10.2% 13.9% 11.2% 4.4%
2002 2007 2013 (est.)
Number of Firms
Women-owned 6,489,483 7,793,139 8,617,200
All firms 22,974,685 27,110,019 29,290,700
% share WOB 28.2% 28.7% 29.4%
Employment
Women-owned 7,146,229 7,579,876 7,754,600
All firms 110,786,416 118,613,426 123,903,400
% share WOB 6.5% 6.4% 6.3%
Revenues ($000)
Women-owned $940,774,986 $1,202,115,758 $1,335,095,100
All firms $22,627,167,224 $30,175,889,261 $34,206,623,000
% share WOB 4.2% 4.0% 3.9%
Sources: 1982–2007, US Census Bureau; 2013, American Express OPEN/Womenable estimate.NA: Not available from 1982 Survey of Women-Owned Busisness Enterprise (SWOBE) report. Note: Definitional changes make longitudinal analysis of women-owned firm data prior to 1997 problematic. Some of the major changes include:
• Prior to 1997, firms with 50% or more female ownership were counted as women-owned firms. from 1997 onward, the definition was narrowed to 51% or more, and equally owned firms were listed separately.
• Prior to 1987, all firms that filed a tax return were included in the Census. In 1987 & 1992, only those with $500+ in revenues were included. from 1997 onward, only firms with $1,000+ in revenues are included.
• In 1992 only, publicly traded women-owned firms were included.
• Starting in 1992, C corporations were included in the population of women-owned firms.
• Starting in 2002, ownership was determined at the personal rather than the company level, by asking the gender of the top 3 owners of the firm. This resulted in a drop in equally owned firms.
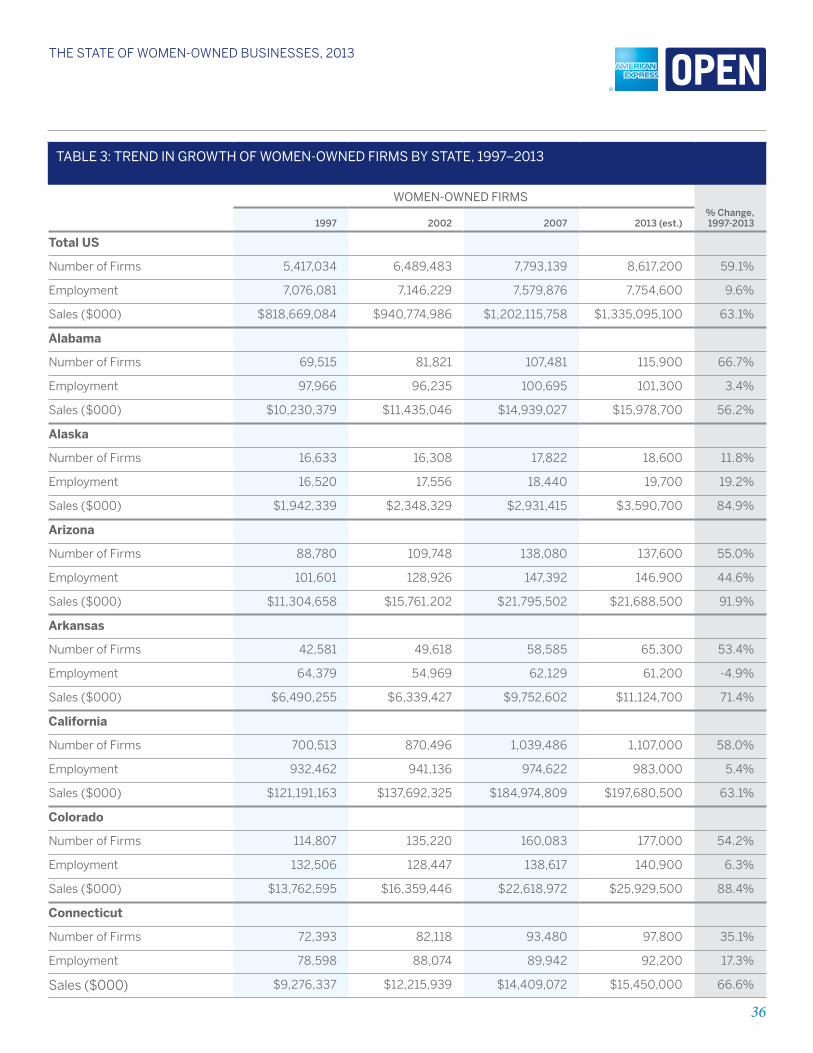
36
THE STaTE of WomEn-oWnEd BuSinESSES, 2013
Table 3: Trend in GroWTh of Women-oWned firmS by STaTe, 1997–2013
Women-oWned firmS % change,
1997-20131997 2002 2007 2013 (est.)
Total US
Number of firms 5,417,034 6,489,483 7,793,139 8,617,200 59.1%
Employment 7,076,081 7,146,229 7,579,876 7,754,600 9.6%
Sales ($000) $818,669,084 $940,774,986 $1,202,115,758 $1,335,095,100 63.1%
Alabama
Number of firms 69,515 81,821 107,481 115,900 66.7%
Employment 97,966 96,235 100,695 101,300 3.4%
Sales ($000) $10,230,379 $11,435,046 $14,939,027 $15,978,700 56.2%
Alaska
Number of firms 16,633 16,308 17,822 18,600 11.8%
Employment 16,520 17,556 18,440 19,700 19.2%
Sales ($000) $1,942,339 $2,348,329 $2,931,415 $3,590,700 84.9%
Arizona
Number of firms 88,780 109,748 138,080 137,600 55.0%
Employment 101,601 128,926 147,392 146,900 44.6%
Sales ($000) $11,304,658 $15,761,202 $21,795,502 $21,688,500 91.9%
Arkansas
Number of firms 42,581 49,618 58,585 65,300 53.4%
Employment 64,379 54,969 62,129 61,200 -4.9%
Sales ($000) $6,490,255 $6,339,427 $9,752,602 $11,124,700 71.4%
California
Number of firms 700,513 870,496 1,039,486 1,107,000 58.0%
Employment 932,462 941,136 974,622 983,000 5.4%
Sales ($000) $121,191,163 $137,692,325 $184,974,809 $197,680,500 63.1%
Colorado
Number of firms 114,807 135,220 160,083 177,000 54.2%
Employment 132,506 128,447 138,617 140,900 6.3%
Sales ($000) $13,762,595 $16,359,446 $22,618,972 $25,929,500 88.4%
Connecticut
Number of firms 72,393 82,118 93,480 97,800 35.1%
Employment 78,598 88,074 89,942 92,200 17.3%
Sales ($000) $9,276,337 $12,215,939 $14,409,072 $15,450,000 66.6%

37
THE STaTE of WomEn-oWnEd BuSinESSES, 2013
Table 3: Trend in GroWTh of Women-oWned firmS by STaTe, 1997–2013 (conT’d)
Women-oWned firmS % change,
1997-20131997 2002 2007 2013 (est.)
Delaware
Number of firms 13,662 15,344 19,446 22,100 61.8%
Employment 19,192 19,359 18,402 18,000 -6.2%
Sales ($000) $1,831,055 $2,020,973 $3,017,397 $3,561,200 94.5%
District of Columbia
Number of firms 13,979 15,675 19,286 23,100 65.2%
Employment 17,320 D 25,977 32,100 85.3%
Sales ($000) $1,813,270 $2,403,019 $3,805,691 $5,224,700 188.1%
Florida
Number of firms 337,811 437,355 581,192 572,900 69.6%
Employment 371,412 432,071 470,466 467,100 25.8%
Sales ($000) $48,261,328 $61,275,106 $76,867,239 $75,888,900 57.2%
Georgia
Number of firms 145,576 196,195 278,334 308,200 111.7%
Employment 190,577 196,810 228,992 237,600 24.7%
Sales ($000) $25,267,240 $30,026,706 $40,889,861 $44,405,000 75.7%
Hawaii
Number of firms 25,807 29,943 37,373 39,800 54.2%
Employment 30,138 38,569 37,748 39,400 30.7%
Sales ($000) $3,253,329 $4,594,306 $4,968,149 $5,329,300 63.8%
Idaho
Number of firms 25,763 28,824 35,594 38,200 48.3%
Employment 25,873 26,633 32,873 34,700 34.1%
Sales ($000) $2,405,407 $3,216,407 $4,103,736 $4,553,100 89.3%
Illinois
Number of firms 239,725 284,954 343,111 382,700 59.6%
Employment 392,569 351,317 339,371 319,000 -18.7%
Sales ($000) $44,273,464 $46,861,800 $53,730,382 $57,350,500 29.5%

38
THE STaTE of WomEn-oWnEd BuSinESSES, 2013
Table 3: Trend in GroWTh of Women-oWned firmS by STaTe, 1997–2013 (conT’d)
Women-oWned firmS % change,
1997-20131997 2002 2007 2013 (est.)
Indiana
Number of firms 107,082 118,857 129,621 137,100 28.0%
Employment 131,778 136,457 150,463 156,600 18.8%
Sales ($000) $13,578,102 $16,481,128 $20,637,409 $22,971,200 69.2%
Iowa
Number of firms 57,527 63,821 66,270 71,000 23.4%
Employment 71,724 63,324 61,243 55,600 -22.5%
Sales ($000) $8,093,311 $7,398,962 $7,886,061 $7,774,100 -3.9%
Kansas
Number of firms 54,638 59,635 65,180 69,500 27.2%
Employment 58,497 61,596 68,098 72,100 23.3%
Sales ($000) $6,928,221 $6,948,910 $9,253,112 $10,214,200 47.4%
Kentucky
Number of firms 65,965 77,159 86,429 98,200 48.9%
Employment 95,453 84,096 89,059 85,400 -10.5%
Sales ($000) $9,876,600 $9,451,101 $12,381,271 $13,816,400 39.9%
Louisiana
Number of firms 70,550 86,876 102,847 129,800 84.0%
Employment 116,063 114,635 110,631 106,100 -8.6%
Sales ($000) $11,462,806 $12,253,105 $22,092,433 $30,963,900 170.1%
Maine
Number of firms 30,598 32,512 38,490 40,500 32.4%
Employment 28,263 26,510 29,648 30,000 6.1%
Sales ($000) $3,212,307 $3,282,306 $3,541,893 $3,625,700 12.9%
Maryland
Number of firms 115,801 137,410 172,115 198,100 71.1%
Employment 139,616 141,906 165,454 177,400 27.1%
Sales ($000) $14,657,414 $17,295,183 $22,307,616 $25,842,000 76.3%

39
THE STaTE of WomEn-oWnEd BuSinESSES, 2013
Table 3: Trend in GroWTh of Women-oWned firmS by STaTe, 1997–2013 (conT’d)
Women-oWned firmS % change,
1997-20131997 2002 2007 2013 (est.)
Massachusetts
Number of firms 142,661 161,918 178,114 198,600 39.2%
Employment 155,191 173,368 167,928 175,300 13.0%
Sales ($000) $16,752,596 $23,133,981 $25,487,227 $30,534,100 82.3%
Michigan
Number of firms 184,590 217,673 248,421 246,700 33.6%
Employment 228,132 229,221 244,342 243,900 6.9%
Sales ($000) $26,498,569 $29,216,689 $30,928,408 $30,811,500 16.3%
Minnesota
Number of firms 108,417 123,905 133,237 146,600 35.2%
Employment 124,616 123,233 140,525 149,100 19.6%
Sales ($000) $13,457,542 $16,251,660 $18,635,862 $21,419,700 59.2%
Mississippi
Number of firms 38,321 47,102 60,846 68,000 77.4%
Employment 54,183 53,948 56,715 57,500 6.1%
Sales ($000) $5,995,011 $6,728,498 $8,572,422 $9,385,900 56.6%
Missouri
Number of firms 103,626 120,443 130,726 142,000 37.0%
Employment 134,301 147,372 140,142 142,600 6.2%
Sales ($000) $15,002,981 $18,604,649 $20,217,661 $22,392,200 49.3%
Montana
Number of firms 22,404 24,519 28,129 30,100 34.4%
Employment 22,240 21,238 28,532 30,700 38.0%
Sales ($000) $2,047,559 $2,138,505 $3,397,707 $3,864,300 88.7%
Nebraska
Number of firms 33,469 38,679 41,003 46,500 38.9%
Employment 42,044 46,868 46,708 50,100 19.2%
Sales ($000) $4,536,547 $5,765,418 $6,432,875 $7,805,100 72.0%
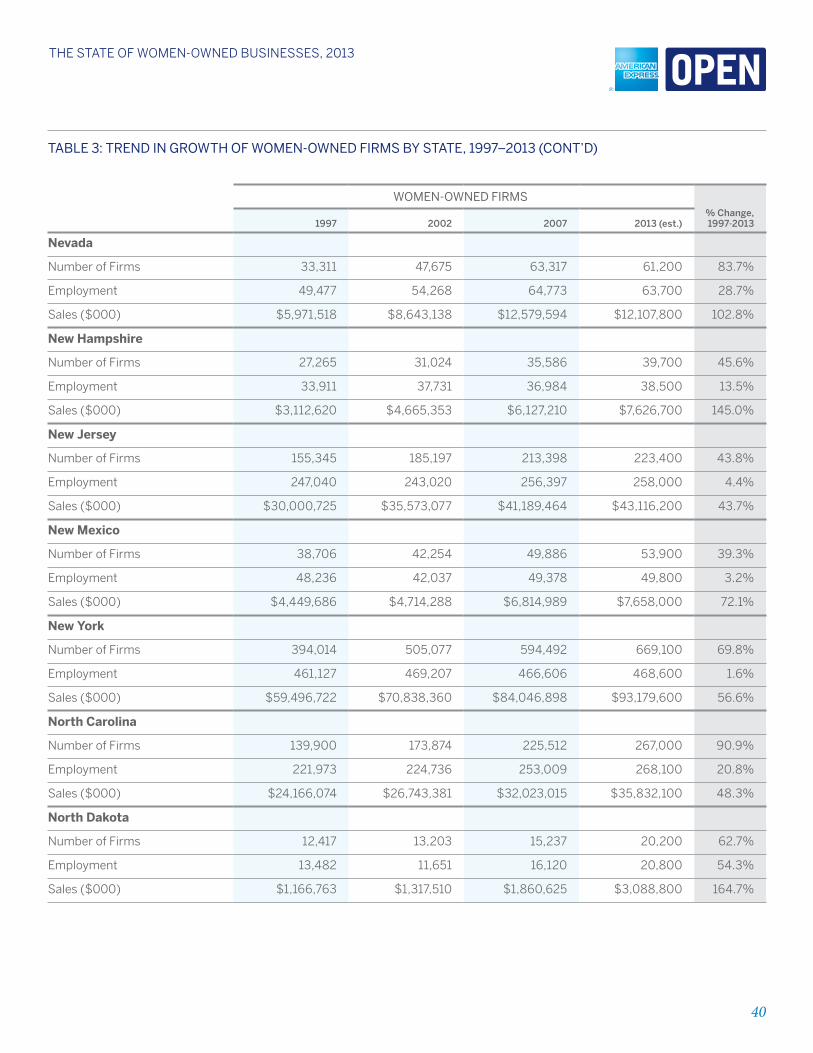
40
THE STaTE of WomEn-oWnEd BuSinESSES, 2013
Table 3: Trend in GroWTh of Women-oWned firmS by STaTe, 1997–2013 (conT’d)
Women-oWned firmS % change,
1997-20131997 2002 2007 2013 (est.)
Nevada
Number of firms 33,311 47,675 63,317 61,200 83.7%
Employment 49,477 54,268 64,773 63,700 28.7%
Sales ($000) $5,971,518 $8,643,138 $12,579,594 $12,107,800 102.8%
New Hampshire
Number of firms 27,265 31,024 35,586 39,700 45.6%
Employment 33,911 37,731 36,984 38,500 13.5%
Sales ($000) $3,112,620 $4,665,353 $6,127,210 $7,626,700 145.0%
New Jersey
Number of firms 155,345 185,197 213,398 223,400 43.8%
Employment 247,040 243,020 256,397 258,000 4.4%
Sales ($000) $30,000,725 $35,573,077 $41,189,464 $43,116,200 43.7%
New Mexico
Number of firms 38,706 42,254 49,886 53,900 39.3%
Employment 48,236 42,037 49,378 49,800 3.2%
Sales ($000) $4,449,686 $4,714,288 $6,814,989 $7,658,000 72.1%
New York
Number of firms 394,014 505,077 594,492 669,100 69.8%
Employment 461,127 469,207 466,606 468,600 1.6%
Sales ($000) $59,496,722 $70,838,360 $84,046,898 $93,179,600 56.6%
North Carolina
Number of firms 139,900 173,874 225,512 267,000 90.9%
Employment 221,973 224,736 253,009 268,100 20.8%
Sales ($000) $24,166,074 $26,743,381 $32,023,015 $35,832,100 48.3%
North Dakota
Number of firms 12,417 13,203 15,237 20,200 62.7%
Employment 13,482 11,651 16,120 20,800 54.3%
Sales ($000) $1,166,763 $1,317,510 $1,860,625 $3,088,800 164.7%

41
THE STaTE of WomEn-oWnEd BuSinESSES, 2013
Table 3: Trend in GroWTh of Women-oWned firmS by STaTe, 1997–2013 (conT’d)
Women-oWned firmS % change,
1997-20131997 2002 2007 2013 (est.)
Ohio
Number of firms 205,044 229,972 249,114 259,600 26.6%
Employment 291,361 264,038 289,699 289,300 -0.7%
Sales ($000) $30,596,853 $32,314,892 $40,985,031 $43,465,700 42.1%
Oklahoma
Number of firms 67,481 75,025 84,427 92,000 36.3%
Employment 82,531 92,546 96,698 103,000 24.8%
Sales ($000) $8,911,638 $9,254,893 $14,717,185 $17,308,800 94.2%
Oregon
Number of firms 80,543 88,317 103,620 120,800 50.0%
Employment 91,379 83,054 97,076 101,300 10.9%
Sales ($000) $10,334,626 $10,608,262 $14,035,799 $16,785,000 62.4%
Pennsylvania
Number of firms 202,990 227,117 265,136 295,200 45.4%
Employment 257,841 279,970 288,393 303,100 17.6%
Sales ($000) $34,043,332 $38,998,092 $46,082,536 $51,897,500 52.4%
Rhode Island
Number of firms 19,886 23,195 26,431 28,200 41.8%
Employment 28,678 25,562 22,417 20,700 -27.8%
Sales ($000) $2,683,580 $3,640,614 $3,339,397 $3,520,400 31.2%
South Carolina
Number of firms 64,232 76,831 99,458 108,300 68.6%
Employment 100,284 92,773 100,308 100,300 0.0%
Sales ($000) $10,634,412 $10,890,936 $14,149,756 $15,035,600 41.4%
South Dakota
Number of firms 14,121 15,573 17,082 19,000 34.6%
Employment 14,323 14,718 17,117 18,900 32.0%
Sales ($000) $1,202,178 $1,546,639 $2,052,027 $2,602,200 116.5%

42
THE STaTE of WomEn-oWnEd BuSinESSES, 2013
Table 3: Trend in GroWTh of Women-oWned firmS by STaTe, 1997–2013 (conT’d)
Women-oWned firmS % change,
1997-20131997 2002 2007 2013 (est.)
Tennessee
Number of firms 99,772 117,935 142,451 164,600 65.0%
Employment 142,080 116,955 126,083 117,800 -17.1%
Sales ($000) $14,538,315 $17,640,826 $21,387,001 $24,933,300 71.5%
Texas
Number of firms 381,453 468,705 610,007 737,300 93.3%
Employment 548,756 553,843 592,308 616,600 12.4%
Sales ($000) $65,065,262 $65,817,396 $97,094,681 $114,928,700 76.6%
Utah
Number of firms 41,991 48,475 61,468 72,800 73.4%
Employment 54,135 53,497 56,739 58,300 7.7%
Sales ($000) $5,096,187 $5,920,242 $10,142,709 $13,079,800 156.7%
Vermont
Number of firms 17,030 18,989 20,447 21,800 28.0%
Employment 13,524 14,974 13,351 13,300 -1.7%
Sales ($000) $1,313,146 $1,454,095 $1,724,022 $1,887,200 43.7%
Virginia
Number of firms 132,219 157,030 192,081 217,000 64.1%
Employment 172,227 183,468 199,248 210,500 22.2%
Sales ($000) $17,486,395 $22,123,426 $30,272,850 $35,597,100 103.6%
Washington
Number of firms 123,042 137,394 157,989 172,100 39.9%
Employment 139,032 126,818 149,093 153,200 10.2%
Sales ($000) $15,099,236 $17,368,371 $23,103,402 $26,335,500 74.4%
West Virginia
Number of firms 30,231 31,301 33,787 37,300 23.4%
Employment 33,724 31,539 36,095 38,400 13.9%
Sales ($000) $3,298,735 $3,252,129 $4,777,819 $6,236,800 89.1%
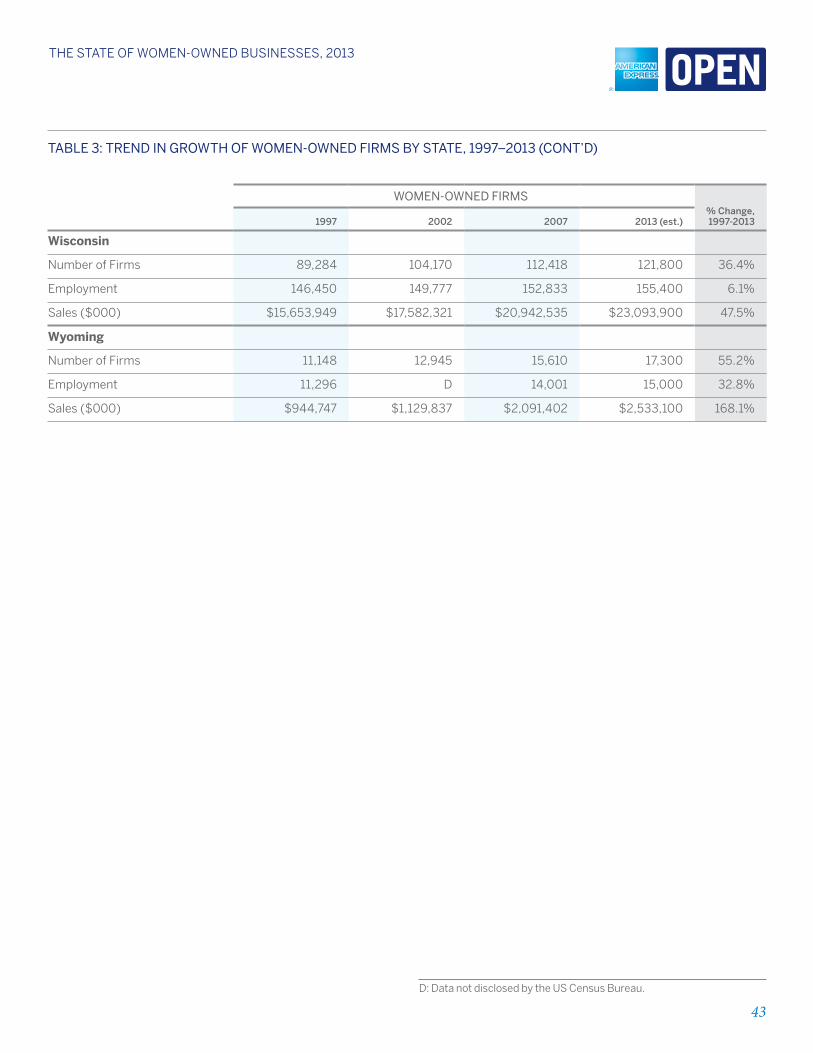
43
THE STaTE of WomEn-oWnEd BuSinESSES, 2013
Table 3: Trend in GroWTh of Women-oWned firmS by STaTe, 1997–2013 (conT’d)
Women-oWned firmS % change,
1997-20131997 2002 2007 2013 (est.)
Wisconsin
Number of firms 89,284 104,170 112,418 121,800 36.4%
Employment 146,450 149,777 152,833 155,400 6.1%
Sales ($000) $15,653,949 $17,582,321 $20,942,535 $23,093,900 47.5%
Wyoming
Number of firms 11,148 12,945 15,610 17,300 55.2%
Employment 11,296 D 14,001 15,000 32.8%
Sales ($000) $944,747 $1,129,837 $2,091,402 $2,533,100 168.1%
D: Data not disclosed by the US Census Bureau.
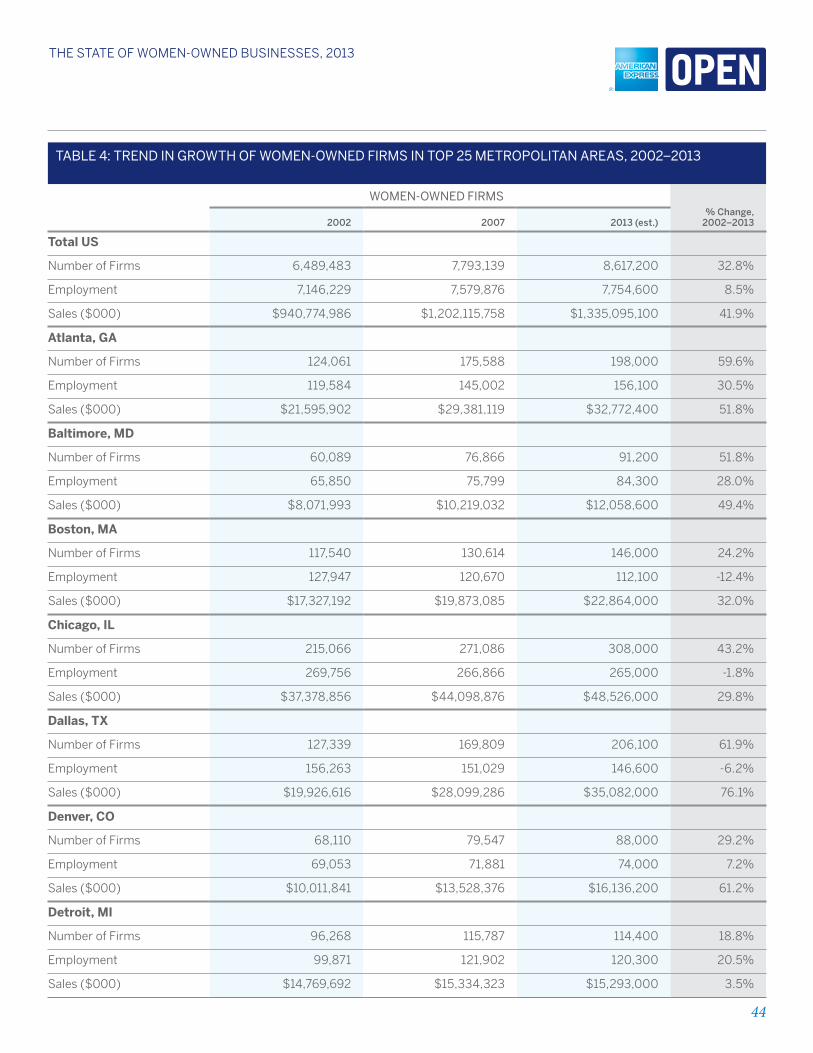
44
THE STaTE of WomEn-oWnEd BuSinESSES, 2013
Table 4: Trend in GroWTh of Women-oWned firmS in Top 25 meTropoliTan areaS, 2002–2013
Women-oWned firmS% change,
2002–20132002 2007 2013 (est.)
Total US
Number of firms 6,489,483 7,793,139 8,617,200 32.8%
Employment 7,146,229 7,579,876 7,754,600 8.5%
Sales ($000) $940,774,986 $1,202,115,758 $1,335,095,100 41.9%
Atlanta, GA
Number of firms 124,061 175,588 198,000 59.6%
Employment 119,584 145,002 156,100 30.5%
Sales ($000) $21,595,902 $29,381,119 $32,772,400 51.8%
Baltimore, MD
Number of firms 60,089 76,866 91,200 51.8%
Employment 65,850 75,799 84,300 28.0%
Sales ($000) $8,071,993 $10,219,032 $12,058,600 49.4%
Boston, MA
Number of firms 117,540 130,614 146,000 24.2%
Employment 127,947 120,670 112,100 -12.4%
Sales ($000) $17,327,192 $19,873,085 $22,864,000 32.0%
Chicago, IL
Number of firms 215,066 271,086 308,000 43.2%
Employment 269,756 266,866 265,000 -1.8%
Sales ($000) $37,378,856 $44,098,876 $48,526,000 29.8%
Dallas, TX
Number of firms 127,339 169,809 206,100 61.9%
Employment 156,263 151,029 146,600 -6.2%
Sales ($000) $19,926,616 $28,099,286 $35,082,000 76.1%
Denver, CO
Number of firms 68,110 79,547 88,000 29.2%
Employment 69,053 71,881 74,000 7.2%
Sales ($000) $10,011,841 $13,528,376 $16,136,200 61.2%
Detroit, MI
Number of firms 96,268 115,787 114,400 18.8%
Employment 99,871 121,902 120,300 20.5%
Sales ($000) $14,769,692 $15,334,323 $15,293,000 3.5%

45
THE STaTE of WomEn-oWnEd BuSinESSES, 2013
Table 4: Trend in GroWTh of Women-oWned firmS in Top 25 meTropoliTan areaS, 2002–2013 (conT’d)
Women-oWned firmS% change,
2002–20132002 2007 2013 (est.)
Houston, TX
Number of firms 117,516 152,221 181,900 54.8%
Employment 142,305 152,928 162,000 13.8%
Sales ($000) $18,312,556 $30,014,828 $40,013,200 118.5%
Los Angeles, CA
Number of firms 345,436 409,830 432,300 25.1%
Employment 371,194 388,536 394,600 6.3%
Sales ($000) $59,692,294 $79,797,391 $86,818,100 45.4%
Miami, FL
Number of firms 180,797 232,743 229,800 27.1%
Employment 153,586 140,608 141,400 -7.9%
Sales ($000) $21,645,539 $26,697,251 $26,406,300 22.0%
Minneapolis/St. Paul, MN
Number of firms 81,607 90,372 99,500 21.9%
Employment 87,843 102,421 117,700 34.0%
Sales ($000) $11,760,385 $14,093,497 $16,532,100 40.6%
New York, NY
Number of firms 510,692 604,678 663,200 29.9%
Employment 521,585 508,301 500,000 -4.1%
Sales ($000) $79,902,753 $94,662,980 $103,855,600 30.0%
Philadephia, PA/NJ/DE
Number of firms 108,384 133,595 155,200 43.2%
Employment 133,675 136,632 139,200 4.1%
Sales ($000) $18,346,100 $24,083,914 $29,000,100 58.1%
Phoenix, AZ
Number of firms 70,816 83,379 83,200 17.5%
Employment 89,408 102,518 102,300 14.4%
Sales ($000) $11,478,738 $15,911,873 $15,837,400 38.0%
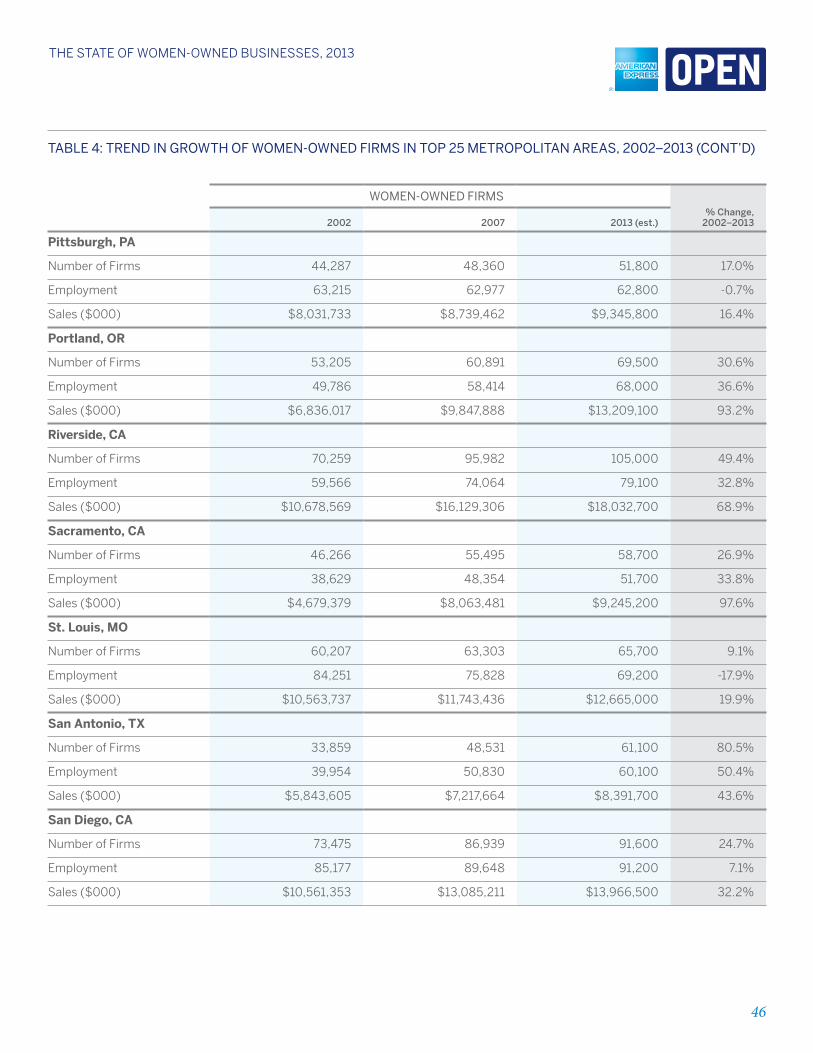
46
THE STaTE of WomEn-oWnEd BuSinESSES, 2013
Table 4: Trend in GroWTh of Women-oWned firmS in Top 25 meTropoliTan areaS, 2002–2013 (conT’d)
Women-oWned firmS% change,
2002–20132002 2007 2013 (est.)
Pittsburgh, PA
Number of firms 44,287 48,360 51,800 17.0%
Employment 63,215 62,977 62,800 -0.7%
Sales ($000) $8,031,733 $8,739,462 $9,345,800 16.4%
Portland, OR
Number of firms 53,205 60,891 69,500 30.6%
Employment 49,786 58,414 68,000 36.6%
Sales ($000) $6,836,017 $9,847,888 $13,209,100 93.2%
Riverside, CA
Number of firms 70,259 95,982 105,000 49.4%
Employment 59,566 74,064 79,100 32.8%
Sales ($000) $10,678,569 $16,129,306 $18,032,700 68.9%
Sacramento, CA
Number of firms 46,266 55,495 58,700 26.9%
Employment 38,629 48,354 51,700 33.8%
Sales ($000) $4,679,379 $8,063,481 $9,245,200 97.6%
St. Louis, MO
Number of firms 60,207 63,303 65,700 9.1%
Employment 84,251 75,828 69,200 -17.9%
Sales ($000) $10,563,737 $11,743,436 $12,665,000 19.9%
San Antonio, TX
Number of firms 33,859 48,531 61,100 80.5%
Employment 39,954 50,830 60,100 50.4%
Sales ($000) $5,843,605 $7,217,664 $8,391,700 43.6%
San Diego, CA
Number of firms 73,475 86,939 91,600 24.7%
Employment 85,177 89,648 91,200 7.1%
Sales ($000) $10,561,353 $13,085,211 $13,966,500 32.2%
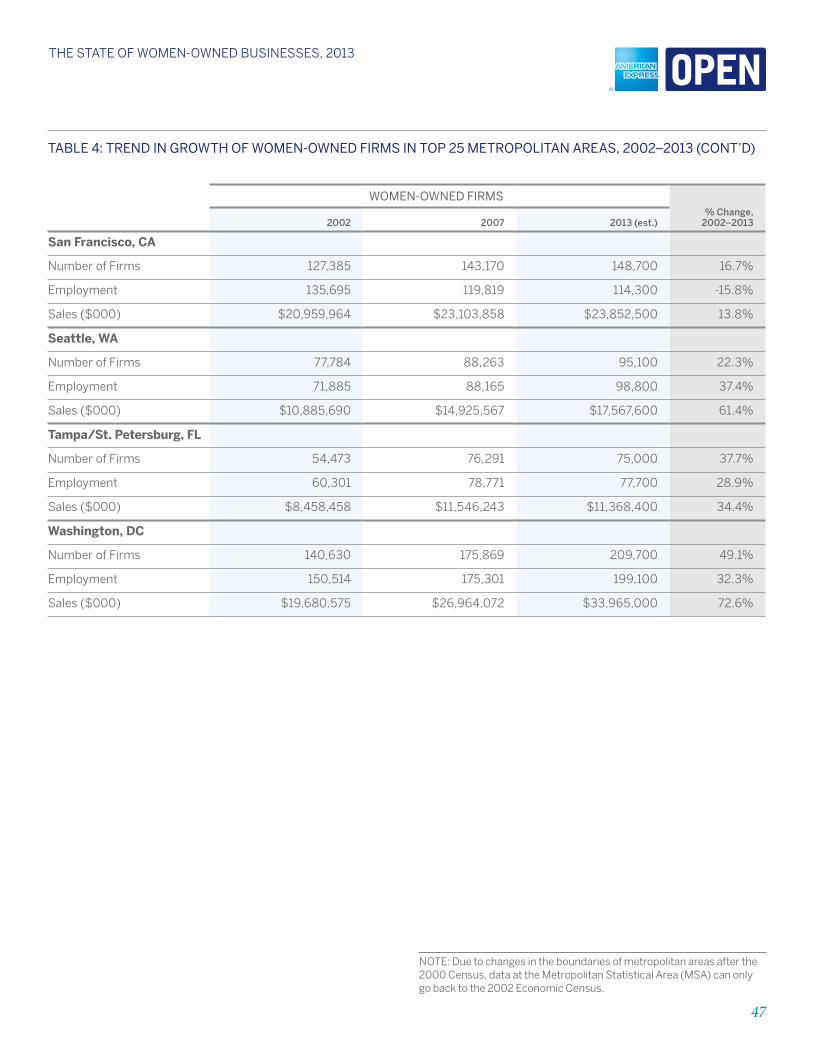
47
THE STaTE of WomEn-oWnEd BuSinESSES, 2013
Table 4: Trend in GroWTh of Women-oWned firmS in Top 25 meTropoliTan areaS, 2002–2013 (conT’d)
Women-oWned firmS% change,
2002–20132002 2007 2013 (est.)
San Francisco, CA
Number of firms 127,385 143,170 148,700 16.7%
Employment 135,695 119,819 114,300 -15.8%
Sales ($000) $20,959,964 $23,103,858 $23,852,500 13.8%
Seattle, WA
Number of firms 77,784 88,263 95,100 22.3%
Employment 71,885 88,165 98,800 37.4%
Sales ($000) $10,885,690 $14,925,567 $17,567,600 61.4%
Tampa/St. Petersburg, FL
Number of firms 54,473 76,291 75,000 37.7%
Employment 60,301 78,771 77,700 28.9%
Sales ($000) $8,458,458 $11,546,243 $11,368,400 34.4%
Washington, DC
Number of firms 140,630 175,869 209,700 49.1%
Employment 150,514 175,301 199,100 32.3%
Sales ($000) $19,680,575 $26,964,072 $33,965,000 72.6%
NOTE: Due to changes in the boundaries of metropolitan areas after the 2000 Census, data at the Metropolitan Statistical Area (MSA) can only go back to the 2002 Economic Census.
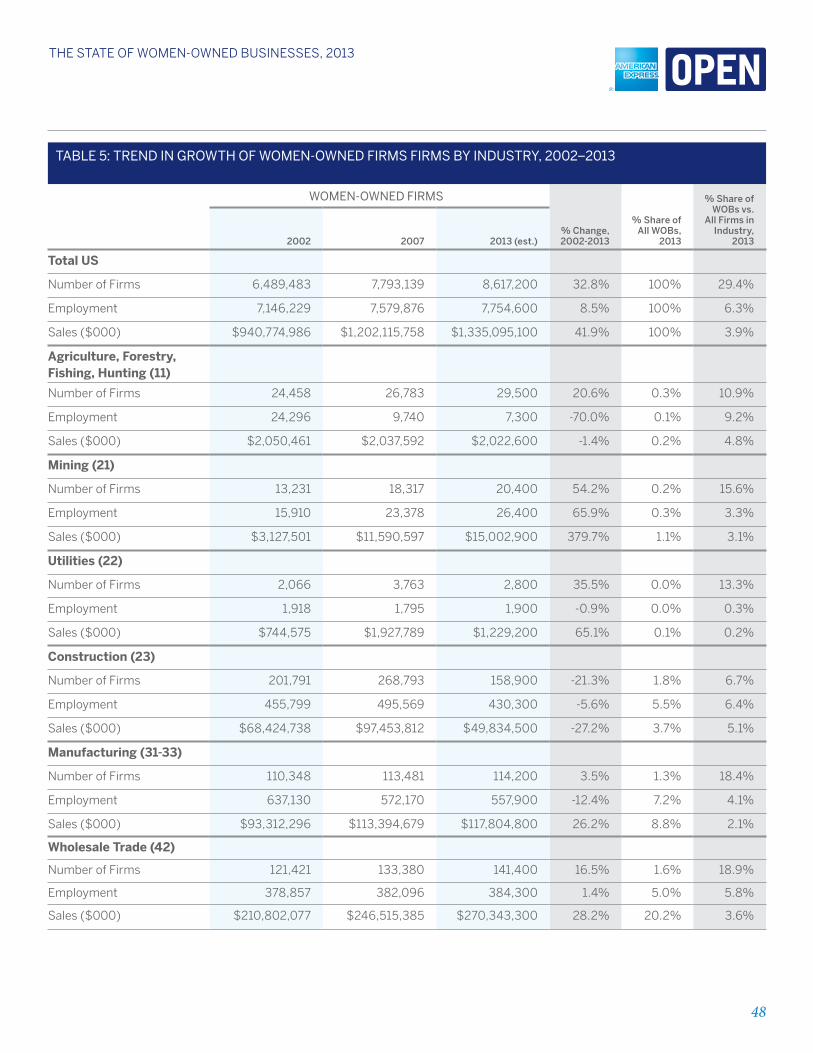
48
THE STaTE of WomEn-oWnEd BuSinESSES, 2013
Table 5: Trend in GroWTh of Women-oWned firmS firmS by induSTry, 2002–2013
Women-oWned firmS
% change, 2002-2013
% Share of All woBs,
2013
% Share of woBs vs.
All firms in Industry,
20132002 2007 2013 (est.)
Total US
Number of firms 6,489,483 7,793,139 8,617,200 32.8% 100% 29.4%
Employment 7,146,229 7,579,876 7,754,600 8.5% 100% 6.3%
Sales ($000) $940,774,986 $1,202,115,758 $1,335,095,100 41.9% 100% 3.9%
Agriculture, Forestry, Fishing, Hunting (11)
Number of firms 24,458 26,783 29,500 20.6% 0.3% 10.9%
Employment 24,296 9,740 7,300 -70.0% 0.1% 9.2%
Sales ($000) $2,050,461 $2,037,592 $2,022,600 -1.4% 0.2% 4.8%
Mining (21)
Number of firms 13,231 18,317 20,400 54.2% 0.2% 15.6%
Employment 15,910 23,378 26,400 65.9% 0.3% 3.3%
Sales ($000) $3,127,501 $11,590,597 $15,002,900 379.7% 1.1% 3.1%
Utilities (22)
Number of firms 2,066 3,763 2,800 35.5% 0.0% 13.3%
Employment 1,918 1,795 1,900 -0.9% 0.0% 0.3%
Sales ($000) $744,575 $1,927,789 $1,229,200 65.1% 0.1% 0.2%
Construction (23)
Number of firms 201,791 268,793 158,900 -21.3% 1.8% 6.7%
Employment 455,799 495,569 430,300 -5.6% 5.5% 6.4%
Sales ($000) $68,424,738 $97,453,812 $49,834,500 -27.2% 3.7% 5.1%
Manufacturing (31-33)
Number of firms 110,348 113,481 114,200 3.5% 1.3% 18.4%
Employment 637,130 572,170 557,900 -12.4% 7.2% 4.1%
Sales ($000) $93,312,296 $113,394,679 $117,804,800 26.2% 8.8% 2.1%
Wholesale Trade (42)
Number of firms 121,421 133,380 141,400 16.5% 1.6% 18.9%
Employment 378,857 382,096 384,300 1.4% 5.0% 5.8%
Sales ($000) $210,802,077 $246,515,385 $270,343,300 28.2% 20.2% 3.6%
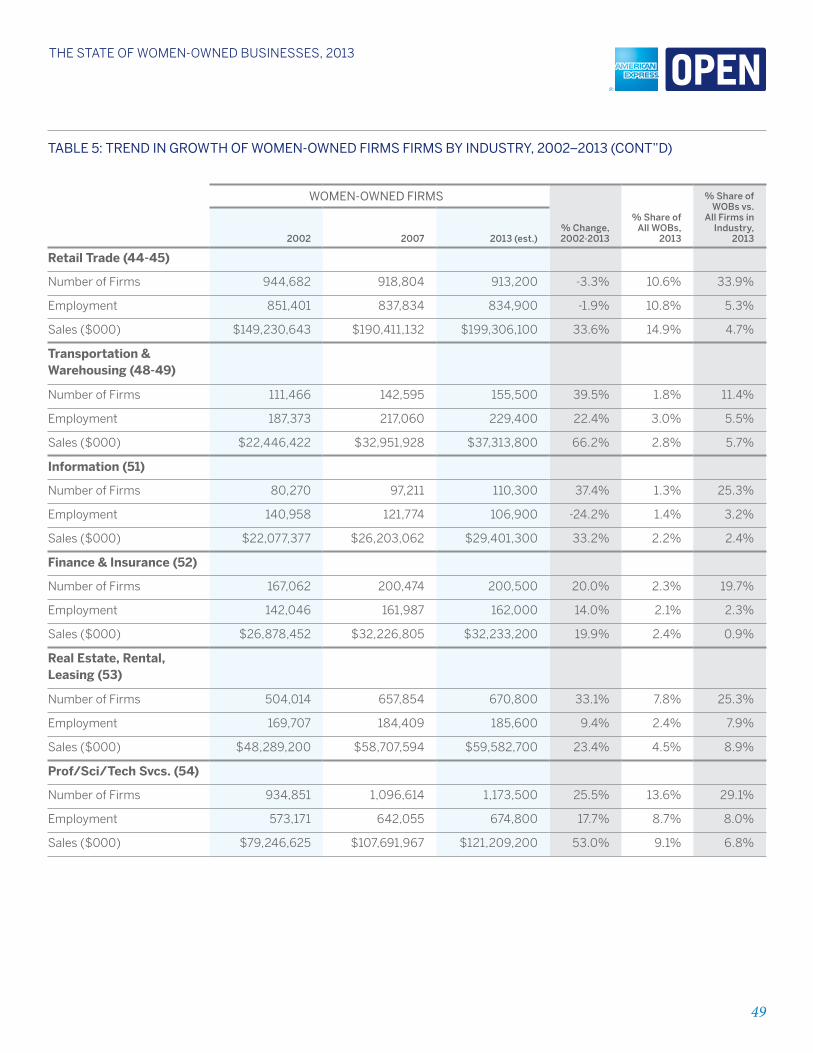
49
THE STaTE of WomEn-oWnEd BuSinESSES, 2013
Table 5: Trend in GroWTh of Women-oWned firmS firmS by induSTry, 2002–2013 (conT”d)
Women-oWned firmS
% change, 2002-2013
% Share of All woBs,
2013
% Share of woBs vs.
All firms in Industry,
20132002 2007 2013 (est.)
Retail Trade (44-45)
Number of firms 944,682 918,804 913,200 -3.3% 10.6% 33.9%
Employment 851,401 837,834 834,900 -1.9% 10.8% 5.3%
Sales ($000) $149,230,643 $190,411,132 $199,306,100 33.6% 14.9% 4.7%
Transportation & Warehousing (48-49)
Number of firms 111,466 142,595 155,500 39.5% 1.8% 11.4%
Employment 187,373 217,060 229,400 22.4% 3.0% 5.5%
Sales ($000) $22,446,422 $32,951,928 $37,313,800 66.2% 2.8% 5.7%
Information (51)
Number of firms 80,270 97,211 110,300 37.4% 1.3% 25.3%
Employment 140,958 121,774 106,900 -24.2% 1.4% 3.2%
Sales ($000) $22,077,377 $26,203,062 $29,401,300 33.2% 2.2% 2.4%
Finance & Insurance (52)
Number of firms 167,062 200,474 200,500 20.0% 2.3% 19.7%
Employment 142,046 161,987 162,000 14.0% 2.1% 2.3%
Sales ($000) $26,878,452 $32,226,805 $32,233,200 19.9% 2.4% 0.9%
Real Estate, Rental, Leasing (53)
Number of firms 504,014 657,854 670,800 33.1% 7.8% 25.3%
Employment 169,707 184,409 185,600 9.4% 2.4% 7.9%
Sales ($000) $48,289,200 $58,707,594 $59,582,700 23.4% 4.5% 8.9%
Prof/Sci/Tech Svcs. (54)
Number of firms 934,851 1,096,614 1,173,500 25.5% 13.6% 29.1%
Employment 573,171 642,055 674,800 17.7% 8.7% 8.0%
Sales ($000) $79,246,625 $107,691,967 $121,209,200 53.0% 9.1% 6.8%
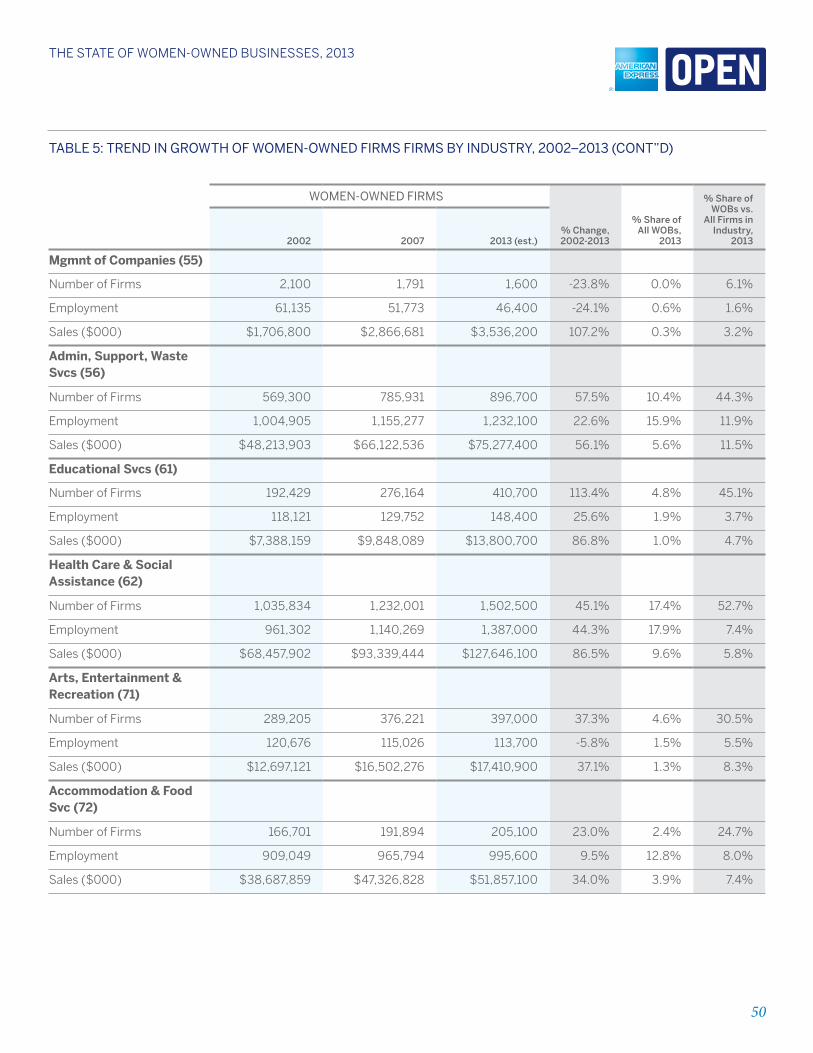
50
THE STaTE of WomEn-oWnEd BuSinESSES, 2013
Table 5: Trend in GroWTh of Women-oWned firmS firmS by induSTry, 2002–2013 (conT”d)
Women-oWned firmS
% change, 2002-2013
% Share of All woBs,
2013
% Share of woBs vs.
All firms in Industry,
20132002 2007 2013 (est.)
Mgmnt of Companies (55)
Number of firms 2,100 1,791 1,600 -23.8% 0.0% 6.1%
Employment 61,135 51,773 46,400 -24.1% 0.6% 1.6%
Sales ($000) $1,706,800 $2,866,681 $3,536,200 107.2% 0.3% 3.2%
Admin, Support, Waste Svcs (56)
Number of firms 569,300 785,931 896,700 57.5% 10.4% 44.3%
Employment 1,004,905 1,155,277 1,232,100 22.6% 15.9% 11.9%
Sales ($000) $48,213,903 $66,122,536 $75,277,400 56.1% 5.6% 11.5%
Educational Svcs (61)
Number of firms 192,429 276,164 410,700 113.4% 4.8% 45.1%
Employment 118,121 129,752 148,400 25.6% 1.9% 3.7%
Sales ($000) $7,388,159 $9,848,089 $13,800,700 86.8% 1.0% 4.7%
Health Care & Social Assistance (62)
Number of firms 1,035,834 1,232,001 1,502,500 45.1% 17.4% 52.7%
Employment 961,302 1,140,269 1,387,000 44.3% 17.9% 7.4%
Sales ($000) $68,457,902 $93,339,444 $127,646,100 86.5% 9.6% 5.8%
Arts, Entertainment & Recreation (71)
Number of firms 289,205 376,221 397,000 37.3% 4.6% 30.5%
Employment 120,676 115,026 113,700 -5.8% 1.5% 5.5%
Sales ($000) $12,697,121 $16,502,276 $17,410,900 37.1% 1.3% 8.3%
Accommodation & Food Svc (72)
Number of firms 166,701 191,894 205,100 23.0% 2.4% 24.7%
Employment 909,049 965,794 995,600 9.5% 12.8% 8.0%
Sales ($000) $38,687,859 $47,326,828 $51,857,100 34.0% 3.9% 7.4%
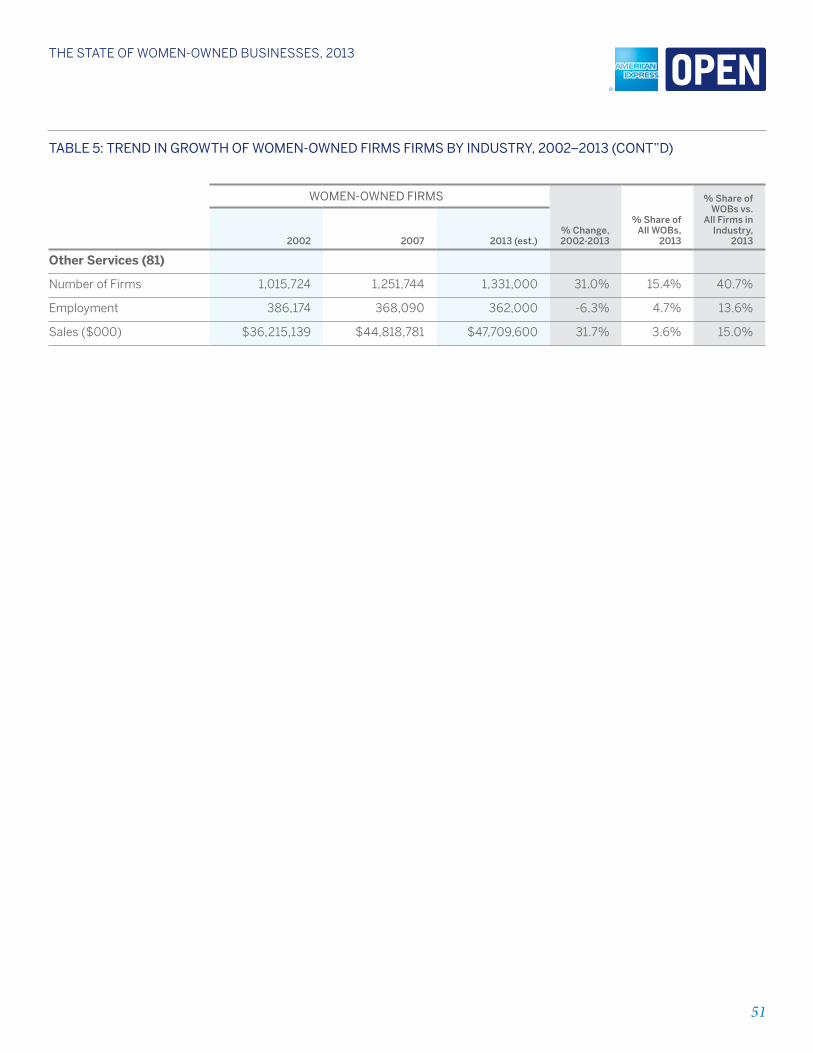
51
THE STaTE of WomEn-oWnEd BuSinESSES, 2013
Table 5: Trend in GroWTh of Women-oWned firmS firmS by induSTry, 2002–2013 (conT”d)
Women-oWned firmS
% change, 2002-2013
% Share of All woBs,
2013
% Share of woBs vs.
All firms in Industry,
20132002 2007 2013 (est.)
Other Services (81)
Number of firms 1,015,724 1,251,744 1,331,000 31.0% 15.4% 40.7%
Employment 386,174 368,090 362,000 -6.3% 4.7% 13.6%
Sales ($000) $36,215,139 $44,818,781 $47,709,600 31.7% 3.6% 15.0%
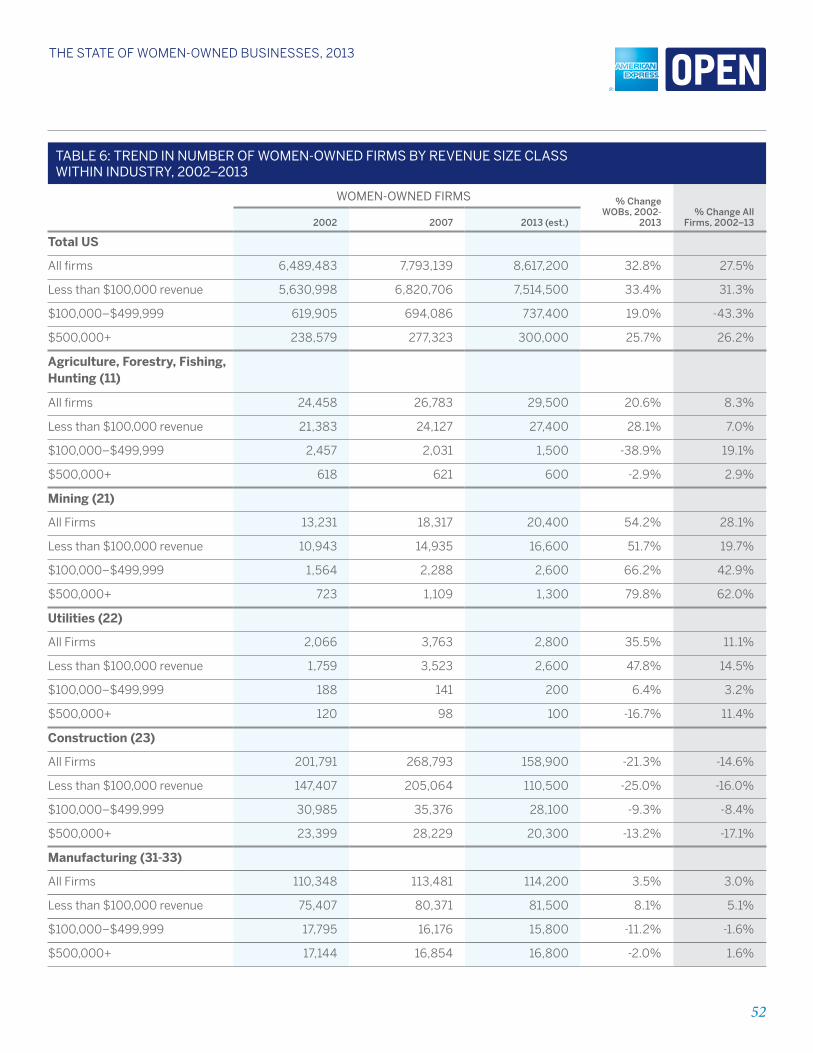
52
THE STaTE of WomEn-oWnEd BuSinESSES, 2013
Table 6: Trend in number of Women-oWned firmS by revenue Size claSS WiThin induSTry, 2002–2013
Women-oWned firmS % change woBs, 2002-
2013% change All
firms, 2002–132002 2007 2013 (est.)
Total US
All firms 6,489,483 7,793,139 8,617,200 32.8% 27.5%
less than $100,000 revenue 5,630,998 6,820,706 7,514,500 33.4% 31.3%
$100,000–$499,999 619,905 694,086 737,400 19.0% -43.3%
$500,000+ 238,579 277,323 300,000 25.7% 26.2%
Agriculture, Forestry, Fishing, Hunting (11)
All firms 24,458 26,783 29,500 20.6% 8.3%
less than $100,000 revenue 21,383 24,127 27,400 28.1% 7.0%
$100,000–$499,999 2,457 2,031 1,500 -38.9% 19.1%
$500,000+ 618 621 600 -2.9% 2.9%
Mining (21)
All firms 13,231 18,317 20,400 54.2% 28.1%
less than $100,000 revenue 10,943 14,935 16,600 51.7% 19.7%
$100,000–$499,999 1,564 2,288 2,600 66.2% 42.9%
$500,000+ 723 1,109 1,300 79.8% 62.0%
Utilities (22)
All firms 2,066 3,763 2,800 35.5% 11.1%
less than $100,000 revenue 1,759 3,523 2,600 47.8% 14.5%
$100,000–$499,999 188 141 200 6.4% 3.2%
$500,000+ 120 98 100 -16.7% 11.4%
Construction (23)
All firms 201,791 268,793 158,900 -21.3% -14.6%
less than $100,000 revenue 147,407 205,064 110,500 -25.0% -16.0%
$100,000–$499,999 30,985 35,376 28,100 -9.3% -8.4%
$500,000+ 23,399 28,229 20,300 -13.2% -17.1%
Manufacturing (31-33)
All firms 110,348 113,481 114,200 3.5% 3.0%
less than $100,000 revenue 75,407 80,371 81,500 8.1% 5.1%
$100,000–$499,999 17,795 16,176 15,800 -11.2% -1.6%
$500,000+ 17,144 16,854 16,800 -2.0% 1.6%
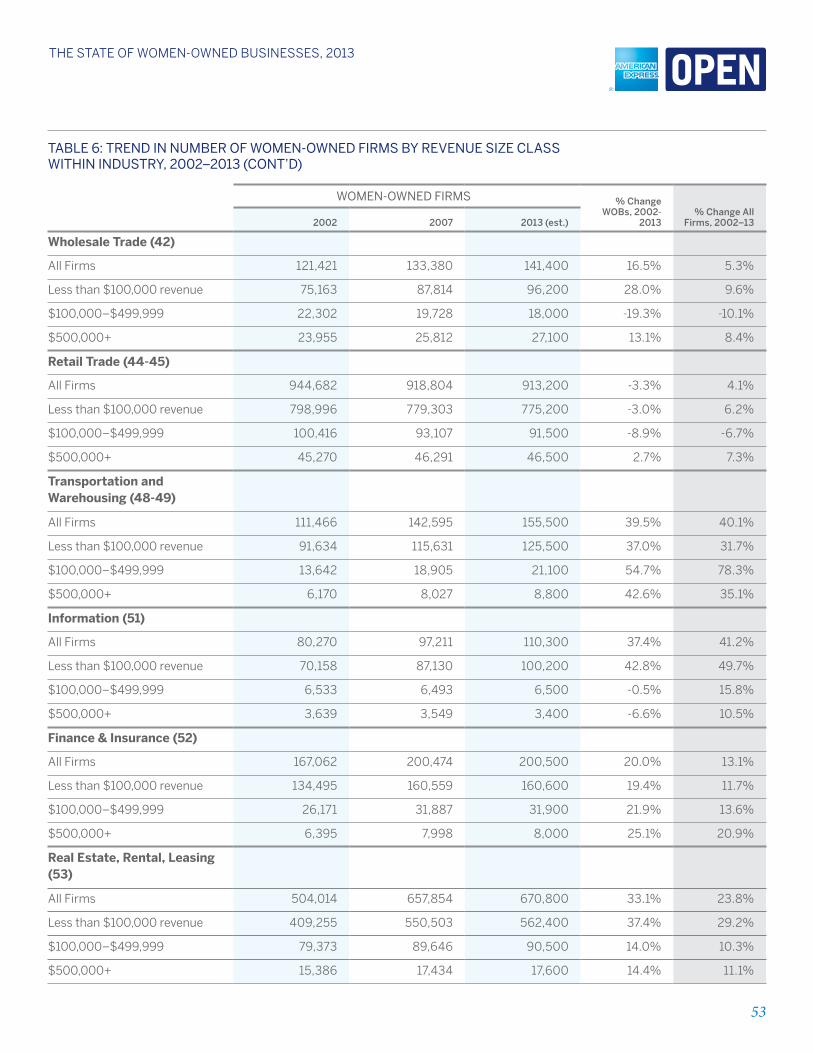
53
THE STaTE of WomEn-oWnEd BuSinESSES, 2013
Table 6: Trend in number of Women-oWned firmS by revenue Size claSS WiThin induSTry, 2002–2013 (conT’d)
Women-oWned firmS % change woBs, 2002-
2013% change All
firms, 2002–132002 2007 2013 (est.)
Wholesale Trade (42)
All firms 121,421 133,380 141,400 16.5% 5.3%
less than $100,000 revenue 75,163 87,814 96,200 28.0% 9.6%
$100,000–$499,999 22,302 19,728 18,000 -19.3% -10.1%
$500,000+ 23,955 25,812 27,100 13.1% 8.4%
Retail Trade (44-45)
All firms 944,682 918,804 913,200 -3.3% 4.1%
less than $100,000 revenue 798,996 779,303 775,200 -3.0% 6.2%
$100,000–$499,999 100,416 93,107 91,500 -8.9% -6.7%
$500,000+ 45,270 46,291 46,500 2.7% 7.3%
Transportation and Warehousing (48-49)
All firms 111,466 142,595 155,500 39.5% 40.1%
less than $100,000 revenue 91,634 115,631 125,500 37.0% 31.7%
$100,000–$499,999 13,642 18,905 21,100 54.7% 78.3%
$500,000+ 6,170 8,027 8,800 42.6% 35.1%
Information (51)
All firms 80,270 97,211 110,300 37.4% 41.2%
less than $100,000 revenue 70,158 87,130 100,200 42.8% 49.7%
$100,000–$499,999 6,533 6,493 6,500 -0.5% 15.8%
$500,000+ 3,639 3,549 3,400 -6.6% 10.5%
Finance & Insurance (52)
All firms 167,062 200,474 200,500 20.0% 13.1%
less than $100,000 revenue 134,495 160,559 160,600 19.4% 11.7%
$100,000–$499,999 26,171 31,887 31,900 21.9% 13.6%
$500,000+ 6,395 7,998 8,000 25.1% 20.9%
Real Estate, Rental, Leasing (53)
All firms 504,014 657,854 670,800 33.1% 23.8%
less than $100,000 revenue 409,255 550,503 562,400 37.4% 29.2%
$100,000–$499,999 79,373 89,646 90,500 14.0% 10.3%
$500,000+ 15,386 17,434 17,600 14.4% 11.1%
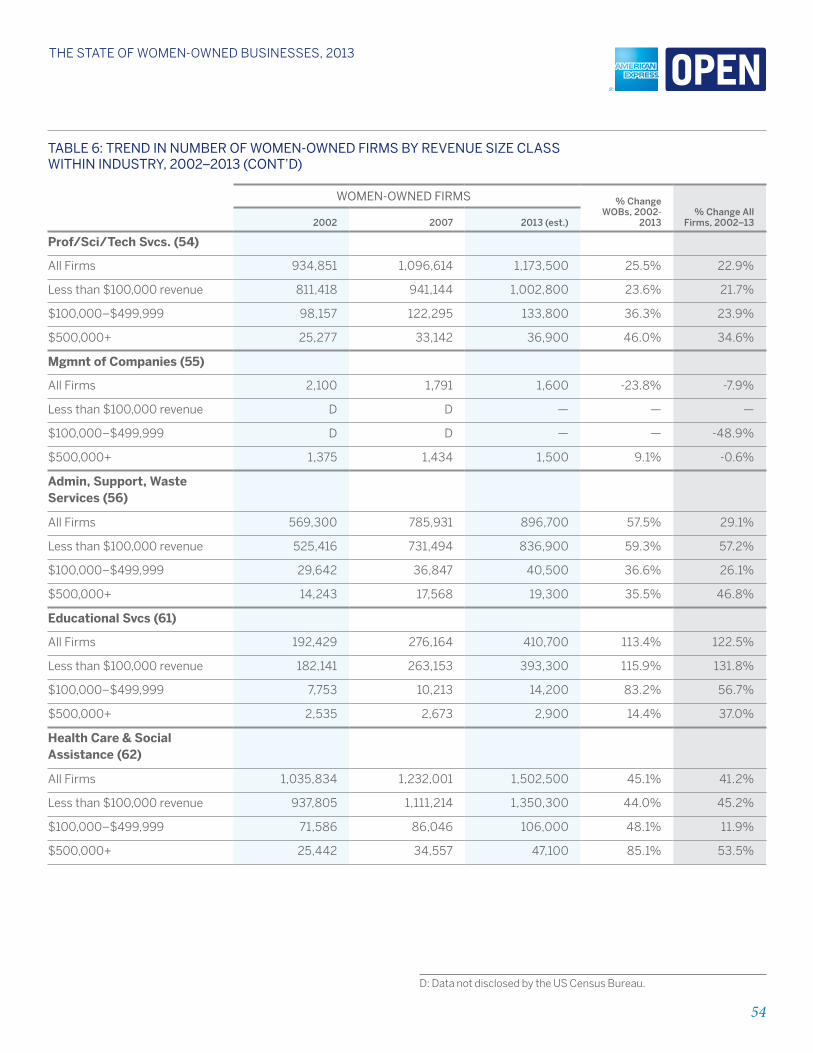
54
THE STaTE of WomEn-oWnEd BuSinESSES, 2013
D: Data not disclosed by the US Census Bureau.
Table 6: Trend in number of Women-oWned firmS by revenue Size claSS WiThin induSTry, 2002–2013 (conT’d)
Women-oWned firmS % change woBs, 2002-
2013% change All
firms, 2002–132002 2007 2013 (est.)
Prof/Sci/Tech Svcs. (54)
All firms 934,851 1,096,614 1,173,500 25.5% 22.9%
less than $100,000 revenue 811,418 941,144 1,002,800 23.6% 21.7%
$100,000–$499,999 98,157 122,295 133,800 36.3% 23.9%
$500,000+ 25,277 33,142 36,900 46.0% 34.6%
Mgmnt of Companies (55)
All firms 2,100 1,791 1,600 -23.8% -7.9%
less than $100,000 revenue D D — — —
$100,000–$499,999 D D — — -48.9%
$500,000+ 1,375 1,434 1,500 9.1% -0.6%
Admin, Support, Waste Services (56)
All firms 569,300 785,931 896,700 57.5% 29.1%
less than $100,000 revenue 525,416 731,494 836,900 59.3% 57.2%
$100,000–$499,999 29,642 36,847 40,500 36.6% 26.1%
$500,000+ 14,243 17,568 19,300 35.5% 46.8%
Educational Svcs (61)
All firms 192,429 276,164 410,700 113.4% 122.5%
less than $100,000 revenue 182,141 263,153 393,300 115.9% 131.8%
$100,000–$499,999 7,753 10,213 14,200 83.2% 56.7%
$500,000+ 2,535 2,673 2,900 14.4% 37.0%
Health Care & Social Assistance (62)
All firms 1,035,834 1,232,001 1,502,500 45.1% 41.2%
less than $100,000 revenue 937,805 1,111,214 1,350,300 44.0% 45.2%
$100,000–$499,999 71,586 86,046 106,000 48.1% 11.9%
$500,000+ 25,442 34,557 47,100 85.1% 53.5%
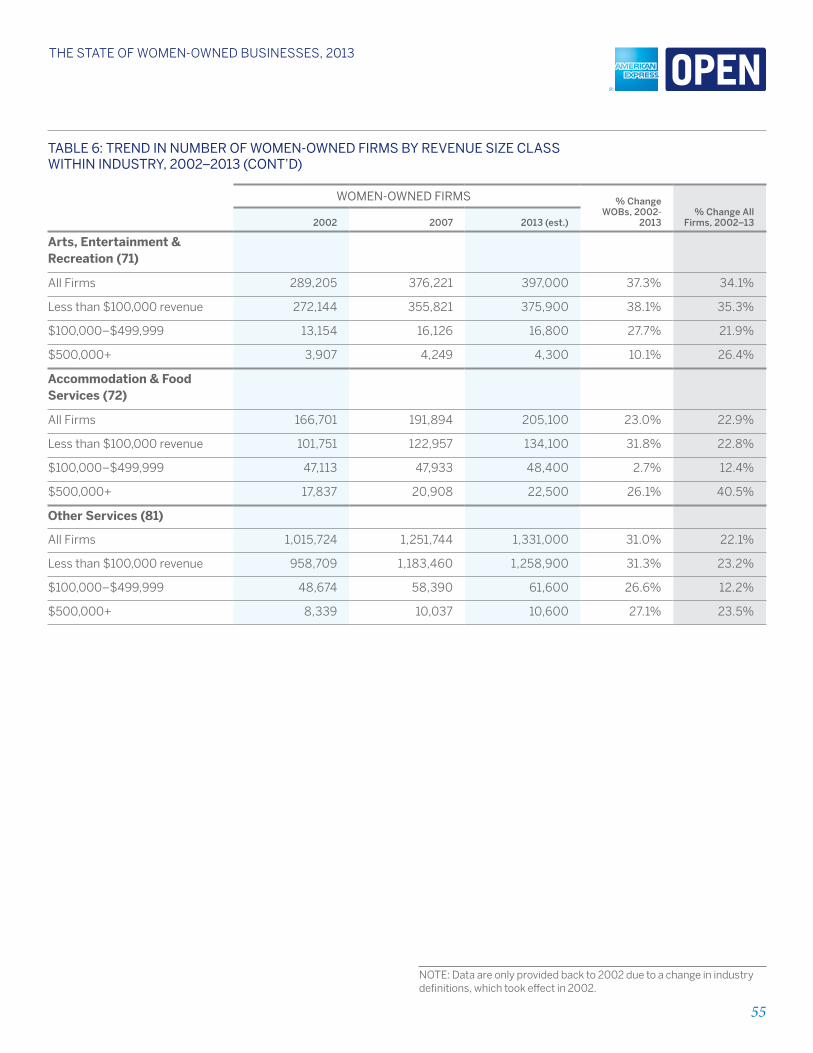
55
THE STaTE of WomEn-oWnEd BuSinESSES, 2013
NOTE: Data are only provided back to 2002 due to a change in industry definitions, which took effect in 2002.
Table 6: Trend in number of Women-oWned firmS by revenue Size claSS WiThin induSTry, 2002–2013 (conT’d)
Women-oWned firmS % change woBs, 2002-
2013% change All
firms, 2002–132002 2007 2013 (est.)
Arts, Entertainment & Recreation (71)
All firms 289,205 376,221 397,000 37.3% 34.1%
less than $100,000 revenue 272,144 355,821 375,900 38.1% 35.3%
$100,000–$499,999 13,154 16,126 16,800 27.7% 21.9%
$500,000+ 3,907 4,249 4,300 10.1% 26.4%
Accommodation & Food Services (72)
All firms 166,701 191,894 205,100 23.0% 22.9%
less than $100,000 revenue 101,751 122,957 134,100 31.8% 22.8%
$100,000–$499,999 47,113 47,933 48,400 2.7% 12.4%
$500,000+ 17,837 20,908 22,500 26.1% 40.5%
Other Services (81)
All firms 1,015,724 1,251,744 1,331,000 31.0% 22.1%
less than $100,000 revenue 958,709 1,183,460 1,258,900 31.3% 23.2%
$100,000–$499,999 48,674 58,390 61,600 26.6% 12.2%
$500,000+ 8,339 10,037 10,600 27.1% 23.5%
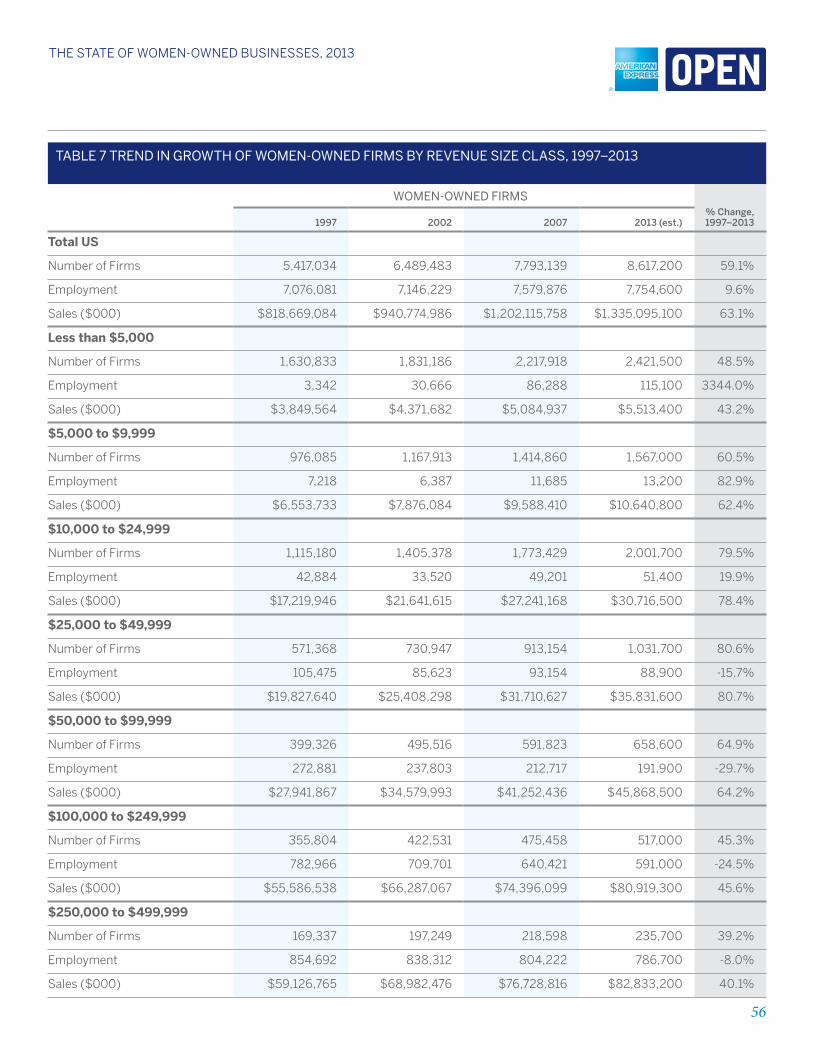
56
THE STaTE of WomEn-oWnEd BuSinESSES, 2013
Table 7 Trend in GroWTh of Women-oWned firmS by revenue Size claSS, 1997–2013
Women-oWned firmS % change, 1997–20131997 2002 2007 2013 (est.)
Total US
Number of firms 5,417,034 6,489,483 7,793,139 8,617,200 59.1%
Employment 7,076,081 7,146,229 7,579,876 7,754,600 9.6%
Sales ($000) $818,669,084 $940,774,986 $1,202,115,758 $1,335,095,100 63.1%
Less than $5,000
Number of firms 1,630,833 1,831,186 2,217,918 2,421,500 48.5%
Employment 3,342 30,666 86,288 115,100 3344.0%
Sales ($000) $3,849,564 $4,371,682 $5,084,937 $5,513,400 43.2%
$5,000 to $9,999
Number of firms 976,085 1,167,913 1,414,860 1,567,000 60.5%
Employment 7,218 6,387 11,685 13,200 82.9%
Sales ($000) $6,553,733 $7,876,084 $9,588,410 $10,640,800 62.4%
$10,000 to $24,999
Number of firms 1,115,180 1,405,378 1,773,429 2,001,700 79.5%
Employment 42,884 33,520 49,201 51,400 19.9%
Sales ($000) $17,219,946 $21,641,615 $27,241,168 $30,716,500 78.4%
$25,000 to $49,999
Number of firms 571,368 730,947 913,154 1,031,700 80.6%
Employment 105,475 85,623 93,154 88,900 -15.7%
Sales ($000) $19,827,640 $25,408,298 $31,710,627 $35,831,600 80.7%
$50,000 to $99,999
Number of firms 399,326 495,516 591,823 658,600 64.9%
Employment 272,881 237,803 212,717 191,900 -29.7%
Sales ($000) $27,941,867 $34,579,993 $41,252,436 $45,868,500 64.2%
$100,000 to $249,999
Number of firms 355,804 422,531 475,458 517,000 45.3%
Employment 782,966 709,701 640,421 591,000 -24.5%
Sales ($000) $55,586,538 $66,287,067 $74,396,099 $80,919,300 45.6%
$250,000 to $499,999
Number of firms 169,337 197,249 218,598 235,700 39.2%
Employment 854,692 838,312 804,222 786,700 -8.0%
Sales ($000) $59,126,765 $68,982,476 $76,728,816 $82,833,200 40.1%
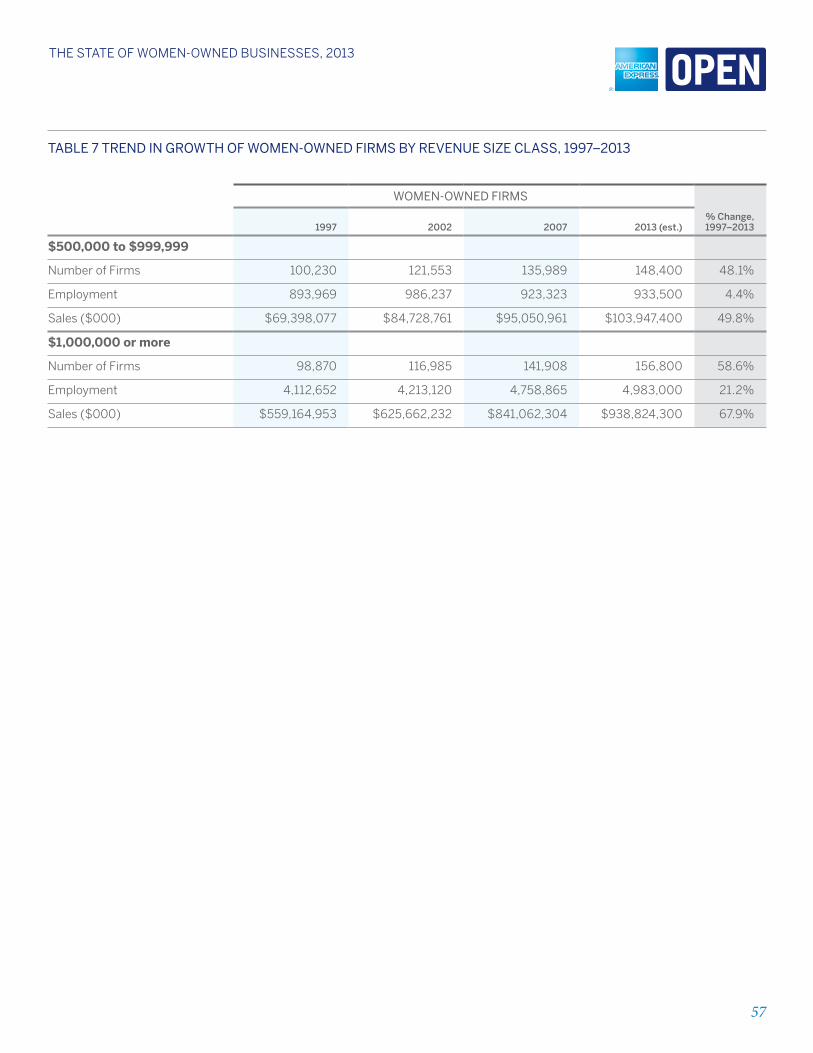
57
THE STaTE of WomEn-oWnEd BuSinESSES, 2013
Table 7 Trend in GroWTh of Women-oWned firmS by revenue Size claSS, 1997–2013
Women-oWned firmS
1997 2002 2007 2013 (est.) % change, 1997–2013
$500,000 to $999,999
Number of firms 100,230 121,553 135,989 148,400 48.1%
Employment 893,969 986,237 923,323 933,500 4.4%
Sales ($000) $69,398,077 $84,728,761 $95,050,961 $103,947,400 49.8%
$1,000,000 or more
Number of firms 98,870 116,985 141,908 156,800 58.6%
Employment 4,112,652 4,213,120 4,758,865 4,983,000 21.2%
Sales ($000) $559,164,953 $625,662,232 $841,062,304 $938,824,300 67.9%
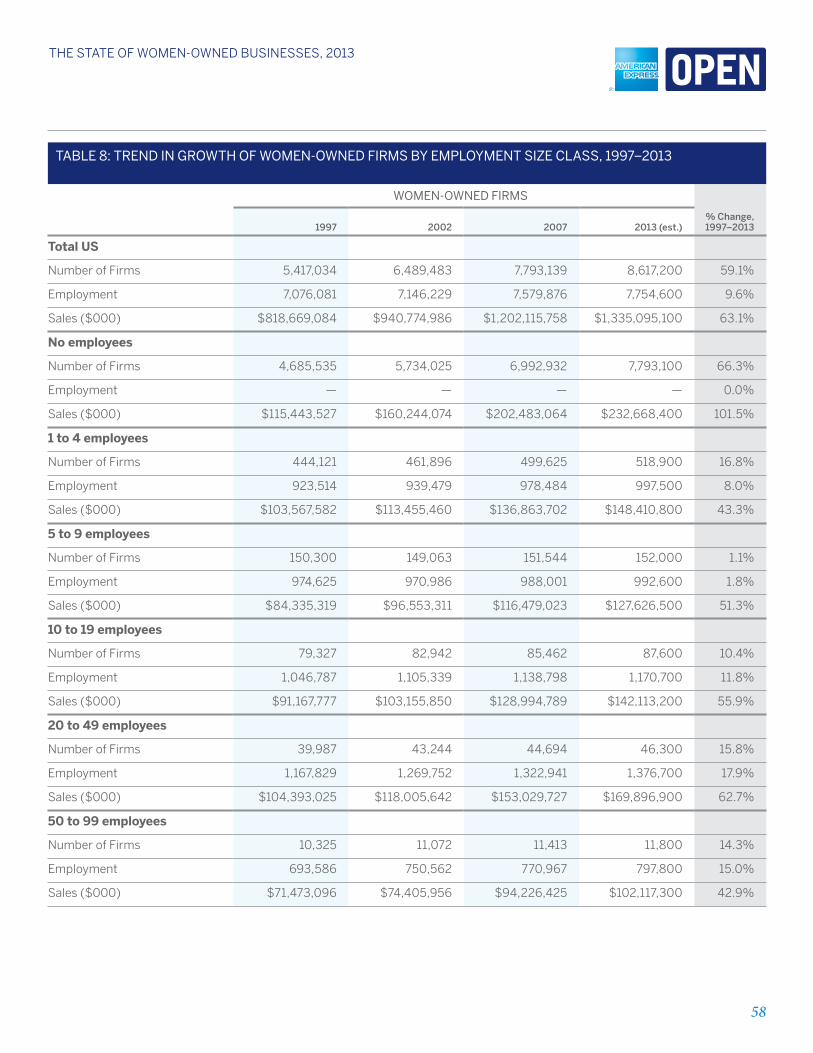
58
THE STaTE of WomEn-oWnEd BuSinESSES, 2013
Table 8: Trend in GroWTh of Women-oWned firmS by employmenT Size claSS, 1997–2013
Women-oWned firmS
1997 2002 2007 2013 (est.) % change, 1997–2013
Total US
Number of firms 5,417,034 6,489,483 7,793,139 8,617,200 59.1%
Employment 7,076,081 7,146,229 7,579,876 7,754,600 9.6%
Sales ($000) $818,669,084 $940,774,986 $1,202,115,758 $1,335,095,100 63.1%
No employees
Number of firms 4,685,535 5,734,025 6,992,932 7,793,100 66.3%
Employment — — — — 0.0%
Sales ($000) $115,443,527 $160,244,074 $202,483,064 $232,668,400 101.5%
1 to 4 employees
Number of firms 444,121 461,896 499,625 518,900 16.8%
Employment 923,514 939,479 978,484 997,500 8.0%
Sales ($000) $103,567,582 $113,455,460 $136,863,702 $148,410,800 43.3%
5 to 9 employees
Number of firms 150,300 149,063 151,544 152,000 1.1%
Employment 974,625 970,986 988,001 992,600 1.8%
Sales ($000) $84,335,319 $96,553,311 $116,479,023 $127,626,500 51.3%
10 to 19 employees
Number of firms 79,327 82,942 85,462 87,600 10.4%
Employment 1,046,787 1,105,339 1,138,798 1,170,700 11.8%
Sales ($000) $91,167,777 $103,155,850 $128,994,789 $142,113,200 55.9%
20 to 49 employees
Number of firms 39,987 43,244 44,694 46,300 15.8%
Employment 1,167,829 1,269,752 1,322,941 1,376,700 17.9%
Sales ($000) $104,393,025 $118,005,642 $153,029,727 $169,896,900 62.7%
50 to 99 employees
Number of firms 10,325 11,072 11,413 11,800 14.3%
Employment 693,586 750,562 770,967 797,800 15.0%
Sales ($000) $71,473,096 $74,405,956 $94,226,425 $102,117,300 42.9%
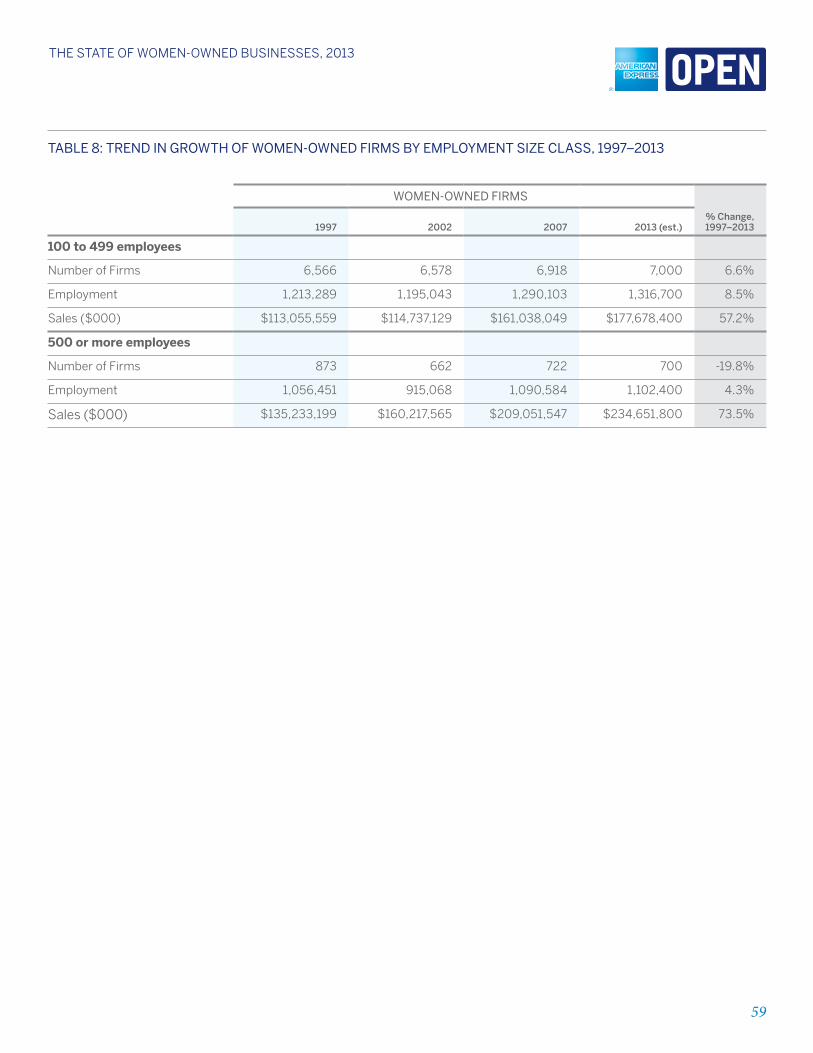
59
THE STaTE of WomEn-oWnEd BuSinESSES, 2013
Table 8: Trend in GroWTh of Women-oWned firmS by employmenT Size claSS, 1997–2013
Women-oWned firmS
1997 2002 2007 2013 (est.) % change, 1997–2013
100 to 499 employees
Number of firms 6,566 6,578 6,918 7,000 6.6%
Employment 1,213,289 1,195,043 1,290,103 1,316,700 8.5%
Sales ($000) $113,055,559 $114,737,129 $161,038,049 $177,678,400 57.2%
500 or more employees
Number of firms 873 662 722 700 -19.8%
Employment 1,056,451 915,068 1,090,584 1,102,400 4.3%
Sales ($000) $135,233,199 $160,217,565 $209,051,547 $234,651,800 73.5%
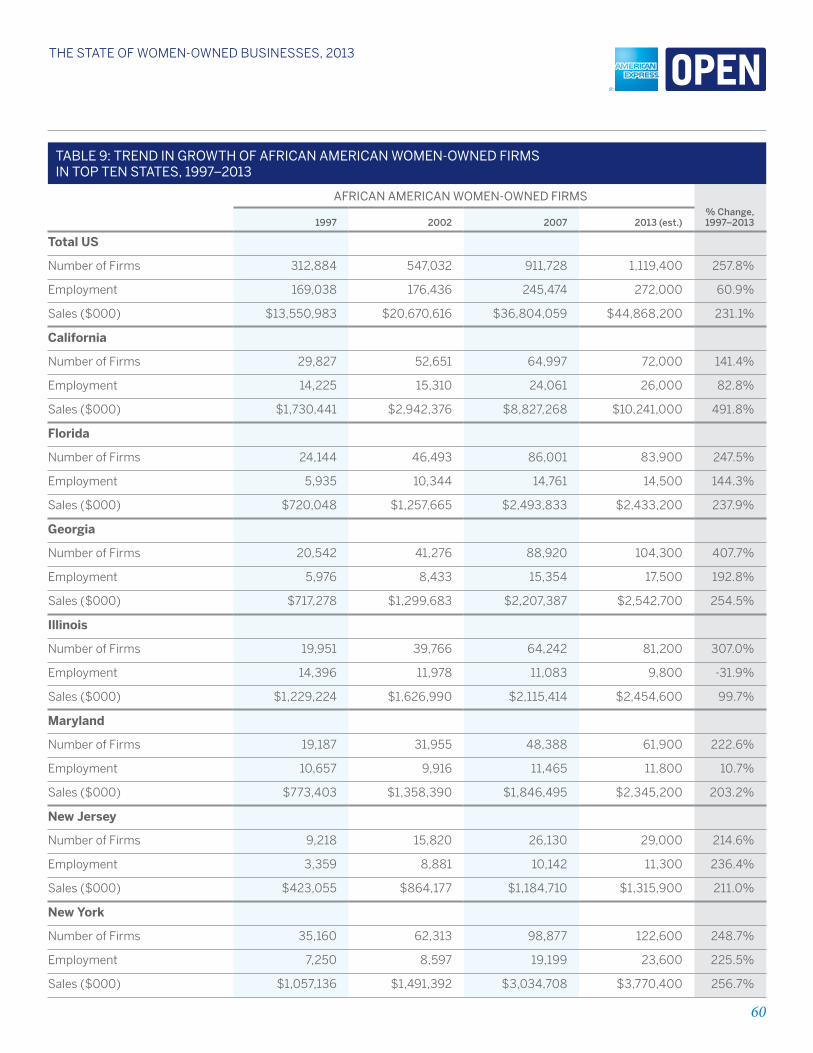
60
THE STaTE of WomEn-oWnEd BuSinESSES, 2013
Table 9: Trend in GroWTh of african american Women-oWned firmS in Top Ten STaTeS, 1997–2013
african american Women-oWned firmS % change, 1997–20131997 2002 2007 2013 (est.)
Total US
Number of firms 312,884 547,032 911,728 1,119,400 257.8%
Employment 169,038 176,436 245,474 272,000 60.9%
Sales ($000) $13,550,983 $20,670,616 $36,804,059 $44,868,200 231.1%
California
Number of firms 29,827 52,651 64,997 72,000 141.4%
Employment 14,225 15,310 24,061 26,000 82.8%
Sales ($000) $1,730,441 $2,942,376 $8,827,268 $10,241,000 491.8%
Florida
Number of firms 24,144 46,493 86,001 83,900 247.5%
Employment 5,935 10,344 14,761 14,500 144.3%
Sales ($000) $720,048 $1,257,665 $2,493,833 $2,433,200 237.9%
Georgia
Number of firms 20,542 41,276 88,920 104,300 407.7%
Employment 5,976 8,433 15,354 17,500 192.8%
Sales ($000) $717,278 $1,299,683 $2,207,387 $2,542,700 254.5%
Illinois
Number of firms 19,951 39,766 64,242 81,200 307.0%
Employment 14,396 11,978 11,083 9,800 -31.9%
Sales ($000) $1,229,224 $1,626,990 $2,115,414 $2,454,600 99.7%
Maryland
Number of firms 19,187 31,955 48,388 61,900 222.6%
Employment 10,657 9,916 11,465 11,800 10.7%
Sales ($000) $773,403 $1,358,390 $1,846,495 $2,345,200 203.2%
New Jersey
Number of firms 9,218 15,820 26,130 29,000 214.6%
Employment 3,359 8,881 10,142 11,300 236.4%
Sales ($000) $423,055 $864,177 $1,184,710 $1,315,900 211.0%
New York
Number of firms 35,160 62,313 98,877 122,600 248.7%
Employment 7,250 8,597 19,199 23,600 225.5%
Sales ($000) $1,057,136 $1,491,392 $3,034,708 $3,770,400 256.7%
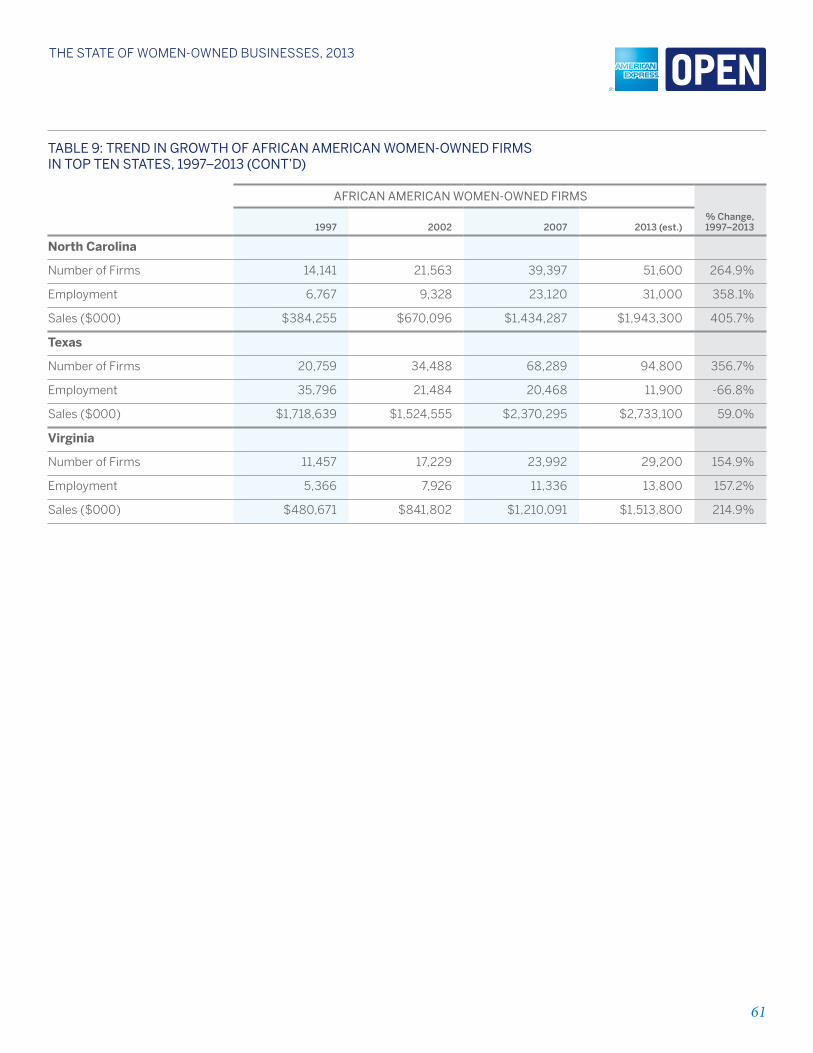
61
THE STaTE of WomEn-oWnEd BuSinESSES, 2013
Table 9: Trend in GroWTh of african american Women-oWned firmS in Top Ten STaTeS, 1997–2013 (conT’d)
african american Women-oWned firmS
1997 2002 2007 2013 (est.) % change, 1997–2013
North Carolina
Number of firms 14,141 21,563 39,397 51,600 264.9%
Employment 6,767 9,328 23,120 31,000 358.1%
Sales ($000) $384,255 $670,096 $1,434,287 $1,943,300 405.7%
Texas
Number of firms 20,759 34,488 68,289 94,800 356.7%
Employment 35,796 21,484 20,468 11,900 -66.8%
Sales ($000) $1,718,639 $1,524,555 $2,370,295 $2,733,100 59.0%
Virginia
Number of firms 11,457 17,229 23,992 29,200 154.9%
Employment 5,366 7,926 11,336 13,800 157.2%
Sales ($000) $480,671 $841,802 $1,210,091 $1,513,800 214.9%
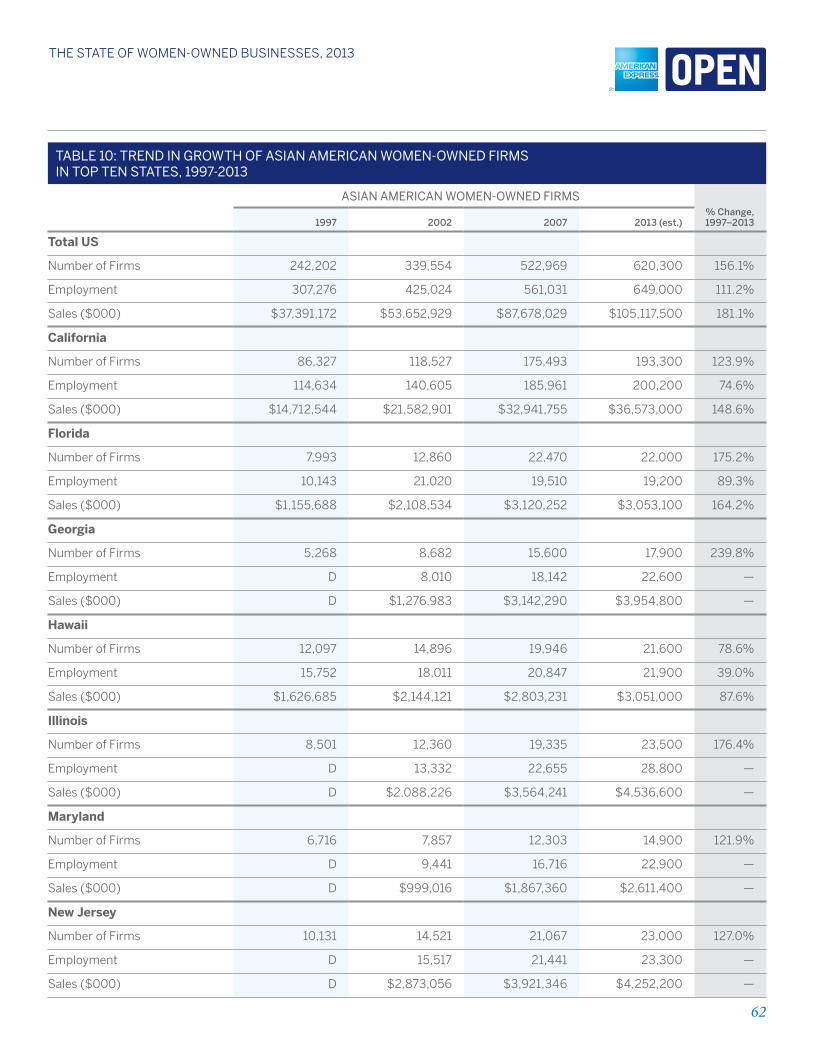
62
THE STaTE of WomEn-oWnEd BuSinESSES, 2013
Table 10: Trend in GroWTh of aSian american Women-oWned firmS in Top Ten STaTeS, 1997-2013
aSian american Women-oWned firmS % change, 1997–20131997 2002 2007 2013 (est.)
Total US
Number of firms 242,202 339,554 522,969 620,300 156.1%
Employment 307,276 425,024 561,031 649,000 111.2%
Sales ($000) $37,391,172 $53,652,929 $87,678,029 $105,117,500 181.1%
California
Number of firms 86,327 118,527 175,493 193,300 123.9%
Employment 114,634 140,605 185,961 200,200 74.6%
Sales ($000) $14,712,544 $21,582,901 $32,941,755 $36,573,000 148.6%
Florida
Number of firms 7,993 12,860 22,470 22,000 175.2%
Employment 10,143 21,020 19,510 19,200 89.3%
Sales ($000) $1,155,688 $2,108,534 $3,120,252 $3,053,100 164.2%
Georgia
Number of firms 5,268 8,682 15,600 17,900 239.8%
Employment D 8,010 18,142 22,600 —
Sales ($000) D $1,276,983 $3,142,290 $3,954,800 —
Hawaii
Number of firms 12,097 14,896 19,946 21,600 78.6%
Employment 15,752 18,011 20,847 21,900 39.0%
Sales ($000) $1,626,685 $2,144,121 $2,803,231 $3,051,000 87.6%
Illinois
Number of firms 8,501 12,360 19,335 23,500 176.4%
Employment D 13,332 22,655 28,800 —
Sales ($000) D $2,088,226 $3,564,241 $4,536,600 —
Maryland
Number of firms 6,716 7,857 12,303 14,900 121.9%
Employment D 9,441 16,716 22,900 —
Sales ($000) D $999,016 $1,867,360 $2,611,400 —
New Jersey
Number of firms 10,131 14,521 21,067 23,000 127.0%
Employment D 15,517 21,441 23,300 —
Sales ($000) D $2,873,056 $3,921,346 $4,252,200 —
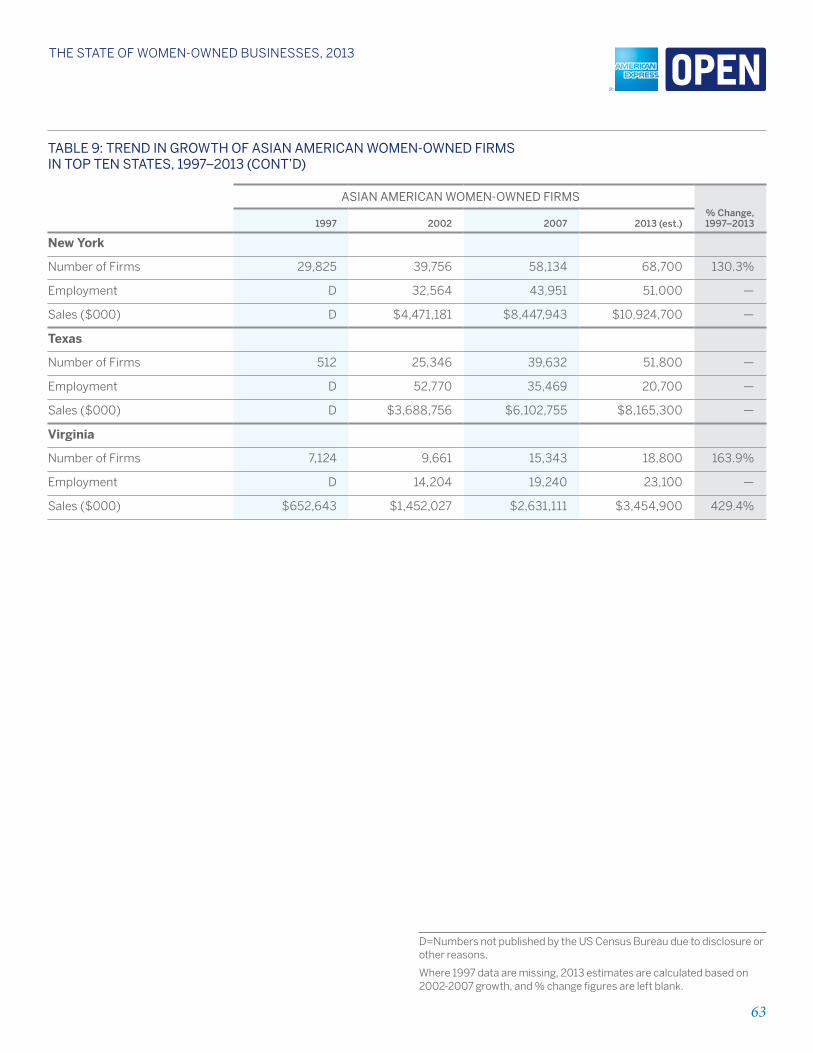
63
THE STaTE of WomEn-oWnEd BuSinESSES, 2013
Table 9: Trend in GroWTh of aSian american Women-oWned firmS in Top Ten STaTeS, 1997–2013 (conT’d)
aSian american Women-oWned firmS % change, 1997–20131997 2002 2007 2013 (est.)
New York
Number of firms 29,825 39,756 58,134 68,700 130.3%
Employment D 32,564 43,951 51,000 —
Sales ($000) D $4,471,181 $8,447,943 $10,924,700 —
Texas
Number of firms 512 25,346 39,632 51,800 —
Employment D 52,770 35,469 20,700 —
Sales ($000) D $3,688,756 $6,102,755 $8,165,300 —
Virginia
Number of firms 7,124 9,661 15,343 18,800 163.9%
Employment D 14,204 19,240 23,100 —
Sales ($000) $652,643 $1,452,027 $2,631,111 $3,454,900 429.4%
D=Numbers not published by the US Census Bureau due to disclosure or other reasons.
Where 1997 data are missing, 2013 estimates are calculated based on 2002-2007 growth, and % change figures are left blank.
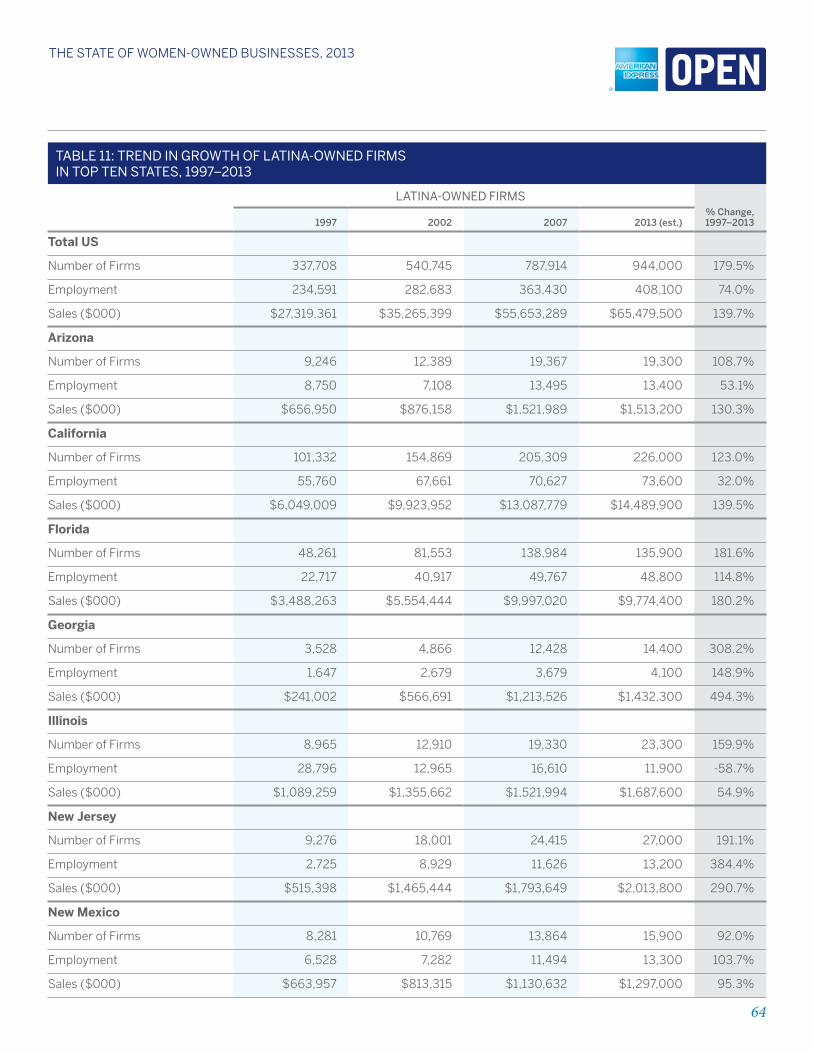
64
THE STaTE of WomEn-oWnEd BuSinESSES, 2013
Table 11: Trend in GroWTh of laTina-oWned firmS in Top Ten STaTeS, 1997–2013
laTina-oWned firmS % change, 1997–20131997 2002 2007 2013 (est.)
Total US
Number of firms 337,708 540,745 787,914 944,000 179.5%
Employment 234,591 282,683 363,430 408,100 74.0%
Sales ($000) $27,319,361 $35,265,399 $55,653,289 $65,479,500 139.7%
Arizona
Number of firms 9,246 12,389 19,367 19,300 108.7%
Employment 8,750 7,108 13,495 13,400 53.1%
Sales ($000) $656,950 $876,158 $1,521,989 $1,513,200 130.3%
California
Number of firms 101,332 154,869 205,309 226,000 123.0%
Employment 55,760 67,661 70,627 73,600 32.0%
Sales ($000) $6,049,009 $9,923,952 $13,087,779 $14,489,900 139.5%
Florida
Number of firms 48,261 81,553 138,984 135,900 181.6%
Employment 22,717 40,917 49,767 48,800 114.8%
Sales ($000) $3,488,263 $5,554,444 $9,997,020 $9,774,400 180.2%
Georgia
Number of firms 3,528 4,866 12,428 14,400 308.2%
Employment 1,647 2,679 3,679 4,100 148.9%
Sales ($000) $241,002 $566,691 $1,213,526 $1,432,300 494.3%
Illinois
Number of firms 8,965 12,910 19,330 23,300 159.9%
Employment 28,796 12,965 16,610 11,900 -58.7%
Sales ($000) $1,089,259 $1,355,662 $1,521,994 $1,687,600 54.9%
New Jersey
Number of firms 9,276 18,001 24,415 27,000 191.1%
Employment 2,725 8,929 11,626 13,200 384.4%
Sales ($000) $515,398 $1,465,444 $1,793,649 $2,013,800 290.7%
New Mexico
Number of firms 8,281 10,769 13,864 15,900 92.0%
Employment 6,528 7,282 11,494 13,300 103.7%
Sales ($000) $663,957 $813,315 $1,130,632 $1,297,000 95.3%
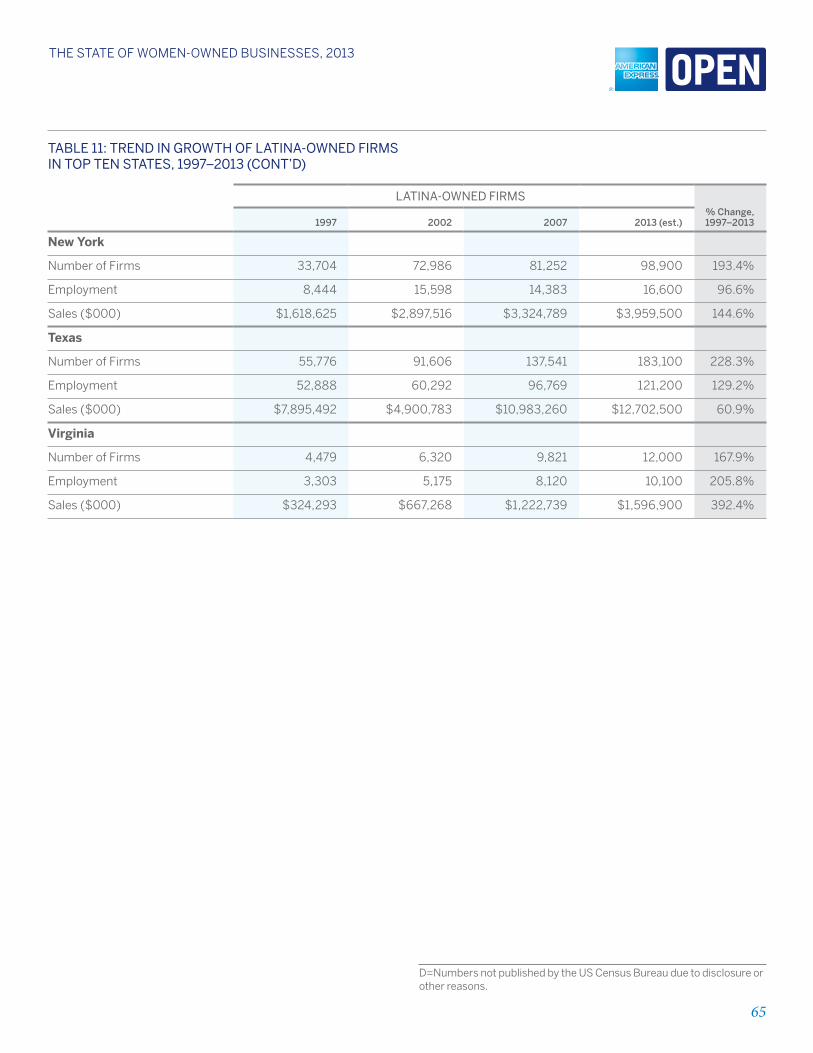
65
THE STaTE of WomEn-oWnEd BuSinESSES, 2013
Table 11: Trend in GroWTh of laTina-oWned firmS in Top Ten STaTeS, 1997–2013 (conT’d)
laTina-oWned firmS % change, 1997–20131997 2002 2007 2013 (est.)
New York
Number of firms 33,704 72,986 81,252 98,900 193.4%
Employment 8,444 15,598 14,383 16,600 96.6%
Sales ($000) $1,618,625 $2,897,516 $3,324,789 $3,959,500 144.6%
Texas
Number of firms 55,776 91,606 137,541 183,100 228.3%
Employment 52,888 60,292 96,769 121,200 129.2%
Sales ($000) $7,895,492 $4,900,783 $10,983,260 $12,702,500 60.9%
Virginia
Number of firms 4,479 6,320 9,821 12,000 167.9%
Employment 3,303 5,175 8,120 10,100 205.8%
Sales ($000) $324,293 $667,268 $1,222,739 $1,596,900 392.4%
D=Numbers not published by the US Census Bureau due to disclosure or other reasons.
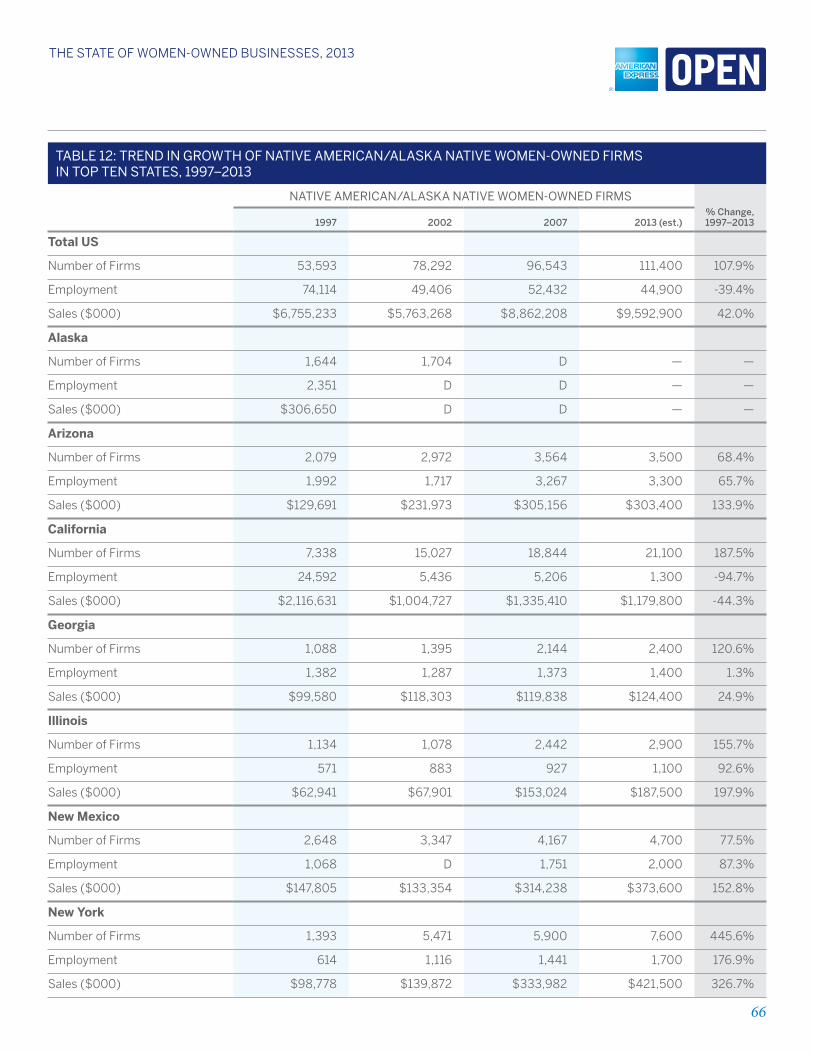
66
THE STaTE of WomEn-oWnEd BuSinESSES, 2013
Table 12: Trend in GroWTh of naTive american/alaSKa naTive Women-oWned firmS in Top Ten STaTeS, 1997–2013
naTive american/alaSKa naTive Women-oWned firmS % change, 1997–20131997 2002 2007 2013 (est.)
Total US
Number of firms 53,593 78,292 96,543 111,400 107.9%
Employment 74,114 49,406 52,432 44,900 -39.4%
Sales ($000) $6,755,233 $5,763,268 $8,862,208 $9,592,900 42.0%
Alaska
Number of firms 1,644 1,704 D — —
Employment 2,351 D D — —
Sales ($000) $306,650 D D — —
Arizona
Number of firms 2,079 2,972 3,564 3,500 68.4%
Employment 1,992 1,717 3,267 3,300 65.7%
Sales ($000) $129,691 $231,973 $305,156 $303,400 133.9%
California
Number of firms 7,338 15,027 18,844 21,100 187.5%
Employment 24,592 5,436 5,206 1,300 -94.7%
Sales ($000) $2,116,631 $1,004,727 $1,335,410 $1,179,800 -44.3%
Georgia
Number of firms 1,088 1,395 2,144 2,400 120.6%
Employment 1,382 1,287 1,373 1,400 1.3%
Sales ($000) $99,580 $118,303 $119,838 $124,400 24.9%
Illinois
Number of firms 1,134 1,078 2,442 2,900 155.7%
Employment 571 883 927 1,100 92.6%
Sales ($000) $62,941 $67,901 $153,024 $187,500 197.9%
New Mexico
Number of firms 2,648 3,347 4,167 4,700 77.5%
Employment 1,068 D 1,751 2,000 87.3%
Sales ($000) $147,805 $133,354 $314,238 $373,600 152.8%
New York
Number of firms 1,393 5,471 5,900 7,600 445.6%
Employment 614 1,116 1,441 1,700 176.9%
Sales ($000) $98,778 $139,872 $333,982 $421,500 326.7%
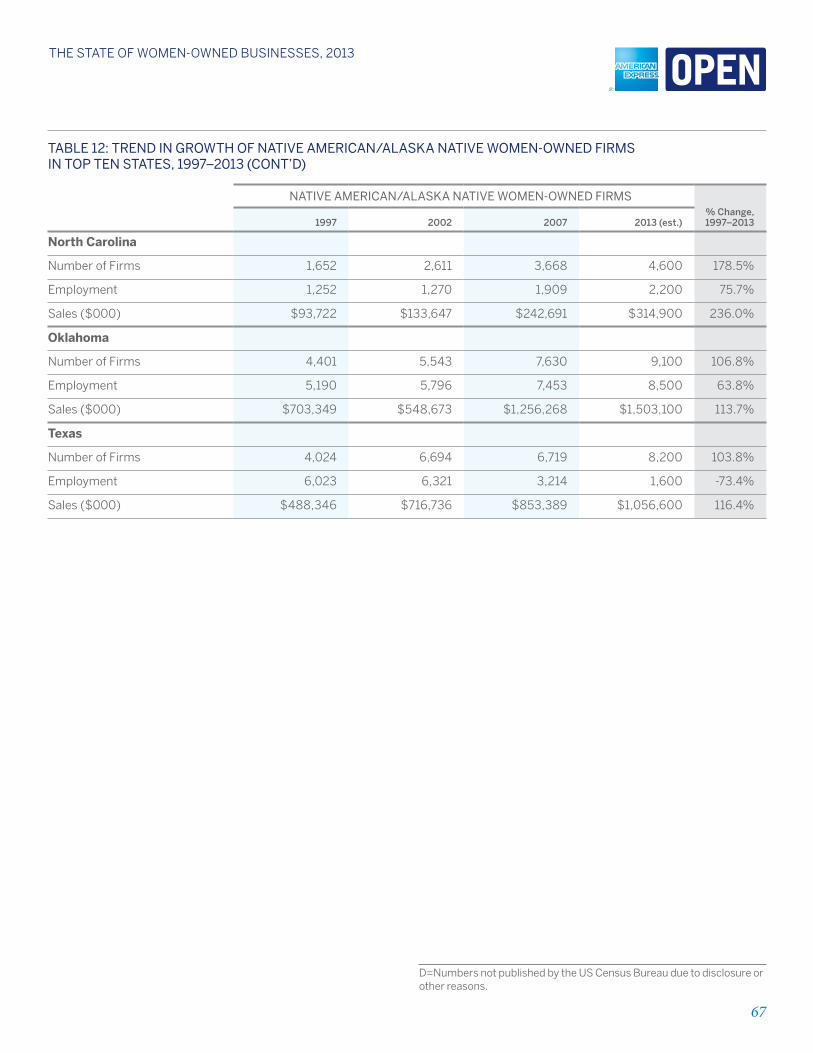
67
THE STaTE of WomEn-oWnEd BuSinESSES, 2013
Table 12: Trend in GroWTh of naTive american/alaSKa naTive Women-oWned firmS in Top Ten STaTeS, 1997–2013 (conT’d)
naTive american/alaSKa naTive Women-oWned firmS % change, 1997–20131997 2002 2007 2013 (est.)
North Carolina
Number of firms 1,652 2,611 3,668 4,600 178.5%
Employment 1,252 1,270 1,909 2,200 75.7%
Sales ($000) $93,722 $133,647 $242,691 $314,900 236.0%
Oklahoma
Number of firms 4,401 5,543 7,630 9,100 106.8%
Employment 5,190 5,796 7,453 8,500 63.8%
Sales ($000) $703,349 $548,673 $1,256,268 $1,503,100 113.7%
Texas
Number of firms 4,024 6,694 6,719 8,200 103.8%
Employment 6,023 6,321 3,214 1,600 -73.4%
Sales ($000) $488,346 $716,736 $853,389 $1,056,600 116.4%
D=Numbers not published by the US Census Bureau due to disclosure or other reasons.
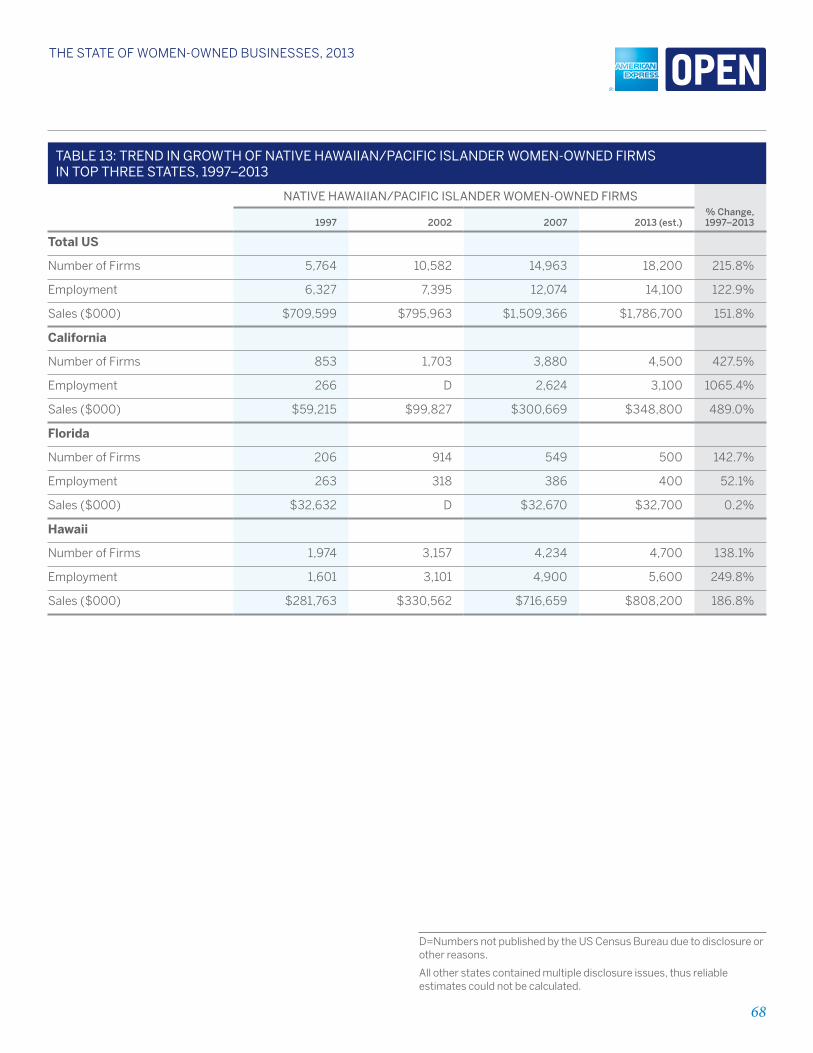
68
THE STaTE of WomEn-oWnEd BuSinESSES, 2013
Table 13: Trend in GroWTh of naTive haWaiian/pacific iSlander Women-oWned firmS in Top Three STaTeS, 1997–2013
naTive haWaiian/pacific iSlander Women-oWned firmS % change, 1997–20131997 2002 2007 2013 (est.)
Total US
Number of firms 5,764 10,582 14,963 18,200 215.8%
Employment 6,327 7,395 12,074 14,100 122.9%
Sales ($000) $709,599 $795,963 $1,509,366 $1,786,700 151.8%
California
Number of firms 853 1,703 3,880 4,500 427.5%
Employment 266 D 2,624 3,100 1065.4%
Sales ($000) $59,215 $99,827 $300,669 $348,800 489.0%
Florida
Number of firms 206 914 549 500 142.7%
Employment 263 318 386 400 52.1%
Sales ($000) $32,632 D $32,670 $32,700 0.2%
Hawaii
Number of firms 1,974 3,157 4,234 4,700 138.1%
Employment 1,601 3,101 4,900 5,600 249.8%
Sales ($000) $281,763 $330,562 $716,659 $808,200 186.8%
D=Numbers not published by the US Census Bureau due to disclosure or other reasons.
All other states contained multiple disclosure issues, thus reliable estimates could not be calculated.