the 1987 aegean dense water formation: a streamtube...
TRANSCRIPT

Marine Geology 375 (2016) 120–133
Contents lists available at ScienceDirect
Marine Geology
j ourna l homepage: www.e lsev ie r .com/ locate /margo
The 1987 Aegean dense water formation: A streamtube investigation bycomparing theoretical model results, satellite, field, and numerical datawith contourite distribution
M. Bellacicco a,b, C. Anagnostou c, F. Falcini a, E. Rinaldi a, K. Tripsanas d, E. Salusti a,⁎a Istituto di Scienze dell'Atmosfera e del Clima (ISAC)-CNR, Via Fosso del Cavaliere 100, Roma, Italyb Università degli Studi di Napoli “Parthenope”, Via Ammiraglio Acton, 38, Napoli, Italyc Hellenic Centre for Marine Research, Institute of Oceanography, 46.7 km Athens-Sounio Av., 19013 Anavyssos, Greeced Geology Home Team, Shell U.K. Limited, Aberdeen, AB 12 3FY, United Kingdom
⁎ Corresponding author.E-mail address: [email protected] (E. Salusti).
http://dx.doi.org/10.1016/j.margeo.2016.01.0120025-3227/© 2016 Elsevier B.V. All rights reserved.
a b s t r a c t
a r t i c l e i n f oArticle history:Received 16 December 2014Received in revised form 13 January 2016Accepted 25 January 2016Available online 27 January 2016
Wehere discuss a detailed investigation of the densewater formation, evolution and spreading in the Aegean Seaduring the year 1987, immediately prior to the onset of the Eastern Mediterranean Transient (EMT).We use hy-drologic data collected during the LIA cruise; satellite images for SST (Sea Surface Temperature), and PROTHEUSdata (a coupled ocean–atmosphere numeric model) along with theoretical streamtube models. These hydrolog-ical analyses are related to late Quaternary sedimentary drifts in the Cyclades Plateau and in the Myrtoon Basin.Our analysis shows that streamtube dynamics provide a novel model of dense water evolution and spreading inthe Aegean Basin. Applying this model to dense water masses observed in winter and spring 1987 near Samo-thrace and over the Limnos-Lesbos Plateau, results in a geostrophic flow of this dense, cold water towards theLimnos-Sporades Channel, in theNorth Aegean Sea. There itmixeswith densewater from the Limnos-Lesbos Pla-teau and finally both move geostrophically towards the Cyclades Plateau. These results indicate that most of thedense water observed near the Cyclades, formed initially about 3 months earlier at Samothrace and Limnosshelves. During its long pathway it partially mixed with adjacent water masses. Although our analysis concernsonly one year of densewater analyses, these results are thought to reflect amore general and recurrent phenom-enon in the Aegean basin. Indeed, high-resolution (Airgun 10 in.) seismic-reflection data from the Cyclades Pla-teau reveal the presence of late Quaternary sediment drifts. These observations are concordant with results fromour theoretical model. This suggests a direct link between such a dense-water cascading and contourite dynam-ics. The continuation of sediment drifts into the deep basinfloor (≈900mdeep) of theMyrtoon Basin, moreover,indicates a cascading character of such bottom currents at the flanks of the basin, a feature that set furtherinvestigations.
© 2016 Elsevier B.V. All rights reserved.
Keywords:EMTAegean SeaDense water formationContourites
1. Introduction
The idea that the Aegean Sea could be the source of the EasternMed-iterranean deep waters was first proposed by Nielsen (1912), but suc-cessive observations demonstrated the main role of the Adriatic Sea assource of such bottom waters (Malanotte-Rizzoli and Hecht, 1988, andreferences therein). Field observations from the Aegean Sea aroundthe year 1990 revived the Nielsen hypothesis by demonstrating thatthe Cretan dense water (CDW) was observed on the Northern Aegeancoasts and on the shallow shelves of the Cyclades islands, and then ac-cumulated in the Cretan Sea (Zervakis et al., 2000; Gertman et al.,2006). CDW, later on, filled the bottom layers of both MediterraneanSea basins (Roether et al., 1996; Klein et al., 1999) although, overflowing
the Sicily Strait, this deep water results to be heavily modified (BenIsmail et al., 2014).
During 1987, before the EMT event, an unexpected dense water wasobserved in the Aegean Sea. Its density (σθ ≈ 29.25–29.35) was indeedhigher than the historical maximum value of 29.2 (Georgopoulos et al.,1992; Theocharis and Georgopoulos, 1993, two similar articles calledG2T3 in the following).
Whereas the period 1992–1993 is generally considered as the realonset of a full EMT (Roether et al., 1996), the cold winter of the year1987 is of some interest since modern field data are available and alsobecause of a particularly severe 3–13 March storms (Lagouvardoset al., 1998) due to cold fronts passing over the Aegean Sea.
About the EMT event, during September 1987 the first Meteor-POEM cruise did not find any presence of the CDW outflow into thedeep Eastern Mediterranean, while Gertman et al. (2006) evidenced aCDWoutflow from the Island of Kassos in the Cretan Arc (Fig. 1) during

Fig. 1. General map of the Aegean Sea bathymetry, and the hydrologic transects F, R, G, NB, H, SB and D simulated by the PROTHEUS numerical results. Transect F, near Samothrace,corresponds to the C transect of G2T3. Transect R is along the Thermaikos Gulf, with remarkable river outflows. Transect G contains the sill between the Sporades plateau and theLimnos shelf, connecting the NAT and the Central Aegean Basin. Transect NB is from the Lesbos shelf to the northern Cyclades plateau (NB is the northern part of the B transect). Itssouthern part in the Cretan Sea is the SB transect, which goes from the Cyclades Plateau to the Eastern Cretan Sea. Transect H contain the sill between Central Chios Basin and theCretan Sea. Transect D,with the southern shelf of Ikaria and intermediate (~1000 m) and deep (~2000 m) points, south of the Eastern Cretan Sea.
121M. Bellacicco et al. / Marine Geology 375 (2016) 120–133
March 1988. Numerical simulations by Wu et al. (2000); Demirov andPinardi (2002) among others, pointed out major winter events in theyears 1981, 1983, 1987, and 1990.
We here focus on path and formation of densewater currents duringthe 1987 cold winter and spring, in order to infer recursive phenomenaof geological interest. We pair field data (i.e., hydrographic data fromG2T3) with theoretical models (i.e., the streamtube model by Smith,1975; Killworth, 1977; Rydberg, 1980, and other viscous models byShaw and Csanady, 1983; Shapiro and Hill, 1997; Killworth, 2001), nu-merical outputs (from the PROTHEUS numerical model; Artale et al.,2010), and satellite measurements (AVHRR time series; Josey, 2003;Marullo et al., 1999a, 1999b) to infer dense water formation sites.Such an approach aims to determine the possible pathway and spread-ing of the resulting bottom currents from the Northern Aegean Troughand the Limnos-Lesbos Plateau till the Cyclades Plateau, also in relationswith contourite deposits in this plateau. All this is complemented by theanalysis of a large set of high-resolution seismic-reflection data from theCyclades Plateau and Myrtoon Basin in order to map late Quaternarysedimentary structures. The combination of marine geological data
with oceanographic analyses provides relation between bottom-current activity and contourite drifts, as suggested by Rebesco et al.(2014).
This work is structured as follows: the study area is described inSection 2; data, methodologies, and both numerical and theoreticalmodels are described in Section 3. Analyses and results from numericalsimulations of temperature (T) and salinity (S) vertical transects aswellas the analysis of the theoreticalmodel for bottom current pathways arein Section 4, for bothNorth Aegean Trough (NAT) and Central Basin. Thebottom sediments of the Cyclades Plateau and the Cretan Sea hydrologyare analyzed in Section 5. A short synthesis and conclusions are inSection 6.
2. Study area
The Aegean basin has a very complex structure of different local en-vironments as canyons, river deltas, coastal or offshore sediments(Maley and Johnson, 1971; Zervakis et al., 2000).

122 M. Bellacicco et al. / Marine Geology 375 (2016) 120–133
In particular, the NAT consists of the North Sporades (≈1460 mdeep) and Athos basins (≈1150 m deep). At its southern boundary,the Northern Aegean Sea is connected by the Limnos-Sporades channel(≈500m deep at the sill) with the Central Aegean Sea. The North Aege-an Sea hydrology is characterized by a dense bottom layer, an upperlayer of Levantine Intermediate Waters (LIW) and a surface layer.Often, amuch colder and fresher surface Black SeaWater (BSW) crossestheDardanelles andworks as a thermal insulator over theNAT (Plakhin,1972; Poulos et al., 1997; Zervakis et al., 2000; Gertman et al., 2006).
The North Aegean Sea is characterized by a sea floor with deeptrenches, shelves and sills. About its sedimentary patterns, Hamannet al. (2008) focused attention on the sediment origins: they analyzedthe different roles of west Anatolian fluvial suspension load, Aeoliandust, the transport of the suspension load to the core position by the an-ticlockwise surface currents. Karageorgis et al. (2005) investigate, inparticular, the effect of Thermaikos Gulf rivers and currents. They findthat in that Gulf dense water flows enter from SE and then are trappedin a cyclonic gyre, just off the shelf. Consequently, fluvial sedimentsdischarged from the rivers remain mostly present within the plateau.
The Central Aegean Sea (in the following Central Basin) is divided inthenorthern Cyclades Plateau and the Skyros, North Ikaria and Chios ba-sins (Fig. 1). Its hydrology is similar to that of the NAT, but with a differ-ent inflow of BSW. Indeed, modified BSW enters the Central Basinthrough its NW flank and then follows the cyclonic flow of the AegeanSea.
Lykousis (2001) analyzed the subaqueous bed-forms of the CycladesPlateau and found dunes, sand waves, 2-D mega-ripples, sand ribbons.He also remarked how such bottom structures would imply large bot-tom water velocities (from ≈40 to 200 cm/s) that, however, were notrecorded during his cruise, where the measured water velocity wasabout 6–10 cm/s.
The South Aegean Sea is composed by the Ikaria basin, the southernshelf of the Cyclades Plateau and the Cretanbasin, the largest depression
Fig. 2. Temperature (A), salinity (B)
of this region reaching≈2000m in depth. The southernmost part of theCretan Sea communicates with the Eastern Mediterranean through theCretan Arc straits.
3. Methods and data
3.1. In situ hydrographic and seismic reflection data
The few available hydrologic data (i.e. 31 CTD casts) during year1987 were collected in Aegean Sea during the LIA-5-87 cruise onboardof the R/V Aegeo. The North Aegean Sea was sampled from 27 Februaryto 3March 1987 after a week of strong cold northerlies (G2T3). The hy-drographic casts (Fig. 2) are analyzed in order to characterize the typicalhydrological structures and, in particular, to validate the hydrographicinformation we derive from the numerical model, in terms of tempera-ture, salinity, and potential density.
The mapping of late Quaternary sedimentary facies on the CycladesPlateau (Fig. 3) is based on the interpretation of extensive 10 in. airgunseismic-reflection profiles collected during years 1986–1992 throughseveral oceanographic cruises with the R/V Aegaeo (Tripsanas et al.,2015).
3.2. Satellite Sea Surface Temperature (SST) data
We analyze an Aegean subset of SST data from the AVHRR-Pathfinder, focusing on those regions characterized by dense water for-mation. These SST data have a daily resolution of≈4 km (two times perday) and are derived from the 4-kmGlobal Area Coverage (http://www.nodc.noaa.gov).
In particular, we use monthly averaged SST time series from 1981 to2006 to infer dense water formation processes from SST anomalies. Wefocus on 1987 (Fig. 4), which is considered as the first year of a cold
data in the C transect of G2T3.

Fig. 3. Shaded bathymetricmap of the southwest Aegean Sea, showing (A) thedistribution of the bottom-current related seismic facies, and (B, C) examples ofmoats and sediment drifts inthe southwest Aegean Sea.
123M. Bellacicco et al. / Marine Geology 375 (2016) 120–133
period (Zervakis et al., 2000) even though it is not the coldest year of the1982–2006 time-series.
3.3. The PROTHEUS model
The numerical outputswe used in this study are from the PROTHEUSsystem (kindly provided by Dr. Sannino), i.e., a coupled model com-posed by the RegCM3 atmospheric regional model and a MITgcmocean model (Artale et al., 2010). The coupling of these two models isaccomplished by the OASIS3 coupler (Valcke and Redler, 2006; formore details see Appendices A and B).
We stress that, in being a hydrostatic model the PROTHEUS is notparticularly suitable for simulating dense water chimney phenomena.Despite this source of uncertainties, we use T and S vertical transectsfrom this model to analyze the main hydrographic setting (and theirmonthly evolution) in some crucial areas of the Aegean and CreteSeas, an approach that is not largely affected by the non-hydrostaticityof the model.
The PROTHEUS simulation is performed on an area including the en-tire Mediterranean Sea, where there are also considered inflows fromrivers and external seas, as Dardanelles that is here schematized as arunoff. As an example, monthly averages of transect F are shown inFig. 5A and B, to be compared with the G2T3 measurements in Fig. 2A

Fig. 4.Monthly satellite data of winter-sping SST over the Aegean Sea during year 1987.
124 M. Bellacicco et al. / Marine Geology 375 (2016) 120–133
and B. We moreover note how the PROTHEUS bathymetry is often par-ticularly smoothed in comparison with the real sea bottom (for moredetails see Appendix B).
The model validation (Appendix B) shows that the PROTHEUSmonthly averaged temperatures are about 1–2 °C lower for the surfacelayer of BSW (simulated as a layer of cold fresh water often less than

Fig. 5. Temperature (A), salinity (B) data for the F transect of the PROTHEUS numerical simulation. White, vertical lines represent the G2T3 hydrological casts shown in Fig. 2.
125M. Bellacicco et al. / Marine Geology 375 (2016) 120–133
40m thick, Figs. 2A and 5A). This large discrepancy probably is due to apoor parameterization of the Dardanelles outflow of BSW in thePROTHEUS model and/or a numerical bias (Artale, personal communi-cation). For the other layers less deep than≈500m this kind of discrep-ancy is≈0.5 °C. On the other hand, PROTHEUS salinity is about 0.9 psulower for BSW and then is rather realistic, perhaps a 0.1 psu lower forthe largest depths, while the PROTHEUS density is rather realistic onthe surface and good for the deep layers.
We remind that those of PROTHEUS are Eulerian data that concernlocal values in a given month, and thus the Lagrangian evolution ofthe previous measured values, although fully advected by the Eulerianmodel, can be affected by uncertainties related to Lagrangian chaos(Palatella et al., 2014).We also point out that the use of the Eulerian ve-locities from this model, which can be potentially used for our analysis,are not suitable for our goal since bottomnumerical currents are usuallyaffected by large errors (due to, e.g., coarse vertical resolution, lack of sa-linity data for model initialization) and thus might result unrealistic(Sannino and Artale, personal communications).
3.4. Theoretical models
Models for dense water evolution over a slope describe that a densewater, immediately after its formation, can either start a slow geo-strophicmotionwith velocity u or it can downflow as rather quick a cas-cade. In this first case the pioneering streamtube model (Smith, 1975;Killworth, 1977, among others) describes the geostrophic motion of avein of dense water along the slope. The balance of Coriolis force andbuoyancy in a stratified fluid gives a densewatermoving approximatelyalong the isobaths (Smith, 1975; Killworth, 1977; Estournel et al., 2005).
However, along this motion the vein slightly deepens (a second ordereffect of friction and entrainment) and its cross section increases. In ad-dition, just under the main streamtube a small parallel flow of slightlydenser current often occurs.
In more detail, since the streamtube has some turbulent characteris-tics due to the bottom friction, itsmotion can erase adjacentwaters, thatis, a streamtube thickness h in the point x along its path evolves as
udh=dx ¼ E u−vj j ð1Þ
where v is the ambient water velocity (Turner, 1973) and E is the en-trainment parameter, usually considered as a function of the Froudenumber Fr. In the Mediterranean Sea E is ~10−4–10−5 (Baringer andPrice, 1997; Falcini and Salusti, 2015).
Different schematizations, due to Shaw and Csanady (1983) andShapiro and Hill (1997), correlate the evolution of a dense water initialpatch with the bottom density gradients, thus estimating a density cur-rent flowing horizontally with speed (Nof, 1983)
uNof ¼ s g 0= f ð2Þ
where s is the sea bottom slope, gʹ is the reduced gravity and f is theCoriolis parameter.
This kind of models also allows computing the small dense waterdeepening. Killworth (2001) applied a Zilitinkevich and Mironov(1996) analysis on meteorological and oceanographic downflowsbased on a Froude number Fr characterization, and found that such out-flows often follow a simple trajectory characterized by a constant in-crease of the current depth z, so obtaining dz/dx ≈ constant. This

Fig. 6.Monthly T/S diagrams for the “critical points” in NAT during January, February andMarch. These diagrams are the overlap of T/S diagrams during January (segmentbeginning in the T/S diagram), February (intermediate point of the segment) and March(segment with an arrow point) for the year 1987. The March surface point (F 40), thatcorresponds to the G2T3 measurements, is out of this diagram because of its surprisingvalues T ≈ 9.4 °C, S ≈ 37.5 psu and σθ ≈ 29.9, where some complex interaction of thelocal water with the BSW looks probable. Colors indicate the corresponding transect inFig. 1.
126 M. Bellacicco et al. / Marine Geology 375 (2016) 120–133
Froude number model gives Fr ~ 1, namely h gʹ≈ u2 and also dz/dx b 1/400. These results are of interest since they are apparently independentfrom entrainment, detrainment and details of the bottom drag. On theother hand such approach mostly concerns bottom currents crossing adeep sill and thus its application to currents flowing over a slope maybe questionable.
4. Analyses and results
4.1. The hydrographic data
North of the Samothrace island, theC transect of G2T3 (Fig. 2)— sim-ulated by the F transect of PROTHEUS— is about 50 km at the east of theW transect of G2T3. The core data of the transect C of G2T3 (Fig. 2a andb: T≈ 13.50 °C, S≈ 38.75 psu,σθ≈ 29.25 at z≈ 170 to 350m), and themore westward transect W (not shown, T ≈ 12.50 °C, S ≈ 38.40–38.75 psu, σθ ≈ 29.23 at from ≈150 to 380 m) reveal processes ofdensewater formation over theNorth Samothrace shelf. G2T3 observedthe densest transect L over the more southern Limnos-Lesbos Plateau(not shown, T ≈ 13.60–13.80 °C, S ≈ 38.95 psu, σθ ≈ 29.33).
In these G2T3 sections, the typical hydrological structure of theAegean Sea is revealed by temperature and salinity (Fig. 2a, b),with relatively high values of T and S at intermediate and deeplayers. In the surface layer the cold and fresh BSW, often thinnerthan ≈30–40 m, can be seen (Zervakis and Georgopoulos, 2002;Pazi, 2008).
During the same period, Zervakis et al. (2000) synthesized the avail-ablemarinewater densities near Limnos island asσθ≈ 29.32,while fur-ther south in the Cyclades, at≈660mdepth, isσθ≈ 29.18; at east of theIsland of Crete was found σθ ≈ 29.16 at 1570 m depth and σθ ≈ 29.15;west of that island, at≈1270m depth. In general, Zervakis et al. (2004)interpret the deep CretanWater as a mixing of LIW and dense water ofNAT origin, a characterization in agreement with our results.
4.2. SST patterns from remote sensing
In his careful analysis of the Aegean Sea SST, Josey (2003) recognizedthe essential importance of the thermal effects for the density evolutionof the surfacewaters during the EMTwinters, in comparisonwith evap-oration. From January to May of 1987, the coast near Samothrace, theThermaikos gulf, and the Limnos-Lesbos shelf appear to be particularlyaffected by strong winds from east, funneled by the Greek and Turkishorography (Sayın and Beşiktepe, 2010 and Sayin et al., 2011). Thesewinds determine lower temperatures in these regions in comparisonto Central and Southern Aegean Sea. In turn, during June, the CycladesPlateau has rather lower temperatures (Fig. 4) than the northern area.
In addition, Fig. 4 shows that the 1987 was not particularly cold,while the Turkish coast seems colder than the other shelves (Zervakisand Georgopoulos, 2002; Sayın and Beşiktepe, 2010 and Sayin et al.,2011). No particular thermal effect is evident over the Cyclades during1987 while, in the following years, the water temperature decreasesby 1–1.5 °C (see Fig. S1 in Supplementary). This highlights the role ofthe winter 1986–87 in preconditioning the EMT, then fully developedduring the early '90s (Sayin et al., 2010 and 2011).
Summarizing, dense water “sources” are recognized in the Sam-othrace and Limnos-Lesbos shelves, as suggested by G2T3, or in theCyclades Plateau as well (Zervakis et al., 2000 and 2002; Sayin et al.,2010 and 2011; among others). Although in the Thermaikos Gulfsurface dense waters are evident, this gulf is also affected by aremarkable fresh water input from rivers (Estournel et al., 2005).
4.3. Numerical results in the NAT basin [transects F, R, and G]
In order to simulate lacking field data and to assess dense vein path-ways and dynamics, we analyzed monthly averaged T and S data insome selected transects as obtained from the PROTHEUS model (Figs.
6, 7, 8; for details see Fig. 1 and Table 1). Results are synthesized in 3heuristic “monthly T/S plots”, namely an overlap of T/S diagrams rela-tive to the same geographical points but for different months. In theseplots we indicate different waters as XX YYY (e.g., F 40 or NB 100, seeTable 1), where XX is the name of the transect in Fig. 1 and YYY is thewater depth (m).
Fig. 6 shows the PROTHEUS monthly averages of T/S diagrams ofNAT during January, February and March of the year 1987. We focuson the transects shown in Fig. 1 and Table 1:
i) the Samothrace shelf transect (F);ii) the shelf and the deepest part of Thermaikos gulf (R);iii) the Limnos-Lesbos shelf (G).
During January 1987 the densest and coldest waters are found in theSamothrace shelf (F 40,with a PROTHEUS abundant σθ≈ 29.65), whereboth S and σθ decrease considerably during February and March, likelydue to a BSW interaction (Fig. 6). This salinity decrease is a general effectsince it also occurs in the other superficial (G 40) and (R 40) points,which become also remarkably cold. Either ameteorological interactionor an interaction with BSW are likely the main causes of such a densewater formation.
A strong cooling also occurs in the Limnos shelf (G 40), where thedensest water were measured by G2T3. PROTHEUS data in Januaryshow T ≈ 14.2 °C and in March T ≈ 12.3 °C for the (G 40) water, acooling likely influenced by particularly dramatic storms during March1987 (Lagouvardos et al., 1998).
Temperature in the deepest point of the Samothrace shelf (i.e., F470), as well as for the Thermaikos gulf (i.e., R 760, R 360), remainsrather constant while salinity increases from January to March (Fig. 6).Therefore, there is no evidence of any mixing between this deep (F470) water with the overlying shelf (F 40), although some mixing of

Fig. 7. As Fig. 6, monthly T/S diagram of transects of the Central Basin during January(segment beginning in the T/S diagram), February (intermediate point of the segment)and March (segment arrow) for the year 1987. Colors indicate the correspondingtransect in Fig. 1.
127M. Bellacicco et al. / Marine Geology 375 (2016) 120–133
(F 470) is possible with (G 40), i.e. the L transect of G2T3, or with the sillwater (G 200).
About the Limnos-Sporades channel, the point (G 200) “moves”towards— appears to be mixed with— the denser (G 40) water. Indeed(G 200) increases its potential density of ≈0.1 in February ≈0.2 inMarch, finally reachingσθ≈ 29.42 in April. This agreeswith the hypoth-esis of a robust interaction between (G 40) and (G 200) waters (Fig. 6).In the next we will show that also the (F 40) water has a similar inter-action with (G 200), but with some months of delay. On the otherhand, a mixing of (F 470) with the (G 200) sill water, partially flowing
Fig. 8. As Fig. 6, monthly T/S diagram of the Central Basin transects during April (segmentbeginning in the T/S diagram), May (intermediate point of the segment) and June(segment arrow) for the year 1987. Colors indicate the corresponding transect in Fig. 1.
northward to balance the massive southward flow of (G 40) and (G200) waters, could explain the deep (F 470) time evolution.
In turn, the points R in the Thermaikos Gulf have a rather irregularbehavior, probably due to March storms or local river outflows, whileonly (R 300) looks mainly mixed with (F 40). These mixings supportthe G2T3 idea that the (F 40) dense water moved westward along theisobaths over the shelf break in a slow geostrophic motion. Of particularinterest is that all densities in the southern sector of the basin are small-er than those of (F 40) and (G 40) during January, namely σθ ≈ 29.65and 29.43 (Fig. 6).
4.4. Numerical results in the Central basin [transects G, NB, H, and D]
We now analyze the following PROTHEUS monthly averages of T/Sdiagrams of the Central basin during January, February and March ofthe year 1987 (Fig. 7) in:
i) the (G 200) and (G 40), already discussed above;ii) the southern boundary of the Central Basin, i.e. transect H with
its eastern point at 40 m depth (H 40), near Bodrum (Fig. 1)and its sill (H 250);
iii) the point (D 200) near the island of Ikaria, East of the Cycladicshelf;
iv) theNB transect (part of transect B from north of the Cyclades tillLesbos), i.e. points (NB 50) East of Lesbos, (NB 100) near the is-land of Andros, at the northern Cycladic border, and the deepsill (NB 500).
Fig. 7 shows that in thesemonths the near-surface points (G 40) and(H 40) become remarkably colder and fresher, mainly in March, likelydue to the strong front over the Aegean Sea (Lagouvardos et al., 1998).The deep (H 250), (NB 500), and (D 200) have a common evolution,i.e. a rather steady T and an increasing S from January toMarch, indicat-ing a mixing with the salty, deep current flowing northward along theTurkish coast (Gertman et al., 2006). The increase of salinity might beinduced by upwelling due to strong winds blowing off the Turkishcoast (Zervakis and Georgopoulos, 2002; Sayın and Beşiktepe, 2010and Sayin et al., 2011). However, the lack of a corresponding coolingin the eventual upwelling region (Crépon et al., 1984) suggests that amixing with salty waters is the most important effect (Figs. 7 and 8).
In this period the (NB 50) and (NB 100) waters move as — and aremixed with — the cold and dense (G 200) and (G 40) waters arrivingfrom the NAT. Based on the estimate of mixing rates, we argue thatthe relative dynamics shown in Fig. 7 mark the presence of both north-ern cold waters in this NB transect. The (G 40) point with PROTHEUSσθ ≈ 29.43 and (G 200) with σθ ≈ 29.37 have the largest waterdensities.
In synthesis, duringwinter a large amount of northern coldwater ar-rives in the Central Basin from (G 40) and the (G 200) sill, influencingthe (NB 50) and (NB 100) points (Fig. 9 and Table 2). To balance suchsouthward flow the (G 200) water shows a counter-flow through theLimnos-Sporades sill towards the deep (F 470) basin, as evidenced bythe (F 470) evolution in Fig. 6.
During spring (i.e., April, May and June), a strongwarming of the su-perficial (G 40) and (H 40) waters is evident, till reaching ≈18 °C inJune (Fig. 8). An unexpected, thin surface layer of fresh water withS ≈ 38.61 psu is present over the point (NB 100), near the Cycladesshelf during May and June, perhaps of the BSW origin. All other pointshave mild variations: the superficial (NB 50) water shows a modesttemperature increase while the sill (H 250 m) water becomes slightlyfresher. Finally we notice that the (D 200 m) water is colder, with aS ≈ constwhile, during winter, S had a strong increase.
Regarding dense waters near the Cycladic Plateau, in the CentralBasin we observe that (Fig. 9 and Table 2): the (NB 100) water evolvesfrom σθ ≈ 29.37 (March) to ≈29.19 (June) while (NB 50) goes from

Table 1Characteristics of the PROTHEUS transects. In red two points now shown in Fig. 1 (black dots).
Transect Orientation Origin point End point Length (Km) Bottom slope Critical points and depths (m) Point symbol
F N–S 25°11ʹE 40°58ʹN 25°11ʹE 40°06ʹN 94 5 × 10⁻³ Northern shelf, 40 F 40Bottom, 470 F 470
R NW–SE 23°06ʹE 39°56ʹN 24°14ʹE 39°27ʹN 115 7 × 10⁻³ Northern shelf, 40 R 40170 Intermediate, 300 R 300
Bottom, 760 R 760Sporades, 360 R 360
G E–W 25°33ʹE 39°60ʹN 24°13ʹE 39°21ʹN 165 8 × 10⁻³ Limnos, 30 G 4083 sill, 200 G 200
NB NE–SW 25°42ʹE 39°26ʹN 24°53ʹE 38°00ʹN 232 5 × 10⁻³ Lesbos shelf, 50 NB 50deep sill, 500 NB 500Cyclades shelf, 100 NB 100
H E–W 27°34ʹE 37°11ʹN 25°16ʹE 37°11ʹN 204 2 × 10⁻³ Turkish shelf, 20 H 20deep Ikaria, 250 H 250Cyclades plateau,100 H 100
D N–S 26°05ʹE 37°13ʹN 27°04ʹE 35°01ʹN 340 4 × 10⁻³ South Ikaria, 200 D 200Cyclades, 1000 D 1000deep Cretan, 2000 D 2000
SB NE–SW 24°25ʹE 37°08ʹN 22°53ʹE 35°05ʹN 357 6 × 10⁻³ Southern Cyclades, 800 SB 800western Cretan,1500 SB 1500
Fig. 9. Pathways of dense water masses in the context of the streamtube (see text). It also indicated the position of points (NB 50), (NB 100) and (NB 500). Green arrows represent theevolution of the (F 40) water; yellow arrows represent the evolution of the dense (G 40)–(G 200) water; red arrows represent the northward evolution of the (H 250), (NB 500), and (D200) deep waters.
128 M. Bellacicco et al. / Marine Geology 375 (2016) 120–133
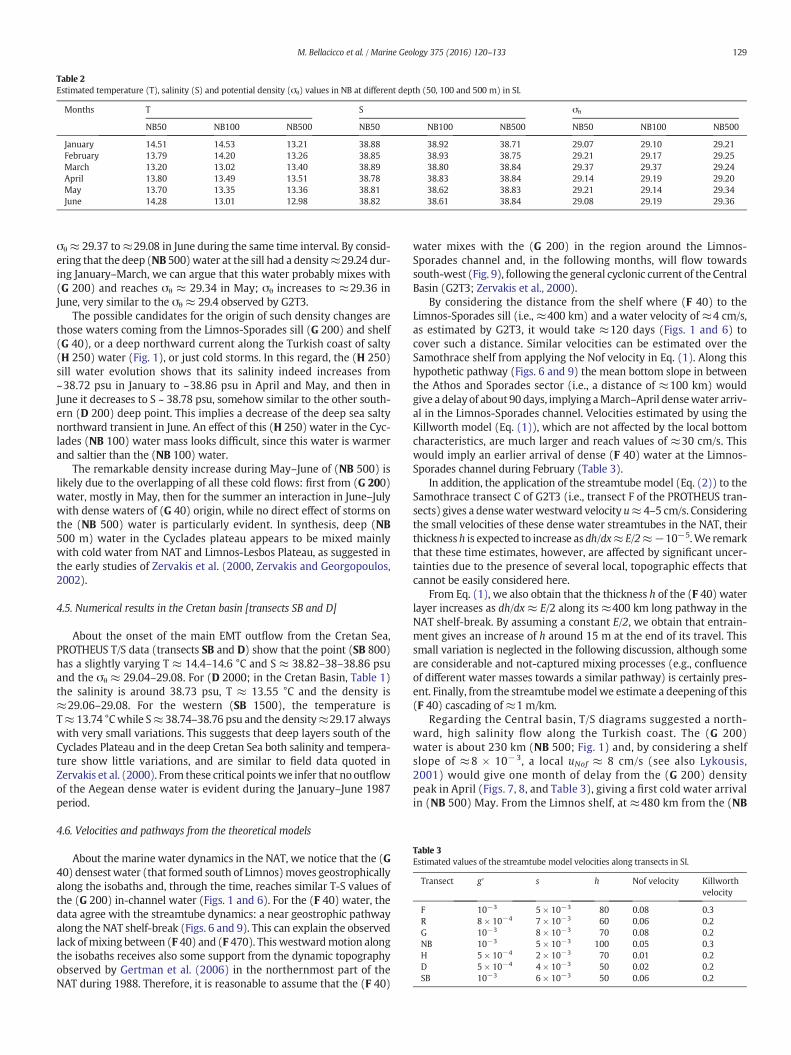
Table 2Estimated temperature (T), salinity (S) and potential density (σθ) values in NB at different depth (50, 100 and 500 m) in SI.
Months T S σθ
NB50 NB100 NB500 NB50 NB100 NB500 NB50 NB100 NB500
January 14.51 14.53 13.21 38.88 38.92 38.71 29.07 29.10 29.21February 13.79 14.20 13.26 38.85 38.93 38.75 29.21 29.17 29.25March 13.20 13.02 13.40 38.89 38.80 38.84 29.37 29.37 29.24April 13.80 13.49 13.51 38.78 38.83 38.84 29.14 29.19 29.20May 13.70 13.35 13.36 38.81 38.62 38.83 29.21 29.14 29.34June 14.28 13.01 12.98 38.82 38.61 38.84 29.08 29.19 29.36
Table 3Estimated values of the streamtube model velocities along transects in SI.
Transect gʹ s h Nof velocity Killworthvelocity
F 10−3 5 × 10⁻³ 80 0.08 0.3R 8 × 10⁻⁴ 7 × 10⁻³ 60 0.06 0.2G 10−3 8 × 10⁻³ 70 0.08 0.2NB 10−3 5 × 10⁻³ 100 0.05 0.3H 5 × 10⁻⁴ 2 × 10⁻³ 70 0.01 0.2D 5 × 10⁻⁴ 4 × 10⁻³ 50 0.02 0.2SB 10−3 6 × 10⁻³ 50 0.06 0.2
129M. Bellacicco et al. / Marine Geology 375 (2016) 120–133
σθ ≈ 29.37 to≈29.08 in June during the same time interval. By consid-ering that the deep (NB 500)water at the sill had a density≈29.24 dur-ing January–March, we can argue that this water probably mixes with(G 200) and reaches σθ ≈ 29.34 in May; σθ increases to ≈29.36 inJune, very similar to the σθ ≈ 29.4 observed by G2T3.
The possible candidates for the origin of such density changes arethose waters coming from the Limnos-Sporades sill (G 200) and shelf(G 40), or a deep northward current along the Turkish coast of salty(H 250) water (Fig. 1), or just cold storms. In this regard, the (H 250)sill water evolution shows that its salinity indeed increases from~38.72 psu in January to ~38.86 psu in April and May, and then inJune it decreases to S ~ 38.78 psu, somehow similar to the other south-ern (D 200) deep point. This implies a decrease of the deep sea saltynorthward transient in June. An effect of this (H 250) water in the Cyc-lades (NB 100) water mass looks difficult, since this water is warmerand saltier than the (NB 100) water.
The remarkable density increase during May–June of (NB 500) islikely due to the overlapping of all these cold flows: first from (G 200)water, mostly in May, then for the summer an interaction in June–Julywith dense waters of (G 40) origin, while no direct effect of storms onthe (NB 500) water is particularly evident. In synthesis, deep (NB500 m) water in the Cyclades plateau appears to be mixed mainlywith cold water from NAT and Limnos-Lesbos Plateau, as suggested inthe early studies of Zervakis et al. (2000, Zervakis and Georgopoulos,2002).
4.5. Numerical results in the Cretan basin [transects SB and D]
About the onset of the main EMT outflow from the Cretan Sea,PROTHEUS T/S data (transects SB and D) show that the point (SB 800)has a slightly varying T ≈ 14.4–14.6 °C and S ≈ 38.82–38–38.86 psuand the σθ ≈ 29.04–29.08. For (D 2000; in the Cretan Basin, Table 1)the salinity is around 38.73 psu, T ≈ 13.55 °C and the density is≈29.06–29.08. For the western (SB 1500), the temperature isT≈ 13.74 °Cwhile S≈ 38.74–38.76 psu and the density≈29.17 alwayswith very small variations. This suggests that deep layers south of theCyclades Plateau and in the deep Cretan Sea both salinity and tempera-ture show little variations, and are similar to field data quoted inZervakis et al. (2000). From these critical pointswe infer that nooutflowof the Aegean dense water is evident during the January–June 1987period.
4.6. Velocities and pathways from the theoretical models
About the marine water dynamics in the NAT, we notice that the (G40) densestwater (that formed south of Limnos)moves geostrophicallyalong the isobaths and, through the time, reaches similar T-S values ofthe (G 200) in-channel water (Figs. 1 and 6). For the (F 40) water, thedata agree with the streamtube dynamics: a near geostrophic pathwayalong the NAT shelf-break (Figs. 6 and 9). This can explain the observedlack ofmixing between (F 40) and (F 470). This westwardmotion alongthe isobaths receives also some support from the dynamic topographyobserved by Gertman et al. (2006) in the northernmost part of theNAT during 1988. Therefore, it is reasonable to assume that the (F 40)
water mixes with the (G 200) in the region around the Limnos-Sporades channel and, in the following months, will flow towardssouth-west (Fig. 9), following the general cyclonic current of the CentralBasin (G2T3; Zervakis et al., 2000).
By considering the distance from the shelf where (F 40) to theLimnos-Sporades sill (i.e., ≈400 km) and a water velocity of ≈4 cm/s,as estimated by G2T3, it would take ≈120 days (Figs. 1 and 6) tocover such a distance. Similar velocities can be estimated over theSamothrace shelf from applying the Nof velocity in Eq. (1). Along thishypothetic pathway (Figs. 6 and 9) the mean bottom slope in betweenthe Athos and Sporades sector (i.e., a distance of ≈100 km) wouldgive a delay of about 90 days, implying aMarch–April densewater arriv-al in the Limnos-Sporades channel. Velocities estimated by using theKillworth model (Eq. (1)), which are not affected by the local bottomcharacteristics, are much larger and reach values of ≈30 cm/s. Thiswould imply an earlier arrival of dense (F 40) water at the Limnos-Sporades channel during February (Table 3).
In addition, the application of the streamtubemodel (Eq. (2)) to theSamothrace transect C of G2T3 (i.e., transect F of the PROTHEUS tran-sects) gives a densewaterwestward velocity u≈ 4–5 cm/s. Consideringthe small velocities of these dense water streamtubes in the NAT, theirthickness h is expected to increase as dh/dx≈ E/2≈−10−5.We remarkthat these time estimates, however, are affected by significant uncer-tainties due to the presence of several local, topographic effects thatcannot be easily considered here.
From Eq. (1), we also obtain that the thickness h of the (F 40) waterlayer increases as dh/dx≈ E/2 along its ≈400 km long pathway in theNAT shelf-break. By assuming a constant E/2, we obtain that entrain-ment gives an increase of h around 15 m at the end of its travel. Thissmall variation is neglected in the following discussion, although someare considerable and not-captured mixing processes (e.g., confluenceof different water masses towards a similar pathway) is certainly pres-ent. Finally, from the streamtubemodel we estimate a deepening of this(F 40) cascading of≈1 m/km.
Regarding the Central basin, T/S diagrams suggested a north-ward, high salinity flow along the Turkish coast. The (G 200)water is about 230 km (NB 500; Fig. 1) and, by considering a shelfslope of ≈8 × 10⁻³, a local uNof ≈ 8 cm/s (see also Lykousis,2001) would give one month of delay from the (G 200) densitypeak in April (Figs. 7, 8, and Table 3), giving a first cold water arrivalin (NB 500) May. From the Limnos shelf, at ≈480 km from the (NB

Fig. 10. PROTHEUS monthly data of density in the NB vertical transect, during the January–June 1987 period.
130 M. Bellacicco et al. / Marine Geology 375 (2016) 120–133
500) point with a uNof ≈ 5 cm/s, one has about 3 months of delayand thus a dense water arrival can be estimated in June–July (Fig.10).
4.7. Geophysical results
The upper 200 m of the sedimentary packet in the Cyclades Plateaumost probably is the product of late Quaternary sedimentary processes(Anastasakis et al., 2006). It consists of the six seismic facies shown inFig. 3. Parallel, continuous, mid to low-amplitude seismic reflectionsrepresent hemipelagic sediments. In turn high to mid-amplitude, dis-continuous to incoherent reflections and overlying on a hard substratewith no further sound penetration, are usually interpreted as shallowmarine and fluvial sediments. Lenses of incoherent mid- to low-amplitude reflections interbedded in hemipelagic sediment representmass-transport deposits (MTDs). Seismic facies related to bottom-current are expressed by erosional channel-like features, which arebounded on their sides by mounded seismic packets, consisting ofhigh-amplitude incoherent to semi-parallel, discontinuous mid- tolow-amplitude seismic reflections. Similar seismic facies have been de-scribed from many ocean environments around the world (Rebescoet al., 2014, and references therein) and are usually interpreted asmoats and sediment drifts. These sedimentary structures mark themain entrance of the deep water we investigate here between theIslands of Euboea and Andros (Channel B in Fig. 3). Moreover, theyoccur along some interesting pathways towards the Myrtoon Basinand the Cretan Sea.
5. The Cyclades plateau deposits
Wenow relate the above results on densewater hydrodynamics andpathways with the evidence of bottom sediments in the Cyclades Pla-teau (Fig. 3). According to the distribution of the sediment drifts, thebottom currents that affect their formation processes enter the CycladesPlateau through a strait in the North-East sector of this basin(i.e., between the Islands of Euboea and Andros, NB 100 point in Figs.1 and 9) and exit towards west and southwest through three deep
straits in the Myrtoon Basin and the Cretan Sea. This flow is depictedby the sedimentary structures (sand waves, dunes, and sand ribbons)already identifiedby Lykousis (2001) in the same area. The continuationof the sediment drifts at the much larger water depth of the MyrtoonBasin indicates that the bottom currents exhibited a strong cascadingfeature, suggesting that they have large densities.
We notice that bottom velocities, as obtained from the streamtubemodel, are rather small (Table 2) with respect to those that are neededto form such sedimentary structures (Rebesco et al., 2014). However,this region is characterized by a very complicated bottom topographythat have a remarkable influence on the bottom water velocity andtheir temporal evolution. It could indeed happen that impulsive strongcurrents, affected by irregular bottom confinements, give origin tostrongnonlinear phenomena. Indeed, Lykousis (2001) from the analysisof such sedimentary structures predicted velocities up to 1–2m/s whilehis own measurements were 7–10 cm/s, in some agreement with ourestimated velocities (Table 3). Moreover, streamtube models dealwith steady motions, while the Lykousis (2001) bottom structuresprobably captured only the paroxismical stage of the currents, whichmight not have lasted for a long time.
Finally, we stress that in the streamtube case lower velocities are ex-pected because we focus our analysis just on a single year, prior to theEMT event. Moreover, Lykousis (2001) estimates would be, in turn,rather similar to the Killworth model velocities. Therefore, these sedi-mentary results somehow support the model here proposed which, ac-cordingly, agrees with the southward dense water outflow off theCyclades Plateau. There, one can indeed remark at the boundary of theCyclades Plateau and the Myrtoon basin (Fig. 3) some evidence of bot-tom current dynamics, a particular, interesting feature that suggests fu-ture investigations.
6. Conclusions
In this paper, we analyze the thermodynamics of Aegean Sea cur-rents during the year 1987, just before the onset of the EMT event(Roether et al., 2013).

131M. Bellacicco et al. / Marine Geology 375 (2016) 120–133
The complexity of the EMT event has been largely analyzed by sev-eral authors. G2T3 found very dense water masses and assumed thatthe densest waters of the Cretan Sea arrived via slope convection fromthe Cycladic Plateau shelf, although specific dense water paths werenot identified.
By combining satellite, numerical, field, and theoretical informa-tion, we here complement and what was found in seminal work(e.g., Zervakis et al., 2000; Theocharis et al., 1999a, 1999b; Lascaratoset al., 1999;Malanotte-Rizzoli et al., 1999;Nittis et al., 2003) by present-ing a novel viewpoint about the Aegean Sea dense water dynamics. Ouranalysis considers the northern dense water formation zones observedby Zervakis et al. (2000) in the light of a stream tube model (Smith,1975; Killworth, 1977).
From SST satellite data, we recognized the main sources of verydense water in the Samothrace shelf and the Limnos-Lesbos Plateau.From T and S data, simulated by the PROTHEUS numerical model, wefound that the densest water from the Samothrace shelf flowedgeostrophycally along the NAT isobaths, as a streamtube, towards theLimnos-Sporades channel. There, it mixed with a dense water fromthe Limnos-Lesbos Plateau andmoved geostrophically towards the Cyc-lades during April, May and June with different pathways and arrivaltimes. In addition, it is reasonable to argue that the heavy storm thatoccurred on March 1987 had a significant role on this dynamics. A dif-ferent high-salinity, northward flow along the Turkish coast, probablyrelated to wind induced upwelling (Sayin, 2010 and 2011), seemed toplay a secondary role. Our stream tube approach essentially supportsthe Zervakis et al. (2000) analysis.
Ourfindingswere then related to the presence of sedimentary struc-tures in the area. Results suggested that the main entrance of densewater in the Cyclades Plateau is between the Islands of Euboea and An-dros. Moats and sediment drifts in this area agree with this southward,densewater outflow. This opens newquestions about the downflow to-wards theMyrtoon Basin and the deepCretan Sea. Indeed, regarding theEMT temporal evolution, there was no evidence of dense water outflowoff the Cretan Sea towards the Levantine basin during the January–June1987 period. Since such a dense water outflowwas observed at the endof the 1987, we can argue that the main EMT event started after theperiod of our analysis.
Supplementary data to this article can be found online at http://dx.doi.org/10.1016/j.margeo.2016.01.012.
Acknowledgments
We are deeply grateful to Dr. Volfango Rupolo, who started thisstudy, to Dr. Artale, Gacic, Mosetti for creative criticism. We are alsoindebted to Dr. Marullo for the satellite data, help and criticism and toDr. Sannino for providing the PROTHEUS data, while Dr. Garra andGasbarra were of great help in an early period of this work. We alsothank both the anonymous reviewers for their support and their con-structive criticisms. This work has been supported by the ItalianNation-al Flagship Project RITMARE (Marine Italian Research), funded by theItalian Ministry of Education, University and Research within the Na-tional Research Program 2011–2013.
Appendix A. The PROTHEUS numerical model
In addition to the text information, here we remind that theRegCM3 (i.e., the athmospheric component of PROTHEUS system)is a 3-dimensional, sigma-coordinate, primitive equation, hydrostat-ic regional climate model (Giorgi et al., 1993a, 1993b, Giorgi andMearns, 1999; Pal et al., 2007). Air-sea exchanges are treated usingthe parameterization of Zeng et al. (1998). The configuration usedhere has a uniform horizontal grid spacing of 30 km on a Lambertconformal projection and 18 σ-levels are used. The simulation is per-formed on an area including the entire Mediterranean Sea. Lateralboundary conditions are supplied every 6-hours by interpolating
horizontal wind components, temperature, specific humidity andsurface pressure from a global atmospheric model.
The ocean component is based on the MITgcm developed byMarshall et al. (1997a, 1997b); here themodel is used in its hydrostatic,implicit free-surface, partial step topography formulation (Adcroft et al.,
1997). The model has a resolution of 18
� � 18
�, equivalent to rectangular
meshes of variable resolution with the meridional side of about 14 kmand the zonal one ranging from about 9 km in the northern part of thedomain to about 12 km in southern part. The model has 42 vertical Z-levels with a resolution varying from 10 m at the surface to 300 m inthe deepest part of the basin, and an intermediate resolution of about40–50 m between the depths 200–700 m. Horizontal viscous anddiffusive terms are modeled with a bi-harmonic formulation withdiffusivity and viscosity coefficients equal to 1.5 × 10¹⁰ m4/s. Verti-cal eddy-diffusivity is modeled via a Laplacian formulation withdiffusivity coefficient ranging from 3.0 × 10⁻⁵ m2/s at surfaceto 1.0 × 10⁻⁷ m2/s at the bottom, while the viscous coefficient ishold constant to 1.5 × 10⁻⁴ m2/s over the whole water column(Sannino et al., 2009). Deep convection is simulated through the en-hancement of the vertical diffusivity to about 1 m2/s in regionswhere the stratification becomes unstable.
Respect to the version of theMITgcmmodel described in Artale et al.(2010), in this version natural boundary conditions for salinity are used,that is P+ R− E (precipitation plus runoff minus evaporation) is treat-ed as a real fresh water flux. Monthly river discharges computed fromthe RegCM3 total runoff are used by the oceanic model. Catchmentbasins for 147 rivers falling into the Mediterranean Sea have been re-constructed using Total Runoff Integrated (TRIP) database. Riversdischarging in the Black Sea have been collected to dense fresh waterfluxes that reach the Mediterranean Sea via the Dardanelles Strait. Amonthly value for thedischarge of Black Sea is then included as a furtherriver. The initial condition for the oceanic run is obtained from a previ-ous run performed using a 3D relaxation towards the MEDATLAS-IIclimatology.
Appendix B. The PROTHEUS model validation
As a check of the numerical simulation over the Aegean Sea, wecompared monthly SSTs produced by PROTHEUS with Optimally Inter-polated SST (OISST, Marullo et al., 2007) from Pathfinder 5.0 SST data.The agreement between the two time series (Fig. S2) confirms thatPROTHEUS is able to reproduce reasonably well the annual SST cycles,though some minor discrepancies between the model and the data donot exceed 1.5 °C and less than 1 °C in average. The difference betweenOISST and field data shows no time drift (Marullo et al., 2007), as alsohappens between the model and OISST data and we therefore deducethat the model has no remarkable drift in the overlapping period.
We moreover compare the PROTHEUS hydrologic transect (F 40)with CTD data for the North Samothrace transect C (Fig. 2) of G2T3 dur-ingMarch 1987. There is a low surface temperature T≈ 11.20–11.50 °C(in PROTHEUS simulation T≈ 9.5 °C), most probably due to a thin sur-face layer of BSW≈ 40m thick. Just below one has T≈ 12.5 °C while inthe deepest layers T reach 13.5 °C (PROTHEUS has T≈ 12.6 °C down to100m, remaining rather homogeneous with 12.8 °C at the sea bottom).As remarked by a referee it is possible that the BSW from Dardanelles isunderestimated till a factor 2 by the PROTHEUS model.
About other parts of the Aegean in the same period, Zervakis et al.(2000) synthesize the available field data at Limnos (near Samothrace)with T ≈ 13.30 °C (T ≈ 12.8 °C in the PROTHEUS data) while moreSouth in the Cyclades at 660 m depth T ≈ 14.25 °C (T ≈ 13.4 °C in thePROTHEUS data), at east of the Island of Crete T ≈ 14.05 °C at 1570 mdepth (T ≈ 13.6 °C in the PROTHEUS data) and T ≈ 14.10 °C West ofthat Island, at just 1270 m depth (T ≈ 13.8 °C in the PROTHEUS data).In synthesis the PROTHEUS simulation is about 2 °C low for the BSW,rather poorly simulated, and ≈0.5 °C low for the other layers.
132 M. Bellacicco et al. / Marine Geology 375 (2016) 120–133
In the same F transect, salinity S ≈ 38.00 psu in the BSW surfacelayer, rapidly increasing with depth to 38.25–38.50 psu till reaching≈38.80 psu in the deepest layers (PROTHEUS simulates the BSW layeras low as S ≈ 37.0 psu on the surface, then S ≈ 38.5 psu at 60–100 mdepth, to a rather homogeneous value S ≈ 38.75 psu below 200 m).
About other parts of the Aegean in the same period, Zervakis et al.(2000) synthesize the available field salinity at Limnos (near Samo-thrace) with S ≈ 38.84 psu (S ≈ 38.82 psu in the PROTHEUS data)while more South in the Cyclades at 660 m depth S ≈ 38.94 psu(S ≈ 38.95 psu in the PROTHEUS data), at east of the Island of CreteS ≈ 38.84 psu at 1570 m depth (S ≈ 38.8 psu in the PROTHEUS data)and S ≈ 38.85 psu West of that Island, at just 1270 m depth(S≈ 38.78 psu in the PROTHEUS data). Again, there is a PROTHEUS sa-linity about 1 psu low for BSWand then rather realistic values, perhaps a0.1 psu low for the largest depths.
The surface BSW density is less than ≈29.05 while the PROTHEUSdensity is ≈29,0 in the BSW layer.
References
Adcroft, A., Hill, C., Marshall, J., 1997. Representation of topography by shaved cells in aheight coordinate ocean model. Mon. Weather Rev. 125 (9), 2293–2315.
Anastasakis, G., Piper, D.J., Dermitzakis, M.D., Karakitsios, V., 2006. Upper Cenozoic stratig-raphy and paleogeographic evolution of Myrtoon and adjacent basins, Aegean Sea,Greece. Mar. Pet. Geol. 23 (3), 353–369.
Artale, V., Calmanti, S., Carillo, A., Dell'Aquila, A., Herrmann, M., Pisacane, G., ...PROTHEUS Group, 2010. An atmosphere–ocean regional climate model for theMediterranean area: assessment of a present climate simulation. Clim. Dyn. 35(5), 721–740.
Baringer, M.O.N., Price, J.F., 1997. Momentum and energy balance of the Mediterraneanoutflow. J. Phys. Oceanogr. 27 (8), 1678–1692.
Ben Ismail, S., Schroeder, K., Sammari, C., Gasparini, G.P., Borghini, M., Aleya, L., 2014. In-terannual variability of water mass properties in the Tunisia–Sicily Channel. J. Mar.Syst. 135, 14–28.
Crépon, M., Richez, C., Chartier, M., 1984. Effects of coastline geometry on upwellings.J. Phys. Oceanogr. 14 (8), 1365–1382.
Demirov, E., Pinardi, N., 2002. Simulation of the Mediterranean Sea circulation from 1979to 1993: part I. The interannual variability. J. Mar. Syst. 33, 23–50.
Estournel, C., Zervakis, V., Marsaleix, P., Papadopoulos, A., Auclair, F., Perivoliotis, L.,Tragou, E., 2005. Dense water formation and cascading in the Gulf of Thermaikos(North Aegean), from observations and modelling. Cont. Shelf Res. 25 (19),2366–2386.
Falcini, F., Salusti, E., 2015. Friction and mixing effects on potential vorticity for bottomcurrent crossing a marine strait: an application to the Sicily Channel (Central Medi-terranean Sea). Ocean Sci. 11 (3), 391–403.
Georgopoulos, D., Salusti, E., Theocharis, A., 1992. Dense water formation processes in theNorth Aegean Sea (Eastern Mediterranean Sea). Ocean Model. 95, 4–6.
Gertman, I., Pinardi, N., Popov, Y., Hecht, A., 2006. Aegean Sea water masses during theearly stages of the Eastern Mediterranean climatic transient (1988–90). J. Phys.Oceanogr. 36 (9), 1841–1859.
Giorgi, F., Mearns, L.O., 1999. Introduction to special section: regional climate modelingrevisited. J. Geophys. Res. Atmos. 104 (D6), 6335–6352 (1984–2012).
Giorgi, F., Bates, G.T., Nieman, S.J., 1993a. The multiyear surface climatology of a regionalatmospheric model over the Western United States. J. Clim. 6 (1), 75–95.
Giorgi, F., Marinucci, M.R., Bates, G.T., 1993b. Development of a second-generation region-al climate model (RegCM2). Part I: boundary-layer and radiative transfer processes.Mon. Weather Rev. 121 (10), 2794–2813.
Hamann, Y., Ehrmann, W., Schmiedl, G., Krüger, S., Stuut, J.B., Kuhnt, T., 2008. Sedimenta-tion processes in the Eastern Mediterranean Sea during the Late Glacial and Holocenerevealed by end-member modelling of the terrigenous fraction in marine sediments.Mar. Geol. 248 (1), 97–114.
Josey, S.A., 2003. Changes in the heat and freshwater forcing of the EasternMediterraneanand their influence on deep water formation. J. Geophys. Res. Oceans 108 (C7)(1978–2012).
Karageorgis, A.P., Anagnostou, C.L., Kaberi, H., 2005. Geochemistry and mineralogy of theNW Aegean Sea surface sediments: implications for river runoff and anthropogenicimpact. Appl. Geochem. 20 (1), 69–88.
Killworth, P.D., 1977. Mixing of the Weddell Sea continental slope. Deep-Sea Res. 24 (5),427–448.
Killworth, P.D., 2001. On the rate of descent of overflows. J. Geophys. Res. Oceans 106(C10), 22267–22275 (1978–2012).
Klein, B., Roether, W., Manca, B.B., Bregant, D., Beitzel, V., Kovacevic, V., Luchetta, A., 1999.The large deep water transient in the Eastern Mediterranean. Deep-Sea Res. IOceanogr. Res. Pap. 46 (3), 371–414.
Lagouvardos, K., Kotroni, V., Kallos, G., 1998. An extreme cold surge over the Greek pen-insula. Q. J. R. Meteorol. Soc. 124 (551), 2299–2327.
Lascaratos, A., Roether, W., Nittis, K., Klein, B., 1999. Recent changes in deep water forma-tion and spreading in the Eastern Mediterranean Sea: a review. Prog. Oceanogr. 44(1), 5–36.
Lykousis, V., 2001. Subaqueous bedforms on the Cyclades plateau (NEMediterranean)—evidence of Cretan deep water formation? Cont. Shelf Res. 21 (5),495–507.
Malanotte-Rizzoli, P., Hecht, A., 1988. Large-scale properties of the easternmediterranean—a review. Oceanol. Acta 11 (4), 323–335.
Malanotte-Rizzoli, P., Manca, B.B., d'Alcala, M.R., Theocharis, A., Brenner, S., Budillon,G., Ozsoy, E., 1999. The Eastern Mediterranean in the 80s and in the 90s: the bigtransition in the intermediate and deep circulations. Dyn. Atmos. Oceans 29 (2),365–395.
Maley, T.S., Johnson, G.L., 1971, January. Morphology and structure of the Aegean Sea.Deep Sea Research and Oceanographic Abstracts vol. 18, No. 1. Elsevier, pp. 109–122.
Marshall, J., Adcroft, A., Hill, C., Perelman, L., Heisey, C., 1997a. A finite-volume, incom-pressible Navier stokes model for studies of the ocean on parallel computers.J. Geophys. Res. 102, 5753–5766.
Marshall, J., Hill, C., Perelman, L., Adcroft, A., 1997b. Hydrostatic, quasi-hydrostatic, andnonhydrostatic ocean modeling. J. Geophys. Res. 102, 5733–5752.
Marullo, S., Santoleri, R., Malanotte-Rizzoli, P., Bergamasco, A., 1999a. The sea surface tem-perature field in the Eastern Mediterranean from advanced very high resolution radi-ometer (AVHRR) data: part I. Seasonal variability. J. Mar. Syst. 20 (1), 63–81.
Marullo, S., Santoleri, R., Malanotte-Rizzoli, P., Bergamasco, A., 1999b. The sea surfacetemperature field in the Eastern Mediterranean from advanced very high resolutionradiometer (AVHRR) data: part II. Interannual variability. J. Mar. Syst. 20 (1), 83–112.
Marullo, S., Nardelli, B.B., Guarracino, M., Santoleri, R., 2007. Observing theMediterraneanSea from space: 21 years of pathfinder-AVHRR sea surface temperatures (1985 to2005): re-analysis and validation. Ocean Sci. 3 (2), 299–310.
Nielsen, J.N., 1912. Hydrography of the Mediterranean and adjacent waters. Report of theDanish Oceanographic Expedition 1908–1910 to the Mediterranean and AdjacentWaters 1. Copenhagen, pp. 72–191.
Nittis, K., Lascaratos, A., Theocharis, A., 2003. Dense water formation in the Aegean Sea:numerical simulations during the Eastern Mediterranean Transient. J. Geophys. Res.Oceans 108 (C9) (1978–2012).
Nof, D., 1983. The translation of isolated cold eddies on a sloping bottom. Deep Sea Res.Part A 30 (2), 171–182.
Pal, J.S., Giorgi, F., Bi, X., Elguindi, N., Solmon, F., Rauscher, S.A., ... Steiner, A.L., 2007. Re-gional climate modeling for the developing world: the ICTP RegCM3 and RegCNET.Bull. Am. Meteorol. Soc. 88 (9), 1395–1409.
Palatella, L., Bignami, F., Falcini, F., Lacorata, G., Lanotte, A.S., Santoleri, R., 2014. Lagrangiansimulations and interannual variability of anchovy egg and larva dispersal in the Sic-ily Channel. J. Geophys. Res. Oceans 119 (2), 1306–1323.
Pazi, I., 2008.Water mass properties and chemical characteristics in the Saros Gulf, North-east Aegean Sea (Eastern Mediterranean). J. Mar. Syst. 74 (1), 698–710.
Plakhin, Y.A., 1972. Vertical winter circulation in the Mediterranean. Oceanology 12,344–351.
Poulos, S.E., Drakopoulos, P.G., Collins, M.B., 1997. Seasonal variability in sea surfaceoceanographic conditions in the Aegean Sea (Eastern Mediterranean): an overview.J. Mar. Syst. 13 (1–4), 225–244.
Rebesco, M., Hernández-Molina, F.J., Van Rooij, D., Wåhlin, A., 2014. Contourites and asso-ciated sediments controlled by deep-water circulation processes: state-of-the-art andfuture considerations. Mar. Geol. 352, 111–154.
Roether, W., Manca, B.B., Klein, B., Bregant, D., 1996. Recent changes in Eastern Mediter-ranean deep waters. Science 271 (5247), 333.
Roether, W., Klein, B., Hainbucher, D., 2013. The Eastern Mediterranean Transient: evi-dence for similar events previously? In: Eusebi-Borzelli, G.-L. (Ed.), AGU Monograph“The Mediterranean Sea: Temporal Variability and Spatial Patterns”
Rydberg, L., 1980. Rotating Hydraulics in Deep-water Channel Flow. 1. Tellus, pp. 77–89.Sannino, G., Herrmann, M., Carillo, A., Rupolo, V., Ruggiero, V., Artale, V., Heimbach,
P., 2009. An eddy-permitting model of the Mediterranean Sea with a two-waygrid refinement at the strait of Gibraltar. Ocean Model. 30 (1), 56–72.
Sayın, E., Beşiktepe, Ş.T., 2010. Temporal evolution of the water mass properties duringthe Eastern Mediterranean Transient (EMT) in the Aegean Sea. J. Geophys. Res.Oceans 115 (C10) (1978–2012).
Sayin, E., Eronat, C., Uçkaç, S., Şükrü Beşiktepe, T., 2011. Hydrography of the eastern partof the Aegean Sea during the Eastern Mediterranean Transient (EMT). J. Mar. Syst. 88,502–515.
Shapiro, G.I., Hill, A.E., 1997. Dynamics of dense water cascades at the shelf edge. J. Phys.Oceanogr. 27 (11), 2381–2394.
Shaw, P.T., Csanady, G.T., 1983. Self-advection of density perturbations on a slopingcontinental shelf. J. Phys. Oceanogr. 13 (5), 769–782.
Smith, P.C., 1975, December. A streamtube model for bottom boundary currents in theocean. Deep Sea Research and Oceanographic Abstracts vol. 22, No. 12. Elsevier,pp. 853–873.
Theocharis, A., Georgopoulos, D., 1993. Dense water formation over the Samothraki andLimnos plateaux in the North Aegean Sea (Eastern Mediterranean Sea). Cont. ShelfRes. 13 (8), 919–939.
Theocharis, A., Balopoulos, E., Kioroglou, S., Kontayannis, H., Iona, A., 1999a. A synthesis ofthe circulation and hydrography of the South Aegean Sea and the straits of the Cretanarc (March 1994–January 1995). Prog. Oceanogr. 44, 469–509.
Theocharis, A., Nittis, K., Kontoyiannis, H., Papageorgiou, E., Balopoulos, E., 1999b. Climaticchanges in the Aegean Sea influence the Eastern Mediterranean thermohaline circu-lation (1986–1997). Geophys. Res. Lett. 26 (11), 1617–1620.
Tripsanas, E., Lykousis, V., Panagiotopoulos, I., Morfis, I., Karageorgis, A., Anastasakis, G.,Kontogonis, G., Anagnostou, G., 2015. Evidence for Periodic Developments of StrongLate Quaternary Bottom-Current Activity in South Aegean Sea Submitted to MarineGeology.
Turner, J.S., 1973. Buoyancy Effects in Fluids. Cambridge University Press (356 Pg).Valcke, S., Redler, R., 2006. OASIS3 user guide. PRISM Support Initiative, Report no 4, p. 60.

133M. Bellacicco et al. / Marine Geology 375 (2016) 120–133
Wu, P., Haines, K., Pinardi, N., 2000. Toward an understanding of deep-water renewal inthe Eastern Mediterranean. J. Phys. Oceanogr. 30 (2), 443–458.
Zeng, X., Zhao, M., Dickinson, R.E., 1998. Intercomparison of bulk aerodynamic algorithmsfor the computation of sea surface fluxes using TOGA COARE and TAO data. J. Clim. 11(10), 2628–2644.
Zervakis, V., Georgopoulos, D., 2002. Hydrology and circulation in the North Aegean (East-ern Mediterranean) throughout 1997 and 1998. Mediterr. Mar. Sci. 3 (1), 5–19.
Zervakis, V., Georgopoulos, D., Drakopoulos, P.G., 2000. The role of the North Aegean intriggering the recent Eastern Mediterranean climatic changes. J. Geophys. Res. 105(C11), 26103–26116.
Zervakis, V., Georgopoulos, D., Karageorgis, A.P., Theocharis, A., 2004. On the response ofthe Aegean Sea to climatic variability: a review. Int. J. Climatol. 24 (14), 1845–1858.
Zilitinkevich, S., Mironov, D.V., 1996. A multi-limit formulation for the equilibrium depthof a stably stratified boundary layer. Bound.-Layer Meteorol. 81 (3–4), 325–351.