the 1980s price bubble on (post) impressionism · the 1980s price bubble on (post) impressionism...
TRANSCRIPT

ACEI working paper series
THE 1980S PRICE BUBBLE ON
(POST) IMPRESSIONISM
Fabian Bocart, Ken Bastiaensen and Peter Cauwels
AWP-03-2011 Date: November 2011

The 1980s Price Bubble on(Post) Impressionism
Fabian Bocart ∗†, Ken Bastiaensen‡, Peter Cauwels §
November 2011
Abstract
The Log Periodic Power Law is a model used to define and measure speculative bubbles. Thismodel has proven useful to track bubbles and even predict crashes of liquid asset classes. Usingthis methodology coupled with properties of cointegration between stocks and art, the 1980sprice bubble on Impressionism and Post-Impressionism is analyzed. It is shown formally thatthere was a bubble in this market between 1986 and 1989. However, when denominatingthe art index in JPY rather than in USD, no price bubble behaviour was found at all. Thisobservation suggests that Japanese buyers never felt that they were riding a bubble. Despitepopular beliefs, no evidence is found that Japanese buyers viewed art as a speculative vehicleinstead of a more classic consumption good that was related to their own cultural heritage.
Keywords: Impressionism, art market, hedonic regression, LPPL, bubbleJEL classification: G1, G17, Z11
∗Universite Catholique de Louvain, Institut de Statistique, Biostatistique et Sciences Actuarielles, Voie duRoman Pays 20, 1348 Louvain-La-Neuve, Belgium, [email protected], corresponding author
†Tutela Capital S.A., Bastion Tower, Level 21, Pl. du Champ de Mars 5, 1050 Brussels, Belgium‡Karel Oomsstraat 1 bus 59, 2018 Antwerpen, Belgium, [email protected]§ETH Zurich, Department of Management, Technology, and Economics, KPLF34, Kreuzplatz 5, 8032
Zurich, Switzerland, [email protected]
1

1 Introduction
During the late 1980s, the market for Impressionist art experienced some of the most ex-treme conditions in its history. On March 31, 1987, Van Gogh’ sunflowers were lifted byYasuo Goto from the Yasuda Fire and Marine Insurance Company of Japan for 25 millionsat Christie’s London. A few months later, waves of records hit the market. Van Gogh’sIrises were hammered for 30 millions at Sotheby’s London. In May 1990, Pierre-AugusteRenoir’s Bal du moulin de la Galette was acquired by Ryoei Saito for USD 78.1 millionsat Christie’s New York. By contrast, one and a half year later, the sixth of December 1992,The Jardin a Auvers, one of the very last landscapes Vincent Van Gogh painted before hissuicide, fetched only FRF 55 million, or 6.5 millions in Paris.The Nikkei 225, on the other hand, followed a similar path. In the afternoon of the 29thof December 1989, this equity index was at its all-time high of 38’915.87 after a massive106% rise in three years. Not even three years later, on Tuesday the eighteenth of August1992, five months prior to the The Jardin a Auvers’ sale, the same index dropped to a mere14’309.41, a bottom not seen since March 1986.
At first sight, there seems to be a coincidence in timing between the rise and fall of paint-ing prices, especially on French painters (see for instance de la Barre et al. (1993) [5]) andthe development of bubble-like behaviour in Japanese stocks. Singer and Lynch (1997)[29] wrote about Japanese speculators in the Impressionist market. Roehner and Sornette(1999) [26] also showed evidences of speculation in the stamp market in the 1980s, with astrong outperformance of XIXth century stamps and Van Gogh stamps.Using a hedonic regression methodology, Wieand et al. (1998) [37] suggested that thecombination of high Japanese security prices and low yen cost of art made Western artan attractive asset to Japanese investors. Additionally, Hiraki et al. (2009) [12] havehighlighted comovements between Japanese stocks, land index and art indices during the1980s.They conclude that, amongst all genres and styles, Impressionism was aggressively bid,as [Japanese buyers] had a much stronger preference to well-known French Impressionistand Post-Impressionist style paintings (Hiraki et al., 2009). The same authors find also that,amongst all genres, it is French Impressionism that is most correlated with Nikkei, whereasDutch Old Masters for instance are less correlated.
This paper aims at further investigating Impressionist art prices behaviour during this pe-riod, as important questions are still pending. We set five goals for this paper:Firstly, we want to formally challenge the common belief that a bubble took place in the
2

market for Impressionist and Post-Impressionist art at the end of the 1980s. Identifyingbubble behaviour in the art market is of great relevance in order to better understand itsprice dynamics. This partially answers the question whether art can be seen as a specula-tive rather than a common consumption or investment good.Our second objective is to estimate as precisely as possible the timing of this phenomenon.In what period exactly did prices start accelerating, and, when did this acceleration stop,resulting in a change of regime, a bubble deflation or an outright crash?Thirdly, we want to describe price dynamics of other art movements during this period. Webuild indices for Modern Art (that can be seen as historically close to Post-Impressionism)and Old Masters (that can be seen as historically less related to Impressionism and Post-Impressionism).Fourth, we want to compare the Western (European and American) perspective with theJapanese point of view by taking into account currency effect.Finally, an explanation is put forward on why Impressionist art attracted so much theJapanese collectors.
To investigate these questions, a rigorous framework is needed that allows one to defineand characterize a speculative bubble. We exploit recent developments in bubble mod-elling made by Jiang et al. (2010) [16] and references.In order to study art prices, we construct a new hedonic index on Impressionist and Post-Impressionist drawings. Whereas many art indices exist in the literature, only a few seemto exclusively cover sales of Impressionist art during the 1980s. A first example of suchindices is found in de la Barre et al. (1993), who designed an OLS-based XIXth centuryFrench painters index covering 1980 to 1991. A second example of such index is foundin Hiraki et al. (2009) who used an index that, for each artist, is constructed roughly asthe average prices of his or her paintings on a monthly basis, and after some seasonalityadjustment, the index corresponding to a portfolio of particular artists is calculated.However, none of these indices satisfy our needs. Indeed we want an index based on thedrawings market, as this market was not only played by the upper-class, like the Impres-sionist painting market, but also by Japanese, American and European middle-class. Fur-thermore, as we use the index as observed series, we need our estimates to be as precise aspossible. We rely on Hodgson and Vorkink’ (2004) semi-parametric estimation to build theindex. This class of indices have been developed to achieve greater precision in situationswhere residuals of hedonic regressions are not normally distributed, a classical issue whendesigning art indices.
The remainder of the paper is organised as follows. In section 2, the methodology is ex-plained on how the index is built. The third section elaborates on the time series analysis
3

tools that are used to distract all relevant information from the newly constructed art index.In section 4 the results of this analysis are presented. Section 5 offers an explanation toprice moves in the art markets and what role Japanese collectors may have played. The lastsection closes this paper with our final conclusions.
2 The construction of a new index on Impressionist andPost-Impressionist art
2.1 The dataset
This study is based on three datasets. The first one consists of sales of works on paper fromartists belonging to Impressionism and Post-Impressionism art movements. We confinedour analysis to 3862 artworks from thirteen artists, born between 1820 and 1880, and citedin Galenson and Weinberg (2001) [6]: Pissarro, Manet, Degas, Cezanne, Monet, Redon,Renoir, Gauguin, Van Gogh, Seurat, Toulouse-Lautrec, Bonnard, and Vlaminck. The sec-ond dataset is made of 2563 sales from 39 Old Masters of Dutch, French and Italian origincited in Ginsburgh and Schwed (1992) [9]. The third dataset consists in 2650 artworksmade by 9 different artists who can be seen as painters of Modern Art (Andre Derain, Fer-nand Leger, Georges Braque, Jean Arp, Joan Miro, Juan Gris, Marc Chagall, Pablo Picassoand Robert Delaunay).We choose to only include sales of drawings, studies and sketches, as supply in this seg-ment of the art market is larger than in the market for paintings. Furthermore, the marketfor works on canvas is reputed much more expensive and concerns mainly high net worthindividuals (see Goetzmann et al., 2011 [10]). We are more interested in behavioural pat-tern of the broader market for art.Our database has been built using sales catalogues and results files. All sales were ob-served between January 1975 and December 1994. Prices are expressed in USD and aredeflated using the 1995 OECD price index. We grossly estimate buyer’s transaction feesusing Christie’s and Sotheby’s fees’ policy: +25% for works below 50,000 USD and +20%otherwise.As we want to focus on the broad art market, and not on very expensive art that may biasthe index, we trim the 5% most expensive artworks, on semi-annual basis1. After eliminat-
1Indices are less robust and more volatile when no trimming is made, but conclusions stay the same.
4

ing further sales lacking information (size of the work, title, etc.) the first, second and thirddataset eventually consists of 3463, 2410 and 2382 sales respectively.Financial data are imported from Datastream and consists of 5218 daily observations ofclosing price of the Nikkei 225 and the daily JPY/USD exchange rate, between the first ofJanuary, 1975 and the 30th of December, 1994.
2.2 Methodology of Hedonic Index construction
It is the purpose to derive indices that show the progression of the market over time. Indicesare based on a hedonic regression methodology, as opposed to a repeat-sales methodology(see a detailed comparison in Ginsburgh et al., 2006 [8]). The basic principle in this ap-proach is the regression of the logged prices with respect to specific characteristics (size,medium, period of the sale, etc.) of the art pieces so as to obtain a marginal “price” foreach characteristic.
pi =
T∑t=1
γtdi,t +
K∑k=1
αkvi,k + ui, i = 1, ..., n. (1)
In which pi is the logged price of sale i, di,t is a dummy variable taking the value 1 if thework of art i was sold in period t, and 0 otherwise. There are T = 39 periods, as one ofthe semesters of the series is used as benchmark. The K variables vi,k reflect other specificcharacteristics of the piece of art i. For instance, for the Impressionist/Post Impressionistart dataset, these include: the height and surface, the lot number, twelve dummies relatedto the artists (Pissarro as a benchmark), six dummies whose values depend on the auctionhouses (Sotheby’s, Christie’s, Koller, Blache, Ader Picard and Tajan, Phillips, Bonhams),one dummy taking the value 1 if the sales’ session is devoted to a specific collection or not,six dummies for the weekday the sale occurs (as some (un)important sales may be morelikely to happen certain days), three dummies for the city where the sale occurs (New York,London and Zurich), one dummy taking the value 1 if the drawing is a study, 0 otherwise,and fourteen dummies corresponding to different subjects that are not mutually exclusive:landscape, peasants, animals, portrait, people, still life, urban scenes, family of the artist,self-portrait, dancers, bath scenes, women, nude, religious scenes. The number of objectsin the analysis (n) totals 3463.
5

After eliminating variables that are not significant at a 5% level in a standard ordinaryleast squares regression, 31 variables (in addition to the 39 semiannual dummies) are re-strained. This linear model results in an R2 of nearly 60% for Impressionism and Post-Impressionism. The same methodology yields an R2 of 40% for Old Masters and morethan 67% for Modern Art.As we want to obtain as much precision as possible in the final estimation of the parameterswe follow Hodgson and Vorkink (2004) [13] and implement the modified Bickel’s (1982)[2] adaptive estimator to gain more efficiency. Note that a valid application of this methodrequires symmetry of the residuals, which is verified in our case.The semiparametric estimator is built as follow:Let us consider X′i = (di1, ..., di,t, vi,1, ..., vi,K) and β = (γ1, ..., γT, α1, ...., αK)Let β be the estimator of β, based on ordinary least squares:
β = (X′X)−1(X′p). (2)
Let ϵ = p − Xβ be the vector of residuals. Let us define K(.), a gaussian kernel: (K(λ) =−λ e0.5λ2
√2π
).
f (ϵi) =1
2(n − 1)
n∑i, j
(K(ϵi + ϵ j
h) + K(
ϵi − ϵ j
h)). (3)
f ′(ϵi) =1
2h(n − 1)
n∑i, j
(K′(ϵi + ϵ j
h) + K′(
ϵi − ϵ j
h)), (4)
where h is a bandwidth obtained using Silverman’s rule of thumb [28] . The score functionis computed using a trimming parameter (t1 = 2.5, t2 = e2.52/2, t3 = 2.5) following Hsiehand Manski (1987) [14].
ψi(ϵi) =ˆf ′(ϵi)ˆf (ϵi)
if | ϵi |< t1 and f (ϵi) > t2 and f ′(ϵi) < t3. (5)
ψi(ϵi) = 0 otherwise. (6)
The sample score vector is then estimated as follows:
S =∑n
i=1 Xiψi(ϵi)n
. (7)
Similarly to Hodgson and Vorkink (2004), the information matrix is approximated:
I =∑n
i=1(ψi(ϵi))2
n2
n∑i=1
XiX′i . (8)
6

According to Bickel(1982):β = β + I−1S. (9)√β − β→ N(0, I−1). (10)
White’s (1980) [36] consistent estimator of variance is used to obtain robust estimators ofβ’s variance.Finally, the index is built. The semi-annual Impressionist Works On Paper index is furtherreferred to as IWOP. The Modern Art Works on Paper index is referred to as MAWOPand the Old Master Drawings index is referred to as OMD. The first semester of 1975 isconsidered as the base of the index, whose value is arbitrarily put to 100.
IWOPt = 100eγt−γ1 , (11)
where t = 1, ...,T.
The OMD (Old Master Drawings) index and MAWOP (Modern Art Work On Paper)index are built in a similar fashion.Tables 3, 4 and 5 in appendix summarize results from these hedonic regressions.
3 Time series analysis
3.1 Overview
First we devote our analysis to the IWOP index. As the index is based on the coefficientsof the 39 time dummies presented in equation 1, our semi-annual index is only made of 39plus 1 observations. The LPPL methodology requires a fit of 7 parameters. Applying thismethodology directly to the 40 observations may lead to overfitting 2. To deal with thisproblem, an innovative approach is required. This starts with the observation of cointegra-tion between the IWOP index and Japanese stocks (Nikkei). By exploiting this relationshipto simulate synthetic art indices using a monte carlo simulation, an LPPL can be fitted
2Note that though results are less precise, conclusions stay unchanged when applying directly LPPL onthe 40 observations.
7

on each of these simulations in order to obtain the needed estimates and their confidenceintervals.
3.2 Methodology
3.2.1 LPPL
Let f (t) be a times series. The Log Periodic Power Law is :
f (t) = A + B(tc − t)m + C(tc − t)mCos(ω log(tc − t) + ϕ). (12)
limt→tc
f (t) = ∞. (13)
In this equation A is a constant term, B(tc − t)m models a super-exponential accelerationwhere tc is a critical time, and C(tc − t)mCos(ω log(tc − t) + ϕ) introduces a first order log-periodic oscillation (Sornette, 1998 [31], Jian et al., 2010). Following Jiang et al., 2010,f (t) follows a bubble-type behaviour if B < 0, m ∈ [0, 1] and C , 0. The critical time,tc, introduces a singularity in the equation. It is the point where the price series divergestowards infinity. In its current form, the model does not give any solution beyond thiscritical time. However, it suggests a change of regime beyond tc that may lead to a bubbledeflation or an outright crash. As a consequence, all conclusions drawn in this paper willrelate to this specific definition of a bubble.
3.2.2 Cointegration
Under the assumption that the IWOP and the Nikkei are cointegrating time series, thecritical time tc should be identical for both of them, independent of error terms. Indeed, ifthe IWOP and the Nikkei are cointegrating time series, they will, by definition, follow thisrelationship:
8

Nikkeit = c + µ × IWOPt + wt, t = 0, ...,T, (14)
where wt is a stationary process. On the other hand, under the assumption that the Nikkeifollows an LPPL price process:
Nikkeit = f (t) + ξt, (15)
where f (t) is the LPPL function and ξt is an error term.By combining (14) and (15):
f (t) + ξt = c + µIWOPt + wt. (16)
(13) and (16)limt→tc
f (t) = limt→tc
(c + µIWOPt − ξt + wt) = ∞. (17)
tc is found by estimating LPPL function on the Nikkei.
3.2.3 Monte Carlo
In practise, c, µ and wt are estimated using ordinary least squares.
µ ∼ N(µ, σ2µ). (18)
c ∼ N(c, σ2c ). (19)
Let us further assume:
w ∼ N(0, σ2w). (20)
By definition of OLS estimators:
9

c = ¯Nikkeit − µ ¯IWOP, (21)
where
¯Nikkei =∑T
t=0 Nikkeit
T + 1, (22)
and
¯IWOP =∑T
t=0 IWOPT + 1
. (23)
It is hence possible to simulate series for the IWOP, from daily Nikkei values, based on(14).
IWOP∗τ,z = c∗τ,z + µ∗τ,zNikkeiτ + w∗τ,z, τ = 1, ..., tc, z = 1, ...,Z, (24)
where µ∗ and w∗ are randomly selected values according to (18) and (20) , and c∗ is thecorresponding value for c, according to (21). Z is the total number of simulations.For each simulated series, we estimate LPPL parameters by non linear least squares. Wethen obtain as many estimations of LPPL coefficients as simulated series.As the IWOP∗ series have been simulated, it must be tested whether the coefficients result-ing from non linear estimation are compliant with the definition of a bubble. If yes, thenthe null hypothesis that no bubble took place in the art market can be rejected.
4 Empirical results
4.1 The bubble on Nikkei
The starting time and the critical times for the Nikkei bubble are found using Bastiaensen etal.’s (2009) [1] methodology: one endpoint is fixed while the other one varies. As explainedin the previous section, each fit process produces a different set of parameters estimated bynon linear least squares. By selecting solutions with the smallest MSE and that match theobserved peak on equity, one gets a meaningful set of coefficients. Figure 1 highlights some
10

of these possible solutions. Among them, one suggestion seems to better match observeddata: a fit beginning in summer 1986 and ending in December 1989.
1984 1985 1986 1987 1988 1989 1990
1000
020
000
3000
040
000
5000
0
Time
Nik
kei
Window 2Window 4Window 7Window 8Window 10Window 11Window 12Window 13.1Window 13.2Window 14Window 15Window 16Window 17Window 18Window 19
Figure 1: Selected LPPL fits on Nikkei
4.2 The bubble on Impressionist and Post-Impressionist art prices
Figure 2 compares the IWOP, obtained from Hodgson and Vorkink, 2004’s methodologyand the Nikkei. Worthington and Higgs (2001) [38] have already highlighted the presenceof cointegration between art and equities. We perform a Phillips-Ouliaris (1990) [24] coin-tegration test and observe that the IWOP is significantly cointegrated with the Nikkei, at aconfidence level of 5%. At the contrary, IWOP is not significantly cointegrated with S&P500 at a level of 15%, what confirms results from Hiraki et al. (2009).
We generate the expected time series of art prices, based on the cointegration betweenNikkei and IWOP. We use these series to first investigate several possibilities for the crit-ical time and the starting point of a would-be bubble on art. As the IWOP index and
11

Figure 2: Iwop and Nikkei rescaled to 100 in 1975
Japanese equities are strongly cointegrated, we use the solutions found for Nikkei as primepossibilities. Figure 3 illustrates the fits for these options.
We select the two solutions that yield the smallest Mean Squared Error on the one handand match the observed peak of December 1989 /January 1990 on the Nikkei on the otherhand:
• From June 1986 to December 1989.
• From July 1987 to January 1990.
However, we cannot directly conclude that a bubble did exist on Impressionist and Post-Impressionist art prices, as we need to take into account the noise linked to our estimationof daily art prices. In order to cope with this issue, we simulate 10’000 series. Eachseries suffer from noise as described in equation (24). LPPL parameters are estimated andrecorded for all series.For both possibilities, key parameters stay in line with Jiang et al., 2010’s definition of abubble3 in more than 95% of the simulations, suggesting that a bubble did occur in themarket for XIXth century art.
3B < 0, m ∈ [0, 1] and C , 0
12

1984 1985 1986 1987 1988 1989 1990 1991
5010
015
020
025
030
0
Time
E(S
imul
ated
IWO
P)
Window 4Window 7Window 8Window 10Window 11Window 12Window 13.1Window 13.2Window 14Window 15Window 16Window 17Window 18Window 19
simulated IWOPhedonic index
Figure 3: Selected LPPL fits on IWOP∗
4.3 Market behavior for Old Masters and Modern art
Figure 4 plots the three art indices (OMD, MAWOP and IWOP) along the Nikkei 225. In-terestingly, for the MAWOP and OMD, the Phillips-Ouliaris (1990) test fails to reject thenull hypothesis of no-cointegration with Nikkei. Nevertheless, Figure 4 seems to presenta peak in prices right after 1990, both for the Old Master Drawings index and ModernArt Works On Papers. Indeed, we reject the null hypothesis of no-cointegration for IWOPagainst MAWOP when taking a 6 months lag into account, and we reject the null hypothe-sus of no-cointegration for MAWOP against OMD, also with a 6 months lag into account.In other words, the IWOP is directly cointegrated with Nikkei, whereas MAWOP is onlycointegrated with IWOP with a lag, and OMD is cointegrated with MAWOP with yet an-other lag. This suggests that IWOP and Nikkei were leading a bubble, whereas OMD andMAWOP were following it. Because we do not directly observe cointegration of OMD andMAWOP with Nikkei, we cannot however use the same methodology to affirm or infirmthat a bubble took place in the market for Old Masters or the one for Modern Art. We canhowever affirm there was a bullish market prior to 1990, followed by a significant drop in
13

prices.
1975 1980 1985 1990 1995
0.0
0.2
0.4
0.6
0.8
1.0
Date
Indi
ces
resc
aled
to th
eir
max
imum
val
ue
NikkeiIWOPOMDMAWOP
Figure 4: IWOP (USD), MAWOP (USD), OMD (USD) and Nikkei (JPY), rescaled to 1 intheir maximum value
5 Explanation to swings in art prices
Results of previous sections show that a speculative bubble took place in the market forimpressionist art and that the timing of this bubble lies between June 1986 and January1990. However, three important questions still need to be addressed:- Why a lagged cointegration is observed between (Post) Impressionism and other art move-ments ?- Did Japanese really present a speculative behaviour on art prices ?- Why did Japanese buy more specifically Impressionist art during the 1980s?
14

5.1 Why a lagged cointegration is observed between (Post) Impres-sionism and other art movements ?
A first explanation to the lagged cointegration would be linked to the timing of the sales,as important auctions are typically spaced of 6 months from one another. However, it isknown that impressionism and modern art were presented in the same week, sometimes inthe same sale. The same is true for Old Masters. This phenomenon comes from the factthat works on paper were frequently gathered by auction houses in special sales devotedto drawings. As a consequence, this first possibility to explain a lagged cointegration ofprices seems unconvincing.A second explanation would be that our initial failing to reject the null hypothesis of no-cointegration with Nikkei is due to a type II error. In this case, we would fail to spot thatthe three segments could have acted as one. Nevertheless, as we observe the lagged rela-tionship on two different samples (MAWOP and OMD), this idea fades.Finally, a possibility is that Impressionist works were setting the pulse of the global artmarket. In other words, Impressionism was, at the time, the leading engine of global artprices. The strong cointegration between IWOP and Nikkei, as well as many other evi-dences (see for instance Hiraki et al, 2009 or de la Barre et al., 1994) suggest that Japaneseinvestors may have directly influenced the Impressionist art market. From our results, wecan conclude that other movements, either closely related (like Modern Art) or not (likeOld Masters), did suffer from lagged contagion.
5.2 Did Japanese present a speculative behaviour on art prices?
It was concluded in the previous section that a bubble occurred in the market for (Post) Im-pressionist art. As the IWOP index is denominated in USD this conclusion merely countsfor what could be referred to as a Western perspective. Compelling evidence shows thatthis art bubble was strongly linked to a bubble on Japanese equities at the time. A commonexplanation for this phenomenon (see for instance Hiraki et al., 2009) is that Japanese col-lectors, enriched by a booming equity market, fuelled the ever increasing, unstable pressureon art prices in Western countries.However, to our knowledge, few studies have investigated the Japanese point of view ofthis bubble. A simple, yet powerful tool to look at the market through Japanese eyes, is todesign the IWOP in Japanese yen rather than in US dollars.Figure 5 shows how the exchange rate evolved between 1975 until 1995. Though this mar-
15

1975 1980 1985 1990 1995
100
150
200
250
300
Time
JPY
/US
D
Figure 5: Foreign exchange: JPY to USD
ket did not encounter a bubble type behaviour, it trended in favour of the Japanese yen,from roughly 300 JPY/USD in 1975, to 100 JPY/USD in 1995.In this context, figure 6 shows that art prices in Japanese currency were not especially highin the period ranging from 1986 to 1990. From its lowest level in 1984, to its peak in 1989,Impressionist and Post-Impressionist art rallied +231% for the yen owner. Though impres-sive, this was a rather modest performance compared to the +472% American investorsencountered during the same period.Furthermore, art prices in real terms were more than three times as expensive in 1989 thanthey were in 1975 for USD owners. On the other hand, JPY owners felt a rather small 50%increase in art prices over the whole 1975-1989 period.
An explanation consistent with the observation of a bubble from a Western perspectiveis found in the works of Smith et al. (1988) [30]: irrational behaviour need not exist for abubble to happen. Lei et al. (2001) [21] summarize this concept: a rational trader mightmake a purchase at a price greater than the fundamental value, believing that he will beable to realize a capital gain by reselling at an even higher price, either to an irrationaltrader, or to a trader who plans on reselling. In other words, bubbles can occur whenmarket participants are rational, but observe the presence of irrational actors. As showed
16

1975 1980 1985 1990 1995
100
200
300
400
Time
IWO
P
IWOP in USDIWOP in JPY
Figure 6: Comparison of the IWOP in USD and the IWOP in JPY
previously, for Western collectors, Japanese were riding a bubble. Indeed, from a USD de-nominated point of view, Japanese collectors acted in an irrational fashion as demonstratedby the creation of a LPPL bubble type. Nevertheless, Japanese themselves never felt theywere riding a bubble as the price level at which they were buying was not historically high,once the USD/JPY exchange rate is taken into account.All actors may have been rational: Japanese collectors behaved rationally by consumingart they like at reasonable JPY levels, whereas Western investors bought art at high USDprices, hoping to resell to the “irrational” Japanese they truly observe. In Lei et al.’s words,the situation in global art markets, end of the 1980s saw the existence of speculative oppor-tunities (see Blanchard (1979) [3] or Brooks and Katsaris (2003) [4] or a formal descriptionof bubble creation when rational speculative opportunities occur).
17

5.3 Why did Japanese buy more specifically Impressionist art duringthe 1980s?
It is well known that discovery or re-discovery of art movements by scholars and museumscan lead to soaring prices (de Limburg-Stirum and Ginsburgh, 1995 [7]). This hypothesis,however, seems improbable in the case of the Impressionism and Post-Impressionism boomof the 1980s, as these movements were already established and universally recognised foralmost a century. Indeed, the term Impressionist is derived from Claude Monet’s workImpression, soleil levant, and was originally invented in 1874 by an art critic to satiriseMonet’s art. The artist subsequently adopted the word to describe the entire movement.Post-Impressionism was first coined by art critic and artist Roger Fry to title an exhibitionat the Grafton Galleries in London in 1910. Nathanson (1985) [23] has highlighted thatFry invented the term to group what are nowadays known as different movements, rangingfrom Modernism to Proto-Cubism. As movements, Impressionism and Post-Impressionismalready had international visibility in the first part of the XXth century: in addition to theGrafton Galleries’ exhibition, London played a role in promoting French and British Im-pressionism with exhibitions as early as 1883 (Rewald, Pissarro and Pissarro, 1949) [25].In 1918, National Gallery’s director Sir Charles Holmes spent 20’000 on post Impression-ists paintings, including Degas and Gauguin (Munro, 2003 [22]). Of course, France was aleader in promoting French Impressionism and Post-Impressionism. In 1922, the Toulouse-Lautrec museum opened in the city of Albi to host Lautrec’s works as well as Bonnard’s,Serusier’s, Valadon’s and Vuillard’s (Julien, 1952 [17]).In 1929, the largest version of the Bal du moulin de la Galette was hung in the Musee duLouvre. The piece was previously exhibited in the Musee du Luxembourg. Such a transferwas, under the French system, conditional to the fact that “ [the artist’s] glory had beenconfirmed by universal opinion” (Laclotte et al., 1986 [20]).The Museum of Modern Art in New York was established in 1929 and displayed the sameyear an exhibition devoted to Cezanne, Van Gogh, Gauguin and Seurat. In 1935, this mu-seum organised an exhibition entirely devoted to Vincent Van Gogh (Goodyear, 1943 [11]).In 1937, the Palais de Tokyo in Paris, built for the International Exhibition, hosted Neo-Impressionists and Pont-Aven school paintings.The former USSR also had a marked interest in the genre as at least 74 Impressionist andPost-Impressionist master pieces were seized in Germany by Soviet authorities after theSecond World War, to augment the Hermitage’s collection (Kostenevich, 1995 [19]).In 1959, the National Museum of Western Art opened in Tokyo to exhibit Western paint-ings, including works of Manet, Renoir, Monet, Van Gogh, Gauguin and Moreau, previ-ously held by the famous Japanese collector Matsukata Kojiro (National Museum of West-
18

ern Art, 1960 [33]). Hence, as a matter of fact, Impressionism and Post-Impressionismcannot be considered as being “discovered” in the 1970s or 1980s. It is more likely thatthe roots of the bubble may be found in the historical links between Impressionism andJapan. It is indeed well documented that Western art was influenced by Japanese art pre-cisely during the second part of the nineteenth century, when Europe (and more particularlyFrance) was subject to “Japonisme”. Watanabe(1984) [34] has highlighted that after 18674,Japanese prints became widely available in the West and that the cult of Japanese art is adistinct characteristic of the 1870ies and 1880ies in the West, particularly in France andin England. As Schuster(1974) [27] explains: Degas, Gauguin, Manet, Matisse, Monet,Toulouse-Lautrec, Van Gogh, Baudelaire, Flaubert, Zola: all were enthusiastic about thenew Japanese way of painting - so different from techniques known in Europe. For VanGogh, Japan is an utopia (Kodera(1984) [18]) that he tries to figure out in his paintings.Cezanne may have similar links to Japan (Inaga, 1988 [15], Tanaka, 2001 [32]). Accord-ing to Weisberg(1975) [35] Manet and Degas were both influenced by Japanese prints andJaponisme. An exhibition held in 1988, called “Le Japonisme”, took place at the GaleriesNationales du Grand Palais in Paris and the Museum of Western Art in Tokyo. The muse-ums exhibited works of Cezanne (of which La Montagne Sainte-Victoire), Degas, Gauguin,Manet, Monet, Pissarro, Renoir, Toulouse-Lautrec and Van Gogh.
Impressionism and Post-Impressionism may be seen as the first signs of tangible Japaneseinfluence on modern European culture in a post-Edo period. The very same influence, notonly on art, but also on finance, was at its highest in the 1980s, as the Japanese economywas taking over the world. In this context, for a Japanese to buy late XIXth century artin the eighties was not simply obtaining a European painting, it was also acquiring part ofJapanese history: the early international Japanese influence in the modern world.
6 Conclusion
This paper investigates the bubble-like behaviour in Impressionist art and Japanese stocksat the end of the 1980s. A common explanation of high art prices at the end of the eightiesis the Japanese influence on international art markets, more precisely on Impressionist andPost-Impressionist art. We suggest that Impressionist and Post-Impressionist art were noarbitrary choice for Japanese collectors: these movements stand for one of the greatest ex-amples of Japanese influence on European art. In a sense, Japanese collectors were simply
4the end of the Edo period
19

buying part of their cultural heritage.However, to formally investigate the assumption that a speculative bubble took place in Im-pressionist art, a semi-parametric adaptive estimation is performed on Impressionist workson paper data to obtain a semi-annual USD index between 1975 and 1995. As it is impre-cise to calibrate a Log Periodic Power Law (LPPL) on only 40 data, we exploit an observedcointegration between Nikkei and Impressionist art prices to simulate series.From our Monte-Carlo simulation, we derive sets of LPPL parameters. All of them comply(at a 95% confidence level) with Jiang et al.’s definition of a bubble.As a consequence, our first result shows that an unstable acceleration of prices took place inthe market for Impressionist works on paper, at the end of the 1980s. Our results also sug-gest a price contagion to other markets, such as Modern Art (a movement closely relatedto Post-Impressionist art), or even Old Masters. This confirms previous results (de la Barreet al, 1996 [5]) that global art markets did experience considerable growth prior to 1990.The existence of a lagged cointegration between Impressionism and these art movementssuggests that global art prices were more or less following trends set by Japanese collectorsin Impressionist and Post-Impressionist art.A second important result is the timing of the bubble: we identify several possibilities, butfavour two scenarios: from June 1986 to December 1989, and/or from July 1987 to January1990.
By contrast, by designing the same index in Japanese yen rather than American dollar, weshow that, from a Japanese point of view, there is no evidence at all that a bubble occurred.An important conclusion of this last finding is that Japanese buyers never felt they wereriding a “bubble”, they were merely surfing a bullish art market. Despite popular belief,this finding implies that we have no evidence that Japanese buyers perceived Impressionistart as speculative vehicle instead of sa consumption good.
Nevertheless, Westerners did experience a bubble. Some blamed the Japanese for it. Ac-tually, what the West was experiencing was the combination of a bullish art market led byenriched Japanese on the one hand and the strength of the yen on the other hand. It is thisvery combination that turned out to be the perfect storm for European and American col-lectors. This combination was so strong and so unstable that it had to collide at one point,as predicted by LPPL. History tells that it is the bullish art trend that came abruptly to anend, whereas the JPY/USD did not stop strengthening.Another consequence of this duality is that, depending on the point of view (Western orJapanese) one may, or may not, consider that a bubble took place. This observation openspaths for further investigation: What role foreign exchange, or rates market can play onthe creation of a bubble on real assets? How swings in currencies can lead to important
20

transfers of cultural goods at international level? How to design a new model explainingthe creation of bubbles created by combined effects of different markets?
Acknowledgment
We are grateful for helpful comments from Victor Ginsburgh, Christian Hafner, Kim Oost-erlinck, Gary Schwartz, Didier Sornette, Christophe Spaenjers, Darius Spieth, Ryan Woodard,Roberto Zanola, and all participants at the Art Markets Workshop in Brussels, April 2011.
21

References
[1] BASTIAENSEN, K., CAUWELS, P., SORNETTE, D., WOODARD, R., ZHOU,W. X., 2009. The Chinese Equity Bubble: Ready to Burst. Quantitative Finance Pa-pers from arXiv.org. [cited at p. 10]
[2] BICKEL, P., 1982. On adaptive estimation. Annals of statistics 10, 647–671. [cited at p. 6]
[3] BLANCHARD, O. J., 1979. Speculative Bubbles, Crashes and Rational Expectations.Economics Letters 3 (4), 387–389. [cited at p. 17]
[4] BROOKS, C., KATSARIS, A., 2003. Rational Speculative Bubbles: An EmpiricalInvestigation of the London Stock Exchange. Bulletin of Economic Research 55 (4),319–346. [cited at p. 17]
[5] DE-LA-BARRE, M., DOCCLO, S., GINSBURGH, V., 1996. Returns of Impres-sionist, Modern and Contemporary European Paintings 1962 to 1991. AnnalesD’Economie et de Statistique 35, 143–181. [cited at p. 2, 20]
[6] GALENSON, D. W., WEINBERG, B. A., 2001. Creating Modern Art: The Chang-ing Careers of Painters in France from Impressionism to Cubism. The American Eco-nomic Review 91(4), 1063–1071. [cited at p. 4]
[7] GINSBURGH, V., LIMBURG-STIRUM, M. D., 1993. The fall from favour of Sym-bolist art and its recovery. The Art Newspaper. [cited at p. 18]
[8] GINSBURGH, V., MEI, J., MOSES, M., 2006. On The Computation of Price Indices.Handbook of the economics of art and culture 1, 948–979. [cited at p. 5]
[9] GINSBURGH, V., SCHWED, N., September 1992. Price trends for old masters draw-ings 1980-1991. The Art Newspaper. [cited at p. 4]
[10] GOETZMANN, W. N., RENNEBOOG, L., SPAENJERS, C., 2011. Art and Money.American Economic Review 101(3), 222–26. [cited at p. 4]
[11] GOODYEAR, A. C., 1943. The Museum of Modern Art: The first ten years. TheMuseum of Modern Art. [cited at p. 18]
[12] HIRAKI, T., ITO, A., SPIETH, D., TAKEZAWA, N., 2009. How Did Japanese In-vestments Influence International Art Prices? Journal of Financial and QuantitativeAnalysis 44, 1489–1514. [cited at p. 2]
22

[13] HODGSON, D., VORKINK, K., 2004. Asset Pricing Theory and the Valuationof Canadian Paintings. The Canadian Journal of Economics / Revue canadienned’Economique 37, 629–655. [cited at p. 6]
[14] HSIEH, D., MANSKI, C. F., 1987. Monte Carlo Evidence on Adaptive MaximumLikelihood Estimation of a Regression. Annals of statistics 15 (2), 541–551. [cited at p. 6]
[15] INAGA, S., 1983. La reinterpretation de la perspective lineaire au Japon (1740-1830)et son retour en France (1860-1910). Actes de la recherche en sciences sociales 49,29–45. [cited at p. 19]
[16] JIANG, Z., ZHOU, W. X., SORNETTE, D., WOODARD, R., BASTIAENSEN, K.,CAUWELS, P., 2010. Bubble diagnosis and prediction of the 2005 2007 and 20082009 Chinese stock market bubbles. Journal of Economic Behavior and Organization74(3), 149–162. [cited at p. 3]
[17] JULIEN, E., 1952. Toulouse-Lautrec au Musee d’Albi. Musee d’Albi. [cited at p. 18]
[18] KODERA, T., 1984. Japan as Primitivistic Utopia: Van Gogh’s Japonisme Portrait.Netherlands Quarterly for the History of Art 14 (3), 198–208. [cited at p. 19]
[19] KOSTENEVICH, A. G., 1995. Hidden treasures revealed: Impressionist masterpiecesand other important French paintings preserved by the State Hermitage Museum, St.Petersburg. Ministry of Culture of the Russian Federation, The State Hermitage Mu-seum, St. Petersburg in association with H.N. Abrams (New York). [cited at p. 18]
[20] LACLOTTE, M., LACAMBRE, G., DISTEL, A., FRECHES-THORY, C., 1986. Lapeinture au Musee d’Orsay. Scala. [cited at p. 18]
[21] LEI, V., NOUSSAIR, C., PLOTT, C. R., 2001. Nonspeculative Bubbles in Experi-mental Asset Markets: Lack of Common Knowledge of Rationality vs. Actual Irra-tionality. Econometrica 69 (4), 831–859. [cited at p. 16]
[22] MUNRO, J., 2003. French Impressionists. Fitzwilliam Museum Handbooks. Cam-bridge University Press. [cited at p. 18]
[23] NATHANSON, C. A., 1985. The American Reaction to London’s First Grafton Show.Archives of American Art Journal 25(3), 2–10. [cited at p. 18]
[24] PHILLIPS, P., OULIARIS, S., 1990. Asymptotic Properties of Residual Based Testsfor Cointegration. Econometrica 58 (1), 165–193. [cited at p. 11]
23

[25] REWALD, J., PISSARRO, L., PISSARRO, C., July 1949. Letters from London, 1883- 1891. The Burlington Magazine 91 (556), 188–1921. [cited at p. 18]
[26] ROEHNER, B., SORNETTE, D., 1999. Analysis of the phenomenon of speculativetrading in one of its basic manifestations: postage stamp bubbles. International Jour-nal of Modern Physics C 10(6), 1099–1116. [cited at p. 2]
[27] SCHUSTER, I., 1974. Effects of Japanese Art on French and German Literature inthe Nineteenth Century. Canadian Review of Comparative Literature 1 (1), 76–88.[cited at p. 19]
[28] SILVERMAN, B., 1986. Density Estimation for Statistics and Data Analysis. Chap-man and Hall. [cited at p. 6]
[29] SINGER, L. P., LYNCH, G. A., 1997. Are Multiple Art Markets Rational? Journal ofCultural Economics 22 (1), 33–42. [cited at p. 2]
[30] SMITH, V., SUCHANEK, G., WILLIAMS, A., Sep. 1988. Bubbles, Crashes, andEndogenous Expectations in Experimental Spot Asset Markets. Econometrica 56 (5),1119–1151. [cited at p. 16]
[31] SORNETTE, D., 1998. Multiplicative processes and power laws. Physical Review E57(4), 48114813. [cited at p. 8]
[32] TANAKA, H., 2001. Cezanne and Japonisme. Artibus et Historiae 2 (44), 201–220.[cited at p. 19]
[33] (TOKYO), N. M. O. W. A., 1960. Masterpieces of the Ex-Matsukata collection:Tokyo, National Museum of Western Art, 14.5. - 10.7.1960. National Museum ofWestern Art (Tokyo). [cited at p. 19]
[34] WATANABE, T., 1984. The Western Image of Japanese Art in the Late Edo Period.Modern Asian Studies 18 (4), 667–684. [cited at p. 19]
[35] WEISBERG, G., Apr. 1975. Aspects of Japonisme. The Bulletin of the ClevelandMuseum of Art 62 (4), 120–130. [cited at p. 19]
[36] WHITE, H., 1980. A Heteroskedasticity-Consistent Covariance Matrix Estimator anda Direct Test for Heteroskedasticity. Econometrica 48 (4), 817–838. [cited at p. 7]
[37] WIEAND, K., DONALDSON, J., QUINTERO, S., 1998. Are Real Assets PricedInternationally? Evidence From the Art Market. Multinational Finance Journal 2 (3),167–187. [cited at p. 2]
24

[38] WORTHINGTON, A. C., HIGGS, H., 2001. Art as an Investment: Risk, Returnand Comovements in Major Painting Markets. Queensland University of Technol-ogy School of Economics and Finance Discussion Papers and Working Papers Series.[cited at p. 11]
25

Appendix
Figure 7: Iwop and S&P500 rescaled to 100 in 1975
26

Figure 8: Histogram of ω∗
Figure 9: Histogram of ϕ∗
27

Figure 10: Histogram of C∗
Figure 11: Histogram of B∗
28

Figure 12: Histogram of A∗
29

IWOP MAWOP OMDAmount of pieces Volume (USD) Amount of pieces Volume (USD) Amount of pieces Volume (USD)
S1.1975 20 208,232 20 273,243 7 8,928S2.1975 49 481,448 29 315,647 40 55,236S1.1976 132 377,291 63 676,091 62 101,857S2.1976 50 204,089 22 118,712 41 53,269S1.1977 81 379,474 49 454,212 80 121,684S2.1977 42 407,487 40 465,583 63 144,532S1.1978 90 2,352,968 53 878,717 39 123,863S2.1978 38 165,265 33 379,790 48 110,817S1.1979 91 1,308,812 54 667,809 57 178,329S2.1979 89 1,440,889 54 841,579 69 203,207S1.1980 74 1,212,729 51 645,719 46 118,751S2.1980 75 820,987 51 1,061,581 131 418,751S1.1981 111 1,331,296 58 1,250,972 58 207,803S2.1981 53 310,884 50 1,574,859 50 160,945S1.1982 61 460,616 64 1,251,675 65 155,652S2.1982 49 658,769 38 547,762 64 196,567S1.1983 121 1,529,979 63 1,153,559 60 135,754S2.1983 96 925,831 48 997,662 62 187,958S1.1984 69 807,634 72 1,520,943 37 139,186S2.1984 64 437,862 46 1,054,241 118 1,678,016S1.1985 107 1,157,654 76 1,976,736 61 144,180S2.1985 65 1,787,884 32 884,667 60 167,460S1.1986 100 1,738,960 76 1,759,084 76 286,941S2.1986 80 4,322,849 77 3,370,809 49 285,953S1.1987 116 4,425,521 108 5,416,072 61 525,880S2.1987 128 6,917,476 68 3,443,936 92 1,790,164S1.1988 124 8,620,164 93 8,932,129 39 272,411S2.1988 114 4,789,777 73 6,942,076 60 402,599S1.1989 179 13,923,224 114 12,700,459 38 288,818S2.1989 131 11,073,430 87 8,980,418 67 570,868S1.1990 193 6,809,236 101 9,124,550 71 1,721,729S2.1990 89 5,118,064 44 2,817,718 54 1,164,225S1.1991 78 2,127,495 55 4,039,207 42 402,948S2.1991 53 1,735,649 46 2,571,990 99 1,529,744S1.1992 61 2,007,688 63 4,083,818 44 369,184S2.1992 61 1,783,540 50 3,191,454 75 515,662S1.1993 83 2,690,097 59 3,845,099 50 388,634S2.1993 69 2,962,844 67 7,018,055 58 300,017S1.1994 96 2,555,558 69 4,368,277 71 992,542S2.1994 81 2,008,597 66 3,928,271 46 417,484TOTAL 3,463 104,378,249 2,382 115,525,181 2,410 17,038,548
Table 1: Descriptive statistics per semester
30
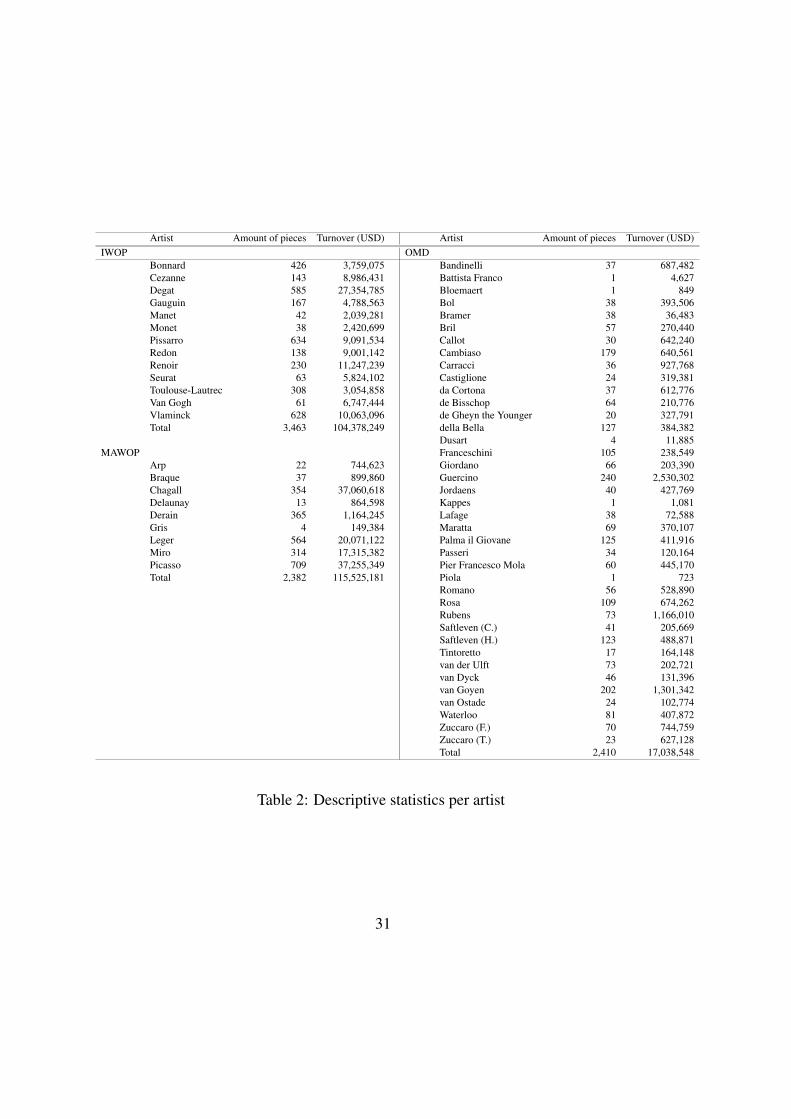
Artist Amount of pieces Turnover (USD) Artist Amount of pieces Turnover (USD)IWOP OMD
Bonnard 426 3,759,075 Bandinelli 37 687,482Cezanne 143 8,986,431 Battista Franco 1 4,627Degat 585 27,354,785 Bloemaert 1 849Gauguin 167 4,788,563 Bol 38 393,506Manet 42 2,039,281 Bramer 38 36,483Monet 38 2,420,699 Bril 57 270,440Pissarro 634 9,091,534 Callot 30 642,240Redon 138 9,001,142 Cambiaso 179 640,561Renoir 230 11,247,239 Carracci 36 927,768Seurat 63 5,824,102 Castiglione 24 319,381Toulouse-Lautrec 308 3,054,858 da Cortona 37 612,776Van Gogh 61 6,747,444 de Bisschop 64 210,776Vlaminck 628 10,063,096 de Gheyn the Younger 20 327,791Total 3,463 104,378,249 della Bella 127 384,382
Dusart 4 11,885MAWOP Franceschini 105 238,549
Arp 22 744,623 Giordano 66 203,390Braque 37 899,860 Guercino 240 2,530,302Chagall 354 37,060,618 Jordaens 40 427,769Delaunay 13 864,598 Kappes 1 1,081Derain 365 1,164,245 Lafage 38 72,588Gris 4 149,384 Maratta 69 370,107Leger 564 20,071,122 Palma il Giovane 125 411,916Miro 314 17,315,382 Passeri 34 120,164Picasso 709 37,255,349 Pier Francesco Mola 60 445,170Total 2,382 115,525,181 Piola 1 723
Romano 56 528,890Rosa 109 674,262Rubens 73 1,166,010Saftleven (C.) 41 205,669Saftleven (H.) 123 488,871Tintoretto 17 164,148van der Ulft 73 202,721van Dyck 46 131,396van Goyen 202 1,301,342van Ostade 24 102,774Waterloo 81 407,872Zuccaro (F.) 70 744,759Zuccaro (T.) 23 627,128Total 2,410 17,038,548
Table 2: Descriptive statistics per artist
31

Variable Coefficient White’SDIntercept 8.91 *** 0.10Ader 0.27 *** 0.07Bath scenes 0.33 *** 0.12Bonhams -0.7 *** 0.20Bonnard -0.41 *** 0.07Cezanne 1.46 *** 0.09Christie’s -0.13 *** 0.05Dancer 0.4 *** 0.09Degas 0.83 *** 0.08Gauguin 0.86 *** 0.10Height 0.03 *** 0.002Koller 1.59 *** 0.21Landscape 0.19 *** 0.05Lautrec 0.14 ** 0.06London 0.58 *** 0.05Lot -0.00007 ** 0.00003Manet 1.2 *** 0.21Monet 1.24 *** 0.20New York 0.68 *** 0.05Nude -0.13 * 0.07People -0.34 *** 0.05Phillips -0.51 *** 0.12Redon 1.25 *** 0.10Renoir 0.85 *** 0.08Saturday 0.45 *** 0.10Scenes with women 0.29 *** 0.07Seurat 1.53 *** 0.18Study -0.46 *** 0.05Tuesday 0.24 *** 0.06Van Gogh 2.21 *** 0.10Vlaminck 0.32 *** 0.06Wednesday 0.14 *** 0.04
Table 3: Parameters estimates and White’s SD of variables’ coefficients for IWOP, R2=58%(*** 1%; ** 5%; * 10% significativity level)
32

Variable Coefficient White’SDIntercept 7.51 *** 0.04Christie’s 0.24 *** 0.01Dead -0.13 *** 0.01Fernand Leger 2.22 *** 0.003Georges Braque 2.18 *** 0.02Jean Arp 1.51 *** 0.04Joan Miro 2.41 *** 0.01Juan Gris 1.9 *** 0.20Lot 0.00006 *** 0.000000001Marc Chagall 3.28 *** 0.01New York 0.26 *** 0.01Pablo Picasso 2.55 *** 0.00Paris 0.15 *** 0.004Robert Delaunay 2.4 *** 0.06Sotheby’s 0.33 *** 0.01Width 0.04 *** 0.00001
Table 4: Parameters estimates and White’s SD of variables’ coefficients for MAWOP,R2=67% (*** 1%; ** 5%; * 10% significativity level)
33

Variable Coefficient White’SDIntercept 9.17 *** 0.27Annibale Carracci 0.92 *** 0.09Attribution -0.69 ** 0.01Birth -0.06 *** 0.0005Carlo Maratta 0.79 *** 0.05Christie’s 0.61 *** 0.005Finarte 0.2 0.16Flemish 0.45 *** 0.01Giovanni Benedetto Castiglione 0.96 *** 0.05Giuseppe Passeri 0.69 *** 0.09Guercino 0.73 *** 0.05Height -0.005 *** 0.000001Jacob de Gheyn the Younger 0.81 ** 0.09Jacob Jordaens 0.53 *** 0.04Jacques Callot 0.5 *** 0.06Leonard Bramer -0.88 *** 0.04London -0.14 *** 0.003Luca Giordano 0.68 *** 0.07Paris 0.31 *** 0.01Pier Francesco Mola 0.85 *** 0.04Pietro da Cortona 0.79 *** 0.05Salvator Rosa 0.88 *** 0.03Sir Peter Paul Rubens 0.32 *** 0.05Sotheby’s 0.66 *** 0.004Study -0.12 *** 0.003Width -0.01 *** 0.000001
Table 5: Parameters estimates and White’s SD of variables’ coefficients for OMD, R2=40%(*** 1%; ** 5%; * 10% significativity level)
34

Window Start End m ω ϕ A B C SSE/n2 17/03/1984 17/08/1990 1.23 8.01 10.27 246.75 - 17.16 3.73 160.854 18/08/1984 12/03/1990 0.86 18.11 - 1.57 265.12 - 39.46 - 2.34 47.617 7/04/1985 2/09/1990 1.49 22.32 15.80 242.00 - 11.59 - 3.25 255.418 22/06/1985 29/01/1990 0.88 19.14 1.10 262.50 - 39.31 2.85 46.38
10 23/11/1986 30/11/1989 1.02 16.22 17.46 250.29 - 31.92 2.82 48.3611 8/02/1986 22/01/1990 0.86 29.09 4.48 262.47 - 40.09 - 1.51 53.2012 26/04/1986 8/12/1989 0.77 12.46 20.28 259.55 - 43.13 6.59 26.05
13.1 12/07/1986 24/12/1989 0.72 13.25 13.16 264.54 - 46.82 8.09 26.7013.2 12/07/1986 2/12/1989 0.73 12.66 1.47 260.36 - 44.93 6.73 21.42
14 26/09/1986 13/12/1989 0.75 12.75 13.71 261.30 - 44.56 7.58 22.1115 12/12/1987 12/12/1989 0.74 12.70 10.62 261.53 - 45.03 - 5.61 20.7516 27/02/1987 11/12/1989 0.72 12.63 20.10 261.77 - 45.47 7.09 22.1617 15/05/1987 15/12/1989 0.74 12.88 4.19 261.98 - 45.16 - 6.17 21.9918 31/07/1987 5/01/1990 0.73 13.98 12.61 266.91 - 48.13 6.41 20.7919 16/10/1987 20/05/1990 1.92 17.81 57.29 245.46 - 12.45 2.46 110.89
Table 6: LPPL parameters for several fits for expected simulated IWOP
Start End m ω ϕ A B C SSE/n17/03/1984 17/08/1990 0.64 7.77 0.85 46,289.19 - 11,637.78 - 598.16 982,47318/08/1984 12/03/1990 0.76 10.15 - 1.43 40,288.46 - 8,549.73 - 452.80 1,132,950
7/04/1985 2/09/1990 0.67 12.92 - 0.29 46,700.58 - 11,466.31 - 377.99 1,446,65122/06/1985 29/01/1990 0.81 10.13 - 0.98 38,592.79 - 7,593.49 - 474.50 1,291,96623/11/1986 30/11/1989 0.85 9.55 0.58 36,747.75 - 6,768.08 - 545.71 1,314,529
8/02/1986 22/01/1990 0.79 11.72 1.27 38,351.16 - 7,561.00 661.27 1,156,88826/04/1986 8/12/1989 0.73 12.44 1.45 37,826.94 - 7,906.18 974.87 721,10212/07/1986 24/12/1989 0.69 13.27 0.61 38,600.08 - 8,470.20 1,088.28 611,00312/07/1986 2/12/1989 0.70 12.59 1.55 37,945.93 - 8,175.03 1,087.42 631,79226/09/1986 13/12/1989 0.73 12.75 1.14 37,905.26 - 7,904.11 1,091.75 600,53912/12/1987 12/12/1989 0.74 12.71 1.18 37,797.89 - 7,796.49 1,098.68 620,59827/02/1987 11/12/1989 0.75 12.64 1.24 37,708.79 - 7,719.06 1,106.21 651,37915/05/1987 15/12/1989 0.77 12.91 1.04 37,693.90 - 7,619.50 1,081.39 675,57531/07/1987 5/01/1990 0.82 13.95 0.07 37,892.22 - 7,420.46 995.80 629,36016/10/1987 20/05/1990 0.89 13.15 0.62 40,522.00 - 7,586.20 - 511.66 406,731
Table 7: LPPL parameters for several fits for Nikkei
35

IWOP (USD) IWOP (JPY)1/03/1975 100.00 100.001/09/1975 111.44 114.811/03/1976 51.46 52.501/09/1976 65.29 63.841/03/1977 67.51 63.721/09/1977 91.41 82.291/03/1978 102.75 78.131/09/1978 79.26 51.031/03/1979 102.87 73.291/09/1979 100.17 76.181/03/1980 121.21 102.571/09/1980 105.65 77.301/03/1981 122.29 86.931/09/1981 75.88 59.361/03/1982 62.02 50.801/09/1982 82.11 73.431/03/1983 72.64 58.821/09/1983 103.10 85.171/03/1984 80.48 61.771/09/1984 55.12 46.001/03/1985 81.67 71.841/09/1985 104.36 84.151/03/1986 96.04 58.461/09/1986 140.89 74.221/03/1987 159.51 82.291/09/1987 145.32 70.751/03/1988 226.17 97.941/09/1988 189.37 86.661/03/1989 315.31 139.901/09/1989 308.69 152.411/03/1990 225.78 117.721/09/1990 229.41 108.501/03/1991 143.69 67.051/09/1991 130.45 59.761/03/1992 131.49 59.411/09/1992 158.02 66.011/03/1993 117.04 46.611/09/1993 174.42 62.501/03/1994 142.01 50.811/09/1994 130.13 43.76
Table 8: Values of the Impressionist Works on Paper Index in USD and in yen
36