the 100 largest public water supplies in south...
TRANSCRIPT

THE 100 LARGEST
PUBLIC WATER SUPPLIES
IN SOUTH CAROLINA—2005
STATE OF SOUTH CAROLINADEPARTMENT OF NATURAL
RESOURCES
LAND, WATER ANDCONSERVATION DIVISION
WATER RESOURCESREPORT 37
2005

STATE OF SOUTH CAROLINADEPARTMENT OF NATURAL RESOURCES
LAND, WATER AND CONSERVATION DIVISION
WATER RESOURCES REPORT 37
2005
This document is available on the Department of Natural Resources web site at http://www.dnr.state.sc.us/
THE 100 LARGEST PUBLIC WATER SUPPLIESIN SOUTH CAROLINA—2005
Compiled byRoy Newcome, Jr.

STATE OF SOUTH CAROLINAThe Honorable Mark H. Sanford, Governor
South Carolina Department of Natural Resources
Board Members
Michael G. McShane, Chairman ........................................................................................................... Member-at-Large
R. Michael Campbell, II, Vice-Chairman ................................................................................ 2nd Congressional District
T. Smith Ragsdale, III .............................................................................................................. 1st Congressional District
Stephen L. Davis .................................................................................................................... 3rd Congressional District
Karen Kanes Floyd ................................................................................................................ 4th Congressional District
Frank Murray, Jr. .................................................................................................................... 5th Congressional District
John P. Evans ......................................................................................................................... 6th Congressional District
John E. Frampton, Director
Land, Water and Conservation Division
Alfred H. Vang, Deputy Director
A.W. Badr, Ph.D., Chief, Hydrology Section
ii
iii
CONTENTS
Page
Abstract .................................................................................................................................................................. 1
Introduction ............................................................................................................................................................ 1
Alphabetical listing ................................................................................................................................................ 3
Ranking list ............................................................................................................................................................. 4
Explanation of compilation ..................................................................................................................................... 5
Compilation ............................................................................................................................................................ 6
MAP
Map showing location of public supplies using more than 10 million gallons per day .......................................... 2

1
THE 100 LARGEST PUBLIC WATER SUPPLIESIN SOUTH CAROLINA—2005
Compiled byRoy Newcome, Jr.
ABSTRACT
The 100 largest public water supply systems in South Carolina are using about 565 million gallons per day in the year2005. About 85 percent of the water is obtained from lakes and streams, the rest from wells and springs. Among the 100 largestwater suppliers, 32 purchase all of their water from other systems and 12 others purchase a portion of their supply.
The five largest water suppliers are Greenville, Columbia, Charleston, Spartanburg, and Grand Strand Water and SewerAuthority. Sumter, seventh in size, is the largest supply using only ground water. The range in pumpage for the 100 largestsystems is 66 million gallons per day for the largest to 1.0 million gallons per day for the smallest.
INTRODUCTION
This is the fourth report prepared in this general for-mat. The previous reports were published in 1990, 1995, and2000. All the reports are based on data in the computersystem of the South Carolina Department of Health andEnvironmental Control (DHEC). Where there was reason toquestion the information on the data printout, the watersystem was contacted for verification or correction.
The public water supplies considered herein comprisemunicipal and rural water systems. Several other types ofwater systems provide water that is used by the public,hence must comply with public-supply requirements. Theseother providers are: industries that furnish drinking waterin their facilities or who wholesale water to municipal orprivate utilities; subdivision systems; mobile-home parks;and schools, restaurants, etc.
There are nearly 300 municipal and rural water systemsin South Carolina. They are pumping an average of 610 mgd(million gallons per day). The 100 largest of these systems,described in this report, produce 565 mgd. Lakes and streamsprovide about 85 percent of the public-supply use, wellsand springs the rest.
Thirty-two of the 100 largest systems purchase all oftheir water from other systems, and 12 others purchase someof their water from other systems. It follows, then, that caremust be exercised in calculating the total amount of waterproduced for public supply. The sources of the waterpurveyed by the 100 largest systems are given in the systemdescriptions in this report.
We are using more water all the time. In 1990 the 10largest systems produced 237 mgd; in 1995 it was 252 mgd;in 2000 it was 282 mgd. The current report, for 2005, showsa production of 310 mgd for the 10 largest systems.
Industrial water use is significantly greater than thepublic-supply use, but the data required to reliably estimatethe amount is difficult to obtain. Many industries obtaintheir water from public supplies, but many others are selfsupplied, owning their wells or other withdrawal facilities.Crop irrigation in South Carolina is a relatively small activity.Industrial and irrigation use are not closely monitored andare incompletely reported.
The map shows the location of public supplies thatuse more than 10 million gallons per day. Two items includedin earlier reports are omitted in this one. They are treatmentand per capita use. The procedures related to watertreatment cannot be adequately summarized in the formatof this report. Per capita use is so distorted by localindustrial, commercial, and institutional uses that its valueis questionable without detailed explanation, again beyondthe scope of this report.
The reader will note that population given herein isbroken down into “primary” and “secondary.” Primarypopulation constitutes the number of people who buy theirwater directly from the producer (water system). Secondarypopulation buys its water from water systems that buy theirwater from the producing system. Knowing the foregoingavoids counting the same people twice when calculatingwater use.

2
Public water supplies using more than 10 million gallons per day in South Carolina, in 2005.
30 40 miles2010010
N
Circle area is
proportional
to pumpage.
ANDERSON
OCONEE
PICKENS
GREENVILLE
SPARTANBURGCHEROKEE
UNION
YORK
CHESTERLANCASTER CHESTERFIELD
MARLBORO
DILLON
MARION
HORRY
GEORGETOWN
WILLIAMSBURG
FLORENCE
DARLINGTON
LEE
KERSHAW
FAIRFIELD
NEWBERRY
LAURENS
ABBEVILLE
McCO
RMICK
EDGEFIELD
SALUDA
GREENWOOD
LEXINGTON
RICHLAND
CLARENDON
SUMTER
ORANGEBURG
BERKELEY
DORCHESTER
COLLETON
JASPER
HAMPTON
ALLENDALE
BARNWELL
BAMBERG
BEAUFORT
CHARLE
STO
N
CALHOUN
AIKEN
Charleston
Santee CooperRegional Water System
Greenville
Columbia
Spartanburg
Anderson
Grand Strand WSASumter
Myrtle Beach
Greenwood
Beaufort-Jasper WSA
Florence
Rock Hill
Catawba River WTP

3
ALPHABETICAL LISTING
Page Page
Abbeville ........................................................................... 15Aiken .................................................................................. 9Alligator Rural Water Co. ................................................. 19Anderson Regional Joint Water System ............................. 7Barnwell ............................................................................ 23Batesburg–Leesville .......................................................... 29Beaufort–Jasper WSA ........................................................ 7Beech Island WD .............................................................. 26Belton ............................................................................... 30Belton–Honea Path WA ................................................... 20Bennettsville ..................................................................... 18Berkeley County WSA/Sangaree WD .............................. 14Bishopville ........................................................................ 25Blue Ridge Water Co. ........................................................ 18Breezy Hill WD ................................................................ 20Broad Creek PSD .............................................................. 22Camden ............................................................................. 20Cassatt Water Co. ............................................................. 19Catawba River Water Treatment Plant ............................... 9Cayce ................................................................................ 15Charleston ........................................................................... 6Cheraw .............................................................................. 22Chester Metro .................................................................. 16Chesterfield County Rural Water Co. ............................... 23Clemson ............................................................................ 24Clemson University .......................................................... 29Clinton .............................................................................. 15Columbia ............................................................................. 6Conway ............................................................................ 19Darlington ......................................................................... 28Darlington County WSA .................................................. 13Dillon ................................................................................ 27Easley Central WD ........................................................... 24Easley Combined Utilities ................................................ 10Edgefield County WSA .................................................... 13Electric City Utilities ........................................................ 12Florence .............................................................................. 8Fort Jackson ..................................................................... 18Gaffney ............................................................................. 10Georgetown ...................................................................... 23Georgetown County WSD/Waccamaw Neck ................... 14Goose Creek ..................................................................... 21Grand Strand WSA ............................................................. 7Greenville ............................................................................ 6Greenwood ......................................................................... 9Greer ................................................................................. 11Hammond WD .................................................................. 25Hartsville .......................................................................... 27High Hills WD .................................................................. 28Hilton Head Plantation Utilities ....................................... 23Hilton Head PSD 1 ........................................................... 24Inman–Campobello WD ................................................... 17Isle of Palms WSC ............................................................ 26Kiawah Island Utility ....................................................... 16Kingstree ........................................................................... 29
Lake City .......................................................................... 30Lancaster ........................................................................... 21Lancaster County WSD .................................................... 13Laurens ............................................................................. 16Laurens County WSC ....................................................... 16Lexington .......................................................................... 21Lexington County Joint Municipal WSC ......................... 17Liberty–Chesnee–Fingerville WD .................................... 27Little River WSA .............................................................. 26Lugoff–Elgin WA .............................................................. 19Manning ............................................................................ 29Marco Rural Water Co. ..................................................... 24Marion .............................................................................. 26McCormick CPW ............................................................. 30Mount Pleasant ................................................................ 10Myrtle Beach ...................................................................... 7Newberry .......................................................................... 12North Augusta .................................................................. 13North Myrtle Beach ......................................................... 14Orangeburg ........................................................................ 10Pickens .............................................................................. 22Pioneer Rural WD ............................................................. 27Powdersville WD .............................................................. 17Rock Hill ............................................................................. 8Saluda County WSA ......................................................... 30Sandy Springs Water Co. .................................................. 20Santee Cooper Regional Water System ............................... 8Seneca ............................................................................... 11South Island PSD .............................................................. 11Spartanburg ......................................................................... 6St. Johns Water Co. .......................................................... 12Starr–Iva WD .................................................................... 28SJWD WD ........................................................................ 12Summerville ...................................................................... 11Sumter ................................................................................. 8TRICO Water Co. ............................................................. 15Union ................................................................................ 14Walhalla ............................................................................. 25Walterboro ........................................................................ 21West Anderson WD .......................................................... 28West Columbia .................................................................... 9Westminster ...................................................................... 18Winnsboro ........................................................................ 22Woodruff–Roebuck WD ................................................... 17York County East WD ..................................................... 25
Note: CPW, Commission of Public WorksPSD, Public Service DistrictWA, Water AssociationWD, Water DistrictWSA, Water & Sewer AuthorityWSC, Water & Sewer CommissionWSD, Water & Sewer District

4
RANKING LISTAverage pumpage
Rank (mgd)
Greenville ........................................................................ 1 ...................................................................... 66Columbia ......................................................................... 2 ...................................................................... 65Charleston ....................................................................... 3 ...................................................................... 49Spartanburg ..................................................................... 4 ...................................................................... 33Grand Strand WSA ......................................................... 5 ...................................................................... 20Beaufort-Jasper WSA ..................................................... 6 ...................................................................... 18Anderson Regional Joint Water System ......................... 7 ...................................................................... 18Myrtle Beach .................................................................. 8 ...................................................................... 14Sumter ............................................................................. 9 ...................................................................... 14Florence ........................................................................ 10 ...................................................................... 13Santee Cooper Regional Water System ......................... 11 ...................................................................... 13Rock Hill ....................................................................... 12 ...................................................................... 13Greenwood ................................................................... 13 ...................................................................... 12Catawba River Water Treatment Plant ......................... 14 ...................................................................... 11West Columbia .............................................................. 15 ........................................................................ 9.6Aiken ............................................................................ 16 ........................................................................ 8.8Mount Pleasant ............................................................ 17 ........................................................................ 7.8Orangeburg .................................................................... 18 ........................................................................ 7.8Gaffney ......................................................................... 19 ........................................................................ 7.7Easley Combined Utilities ............................................ 20 ........................................................................ 7.5Seneca ........................................................................... 21 ........................................................................ 7.0Summerville .................................................................. 22 ........................................................................ 6.6Greer ............................................................................. 23 ........................................................................ 6.5South Island PSD .......................................................... 24 ........................................................................ 6.3SJWD WD .................................................................... 25 ........................................................................ 6.2Electric City Utilities .................................................... 26 ........................................................................ 6.0Newberry ...................................................................... 27 ........................................................................ 5.1St. Johns Water Co. ...................................................... 28 ........................................................................ 4.7Lancaster County WSD ................................................ 29 ........................................................................ 4.5Darlington County WSA .............................................. 30 ........................................................................ 4.4North Augusta .............................................................. 31 ........................................................................ 4.2Edgefield County WSA ................................................ 32 ........................................................................ 4.1North Myrtle Beach ..................................................... 33 ........................................................................ 4.1Union ............................................................................ 34 ........................................................................ 3.4Berkeley County WSA/Sangaree WD .......................... 35 ........................................................................ 3.4Georgetown County WSD/Waccamaw Neck ............... 36 ........................................................................ 3.3Cayce ............................................................................ 37 ........................................................................ 3.1TRICO Water Co. ......................................................... 38 ........................................................................ 3.0Abbeville ....................................................................... 39 ........................................................................ 2.9Clinton .......................................................................... 40 ........................................................................ 2.8Chester Metro .............................................................. 41 ........................................................................ 2.8Laurens County WSC ................................................... 42 ........................................................................ 2.8Laurens ......................................................................... 43 ........................................................................ 2.4Kiawah Island Utility ................................................... 44 ........................................................................ 2.4Powdersville WD .......................................................... 45 ........................................................................ 2.3Inman-Campobello WD ................................................ 46 ........................................................................ 2.3Lexington County Joint Municipal WSC ..................... 47 ........................................................................ 2.3Woodruff-Roebuck WD ................................................ 48 ........................................................................ 2.2Westminster .................................................................. 49 ........................................................................ 2.2Bennettsville ................................................................. 50 ........................................................................ 2.2Fort Jackson ................................................................. 51 ........................................................................ 2.2Blue Ridge Water Co. .................................................... 52 ........................................................................ 2.2Conway ................................................................ 53 ................................................................. 2.1Cassatt Water Co. ................................................. 54 ................................................................. 2.1Lugoff-Elgin WA .................................................. 55 ................................................................. 2.0Alligator Rural Water Co. ..................................... 56 ................................................................. 2.0

5
RANKING LIST (continued)Average pumpage
Rank (mgd)
Camden ................................................................. 57 ................................................................. 2.0Breezy Hill WD ..................................................... 58 ................................................................. 2.0Sandy Springs Water Co. ..................................... 59 ................................................................. 1.9Belton-Honea Path WA ........................................ 60 ................................................................. 1.9Goose Creek .......................................................... 61 ................................................................. 1.9Lancaster .............................................................. 62 ................................................................. 1.9Walterboro ............................................................ 63 ................................................................. 1.9Lexington .............................................................. 64 ................................................................. 1.8Winnsboro ............................................................ 65 ................................................................. 1.7Pickens ................................................................. 66 ................................................................. 1.7Cheraw .................................................................. 67 ................................................................. 1.7Broad Creek PSD .................................................. 68 ................................................................. 1.6Chesterfield Rural Water Co. ................................ 69 ................................................................. 1.6Barnwell ................................................................ 70 ................................................................. 1.6Georgetown .......................................................... 71 ................................................................. 1.6Hilton Head Plantation Utilities ............................ 72 ................................................................. 1.5Hilton Head PSD 1 ................................................ 73 ................................................................. 1.5Clemson ................................................................ 74 ................................................................. 1.5Marco Rural Water Co. ......................................... 75 ................................................................. 1.5Easley Central WD ............................................... 76 ................................................................. 1.5Walhalla ................................................................ 77 ................................................................. 1.5York County East WD .......................................... 78 ................................................................. 1.5Bishopville ............................................................ 79 ................................................................. 1.5Hammond WD ...................................................... 80 ................................................................. 1.4Beech Island WD ................................................. 81 ................................................................. 1.4Marion .................................................................. 82 ................................................................. 1.4Little River WSA .................................................. 83 ................................................................. 1.4Isle of Palms WSC ................................................ 84 ................................................................. 1.4Dillon .................................................................... 85 ................................................................. 1.4Pioneer Rural WD ................................................. 86 ................................................................. 1.3Hartsville .............................................................. 87 ................................................................. 1.3Liberty-Chesnee-Fingerville WD .......................... 88 ................................................................. 1.3High Hills WD ...................................................... 89 ................................................................. 1.2Darlington ............................................................. 90 ................................................................. 1.1Starr-Iva WD ........................................................ 91 ................................................................. 1.1West Anderson WD ............................................. 92 ................................................................. 1.1Batesburg-Leesville .............................................. 93 ................................................................. 1.1Kingstree .............................................................. 94 ................................................................. 1.1Clemson University .............................................. 95 ................................................................. 1.1Manning ............................................................... 96 ................................................................. 1.1Lake City ............................................................... 97 ................................................................. 1.0McCormick CPW .................................................. 98 ................................................................. 1.0Belton ................................................................... 99 ................................................................. 1.0Saluda County WSA .......................................... 100 ................................................................. 1.0
EXPLANATION OF COMPILATION
Most items in the compilation are self-explanatory, but a few may need clarification. The storage listed includes elevated(EL) and ground (GR); storage is in millions of gallons. “Population served” has been broken down into “primary,” which isthe number of people who purchase their water directly from the named supplier, and “secondary,” which is the number ofpeople who purchase water from the system that buys water from the named supplier.

6
GREENVILLE
Greenville County
POPULATION SERVED: 310,500 (primary); 18,650 (secondary)
SOURCE(S) OF SUPPLY: North Saluda and Table Rock Reservoirs and Lake Keowee
AVERAGE PUMPAGE: 66 mgd RANK IN SIZE: 1
PLANT CAPACITY: 105 mgd STORAGE (mil gal): EL 3.5 GR 106
REMARKS: 5-10 mgd sold to 14 smaller systems.
COLUMBIA
Richland County
POPULATION SERVED: 223,660 (primary); 32,841 (secondary)
SOURCE(S) OF SUPPLY: Broad River (Columbia Canal) and Lake Murray, about 50 percent from each
AVERAGE PUMPAGE: 65 mgd RANK IN SIZE: 2
PLANT CAPACITY: 126 mgd STORAGE (mil gal): EL 9.0 GR 38
REMARKS: 2¼ mgd sold to Fort Jackson.
CHARLESTON
Charleston County
POPULATION SERVED: 327,620 (primary); 41,789 (secondary)
SOURCE(S) OF SUPPLY: Bushy River Reservoir and Edisto River; Goose Creek Reservoir and Ashley
River serve as backups
AVERAGE PUMPAGE: 49 mgd RANK IN SIZE: 3
PLANT CAPACITY: 118 mgd STORAGE (mil gal): EL 0 GR 22
REMARKS: 11-12 mgd sold to 10 smaller systems.
SPARTANBURG
Spartanburg County
POPULATION SERVED: 117,742 (primary); 67,180 (secondary)
SOURCE(S) OF SUPPLY: South Pacolet River and Lake Blalock
AVERAGE PUMPAGE: 33 mgd RANK IN SIZE: 4
PLANT CAPACITY: 79 mgd STORAGE (mil gal): EL 4.2 GR 20
REMARKS: About 14 mgd sold to eight smaller systems.

7
GRAND STRAND WATER AND SEWER AUTHORITY
Horry County
POPULATION SERVED: 85,960 (primary); 34,857 (secondary)
SOURCE(S) OF SUPPLY: Bull Creek, plus about 20 wells in the Black Creek Formation
AVERAGE PUMPAGE: 20 mgd RANK IN SIZE: 5
PLANT CAPACITY: 45 mgd STORAGE (mil gal): EL 3.0 GR 9.5
REMARKS: About 10 mgd sold to Conway, North Myrtle Beach, Little River, Loris, and Georgetown.
The wells are used for aquifer storage and retrieval during peak-demand periods.
BEAUFORT-JASPER WATER AND SEWER AUTHORITY
Beaufort County
POPULATION SERVED: 68,485 (primary); 44,458 (secondary)
SOURCE(S) OF SUPPLY: Savannah River
AVERAGE PUMPAGE: 18 mgd RANK IN SIZE: 6
PLANT CAPACITY: 34 mgd STORAGE (mil gal): EL 3.8 GR 7.9
REMARKS: About 4 mgd sold to 11 water systems.
ANDERSON REGIONAL JOINT WATER SYSTEM
Anderson County
POPULATION SERVED: 14 (primary); 147,681 (secondary)
SOURCE(S) OF SUPPLY: Lake Hartwell (Duke Power Company)
AVERAGE PUMPAGE: 18 mgd RANK IN SIZE: 7
PLANT CAPACITY: 32 mgd STORAGE (mil gal): EL 3.8 GR 19
REMARKS: Entire pumpage sold to 15 water systems.
MYRTLE BEACH
Horry County
POPULATION SERVED: 25,500 (primary); 25,000 (secondary)
SOURCE(S) OF SUPPLY: Atlantic Intracoastal Waterway and eight wells in the Black Creek Formation
AVERAGE PUMPAGE: 14 mgd RANK IN SIZE: 8
PLANT CAPACITY: 40 mgd STORAGE (mil gal): EL 5.2 GR 7.0
REMARKS: 4 mgd sold to North Myrtle Beach.

8
SUMTER
Sumter County
POPULATION SERVED: 56,012 (primary); 701 (secondary)
SOURCE(S) OF SUPPLY: Nineteen wells in the Black Creek and Middendorf Formations
AVERAGE PUMPAGE: 14 mgd RANK IN SIZE: 9
PLANT CAPACITY: 22 mgd STORAGE (mil gal): EL 3.2 GR 5.0
REMARKS: Largest ground-water based public supply in South Carolina.
FLORENCE
Florence County
POPULATION SERVED: 70,000 (primary); 0 (secondary)
SOURCE(S) OF SUPPLY: Twenty-nine wells in the Black Creek and Middendorf Formations and the
Great Pee Dee River
AVERAGE PUMPAGE: 13 mgd RANK IN SIZE: 10
PLANT CAPACITY: 31 mgd STORAGE (mil gal): EL 5.1 GR 2.25
SANTEE COOPER REGIONAL WATER SYSTEM
Berkeley County
POPULATION SERVED: 25 (primary); 115,743 (secondary)
SOURCE(S) OF SUPPLY: Lake Moultrie
AVERAGE PUMPAGE: 13 mgd RANK IN SIZE: 11
PLANT CAPACITY: 31 mgd STORAGE (mil gal): EL 1.0 GR 5.0
REMARKS: Supplies part or all the water for Goose Creek, Moncks Corner, and Summerville and
the Berkeley County Water and Sanitation Authority.
ROCK HILL
York County
POPULATION SERVED: 59,400 (primary); 21,290 (secondary)
SOURCE(S) OF SUPPLY: Lake Wylie and Catawba River
AVERAGE PUMPAGE: 13 mgd RANK IN SIZE: 12
PLANT CAPACITY: 24 mgd STORAGE (mil gal): EL 3.5 GR 2.0
REMARKS: About 3 mgd sold to Fort Mill and York County West Water District.

9
GREENWOOD
Greenwood County
POPULATION SERVED: 44,095 (primary); 9,522 (secondary)
SOURCE(S) OF SUPPLY: Lake Greenwood
AVERAGE PUMPAGE: 12 mgd RANK IN SIZE: 13
PLANT CAPACITY: 30 mgd STORAGE (mil gal): EL 3.8 GR 7.0
REMARKS: About 700,000 gpd sold to smaller systems.
CATAWBA RIVER WATER TREATMENT PLANT
Lancaster County
POPULATION SERVED: 25 (primary); 100,000 (secondary)
SOURCE(S) OF SUPPLY: Catawba River
AVERAGE PUMPAGE: 11 mgd RANK IN SIZE: 14
PLANT CAPACITY: 18 mgd STORAGE (mil gal): EL 0 GR 16
REMARKS: Supplies water to about 65,000 people in Union County, N.C., and 43,000 in Lancaster
County, S.C., through several water systems. About 25 percent of the pumpage is
used by industries.
WEST COLUMBIA
Lexington County
POPULATION SERVED: 26,977 (primary); 34,808 (secondary)
SOURCE(S) OF SUPPLY: Saluda River and Lake Murray, and purchased from Cayce
AVERAGE PUMPAGE: 9.6 mgd RANK IN SIZE: 15
PLANT CAPACITY: 20 mgd STORAGE (mil gal): EL 3.5 GR 8.6
REMARKS: Much of the output is sold to other water systems, including City of Lexington and the
Lexington County Joint Municipal Water and Sewer Commission.
AIKEN
Aiken County
POPULATION SERVED: 37,368 (primary); 0 (secondary)
SOURCE(S) OF SUPPLY: Eight wells in the Middendorf Formation; also Shaw Creek
AVERAGE PUMPAGE: 8.8 mgd RANK IN SIZE: 16
PLANT CAPACITY: 13 mgd STORAGE (mil gal): EL 2.6 GR 2.0

10
MOUNT PLEASANT
Charleston County
POPULATION SERVED: 54,309 (primary); 0 (secondary)
SOURCE(S) OF SUPPLY: Six deep wells in the Middendorf Formation and purchased water from
Charleston
AVERAGE PUMPAGE: 7.8 mgd RANK IN SIZE: 17
PLANT CAPACITY: 26 mgd STORAGE (mil gal): EL 0.5 GR 9.3
ORANGEBURG
Orangeburg County
POPULATION SERVED: 60,000 (primary); 1,000 (secondary)
SOURCE(S) OF SUPPLY: North Edisto River
AVERAGE PUMPAGE: 7.8 mgd RANK IN SIZE: 18
PLANT CAPACITY: 19 mgd STORAGE (mil gal): EL 2.6 GR 4.8
REMARKS: About 70,000 gpd sold to Norway.
GAFFNEY
Cherokee County
POPULATION SERVED: 22,270 (primary); 11,000 (secondary)
SOURCE(S) OF SUPPLY: Lake Whelchel and Broad River
AVERAGE PUMPAGE: 7.7 mgd RANK IN SIZE: 19
PLANT CAPACITY: 15 mgd STORAGE (mil gal): EL 2.5 GR 4.6
REMARKS: About 2 mgd sold to smaller systems. A considerable portion of Gaffney’s pumpage is
used by industry.
EASLEY COMBINED UTILITIES
Pickens County
POPULATION SERVED: 30,300 (primary); 28,507 (secondary)
SOURCE(S) OF SUPPLY: Saluda Lake and purchased from Greenville
AVERAGE PUMPAGE: 7.5 mgd RANK IN SIZE: 20
PLANT CAPACITY: 9 mgd STORAGE (mil gal): EL 3.2 GR 4.0
REMARKS: About 1 mgd sold to smaller systems.

11
SENECA
Oconee County
POPULATION SERVED: 24,482 (primary); 10,384 (secondary)
SOURCE(S) OF SUPPLY: Lake Keowee
AVERAGE PUMPAGE: 7.0 mgd RANK IN SIZE: 21
PLANT CAPACITY: 14 mgd STORAGE (mil gal): EL 1.6 GR 4.0
REMARKS: About 1½ mgd sold to smaller systems.
SUMMERVILLE
Dorchester County
POPULATION SERVED: 57,563 (primary); 2,850 (secondary)
SOURCE(S) OF SUPPLY: Purchased from Santee Cooper Regional Water System
AVERAGE PUMPAGE: 6.6 mgd RANK IN SIZE: 22
PLANT CAPACITY: 17 mgd STORAGE (mil gal): EL 1.6 GR 1.2
REMARKS: About 20,000 gpd sold to smaller systems.
GREER
Greenville County
POPULATION SERVED: 31,000 (primary); 15,302 (secondary)
SOURCE(S) OF SUPPLY: South Tyger River
AVERAGE PUMPAGE: 6.5 mgd RANK IN SIZE: 23
PLANT CAPACITY: 16 mgd STORAGE (mil gal): EL 4.2 GR 8.0
REMARKS: About 2 mgd sold to Blue Ridge Water Co.
SOUTH ISLAND PUBLIC SERVICE DISTRICT
Beaufort County
POPULATION SERVED: 24,129 (primary); 0 (secondary)
SOURCE(S) OF SUPPLY: Eighteen wells in the Floridian Aquifer
AVERAGE PUMPAGE: 6.3 mgd RANK IN SIZE: 24
PLANT CAPACITY: 15.7 mgd STORAGE (mil gal): EL 0.9 GR 2.1

12
STARTEX-JACKSON-WELLFORD-DUNCAN WATER DISTRICT (SJWD)
Spartanburg County
POPULATION SERVED: 39,600 (primary); 820 (secondary)
SOURCE(S) OF SUPPLY: Lyman Lake (on Middle Tyger River)
AVERAGE PUMPAGE: 6.2 mgd RANK IN SIZE: 25
PLANT CAPACITY: 12 mgd STORAGE (mil gal): EL 1.6 GR 13.2
ELECTRIC CITY UTILITIES
Anderson County
POPULATION SERVED: 43,750 (primary); 0 (secondary)
SOURCE(S) OF SUPPLY: Purchased from Anderson Regional Joint Water System
AVERAGE PUMPAGE: 6.0 mgd RANK IN SIZE: 26
PLANT CAPACITY: 10.5 mgd STORAGE (mil gal): EL 2.6 GR 0
NEWBERRY
Newberry County
POPULATION SERVED: 10,258 (primary); 9,250 (secondary)
SOURCE(S) OF SUPPLY: Saluda River
AVERAGE PUMPAGE: 5.1 mgd RANK IN SIZE: 27
PLANT CAPACITY: 8.1 mgd STORAGE (mil gal): EL 1.5 GR 2.5
REMARKS: About 1 mgd sold to Newberry County Water and Sewer Authority.
ST. JOHNS WATER COMPANY
Charleston County
POPULATION SERVED: 8,150 (primary); 12,411 (secondary)
SOURCE(S) OF SUPPLY: Purchased from Charleston
AVERAGE PUMPAGE: 4.7 mgd RANK IN SIZE: 28
PLANT CAPACITY: 10 mgd STORAGE (mil gal): EL 0.2 GR 0.8
REMARKS: About 3 mgd sold to Kiawah Island and Seabrook Island.

13
LANCASTER COUNTY WATER AND SEWER DISTRICT
Lancaster County
POPULATION SERVED: 43,200 (primary); 18,500 (secondary)
SOURCE(S) OF SUPPLY: Purchased from Catawba River Water Treatment Plant
AVERAGE PUMPAGE: 4.5 mgd RANK IN SIZE: 29
PLANT CAPACITY: 7.1 mgd STORAGE (mil gal): EL 4.0 GR 16.0
REMARKS: About 500,000 gpd sold to Kershaw.
DARLINGTON COUNTY WATER AND SEWER AUTHORITY
Darlington County
POPULATION SERVED: 38,434 (primary); 0 (secondary)
SOURCE(S) OF SUPPLY: Twelve wells in the Middendorf Formation
AVERAGE PUMPAGE: 4.4 mgd RANK IN SIZE: 30
PLANT CAPACITY: 8.9 mgd STORAGE (mil gal): EL 5.3 GR 3.0
REMARKS: Connects with Darlington, Hartsville, and Lamar for emergency use.
NORTH AUGUSTA
Aiken County
POPULATION SERVED: 25,581 (primary); 1,412 (secondary)
SOURCE(S) OF SUPPLY: Savannah River
AVERAGE PUMPAGE: 4.2 mgd RANK IN SIZE: 31
PLANT CAPACITY: 26 mgd STORAGE (mil gal): EL 1.4 GR 1.8
REMARKS: Sells to Breezy Hill Water District.
EDGEFIELD COUNTY WATER AND SEWER AUTHORITY
Edgefield County
POPULATION SERVED: 18,600 (primary); 2,600 (secondary)
SOURCE(S) OF SUPPLY: Savannah River
AVERAGE PUMPAGE: 4.1 mgd RANK IN SIZE: 32
PLANT CAPACITY: 7.0 mgd STORAGE (mil gal): EL 2.0 GR 3.6

14
NORTH MYRTLE BEACH
Horry County
POPULATION SERVED: 24,954 (primary); 0 (secondary)
SOURCE(S) OF SUPPLY: Purchased from Myrtle Beach
AVERAGE PUMPAGE: 4.1 mgd RANK IN SIZE: 33
PLANT CAPACITY: 10 mgd STORAGE (mil gal): EL 2.2 GR 2.0
UNION
Union County
POPULATION SERVED: 10,090 (primary); 12,637 (secondary)
SOURCE(S) OF SUPPLY: Broad River
AVERAGE PUMPAGE: 3.4 mgd RANK IN SIZE: 34
PLANT CAPACITY: 10 mgd STORAGE (mil gal): EL 2.3 GR 2.4
REMARKS: About 1½ mgd sold to smaller systems.
BERKELEY COUNTY WATER AND SEWER AUTHORITY
SANGAREE WATER DISTRICT
Berkeley County
POPULATION SERVED: 26,512 (primary); 1,820 (secondary)
SOURCE(S) OF SUPPLY: Purchased from Santee Cooper Regional Water System
AVERAGE PUMPAGE: 3.4 mgd RANK IN SIZE: 35
PLANT CAPACITY: 8.6 mgd STORAGE (mil gal): EL 2.9 GR 0
GEORGETOWN COUNTY WATER AND SEWER DISTRICT
WACCAMAW NECK
Georgetown County
POPULATION SERVED: 25,439 (primary); 1,882 (secondary)
SOURCE(S) OF SUPPLY: Waccamaw River
AVERAGE PUMPAGE: 3.3 mgd RANK IN SIZE: 36
PLANT CAPACITY: 6.0 mgd STORAGE (mil gal): EL 0.75 GR 1.5
15
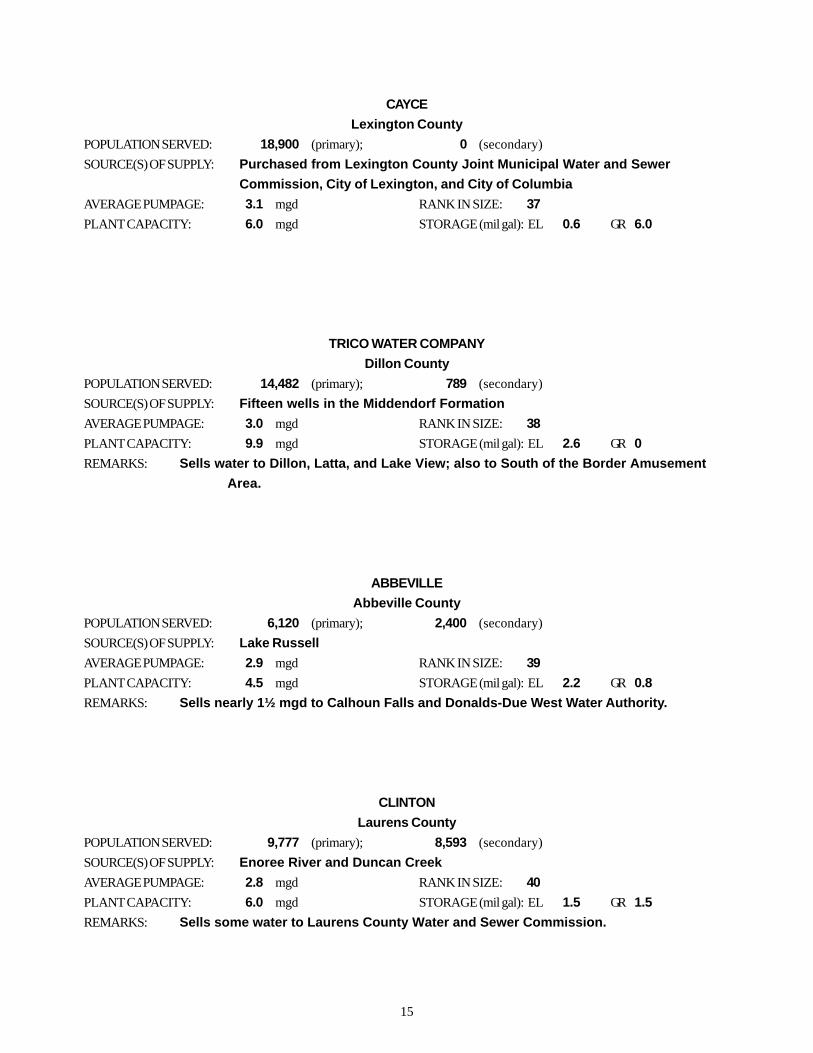
CAYCE
Lexington County
POPULATION SERVED: 18,900 (primary); 0 (secondary)
SOURCE(S) OF SUPPLY: Purchased from Lexington County Joint Municipal Water and Sewer
Commission, City of Lexington, and City of Columbia
AVERAGE PUMPAGE: 3.1 mgd RANK IN SIZE: 37
PLANT CAPACITY: 6.0 mgd STORAGE (mil gal): EL 0.6 GR 6.0
TRICO WATER COMPANY
Dillon County
POPULATION SERVED: 14,482 (primary); 789 (secondary)
SOURCE(S) OF SUPPLY: Fifteen wells in the Middendorf Formation
AVERAGE PUMPAGE: 3.0 mgd RANK IN SIZE: 38
PLANT CAPACITY: 9.9 mgd STORAGE (mil gal): EL 2.6 GR 0
REMARKS: Sells water to Dillon, Latta, and Lake View; also to South of the Border Amusement
Area.
ABBEVILLE
Abbeville County
POPULATION SERVED: 6,120 (primary); 2,400 (secondary)
SOURCE(S) OF SUPPLY: Lake Russell
AVERAGE PUMPAGE: 2.9 mgd RANK IN SIZE: 39
PLANT CAPACITY: 4.5 mgd STORAGE (mil gal): EL 2.2 GR 0.8
REMARKS: Sells nearly 1½ mgd to Calhoun Falls and Donalds-Due West Water Authority.
CLINTON
Laurens County
POPULATION SERVED: 9,777 (primary); 8,593 (secondary)
SOURCE(S) OF SUPPLY: Enoree River and Duncan Creek
AVERAGE PUMPAGE: 2.8 mgd RANK IN SIZE: 40
PLANT CAPACITY: 6.0 mgd STORAGE (mil gal): EL 1.5 GR 1.5
REMARKS: Sells some water to Laurens County Water and Sewer Commission.

16
CHESTER METRO
Chester County
POPULATION SERVED: 14,500 (primary); 1,100 (secondary)
SOURCE(S) OF SUPPLY: Catawba River
AVERAGE PUMPAGE: 2.8 mgd RANK IN SIZE: 41
PLANT CAPACITY: 7.6 mgd STORAGE (mil gal): EL 1.0 GR 4.3
LAURENS COUNTY WATER AND SEWER COMMISSION
Laurens County
POPULATION SERVED: 26,959 (primary); 1,050 (secondary)
SOURCE(S) OF SUPPLY: Purchased from Laurens CPW, Clinton, and Greenville
AVERAGE PUMPAGE: 2.8 mgd RANK IN SIZE: 42
PLANT CAPACITY: 5.7 mgd STORAGE (mil gal): EL 1.8 GR 0
REMARKS: About 73,000 gpd sold to Gray Court.
LAURENS
Laurens County
POPULATION SERVED: 10,674 (primary); 8,287 (secondary)
SOURCE(S) OF SUPPLY: Reedy Creek, Rabon Creek, and Lake Rabon
AVERAGE PUMPAGE: 2.4 mgd RANK IN SIZE: 43
PLANT CAPACITY: 8.0 mgd STORAGE (mil gal): EL 3.15 GR 1.5
REMARKS: About ¾ mgd sold to Laurens County WSC.
KIAWAH ISLAND UTILITY
Charleston County
POPULATION SERVED: 7,016 (primary); 152 (secondary)
SOURCE(S) OF SUPPLY: Purchased from St. Johns Water Company and one deep well
AVERAGE PUMPAGE: 2.4 mgd RANK IN SIZE: 44
PLANT CAPACITY: 6.0 mgd STORAGE (mil gal): EL 0 GR 4.5
REMARKS: Two additional wells are used for aquifer storage and retrieval.

17
POWDERSVILLE WATER DISTRICT
Anderson County
POPULATION SERVED: 23,938 (primary); 0 (secondary)
SOURCE(S) OF SUPPLY: Purchased from Easley Combined Utility System, Greenville Water System,
and Anderson Regional Joint Water System
AVERAGE PUMPAGE: 2.3 mgd RANK IN SIZE: 45
PLANT CAPACITY: 6.5 mgd STORAGE (mil gal): EL 0.9 GR 2.0
INMAN-CAMPOBELLO WATER DISTRICT
Spartanburg County
POPULATION SERVED: 20,837 (primary); 0 (secondary)
SOURCE(S) OF SUPPLY: Purchased from Spartanburg
AVERAGE PUMPAGE: 2.3 mgd RANK IN SIZE: 46
PLANT CAPACITY: 3.5 mgd STORAGE (mil gal): EL 0.8 GR 2.5
LEXINGTON COUNTY JOINT MUNICIPAL WATER AND SEWER COMMISSION
Lexington County
POPULATION SERVED: 12,264 (primary); 2,841 (secondary)
SOURCE(S) OF SUPPLY: Purchased from West Columbia
AVERAGE PUMPAGE: 2.3 mgd RANK IN SIZE: 47
PLANT CAPACITY: 4.3 mgd STORAGE (mil gal): EL 1.8 GR 0
REMARKS: Sells water to Lexington, Cayce, Swansea, Pelion, Gilbert-Summit, and several
subdivisions.
WOODRUFF-ROEBUCK WATER DISTRICT
Spartanburg County
POPULATION SERVED: 21,855 (primary); 0 (secondary)
SOURCE(S) OF SUPPLY: Purchased from Spartanburg
AVERAGE PUMPAGE: 2.2 mgd RANK IN SIZE: 48
PLANT CAPACITY: 6.5 mgd STORAGE (mil gal): EL 1.5 GR 0

18
WESTMINSTER
Oconee County
POPULATION SERVED: 7,200 (primary); 11,148 (secondary)
SOURCE(S) OF SUPPLY: Chauga River and Ramsey Creek, also purchased water from Seneca and
Walhalla
AVERAGE PUMPAGE: 2.2 mgd RANK IN SIZE: 49
PLANT CAPACITY: 4.0 mgd STORAGE (mil gal): EL 0.3 GR 3.2
REMARKS: Sells water to Pioneer Rural Water District and Foxwood Hills Subdivision.
BENNETTSVILLE
Marlboro County
POPULATION SERVED: 10,484 (primary); 0 (secondary)
SOURCE(S) OF SUPPLY: Eight wells in the Middendorf Formation and Lake Paul Wallace
AVERAGE PUMPAGE: 2.2 mgd RANK IN SIZE: 50
PLANT CAPACITY: 4.8 mgd STORAGE (mil gal): EL 1.25 GR 1.5
FORT JACKSON (U.S. ARMY)
Richland County
POPULATION SERVED: 32,841 (primary); 0 (secondary)
SOURCE(S) OF SUPPLY: Purchased from Columbia
AVERAGE PUMPAGE: 2.2 mgd RANK IN SIZE: 51
PLANT CAPACITY: 6.6 mgd STORAGE (mil gal): EL 2.0 GR 0
BLUE RIDGE WATER COMPANY
Greenville County
POPULATION SERVED: 20,134 (primary); 0 (secondary)
SOURCE(S) OF SUPPLY: Purchased from Greer and Greenville
AVERAGE PUMPAGE: 2.2 mgd RANK IN SIZE: 52
PLANT CAPACITY: 4.8 mgd STORAGE (mil gal): EL 0.1 GR 1.6

19
CONWAY
Horry County
POPULATION SERVED: 16,935 (primary); 0 (secondary)
SOURCE(S) OF SUPPLY: Purchased from Grand Strand Water and Sewer Authority
AVERAGE PUMPAGE: 2.1 mgd RANK IN SIZE: 53
PLANT CAPACITY: 4.0 mgd STORAGE (mil gal): EL 1.0 GR 0
CASSATT WATER COMPANY
Kershaw County
POPULATION SERVED: 23,198 (primary); 105 (secondary)
SOURCE(S) OF SUPPLY: Seventeen wells in the Middendorf Formation and purchased water from City
of Camden
AVERAGE PUMPAGE: 2.1 mgd RANK IN SIZE: 54
PLANT CAPACITY: 3.1 mgd STORAGE (mil gal): EL 0.5 GR 2.0
LUGOFF-ELGIN WATER AUTHORITY
Kershaw County
POPULATION SERVED: 13,100 (primary); 0 (secondary)
SOURCE(S) OF SUPPLY: Lake Wateree
AVERAGE PUMPAGE: 2.0 mgd RANK IN SIZE: 55
PLANT CAPACITY: 3.2 mgd STORAGE (mil gal): EL 1.2 GR 1.8
ALLIGATOR RURAL WATER COMPANY
Chesterfield County
POPULATION SERVED: 4,572 (primary); 13,611 (secondary)
SOURCE(S) OF SUPPLY: Nine wells in the Middendorf Formation
AVERAGE PUMPAGE: 2.0 mgd RANK IN SIZE: 56
PLANT CAPACITY: 4.9 mgd STORAGE (mil gal): EL 1.3 GR 0
REMARKS: Sells water to Chesterfield County W&SA and Darlington County W&SA.
20
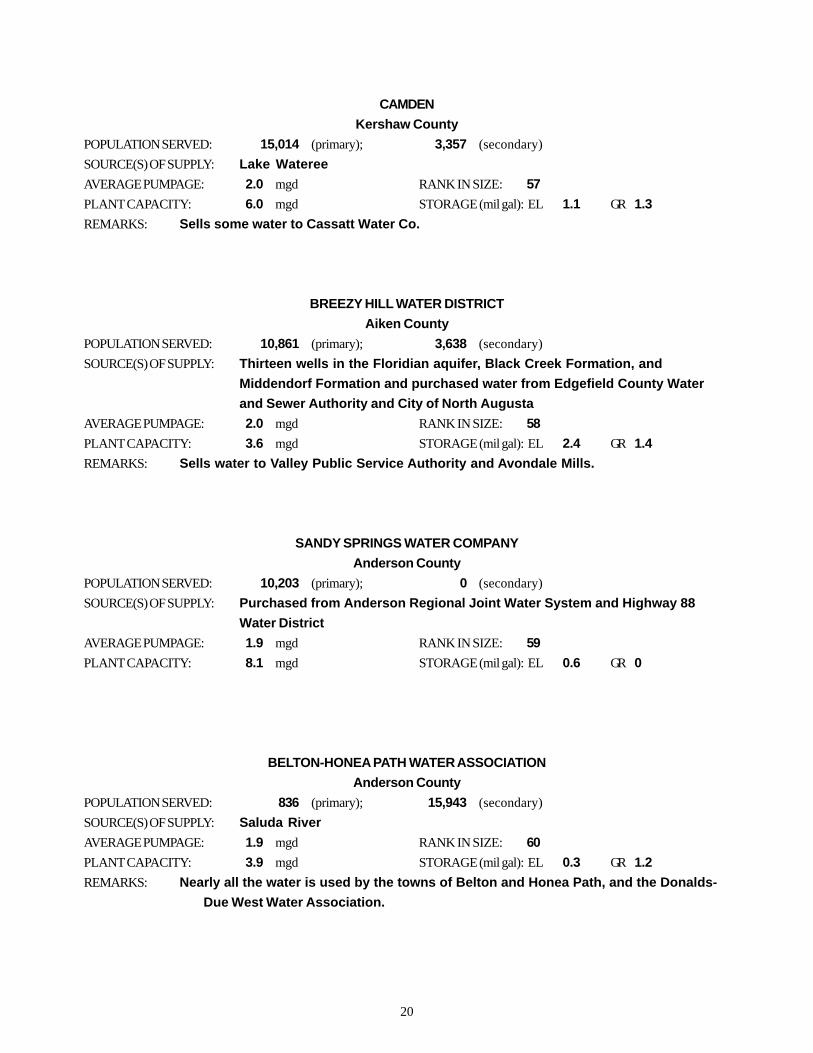
CAMDEN
Kershaw County
POPULATION SERVED: 15,014 (primary); 3,357 (secondary)
SOURCE(S) OF SUPPLY: Lake Wateree
AVERAGE PUMPAGE: 2.0 mgd RANK IN SIZE: 57
PLANT CAPACITY: 6.0 mgd STORAGE (mil gal): EL 1.1 GR 1.3
REMARKS: Sells some water to Cassatt Water Co.
BREEZY HILL WATER DISTRICT
Aiken County
POPULATION SERVED: 10,861 (primary); 3,638 (secondary)
SOURCE(S) OF SUPPLY: Thirteen wells in the Floridian aquifer, Black Creek Formation, and
Middendorf Formation and purchased water from Edgefield County Water
and Sewer Authority and City of North Augusta
AVERAGE PUMPAGE: 2.0 mgd RANK IN SIZE: 58
PLANT CAPACITY: 3.6 mgd STORAGE (mil gal): EL 2.4 GR 1.4
REMARKS: Sells water to Valley Public Service Authority and Avondale Mills.
SANDY SPRINGS WATER COMPANY
Anderson County
POPULATION SERVED: 10,203 (primary); 0 (secondary)
SOURCE(S) OF SUPPLY: Purchased from Anderson Regional Joint Water System and Highway 88
Water District
AVERAGE PUMPAGE: 1.9 mgd RANK IN SIZE: 59
PLANT CAPACITY: 8.1 mgd STORAGE (mil gal): EL 0.6 GR 0
BELTON-HONEA PATH WATER ASSOCIATION
Anderson County
POPULATION SERVED: 836 (primary); 15,943 (secondary)
SOURCE(S) OF SUPPLY: Saluda River
AVERAGE PUMPAGE: 1.9 mgd RANK IN SIZE: 60
PLANT CAPACITY: 3.9 mgd STORAGE (mil gal): EL 0.3 GR 1.2
REMARKS: Nearly all the water is used by the towns of Belton and Honea Path, and the Donalds-
Due West Water Association.

21
GOOSE CREEK
Berkeley County
POPULATION SERVED: 16,860 (primary); 0 (secondary)
SOURCE(S) OF SUPPLY: Purchased water from Santee Cooper Regional Water System and Charleston
AVERAGE PUMPAGE: 1.9 mgd RANK IN SIZE: 61
PLANT CAPACITY: 5.0 mgd STORAGE (mil gal): EL 1.5 GR 5.0
LANCASTER
Lancaster County
POPULATION SERVED: 13,050 (primary); 0 (secondary)
SOURCE(S) OF SUPPLY: Purchased from Springs-Grace Bleachery
AVERAGE PUMPAGE: 1.9 mgd RANK IN SIZE: 62
PLANT CAPACITY: 5.0 mgd STORAGE (mil gal): EL 1.0 GR 1.0
WALTERBORO
Colleton County
POPULATION SERVED: 11,556 (primary); 0 (secondary)
SOURCE(S) OF SUPPLY: Fourteen wells in the Black Mingo and Middendorf Formations
AVERAGE PUMPAGE: 1.9 mgd RANK IN SIZE: 63
PLANT CAPACITY: 3.8 mgd STORAGE (mil gal): EL 0.85 GR 1.0
LEXINGTON
Lexington County
POPULATION SERVED: 7,659 (primary); 177 (secondary)
SOURCE(S) OF SUPPLY: Purchased from West Columbia and Lexington County Joint Municipal Water
and Sewer Commission
AVERAGE PUMPAGE: 1.8 mgd RANK IN SIZE: 64
PLANT CAPACITY: 4.5 mgd STORAGE (mil gal): EL 0.55 GR 0.75
22
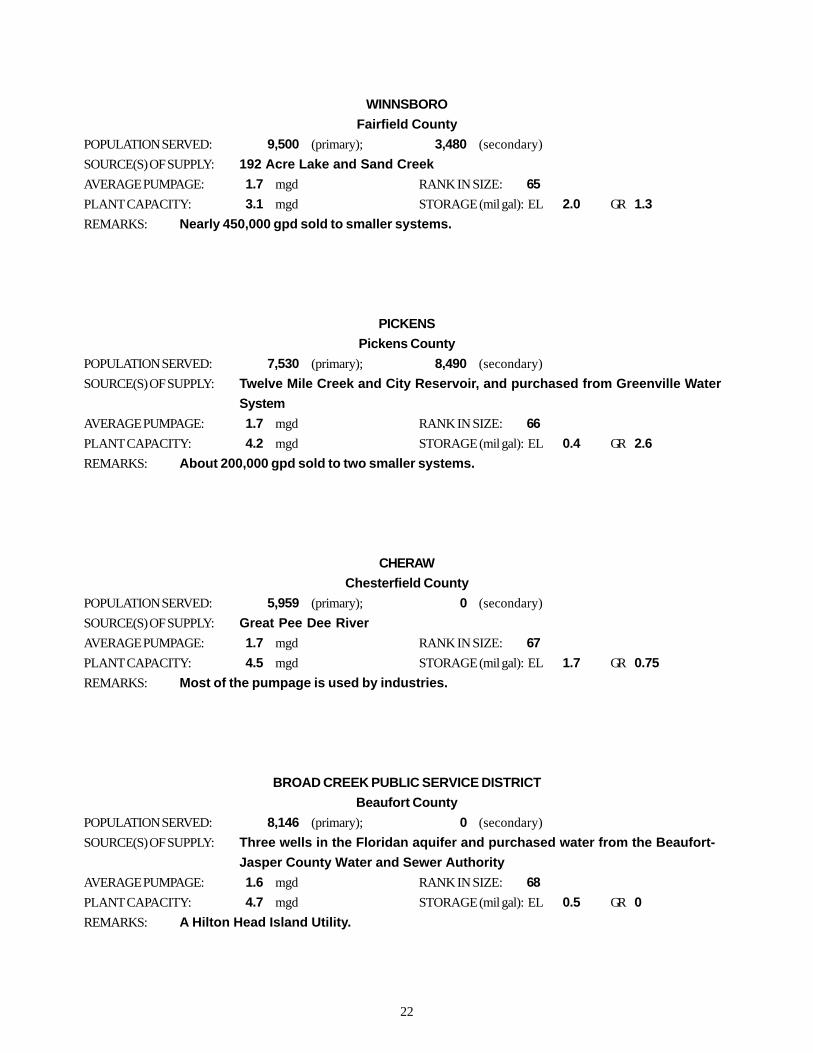
WINNSBORO
Fairfield County
POPULATION SERVED: 9,500 (primary); 3,480 (secondary)
SOURCE(S) OF SUPPLY: 192 Acre Lake and Sand Creek
AVERAGE PUMPAGE: 1.7 mgd RANK IN SIZE: 65
PLANT CAPACITY: 3.1 mgd STORAGE (mil gal): EL 2.0 GR 1.3
REMARKS: Nearly 450,000 gpd sold to smaller systems.
PICKENS
Pickens County
POPULATION SERVED: 7,530 (primary); 8,490 (secondary)
SOURCE(S) OF SUPPLY: Twelve Mile Creek and City Reservoir, and purchased from Greenville Water
System
AVERAGE PUMPAGE: 1.7 mgd RANK IN SIZE: 66
PLANT CAPACITY: 4.2 mgd STORAGE (mil gal): EL 0.4 GR 2.6
REMARKS: About 200,000 gpd sold to two smaller systems.
CHERAW
Chesterfield County
POPULATION SERVED: 5,959 (primary); 0 (secondary)
SOURCE(S) OF SUPPLY: Great Pee Dee River
AVERAGE PUMPAGE: 1.7 mgd RANK IN SIZE: 67
PLANT CAPACITY: 4.5 mgd STORAGE (mil gal): EL 1.7 GR 0.75
REMARKS: Most of the pumpage is used by industries.
BROAD CREEK PUBLIC SERVICE DISTRICT
Beaufort County
POPULATION SERVED: 8,146 (primary); 0 (secondary)
SOURCE(S) OF SUPPLY: Three wells in the Floridan aquifer and purchased water from the Beaufort-
Jasper County Water and Sewer Authority
AVERAGE PUMPAGE: 1.6 mgd RANK IN SIZE: 68
PLANT CAPACITY: 4.7 mgd STORAGE (mil gal): EL 0.5 GR 0
REMARKS: A Hilton Head Island Utility.

23
CHESTERFIELD COUNTY RURAL WATER COMPANY
Chesterfield County
POPULATION SERVED: 14,981 (primary); 0 (secondary)
SOURCE(S) OF SUPPLY: Purchased from Alligator Rural Water Co. (90%) and Anson County, N.C. (10%)
AVERAGE PUMPAGE: 1.6 mgd RANK IN SIZE: 69
PLANT CAPACITY: 2.7 mgd STORAGE (mil gal): EL 1.2 GR 0
REMARKS: Sells water to Pageland and Jefferson.
BARNWELL
Barnwell County
POPULATION SERVED: 5,709 (primary); 492 (secondary)
SOURCE(S) OF SUPPLY: Six wells in the Congaree and Black Mingo Formations
AVERAGE PUMPAGE: 1.6 mgd RANK IN SIZE: 70
PLANT CAPACITY: 2.6 mgd STORAGE (mil gal): EL 0.65 GR 0
GEORGETOWN
Georgetown County
POPULATION SERVED: 9,593 (primary); 1,106 (secondary)
SOURCE(S) OF SUPPLY: Two wells in the Black Creek Formation and the Great Pee Dee River
AVERAGE PUMPAGE: 1.6 mgd RANK IN SIZE: 71
PLANT CAPACITY: 5.2 mgd STORAGE (mil gal): EL 0.8 GR 3.0
HILTON HEAD PLANTATION UTILITIES
Beaufort County
POPULATION SERVED: 12,209 (primary); 1,685 (secondary)
SOURCE(S) OF SUPPLY: Seven wells in the Floridan aquifer
AVERAGE PUMPAGE: 1.5 mgd RANK IN SIZE: 72
PLANT CAPACITY: 6.7 mgd STORAGE (mil gal): EL 0.6 GR 1.0
24
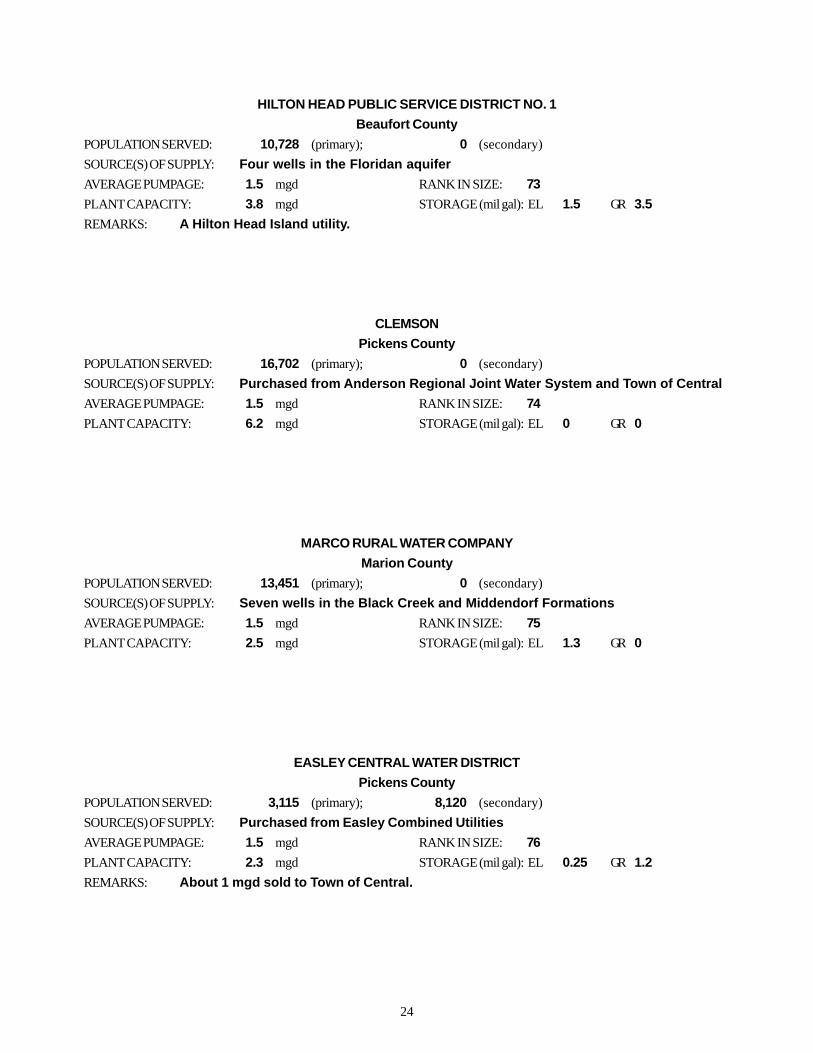
HILTON HEAD PUBLIC SERVICE DISTRICT NO. 1
Beaufort County
POPULATION SERVED: 10,728 (primary); 0 (secondary)
SOURCE(S) OF SUPPLY: Four wells in the Floridan aquifer
AVERAGE PUMPAGE: 1.5 mgd RANK IN SIZE: 73
PLANT CAPACITY: 3.8 mgd STORAGE (mil gal): EL 1.5 GR 3.5
REMARKS: A Hilton Head Island utility.
CLEMSON
Pickens County
POPULATION SERVED: 16,702 (primary); 0 (secondary)
SOURCE(S) OF SUPPLY: Purchased from Anderson Regional Joint Water System and Town of Central
AVERAGE PUMPAGE: 1.5 mgd RANK IN SIZE: 74
PLANT CAPACITY: 6.2 mgd STORAGE (mil gal): EL 0 GR 0
MARCO RURAL WATER COMPANY
Marion County
POPULATION SERVED: 13,451 (primary); 0 (secondary)
SOURCE(S) OF SUPPLY: Seven wells in the Black Creek and Middendorf Formations
AVERAGE PUMPAGE: 1.5 mgd RANK IN SIZE: 75
PLANT CAPACITY: 2.5 mgd STORAGE (mil gal): EL 1.3 GR 0
EASLEY CENTRAL WATER DISTRICT
Pickens County
POPULATION SERVED: 3,115 (primary); 8,120 (secondary)
SOURCE(S) OF SUPPLY: Purchased from Easley Combined Utilities
AVERAGE PUMPAGE: 1.5 mgd RANK IN SIZE: 76
PLANT CAPACITY: 2.3 mgd STORAGE (mil gal): EL 0.25 GR 1.2
REMARKS: About 1 mgd sold to Town of Central.

25
WALHALLA
Oconee County
POPULATION SERVED: 14,880 (primary); 590 (secondary)
SOURCE(S) OF SUPPLY: Coneross Creek
AVERAGE PUMPAGE: 1.5 mgd RANK IN SIZE: 77
PLANT CAPACITY: 3.0 mgd STORAGE (mil gal): EL 0.8 GR 0.4
REMARKS: About 50,000 gpd sold to West Union.
YORK COUNTY EAST WATER DISTRICT
York County
POPULATION SERVED: 5,365 (primary); 829 (secondary)
SOURCE(S) OF SUPPLY: Purchased from Fort Mill
AVERAGE PUMPAGE: 1.5 mgd RANK IN SIZE: 78
PLANT CAPACITY: 2.0 mgd STORAGE (mil gal): EL 1.1 GR 0
BISHOPVILLE
Lee County
POPULATION SERVED: 3,800 (primary); 1,800 (secondary)
SOURCE(S) OF SUPPLY: Five wells in the Middendorf Formation
AVERAGE PUMPAGE: 1.5 mgd RANK IN SIZE: 79
PLANT CAPACITY: 2.1 mgd STORAGE (mil gal): EL 0.8 GR 0
REMARKS: More than half of the pumpage is used by industry.
HAMMOND WATER DISTRICT
Anderson County
POPULATION SERVED: 12,725 (primary); 457 (secondary)
SOURCE(S) OF SUPPLY: Purchased from Anderson Regional Joint Water System
AVERAGE PUMPAGE: 1.4 mgd RANK IN SIZE: 80
PLANT CAPACITY: 5.0 mgd STORAGE (mil gal): EL 1.3 GR 0

26
BEECH ISLAND WATER DISTRICT
Aiken County
POPULATION SERVED: 7,436 (primary); 0 (secondary)
SOURCE(S) OF SUPPLY: Six wells in the Middendorf and Black Creek Formations
AVERAGE PUMPAGE: 1.4 mgd RANK IN SIZE: 81
PLANT CAPACITY: 2.5 mgd STORAGE (mil gal): EL 1.0 GR 0
MARION
Marion County
POPULATION SERVED: 7,682 (primary); 0 (secondary)
SOURCE(S) OF SUPPLY: Nine wells in the Black Creek and Middendorf Formations, and purchased
water from Marco Rural Water Co.
AVERAGE PUMPAGE: 1.4 mgd RANK IN SIZE: 82
PLANT CAPACITY: 4.2 mgd STORAGE (mil gal): EL 0.6 GR 1.8
LITTLE RIVER WATER AND SEWER AUTHORITY
Horry County
POPULATION SERVED: 14,265 (primary); 0 (secondary)
SOURCE(S) OF SUPPLY: Purchased from Grand Strand Water and Sewer Authority
AVERAGE PUMPAGE: 1.4 mgd RANK IN SIZE: 83
PLANT CAPACITY: 4.0 mgd STORAGE (mil gal): EL 0.9 GR 0
ISLE OF PALMS WATER AND SEWER COMMISSION
Charleston County
POPULATION SERVED: 8,801 (primary); 26 (secondary)
SOURCE(S) OF SUPPLY: Purchased from Charleston and one well in the Middendorf Formation
AVERAGE PUMPAGE: 1.4 mgd RANK IN SIZE: 84
PLANT CAPACITY: 2.7 mgd STORAGE (mil gal): EL 0.14 GR 2.2
REMARKS: 1 mgd purchased from Charleston.

27
DILLON
Dillon County
POPULATION SERVED: 7,818 (primary); 0 (secondary)
SOURCE(S) OF SUPPLY: Four wells in the Middendorf Formation and purchased from Trico Water Co.
AVERAGE PUMPAGE: 1.4 mgd RANK IN SIZE: 85
PLANT CAPACITY: 2.1 mgd STORAGE (mil gal): EL 0.6 GR 0.4
PIONEER RURAL WATER DISTRICT
Oconee County
POPULATION SERVED: 16,258 (primary); 0 (secondary)
SOURCE(S) OF SUPPLY: Purchased from Westminster and Seneca
AVERAGE PUMPAGE: 1.3 mgd RANK IN SIZE: 86
PLANT CAPACITY: 2.5 mgd STORAGE (mil gal): EL 1.2 GR 0.2
HARTSVILLE
Darlington County
POPULATION SERVED: 8,056 (primary); 0 (secondary)
SOURCE(S) OF SUPPLY: Four wells in the Middendorf Formation
AVERAGE PUMPAGE: 1.3 mgd RANK IN SIZE: 87
PLANT CAPACITY: 3.2 mgd STORAGE (mil gal): EL 1.6 GR 0.5
REMARKS: Has a two-way connection with Darlington County Water and Sewer Authority for
emergency use.
LIBERTY-CHESNEE-FINGERVILLE WATER DISTRICT (LCF)
Spartanburg County
POPULATION SERVED: 14,280 (primary); 0 (secondary)
SOURCE(S) OF SUPPLY: Purchased from Spartanburg
AVERAGE PUMPAGE: 1.3 mgd RANK IN SIZE: 88
PLANT CAPACITY: 3.2 mgd STORAGE (mil gal): EL 1.1 GR 0.5

28
HIGH HILLS WATER DISTRICT
Sumter County
POPULATION SERVED: 8,854 (primary); 0 (secondary)
SOURCE(S) OF SUPPLY: Five wells in the Middendorf and Black Creek Formations
AVERAGE PUMPAGE: 1.2 mgd RANK IN SIZE: 89
PLANT CAPACITY: 2.3 mgd STORAGE (mil gal): EL 1.0 GR 0
DARLINGTON
Darlington County
POPULATION SERVED: 7,242 (primary); 0 (secondary)
SOURCE(S) OF SUPPLY: Four wells in the Middendorf Formation
AVERAGE PUMPAGE: 1.1 mgd RANK IN SIZE: 90
PLANT CAPACITY: 1.9 mgd STORAGE (mil gal): EL 1.2 GR 0.6
REMARKS: Has a two-way connection with Darlington County Water and Sewer Authority for
emergency use.
STARR-IVA WATER DISTRICT
Anderson County
POPULATION SERVED: 8,818 (primary); 0 (secondary)
SOURCE(S) OF SUPPLY: Purchased from Anderson Regional Joint Water System
AVERAGE PUMPAGE: 1.1 mgd RANK IN SIZE: 91
PLANT CAPACITY: 2.2 mgd STORAGE (mil gal): EL 0.75 GR 0
WEST ANDERSON WATER DISTRICT
Anderson County
POPULATION SERVED: 15,035 (primary); 354 (secondary)
SOURCE(S) OF SUPPLY: Purchased from Anderson Regional Joint Water System
AVERAGE PUMPAGE: 1.1 mgd RANK IN SIZE: 92
PLANT CAPACITY: 4.3 mgd STORAGE (mil gal): EL 1.5 GR 0
29
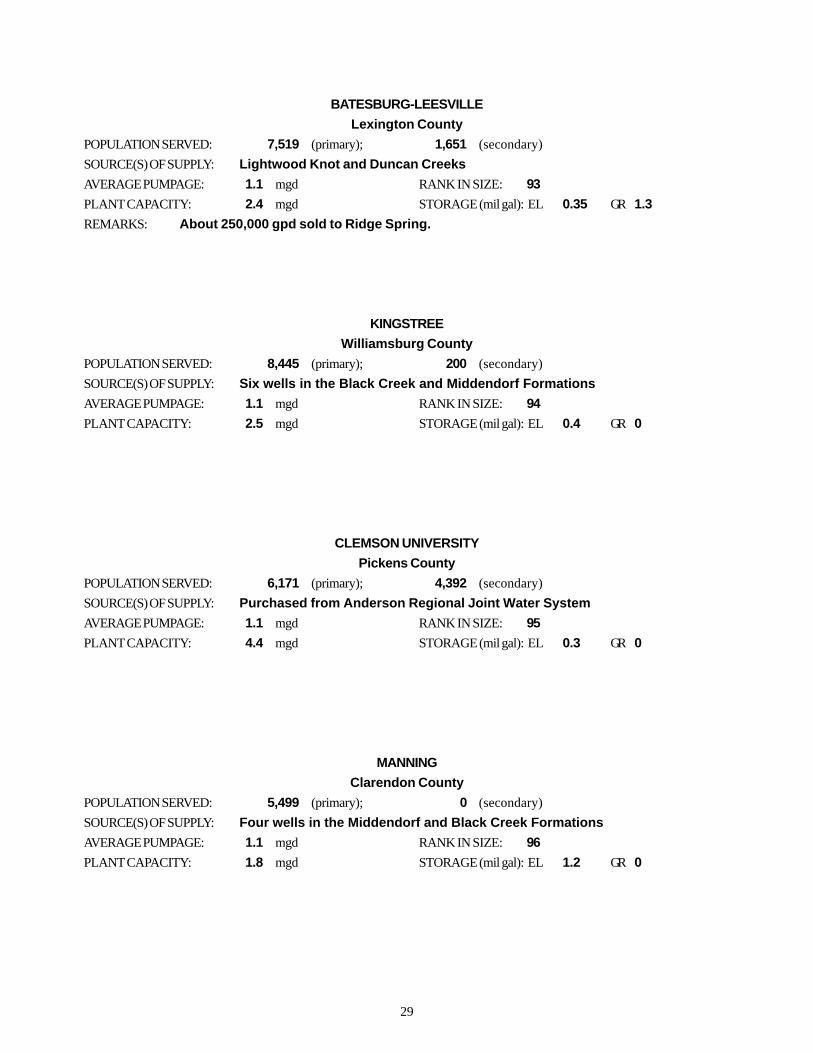
BATESBURG-LEESVILLE
Lexington County
POPULATION SERVED: 7,519 (primary); 1,651 (secondary)
SOURCE(S) OF SUPPLY: Lightwood Knot and Duncan Creeks
AVERAGE PUMPAGE: 1.1 mgd RANK IN SIZE: 93
PLANT CAPACITY: 2.4 mgd STORAGE (mil gal): EL 0.35 GR 1.3
REMARKS: About 250,000 gpd sold to Ridge Spring.
KINGSTREE
Williamsburg County
POPULATION SERVED: 8,445 (primary); 200 (secondary)
SOURCE(S) OF SUPPLY: Six wells in the Black Creek and Middendorf Formations
AVERAGE PUMPAGE: 1.1 mgd RANK IN SIZE: 94
PLANT CAPACITY: 2.5 mgd STORAGE (mil gal): EL 0.4 GR 0
CLEMSON UNIVERSITY
Pickens County
POPULATION SERVED: 6,171 (primary); 4,392 (secondary)
SOURCE(S) OF SUPPLY: Purchased from Anderson Regional Joint Water System
AVERAGE PUMPAGE: 1.1 mgd RANK IN SIZE: 95
PLANT CAPACITY: 4.4 mgd STORAGE (mil gal): EL 0.3 GR 0
MANNING
Clarendon County
POPULATION SERVED: 5,499 (primary); 0 (secondary)
SOURCE(S) OF SUPPLY: Four wells in the Middendorf and Black Creek Formations
AVERAGE PUMPAGE: 1.1 mgd RANK IN SIZE: 96
PLANT CAPACITY: 1.8 mgd STORAGE (mil gal): EL 1.2 GR 0

30
LAKE CITY
Florence County
POPULATION SERVED: 7,319 (primary); 0 (secondary)
SOURCE(S) OF SUPPLY: Six wells in the Black Creek Formation
AVERAGE PUMPAGE: 1.0 mgd RANK IN SIZE: 97
PLANT CAPACITY: 4.0 mgd STORAGE (mil gal): EL 1.2 GR 0
McCORMICK COMMISSION OF PUBLIC WORKS
McCormick County
POPULATION SERVED: 2,038 (primary); 2,898 (secondary)
SOURCE(S) OF SUPPLY: Strom Thurmond Reservoir
AVERAGE PUMPAGE: 1.0 mgd RANK IN SIZE: 98
PLANT CAPACITY: 2.7 mgd STORAGE (mil gal): EL 0.8 GR 0.35
REMARKS: 700,000 gpd sold to McCormick County Water Authority. Substantial part of
McCormick pumpage is used by industry.
BELTON
Anderson County
POPULATION SERVED: 6,510 (primary); 0 (secondary)
SOURCE(S) OF SUPPLY: Purchased from Belton-Honea Path Water Association
AVERAGE PUMPAGE: 1.0 mgd RANK IN SIZE: 99
PLANT CAPACITY: 2.0 mgd STORAGE (mil gal): EL 0.75 GR 0
SALUDA COUNTY WATER AND SEWER AUTHORITY
Saluda County
POPULATION SERVED: 2,439 (primary); 0 (secondary)
SOURCE(S) OF SUPPLY: Purchased from Saluda CPW, which purchases water from Newberry
AVERAGE PUMPAGE: 1.0 mgd RANK IN SIZE: 100
PLANT CAPACITY: 0 mgd STORAGE (mil gal): EL 0.5 GR 0
REMARKS: Much of the water is used by industry (poultry processing).