that's our forecast 2007
TRANSCRIPT
That’s Our Forecast and We’re Sticking to It! Global Energy’s Forecast Performance since 2001 We said it before and now we’ll say it again: Forecasting is inherently a risky business. No one can forecast exactly the right price. And no one should buy a forecast from anyone who says they can. At Global Energy we are experts at assessing and modeling changing power market fundamentals. Out of that analysis come insights that drive our view of expected market prices. When you get a price forecast from Global Energy you get the results of the collective judgment and experience of a team of regional power experts who use the most advanced market simulation software and best available data.
Long-time Global Energy clients might recall that in the winter of 2003, we first prepared That’s Our Forecast And Were Sticking To It! Every forecast can be measured after the fact to judge its performance—but not every provider of market forecasts wants to disclose the results of that analysis. In 2005, Global Energy provided a second update on our performance and in this latest 2007 installment, we show our latest forecasts results and how these have performed against three key performance indicators: 1. Goodness of Fit. Is there a goodness of fit between the forecast and how the
market actually performed? 2. Major Turns in the Market. Did the forecast call the major turns of the
market being examined reasonably? 3. Performance within the Forecast Band of Confidence. Did the forecast
deviations fall within the stochastic band of confidence in the forecast? If the answer to these three questions is yes, then from Global Energy’s perspective that is about as accurate as any forecast can get. We urge all forecast users to ask hard questions about forecast performance against these key criteria. We use this backtest of forecasting results and lessons learned to guide our forecast methods and our advice to clients in the markets we serve. In this report card we also discuss some of the pitfalls inherent in producing power price forecasts and describe our fundamentals-based forecasting methodology. As you review this self assessment, you be the judge. Global Energy continues to strive to provide the highest quality, most transparent, consistent, and independent forecast of changing power market fundamentals available anywhere.
THAT’S OUR FORECAST AND WE’RE STICKING TO IT!
GLOBAL ENERGY DECISIONS | 2
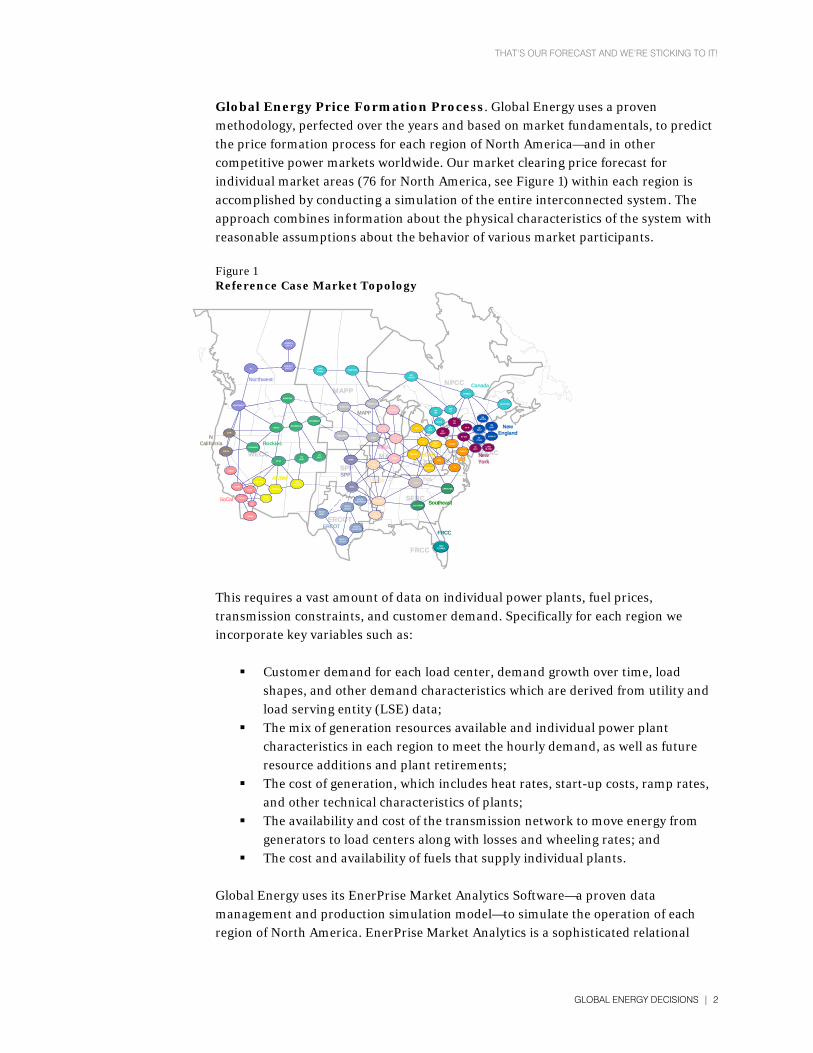
Global Energy Price Formation Process. Global Energy uses a proven methodology, perfected over the years and based on market fundamentals, to predict the price formation process for each region of North America—and in other competitive power markets worldwide. Our market clearing price forecast for individual market areas (76 for North America, see Figure 1) within each region is accomplished by conducting a simulation of the entire interconnected system. The approach combines information about the physical characteristics of the system with reasonable assumptions about the behavior of various market participants. Figure 1 Reference Case Market Topology
WECC
MAPP
SPP
ERCOT
SERC
MAINECAR
MAAC
NPCC
FRCC
CZP26
BC
NEWMEXICO
NBAJA
CSDGE
ARIZONA
PALOVERDE
N NEVADA
CSCE
UTAH
LADWP
COEASTCO
WEST
CAROLINAS
NEBRASKA
ALBERTASOUTH
MONTANA
WUMS
IOWA
W-ECAR
MINNESOTA
ALTW
LAOTHER
AECI
SPPC
SPPN SMAIN
ENTERGY
ALBERTACENT-N
ERCOTNORTH
ERCOTSOUTH
ERCOTWEST
ERCOTHOUSTON
SaskPower MANITOBA
SOUTHERN
GRIDFLORIDA
TVA
CE_NI
WYOMING W
DAKOTAS
IDAHO
NORTHWEST
COB
CNP15
IID
S NEVADA
MECS
APS
AEP FIRSTENERGY
VP
MARITIMES
ONTEC
NYWEST
ONTMP
NYCN
NYCITY
PJMEX
NY F
NENORTH
PJMWX
ONT-NORTH
QUEBEC
LONGISLAND
SEMA RI
NEEASTNE
WEST
NY GHI NECTSW
ONT-NI
ONTWEST
KENTUCKY
Canada
NewEngland
NewYork
Southeast
TVA
FRCCERCOT
MAPP
MAIN
NCalifornia Rockies
AZ/NM SPP
SoCal
ECAR
Northwest
PJM
Entergy
ERCOTNORTHEAST
WYOMING E
This requires a vast amount of data on individual power plants, fuel prices, transmission constraints, and customer demand. Specifically for each region we incorporate key variables such as:
Customer demand for each load center, demand growth over time, load shapes, and other demand characteristics which are derived from utility and load serving entity (LSE) data;
The mix of generation resources available and individual power plant characteristics in each region to meet the hourly demand, as well as future resource additions and plant retirements;
The cost of generation, which includes heat rates, start-up costs, ramp rates, and other technical characteristics of plants;
The availability and cost of the transmission network to move energy from generators to load centers along with losses and wheeling rates; and
The cost and availability of fuels that supply individual plants. Global Energy uses its EnerPrise Market Analytics Software—a proven data management and production simulation model—to simulate the operation of each region of North America. EnerPrise Market Analytics is a sophisticated relational

THAT’S OUR FORECAST AND WE’RE STICKING TO IT!
GLOBAL ENERGY DECISIONS | 3
database that operates in conjunction with a state-of-the-art, multi-area, chronological production simulation model. The simulation or forecast takes into account system and generation resource operational constraints; available interregional transmission capacity; and forecasts the operation of individual generators, utilities, and control areas to meet fluctuating loads within the region. Using these tools, Global Energy simulates the operation of the entire region over a 25-year horizon on an hourly basis to ensure that plant specific operating constraints are respected. We use a Monte Carlo approach to simulate individual unit forced outages. The model keeps the loads and generation in balance on an hour-by-hour basis, while maintaining system reliability and meeting other physical constraints. As demand growth over time exhausts the available capacity, prices rise making new entry possible. Therefore, over a long-term horizon, we assume that new plants enter the market when prices rise high enough to cover their variable operating cost and all fixed and financing costs. These results are then summarized in each of Global Energy’s five regional Power Market Outlooks, published in the spring and fall of each year. Global Energy has provided power price consulting services for many years and, since 2000, has been publishing this standardized Market Advisory Service. Simulated Backtest Results Validate Our Approach. After inputting all market and plant data, but prior to producing regional price forecasts, Global Energy performs a series of backtests to verify:
That the model topology and configuration are correct; That the basic data inputs provide reasonable results; and Our representation of plant level scarcity premiums is valid.
We then input actual fuel prices and load data observed in the market along with any large and significant plant outages that occurred into the model and simulate the backtest period. The simulation is then compared to historical prices to see how well the model is able to replicate actual market prices. Figure 2 shows the daily goodness of fit for the ERCOT North congestion zone compared to the real-time energy market. Overall, the backtest shows that, as expected, real-time energy market s are more volatile than day-ahead spot values. However, the general shape and shift in both are relatively closely aligned.

THAT’S OUR FORECAST AND WE’RE STICKING TO IT!
GLOBAL ENERGY DECISIONS | 4
Figure 2 ERCOT Backtest Simulation Daily On-Peak: 2003-2005
We strive to produce an accurate representation of historical market prices and when results don’t match, we review and reassess other market drivers and data and then re-simulate if necessary. In the figure above, we show a very close match between the backtest and history in what is a relatively transmission-isolated market where natural gas is on the margin in nearly all hours. In other markets, where there is more fuel substitution for the price setting plant and in regions with multiple transmission links along with other factors, the goodness of fit tends to be reduced. Remember: Forecasting is inherently a risky business. However, the real value to showing how close Global Energy comes to replicating actual historical prices is that it confirms a number of key methodological points that are applicable across all markets:
It validates the underlying simulation algorithm (PROSYM) used by Global Energy relating to generator commitment and dispatch;
It confirms the value of providing an “all in” price approach pioneered by Global Energy that takes into account scarcity bidding during some periods; and
It confirms that all other database assumptions used in the analysis are valid.
Nevertheless, un-measurable factors and events occur can throw our backtest (and forecasts) results off. Examples of these include:
Periods of extreme market power where bid markups go well beyond normal and observe levels or result in out-of-merit order dispatch;
Large changes or unanticipated swings in available transmission capacity between markets;
Significant hydro events (e.g., drought) that cause hydro plants’ dispatch to veer away from historical trend;
0
20
40
60
80
100
120
140
160
180
200
Feb-
03
Apr
-03
Jun-
03
Aug
-03
Oct
-03
Dec
-03
Feb-
04
Apr
-04
Jun-
04
Aug
-04
Oct
-04
Dec
-04
Feb-
05
Apr
-05
Jun-
05
Aug
-05
Oct
-05
Dec
-05
On-
Peak
Ele
ctric
ity P
rice
($/M
Wh)
ERCOT BES Prices Simulated
THAT’S OUR FORECAST AND WE’RE STICKING TO IT!
GLOBAL ENERGY DECISIONS | 5
Changeability of local reliability constraints that enforce non-economic dispatch of certain plants; and
Fuel delivery constraints that impact the ability of economic generators to dispatch in merit order.
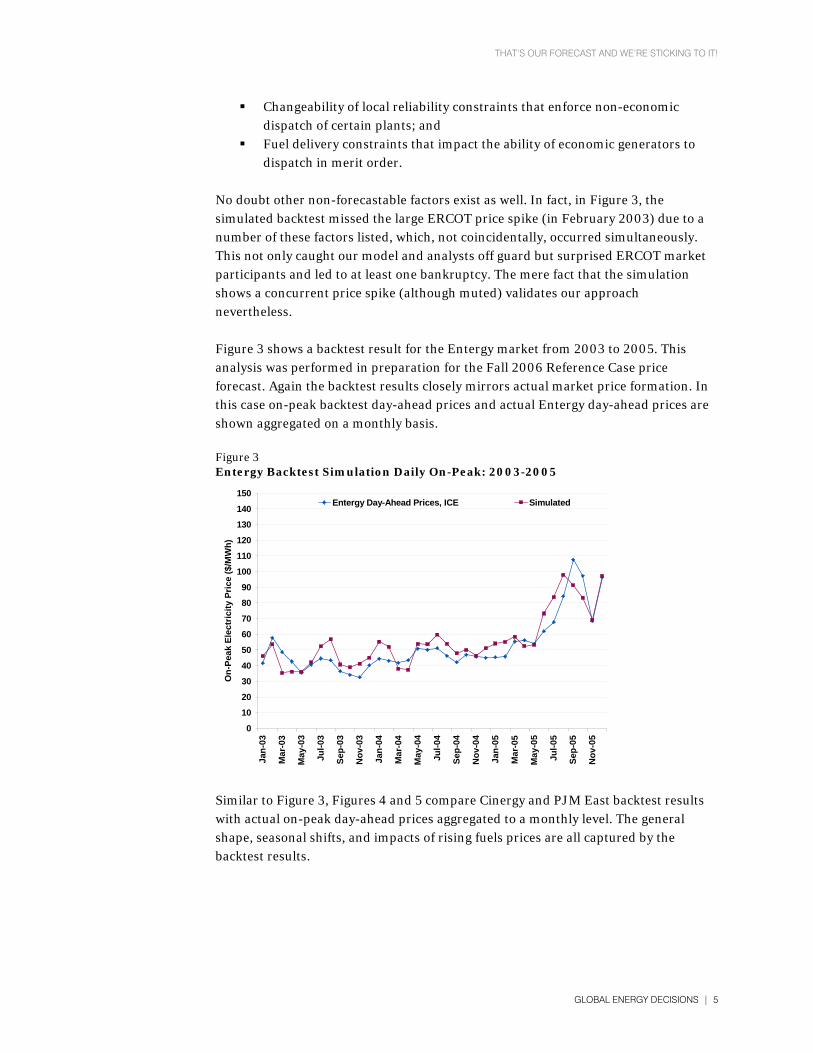
No doubt other non-forecastable factors exist as well. In fact, in Figure 3, the simulated backtest missed the large ERCOT price spike (in February 2003) due to a number of these factors listed, which, not coincidentally, occurred simultaneously. This not only caught our model and analysts off guard but surprised ERCOT market participants and led to at least one bankruptcy. The mere fact that the simulation shows a concurrent price spike (although muted) validates our approach nevertheless. Figure 3 shows a backtest result for the Entergy market from 2003 to 2005. This analysis was performed in preparation for the Fall 2006 Reference Case price forecast. Again the backtest results closely mirrors actual market price formation. In this case on-peak backtest day-ahead prices and actual Entergy day-ahead prices are shown aggregated on a monthly basis. Figure 3 Entergy Backtest Simulation Daily On-Peak: 2003-2005
Similar to Figure 3, Figures 4 and 5 compare Cinergy and PJM East backtest results with actual on-peak day-ahead prices aggregated to a monthly level. The general shape, seasonal shifts, and impacts of rising fuels prices are all captured by the backtest results.
0
10
20
30
40
50
60
70
80
90
100
110
120
130
140
150
Jan-
03
Mar
-03
May
-03
Jul-0
3
Sep-
03
Nov
-03
Jan-
04
Mar
-04
May
-04
Jul-0
4
Sep-
04
Nov
-04
Jan-
05
Mar
-05
May
-05
Jul-0
5
Sep-
05
Nov
-05
On-
Peak
Ele
ctric
ity P
rice
($/M
Wh)
Entergy Day-Ahead Prices, ICE Simulated

THAT’S OUR FORECAST AND WE’RE STICKING TO IT!
GLOBAL ENERGY DECISIONS | 6
Figure 4 Cinergy Backtest Simulation Daily On-Peak: 2003-2005
Figure 5 PJM East Backtest Simulation Daily On-Peak: 2003-2005
So How Did Global Energy’s Forecast Withstand the Test of Time? ERCOT Market. In our previous briefing report, Global Energy showed that our earlier forecasts, starting in fall 2000, recognized the ERCOT market overbuild early on in the development of that market and consistently warned clients that periods of high market prices as seen in many eastern markets was not to be expected—even during periods of high demand. In Figure 6, Global Energy compares various ERCOT forecasts since 2003.
0
10
20
30
40
50
60
70
80
90
100
110
120
130
140
150
Jan-
03
Mar
-03
May
-03
Jul-0
3
Sep-
03
Nov
-03
Jan-
04
Mar
-04
May
-04
Jul-0
4
Sep-
04
Nov
-04
Jan-
05
Mar
-05
May
-05
Jul-0
5
Sep-
05
Nov
-05
On-
Peak
Ele
ctric
ity P
rice
($/M
Wh)
PJM Eastern Hub LMPs Simulated
0
20
40
60
80
100
120
Jan-
03
Mar
-03
May
-03
Jul-0
3
Sep-
03
Nov
-03
Jan-
04
Mar
-04
May
-04
Jul-0
4
Sep-
04
Nov
-04
Jan-
05
Mar
-05
May
-05
Jul-0
5
Sep-
05
Nov
-05
On-
Peak
Ele
ctric
ity P
rice
($/M
Wh)
Cinergy Day-Ahead Prices Simulated

THAT’S OUR FORECAST AND WE’RE STICKING TO IT!
GLOBAL ENERGY DECISIONS | 7
Figure 6 Global Energy ERCOT Track Record
0
2,000
4,000
6,000
8,000
10,000
12,000
14,000
16,000
Jan-
03
Apr
-03
Jul-0
3
Oct
-03
Jan-
04
Apr
-04
Jul-0
4
Oct
-04
Jan-
05
Apr
-05
Jul-0
5
Oct
-05
Jan-
06
Apr
-06
Jul-0
6
Oct
-06
On-
Peak
Mar
ket H
eat R
ate
(Btu
/kW
h)
Fall 2002 Fall 2003 Fall 2004 Fall 2005Fall 2006 Actual
Again the data shows that Global Energy’s forecast track record is solid—although we did underestimate the effect lower load forecasts and additional under construction projects would have on the 2004-2006 market price forecast prepared in the spring of 2002. Frankly, our ERCOT market view back in 2002 indicated that it would be uneconomic to build additional plants until 2008 so we assumed developers would act accordingly. We were wrong. Furthermore, with a lower load growth rate forecast for ERCOT due in part to record high gas fuel prices, load growth has not resumed the torrid pace assumed by many load serving entities. WECC Market. Global Energy was the first forecast of Western power markets to identify that the rotating blackouts and high prices were an anomaly of a “perfect storm” confluence of multiple events and could not be sustained. Global Energy’s spring 2002 forecast was well below NYMEX forward strips. Later on, Global Energy was able to confirm that the NYMEX forwards at that time were not based on actual transactions, but were instead based on phone conversations between NYMEX staff and others. In actuality, spot prices fell below the extremely high NYMEX forward strip and even below the Global Energy forecast, in large part due to reductions in load brought about through conservation and high prices. We were also the first market observer to forecast that there would be no blackouts in the summer of 2001. We struggled with understanding the high prices in spring 2001—even with the perfect storm of events—and modeled extraordinary market price bidding behavior for that one summer. In late May 2001, we learned that the high market price levels were being driven by the unheralded (and unnecessarily aggressive) purchasing of spot market energy by the Bonneville Power Authority (BPA) to allow the Pacific Northwest hydro reservoirs to re-fill in spite of drought conditions. When BPA stopped its market purchases, prices dropped and Global Energy issued a special revision to its near-term forecasts to reflect the withdrawal of this large single player. Below in Figure 7
THAT’S OUR FORECAST AND WE’RE STICKING TO IT!
GLOBAL ENERGY DECISIONS | 8
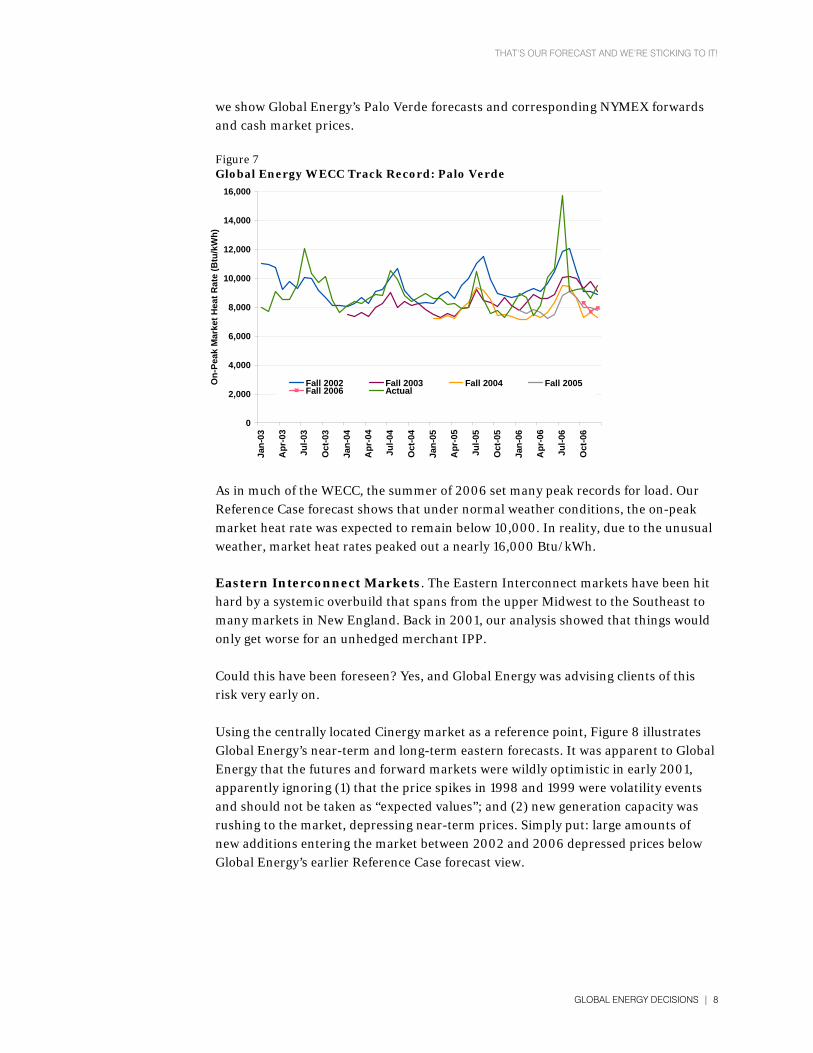
we show Global Energy’s Palo Verde forecasts and corresponding NYMEX forwards and cash market prices. Figure 7 Global Energy WECC Track Record: Palo Verde
0
2,000
4,000
6,000
8,000
10,000
12,000
14,000
16,000
Jan-
03
Apr
-03
Jul-0
3
Oct
-03
Jan-
04
Apr
-04
Jul-0
4
Oct
-04
Jan-
05
Apr
-05
Jul-0
5
Oct
-05
Jan-
06
Apr
-06
Jul-0
6
Oct
-06
On-
Peak
Mar
ket H
eat R
ate
(Btu
/kW
h)
Fall 2002 Fall 2003 Fall 2004 Fall 2005Fall 2006 Actual
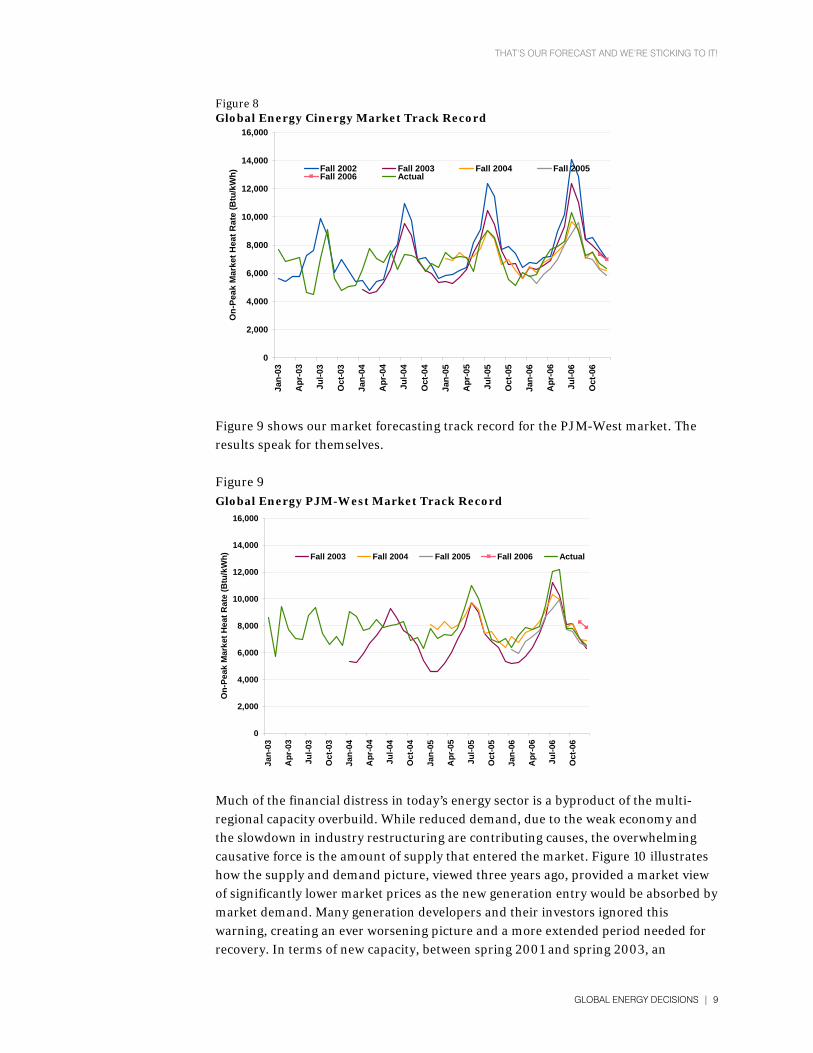
As in much of the WECC, the summer of 2006 set many peak records for load. Our Reference Case forecast shows that under normal weather conditions, the on-peak market heat rate was expected to remain below 10,000. In reality, due to the unusual weather, market heat rates peaked out a nearly 16,000 Btu/kWh. Eastern Interconnect Markets. The Eastern Interconnect markets have been hit hard by a systemic overbuild that spans from the upper Midwest to the Southeast to many markets in New England. Back in 2001, our analysis showed that things would only get worse for an unhedged merchant IPP. Could this have been foreseen? Yes, and Global Energy was advising clients of this risk very early on. Using the centrally located Cinergy market as a reference point, Figure 8 illustrates Global Energy’s near-term and long-term eastern forecasts. It was apparent to Global Energy that the futures and forward markets were wildly optimistic in early 2001, apparently ignoring (1) that the price spikes in 1998 and 1999 were volatility events and should not be taken as “expected values”; and (2) new generation capacity was rushing to the market, depressing near-term prices. Simply put: large amounts of new additions entering the market between 2002 and 2006 depressed prices below Global Energy’s earlier Reference Case forecast view.
THAT’S OUR FORECAST AND WE’RE STICKING TO IT!
GLOBAL ENERGY DECISIONS | 9
Figure 8 Global Energy Cinergy Market Track Record
0
2,000
4,000
6,000
8,000
10,000
12,000
14,000
16,000
Jan-
03
Apr
-03
Jul-0
3
Oct
-03
Jan-
04
Apr
-04
Jul-0
4
Oct
-04
Jan-
05
Apr
-05
Jul-0
5
Oct
-05
Jan-
06
Apr
-06
Jul-0
6
Oct
-06
On-
Peak
Mar
ket H
eat R
ate
(Btu
/kW
h)
Fall 2002 Fall 2003 Fall 2004 Fall 2005Fall 2006 Actual
Figure 9 shows our market forecasting track record for the PJM-West market. The results speak for themselves. Figure 9
Global Energy PJM-West Market Track Record
0
2,000
4,000
6,000
8,000
10,000
12,000
14,000
16,000
Jan-
03
Apr
-03
Jul-0
3
Oct
-03
Jan-
04
Apr
-04
Jul-0
4
Oct
-04
Jan-
05
Apr
-05
Jul-0
5
Oct
-05
Jan-
06
Apr
-06
Jul-0
6
Oct
-06
On-
Peak
Mar
ket H
eat R
ate
(Btu
/kW
h) Fall 2003 Fall 2004 Fall 2005 Fall 2006 Actual
Much of the financial distress in today’s energy sector is a byproduct of the multi-regional capacity overbuild. While reduced demand, due to the weak economy and the slowdown in industry restructuring are contributing causes, the overwhelming causative force is the amount of supply that entered the market. Figure 10 illustrates how the supply and demand picture, viewed three years ago, provided a market view of significantly lower market prices as the new generation entry would be absorbed by market demand. Many generation developers and their investors ignored this warning, creating an ever worsening picture and a more extended period needed for recovery. In terms of new capacity, between spring 2001 and spring 2003, an

THAT’S OUR FORECAST AND WE’RE STICKING TO IT!
GLOBAL ENERGY DECISIONS | 10
additional 13,975 MW of capacity was commissioned with much of it now complete. More recently, developers and their lenders have put the brakes on financing new plants adding only an additional 1,167 MW of new capacity since spring 2003. Figure 10 Global Energy Predicted the Overbuild in Early 2001
-
2,000
4,000
6,000
8,000
10,000
12,000
14,000
16,000
18,000
20,000
22,000
2003 2004 2005 2006 2007 2008 2009 2010 2011 2012 2013 2014 2015 2016 2017 2018 2019 2020
Mar
ket H
eat R
ate
(Btu
/kW
h)
Spring 2001 Fall 2001 Spring 2002 Fall 2002 Spring 2003 Fall 2003 Spring 2004
ECAR Resource Additions (MW) Completed Under
Construction Total Spring 2001 3,035 5,528 8,563 Spring 2003 15,110 7,428 22,538
Fall 2003 19,087 4,402 23,489 Spring 2004 20,342 3,363 23,705
Developers and investors ignored the warning, making the overbuild much worse.
Global Energy’s forecasts
market in early 2001. predicted the overbuilt
Global Energy’s clients who heeded these warnings tended to hedge the risk in their investments. While in some cases this has created subsequent concerns centered on counterparty credit risk, this is still a much preferable position to full merchant risk exposure.
Conclusions Global Energy provides the only independent, standardized view of power market fundamentals modeled and maintained across every North American electric power region. We also produce similar forecasts for many European and Asian markets. We provide a transparent and consistent approach to price forecasting and we “sanity check” that forecast hundreds of times each year through the consulting engagements which use the price forecast as an essential input into the analysis. While we are not perfect, we believe that we have shown a consistent track record of good forecast accuracy since 2000. We hope this assessment of our forecast methodology, approach, and results are useful in reinforcing your confidence in the quality, integrity, and consistency of our work. ____________________ George Given, Chief Economist, Global Energy Advisors [email protected] 916.609.7763
More Information: 720-240-5554 [email protected] www.globalenergy.com