thai union group pcl. 9 august, 2019 - set.or.th · •dr. darian mcain, thai union [s global...
TRANSCRIPT

2Q19 Opportunity Day
2Q19 Opportunity Day
Thai Union Group PCL.
9 August, 2019

2Q19 Opportunity Day
The information contained in our presentation is intended solely for your personal reference only. In addition, such information contains projections and forward-looking statements that reflect our current views with respect to future events and financial performance.
These views are based on assumptions subject to various risks and uncertainties. No assurance is given that future events will occur, that projections will be achieved, or that the assumptions are correct. Actual results may differ materially from those projected.
Disclaimer

2Q19 Opportunity Day
Strategic Cornerstones Innovation: A key pillar at Thai Union

2Q19 Opportunity Day
Official opening of new Global Innovation Center
Innovation Rising to the Future
In June 2019, Thai Union celebrated official opening ceremony of Global
Innovation Center (GIC) by Princess Maha Chakri Sirindhorn
Facility has been expanded to +5,000 m2, and houses more than 160 scientists and researchers from around the world. It is now located at SM Tower, Bangkok.
State-of-the-art research and product development center
Established in 2015, Global Innovation Center (GIC) seeks to find new innovative solutions to seafood that meet needs of consumers.

2Q19 Opportunity Day Slide 5

2Q19 Opportunity Day
Key Highlights
Thai Union’s 2Q19 key
highlights

2Q19 Opportunity Day
Thai Union remains focused on operational
excellence and profitability. We continue to
invest in new product innovations to promote
sustainable business growth.
Thiraphong Chansiri
President and CEO
“
”

2Q19 Opportunity Day
Sales dropped on lower raw material prices YoY 2Q19 sales down 2.2% YoY excluding FX impact: • Thai Baht appreciated against major trading currencies • Focus on higher-margin sales and lower less-profitable businesses • Lower sales volumes
GPM of 16.7%, highest since 2015
Gross profit improved 13.1% YoY from 14.0% in 2Q18 to 16.7%, driven by: • Focus on high-margin
businesses • Raw material prices
dropped • Excluding labour
retirement expenses, GPM would be at 17.0%
Solid operation recovery Normalized operating profit up 29.6% YoY, • Marketing expense
increased • SG&A ratio still high at
11.8% (from 10.4% in 2Q18)
Recovery partly offset by non-operating items Normalized net profit up 10.6% YoY: • Lower FX gains and higher
tax expenses during 2Q19 • Share of profits improved
mostly from Red Lobster operation improvement
Sales
2Q19: Solid underlying operation improvement amid additional legal expenses
Slide 8
Operating Profit
Gross Profit Net Profit
32,214
(THB mn)
5,364 1,513* 1,570*
YoY Chg. -4.6% +13.1% +29.6%** +10.6%**
QoQ Chg +9.7% +22.4% +53.9% +18.8%
% of sales
16.7% 4.9% 4.7%
Remark: *Based on normalized operating figures. 2Q19 reported operating losses of THB 288mn and reported net profit of THB 111mn, including one-time majority accrual for US legal settlement of THB1,858mn and related tax credit of THB 456mn **Based on normalized operating figures. 2Q18 reported operating losses of THB 285mn and reported net profit of THB 10mn.

2Q19 Opportunity Day
2,237
[CELLREF]
1,305
8,129
63,104
2,787
6,089
2,589
9,746 61,583
Net profit
EBITDA Operating profit Gross profit Total sales
Financial Summary1
(THB million) 1H18 1H19
1H19 Net Profit up 24.6% YoY to
THB 2,787 million
Strong cash flow and debt repayment improve debt ratio
1H19 Improved profitability
Slide 9
2018 ND/E
1.39x**
2Q19 ND/E
1.38x
-2.4%
+19.9%
+98.4%
+20.3%
+24.6%
Share price movement
20192
(Jan – 5 Aug 19)
+16.7%
20182
(Jan – Dec 18)
-21.7%
Source: 1TU; 2SET (Jan 3’18: THB20.7/share and Dec 28’18: THB16.2/share, Jan 2’19: THB16.2/share and Aug 5’19: THB18.9/share) **Net debt to equity of 1.35X, before adoption of TFRS 9 and 16
Remark: Excluding one-time net accrual for US legal-related settlement of THB1,402mn (2Q19) and THB1,359mn (2Q18), ESCo business closure-related expenses of THB489mn (2H18) and TMAC investment impairment of THB 87mn (4Q18).

2Q19 Opportunity Day
30,958 34,400 34,847 34,733
29,329
33,775 34,169 36,012
29,369 32,214
14.8% 14.5% 14.2% 13.8%
11.6%
14.0%
15.8% 14.9% 14.9%
16.7%
4.6% 4.1% 4.9%
4.1% 3.0%
4.1% 5.1%
3.4% 4.3% 4.7%
0.0%
2.0%
4.0%
6.0%
8.0%
10.0%
12.0%
14.0%
16.0%
18.0%
0
10,000
20,000
30,000
40,000
50,000
60,000
1Q17 2Q17 3Q17 4Q17 1Q18 2Q18 3Q18 4Q18 1Q19 2Q19
Total sales (THB mn) GPM NPM
% Growth YoY
Sales -0.8 0.0 -0.6 3.0 -5.3 -1.8 -1.9 3.7 0.1 -4.6
Gross profit -8.3 -9.0 0.3 6.1 -26.1 -4.6 9.2 11.4 29.3 13.1
Net profit 16.3 -6.9 8.1 56.6 -39.3 -3.7 0.5 -13.4 46.5 10.6
2Q19: Record quarterly margin since 2015 despite one-time labor retirement benefit provision
Slide 10
Remark: Excluding one-time net accrual for US legal-related settlement of THB1,402mn (2Q19) and THB1,359mn (2Q18), ESCo business closure-related expenses of THB489mn (2H18) and TMAC investment impairment of THB 87mn (4Q18).

2Q19 Opportunity Day
Recent Developments
Corporate, innovation,
sustainability, and brands
around the world

2Q19 Opportunity Day
• The index identifies companies that demonstrate strong
ESG practices and better manage ESG risks.
Thai Union’s sustainability efforts
• Thiraphong Chansiri, Thai Union’s President and CEO,
participated in dive along with 40 other experienced divers.
• Thai Union also partnered with Royal Thai Navy and
Pattaya City in a beach cleanup and ghost gear diving
activities.
Thai Union Reinforces SeaChange with #GhostGearReborn Kickoff on World Oceans Day
Thai Union remains constituent to FTSE4Good Emerging Index by FTSE Russel, for 4th
consecutive year
Slide 12
2Q19 Opportunity Day
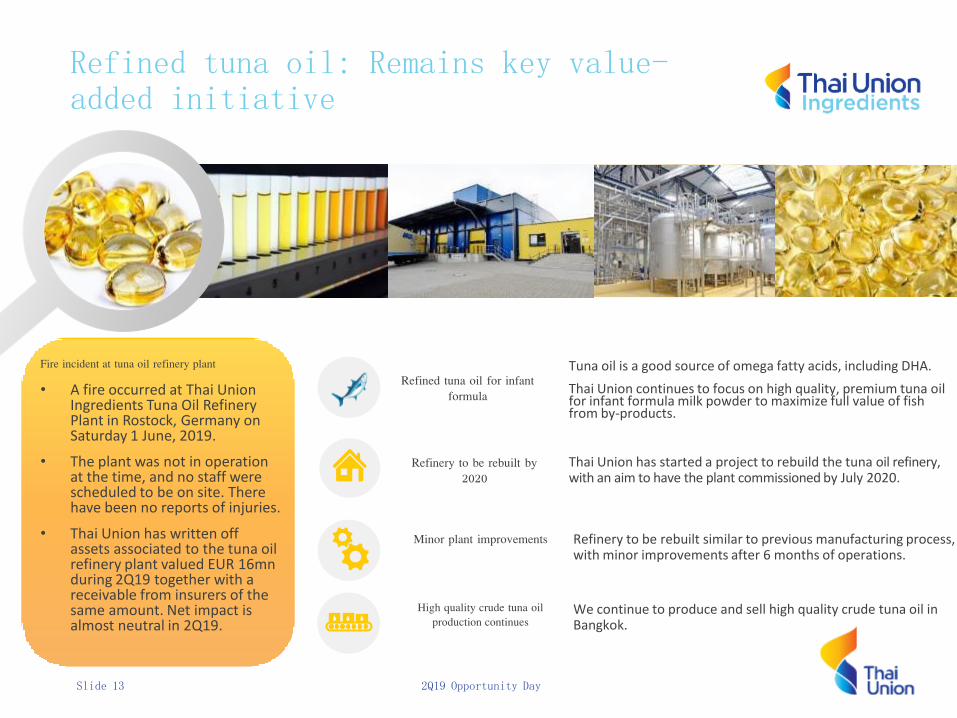
Refined tuna oil for infant
formula
Tuna oil is a good source of omega fatty acids, including DHA.
Thai Union continues to focus on high quality, premium tuna oil for infant formula milk powder to maximize full value of fish from by-products.
Refinery to be rebuilt by
2020
Thai Union has started a project to rebuild the tuna oil refinery, with an aim to have the plant commissioned by July 2020.
Minor plant improvements Refinery to be rebuilt similar to previous manufacturing process, with minor improvements after 6 months of operations.
High quality crude tuna oil
production continues We continue to produce and sell high quality crude tuna oil in Bangkok.
Slide 13
Refined tuna oil: Remains key value-added initiative
Fire incident at tuna oil refinery plant
• A fire occurred at Thai Union Ingredients Tuna Oil Refinery Plant in Rostock, Germany on Saturday 1 June, 2019.
• The plant was not in operation at the time, and no staff were scheduled to be on site. There have been no reports of injuries.
• Thai Union has written off assets associated to the tuna oil refinery plant valued EUR 16mn during 2Q19 together with a receivable from insurers of the same amount. Net impact is almost neutral in 2Q19.

2Q19 Opportunity Day
Thai Union’s Group CFO: Joerg Ayrle on talks about ethical return on investment
Joerg Ayrle Becomes Council
Member of CNBC’s Global CFO
Council
The Council comprises of 100+ CFOs from Fortune 500 companies in countries around the world, who collectively manage market capitalization of more than $4 trillion. For more information, visit CNBC.
Source: Presentation by Joerg Ayrle, Thai Union’s Group CFO at the 5th CFO Innovation Forum Thailand on 4 July, 2019.
• Joerg Ayrle, Thai Union’s Group CFO, gave a closing speech at SeaWeb Seafood Summit 2019 in Bangkok about ethical return on investment and seafood companies in the emerging blue bond trend.
• Separately, he was key speaker at 5th CFO Innovation Forum in Bangkok on 4 July, 2019, on integrating sustainability to unravel capital benefits and boost investor confidence.
Caption: Joerg Ayrle during his closing speech at SeaWeb Seafood Summit in Bangkok. Photo Credit: Intrafish, Lola Navarro (Twitter: @IntrafishLola)
Caption: Thai Union’s Group CFO at 5th CFO Innovation Forum Thailand on 4 July, 2019.
Slide 14

2Q19 Opportunity Day
Thai Union’s global brand footprint
Slide 15
United States Germany
Thailand
China
New premium product
Chicken of
the Sea Wild
Catch
New lobster product
Orion Cooked
Lobster Meat
Retail Pack
New innovative packaging
Brisling
Sardines in
see-through
lid New ready-to-eat tuna varieties
• Tuna Salad (Couscous)
• Tuna Infusions
New product initiatives and innovations from brands around the
world
Expanded to Thai market
Chicken of the
Sea Infusions
1st branch launched in Beijing
Located in
Taikoo Li
New premium product
Ready-to-eat
premium
shrimp
Italy
United
Kingdom
New, healthier product
Mareblu
Leggero with
60% less fat
New innovative packaging
John West
Fridge Pot

2Q19 Opportunity Day
Thai Union is proud to have its efforts recognized by
leading organizations around the world
Asian Excellence Award and Asiamoney Award
• 9th Asian Excellence Award 2019: Asia’s Best CEO and Best Investor Relations Company in Thailand, received by Joerg Ayrle, Group CFO of Thai Union.
• Asiamoney‘s Best Managed Companies Awards: one of the best companies in Thailand for the decade since 2010.
Awards & Recognitions
Seafood Champion Award
• Dr. Darian McBain, Thai Union’s Global Director of Corporate Affairs and Sustainability, for visionary approach to improving seafood sustainability, inspiring positive change across industry, at SeaWeb Seafood Summit 2019.
Thai Union’s Brands Awards
• Thai Union's John West brand, winner of Marine Stewardship Council’s (MSC) 2019 UK Canned Brand of the Year Award for 3rd consecutive year.
• Chicken of the Sea Infusions, winner of People Magazine’s PEOPLE Food Awards 2019: The Best Supermarket Products of the Year (Basil flavour won best new product in Tuna category)
AGM Checklist 2019 by Thai Investors Association
• Thai Union received maximum score of 100 for the AGM Checklist 2019 for third consecutive year

2Q19 Opportunity Day
Despite anti-trust charges, we commit to high DPS
0.30 0.28 0.28 0.32 0.48 0.40 0.39 0.53 0.15 0.30 0.32 0.32 0.32 0.25 0.25
0.22
0.25 0.31 0.31 0.34
0.15
50% 50% 53%
51% 50.7% 50.0%
29.4%
51.3%
59.9%
50.5%
56.7% 57.2% 52.3%
[VALUE]*
0.00
0.10
0.20
0.30
0.40
0.50
0.60
0.70
2005 2006 2007 2008 2009 2010 2011 2012 2013 2014* 2015 2016 2017 2018 1H19
THB/Share
DPS (LHS) Payout Ratio (RHS) Remark: • The company changed the par value from THB 1 to THB 0.25 and registered with the Ministry of Commerce on 25 Dec 2014. Hence, dividend per share has
been revised retroactively to reflect the par change of THB 0.25. • *Chicken of the Sea’s net legal accruals impact not considered for the payout calculation for 1H18 dividend payment
Slide 17
Interim dividend for the period: 1 January to 30 June, 2019
DPS THB 0.25
Ex. Dividend Date 20 August, 2019
Record Date 21 August, 2019
Payment date 3 September, 2019
2Q19 Opportunity Day
2Q19 Financial Results
Consolidated Results

2Q19 Opportunity Day
Joerg Ayrle, Group CFO
Investments need to be value
growth-oriented to strengthen
Thai Union’s portfolio.
“
”

2Q19 Opportunity Day
Antitrust litigation in USA
• Chicken of the Sea has now settled with a large majority of plaintiffs.
• The financial exposure has been substantially higher than originally anticipated.
• As a result, Thai Union recorded an additional accrual of USD 60mn (THB 1,858mn) and related tax credit of THB 456mn in 2Q19.
• The net impact of this accrual was THB 1,402mn.
• We believe that the financial impact of this litigation is now fully provided for by Chicken of the Sea.
(in THB mn) 2Q19
Reported Special items
2Q19 Normalized
Net sales
32,214
32,214
Cost of sales
(26,850)
(26,850)
Gross profit
5,364
5,364
SG&A expenses
(5,652)
1,858
(3,794)
Operating profit
(288)
1,570
Other items* 139 139
Tax
260
(456)
(196)
Net income
111
1,513
Slide 20
Remark: *Other items include share of profit of investment in associates and joint ventures, other income, net gain on exchange rates, finance costs, loss from discontinued operations and net profit attributable to non-controlling interests

2Q19 Opportunity Day
2Q19: Key Takeaways
COSI antitrust additional accrual
• Based on latest settlements, we recorded additional accrual by THB 1,858mn • Net of an associated tax credit of THB 456mn, the net impact of this accrual
THB 1,402mn • This one-off impact is excluded for performance analysis
Strong GPM • GPM recovering at 16.7%, the record quarterly margin since 2015, from 2Q18
GPM of 14.0% • All key three business segments contributed to margin recovery
Less favorable non-operating items than last year
• FX gains lower from hedged account adoption and tax expenses higher YoY • TU recorded insurance claims amounted THB 133mn during 2Q18 • Equity income improved mainly from Red Lobster operation improvement
Positive OP recovery
• High SG&A prompted 11.8% SG&A to sales ratio, from 10.4% during 2Q18 • Normalized OP at THB 1,570mn (up 29.6% YoY) • Labor retirement benefit accruals according to new labor law were THB 205mn
Challenged sales
• Focusing on reducing less-profitable businesses, affecting sales • European sales weaken from EUR and GBP currencies depreciation (6-7% YoY) • 2Q19 Tuna raw material price down 27% YoY, affecting sales
Remark: Excluding one-time net accrual for US legal-related settlement of THB1,402mn (2Q19) and THB1,359mn (2Q18), ESCo business closure-related expenses of THB489mn (2H18) and TMAC investment impairment of THB 87mn (4Q18).

2Q19 Opportunity Day
Efficient inventory management amid declining tuna raw material price environment
Slide 22
%Change QoQ 20.1% 19.6% -4.7% 5.2% 8.3% 8.0% 14.0% 1.2% -22.5% 5.7% -12% -4% +3.2% -16.3%
%Change YoY
13.9% 36.5% 0.2% 44.1% 30.0% 17.3% 40.2% 34.8% -3.5% -5.4% -27% -31% -7.8% -27.0%
1,257
1,503 1,433 1,508 1,633
1,763 2,010
2,033
1,577 1,667
1,467 1,408 1,453
1,217 1,200
900
1,100
1,300
1,500
1,700
1,900
2,100
2,300
2,500
Jan
-16
Feb
-16
Mar
-16
Ap
r-1
6
May
-16
Jun
-16
Jul-
16
Au
g-1
6
Sep
-16
Oct
-16
No
v-1
6
Dec
-16
Jan
-17
Feb
-17
Mar
-17
Ap
r-1
7
May
-17
Jun
-17
Jul-
17
Au
g-1
7
Sep
-17
Oct
-17
No
v-1
7
Dec
-17
Jan
-18
Feb
-18
Mar
-18
Ap
r-1
8
May
-18
Jun
-18
Jul-
18
Au
g-1
8
Sep
-18
Oct
-18
No
v-1
8
Dec
-18
Jan
-19
Feb
-19
Mar
-19
Ap
r-1
9
May
-19
Jun
-19
Jul-
19
Tuna raw material price (USD/ton)
Quarterly average Monthly average
1Q16
1Q17 2Q17
3Q17 4Q17
1Q18 2Q18
3Q18 4Q16 3Q16 2Q16 4Q18 1Q19
2Q19

2Q19 Opportunity Day
33,775 34,169 36,012
29,369 32,214
0
5,000
10,000
15,000
20,000
25,000
30,000
35,000
40,000
2Q18 3Q18 4Q18 1Q19 2Q19
Sales THB mn
+9.7% QoQ
-4.6% YoY
USD mn 929 1,020 1,059 1,036 1,098
125,183 134,375 134,937 133,285
63,104 61,583
2015 2016 2017 1H18 1H19
3.1% 7.3% 0.4% -1.2% YoY Growth
2Q19 Sales decline driven by FX, lower raw material prices, and lower sales volume
Slide 23
• 2Q19 sale declined 2.2% YoY, excluding FX impact, driven by: Frozen and Chilled Seafood and
PetCare businesses saw strong sales volume growth YoY
Ambient business saw sales decline from the falling tuna price (-27% YoY) and a keen focus on higher-margin sales.
Branded ambient business sales saw decline mainly from EUR and GBP currency depreciation of 7% against THB
Overall sales volume saw a decline of 2.7% YoY.
On reported basis, 2Q19 sales were at THB 32bn, down 4.6% YoY
-2.4% YoY -0.1% YoY
excluding FX
-2.2% YoY Before currency
impacts

2Q19 Opportunity Day
2Q18 2Q19
Excluding the FX impact, 2Q19 reported a decline of 2.2% YoY
Slide 24
Revenue growth component THB mn
Remark: 1Shrimp & related business comprises of frozen shrimp and shrimp feed. 2Value-added & other products includes ready-to-eat products, frozen cephalopod, canned seafood, local products, bakery products, and sales of
scraps
-4.6% YoY
-2.2% YoY Before currency
impacts
32,214
33,775 -1,756
Tuna Shrimp &
related business1
Sardine &
Mackerel
Salmon-Ambient
Pet Care Value added
& other products2
USD effect
EUR effect
Lobster Other seafood - Ambient
Salmon-Frozen
Other seafood -
Frozen
47 -8 -11
782 84 82 -300 314 31 -112 -714
-13% +2% -1% -5% +10%
+9% +5%
-11% +13%
+2% -1%
-7%

2Q19 Opportunity Day
Brand 35%
**FS - Brand
6% **FS - Private Label
5%
Private Label 54%
Remark: *Others represent Asia, Australia, Middle East, Canada, Africa and South America **FS stands for Food Service
42% 39% 39% 38% 39%
29% 33% 31% 31% 29%
8% 8% 9% 11% 12% 6% 6% 6% 6% 5%
14% 13% 15% 15% 14%
0%
20%
40%
60%
80%
100%
2015 2016 2017 2018 1H19
Sales Breakdown by Geographic
Brand 37%
**FS - Brand
6% **FS - Private Label
5%
Private Label 52%
Sales Breakdown by Business
THB 61.6bn THB 133.2bn
2018 1H19
Continued push for domestic and US markets
Slide 25
• 1H19 Sales contribution in key markets shifted in favor of domestic and US markets. TU focused on domestic market,
resulted in 19% sales growth YoY. US sales was stable YoY, as Frozen
Seafood sales growth hindered by lower ambient seafood sales
Europe sales contribution shrunk mainly due to EUR and GBP depreciating against THB in 1H19.
• 1H19 branded sales mix at 43% (compared to 41% during 2018), private label sales contributing remaining 57% of 1H19 sales 1H19 total branded sales increased 0.2%
YoY, partly due to the increased in branded aqua feed sales
1H19 private label sales was down 4.3% YoY due to increased sales volume was offset by the decline in tuna raw material price YoY
Others Japan Domestic Europe USA

2Q19 Opportunity Day
4,741 5,406 5,356
4,382
5,364
14.0%
15.8% 14.9% 14.9%
16.7%
10.0%
15.0%
20.0%
25.0%
30.0%
2Q18 3Q18 4Q18 1Q19 2Q19
Gross Profit THB mn
19,501 19,927 19,310 18,892
8,129 9,746
-
5,000
10,000
15,000
20,000
25,000
2015 2016 2017 1H18 1H19
+13.1% YoY
+22.4% QoQ
GPM
2Q19 Gross profit improved 13.1% YoY
• 2Q19 Gross profit was up 13.1% YoY, With tuna raw material prices
declined during the quarter, ongoing product price discussion prompted ambient seafood margin recovery,
Frozen Seafood and PetCare businesses also delivered margin improvement from price recovery and strategy to pursue more value-added products
Adjusted for labor retirement benefits, 2Q19 GPM was at 17.0%, the highest since 2015 (normalized GPM at 16.7%).
Slide 26
GPM 15.6% 14.8% 14.3% 14.2%
+19.9% YoY
Remark: Excluding one-time net accrual for US legal-related settlement of THB1,402mn (2Q19) and THB1,359mn (2Q18), ESCo business closure-related expenses of THB489mn (2H18) and TMAC investment impairment of THB 87mn (4Q18).

2Q19 Opportunity Day
1,212
1,866
1,499
1,020
1,570
3.6%
5.5% 4.2%
3.5% 4.9%
0.0%
2.0%
4.0%
6.0%
8.0%
10.0%
12.0%
14.0%
16.0%
18.0%
20.0%
2Q18 3Q18 4Q18 1Q19 2Q19
Operating Profit THB mn +29.6% YoY
+53.9% QoQ
6,817 6,805
4,921 4,669
1,305
2,589
-
1,000
2,000
3,000
4,000
5,000
6,000
7,000
8,000
9,000
10,000
2015 2016 2017 1H18 1H19
OP Margin
OPM 5.4% 5.1% 3.6% 3.5%
SG&A% 10.4% 10.4% 10.7% 11.4% 11.8%
2Q19 Operating profit delivered strong improvement YoY
Slide 27
• 2Q19 Operating profit was at THB 1,570mn, up 30% YoY: Strong gross margin recovery YoY SG&A higher partly from increasing
marketing expenses • SG&A-to-sales ratio was at 11.8%
(from 10.4% in 2Q18), due to: THB sales declined 4.6% YoY as
European sales declined from weak currency and raw material price decline, prompting higher SG&A ratio.
Compared to SG&A ratio of 11.8%, the ratio would be 11.6% if restated from impact of new Thai labor law on retirement benefits of THB 81mn associated to SG&A.
+98.4% YoY
Remark: Excluding one-time net accrual for US legal-related settlement of THB1,402mn (2Q19) and THB1,359mn (2Q18), ESCo business closure-related expenses of THB489mn (2H18) and TMAC investment impairment of THB 87mn (4Q18).

2Q19 Opportunity Day
• 2Q19 EBITDA up 15.4% YoY, Gross margin improvement is the
key contributor to the EBITDA improvement
Business profitability improved from a more stable raw material price environment and product mix adjustment to higher-margin portfolio
EBITDA Margin
9.2% 8.4% 8.6% 8.3%
2,834 3,254
2,703 2,818
3,271
8.4% 9.5%
7.5% 9.6% 10.2%
3.0%
8.0%
13.0%
18.0%
23.0%
28.0%
2Q18 3Q18 4Q18 1Q19 2Q19
EBITDA THB mn
+15.4% YoY
+16.1% QoQ
11,526 11,269 11,579 11,016
5,059 6,089
-
2,000
4,000
6,000
8,000
10,000
12,000
14,000
16,000
2015 2016 2017 1H18 1H19
+20.3% YoY
EBITDA Margin
2Q19 EBITDA recovery YoY
Slide 28
Remark: Excluding one-time net accrual for US legal-related settlement of THB1,402mn (2Q19) and THB1,359mn (2Q18), ESCo business closure-related expenses of THB489mn (2H18) and TMAC investment impairment of THB 87mn (4Q18).

2Q19 Opportunity Day
1,368
1,731
1,223 1,273
1,513
4.1%
5.1%
3.4% 4.3% 4.7%
0.0%
2.0%
4.0%
6.0%
8.0%
10.0%
12.0%
14.0%
2Q18 3Q18 4Q18 1Q19 2Q19
Net Profit THB mn
+10.6% YoY
+18.8% QoQ
5,302 5,254 5,989
5,191
2,237 2,787
-
1,000
2,000
3,000
4,000
5,000
6,000
7,000
8,000
2015 2016 2017 1H18 1H19
NPM
NPM 3.0% 4.1% 5.1% 3.4%
• With strong recovery in operating performance, TU’s 2Q19 net profit was at THB 1,513mn, up 10.6% YoY, despite the key non-operating items lowered: FX gains of THB 164mn (from THB
222mn in 2Q18), Tax expense of THB 196mn from
improved profitability, vs THB 91mn recorded in 2Q18
• However, equity income mainly improved from Red Lobster operation recovery YoY.
2Q19 Net profit improved 10% YoY
Slide 29
+24.6% YoY
Remark: Excluding one-time net accrual for US legal-related settlement of THB1,402mn (2Q19) and THB1,359mn (2Q18), ESCo business closure-related expenses of THB489mn (2H18) and TMAC investment impairment of THB 87mn (4Q18).

2Q19 Opportunity Day
Adjusted NP Margin 1,018
1,731
1,223 1,111
1,718
3.0%
5.1%
3.4% 3.8%
5.3%
0.0%
2.0%
4.0%
6.0%
8.0%
10.0%
12.0%
14.0%
16.0%
18.0%
20.0%
2Q18 3Q18 4Q18 1Q19 2Q19
Adjusted Net Profit THB mn
+68.8% YoY
+54.6% QoQ
2Q19 Adjusted net profit up 69% YoY
• Excluding the one-off quarter-end items, 2Q19 adjusted net profit was at THB 1,718mn, representing 69% increase YoY
• One-off positive items during 2Q19 of THB 205mn comprised of: Labor retirement benefit accruals
according to the new labor law were allocated to both COGS (THB 124mn) and SG&A (THB 81mn).
Slide 30
-79
1,718
2Q19 Normalized NP
2Q19 Adjusted NP
+81
+124
Retirement benefits - COGS
1,513
Retirement benefits - SG&A
Remark: Excluding one-time net accrual for US legal-related settlement of THB1,402mn (2Q19) and THB1,359mn (2Q18), ESCo business closure-related expenses of THB489mn (2H18) and TMAC investment impairment of THB 87mn (4Q18).

2Q19 Opportunity Day
1.11 1.10 1.26
1.09
0.47 0.58
2015 2016 2017 1H18 1H19
0.29
0.36
0.26 0.27 0.32
2Q18 3Q18 4Q18 1Q19 2Q19
Earning per Share (EPS)* THB
+10.6% YoY
+18.8% QoQ
+24.6% YoY
EPS: 2Q19 EPS was up 10.6% YoY
• 2Q19 normalized EPS was at THB 0.32, up 10.6% YoY and 18.8% QoQ, along with the net profit trajectory.
Slide 31
Remark: Excluding one-time net accrual for US legal-related settlement of THB1,402mn (2Q19) and THB1,359mn (2Q18), ESCo business closure-related expenses of THB489mn (2H18) and TMAC investment impairment of THB 87mn (4Q18). *EPS in this slide represents fully diluted EPS based on current number of shares of 4,771,815,496

2Q19 Opportunity Day
THB mn • 2Q19, while still in negative, the net
profit has recovered from the previous year from turnaround initiatives and collaboration with TU.
• Interest income remained stable and well-above funding cost
• As a result, the equity income and total net income contributions to TU have both improved YoY.
2Q19: Improved operation
Slide 32
Share of profit
Other income
Finance costs
Income tax
Net income
EPS (THB/share)
Red Lobster has contributed THB 168mn to net profit in 2Q19
2Q19 1Q19 4Q18 3Q18 2Q18
-9 144 -201 64 -128
249 249 258 256 259
-146 -142 -138 -137 -129
73 34 -113 104 93
168 284 -193 287 96
0.04 0.06 -0.04 0.06 0.02

2Q19 Opportunity Day
5,544
2,938
8,401
2,437
2016 2017 2018 1H19
Annual Free Cash Flow THB mn
3,794
2,186
1,052 1,259 1,178
2Q18 3Q18 4Q18 1Q19 2Q19
Quarterly Free Cash Flow THB mn
Remark: Change definition of Free Cash Flow; 1Cash Conversion Rate = FCF / EBIT; FCF= EBITDA-Changes in net working capital – Change in other assets& Liabilities + non-cash expenses – CAPEX FCF is based on reported financial statement basis
Cash Conversion Rate1
1.18 0.91 0.77 0.68 0.59
Cash Conversion Rate1 0.67 0.33 0.95 0.67
• 2Q19 free cash flow was at THB 1.2bn, which was due largely to a one-time legal expense from US lawsuit,
• However, despite the significant legal expense booked during the quarter, efficient inventory control and falling tuna price prompt a stable free cash flow profile compared to the 1Q19.
2Q19 Free cash flow weak from one-time US legal expense
Slide 33

2Q19 Opportunity Day
53 110
2,169
-48
-102
Free Cash Flow THB 2,437 mn
Unit: THB mn
ND/E 1.39x Kd = 3.20%
ND/E 1.38x Kd = 3.21%
63,480
891
-537 -4,231
64,374
Net Debt as of
1 Jan 2019
Net Debt as of
30 Jun 2019
803
Remark: *Included 1) change in loans to associates & other companies 2) change in investments in associates and other long-term investments 3) proceeds from sale of assets 4) dividend received and 5) change in non-controlling interest
Other Investing & Financing activities*
CAPEX Other non-cash
expenses
Tax payments
Net interest paid
Dividend received
Change in other assets
and liabilities
EBITDA Change in net working capital
Income tax paid and other investing & financing activities
1H19: Strong cash flow prompted THB 894mn debt repayment
Slide 34
1.35x before adoption of
TFRS 9 and 16
Excluding one-time net accrual for US legal-related settlement of THB1,402mn (2Q19) and THB1,359mn (2Q18), ESCo business closure-related expenses of THB489mn (2H18) and TMAC investment impairment of THB 87mn (4Q18).

2Q19 Opportunity Day
2018 2Q19
98.3% 98.2%
0.0%
1.7% 1.9%
2018 2Q19
Interest-bearing debts of THB 64,544mn
Long-term loan by maturity THB 37,780mn
By Maturity
2023 onward
s
2022
2021
Long-term debt
Current portion of long-term debt & finance lease
Short-term loan 21%
65%
14%
EUR
By Currency
USD
THB
THB 64.5bn THB 64.5bn
23%
61%
16%
Majority THB funding, reducing risk associated to currency volatility
Slide 35

2Q19 Opportunity Day
Remark: 1ROE = Annualized quarterly net profit/ Average total shareholders’ equity 2ROCE = Annualized EBIT / Average capital employed; where as Capital Employed = total assets - total current liabilities
(incl. current portion of long-term debt) and EBIT = Total revenue – COGS – SG&A + share of profit in associates and joint ventures 3Net WC day = INV day + A/R day – A/P day 4ND/E ratio = Net interest-bearing debt/ Total equity,
Net interest-bearing debt = Total interest-bearing debt - Cash & Cash equivalents including ST investment *Net debt to equity of 1.35X, before adoption of TFRS 9 and 16
Net WC3
9.9% 8.0% 7.7%
9.9% 8.0%
2Q19 1Q19 4Q18 3Q18 2Q18
ROCE2
ROE1 Net Debt to EBITDA
14.1% 11.8% 11.5%
16.2%
12.5%
2Q19 1Q19 4Q18 3Q18 2Q18
INV Days
4.85 5.63 5.95
4.92 5.73
2Q19 1Q19 4Q18 3Q18 2Q18
41,652 41,213 39,085 38,212 38,383
111 109 100
118
107
2Q18 3Q18 4Q18 1Q19 2Q19
WC (THB mn) WC Day
39,708 39,996 38,371 36,859 37,126
125 125
115
135
124
2Q18 3Q18 4Q18 1Q19 2Q19
INV (THB mn) INV Day
Keen focus on NWC management
Slide 36
1.38x 1.36x 1.39x 1.40x 1.41x
2Q19 1Q19* 4Q18 3Q18 2Q18
ND/E4
Target 4.0-4.5
Target 1.0-1.1
Excluding one-time net accrual for US legal-related settlement of THB1,402mn (2Q19) and THB1,359mn (2Q18), ESCo business closure-related expenses of THB489mn (2H18) and TMAC investment impairment of THB 87mn (4Q18).

2Q19 Opportunity Day
2Q19 Financial Results
Results by Business Units

2Q19 Opportunity Day
1,633 1,763
2,010 2,033
1,577 1,667 1,467 1,408 1,453
1,217
900
1,100
1,300
1,500
1,700
1,900
2,100
2,300
2,500
Tuna raw material price (USD/ton)
Quarterly average Monthly average
3Q17 4Q17
1Q18 2Q18
3Q18 4Q18 1Q19
2Q19
1Q17 2Q17
212 169 176 175 183
141 158 145 167
139
70
120
170
220
270 Shrimp raw material price
(60pcs/kg) (THB/kg)
Quarterly average Monthly average
1Q17 2Q17 1Q18
2Q18 3Q18 4Q18 1Q19 2Q19
3Q17 4Q17
Source: Thai Union Group and Bloomberg
Key operating impact: Tuna and shrimp raw material prices declined to favorable, lower-end range while salmon remained at manageable level
Slide 38
In July 2019, raw material prices closed at: • Tuna - USD 1,200/ton • Shrimp - THB 147/kg • Salmon - NOK 61/kg
In 2Q19, average raw material prices closed at: • Tuna
USD 1,217/ton (-27.0% YoY, -16.3% QoQ) • Shrimp
THB 139/kg (-1.2% YoY, -16.6% QoQ) • Salmon
NOK 65/kg (-5.4% YoY, +3.1% QoQ)
Prices continued to decline at a manageable level
Price trending upward after some retracement
from peak last year
66 67 59
53 60
69
58 58 64 65
40
50
60
70
80
90 Salmon raw material price
(NOK/kg)
Quarterly average Monthly average
3Q17 4Q17
1Q18 2Q18
3Q18 4Q18 1Q19 2Q19 1Q17 2Q17
Fluctuation in the range of 140-160 THB/kg since
2018

2Q19 Opportunity Day
43.52 43.87 43.69 43.74 43.93 43.44 42.99 42.19 41.18 40.60
36.0
38.0
40.0
42.0
44.0
46.0
48.0
Quarterly average Monthly average
1Q17 2Q17 3Q17 4Q17 1Q18 2Q18 3Q18
2Q19 1Q19 4Q18
37.41 37.72 39.20 38.78 38.78
38.05 38.35 37.42
35.90 35.48 34.0
35.0
36.0
37.0
38.0
39.0
40.0
41.0
Quarterly average Monthly average
1Q17 2Q17
3Q17 4Q17 3Q18 4Q18
1Q19
1Q18 2Q18
2Q19
35.12 34.30
33.39 32.95 31.54 31.92
32.97 32.81 31.61 31.59
28.0
30.0
32.0
34.0
36.0
38.0
ม.ค.
-17
มี.ค.
-17
พ.ค.
-17
ก.ค.
-17
ก.ย.
-17
พ.ย.
-17
ม.ค.
-18
มี.ค.
-18
พ.ค.
-18
ก.ค.
-18
ก.ย.
-18
พ.ย.
-18
ม.ค.
-19
มี.ค.
-19
พ.ค.
-19
ก.ค.
-19
Quarterly average Monthly average
1Q17 2Q17
3Q17 4Q18
1Q19 4Q17
1Q18 2Q18 3Q18
2Q19
In July 2019, average FX rates closed at: USD/THB – THB 30.79 EUR/THB – THB 34.56 GBP/THB – THB 38.47
In 2Q19, average FX rates closed at: USD/THB THB 31.59 (-1.0% YoY, -0.1% QoQ) EUR/THB THB 35.48 (-6.8% YoY, -1.2% QoQ) GBP/THB THB 40.60 (-6.5% YoY, -1.4% QoQ)
USD/THB EUR/THB
Key operating impact: Euro and GBP weakest against Thai Baht since 1985, affecting our sales
Slide 39
GBP/THB
Source: Thai Union Group
Continued decline since 2Q18 and remains a risk factor
Risk factor
Continued depreciation with recent sharp decline
Risk factor
Continues to decline against THB after gaining strength in 2018

2Q19 Opportunity Day
Tuna Tuna slices
Sardine & mackerel Ambient and pouch salmon
Sales: THB 24,964 mn
Frozen, chilled seafood and related
41% 45%
59%
41%
Sales Split
36% 64%
13%
87%
15%
Brand
Private label
Brand
Private label
Brand
Private label
Remark: 1.Shrimp & related business includes frozen shrimp, lobster, shrimp feed and value-added shrimp 2.Other seafood includes frozen cephalopod, crab, scallop, shellfish and other fish 3.Value-added business includes ready-to-eat products, maguro & cephalopod sashimi, local products, bakery products and snack 4.Other products include scrap, fishery and others Excluding one-time net accrual for US legal-related settlement of THB1,402mn (2Q19) and THB1,359mn (2Q18), ESCo business closure-related expenses of THB489mn (2H18) and TMAC investment impairment of THB 87mn (4Q18).
Slide 40
3 strategic business segments
Total 6M19 sales: THB 61,583 mn
Sales: THB 27,488 mn
Ambient seafood
Sales: THB 9,131 mn
PetCare, value-added and others
Shrimp and related 1 Lobster
Frozen, chilled & smoked salmon Other seafood2
PetCare Marine ingredients
Value-added 3 Other products4

2Q19 Opportunity Day
[CELLRANGE]
[CELLRANGE]
[CELLRANGE]
[CELLRANGE]
[CELLRANGE]
[CELLRANGE]
[CELLRANGE]
[CELLRANGE] [CELLRANG
E] [CELLRANG
E]
- 1,000.00 2,000.00 3,000.00 4,000.00 5,000.00 6,000.00 7,000.00 8,000.00 9,000.00 10,000.00 11,000.00 12,000.00 13,000.00 14,000.00 15,000.00 16,000.00 17,000.00 18,000.00 19,000.00 20,000.00 21,000.00 22,000.00 23,000.00 24,000.00 25,000.00 26,000.00 27,000.00 28,000.00 29,000.00 30,000.00 31,000.00 32,000.00 33,000.00 34,000.00 35,000.00 36,000.00 37,000.00 38,000.00 39,000.00 40,000.00 41,000.00 42,000.00 43,000.00 44,000.00 45,000.00 46,000.00 47,000.00 48,000.00 49,000.00 50,000.00 51,000.00 52,000.00 53,000.00 54,000.00 55,000.00 56,000.00 57,000.00 58,000.00 59,000.00 60,000.00 61,000.00 62,000.00 63,000.00 64,000.00 65,000.00 66,000.00 67,000.00 68,000.00 69,000.00 70,000.00 71,000.00 72,000.00 73,000.00 74,000.00 75,000.00 76,000.00 77,000.00 78,000.00 79,000.00 80,000.00 81,000.00 82,000.00 83,000.00 84,000.00 85,000.00 86,000.00 87,000.00 88,000.00 89,000.00 90,000.00 91,000.00 92,000.00 93,000.00 94,000.00 95,000.00 96,000.00 97,000.00 98,000.00 99,000.00 100,000.00 101,000.00 102,000.00 103,000.00 104,000.00 105,000.00 106,000.00 107,000.00 108,000.00 109,000.00 110,000.00 111,000.00 112,000.00 113,000.00 114,000.00 115,000.00 116,000.00 117,000.00 118,000.00 119,000.00 120,000.00
2Q18 3Q18 4Q18 1Q19 2Q19
Sales (THB million) Quantity (Tons)
Gross Profit Margin (Percent)
-14.3% YoY
+4.3% QoQ
-16.9% YoY
-2.4% QoQ
Brand
Private label
Brand
Private label
Total
Brand
Private label
[CELLRANGE]
[CELLRANGE]
[CELLRANGE]
[CELLRANGE]
[CELLRANGE]
[CELLRANGE]
[CELLRANGE]
[CELLRANGE]
[CELLRANGE]
[CELLRANGE]
16,363 16,806 14,994
13,456 14,031
- 1,000.00 2,000.00 3,000.00 4,000.00 5,000.00 6,000.00 7,000.00 8,000.00 9,000.00
10,000.00 11,000.00 12,000.00 13,000.00 14,000.00 15,000.00 16,000.00 17,000.00 18,000.00 19,000.00 20,000.00
2Q18 3Q18 4Q18 1Q19 2Q19
22% 21%
17%
20%
23%
12%
16% 16% 17%
22%
18% 19% 17% 19%
22%
2Q18 3Q18 4Q18 1Q19 2Q19
Ambient Seafood: Gross margin recovery despite weak sales
Slide 41
• 2Q19 ambient sales declined 14.3% YoY, while gross profit improved 9.1% YoY.
• Weak sales were partly attributed to the depreciating European currencies (EUR/THB -6.8% YoY and GBP/THB -6.5% YoY)
• Gross profit margin at 22.4%, up from 17.6% in 2Q18: Falling tuna price environment A focus on higher-value product sales Automation implementation enables a
more efficient work process.
79,973 93,855 93,236 88,841 78,018
Remark: Excluding one-time net accrual for US legal-related settlement of THB1,402mn (2Q19) and THB1,359mn (2Q18), ESCo business closure-related expenses of THB489mn (2H18) and TMAC investment impairment of THB 87mn (4Q18).

2Q19 Opportunity Day
8% 8% 9%
10% 10%
9%
11% 10%
7%
9% 8%
10% 10% 8%
9%
2Q18 3Q18 4Q18 1Q19 2Q19
Frozen, chilled seafood and related: Solid growth and salmon business turnaround
Slide 42
• 2Q19 frozen and chilled seafood sales up 3.6% YoY, driven mainly by volume growth (10.0% YoY) that outpaced raw material price decline (shrimp -1.2% YoY; salmon -5.4% YoY).
• Gross profit margin was at 9.4%, up 70bps YoY, attributed to margin improvement in all shrimp, salmon and lobster business.
• European salmon business margin recovered from business restructuring and price recovery to reflect prevailing salmon price.
Sales (THB million)
+3.6% YoY
+16.5% QoQ
Brand
Private label
[CELLRANGE]
[CELLRANGE]
[CELLRANGE]
[CELLRANGE]
[CELLRANGE]
[CELLRANGE]
[CELLRANGE]
[CELLRANGE] [CELLRANG
E]
[CELLRANGE]
12,962 13,031 15,651
11,529 13,435
- 1,000.00 2,000.00 3,000.00 4,000.00 5,000.00 6,000.00 7,000.00 8,000.00 9,000.00
10,000.00 11,000.00 12,000.00 13,000.00 14,000.00 15,000.00 16,000.00 17,000.00 18,000.00 19,000.00 20,000.00
2Q18 3Q18 4Q18 1Q19 2Q19
[CELLRANGE] [CELLRANGE] [CELLRANGE] [CELLRANGE] [CELLRANGE]
[CELLRANGE] [CELLRANG
E]
[CELLRANGE]
[CELLRANGE]
[CELLRANGE]
62,253 63,443 67,552 61,862 68,504
- 1,000.00 2,000.00 3,000.00 4,000.00 5,000.00 6,000.00 7,000.00 8,000.00 9,000.00 10,000.00 11,000.00 12,000.00 13,000.00 14,000.00 15,000.00 16,000.00 17,000.00 18,000.00 19,000.00 20,000.00 21,000.00 22,000.00 23,000.00 24,000.00 25,000.00 26,000.00 27,000.00 28,000.00 29,000.00 30,000.00 31,000.00 32,000.00 33,000.00 34,000.00 35,000.00 36,000.00 37,000.00 38,000.00 39,000.00 40,000.00 41,000.00 42,000.00 43,000.00 44,000.00 45,000.00 46,000.00 47,000.00 48,000.00 49,000.00 50,000.00 51,000.00 52,000.00 53,000.00 54,000.00 55,000.00 56,000.00 57,000.00 58,000.00 59,000.00 60,000.00 61,000.00 62,000.00 63,000.00 64,000.00 65,000.00 66,000.00 67,000.00 68,000.00 69,000.00 70,000.00 71,000.00 72,000.00 73,000.00 74,000.00 75,000.00 76,000.00 77,000.00 78,000.00 79,000.00 80,000.00 81,000.00 82,000.00 83,000.00 84,000.00 85,000.00 86,000.00 87,000.00 88,000.00 89,000.00 90,000.00 91,000.00 92,000.00 93,000.00 94,000.00 95,000.00 96,000.00 97,000.00 98,000.00 99,000.00 100,000.00 101,000.00 102,000.00 103,000.00 104,000.00 105,000.00 106,000.00 107,000.00 108,000.00 109,000.00 110,000.00 111,000.00 112,000.00 113,000.00 114,000.00 115,000.00 116,000.00 117,000.00 118,000.00 119,000.00 120,000.00
2Q18 3Q18 4Q18 1Q19 2Q19
Quantity (Tons)
+10.0% YoY
+10.7% QoQ
Brand
Private label
Gross Profit Margin (Percent)
Total
Brand
Private label
Remark: Excluding one-time net accrual for US legal-related settlement of THB1,402mn (2Q19) and THB1,359mn (2Q18), ESCo business closure-related expenses of THB489mn (2H18) and TMAC investment impairment of THB 87mn (4Q18).

2Q19 Opportunity Day
• PetCare and valued added sales increased 6.7% YoY, on the back of sales volume increase 5.9% over the same period. Pet food business delivered a solid sales
growth, driven mainly by sales volume. Value-added products and others segment
reported significant business growth in can manufacturing subsidiary.
• Gross margin has improved due to strong sales growth and growing value-added product sales mix.
+5.9% YoY
[CELLRANGE] [CELLRANGE] [CELLRANGE] [CELLRANGE] [CELLRANGE]
[CELLRANGE] [CELLRANGE] [CELLRANGE] [CELLRANGE] [CELLRANGE]
- 1,000.00 2,000.00 3,000.00 4,000.00 5,000.00 6,000.00 7,000.00 8,000.00 9,000.00 10,000.00 11,000.00 12,000.00 13,000.00 14,000.00 15,000.00 16,000.00 17,000.00 18,000.00 19,000.00 20,000.00 21,000.00 22,000.00 23,000.00 24,000.00 25,000.00 26,000.00 27,000.00 28,000.00 29,000.00 30,000.00 31,000.00 32,000.00 33,000.00 34,000.00 35,000.00 36,000.00 37,000.00 38,000.00 39,000.00 40,000.00 41,000.00 42,000.00 43,000.00 44,000.00 45,000.00 46,000.00 47,000.00 48,000.00 49,000.00 50,000.00 51,000.00 52,000.00 53,000.00 54,000.00 55,000.00 56,000.00 57,000.00 58,000.00 59,000.00 60,000.00 61,000.00 62,000.00 63,000.00 64,000.00 65,000.00 66,000.00 67,000.00 68,000.00 69,000.00 70,000.00 71,000.00 72,000.00 73,000.00 74,000.00 75,000.00 76,000.00 77,000.00 78,000.00 79,000.00 80,000.00
2Q18 3Q18 4Q18 1Q19 2Q19
[CELLRANGE]
[CELLRANGE]
[CELLRANGE]
[CELLRANGE]
[CELLRANGE]
[CELLRANGE]
[CELLRANGE]
[CELLRANGE] [CELLRANG
E]
[CELLRANGE]
4,450 4,332 5,367
4,384 4,747
-
1,000.00
2,000.00
3,000.00
4,000.00
5,000.00
6,000.00
2Q18 3Q18 4Q18 1Q19 2Q19
17% 21%
24% 22% 20%
2Q18 3Q18 4Q18 1Q19 2Q19
Brand
Private label
PetCare, value-added and others: Growth story continued
Slide 43
Sales (THB million)
+6.7% YoY
+8.3% QoQ
Brand
Private label
Quantity (Tons)
-0.5% QoQ
Total
Gross Profit Margin (Percent)
67,508 63,759 67,126 73,769 67,838
Remark: Excluding one-time net accrual for US legal-related settlement of THB1,402mn (2Q19) and THB1,359mn (2Q18), ESCo business closure-related expenses of THB489mn (2H18) and TMAC investment impairment of THB 87mn (4Q18).

2Q19 Opportunity Day Slide 44
Thai Union’s geographic diversity: Sales
(Asia, Australia, Middle East, Africa and South America)
United States and Canada
42% Europe
28%
Thailand
13%
17% Others

2Q19 Opportunity Day
12,931 12,801 15,192
12,207 12,792
-
2,000
4,000
6,000
8,000
10,000
12,000
14,000
16,000
18,000
20,000
2Q18 3Q18 4Q18 1Q19 2Q19
Sales THB mn
-1.1% YoY
+4.8% QoQ
US & Canada: Strong growth in frozen seafood segment
Slide 45
• 2Q19 North America sales declined by 1.1% in Thai Baht term. USD depreciated 1.0% YoY vs Baht US Frozen businesses, both shrimp
and lobster, deliver solid sales growth US Canned tuna sales dropped on
lower sales of lower-margin products Thai export to US declined due to
USD depreciation against THB • Red Lobster operation improved YoY

2Q19 Opportunity Day
• Chicken of the Sea Frozen Foods launched a fully prepped, ready-to-eat cooked lobster meat packed in an innovative vacuum-sealed, five-ounce packaging under Orion Seafood brand.
• It has been rolled out in national retailers and wholesale club chains in United States, such as Meijer and BJ’s, with an aim to introduce to Retail, Club and Foodservice channels
Product launch:
Chicken of the Sea
Frozen Foods introduces
Orion Cooked Lobster Meat Retail Pack

2Q19 Opportunity Day
Chicken of the Sea launches new premium product line:
Wild Catch
Slide 47
• Thai Union is continuing expansion of its product portfolio with national launch of “Wild Catch” product line under Chicken of the Sea brand in United States on 5 August 2019
• Chicken of the Sea Wild Catch is a range of premium, responsibly wild-caught seafood, including Albacore, Ahi Yellowfin and Alaskan Salmon. Thai Union’s SeaChange program is featured on pack.
• It is 100% natural, packed with just hand-selected fillet pieces, water and sea salt.
• Transparent pack allows consumers to see for themselves a higher standard of quality.
TBU – pending from COSI
2Q19 Opportunity Day
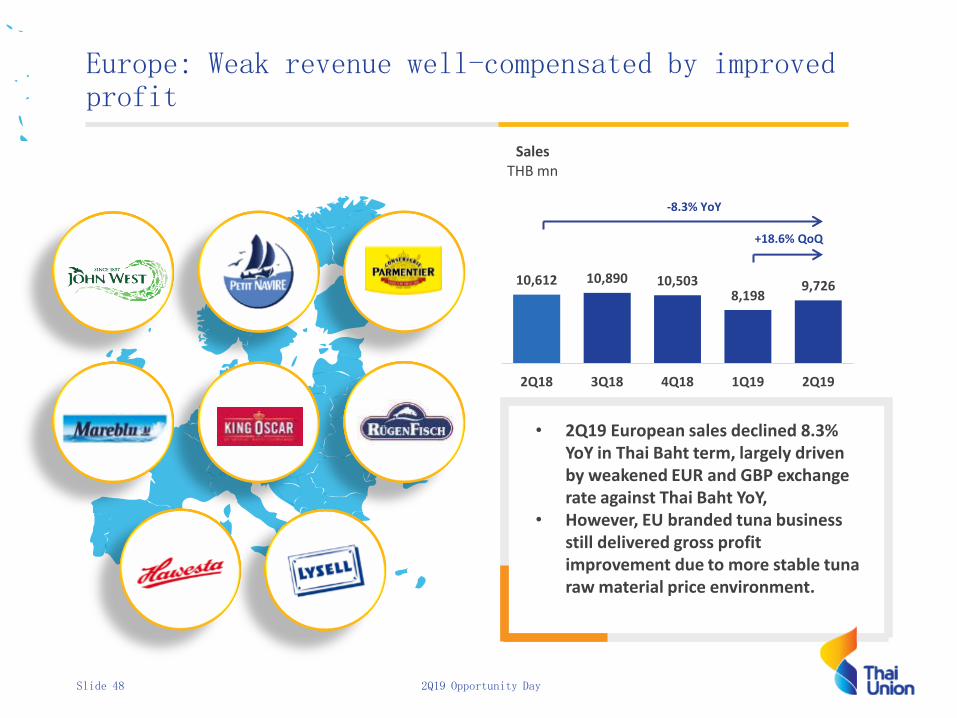
• 2Q19 European sales declined 8.3% YoY in Thai Baht term, largely driven by weakened EUR and GBP exchange rate against Thai Baht YoY,
• However, EU branded tuna business still delivered gross profit improvement due to more stable tuna raw material price environment.
10,612 10,890 10,503 8,198
9,726
0
2000
4000
6000
8000
10000
12000
14000
16000
18000
20000
2Q18 3Q18 4Q18 1Q19 2Q19
Sales THB mn
-8.3% YoY
+18.6% QoQ
Europe: Weak revenue well-compensated by improved profit
Slide 48

2Q19 Opportunity Day
King Oscar (USA) introduced Royal Selection Brisling Sardines self-stable line in unique see-through packaging with easy-peel lid for bold product differentiation in April 2019.
MSC certified, sustainably wild-caught fish, specially selected non-GMO ingredients, and unique recipes for super premium quality.
Shipping soon to select retailers in USA (incl. KeHe, Albertsons/Safeway, Jewel, Supervalu, Lunds, Cub, Amazon, and shortly to additional strategic customers).
Slide 49
King Oscar (USA) launches super premium, certified sustainable line of Brisling Sardines in boldest packaging ever …SEE
THROUGH LID!
Product launch: Packaging innovations

2Q19 Opportunity Day Slide 50
Hawesta launches two ready-to-eat innovations to Germany, Tuna Infusions, and a fourth variety of the Tuna Salads
Product launch: Ready-to-eat innovations
• In March 2019, Hawesta launched fourth variety, Couscous, to expand Tuna Salads product line
• Three varieties of Tuna Salads were launched in 2017 and are well established in Germany (16.6% market share)*
• Tuna Salad Mexico is among top 10 products of Hawesta and Rügenfisch portfolio
*Source: IRI MAT June 2019, value
• Hawesta launched three varieties of Tuna Infusion in May 2019
• The ready-to-eat product is a real innovation in the German seafood market.

2Q19 Opportunity Day
• 2Q19 Thailand sales up 19.4% YoY. • Diversifying sales in home market to
offset weaker export market from THB appreciation against key currencies
• Strong export sales from Ambient, Frozen and PetCare business
Thailand: Star performer
Slide 51
3,169 3,379 4,242 3,853 3,785
0
2000
4000
6000
8000
10000
12000
14000
16000
18000
20000
2Q18 3Q18 4Q18 1Q19 2Q19
Sales THB mn
+19.4% YoY
-1.8% QoQ

2Q19 Opportunity Day
Product launch: Chicken of the Sea Infusions makes it way to Thai supermarkets
• Chicken of the Sea Infusions was recently launched in the Thai market through Thai Union’s subsidiary and Sealect brand distributor, SeaHolding
• Now available at 7-11 and Tops Supermarket in Thai Chili and Sun-Dried Tomato flavors, and soon to come to WeFitness gym club
• Ready-to-eat, flavored tuna, shelf-stable product

2Q19 Opportunity Day

2Q19 Opportunity Day
7,063 7,099 6,075
5,111 5,911
0
2000
4000
6000
8000
10000
12000
14000
16000
18000
20000
2Q18 3Q18 4Q18 1Q19 2Q19
Sales THB mn
-16.3% YoY
+15.7% QoQ
EM and rest of the world: Falling raw material prices hurt sales
Slide 54
• 2Q19 sales was at THB 5.9bn, down 16.3% YoY mainly driven by the weak sales to Middle East, attributable to both the falling tuna prices and lower sales volume.
• China sales delivered sales decline from the previous year, partly driven by falling shrimp price YoY.

2Q19 Opportunity Day
• In May 2019, Thai Union China showcased King Oscar China brand at SIAL Expo, 3rd largest food show in the world
• Exhibitors: major market players from retail, HoReCa, food services, import/export trade and manufacturing.
• Sets benchmark for overseas companies stepping into Asia and China and provides valuable market insights, trends and innovations of regional food industry.
Thai Union China showcases premium quality seafood at SIAL Expo 2019,
Red Lobster opens 1st branch in Beijing
Global expansion: China remains key growth market
• Red Lobster opened 1st branch in Beijing, China, in July 2019, as part of the American casual dining chain’s international expansion
• Located in Taikoo Li, mainly with American expats and study-abroad Chinese consumers
• Key selling points: fresh, reasonably priced seafood, fun atmosphere, and ability to accommodate large groups
Photo Credits: Annabelle Lim/timeoutbeijing.com (1, 3, 4), Kyle M./theBeijinger.com (2)
(1) (2)
(3) (4)

2Q19 Opportunity Day
Remark: 1Shrimp & related business includes frozen shrimp, shrimp feed and value-added shrimp 2Other seafood includes frozen cephalopod, crab, scallop, shellfish and other fish 3Value-added business includes ready-to-eat products, maguro & cephalopod sashimi, local products, bakery products and snack 4Other products include scrap, fishery and others Excluding one-time net accrual for US legal-related settlement of THB1,402mn (2Q19) and THB1,359mn (2Q18), ESCo business closure-related expenses of THB489mn (2H18) and TMAC investment impairment of THB 87mn (4Q18).
2Q19 Segment profitability
Slide 56
Gross profit THB million
Margin %
Sales THB million
Business segment
5,364
Ambient seafood
• Tuna • Sardine and mackerel • Ambient and pouch salmon
14,031 22.4 3,140
Frozen, chilled seafood and related
• Shrimp and related 1
• Lobster • Frozen, chilled and smoked salmon • Other seafood2
13,435 9.4 1,261
PetCare, value-added and others
• PetCare • Value-added and others1
• Other products2
4,747 20.3 963
Total 32,214 16.7

2Q19 Opportunity Day
Business Outlook

Thai Union Group PCL.

2Q19 Opportunity Day
Appendix
Slide 59

2Q19 Opportunity Day
0
200
400
600
800
1,000
1,200
1,400
1,600
1,800
2,000
0
5
10
15
20
25
2013 2014 2015 2016 2017 2018 2019
TU
SET
Minimum 50% payout of our net profit with semi-annual payments
THB
Bloomberg/ Reuters TU TB/ TU.BK
Share price (5 August, 2019) THB 18.90
Historical price
52-week high THB 17.70
52-week low THB 17.10
No. of paid up shares 4,771.8mn
Par value THB 0.25
Market Capitalization THB 90.2bn
Chansiri Family 19.5%
Thai NVDR 11.2%
Mitsubishi Corporatio
n 7.3%
Social Security
Office 7.2%
Niruttinanon Family
6.9%
Others 48.0%
Source: SET and TU
As of 28 June, 2019
Free float 67.4%
Foreign ownership/ Foreign limit 32.4%/ 45.00%
Share capital information
Slide 60
Stock Performance at a Glance Major Shareholders
Dividend Policy
DPS (THB per share) Period 1H19 2H18 1H18 2H17 1H17 2H16 1H16
DPS 0.25 0.15 0.25 0.34 0.32 0.31 0.32
*The company changed the par value from THB 1 to THB 0.25 and registered with the Ministry of Commerce on 25 Dec 2014.

2Q19 Opportunity Day
2Q19 Income statement
Slide 61
2Q19 2Q19
2Q18 1Q19
Change Change
Sales 32,214 100% 33,775 100% 29,369 100% -4.6% 9.7%
Cost of sales (26,850) -83.3% (29,035) -86.0% (24,987) -85.1% -7.5% 7.5%
Gross profit 5,364 16.7% 4,741 14.0% 4,382 14.9% 13.1% 22.4%
SG&A expenses (3,794) -11.8% (3,529) -10.4% (3,362) -11.4% 7.5% 12.8%
FX gain (loss) 164 0.5% 222 0.7% 80 0.3% -26.1% 104.4%
Other income 498 1.5% 628 1.9% 497 1.7% -20.7% 0.1%
Share of profits from investments in assoc. & Jvs 110 0.3% 44 0.1% 347 1.2% 150.4% -68.3%
EBIT 2,342 7.3% 2,105 6.2% 1,945 6.6% 11.2% 20.4%
Finance cost (516) -1.6% (498) -1.5% (528) -1.8% 3.6% -2.3%
EBT 1,826 5.7% 1,607 4.8% 1,417 4.8% 13.6% 28.9%
Tax (196) -0.6% (90) -0.3% (27) -0.1% 116.6% 623.8%
Profit (Loss) from discontinued operarion (29) -0.1% (38) -0.1% (43) -0.1% -23.7% -32.6%
Net income 1,601 5.0% 1,479 4.4% 1,347 4.6% 8.3% 18.9%
Net income (loss) attributable to:
Equity holders of the Company 1,513 4.7% 1,368 4.1% 1,273 4.3% 10.6% 18.8%
Non-controlling interests of the subs 87 0.3% 110 0.3% 73 0.2% -20.9% 19.3%
Earnings per share
Basic earnings per share 0.32 0.29 0.27 10.6% 18.8%
Exchange rate
THB/USD 31.59 31.92 31.61 -1.0% -0.1%
(Unit: THB mn) 2Q19%
to sales2Q18
%
to sales
%
to sales
Consolidated
1Q19

2Q19 Opportunity Day
Remark: *Including short-term investments
Statement of Financial Position as of 30 June 2019
Slide 62
Cash and cash equivalents* 1,063 0.8% 972 0.7% 9.4%
Trade and other receivables - net 15,422 11.0% 15,637 10.9% -1.4%
Inventories - net 37,126 26.5% 39,708 27.7% -6.5%
Other current assets 3,041 2.2% 2,040 1.4% 49.1%
Total current assets 56,652 40.4% 58,357 40.7% -2.9%
Fixed assets 27,542 19.7% 26,320 18.4% 4.6%
Investments 21,474 15.3% 23,475 16.4% -8.5%
Goodwill and other intangible assets 28,398 20.3% 30,530 21.3% -7.0%
Other non-current assets 6,050 4.3% 4,708 3.3% 28.5%
Total Assets 140,116 100% 143,390 100% -2.3%
Bank overdrafts and short-term loans 15,688 11.2% 14,145 9.9% 10.9%
Trade and other payables 18,946 13.5% 18,843 13.1% 0.5%
Current portion of long-term loans 9,989 7.1% 3,916 2.7% 155.1%
Other current liabilities 887 0.6% 2,027 1.4% -56.2%
Total current liabilities 45,509 32.5% 38,930 27.1% 16.9%
Long-term loans 38,867 27.7% 47,863 33.4% -18.8%
Other non-current liabilities 9,727 6.9% 10,483 7.3% -7.2%
Total Liabilities 94,103 67.2% 97,276 67.8% -3.3%
Non-controlling interests of the subsidiaries 3,502 2.5% 3,140 2.2% 11.5%
Total Shareholders’ Equity 42,511 30.3% 42,974 30.0% -1.1%
Total liabilities and shareholders’ equity 140,116 100% 143,390 100% -2.3%
(Unit: THB mn) 2Q19% to total
assets2018
% to total
assetsChange

2Q19 Opportunity Day
2Q19 Statement of cash flow
Slide 63
Remark: *Figures as reported in August 2019
(Unit: THB mn) 1H19 1H18 Change
Profit before income tax 1,349 1,069 279
Adjustments for depreciation & amortisation expenses 1,803 1,437 366
Other adjustments 970 1,658 (688)
Changes in operating assets and liabilities 484 3,551 (3,067)
Cash flows receipts from operating activities 4,606 7,716 (3,110)
Net cash receipts (payments) from operating activities 4,654 7,529 (2,875)
Net cash payments for investing activities (2,307) (2,124) (184)
Net cash receipts (payments) for financing activities (3,004) (5,308) 2,304
Net increase (decrease) in cash and cash equivalent (657) 97 (755)
Cash and cash equivalents - opening balance 1,311 573 738
Exchange gain (loss) on cash and cash equivalents (59) 2 (61)
Cash and cash equivalents - closing balance 594 672 (78)
CAPEX 2,169 2,553 (384)
Management Est. Free Cash Flows* 2,437 5,163 (2,726)
Consolidated

Thai Union Group PCL.
Investor Relations Department
+66 2298 0024
investor.thaiunion.com
@irthaiunion