thai beverage plc -...
TRANSCRIPT

Thai Beverage PLC
FY17 Financial Results(Full Year Ended 30 September 2017)
1Thai Beverage PLCFY17 (Full Year Ended 30 September 2017)

FY17 (Full Year Ended 30 September 2017) Thai Beverage PLC 2
Note on Forward Looking Statements• The following presentation may contain forward looking statements by the management of Thai Beverage Public
Company Limited (“ThaiBev"), relating to financial or other trends for future periods, compared to the resultsfor previous periods.
• Some of the statements contained in this presentation that are not historical facts are statements of futureexpectations with respect to the financial conditions, results of operations and businesses, and related plans andobjectives.
• Forward looking information is based on management's current views and assumptions including, but not limitedto, prevailing economic and market conditions. These statements involve known and unknown risks anduncertainties that could cause actual results, performance or events to differ materially from those in thestatements as originally made. Such statements are not, and should not be construed as a representation as tofuture performance of ThaiBev. In particular, such targets should not be regarded as a forecast or projection offuture performance of ThaiBev. It should be noted that the actual performance of ThaiBev may vary significantlyfrom such targets.

FY17 (Full Year Ended 30 September 2017) Thai Beverage PLC 3
Understanding this Presentation• As approved at the 2016 annual general meeting, the Company and its subsidiaries have changed the fiscal year from “1
January to 31 December” to “1 October to 30 September” since 1 January 2016. The first new fiscal year for 2016 was 9months from 1 January 2016 to 30 September 2016. The fiscal year 2017 will be 12 months from 1 October 2016 to 30September 2017.
• From 1 October 2016 onwards, the soda water business was transferred from the non-alcoholic beverages business tothe spirits business to conform with changes in the Company’s management and reporting structure. The changesrecognise that majority of consumers drink spirits mixed with soda water. The corresponding information for last yearwas restated for comparative analysis.
• The new Excise Tax Act is effective from 16 September 2017. The key change to alcoholic beverages is the tax collection method based on a suggested retail price instead of the last wholesale price. However, the excise tax calculation is still based on both ad valorem rates (a percentage of suggested retail price) and specific rates (Baht per litre of pure alcohol content). The excise tax rate is also changed per below:Beer- Prior: 155 Baht per litre of pure alcohol content and 48% of the last wholesale price exclude VAT.- New: 430 Baht per litre of pure alcohol content and 22% of the suggested retail price exclude VAT.White spirits- Prior: 145 Baht per litre of pure alcohol content and 4% of the last wholesale price exclude VAT.- New: 155 Baht per litre of pure alcohol content and 2% of the suggested retail price exclude VAT.Other distilled liquor- Prior: 250 Baht per litre of pure alcohol content and 25% of the last wholesale price exclude VAT.- New: 255 Baht per litre of pure alcohol content and 20% of the suggested retail price exclude VAT.

FY17 (Full Year Ended 30 September 2017) Thai Beverage PLC 4
Understanding this Presentation• For non-alcoholic beverages - artificial mineral water, soda water, carbonated soft drink, fruit and vegetable juice which
have no alcohol or have alcohol content not exceed 0.5% and are in airtight packaging, the key change is the taxcollection method based on a suggested retail price instead of the ex-factory price and the excise sugar tax which isimplemented for the first time ever. The excise tax is based on both ad valorem rates (a percentage of suggested retailprice) and specific rates (Baht per gram of sugar content). The beverage with over 6 grams of sugar per 100 ml. will besubject to the new specific sugar tax which the rate will be increased every two years until 1 October 2023 onwards.
• On 8 August 2017, The QSR of Asia Co.,Ltd., a subsidiary of an indirect subsidiary of the Company, entered into an AssetSale and Purchase Agreement with Yum Restaurants International (Thailand) Co.,Ltd. for the potential acquisition of over240 existing KFC stores in Thailand. The KFC brand has been the number one quick service restaurant brand in Thailandmeasured by brand share and number of outlets. The closing transactions is planned to complete on 1 December 2017.
• On 3 October 2017, Food of Asia Co.,Ltd., an indirect subsidiary of the Company, has acquired a 76% shareholdinginterest in Spice of Asia Co.,Ltd. to operate 10 stores of restaurants serving hotpot and Thai food.
• On 12 October 2017,International Beverage Holdings (Singapore) Pte. Limited, an indirect subsidiary of the Company,has acquired an aggregate 75% interest in the shares of Myanmar Supply Chain and Marketing Services Co.,Ltd. andMyanmar Distillery Co.,Ltd., companies incorporated in Republic of the Union of Myanmar to operate spirit business inMyanmar.
• Current operations by business segments consist of spirits, beer, non-alcoholic beverages and food
• All monetary amounts in millions of Thai Baht unless otherwise stated
• Volumes in millions of liters unless otherwise stated
• EBITDA = Earnings from total revenues before interest expense, income tax, depreciation, and amortization

Thai Beverage PLC 5FY17 (Full Year Ended 30 September 2017)
Highlights
FY17 (Full Year Ended 30 September 2017) Thai Beverage PLC 6
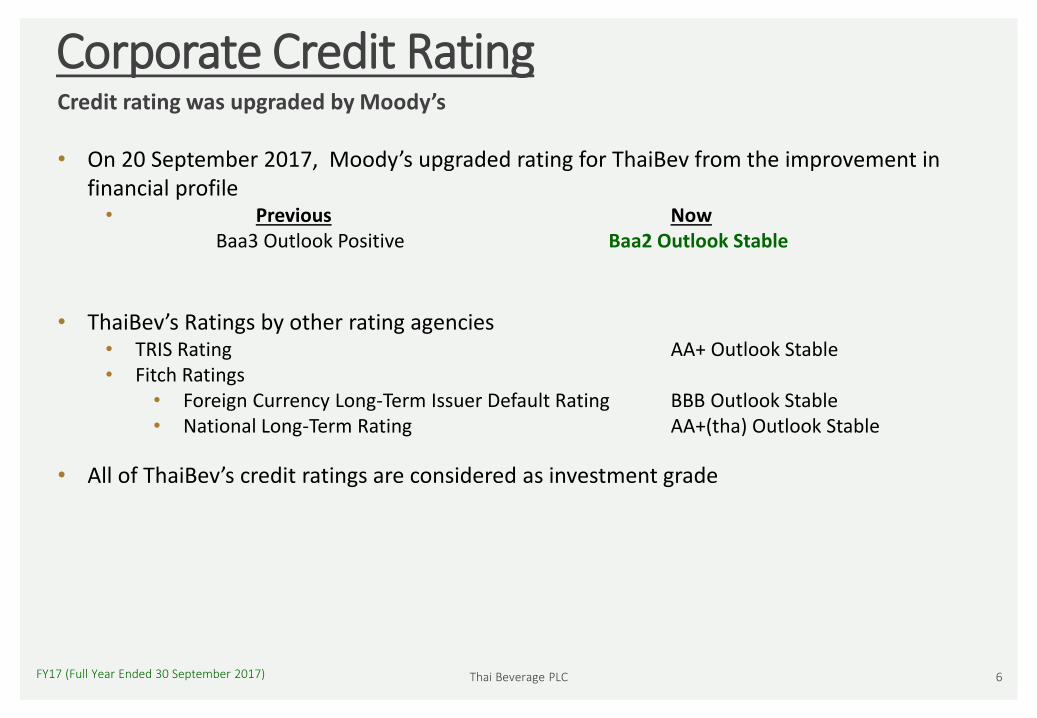
Corporate Credit RatingCredit rating was upgraded by Moody’s
• On 20 September 2017, Moody’s upgraded rating for ThaiBev from the improvement in financial profile• Previous Now
Baa3 Outlook Positive Baa2 Outlook Stable
• ThaiBev’s Ratings by other rating agencies• TRIS Rating AA+ Outlook Stable• Fitch Ratings
• Foreign Currency Long-Term Issuer Default Rating BBB Outlook Stable• National Long-Term Rating AA+(tha) Outlook Stable
• All of ThaiBev’s credit ratings are considered as investment grade

FY17 (Full Year Ended 30 September 2017) Thai Beverage PLC 7
FY17 Performance HighlightsFlat top line, but delivered satisfactory growth in net profit
• Marginal decrease in total sales revenue amid a full year of mourning period• Total sales revenue dropped -0.02% to Baht 189,997 million• Solid performance in spirits segment
• Volume +2.7%• Value +2.6%• Net profit +2.1%
• Maintain market share in beer
• Rise in net profit*
• Maintain good margin in spirits, and turnaround non-alcoholic beverages to be EBITDA positive• Net profit from normal operation* increased 4.6% to Baht 26,184 million
• Recognition of F&N’s fair value gains on financial assets of Baht 8,497 million
• Full year dividend payment• Increase dividend payout from Baht 0.60/share to Baht 0.67/share
* Excluded F&N recognition of fair value gains on financial assets of Baht 8,497 million

FY17 (Full Year Ended 30 September 2017) Thai Beverage PLC 8
Revenue from sales(million Baht)
189,997-0.02%
EBITDA(before F&N recognition of fair value gains on financial assets of Bt 8,497 m)
(million Baht)
36,6053.3%
Net profit(before F&N recognition of fair value gains on financial assets of Bt 8,497 m)
(million Baht)
26,1844.6%
EPS (basic)(before F&N recognition of fair value gains on financial assets of Bt 8,497 m)
(Baht)
1.034.0%
Group Financial Highlights FY17
EBITDA
(million Baht)
45,10227.3%
EPS (basic)
(Baht)
1.3738.4%
Net profit
(million Baht)
34,68138.5%

Thai Beverage PLC 9FY17 (Full Year Ended 30 September 2017)
Dividend Policy:Not less than 50% of net profit after deduction of all specified reserves, subject to our investment plans and as the Board of Directors deems appropriate
Dividend Payment
* Recognition of fair value gains on financial asset
Dividend Payment 9M16 12M17
Net Profit belonging to the Company - Include F&N/FCL (Million Baht) 18,920 34,510
Number of Shares (Million Shares) 25,110 25,110
Dividend (Million Baht) 15,066 16,824
Less Interim dividend already paid (Million Baht) 5,022 5,022
Final dividend (Million Baht) 10,044 11,802
Payout ratio (Full fiscal year) 80% 49%
Net Profit belonging to the Company - Include F&N/FCL (Million Baht) 18,920 34,510
Less exceptional item* (Million Baht) - 8,497
Normalized net profit (Million Baht) 18,920 26,013
Payout ratio (Normalized net profit) (Full fiscal year) 80% 65%
Dividend per share (Baht) 0.60 0.67
Less Interim dividend already paid (Baht ) 0.20 0.20
Final dividend (Baht) 0.40 0.47

Thai Beverage PLC 10FY17 (Full Year Ended 30 September 2017)
Consolidated: FY17 Highlights
As approved at the 2016 annual general meeting, the Company and its subsidiaries have changed the fiscal year from “1 January to 31 December” to “1 October to 30 September” since 1 January 2016. The first new fiscal year for 2016 was 9 months from 1 January 2016 to 30 September 2016. The fiscal year 2017 will be 12 months from 1 October 2016 to 30 September 2017.
12M16 12M17
Group Oct15 - Sep16 Oct16 - Sep17 Change (M Baht)
Sales Revenue 190,033 189,997 0.0%
COGS (134,371) (131,899) % of Sales Revenue 70.7% 69.4%
SG&A (29,921) (30,574) % of Sales Revenue 15.8% 16.1%
EBITDA (exclude F&N/FCL) 31,463 32,675 3.9%
Net Profit (exclude F&N/FCL) 21,778 22,799 4.7%
F&N/FCL EBITDA (from normal operation) 3,972 3,930
F&N/FCL Net Profit (from normal operation) 3,254 3,385
EBITDA (before recognition of fair value gains on financial assets) 35,435 36,605 3.3%
Net Profit (before recognition of fair value gains on financial assets) 25,032 26,184 4.6%
F&N recognition of fair value gains on financial assets - 8,497
EBITDA 35,435 45,102 27.3%
Net Profit 25,032 34,681 38.5%
Net Profit attributable to:
Owners of the Company 24,949 34,510 38.3%
Non-controlling interests 83 171
Margin*
EBITDA (exclude F&N/FCL) 16.6% 17.2%
Net Profit (exclude F&N/FCL) 11.5% 12.0%
EBITDA (before recognition of fair value gains on financial assets) 18.6% 19.3%
Net Profit (before recognition of fair value gains on financial assets) 13.2% 13.8%
EBITDA 18.6% 23.7%
Net Profit 13.2% 18.3%
* margins are % of sales revenue
Thai Beverage PLC 11FY17 (Full Year Ended 30 September 2017)
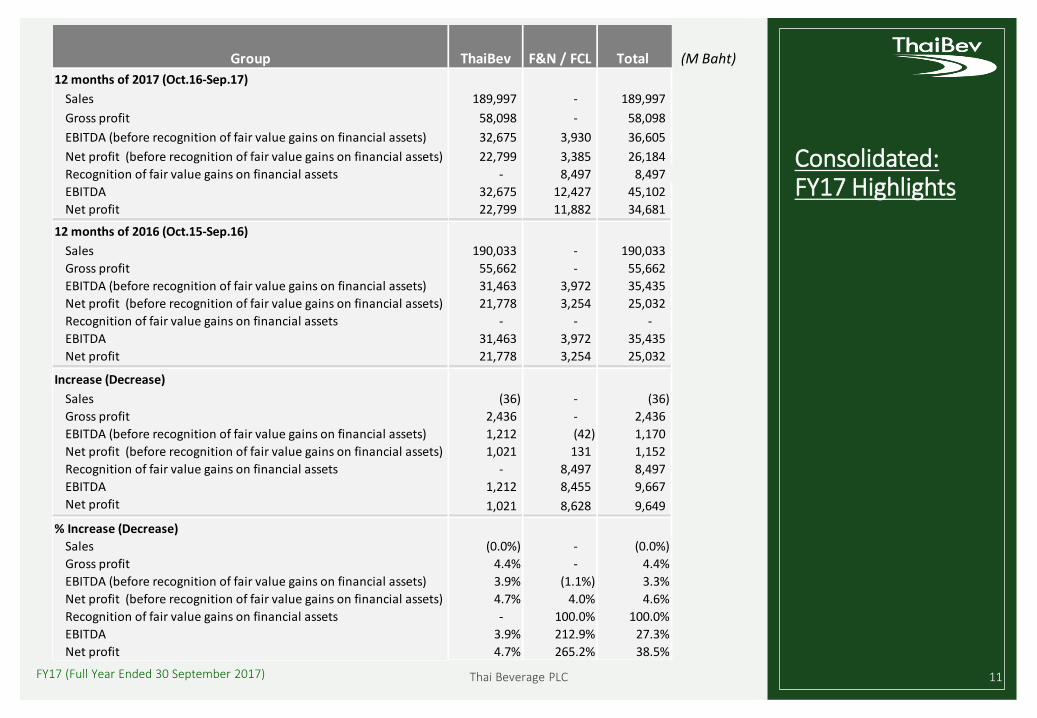
Consolidated: FY17 Highlights
Group ThaiBev F&N / FCL Total (M Baht)
12 months of 2017 (Oct.16-Sep.17)
Sales 189,997 - 189,997
Gross profit 58,098 - 58,098
EBITDA (before recognition of fair value gains on financial assets) 32,675 3,930 36,605
Net profit (before recognition of fair value gains on financial assets) 22,799 3,385 26,184
Recognition of fair value gains on financial assets - 8,497 8,497
EBITDA 32,675 12,427 45,102
Net profit 22,799 11,882 34,681
12 months of 2016 (Oct.15-Sep.16)
Sales 190,033 - 190,033
Gross profit 55,662 - 55,662
EBITDA (before recognition of fair value gains on financial assets) 31,463 3,972 35,435
Net profit (before recognition of fair value gains on financial assets) 21,778 3,254 25,032
Recognition of fair value gains on financial assets - - -
EBITDA 31,463 3,972 35,435
Net profit 21,778 3,254 25,032
Increase (Decrease)
Sales (36) - (36)
Gross profit 2,436 - 2,436
EBITDA (before recognition of fair value gains on financial assets) 1,212 (42) 1,170
Net profit (before recognition of fair value gains on financial assets) 1,021 131 1,152
Recognition of fair value gains on financial assets - 8,497 8,497
EBITDA 1,212 8,455 9,667
Net profit 1,021 8,628 9,649
% Increase (Decrease)
Sales (0.0%) - (0.0%)
Gross profit 4.4% - 4.4%
EBITDA (before recognition of fair value gains on financial assets) 3.9% (1.1%) 3.3%
Net profit (before recognition of fair value gains on financial assets) 4.7% 4.0% 4.6%
Recognition of fair value gains on financial assets - 100.0% 100.0%
EBITDA 3.9% 212.9% 27.3%
Net profit 4.7% 265.2% 38.5%

Thai Beverage PLC 12FY17 (Full Year Ended 30 September 2017)
Contribution per Business Segment
* Exclude F&N / FCL
FY17

Thai Beverage PLC 13FY17 (Full Year Ended 30 September 2017)
Total Sales Volume
* est and 100Plus ** Energy drink, sports drink and other beverages
FY17

Thai Beverage PLC 14FY17 (Full Year Ended 30 September 2017)
Business Segments

FY17 (Full Year Ended 30 September 2017) Thai Beverage PLC 15
Spirits
(M Baht)
Sales Revenue UP an increase in sales volume COGS (%) DOWN an increase in sales volume SG&A (%) UP an increase in advertising and promotion expensesEBITDA UP an increase in gross profitNet Profit UP an increase in EBITDA
12M16 12M17
Spirits Oct15 - Sep16 Oct16 - Sep17 Change
Sales Revenue 106,499 109,297 2.6%
COGS (71,580) (73,209) % of Sales Revenue 67.2% 67.0%
SG&A (10,044) (10,620) % of Sales Revenue 9.4% 9.7%
EBITDA 26,897 27,301 1.5%
Net Profit 19,995 20,420 2.1%
Margin*
EBITDA 25.3% 25.0%
Net Profit 18.8% 18.7%
* margins are % of sales revenue

FY17 (Full Year Ended 30 September 2017) Thai Beverage PLC 16
Spirits: Revenue-Cost Break Down
(% of total revenue) FY17

FY17 (Full Year Ended 30 September 2017) Thai Beverage PLC 17
Beer
Sales Revenue DOWN a decrease in sales volumeCOGS (%) DOWN a decrease in bottle and raw material costs although there was a decrease in sales volumeSG&A (%) UP an increase in advertising and promotion expensesEBITDA DOWN an increase in advertising and promotion expensesNet Profit DOWN a decrease in EBITDA
(M Baht)
12M16 12M17
Beer Oct15 - Sep16 Oct16 - Sep17 Change
Sales Revenue 60,159 57,326 -4.7%
COGS (47,937) (44,316) % of Sales Revenue 79.7% 77.3%
SG&A (8,708) (9,477) % of Sales Revenue 14.5% 16.6%
EBITDA 4,615 4,522 -2.0%
Net Profit 3,265 3,130 -4.1%
Margin*
EBITDA 7.7% 7.9%
Net Profit 5.4% 5.5%
* margins are % of sales revenue
FY17 (Full Year Ended 30 September 2017) Thai Beverage PLC 18
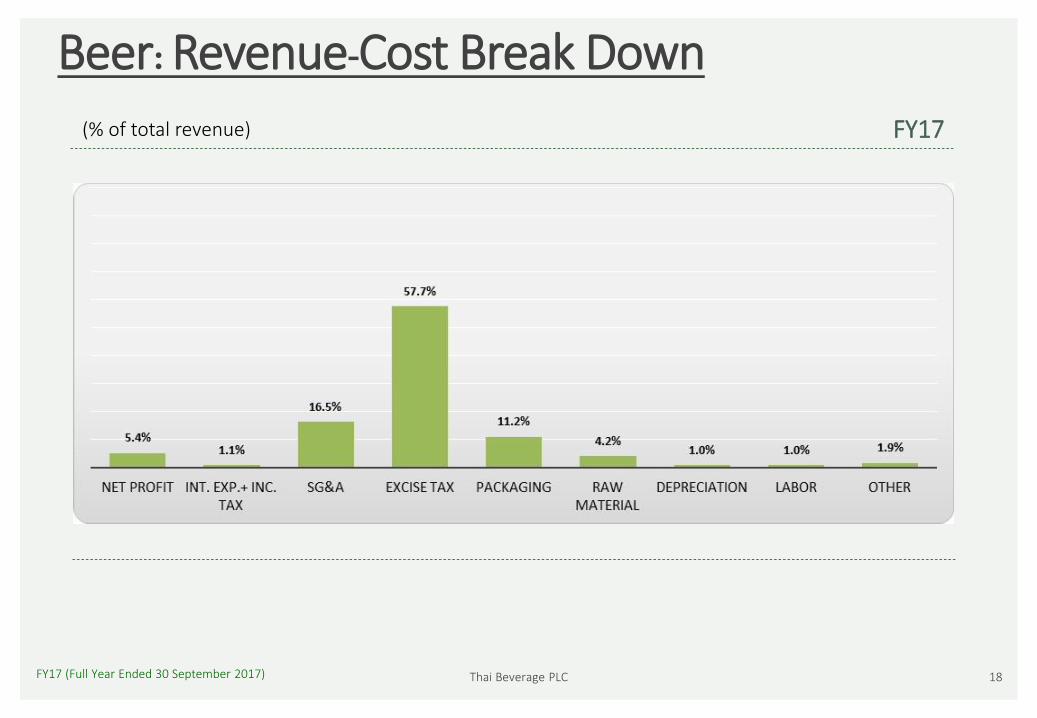
Beer: Revenue-Cost Break Down
(% of total revenue) FY17

FY17 (Full Year Ended 30 September 2017) Thai Beverage PLC 19
Non-alcoholic Beverages
(M Baht)
Sales Revenue DOWN the expiry in August 2016 of a production and distribution agreement for OEM sports drink, even though the sales volume of the company’s main products increased
COGS (%) DOWN a decrease of packaging costs
SG&A (%) DOWN a decrease in advertising and promotion expensesEBITDA UP an increase in gross profit and a decrease in advertising and promotion expensesNet Loss DOWN a turnaround in EBITDA loss
12M16 12M17
Non-Alcoholic Beverages Oct15 - Sep16 Oct16 - Sep17 Change
Sales Revenue 16,936 16,777 -0.9%
COGS (11,132) (10,769) % of Sales Revenue 65.7% 64.2%
SG&A (8,662) (7,735) % of Sales Revenue 51.1% 46.1%
EBITDA (Loss) (697) 209 130.0%
Net Profit (Loss) (1,570) (855) 45.5%
Margin*
EBITDA (-Loss) -4.1% 1.2%
Net Profit (-Loss) -9.3% -5.1%
* margins are % of sales revenue

FY17 (Full Year Ended 30 September 2017) Thai Beverage PLC 20
Food
(M Baht)
Sales Revenue UP an increase in the number of restaurantsCOGS (%) DOWN an increase in selling price and a cost efficiency SG&A (%) UP an increase in rental expenses from opening new storesEBITDA DOWN an increase in rental expenses from opening new stores although there was an increase in gross profitNet Profit UP an increase in gross profit and a decrease in depreciation from fully depreciated assets
12M16 12M17
Food Oct15 - Sep16 Oct16 - Sep17 Change
Sales Revenue 6,645 6,742 1.5%
COGS (3,871) (3,705) % of Sales Revenue 58.3% 55.0%
SG&A (2,701) (2,942) % of Sales Revenue 40.6% 43.6%
EBITDA 648 643 -0.8%
Net Profit 88 104 18.2%
Margin*
EBITDA 9.8% 9.5%
Net Profit 1.3% 1.5%
* margins are % of sales revenue
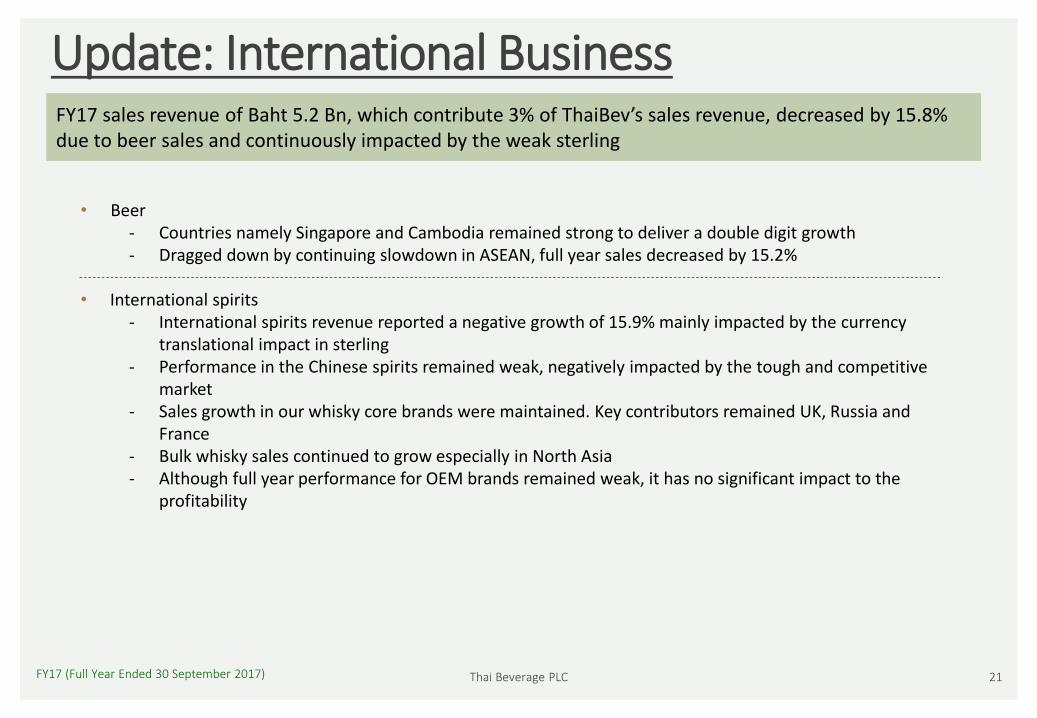
Update: International BusinessFY17 sales revenue of Baht 5.2 Bn, which contribute 3% of ThaiBev’s sales revenue, decreased by 15.8% due to beer sales and continuously impacted by the weak sterling
21Thai Beverage PLCFY17 (Full Year Ended 30 September 2017)
• Beer- Countries namely Singapore and Cambodia remained strong to deliver a double digit growth- Dragged down by continuing slowdown in ASEAN, full year sales decreased by 15.2%
• International spirits- International spirits revenue reported a negative growth of 15.9% mainly impacted by the currency
translational impact in sterling- Performance in the Chinese spirits remained weak, negatively impacted by the tough and competitive
market- Sales growth in our whisky core brands were maintained. Key contributors remained UK, Russia and
France- Bulk whisky sales continued to grow especially in North Asia- Although full year performance for OEM brands remained weak, it has no significant impact to the
profitability

Thai Beverage PLC 22FY17 (Full Year Ended 30 September 2017)
Financials

FY17 (Full Year Ended 30 September 2017) Thai Beverage PLC 23
Statement of Financial Position
Current assets UP an increase in cash and cash equivalents although there was a decrease in inventory
Non-current assets UP an increase in property, plant and equipmentCurrent liabilities UP an increase short-term loans from financial institutions and current portion of
long-term loansNon-current liabilities DOWN a decrease in loans from financial institutionsTotal equity UP an increase in net retained earnings from the profit for the year which deducted
with dividend payment
Statement of Financial Position 30-Sep-16 30-Sep-17 Change
(Million Baht)
Assets
Current assets 50,104 55,921 5,817
Non-current assets 137,549 138,319 770
Total assets 187,653 194,240 6,587
Liabilities
Current liabilities 32,819 47,671 14,852
Non-current liabilities 31,122 14,056 (17,066)
Total liabilities 63,941 61,727 (2,214)
Shareholders' Equity
Total equity 123,712 132,513 8,801

FY17 (Full Year Ended 30 September 2017) Thai Beverage PLC 24
Interest Bearing Debt
The periods to maturity of interest-bearing debts were as follows
Unit: Million BahtWithin one year (Sep 2018) 30,658 After one year but within two years (Sep 2019) 10,000Total 40,658
Interest Bearing Debt 30-Sep-16 30-Sep-17
(Million Baht)
Current
Bank overdrafts 1,072 -
Short-term loans from financial institutions 2,423 5,703
Current portion of bill of exchanges and long-term loans 15,501 24,950
Other short-term loan - 5
18,996 30,658
Non-current
Debentures 2,000 2,000
Long-term bill of exchanges from financial institutions 9,763 -
Long-term loans from financial institutions 15,326 8,000
27,089 10,000
Total 46,085 40,658
Cash and cash equivalents 5,059 9,929
Net Interest Bearing Debt 41,026 30,729

FY17 (Full Year Ended 30 September 2017) Thai Beverage PLC 25
Financial Ratios
Current Ratio DOWN an increase in short-term loans from financial institutions as well as current portion of long-term loans from financial institutions
Liability to Equity Ratio DOWN a decrease in loans from financial institutions, and an increase in net retained earnings from the profit for the year which deducted with dividend payment
Note: use 365 days to calculate turnover
Ratios 30-Sep-16 30-Sep-17
Current Ratio (times) 1.53 1.17
Liability to Equity Ratio (Gearing Ratio) (times) 0.52 0.47
Interest Bearing Debt to Equity Ratio (times) 0.37 0.31
Net Interest Bearing Debt to Equity Ratio (times) 0.33 0.23
Net Interest Bearing Debt to EBITDA (times) 1.16 0.68
Net asset value per share (Baht) 4.78 5.13
Net asset value per share (SGD)* 0.20 0.21 * exchange rate at THB 23.86240 : SGD 1
EPS Oct 15 - Sep 16 Oct 16 - Sep 17
Earnings per share for the year (Baht) 0.99 1.37
Turnover Oct 15 - Sep 16 Oct 16 - Sep 17
A/R Turnover (days) 6 5
Inventory Turnover (days)
Spirit Business: finished goods 60 56
Beer Business: finished goods 9 14
Non-alcohol Business: finished goods 27 26
Food Business: finished goods 2 2

Thai Beverage PLC 26FY17 (Full Year Ended 30 September 2017)
Q&A