th september 2017 criticality as a life cycle … for rare earth elements ......
TRANSCRIPT

CRITICALITY AS A LIFE CYCLE IMPACT INDICATOR FOR RARE EARTH ELEMENTS
Robert Pell – Supervisors: Prof Frances Wall, Dr Xiaoyu Yan, Dr Kathryn Goodenough, Dr Kathryn Moore
12th SEPTEMBER 2017

Contents 2
1. An introduction to Life Cycle Assessments (LCA)
for rare earth production
2. Criticality of rare earth elements
3. Resource depletion in LCA
4. Economic resource scarcity of REE
5. Results and integration into LCA
6. Other areas of research

3
Figure 1. Tailings at Bayan Obo, China
(https://www.theguardian.com/sustainable-business/rare-
earth-mining-china-social-environmental-costs)
Figure 2. Wind energy presented as green
(www.sierraclub.org)
Motivation for research
1. Quantify and reduce the environmental burden associated with raw material production for the low-carbon economy 2. Understand the raw material bottlenecks that could limit the proliferation of green technology

1. Life Cycle Assessments (LCA) for rare earth production

What is a Life Cycle Assessment? 5
A life cycle assessment allows a quantitative assessment of the environmental performance of a product or process over its entire life cycle
(ISO 14044a)

LCA boundaries and flows 6
Figure 3. Simplified flowsheet highlighting system boundaries, inputs and outputs
Mining
Rare earth
element use

Bear Lodge process flowsheet
Figure 5. Process flowsheet
for the Bear Lodge project
Figure 4. Process and system boundary for the fuel
use and explosives emissions at Bear Lodge
Completing an REE project LCA

Bear Lodge process flowsheet
Figure 6. Equations and calculations for energy
consumption during the mining phase at Bear Lodge

What results look like 9
0 20 40 60
Energy consumption(MJ/T REO)
Figure 7. Energy consumption at Bear
Lodge (conference paper Pell et al, 2016)
Figure 8. Example of endpoint environmental
impacts (ISO 2006)

Cradle-to-gate global warming potential for the production of 1 kg of mixed REO at
Mountain Pass (left) and Bear Lodge (right) for the life of mine
0
0.5
1
1.5
2
2.5
3
3.5
Mountain Pass Bear Lodge
Figure 9. Global warming potential (GWP) for the REO production (kg CO2-Equiv/kg
REO) at Mountain Pass and Bear Lodge (Pell et al, 2016)
2.4
3.3 Kg CO2-Equiv/kg REO at Mountain
Pass
Kg CO2-Equiv/kg REO at Bear Lodge
(LOM)
The Tool for Reduction and Assessment of Chemicals and Other Environmental Impacts (TRACI) was used as the characterization factors for Life Cycle Impact Assessment (LCIA) (Bare, 2012) .

2. Criticality of rare earth elements (REE)

12
Figure 10. 2-dimensional criticality (Glöser-Chahoud et al, 2016)
What is criticality? Criticality refers to raw materials that have a relatively high chance of supply restriction and high economic importance. Each criticality study has a different temporal and spatial scale. For example a criticality study of REE from the perspective of China would have a lower supply risk, and high economic importance would be expected.
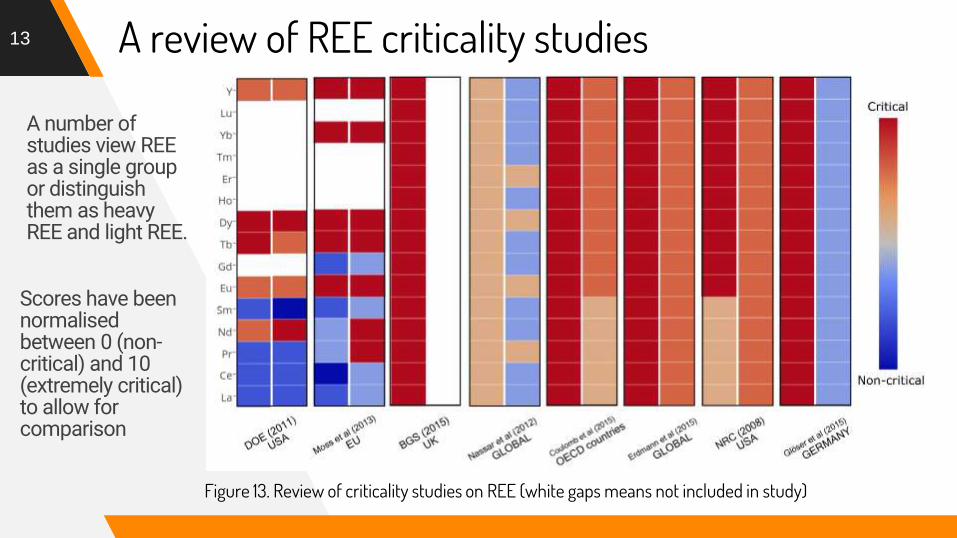
13 A review of REE criticality studies
Figure 13. Review of criticality studies on REE (white gaps means not included in study)
A number of studies view REE as a single group or distinguish them as heavy REE and light REE.
Scores have been normalised between 0 (non-critical) and 10 (extremely critical) to allow for comparison
14
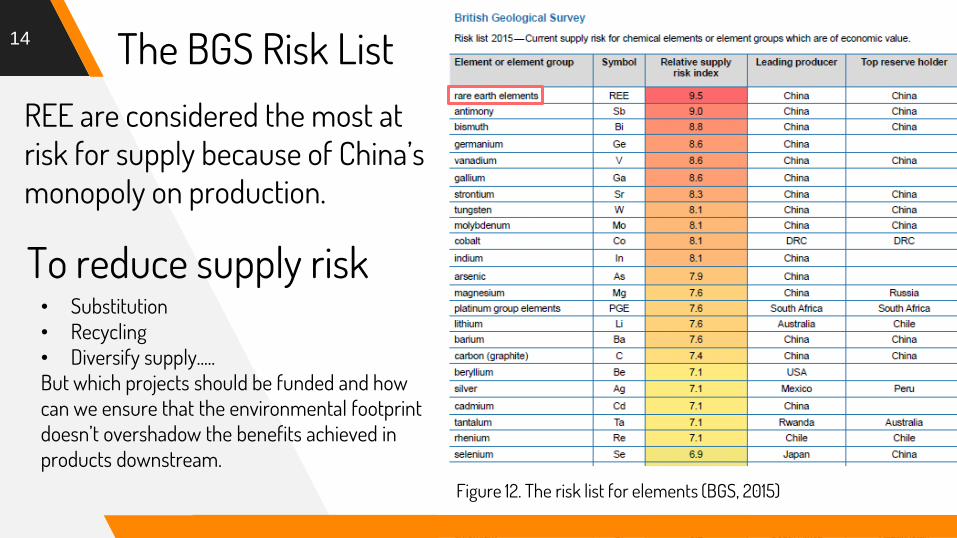
To reduce supply risk • Substitution • Recycling • Diversify supply..... But which projects should be funded and how can we ensure that the environmental footprint doesn’t overshadow the benefits achieved in products downstream.
REE are considered the most at risk for supply because of China’s monopoly on production.
The BGS Risk List
Figure 12. The risk list for elements (BGS, 2015)

3. Resource depletion in LCA

Economic Resource Scarcity Potential (ESP) 16
Figure 14. Areas of Protection in LCA (ISO, 2006)

The three approaches for resource availability in LCA
1. Thermodynamic approach – using entropy or exergy as a basis for characterization to consider efficiency of extraction
2. Resource scarcity as a basis for characterization – looks at long-term depletion of non-renewable resources
3. Calculates future availability including increased effort required to access the resource
17

Abiotic Depletion Potential
1
1.05
1.1
1.15
1.2
1.25
Reserve-to-production ratio
ADP
impa
ct sc
ore
for L
CA
Measures the depletion of resources and calculates future resource scarcity.
The ADP method fails to consider socio-economic, regulatory and geopolitical aspects or functionalities such as material recycling or reuse that control the supply of raw materials. The concept of resource scarcity is contested due to economic and technology drivers.
Figure 15. ADP results for 15 REE + Au, Cu, PGM, Fe and Li

Surplus cost potential 19
Comparison of mineral resource scarcity scores of copper, gold, lithium, platinum-group metals and rare earth elements using the surplus cost potential approach.
All rare earth elements are categorised with a single score
Figure 16. Surplus cost potential results for 15 REE + Au, Cu, PGM, Fe and Li
4. Economic resource scarcity (Schneider, 2014)

Impact categories 21
Impact category Category indicators Threshold
Supply risk
Reserve availability Reserve/Annual production Low<0.4<high
Recycling New material content (%) Low<0.5<high
Country Concentration reserves HHI index Low<0.15<high
Country concentration mine production HHI index Low<0.15<high
Company concentration mine production HHI index Low<0.15<high
Governance stability WGI1 Low<0.25<high
Socioeconomic stability HDI2 Low<0.12<high
Trade barriers mine production Share of mine production under trade barriers (%) Low<0.25<high
Companion metal fraction Production as companion metal (%) Low<0.2<high
Economic importance
Average production and cost per kg $ per kg Low<0.15<high
1 Table 1. Impact categories selected for rare earth element criticality (adjusted from Schneider et al 2014)

Economic Scarcity Potential of REE 22
• Assumed in this case study on a global scale • It doesn’t include the data for the illegal mining of rare earths • Short term time scale until 2021
The impact factor developed by Schneider et al (2014) uses impact factors (𝐼) to provide a threshold, above which high risk of supply is expected. This can be calculated for the 15 REE (𝑖) and each impact category (𝑗).
𝐼𝑖𝑗 = 𝑀𝑎𝑥𝑖𝑛𝑑𝑖𝑐𝑎𝑡𝑜𝑟 𝑣𝑎𝑙𝑢𝑒𝑖,𝑗
𝑡ℎ𝑟𝑒𝑠ℎ𝑜𝑙𝑑𝑖,𝑗
2
; 1
Equation 1. Calculation of impact factors for ESP (Schneider et al, 2014)

23 Country concentration of reserves by individual REE

24 Country concentration of individual REE production

25 Company concentration of reserves by individual REE

26 Governance stability of REE producing countries

Aggregation to create ESP scores 27
𝐸𝑆𝑃𝑖 = 𝐼𝑖,𝑗𝑗
The individual impact categories scores are then aggregated to form an individual elements economic scarcity potential score
Equation 2. Aggregation of individual impact scores for ESP (Schneider et al, 2014)

5. Results and integration into LCA

REE in relation to other metals 29
Figure 24. REE in comparison to Au, Cu, PGM, Fe & Li (normalized between 0-1)
(red is high impact, blue low impact) for the ten impact categories (Data based on
Angerer et al, 2009; BDI 2010; Graedel 2013; Nassar et al, 2012; National
Research Council 2008; USGS, 2005, 2013).
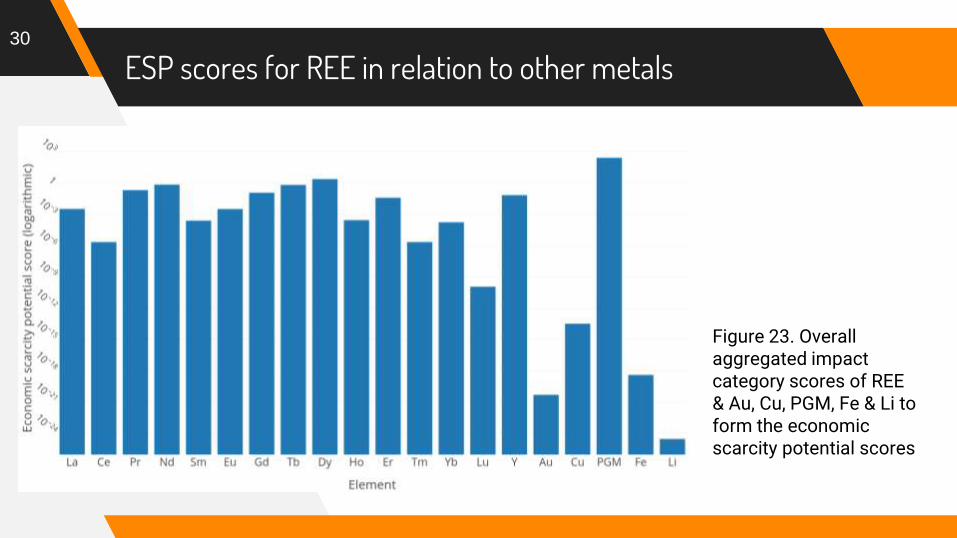
ESP scores for REE in relation to other metals 30
Figure 23. Overall aggregated impact category scores of REE & Au, Cu, PGM, Fe & Li to form the economic scarcity potential scores

Adjusting the weighting 31
Impact category Category indicators Threshold
Supply risk
Reserve availability Reserve/Annual production Low<0.4<high
Recycling New material content (%) Low<0.5<high
Country Concentration reserves HHI index Low<0.15<high
Country concentration mine production HHI index Low<0.15<high
Company concentration mine production HHI index Low<0.15<high
Governance stability WGI1 Low<0.25<high
Socioeconomic stability HDI2 Low<0.12<high
Trade barriers mine production Share of mine production under trade barriers (%) Low<0.25<high
Companion metal fraction Production as companion metal (%) Low<0.2<high
Economic importance
Average production and cost per kg $ per kg Low<0.15<high
1
50%
50%

Adjusting the weighting 32
Increasing the weighting of economic importance to equal supply risk
Equally weighted
50% economic importance & 50% supply risk
Figure 24. Comparison of economic scarcity potential scores when weighting is increased

Incorporating these results into LCA for NdFeB magnet production materials
33
Element Weight %
Fe 66.88
Nd 18.0
Dy 6.15
Pr 4.6
Cu 0.18
Figure 25. Comparison of resource depletion scores for the raw materials that are used in a NdFeB magnet (Results adjusted to kg Cu-eq/kg raw material for easy comparison)

Contribution of individual metal 34
Figure 26. Breakdown of contributing elements to resource depletion scores for three methodologies

Challenges
▸ Is it useful in a Life Cycle Assessment – issues of incorporating the market in LCA is controversial
▸ Data availability REE production and the illegal mining (USGS data used)
▸ Subjective nature of weighting the importance of different impact categories
▸ Needs more information about the supply chain, such as bottlenecks in REE separation or magnet making
▸ Elasticity of downstream industry – alternatives to REE, REE recycling
35

Conclusions and implications of research 36
• This method allows consideration of a greater number of factors which control the supply of raw materials over the short-term
• Not a replacement for other methods such as surplus cost potential, but instead can calculate short-term availability
• This is important to consider as we move to a renewable energy generation economy which is likely to require more critical raw materials per unit energy produced.
• This method can be used with other critical metals and can be tailored for use with specific countries, technologies or companies.

6. Other areas of research

National scale criticality of REE in China
▸ Examine the dynamics of REE market in China using similar method to this talk.
▸ Incorporating criticality within LCA framework and compare current and future
deposits in China.
▸ Extend the value chain through to metals and alloys
38

HSC Sim and LCA for rare earth production 39
Calcite leach at Mkango Resources Songwe Hill deposit Linking HSC Chemistry with GaBi LCA software allows; ▸ Evaluation and
quantification of environmental performance of specific process or plant
▸ Ensures the use of closed mass and energy balances
▸ Novel approaches…

Exergetic efficiency of rare earth production 40
“…determine the thermodynamic perfection of a system…” (R.L. Cornelissen, 1998)
Example of exergetic efficiency results of copper smelting (Lehtonen, 2013)

41
THANKS FOR YOUR ATTENTION! Any questions?