tgi & cálidda earnings call 1 q 2015
TRANSCRIPT
May 27th 2015
1Q 2015 TGI RESULTS AND KEY DEVELOPMENTS
DisclaimerThis presentation contains statements that are forward-looking within the meaning of Section 27A of the Securities Act of 1933, as amended (the “Securities Act”), and Section 21E of the Securities Exchange Act of 1934, as amended. Such forward-looking statements are only predictions and are not guarantees of future performance. All statements other than statements of historical fact are, or may be deemed to be, forward-looking statements. Forward-looking statements include, among other things, statements concerning the potential exposure of TGI, its consolidated subsidiaries and related companies to market risks and statements expressing management’ expectations, beliefs, estimates, forecasts, projections and assumptions. These forward-looking statements are identified by their use of terms and phrases such as “anticipate”, “believe”, “could”, “estimate”, “expect”, “intend”, “may”, “plan”, “objectives”, ”outlook”, “probably”, “project”, “will”, “seek”, “target”, “risks”, “goals”, “should” and similar terms and phrases. Forward-looking statements are statements of future expectations that are based on management’s current expectations and assumptions and involve known and unknown risks and uncertainties that could cause actual results, performance or events to differ materially from those expressed or implied in these statements. Although TGI believes that the expectations and assumptions reflected in such forward-looking statements are reasonable based on information currently available to TGI’s management, such expectations and assumptions are necessarily speculative and subject to substantial uncertainty, and as a result, TGI cannot guarantee future results or events. TGI does not undertake any obligation to update any forward-looking statement or other information to reflect events or circumstances occurring after the date of this presentation or to reflect the occurrence of unanticipated events.

Table of contents
1. Overview
2. Key updates
3. Operational and Financial performance
4. Expansion Projects
Appendix
1. EEB Overview

1. OVERVIEW

Overview
5
Stable and growing Colombian economy with sound investment environment
Constructive and stable regulatory framework
Largest natural gas pipeline system in Colombia
Stable and predictable cash flow generation, strongly indexed to the US Dollar
Strong and consistent financial performance
Experienced management team with solid track record in the sector
Expertise, financial strength and support of shareholders
Natural monopoly in a regulated environment
Strategically located pipeline network

Pipeline networkPipeline network
TGI history
6
Company historyCompany history
HighlightsHighlights
Owns ~60% of the national pipeline network (3,957 km) and transports 48% of the gas consumed in the country
−Serves ~70% of Colombia’s population, reaching the most populated areas (Bogota, Cali, Medellin, the coffee region and Piedemonte Llanero, among others)
−Has access to the two main production regions, La Guajira and Cusiana/Cupiagua
Cartagena Refinery
Barrancabermeja Refinery Bucaramanga
Bogota
NeivaCali
Medellin
3.15 tcf
1.97 tcf
EasternProducers:EcopetrolEquion
Upper Magdalena Valley
Lower and Middle Magdalena Valley
NorthernProducers:ChevronEcopetrol 1.89 tcf
Ballena
Cusiana
ReferencesTGI Pipelines
Natural Gas ReservesCityFieldRefinery
Third Party Pipelines
Source:Mining and Energy Planning Unit. National Hydrocarbons Agency.
1997 2005 2006 2007 2008 2009 2010 2011 2012 2013
Start of Ecogas Privatization Process
Creation of TGI Inaugural bond
issuance (Fitch Rating: BB)
Transfer of first BOMT pipeline (GBS)
Pipelines exchange with Promigas
CVCI capitalization for USD 400 Mn
Transfer of second BOMT pipeline (Centragas)
Cusiana expansion phase I: start of operations
Refinancing of subordinated debt with EEB
Awarded investment grade rating by S&P
Headquarters relocation from Bucaramanga to Bogota
Redesign of organizational structure
Creation of Ecogas Ecogas assets awarded to EEB
TGI takes over the O&M of owned pipelines
EEB acquired the remaining stakes in Transcogas
Ballena expansion: start of operations
Merger of TGI and Transcogas
Refinancing of bonds issued in 2007 (Fitch Rating: BB+)
Cusiana expansion phase II: start of operations
TGI takes over the O&M of compressor stations
Awarded investment grade by Moody’s and Fitch 2014
EEB acquired 31.92% stake
Sabana Compressor starts operations
Fitch upgrades rating from BBB- to BBB
First dividend distribution
Paci
fic
Oce
an
Caribbean Sea
VEN
EZU
ELA

2. KEY UPDATES

Key updates
8
Since 2H 2011 TGI has executed a strategy to improve its credit ratings in order to (i) reduce financial expenses, (ii) provide better access to debt capital markets and (iii) broaden its potential investor base
On August 2014, Standard & Poor’s affirmed the TGI corporate debt and issuer rating in ‘BBB-‘, perspective stable
On October 28th, Fitch Ratings upgraded TGI’s corporate debt and issuer rating from ‘BBB-’ to ‘BBB’, with stable perspective
Baa3 Stable OutlookBBB Stable Outlook BBB- Stable Outlook
TGI´s credit ratings
Final steps of TGI’s stake (31.92%) acquisition by parent company (EEB)
EEB closed TGI’s stake acquisition in 2H2014, through the acquisition of 100% of IELAH (SPV) domiciled in Spain.
As part of the transaction structured by EEB, IELAH should merge with TGI and the debt of that entity will be in TGI´s BS. Currently the company is working on that merger and it is expected to close it at the end of 2015.
Current outstanding debt of IELAH is USD 569 MM, after a partial repay (USD 76 MM) done in March 2015.

TGI started the convergence process from ColGAAP to IFRS Mandatory transition period began on January 1, 2014 and the issuance date of the first
comparative financial statements under IFRS will be December 31, 2015 Since 2013, TGI carried out activities regarding preparation and adjustment of the resources
needed to advance in the process of convergence to IFRS in accordance with legal requirements TGI with technical support from external advisors, determined the effects that such changes will
have on the financial statements Some specific impacts are still being analyzed by TGI
Transition to International Financial Reporting Standards - IFRS
Key updates

Regulation perspectives
■ The last tariff review was approved by the CREG Resolution No. 126 in August 2010 and became effective for TGI in December 2012 (CREG Resolution No. 121). The tariff methodology review process takes place every 5 years, but the actual tariff application is usually delayed (previous tariff period was effective from December 2003 to December 2012, a total of 9 years)
■ According to CREG, new regulation is expected to be approved between 2015 – 2016, with the updated tariffs coming into effect between 2017 – 2018 (the starting point for the 5 year-period is set by the CREG approval of the new tariff methodology)
■ Based on TGI’s analysis and taking into account the latest available data parameters for its calculations (1), the new regulatory WACC is estimated at 11,63% for capacity and 14,30% for volume. (12,30% weighted average)
Aug. 2010
New tariff methodology proposition for discussion
End of current tariff period
Final tariff methodology
Final regulatory WACC
Information request for charges
Charge approval by CREG
Request for reinstatement
Approval of final charges and implementation of new WACC
Approval of charges
Information reporting to CREG
Termination of public information audit stage – demands and expressions of interest from third parties
Dec. 2014
Aug. 2015
Sep. 2015
Jan. 2016
Jun. 2016
Jul. 2016Dec. 2016
Beginning of current tariff period
Tariff review process – Estimated CREG schedule
Tariffs become effective for TGI
Dec. 2012
5 year regulatory period
(1) As of march 2015
Key updates

3. OPERATIONAL AND FINANCIAL PERFORMANCE

Solid operational performance
(1)The trend line refers to the ratio: Firm contracted capacity/available capacity. The Available capacity differs from the Total Capacity as TGI requires a percentage of it for its own use. Source: Company information.
Network lengthNetwork length(km)
CapacityCapacity(MMscfd)
Firm Contracted Capacity(1)Firm Contracted Capacity(1)
(MMscfd)
Transported VolumeTransported Volume Load factorLoad factor(MMscfd) (%)
Pipeline & Compression Stations Reliability Pipeline & Compression Stations Reliability
20
3,529
3,7743,774
3,9573,9573,9573,957
396 422 420 422454
494.387470
2012 2013 2014 LTM 15 1Q
99.6% 99.7% 99.8% 100.0%
96.0% 96.5% 96.5%99.0%
Pipeline systemCompression system
2009 2010 2011 2012 2013 2014 LTM 15 1Q
69% 71%
58% 59%61% 64% 62%
2009 2010 2011 2012 2013 2014 2015 1Q
437485
560604 625
668 669
92% 90% 92%
85%88%
94% 94%
478548
618
730 730 734 734

Stable and predictable cash flow generation
TGI’s revenues are highly predictable, with approximately 99,6% coming from regulated tariffs that are reviewed al least every 5 years, ensuring cash flow stability and attractive rates of return
Main sectors served by the Company (79(1)% of revenues) present stable consumption patterns (no seasonality)
The Company enjoys excellent contract quality
− 100% of TGI’s contracts are firm contracts with an average life of 8,19 years
− 89% of regulated revenues are fixed tariffs, not dependent on transported volume
− Extremely low sensitivity of EBITDA to changes in exchange rate
13
Revenues breakdownRevenues breakdown(% of revenues)
(1) Includes Distributors, Ecopetrol´s refinery and Natural gas for Vehicles.
TGI’s revenues are highly predictable as a result of regulated tariffs and stable consumption
as of March 31- 2015
By Client
Distributors62%
Refinery13%
Thermal16%
Traders3%
Vehicle4%
Others2%
By Sector
Ecopetrol14%
Gas Natural 25%
Gases de Occidente
17%
EPM 11%
Isagen 8%
Others25%

2009 2010 2011 2012 2013 2014 LTM 15 1Q
172196
226250
323 332 328
68.1% 66.7% 66.8%64.1%
69.4% 70.8% 70.5%
Revenues (3) Gross profit and Gross margin (3)Revenues (3) Gross profit and Gross margin (3)
(US$ in millions – EOM exchange rate for each period)
(US$ in millions – EOM exchange rate for each period) (US$ in millions – average exchange rate for each period)
(1) FFO for the years 2009 - 2013 is presented under ColGaap standards as net income plus depreciation, amortization and provisions, adjusted for effect from exchange rate and hedges. 2014 and LTM 1Q 2015 is presented under IFRS as net income plus depreciation, amortization and provisions, adjusted for effect from exchange rate , hedges, and the impact of deferred taxes.
(2) On 2012 FFO includes the LM transaction premium~ USD 69 million (one time event)(3) Figures for the years 2009 - 2013 are presented under ColGaap standards. 2014 and 1Q 2015 are presented under IFRS. IFRS figures are preliminary subject to changes, independent auditor’s revision and Shareholders Assembly approval
TGI Financial performance
(US$ in millions – EOM exchange rate for each period)
2009 2010 2011 2012 2013 2014 LTM 15 1Q
252294
338
390
465 468 466
2009 2010 2011 2012 2013 2014 LTM 15 1Q
196222
257289
359 371 371
78% 75% 76% 74% 77% 79% 80%
2009 2010 2011 2012 2013 2014 LTM 15 1Q
96 108 117 133
268305 316
Funds from operations (1) (2) (3)Funds from operations (1) (2) (3)EBITDA and EBITDA Margin(3)EBITDA and EBITDA Margin(3)

CASH AND EQUIVALENTS (1) TOTAL ASSETS (1)CASH AND EQUIVALENTS (1) TOTAL ASSETS (1)
LIABILITIES (1)LIABILITIES (1)
(US$ in millions – end-of-year exchange rate for each period) (US$ in billions – end-of-year exchange rate for each period)
(US$ in billions – end-of-year exchange rate for each period)
TGI Financial performance
PPE (1)PPE (1)
(US$ in billions – end-of-year exchange rate for each period)
2009 2010 2011 2012 2013 2014 LTM 15 1Q
11071
182160
364
207
275
2009 2010 2011 2012 2013 2014 LTM 15 1Q
1.802.12
2.562.88 2.98 2.81 2.85
2009 2010 2011 2012 2013 2014 LTM 15 1Q
1.25 1.30 1.34 1.40 1.40 1.60 1.65
0.55 0.811.22 1.48 1.58 1.21 1.20
Liabilities Equity
2009 2010 2011 2012 2013 2014 LTM 15 1Q
0.620.77
1.401.67
1.49
2.28 2.27
(1) Figures for the years 2009 - 2013 are presented under ColGaap standards. For 2014 and 1Q 2015 are presented under IFRS. IFRS figures are preliminary subject to changes, independent auditor’s revision and Shareholders Assembly approval

(x)
Note: Total debt includes senior debt, subordinated debt and mark-to-market.
(1) Figures for the years 2009 - 2013 are presented under ColGaap standards. For 2014 and 1Q 2015 are presented under IFRS. IFRS figures are preliminary, subject to changes, independent auditor’s revision and Shareholders Assembly approval
(2) Interest coverage ratio calculated as EBITDA / net interest
Debt / EBITDA (1)Debt / EBITDA (1)
Interest coverage (1)(2)Interest coverage (1)(2)
(x)
Net debt / EBITDA (1)Net debt / EBITDA (1)
(x)
(x)
Financial performance
Senior Debt / EBITDA (1)Senior Debt / EBITDA (1)
(x)
2009 2010 2011 2012 2013 2014 LTM 15 1Q
5.6 5.44.9
4.23.5 3.3 3.3
2009 2010 2011 2012 2013 2014 LTM 15 1Q
5.1 5.1
4.23.7
2.5 2.7 2.6
2009 2010 2011 2012 2013 2014 LTM 15 1Q
3.8 3.73.4
3.0
2.5 2.3 2.3
2009 2010 2011 2012 2013 2014 LTM 15 1Q
2.0 2.02.5
4.0
5.96.3 6.6

4. EXPANSION PROJECTS

Description: TGI will increase existing capacity of Armenia and Chinchina branches with the construction of two new loops; Armenia Branch: 37.5 km 8” loop parallel to exiting 6” pipeline and Chinchina – Santa Rosa – Dosquebradas Branch: 7.5km 3” loop parallel to existing 3” pipeline
Cost: ~$ 28 mm
Status: — Engineering stage— Expected Completion: 2017
Expansion projects pipeline
Description: Adapt compression stations, delivery and receipt locations along the Ballena - Barrancabermeja pipeline so that it can transport natural gas in both directions, in order to allow natural gas to be transported from the central region to the north
Cost: ~$ 20 mm
Expected Completion:
2016
Ballena – Barrancabermeja Bidirectionality
Description: Increase capacity in 20 mmcf/d by adapting Vasconia, Miraflores, Puente Guiillermo compression stations
Cost: ~$ 31 mm
ExpectedCompletion: Dec. 2015
Cusiana Phase III
Cusiana - Apiay – Villavicencio - Ocoa
Description: BOMT ContractIncrease capacity in 32 mmscf/d. 2 New compression stationsCusiana – Apiay 32 mmcfdApiay – Ocoa 7 mmcfd
Cost: ~USD $ 48 mm
ExpectedCompletion: 1H 2017
Eje Cafetero Branches

Investor Relations
For more information about TGI please contact to:
Antonio José Angarita VegaCFO
+57 (1) 3138400 - ext [email protected]
Sergio Andrés Hernández AcostaFinance Manager
+57 (1) 3138400 - ext. [email protected]
Fabián Sánchez AldanaIR Advisor - EEB
+57 (1) 3268000 - ext. [email protected]
http://www.tgi.com.co

Appendix 1 – EEB Overview
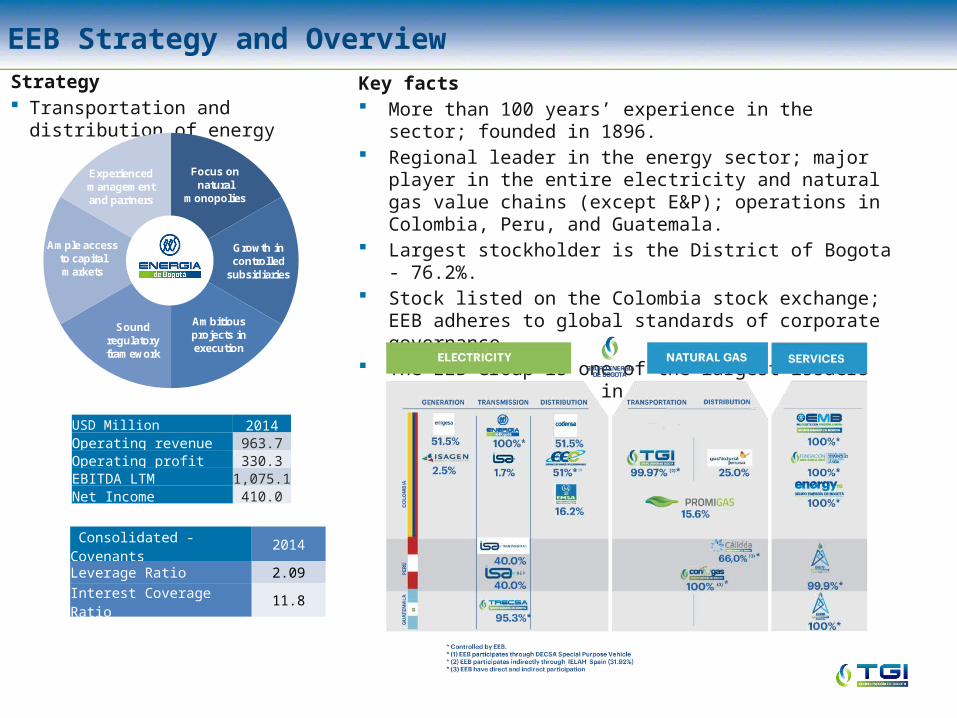
EEB Strategy and OverviewStrategy Transportation and distribution
of energy
Key facts More than 100 years’ experience in the sector; founded in
1896. Regional leader in the energy sector; major player in the
entire electricity and natural gas value chains (except E&P); operations in Colombia, Peru, and Guatemala.
Largest stockholder is the District of Bogota - 76.2%. Stock listed on the Colombia stock exchange; EEB adheres
to global standards of corporate governance. The EEB Group is one of the largest issuers of equity and
debt in Colombia
USD Million 2014Operating revenue 963.7Operating profit 330.3EBITDA LTM 1,075.1Net Income 410.0
Consolidated - Covenants 2014Leverage Ratio 2.09Interest Coverage Ratio 11.8
Focus on natural
monopolies
Ample access to capital markets
Ambitious projects in execution
Growth in controlled
subsidiaries
Sound regulatory framework
Experienced management and partners

Cálidda´s Q1 2015 Results

I. Introduction and Perspectives
II. Significant Developments
III. Commercial Performance
IV. Operational Performance
V. Financial Performance and Key Metrics
VI. Conclusions
Annexes:
(i) Strong Sponsorship with Optimal Experience
(ii) Experienced and Proven Management Team & Board
23
Table of Contents

I. Introduction and Perspectives
II. Significant Developments
III. Commercial Performance
IV. Operational Performance
V. Financial Performance and Key Metrics
VI. Conclusions
Annexes:
(i) Strong Sponsorship with Optimal Experience
(ii) Experienced and Proven Management Team & Board
Table of Contents
24

Introduction and Perspectives
25

I. Introduction and Perspectives
II. Significant Developments
III. Commercial Performance
IV. Operational Performance
V. Financial Performance and Key Metrics
VI. Conclusions
Annexes:
(i) Strong Sponsorship with Optimal Experience
(ii) Experienced and Proven Management Team & Board
Table of Contents
26

Cálidda has a client base of 278,028 customers. In the first quarter, 23,023 new clients have been connected . Now in the residential segment, we have presence in 17 districts of our concession area.
During the first quarter, 279 km of network were built, being mostly polyethylene (270 km), whereby the distribution system reached a total of 4,957 km of underground pipelines.
Even though Total Revenues from the first quarter decreased 9% (because of less investments – IFRIC 12), the Total Adjusted Revenues increased 23%.
In this quarter the EBITDA and adjusted EBITDA margin grew, mostly driven by an increase in the distribution tariff.
Significant Developments
2) Total Adjusted Revenues exclude Pass- through and IFRIC 12 revenues.3) EBITDA Last twelve months.4) Adjusted EBITDA Margin excludes Pass-through and IFRIC 12 revenues.5) Interest Coverage: EBITDA / Financial cost.
27
Significant Developments
1) Clients who are in front of Cálidda's distribution network.
Operational Results ( YTD ) Q1 2015 Q1 2014 Var %
Accumulated Clients: 278,028 185,941 50%
Invoiced Volume (MMCFD): 695.2 663.4 5%
Network Lenght (km): 4,957 3,779 31%
Potencial Clients 1 497,111 369,629 34%
Financial Results ( YTD ) Q1 2015 Q1 2014 Var %
Total Revenues (USD MM): 129.3 142.3 -9%
Total Adj. Revenues (USD MM) 2 : 52.1 42.3 23%
EBITDA (USD MM) 3 : 96.8 72.1 34%
Adjusted EBITDA Margin 4 : 49.5% 48.8%
Interest Coverage (x) 5 6.6x 5.5x 21%
I. Introduction and Perspectives
II. Significant Developments
III. Commercial Performance
IV. Operational Performance
V. Financial Performance and Key Metrics
VI. Conclusions
Annexes:
(i) Strong Sponsorship with Optimal Experience
(ii) Experienced and Proven Management Team & Board
Table of Contents
28

Commercial Performance
29
Residential & Commercial Residential & Commercial
Cálidda has residential presence in 17 districts and industrial network in more than 34 districts within Lima & Callao (Metropolitan area).
Cálidda connected residential customers in the Province of Callao and in March began commercial activities in the district of Ate.
During Q1 2015, Cálidda added 22,706 clients in the Residential segment and 309 clients in the Commercial segment.
Residential
Industrial
Natural gas pipeline
Main grid expansion
Callao
2009 2010 2011 2012 2013 2014 Q1 20150
50,000
100,000
150,000
200,000
250,000
300,000
18,75634,619
63,602
103,090
163,129
254,280
277,295

Commercial Performance
30
Clients Segments Growth Highlights
No new power generators where connected in Q1 2015.
3 new industrial plants were connected during Q1 2015.
In January, independent customers like Alicorp, Refineria La Pampilla and Andina de Cementos Unión, increased their Firm Distribution service in 2.0 MMCFD.
5 new NGV stations joined Cálidda’s distribution system and almost 200,000 converted vehicles are attended in the City of Lima.
Power Generation
Industrial
GNV Stations
2009 2010 2011 2012 2013 2014 Q1 201502468
1012141618
8
1113 13
16 16 16
2009 2010 2011 2012 2013 2014 Q1 20150
150
300
450
600
321360
394429
466 489 492
2009 2010 2011 2012 2013 2014 Q1 20150
100
200
300
400
0
50,000
100,000
150,000
200,000
250,000
103143 172 192 206 220 225
81,029103,712
126,586151,781
171,541197,154
200,173
NGV Stations Converted Vehicles

Commercial PerformanceVolume Sold (Invoiced)MMCFD
As of March 2015, Take-or- Pay contracts amounted 541 MMCFD, 79% of total invoiced volume. In Q1 2015 the volume sold increased 5% compared to Q1 2014, due to an increase of volume mostly explained
by the Power Generation segment.
YoY: + 5%
31
2009 2010 2011 2012 2013 2014 Q1 2014 Q1 2015
52.2%
63.9%
71.6%71.6%
72.5%
74.2% 74.4%75.0%
34.0%
25.0%
19.2%
18.1%
17.2%
16.0% 15.9%15.1%
13.4%
10.6%
8.8%
9.7%
9.6%
9.0%9.0%
9.0%
182
303
457
508
577
679663
695
Total MMPCD
Residential & Commercial
NGV Stations
Industrial
C
AGR (09 -1
4)= + 30%
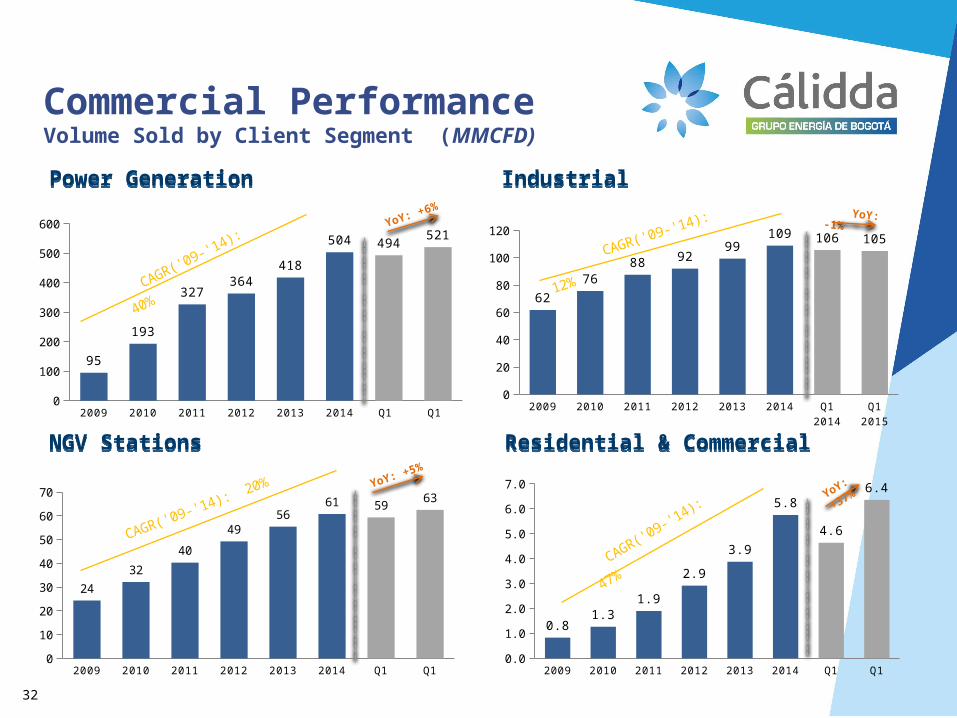
Commercial Performance Volume Sold by Client Segment (MMCFD)
NGV StationsNGV Stations Residential & CommercialResidential & Commercial
IndustrialIndustrialPower GenerationPower Generation
32
YoY: +6% YoY: -1%
YoY: +5%
YoY: +37%
2009 2010 2011 2012 2013 2014 Q1 2014 Q1 20150
100
200
300
400
500
600
95
193
327364
418
504 494521
CAGR('09-'14): 40%
2009 2010 2011 2012 2013 2014 Q1 2014 Q1 20150
20
40
60
80
100
120
62
7688 92
99109 106 105
CAGR('09-'14): 1
2%
2009 2010 2011 2012 2013 2014 Q1 2014 Q1 20150
10
20
30
40
50
60
70
24
32
40
4956
61 5963
CAGR('09-'14): 20%
2009 2010 2011 2012 2013 2014 Q1 2014 Q1 20150.0
1.0
2.0
3.0
4.0
5.0
6.0
7.0
0.81.3
1.9
2.9
3.9
5.8
4.6
6.4
CAGR('0
9-'14):
47%

I. Introduction and Perspective
II. Significant Developments
III. Commercial Performance
IV. Operational Performance
V. Financial Performance and Key Metrics
VI. Conclusions
Annexes:
(i) Strong Sponsorship with Optimal Experience
(ii) Experienced and Proven Management Team & Board
Table of Contents
33

Operational Performance
Distribution System Infrastructure Distribution System Infrastructure
Network EfficiencyNetwork Efficiency
In Q1 2015, Cálidda’s has built 279 km, out of which 9 km were steel high pressure network while the remaining 270 km were polyethylene pipelines.
The total network now reaches 4,957 km of underground pipelines.
The network penetration rate has increased to 56% due to Cálidda’s commercial strategy to focus in low income districts where the savings produced by the use of natural gas against other alternative fuels are more appreciated.
34
Clie
nts
(‘000
)
2009 2010 2011 2012 2013 2014 Q1 20150
1,000
2,000
3,000
4,000
5,000
6,000
273 303 359 387 408 428 437701
1,0201,465
2,163
2,996
4,2494,520
9741,324
1,824
2,550
3,404
4,6784,957
Steel Network Polyethylene Network Total
km
2009 2010 2011 2012 2013 2014 Q1 20150
100
200
300
400
500
600
-10%
0%
10%
20%
30%
40%
50%
60%
19 35 64
104
164
255 278
94 126
174
244
331
466 497
20%
28%
37%42%
50%55%
56%
Total Clients Potential Clients*
(*) Clients who are in front of Cálidda's distribution network.

Operational Performance (Cont’d)
35
Calidda´s pipeline current capacity is 420MMCFD (from City Gate Lurín to Lima). Independent and regulated customers located down flow Lurín use nearly 295MMCFD, equivalent to 70% of our capacity.
Cálidda has enough Gas Supply (Pluspetrol) and Gas Transportation service (TGP) to attend its regulated customers.
Calidda Capacity 420 MMCFD
Gas178MMCFD
Transport204 MMCFD
Edegel Ventanilla
Enersur
Edegel Santa Rosa
Kallpa
Kallpa – Las Flores
Cálidda's City Gate
Thermal Plants (Clients)
Conventions
Cálidda Capacity = 420MMCFD
Regulated Clients + Independent Clients
(149MMCFD) (146MMCFD)
Termochilca
Fénix
Independent Clients
(Power Generators)
= 400MMCFD
Mar-15
* Based on 2014 Figures
Mar-15
Jan-14 Apr-14 Jul-14 Oct-14 Jan-150
150
300
450
Regulated Clients Independent Clients
Jan-14 Apr-14 Jul-14 Oct-14 Jan-1580
120
160
200
240
Regulated Clients

I. Introduction and Perspective
II. Significant Developments
III. Commercial Performance
IV. Operational Performance
V. Financial Performance and Key Metrics
VI. Conclusions
Annexes:
(i) Strong Sponsorship with Optimal Experience
(ii) Experienced and Proven Management Team & Board
Table of Contents
36

Financial PerformanceTotal Adjusted Revenues by Segment
2
1) Total Adjusted Revenues exclude Pass-through and IFRIC 12 revenues.2) Installation Services Revenues include revenues from connection fees and financing.3) Others: mainly derived from network relocation and other non recurrent services.
3
37
As of March 2015, 62% of Adjusted Revenues are volume related and 38% comes from installation services revenues and other revenues.
In this quarter, other revenues have increased substantially compared to previous periods because of extraordinary revenues that came from relocation services.
Residential & Commercial Industrial NGV Stations Power Generation Installation Services Others
Q1 2015 Total Adjusted Revenues1 Q1 2015 Total Volume (MMCFD)
1%
15%
9%
75%

Financial PerformanceMillion US$
Funds from Operations (FFO)1Funds from Operations (FFO)1
EBITDA & Adj. EBITDA Margin (%)EBITDA & Adj. EBITDA Margin (%)Total RevenuesTotal Revenues
38
Debt & Net Debt / EBITDADebt & Net Debt / EBITDA
2) Net Debt = Debt - Cash Balance. 1) FFO = Net Profit + Depreciation + Amortization
2
2009 2010 2011 2012 2013 2014 Q1 2014 Q1 2015
43 64 103 125 146 186
42 52
116125
201245
315326
100 77
160188
304
370
461512
142 129
Total Adjusted Revenues Pass-through & IFRIC 12 Series3
YoY: -9%
CAGR( 09 - 14): 2
6%
2009 2010 2011 2012 2013 2014 LTM Q1 2015
1929
5964
72
9197
44.5% 46.1%
57.6% 51.6% 49.3%
49.1% 49.5%
EBITDA Adjusted EBITDA Margin
2009 2010 2011 2012 2013 2014 LTM Q1 2015
12 18
40 43
36
57 57
2009 2010 2011 2012 2013 2014 LTM Q1 2015
3.9x 3.9x
2.8x 3.0x
4.4x
3.5x 3.3x
3.1x 3.1x
2.3x 2.3x
3.0x 2.6x 2.5x
Debt / EBITDA Net Debt / EBITDA

Financial MetricsMillion US$
Interest Coverage3Interest Coverage3 FFO / Net DebtFFO / Net Debt
Debt / Capitalization2 (%)Debt / Capitalization2 (%)Total Debt1Total Debt1
3) In 2013 ratio does not include 2013’s debt prepayment penalties (USD 7.8 MM)
1) Total Debt: net of debt associated costs.
39
2009 2010 2011 2012 2013 2014 LTM Q1 2015
2867
119 149
318 318 318
4747
4747
75 114
166 196
318 318 318
Senior Debt Shareholders' Subordinated Debt
2009 2010 2011 2012 2013 2014 LTM Q1 2015
41.4%
49.8%54.1%
49.2%
56.6%53.2% 52.6%
2009 2010 2011 2012 2013 2014 LTM Q1 2015
3.5x 3.8x
5.8x 5.5x 5.6x 6.3x
6.6x
2009 2010 2011 2012 2013 2014 LTM Q1 2015
20.9% 20.2%
28.9% 28.3%
16.8%
23.9% 23.7%
2) Capitalization: Equity + Debt

CapExCapExNet IncomeNet Income
EquityEquityTotal AssetsTotal Assets
Equity Injection:
$35MM
Equity Injection:
$25MM
40
Financial Metrics (Cont’d)Million US$
2009 2010 2011 2012 2013 2014 LTM Q1 2015
$106 $115 $141
$202
$244
$280 $287
2009 2010 2011 2012 2013 2014 LTM Q1 2015
$7 $10
$26 $27
$17
$35 $34
2009 2010 2011 2012 2013 2014 Q1 2015
48 5032
63
92 83
16
353
33
5
51 50
8596 98
83
Secondary Network Main Network
2009 2010 2011 2012 2013 2014 LTM Q1 2015
$218 $289
$383
$492
$648 $696 $704

I. Introduction and Perspective
II. Significant Developments
III. Commercial Performance
IV. Operational Performance
V. Financial Performance and Key Metrics
VI. Conclusions
Annexes:
(i) Strong Sponsorship with Optimal Experience
(ii) Experienced and Proven Management Team & Board
Table of Contents
41

Conclusions
42

I. Introduction and Perspective
II. Significant Developments
III. Commercial Performance
IV. Operational Performance
V. Financial Performance and Key Metrics
VI. Conclusions
Annexes:
(i) Strong Sponsorship with Optimal Experience
(ii) Experienced and Proven Management Team & Board
Table of Contents
43

For more information about Cálidda, please contact our Investor Relations team:
http://calidda.com.pe/inversionistas/
http://www.grupoenergiadebogota.com.co
Adolfo HeerenCEO
Rafael Andrés Salamanca RodriguezInvestor Relations Advisor GEB
+57 1 326 8000 – ext. [email protected]
Isaac FingerCFO
+51 1 625 7310 [email protected]
Investor Relations
44
Gabriela Vasquez - MejíaFinance Management
+51 1 625 7390 [email protected]
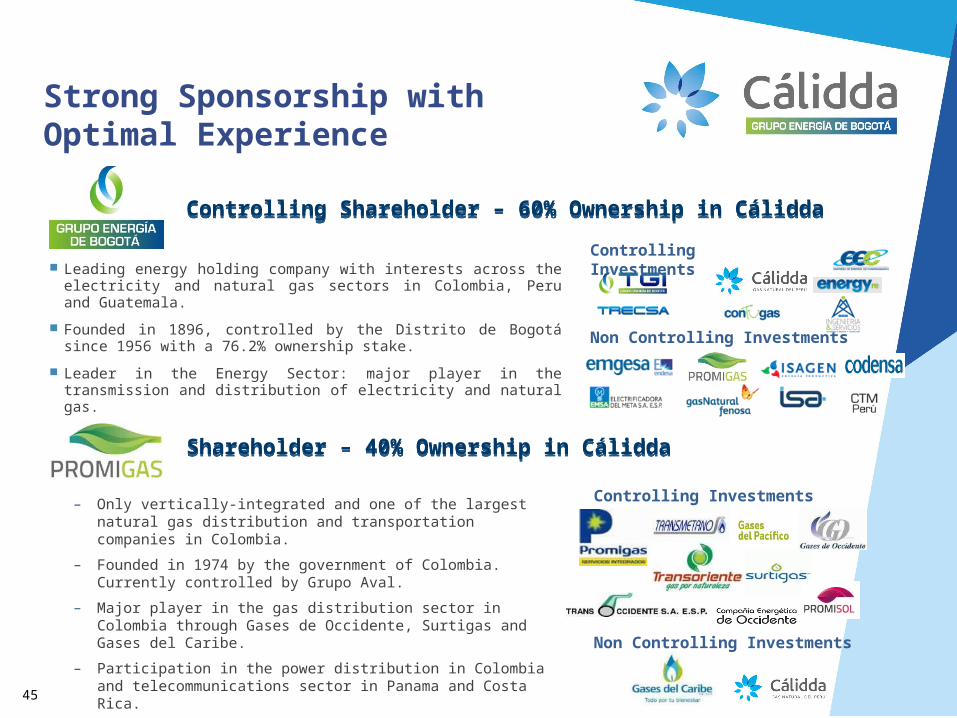
Strong Sponsorship withOptimal Experience
Leading energy holding company with interests across the electricity and natural gas sectors in Colombia, Peru and Guatemala.
Founded in 1896, controlled by the Distrito de Bogotá since 1956 with a 76.2% ownership stake.
Leader in the Energy Sector: major player in the transmission and distribution of electricity and natural gas.
– Only vertically-integrated and one of the largest natural gas distribution and transportation companies in Colombia.
– Founded in 1974 by the government of Colombia. Currently controlled by Grupo Aval.
– Major player in the gas distribution sector in Colombia through Gases de Occidente, Surtigas and Gases del Caribe.
– Participation in the power distribution in Colombia and telecommunications sector in Panama and Costa Rica.
– EEB has 15.6% stake in Promigas.
Controlling Investments
Non Controlling Investments
Non Controlling Investments
Controlling Shareholder – 60% Ownership in CáliddaControlling Shareholder – 60% Ownership in Cálidda
Shareholder – 40% Ownership in CáliddaShareholder – 40% Ownership in Cálidda
Controlling Investments
45

Experienced and ProvenManagement Team & Board
Board of Directors
Management Team
46
Chief Operating
Officer
JorgeMonterroza
Years in industry:18 years
Years at Cálidda:4 years
Chief Executive OfficerAdolfo Heeren
Years in Industry: 17 yearsYears at Cálidda: 3 years
Chief Commercial
Officer
CarlosCerón
Years in industry:17 years
Years at Cálidda:3 years
ChiefProcurement
Officer
PatriciaPazos
Years in industry:18 years
Years at Cálidda:10 years
Chief FinancialOfficer
IsaacFinger
Months in industry:8 months
Months at Cálidda:8 months
Chief Human Resources
Officer
RosarioJiménez
Years in industry:6 years
Years at Cálidda:6 years
Chief External Affairs Officer
TaniaSilva
Years in industry:3 years
Years at Cálidda:2 years
Chief Legal and
Regulatory Officer
AmadeoArrarte
Years in industry:13 years
Years at Cálidda:11 years
Chief Strategy Officer
TatianaRivas
Years in industry:7 years
Years at Cálidda:7 years
Chief Internal Auditor
CarolinaHernández
Years in industry:9 years
Years at Cálidda:7 years
PresidentRicardo Roa
Barragán
Participation in the Boards of Codensa,
Emgesa, Gas Natural, REP Perú, Cálidda,
Contugas, Trecsa and President of
Transportadora de Gas Internacional TGI.
Luis BetancurEscobar
Served as Director of Fondo Financiero
Desarrollo Urbano.
President of Colombia's
restructuring of the Energy and Gas
Regulatory Commission
Jose Elias Melo Acosta
President of Corporación Financiera
Colombiana S.A
Minister of Colombia's Treasury and Public Credit and Labor and
Social Security
departments.
Antonio CeliaMartínez-Aparicio
President ofPromigas
Served on the board of directors of various companies in the
natural gas sector.
Mauricio MontoyaBozzi
Over thirteen years of professional
experience in Project Management, New
Business Structuring and Strategic
Planning.
David Alfredo Riaño Alarcón
President of Transportadora de Gas Internacional
TGI.
19 years of experience in the energy sector
and utilities.
Luis ErnestoMejía Castro
Director ofPromigas.
Minister of Mines and Energy and
Vice Minister of Hydrocarbons
and Mines.
Disclaimer
The information provided here is for informational and illustrative purposes only and is not, and does not seek to be, a source of legal or financial advice on any subject. This information does not constitute an offer of any sort and is subject to change without notice.
Cálidda and its Shareholders expressly disclaim any responsibility for actions taken or not taken based on this information. Neither Cálidda nor its Shareholders accept any responsibility for losses that might result from the execution of the proposals or recommendations herein presented. Neither Cálidda nor its Shareholders are responsible for any content that may originate with third parties. Cálidda or its Shareholders may have provided, or might provide in the future, information that is inconsistent with the information herein presented.
47