texture and chemistry of iranian white cheese as … rahimi j, khosrowshahi a, moradi mm, mohamadi...
TRANSCRIPT

Volume 4 • Issue 4 • 1000219J Food Process TechnolISSN:2157-7110 JFPT, an open access journal
Open AccessResearch Article
FoodProcessing & Technology
Rahimi et al., J Food Process Technol 2013, 4:4http://dx.doi.org/10.4172/2157-7110.1000219
Keywords: Iranian white cheese; Texture; Brine concentration; pH of brine
IntroductionTexture, particularly in cheese, is one of the most important
attributes that helps to determine the identity of a product. Fracture properties of solid and semi-solid foods are important because of their relation to sensory texture [1]. Such information is also helpful when developing food products with desired textural characteristics. The rheology of cheese is a function of its composition, microstructure (i.e., the structural arrangement of the components), the physicochemical state of its components such as the ratio of solid fat to liquid fat, and its macrostructure, which reflects the presence of heterogeneities such as curd granule junctions, cracks, and fissures.
Rheological studies are widely used in food products to understand their texture and microstructure. Small strain dynamic rheological methods are nondestructive. They conduct within the linear viscoelastic region, and determine the elastic and viscous nature of cheese. Large strain rheological methods determine rheological properties that occur outside of the linear viscoelastic region and characterize the nonlinear and fracture properties of the material.
In recent years, much attention has been given to the microstructure of cheese. In particular, the use of scanning electron microscopy has become the method of choice in many investigations. It has proved to be an efficacious method to identify cheese components when fat, protein, and moisture are the major constituents. In complex food structures, such as dairy products, the sizes and distributions of dispersed and continuous phase regions, and also the fine structure within each phase and at interfaces, determine the mechanical (textural and rheological) properties of these systems [2].
Salt is known to affect the functional properties of cheese. Depending on pH, NaCl has been reported to have different effects
*Corresponding author: Jamshid Rahimi, Department of Bioresource Engineering, McGill University, 21111 Lakeshore Road, Sainte-Anne-de-Bellevue, Quebec, Canada, E-mail: [email protected]
Received October 10, 2012; Accepted January 04, 2013; Published January 15, 2013
Citation: Rahimi J, Khosrowshahi A, Moradi MM, Mohamadi H, Abbasi H, et al. (2013) Texture and Chemistry of Iranian White Cheese as Influenced by Brine Treatments. J Food Process Technol 4: 219. doi:10.4172/2157-7110.1000219
Copyright: © 2013 Rahimi J, et al. This is an open-access article distributed under the terms of the Creative Commons Attribution License, which permits unrestricted use, distribution, and reproduction in any medium, provided the original author and source are credited.
AbstractThe effect of different brine concentrations, pH of brine, and type of the used acid in brine on chemistry, element
content, aw (water activity), texture and microstructure of Iranian white cheese was studied. A batch of Iranian white cheese was produced, divided into 8 blocks, and immersed in 8 brine treatments i.e., L1(Cheese ripened at 16% brine concentration with pH equal to 5 and lactic acid for pH adjusting), L2 (Cheese ripened at 10% brine concentration with pH equal to 5 and lactic acid for pH adjusting), L3 (Cheese ripened at 10% brine concentration with pH equal to 4.3 and lactic acid for pH adjusting), L4 (Cheese ripened at 10% brine concentration with pH equal to 3.6 and lactic acid for pH adjusting), C1 (Cheese ripened at 16% brine concentration with pH equal to 5 and citric acid for pH adjusting, C2 (Cheese ripened at 10% brine concentration with pH equal to 5 and citric acid for pH adjusting), C3 (Cheese ripened at 10% brine concentration with pH equal to 4.3 and citric acid for pH adjusting), and C4 (Cheese ripened at 10% brine concentration with pH equal to 3.6 and citric acid for pH adjusting). Cheese samples were analyzed with respect to chemical characteristics, rheological parameters and microstructure. Increasing the brine concentration increased the instrumental hardness parameters (i.e., fracture stress, elastic modulus, and storage modulus). pH and type of the used acid in brine had no significant effect on these parameters.
Texture and Chemistry of Iranian White Cheese as Influenced by Brine TreatmentsJamshid Rahimi1*, Asghar Khosrowshahi2, Mehdi Mohammad Moradi3, Hamid Mohamadi4, Habib Abbasi5 and Ashkan Madadlou6
1Department of Bioresource Engineering, McGill University, 21111 Lakeshore Road, Sainte-Anne-de-Bellevue, Quebec, H9X 3V9, Canada2Department of Food Science and Engineering, Faculty of Agriculture, Urmia University, Urmia, Iran3Food Supervision Offices, Mazandaran University of Medical Science, Sari, Iran 4Administration of Standard and Industrial Research of Kurdistan, Sanandaj, Iran5Department of Chemical Engineering Jundi-Shapur University of Technology, Dezful, Iran6Department of Food Technology, Institute of Chemical Technologies, Iranian Research Organization for Science & Technology (IROST), Tehran, Iran
on the rheological properties of casein gels and cheese [3]. It alters the water binding capacity of casein within the cheese matrix, so it influences the physical properties of cheese. Paulson et al. [4] found that unsalted Mozzarella cheese has large serum pockets distributed throughout the protein matrix, while salted cheeses have much smaller pockets that are fewer in number. Salting of cheese increases the level of protein hydration and results in a swelling of the protein matrix. The textural properties of Iranian white cheese are influenced by many factors including milk pretreatment, make procedure, composition, proteolysis, rennet concentration, starter culture concentration, temperatures of coagulation, etc [5]. Rahimi et al. [6] studied on textural properties of low fat Iranian white cheese and found there is a close relation between chemical and physical properties of cheese. The close relationship between cheese microstructure and cheese rheology is also often highlighted, both being determined by the chemical composition of cheese [7]. In the manufacture of Iranian white cheese, the fermented curd is submerged in the brine. The producers use lactic, citric or acetic acid to adjust the pH of brine. The objective of this research was to study the effect of brine concentration, pH of brine and type of the used acid in brine on chemical composition, texture and microstructure of Iranian white cheese.

Citation: Rahimi J, Khosrowshahi A, Moradi MM, Mohamadi H, Abbasi H, et al. (2013) Texture and Chemistry of Iranian White Cheese as Influenced by Brine Treatments. J Food Process Technol 4: 219. doi:10.4172/2157-7110.1000219
Page 2 of 9
Volume 4 • Issue 4 • 1000219J Food Process TechnolISSN:2157-7110 JFPT, an open access journal
Materials and MethodsTreatments, cultures, and rennet
Eight treatments of cheese were made: 1) Cheese ripened at 16% brine concentration with pH equal to 5 and lactic acid for pH adjusting (L1), 2) Cheese ripened at 16% brine concentration with pH equal to 5 and citric acid for pH adjusting (C1), 3) Cheese ripened at 10% brine concentration with pH equal to 5 and lactic acid for pH adjusting (L2), 4) Cheese ripened at 10% brine concentration with pH equal to 5 and citric acid for pH adjusting (C2), 5) Cheese ripened at 10% brine concentration with pH equal to 4.3 and lactic acid for pH adjusting (L3), 6) Cheese ripened at 10% brine concentration with pH equal to 4.3 and citric acid for pH adjusting (C3), 7) Cheese ripened at 10% brine concentration with pH equal to 3.6 and lactic acid for pH adjusting (L4), 8) Cheese ripened at 10% brine concentration with pH equal to 3.6 and citric acid for pH adjusting (C4). Cheeses were manufactured in triplicate in 1 d, with each replicate using 7 kg of milk for each treatment. One lyophilized direct-to-vat mesophilic mixed culture (FRC-60, Chr. Hansen Dairy Cultures, Hørsholm, Denmark) containing Lactococcus lactic ssp. cremoris, Lactococcus lactis ssp. lactis, Streptococcus thermophilus, and Lactobacillus delbrueckii ssp. bulgaricus was used as starter at a ratio of 0.04 g/L of milk. Chymosin derived by fermentation [standard rennet, Chy-Max, Chr. Hansen; 183 international milk clotting units/mL [8] was used as a coagulant at a concentration of 4.5 international milk clotting units/kg of milk. Rennet was diluted 30-fold with cold water and then added to each 7-kg batch of milk.
Cheese-making procedure
Fresh raw milk obtained from Animal Husbandry of Urmia University (Moisture % = 88.75 ± 0.30, Fat % = 3.19 ± 0.13, Protein % = 3.07 ± 0.03, pH = 6.64 ± 0.01). It was batch-pasteurized at 65°C for 5 min [9] in a stainless steel container placed in a water bath, cooled to 35°C and transported carefully to a cheese vat (FT20-MkII CHEESE VAT, Armfield Ltd., Ringwood, Hampshire, UK). The milk was supplemented with 0.15 g of CaCl2 kg-1 of milk and held at 35°C for approximately 55 min after inoculation of culture for starter maturation before the addition of rennet. The curd was cut crossways in cubes of 1- 4 cm when firm (approximately after 45 min). After being cut, the curd was allowed to settle for 3-5 min and then gently agitated at a gradually increasing rate for 10 min to avoid fusion of freshly cut curd cubes and facilitate whey expulsion. This was followed by whey draining and pressing the transferred curd into molds (14×13×25 cm) for 2.5 h (under the initial pressure of 0.3 kPa which gradually increased up to approximately 2.9 kPa at the first hour and held constant to the end of pressing) to complete draining. After pressing, the curd was divided into eight equal portions which were stored at 23-25°C for 24 h, placed in airtight plastic containers, and covered with eight treatments of brine (brine was pasteurized beforehand at 80°C for 10 min and filtered through a clean cloth after rapid cooling) in a random order. The treatments of brine were produced as described before. After sealing, the containers were stored first at 23-25°C for 24 h and then refrigerated at 5-6°C for the ripening period of 8 weeks.
Chemical analysis
Cheese samples were chemically analyzed after 8 weeks ripening. The total solid content of milk and cheese were measured by drying 8-11 gr milk at 100°C for 5 h in an oven dryer. Dornic method was used to determine titrable acidity, and the pH of milk and cheese samples was obtained using a digital pH-meter (microprocessor pH meter,
model pH 537 WTW, Germany). Salt and ash contents were measured by Volhard and dry ash method [10], respectively. The fat content of milk and cheese samples was determined by the Gerber method [11] and their total protein contents were determined by measuring total nitrogen using the Kjeldahl method [10] and converting it to protein content by multiplying by 6.38. All chemical measurements were done in triplicate.
Ratio of Tyr-Trp concentration to protein content
The proteolysis rate at the 8th week of ripening of cheese slurries was measured by determining the Tyr-Trp concentrations in TCA extracts following the method of Khosrowshahi et al. [5], divided by protein content (T:P). Cheese slurries were prepared by mixing 2 parts of the grated cheese sample with 1 part of a 5.2% sterile solution of sodium chloride at 45°C. Duplicate 1-g samples of slurries were each dispersed in 5.4 mL of distilled water and placed in a 40°C water bath for 5 min. Ten milliliters of a 12% (wt/vol) TCA solution was added to each suspension and allowed to stand for 10 min before being filtered through Whatman no. 2 filter paper. Five milliliters of each TCA extract was added to 10 mL of a solution containing 15% sodium carbonate and 2% sodium hexametaphosphate in Quickfit tubes kept in a 40°C water bath. This was followed by addition of 3 mL of 3x diluted Folin phenol reagent to the tubes. The contents were shaken thoroughly and then held in a 40°C water bath for 5 min before measuring the absorbance at 650 nm by a UV visible spectrophotometer (ultrospect mode, model 80- 2092-26, L KB Biochrom, Pharmacia, Cambridge, UK). 10 mL of 12% (wt/vol) TCA was added to 6 mL of distilled water; the mixture was held at 40°C for 5 min and then filtered through Whatman no. 2 filter paper. The procedure was followed by addition of 5 mL of TCA filtrate and then 3 mL of Folin reagent to 10 mL of sodium hexametaphosphate solution. This solution was used as a blank. A Tyr standard curve was prepared by using concentrations of 0, 5, and 10 μg/mL in TCA filtrate and upto 50 μg/mL.
Water activity
Water activity was measured using Aw SPRINT (Aw SPRINT, TH-50, Novasina, Swiss). Cheese samples were grated, sealed in an air-tight container and allowed to equilibrate to 25°C (approx. 3 h). Samples were measured at 25°C on the 8th week of ripening.
Sodium, Calcium, and Phosphorus measurements
Cheese samples were prepared for sodium, calcium, and phosphorus measurements at the 8th week of ripening following the method of Kira and Maihara [12]. Portions of 10.0 g sample were weighed into a porcelain crucible and put into an oven at 100°C to dry. The sample was preheated in a Bunsen burner until evolution of smoke was ceased. The crucible was transferred into a muffle furnace and the temperature was increased at a rate of about 50°C per 30 min up to 450°C. This temperature was kept constant for 4 h. If ashes still contained carbon (black particles), 1 mL of HNO3 was added, followed by evaporation on a hot plate and a new ashing cycle. This procedure was repeated until the ashes contained no more carbon. Ashes were dissolved with 10% HCl under careful heating on a hot plate and the solution was transferred quantitatively into a 25.0 mL volumetric flask. Concentrations of sodium, calcium, and phosphorus were determined by inductively-coupled, plasma-atomic emission (ICP) spectrometry (SDS-720, GBS Integra XL, Australia).
Color analysis
The color of cheese samples at the 8th week of ripening was

Citation: Rahimi J, Khosrowshahi A, Moradi MM, Mohamadi H, Abbasi H, et al. (2013) Texture and Chemistry of Iranian White Cheese as Influenced by Brine Treatments. J Food Process Technol 4: 219. doi:10.4172/2157-7110.1000219
Page 3 of 9
Volume 4 • Issue 4 • 1000219J Food Process TechnolISSN:2157-7110 JFPT, an open access journal
quantitatively determined with a Hunter Lab system (model DP 9000, Hunter Associates Laboratory Inc., Reston, VA) in which the L-value corresponds to whiteness [9]. Color measurements were performed in triplicate for each treatment at different sites.
Rheological analysis
Uniaxial compression: The simplest fundamental test, uniaxial compression [13] was performed at the 8th week of ripening with an HTE universal testing machine (S-Series Bench UTM model H5K-S, Hounsfield Test Equipment Ltd., Redhill, UK) with a 500-N load cell. A flat plunger with a 49-mm diameter was attached to the moving crosshead. Cheese blocks were cut into cylinders (24 mm diameter×16 mm high) and immediately placed in airtight containers to prevent dehydration. Samples were equilibrated to room temperature (20 ± 1°C) for at least 4 h prior to testing. Samples were compressed uniaxially at a crosshead speed of 50 mm/min with 57% deformation (8.5 mm) from the initial head of the sample in one bite. The fracture stress (σf) was measured as the force divided by the initial cross-sectional area of the sample [6]. The modulus of elasticity was calculated as the secant modulus by using engineering strain at the fracture point. The Hencky strain (εh) was calculated as ln h0/(h0–∆hf), where h0 is the original height and ∆hf is the change in the height [14] at the point of fracture. Each cheese was analyzed in triplicate.
Dynamic rheological measurements: Small-amplitude oscillatory shear measurements were performed with a UDS 200 rheometer (Universal Dynamic Spectrometer, Paar Physica Inc., Ashland, VA). The measuring geometry consisted of 2 parallel plates with a diameter of 25 mm and 1 mm gap size (sample thickness). Samples of the cheese blocks were cut at least 1 cm deep at 6°C. These samples were immediately placed in small airtight plastic containers and equilibrated at room temperature (20 ± 1°C) for at least 4 h. Excess cheese was trimmed carefully with a razor blade, and the sample was allowed to rest for 20 min on the rheometer to allow the stress induced during sample handling to relax. Frequency was set at 10 Hz, because the strain values varied from 0.01 to 2.5%, resulting in a strain sweep. The parameters calculated were the storage modulus (G’) and the storage compliance (G*), which are measures of elastic nature [15]. Values are the average of 2 measurements for 3 replicates of each cheese. All rheological measurements were performed at the 8th week of ripening.
Microstructure
Cheese samples were prepared for scanning electron microscopy at the 8th week of ripening following the method of Rahimi et al. [6]. Cheese blocks were cut into approximately 5 to 6 mm3 cubes with a sharp razor and immersed in 2.5% glutaraldehyde fixative (Merck) for 3 h. Cubes were then washed 6 times in distilled water (1 min each time), dehydrated in a graded (40, 55, 70, 85, 90, and 96%) series of ethanol for 30 min each, and defatted in 3 changes in chloroform (10 min each time). The defatted samples were kept refrigerated and covered with ethanol until they were freeze-fractured in liquid nitrogen to approximately 1-mm pieces. These pieces were mounted on aluminum stubs by silver paint, dried to critical point, and coated with gold for 10 min in a sputter-coater (type SCD 005, Baltec Inc., Balzers, Switzerland). Samples were viewed in a scanning electron microscope (XL Series, model XL30, Philips, Eindhoven, the Netherlands) operated at 15.0 kV. Photomicrographs were recorded at 1,000×magnification.
Image analysis
Digital images of electron micrographs were uploaded into Adobe Photoshop 4.0, and brightness and contrast were adjusted so that
the images looked alike. Images with pixels in the gray scale 0 to 255 (from black to white) were then analyzed as described by Pastorino et al. [16]. Images were converted from their gray-scale values to binary images in which gray pixels were converted to either white or black pixels by applying the threshold function of the software. In the original digital images, dark pixels corresponded to areas of the micrograph occupied by pockets that originally contained fat and/or serum, whereas light pixels corresponded to areas occupied by protein matrix. When thresholding, pixels having a gray value lower than the threshold level were converted to black pixels, whereas those having a gray value higher than the threshold level were converted to white pixels. A threshold level of 120 was found to provide a differentiation between dark and light areas as determined by visually matching the original and binary images. The proportions of black and white pixels, and the areas occupied by them were then determined by applying the histogram function of the software. Thus, the areas of cheese matrix occupied by fat/serum pockets (dark areas) and protein matrix (light areas) were determined.
Statistical analysis
The experiments were carried out in triplicate and the results were submitted to the ANOVA using the GLM procedure of the SPSS (version 9.0, SPSS Inc., Chicago, IL). The means comparison was performed with the Duncan test at P < 0.05.
Results and Discussion Cheese composition
The chemical characteristics of cheese samples are reported in (Table 1). In agreement with the literature [17], as the concentration of salt in brine increased, total ash, salt, fat, and protein contents of cheese (p<0.05) increased significantly, while the moisture content decreased. The treatment; therefore, led to a significant decrease in the ratio of moisture to protein (M:P). When cheese is placed in brine, a dynamic mutual diffusion process is established as NaCl molecules move from the brine into the cheese while, water diffuses out through the cheese matrix [9]. It decreases the moisture content of cheese and increases the salt content as it is ripened [5]. Although the diffusion coefficient for NaCl in cheese is essentially independent of brine concentration [18], it is generally accepted that an increase in brine concentration results in higher rate of salt absorption in cheese due to the increased gradient of salt concentration between cheese and surrounding brine. The amount of salt in cheese body and salt-in-moisture level (Table 1) was therefore, increased as the concentration of salt in brine increased. As compared the treatments with similar brine concentration i.e. L2, L3, L4, C2, C3, and C4 together (Table 1) it is obvious that pH of brine and type of the used acid in brine had no significant effect on chemical composition of cheeses (p<0.05). The amount of acid for reduction in pH of brine was very little, so change in brine dilution vas very low; therefore, the moisture content of cheeses with similar brine concentration had no significant difference. As shown in table 1, there is a direct relation between moisture content of cheese and brine concentration. As mentioned in table 1, reduction in pH of brine reduced the pH of cheese. The conditions of curd formation have important effects on cheese properties, but these conditions in our study were similar and we just changed the condition of brining. The moisture in non fat substance (MNFS) decreased as brine concentration decreased. This was in agreement with results of Feeney et al. [19]. However, pH of brine and the used acid type in brine had no significant effect on MNFS (p<0.05). When L1 compared with L2 and C1 with C2, which are similar in pH and the used acid type in brine, it was

Citation: Rahimi J, Khosrowshahi A, Moradi MM, Mohamadi H, Abbasi H, et al. (2013) Texture and Chemistry of Iranian White Cheese as Influenced by Brine Treatments. J Food Process Technol 4: 219. doi:10.4172/2157-7110.1000219
Page 4 of 9
Volume 4 • Issue 4 • 1000219J Food Process TechnolISSN:2157-7110 JFPT, an open access journal
obvious that brine concentration has significant effect on pH of cheese. It is in agreement with results of Fox et al. [18]. Cheese pH had a close relation to S/M (ratio of salt to moisture) of the treatments i.e., higher S/M led likely to the increased osmotic pressure of the aqueous phase of cheese, causing more dehydration of both desirable and undesirable bacterial cells and killing them, or at least inhibit their growth [18]. This led to the decreased rate of lactic acid production by starter cells and subsequently, a higher pH value. The concentration of free tyrosine-tryptophan (an index of proteolysis development) decreased as S/M of cheese increased. Reduction in pH of brine reduced the pH of cheese, but change in type of acid had no significant effect (p<0.05) on pH of cheeses.
As shown in table 1, T: P decreased in L1 and C1 compared with other cheese samples. The concentration of free tyrosine-tryptophan decreased as S/M of cheese increased. This was due to the lower soluble chymosin [20], as well as the enhanced activity and growth of microorganisms [9]. The enhanced inhibitory effect of salt on bacteria in the treatments ripened as stronger brines led to fewer breakdowns of casein molecules and larger peptides to smaller ones and free amino acids [21]. In addition, the lower M:P in these treatments, might somewhat reduced the activity of retained rennet at the curd, leading to fewer hydrolysis of casein molecules at the primary phase of ripening. pH and type of the used acid in brine had no significant effect on proteolysis in cheese samples. This finding is in agreement with the results of Madadlou et al. [9] for the effect of brine concentration on Iranian white cheese. There was no report about effect of pH and type of the used acid in brine on proteolysis of Iranian white cheese, already.
Water activity
The water activity of cheese samples is reported in table 1. As expected, reduction in brine concentration, increased aw of cheeses. They studied on influence of calcium and phosphorus, lactose, and salt to moisture on cheddar cheese quality. Salt reduces water activity of cheese, and thereby influences the growth of starter and nonstarter lactic acid bacteria, the activity of bacterial, indigenous milk enzymes, and residual chymosin. pH and the used acid type in brine had no significant effect (p<0.05) on aw of cheese treatments. These two parameters had no significant effect on moisture and salt content of cheese samples (Table 1) therefore, aw of these samples was similar.
Sodium, Calcium, and Phosphorus content
The sodium, calcium, and phosphorus content of cheese samples
are shown in table 2. As expected, reduction in brine concentration reduced the sodium content of cheese samples. This was in agreement with the reports of other researchers [22,23]. The principle source of Na in Iranian white cheese is NaCl, which is added directly to curd during manufacturing. Reduction in Na content of cheese samples is surely due to reduction in concentration of salt (NaCl). Multag and Wilbey [23] studied on the effect of chymosin reduction and salt substitution on the properties of white salted cheese and reported that the salt substitution induced sodium reduction in cheese samples, while chymosin reduction had no effect on sodium content. As shown in table 2, pH and type of the used acid in brine had no significant effect on sodium content of cheese samples. Calcium also plays a significant role in cheese functionality and texture by cross-linking protein [24]. Ca and P participate in the protein network that forms the structural matrix of cheese, and hence, directly affect cheese texture. Therefore, cheeses with a high concentration of total Ca tend to be firmer and less meltable than cheeses with a low Ca concentration. Moreover, cheeses with low Ca content tend to have a higher rate of proteolysis than cheeses with high Ca content [25]. As shown in table 2, the calcium content of cheese samples were not changed by the three studied factors. i.e., brine concentration, pH of brine, and type of the used acid in brine. Pastorino et al. [16] reported that increased salt content did not cause an exchange of calcium with sodium, and soluble calcium remained constant. Paulson et al. [4] also reported that salt content had no effect on total calcium content of cheese. In addition, soluble calcium was unaffected by adding salt to cheese and remained at approximately 50% of total calcium. We didn’t measure the soluble calcium in this research. Similar calcium, the three studied factors i.e., brine concentration, pH of brine, and type of the used acid in brine had no significant effect (p<0.05) on phosphorus content of cheese samples. Existence of Ca and P in cheese can be broadly divided into 2 forms: free (associated with the serum phase of cheese), and bound (associated with the milk protein) [25]. Phosphorus associated with milk proteins (i.e., bound P) can be further divided into 2 forms: organic P (phosphorus that is covalently linked to phosphoserine residues of milk proteins), and bound-inorganic P (phosphorus that is electrostatically linked with bound Ca, and is often referred to as colloidal calcium phosphate). A decrease in the pH of milk solubilizes colloidal calcium phosphate (bound Ca and bound-inorganic P), which subsequently is lost during whey drainage. However, it is impossible to solubilize organic P with a change in pH, because it is covalently linked to the protein (i.e., phosphoserine). Therefore, for any milk system
a-bMeans within the same row with different subscripts differ (p < .05)1S/M= ratio of salt to moisture; M/P= Ratio of moisture to protein; MNFS= moisture in non fat substances; FDM= fat in dry matter; T:P= ratio of Tyr-Trp concentration to protein content, as the proteolysis rate
Table 1: Means ± SD of chemical composition, proteolyses rate, and water activity of cheese samples.
Item1 L1 L2 L3 L4 C1 C2 C3 C4Moisture% 50.75 ± 0.8b 55.00 ± 1.59a 54.29 ± 1.64a 53.70 ± 2.96a 49.56 ± 0.97b 54.52 ± 0.55a 55.12 ± 2.67a 55.71 ± 0.37a
Fat% 28.5 ± 0.5a 25.75 ± 0.25b 25.25 ± 0.25b 25.00 ± 0.75b 29.00 ± 0.5a 25.00 ± 0.5b 25.5 ± 0.75b 25.75 ± 0.3b
Protein% 15.25 ± 0.05a 14.5 ± 0.1b 14.45 ± 0.15b 14.65 ± 0.15b 15.45 ± 0.25a 14.65 ± 0.15b 14.5 ± 0.15b 14.45 ± 0.2b
pH 5.29 ± 0.05a 5.2 ± 0.08b 5.12 ± 0.03c 4.06 ± 0.71d 6.08 ± 0.23a 4.53 ± 0.15b 4.34 ± 0.19c 5.12 ± 0.01d
Total ash% 6.33 ± 0.33a 4.73 ± 0.16b 4.19 ± 0.3b 4.13 ± 0.24b 6.68 ± 0.01a 4.59 ± 0.2b 4.54 ± 0.25b 4.24 ± 0.14b
Salt% 6.08 ± 0.44a 4.21 ± 0.47b 3.79 ± 0.13b 4.06 ± 0.71b 6.08 ± 0.23a 4.53 ± 0.15b 4.34 ± 0.19b 4.43 ± 0.25b
S/M 12.1 ± 0.3a 7.5 ± 0.6b 7.00 ± 0.2b 7.8 ± 1.1b 12.00 ± 0.4a 8.35 ± 0.25b 7.95 ± 0.65b 8.00 ± 0.5b
M/P 3.26 ± 0.01b 3.73 ± 0.01a 3.75 ± 0.15a 3.68 ± 0.17a 3.18 ± 0.02b 3.75 ± 0.03a 3.73 ± 0.14a 3.72 ± 0.09a
MNFS 69.69 ± 0.27b 74.43 ± 1.96a 74.74 ± 1.2a 74.96 ± 1.8a 69.68 ± 0.15b 75.7 ± 0.22a 74.92 ± 2.17a 75.5 ± 0.93a
FDM 57.63 ± 0.3a 56.13 ± 0.09a 55.33 ± 1.93a 56.34 ± 2.45a 56.42 ± 1.05a 54.99 ± 0.51a 57.61 ± 2.03a 58.56 ± 0.48a
T:P 0.245 ± 0.06b 0.327 ± 0.07a 0.325 ± 0.04a 0.320 ± 0.08a 0.250 ± 0.05b 0.332 ± 0.06a 0.330 ± 0.04a 0.322 ± 0.07a
Water activity, % 88.85 ± 0.2b 92.85 ± 0.35a 92.8 ± 0.09a 92.65 ± 0.25a 88.05 ± 0.25b 93.00 ± 0.3a 92.05 ± 0.14a 92.3 ± 0.09a

Citation: Rahimi J, Khosrowshahi A, Moradi MM, Mohamadi H, Abbasi H, et al. (2013) Texture and Chemistry of Iranian White Cheese as Influenced by Brine Treatments. J Food Process Technol 4: 219. doi:10.4172/2157-7110.1000219
Page 5 of 9
Volume 4 • Issue 4 • 1000219J Food Process TechnolISSN:2157-7110 JFPT, an open access journal
(concentrated or unconcentrated), Ca can be solubilized to a greater extent than P, and hence, a wider range in Ca content can be achieved compared with P content in whey. As shown in table 2, the P content is more than Ca content of cheese samples; and it may be due to higher solubility of Ca than P in whey. It is expected that Ca and P content affected by change in pH of milk before gel formation; but the pH of cheese samples changed in our study due to change in pH of brine. Therefore it had no effect on Ca and P content of cheese samples.
Cheese opacity
The L-values of treatments at 8th week of ripening are shown in table 3. The scattering of light by any system is related to its heterogeneity at the microstructural levels [6]. In a solid material such as cheese, light penetrates the superficial layers and is scattered by milk fat globules [26] and the edges of whey pockets [4]. The L-value describes the whiteness of the cheese samples. L1 and C1 had a lower whiteness in comparison with other treatments. There was no difference between treatments with similar pH and type of the used acid in brine. A lower brine concentration increased the moisture content and the M:P (Table 1), leading to an increased surface area occupied by scattering centers. Kaya [17] studied on effect of salt on whiteness of Gaziantep cheese and reported that color of cheese related to salt content. Rahimi et al. [6] also reported that whiteness decreased in Iranian white cheese as moisture content decreased. As brine concentration increased, whey in serum pockets diffused from the cheese body out into the brine [5]. Therefore, the surface area occupied by light-scattering centers was decreased. Because pH and type of the used acid in brine had no significant effect (p<0.05) on M/P, salt, and moisture content of cheese samples (Table 1), they had no effect on whiteness of Iranian white cheese.
Rheological properties
Uniaxial compression: The uniaxial compression parameters of the treatments are shown in table 4. The fracture stress, fracture strain, and modulus of elasticity are related to cheese softness [6]; therefore, a greater fracture stress, fracture strain, and modulus of elasticity indicate a cheese with a firmer and more elastic texture. Elasticity modulus, σf and εh increased with increasing brine concentration. εh increased significantly because the treatment tended to make the gel longer in texture. As the treatments with similar brine concentration i. e. L2, L3, L4, C2, C3, and C4 compared together, it is obvious that pH of brine and type of the used acid in brine had no significant effect on chemical cheese firmness (p<0.05). A similar result of the effect of brine concentration on hardness value has been reported for Gaziantep cheese ripened in salt solutions with different concentrations by Kaya [17]. In agreement to the results obtained at the present study, Khosrowshahi et al. [5] reported that the firmer Iranian white cheeses were also longer (had higher εh). Fat and moisture act as fillers in the CN matrix of cheese [6], giving it lubricity and softness, whereas the CN matrix provides cheese texture with an elastic character. The decrease in the volume of the force-bearing component (protein) of the cheese microstructure during ripening (Table 1) could account for most of the reduced firmness. The decrease in M:P in treatments
ripened at stronger brines (Table 1) could mainly account for the increased firmness. As shown in table 1, pH and type of the used acid in brine had no effect on moisture content and S/M of cheese. This may be an evidence for similarity of firmness in cheeses that differed in brine concentration, but was similar in pH and type of the used acid.
Dynamic rheological measurements: The dynamic rheological parameters of treatments are shown in figures 1 and 2. The strain-sweep test was used to determine whether brine concentration, pH of brine and type of the used acid influenced the textural characteristics of the cheese. Also it was used as a support for data found from uniaxial compression test. As shown in figure 1, the G’ of cheese treatments decreased as brine concentration decreased; but the pH and type of the used acid in brine had no significant effect on G’ of cheese treatments. The higher G’ for L1 and C1 indicated a higher elastic contribution as a consequence of the lower moisture contents (Table 1) in these cheeses. Storage compliance has an inverse relation to storage modulus [15], and the higher J’ shows the higher elastic contribution. As shown in figure 2, the J’ of cheese treatments increased as brine concentration increased, but the pH and type of the used acid had no significant effect on J’ of cheese treatments. Similar to fracture stress, the G’ and J’ is related to cheese softness [15]. The magnitude of fracture stress, G’ and J’ values, depends on the number and strength of bonds between CN particles and on the structure and spatial distribution of strands of CN in the gel network. Reduction in MNFS and M/P (Table 1) in treatments with higher brine concentration caused more solid characteristics in cheese samples. Rahimi et al. [6] studied on low fat Iranian white cheese, and like these findings, they reported that reduction in MNFS and M/P induced more firmness in cheese. These findings were also in agreement with Kaya [17]. The higher softness in treatments with lower brine concentration may be due to relatively low impact of casein [27] and high casein hydration [28]. As shown in table 1, higher brine concentration induced higher protein content. The higher protein content may also be another reason for more softness of cheeses treated in higher brine concentration. The ratio of residual rennet to CN is higher in high moisture cheeses than in low moisture cheeses; and therefore, the rate of softening in texture will be higher [29].
Microstructure
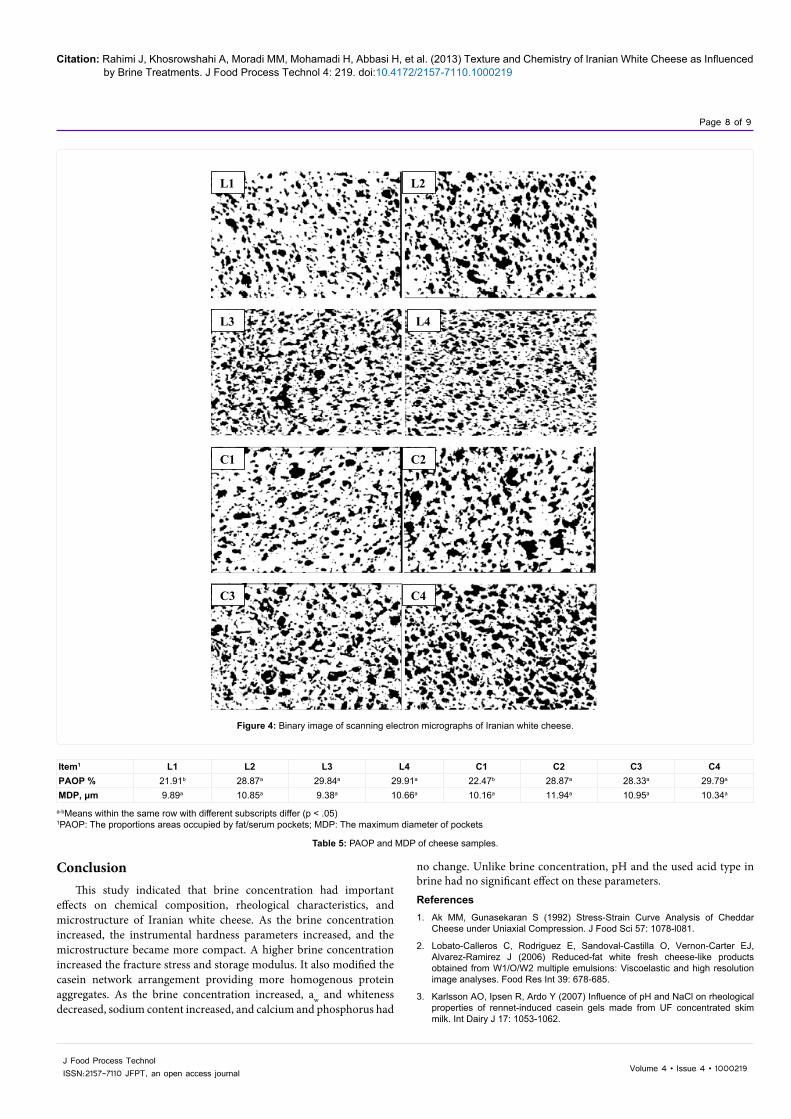
Differences between cheeses could be visually observed in images obtained by scanning electron microscopy (Figures 3 and 4). In the scanning electron micrographs of L2, L3, L4, C2, C3, and C4, the protein matrix was open, with spaces occupied by the fat globules. The holes in the protein matrix indicate the spaces occupied by fat globules before extraction by chloroform [6]. The microstructures of L1 and C1 were clearly different from that of other treatments, with the number of milk fat globules decreasing and the protein matrix becoming more compact. This probably explained the harder texture observed in L1 and C1. We concluded that the microstructure of treatments with lower brine concentration was opened by spaces occupied by the moisture. The lower the brine concentration, the higher was the moisture content (Table 1), so the matrix was more open. This probably explains the soft texture observed for treatments with lower brine concentration.
a-b Means within the same row with different subscripts differ (p < .05)
Table 2: Means ± SD of sodium, calcium, and phosphorus contents of cheese samples.
Item1 L1 L2 L3 L4 C1 C2 C3 C4Sodium, mg/g 13.89 ± 1.8a 9.8 ± 0.4b 10.27 ± 0.3b 10.27 ± 0.02b 13.75 ± 1.1a 10.84 ± 0.21b 10.64 ± 0.26b 10.63 ± 0.11b
Calcium, mg/g 1.84 ± 0.12a 1.80 ± 0.32a 1.72 ± 0.03a 1.74 ± 0.21a 1.84 ± 0.17a 2.01 ± 0.17a 1.89 ± 0.19a 1.98 ± 0.12a
Phosphorus, mg/g 5.34 ± 0.38a 4.7 ± 0.78a 4.75 ± 0.17a 4.56 ± 0.48a 4.52 ± 0.1a 5.69 ± 0.11a 5.5 ± 0.22a 4.88 ± 0.15a

Citation: Rahimi J, Khosrowshahi A, Moradi MM, Mohamadi H, Abbasi H, et al. (2013) Texture and Chemistry of Iranian White Cheese as Influenced by Brine Treatments. J Food Process Technol 4: 219. doi:10.4172/2157-7110.1000219
Page 6 of 9
Volume 4 • Issue 4 • 1000219J Food Process TechnolISSN:2157-7110 JFPT, an open access journal
a-b Means within the row with different subscripts differ (p < .05)
Table 3: Means ± SD of L-values of cheese samples.
L1 L2 L3 L4 C1 C2 C3 C4L- value 19.3 ± 0.17b 20.18 ± 0.24a 19.93 ± 0.04a 20.12 ± 0.27a 19.29 ± 0.17b 20.24 ± 0.23a 20.11 ± 0.31a 20.05 ± 0.18a
a-b Means within the same row with different subscripts differ (p < .05)
Table 4: Fracture stress, fracture strain, and elasticity modulus of cheese samples.
Item L1 L2 L3 L4 C1 C2 C3 C4Fracture stress, Kpa 33.6 ± 3.6a 18.7 ± 3.6b 20.85 ± 2.8b 19.3 ± 2.9b 35.6 ± 2.9a 18.97 ± 3.7b 20.74 ± 3.8b 18.16 ± 3.4b
Fracture strain, Kpa 0.39 ± 0.01a 0.28 ± 0.01b 0.27 ± 0.01b 0.26 ± 0.01b 0.37 ± 0.01a 0.29 ± 0.01b 0.29 ± 0.01b 0.27 ± 0.01b
Elasticity modulus, Kpa
19.6 ± 2.6a 10.74 ± 1.1b 12.44 ± 2.8b 11.47 ± 1.9b 20.6 ± 2.9a 10.2 ± 1.7b 11.12 ± 1.8b 10.99 ± 1.4b
Stor
age
Mod
ulus
(Kpa
)
Strain (%)
Figure 1: Storage moduli of Iranian white cheese. L1, (♦); C1, (*); L2, (■); C2, (●); L3, (▲); C3, (+); L4, (×); C4, (▬).
Stor
age
Com
plia
nce
(Kpa
¯¹)
Strain (%)
Figure 2: Storage compliance of Iranian white cheese. L1, (♦); C1, (*); L2, (■); C2, (●); L3, (▲); C3, (+); L4, (×); C4, (▬).

Citation: Rahimi J, Khosrowshahi A, Moradi MM, Mohamadi H, Abbasi H, et al. (2013) Texture and Chemistry of Iranian White Cheese as Influenced by Brine Treatments. J Food Process Technol 4: 219. doi:10.4172/2157-7110.1000219
Page 7 of 9
Volume 4 • Issue 4 • 1000219J Food Process TechnolISSN:2157-7110 JFPT, an open access journal
L1 L2
L3 L4
C1 C2
C3 C4
Figure 3: Scanning electron micrographs of Iranian white cheese.
Rheological measurements showed that L1 and C1 had higher elastic moduli, fracture strain, and fracture stress than the other cheeses (Table 4). We propose that the network had become coarse, as we observed in the microstructure. As the microstructure of cheese treatments with similar brine concentration i. e. L2, L3, L4, C2, C3, and C4 was compared together; it was obvious that pH of brine and type of the used acid in brine had no significant effect on microstructure of these cheeses. Table 5 shows the proportions areas occupied by fat/serum pockets (PAOP) and the maximum diameter of pockets (MDP) in cheese treatments. L1 and C1 had lower PAOP than other treatments. It has been proposed that sodium chloride in the serum phase of cheese would promote solubilization of caseins and increased protein-to-water interactions, so the protein matrix becomes more hydrated and swells, occupying an increased area of cheese matrix, becoming more continuous and homogeneous in appearance. Pastorino et al. [16] explained that salt increased the hydration of proteins by altering protein interactions. This occurs by increased salt content impairing interactions between
proteins and promoting protein-to-water interactions. Thus, a partial relaxation of the protein matrix would occur that would allow water to migrate from pockets into the protein matrix. As a result, the protein matrix became more hydrated and swelled, occupying increased area of cheese matrix. The pH and type of the used acid in brine concentration had no significant effect on PAOP. In all cheese samples, the MDP was approximately 9-10 μm, and there was no different between them. Indeed, brine concentration, pH of brine, and type of the used acid in brine had no effect on the size of serum pockets. Rowney et al. [30] studied on Salt-induced structural changes in 1-day old Mozzarella cheese. They found that there was no significant effect of salt content on the maximum diameter. Protein and fat are two major components of cheese, so protein-protein interactions and protein-fat interactions are important factors contributing to microstructure formation [31]. As shown in table 1, it was only the brine concentration that affected protein and fat content of cheese samples, so this can explain the difference between microstructure of cheese samples with different brine concentration.
Citation: Rahimi J, Khosrowshahi A, Moradi MM, Mohamadi H, Abbasi H, et al. (2013) Texture and Chemistry of Iranian White Cheese as Influenced by Brine Treatments. J Food Process Technol 4: 219. doi:10.4172/2157-7110.1000219
Page 8 of 9
Volume 4 • Issue 4 • 1000219J Food Process TechnolISSN:2157-7110 JFPT, an open access journal
ConclusionThis study indicated that brine concentration had important
effects on chemical composition, rheological characteristics, and microstructure of Iranian white cheese. As the brine concentration increased, the instrumental hardness parameters increased, and the microstructure became more compact. A higher brine concentration increased the fracture stress and storage modulus. It also modified the casein network arrangement providing more homogenous protein aggregates. As the brine concentration increased, aw and whiteness decreased, sodium content increased, and calcium and phosphorus had
L1 L2
L3 L4
C1 C2
3
C3 C4
3
Figure 4: Binary image of scanning electron micrographs of Iranian white cheese.
no change. Unlike brine concentration, pH and the used acid type in brine had no significant effect on these parameters.References1. Ak MM, Gunasekaran S (1992) Stress-Strain Curve Analysis of Cheddar
Cheese under Uniaxial Compression. J Food Sci 57: 1078-l081.
2. Lobato-Calleros C, Rodriguez E, Sandoval-Castilla O, Vernon-Carter EJ, Alvarez-Ramirez J (2006) Reduced-fat white fresh cheese-like products obtained from W1/O/W2 multiple emulsions: Viscoelastic and high resolution image analyses. Food Res Int 39: 678-685.
3. Karlsson AO, Ipsen R, Ardo Y (2007) Influence of pH and NaCl on rheological properties of rennet-induced casein gels made from UF concentrated skim milk. Int Dairy J 17: 1053-1062.
a-bMeans within the same row with different subscripts differ (p < .05)1PAOP: The proportions areas occupied by fat/serum pockets; MDP: The maximum diameter of pockets
Table 5: PAOP and MDP of cheese samples.
Item1 L1 L2 L3 L4 C1 C2 C3 C4PAOP % 21.91b 28.87a 29.84a 29.91a 22.47b 28.87a 28.33a 29.79a
MDP, μm 9.89a 10.85a 9.38a 10.66a 10.16a 11.94a 10.95a 10.34a

Citation: Rahimi J, Khosrowshahi A, Moradi MM, Mohamadi H, Abbasi H, et al. (2013) Texture and Chemistry of Iranian White Cheese as Influenced by Brine Treatments. J Food Process Technol 4: 219. doi:10.4172/2157-7110.1000219
Page 9 of 9
Volume 4 • Issue 4 • 1000219J Food Process TechnolISSN:2157-7110 JFPT, an open access journal
4. Paulson BM, McMahon DJ, and Oberg CJ (1998) IInfluence of Salt on Appearance Functionality, and Protein Arrangements in Nonfat Mozzarella Cheese. J Dairy Sci 81: 2053-2064.
5. Khosrowshahi A, Madadlou A, Mousavi ME, Emam-Djomeh Z (2006) Monitoring the chemical and textural changes during ripening of Iranian White cheese made with different concentrations of starter. J Dairy Sci 89: 3318-3325.
6. Rahimi J, Khosrowshahi A, Madadlou A, Aziznia S (2007) Texture of low-fat Iranian White cheese as influenced by gum tragacanth as a fat replacer. J Dairy Sci 90: 4058-4070.
7. Buffa NM, Trujillo AJ, Pavia M, Guamis B (2001) Changes in textural, microstructural, and color characteristics during ripening of cheeses made from raw, pasteurized or high-pressure-treated goats’ milk. Int Dairy J 11: 927-934.
8. IDF (1997) Bovine rennets: Determination of total milk clotting activity. Standard 157A. International Dairy Federation, Brussels, Belgium.
9. Madadlou A, Khosrowshahi A, Mousavi ME, Farmani J (2007) The influence of brine concentration on chemical composition and texture of Iranian White cheese. J Food Eng 81: 330-335.
10. Association of Official Analytical Chemists (1997) Official methods of analysis, (16th ed., 3rd rev.). Arlington, VA: AOAC.
11. James CS (1998) Analytical Chemistry of Foods. Glasgow, UK.
12. Kira CS, Maihara VA (2007) Determination of major and minor elements in dairy products through inductively coupled plasma optical emission spectrometry after wet partial digestion and neutron activation analysis. J Food Chem 100: 390-395.
13. Tunick MH (2000) Rheology of dairy foods that gel, stretch, and fracture. J Dairy Sci 83: 1892-1898.
14. Hort J, Grys GL (2001) Developments in the textural and rheological properties of UK Cheddar cheese during ripening. Int Dairy J 11: 475-481.
15. Steff JF (1996) Rheological Methods in Food Process Engineering. (2nd edn), Freeman Press, MI USA.
16. Pastorino AJ, Hansen CL, McMahon DJ (2003) Effect of salt on structure-function relationships of cheese. J Dairy Sci 86: 60-69.
17. Kaya S (2002) Effect of salt on hardness and whiteness of Gaziantep cheese during short-term brining. J Food Eng 52: 155-159.
18. Fox PF, Guinee TP, Cogan TM, McSweeny PLH (2000) Fundamentals of Cheese Science. Gaithersburg, MD, USA: Aspen Publishers, Inc.
19. Feeney EP, Guinee TP, Fox PF (2002) Effect of pH and calcium concentration on proteolysis in mozzarella cheese. J Dairy Sci 85: 1646-1654.
20. Barbano DM, Kindstedt PS (1998) Effect of fat replacer (Salatrim) on chemical composition, proteolysis, functionality, appearance, and yield of reduced fat Mozzarella cheese
21. Kilcast D, Angus F (2007) Reducing salt in foods. Woodhead publishing Limited, Abington Hall, Abington, Cambridge CB21 6Ah, England.
22. Schroeder CL, Bodyfelt FW, Wyatt CJ, McDaniel MR (1988) Reduction of Sodium Chloride in Cheddar Cheese: Effect on Sensory, Microbiological, and Chemical Properties. J Dairy Sci 71: 2010-2020.
23. Multag MA, Wilbey RA (2006) Effect of chymosin reduction and salt substitution on the properties of white salted cheese. Int Dairy J 16: 903- 909.
24. Zisu B, Shah NP (2005) Textural and functional changes in low-fat Mozzarella cheeses in relation to proteolysis and microstructure as influenced by the use of fat replacers, pre-acidification and EPS starter. Int Dairy J 15: 957-972.
25. Upreti P, Metzger LE (2006) Influence of calcium and phosphorus, lactose, and salt-to-moisture ratio on Cheddar cheese quality: manufacture and composition. J Dairy Sci 89: 420-428.
26. Lemay A, Paquin P, Lacroix C (1994) Influence of Microfluidization of Milk on Cheddar Cheese Composition, Color, Texture, and Yield. J Dairy Sci 77: 2870-2879.
27. Guinee TP, Auty MAE, Fenelon MA (2000) The effect of fat content on the rheology, microstructure and heat-induced functional characteristics of Cheddar cheese. Int Dairy J 10: 277-288.
28. Guinee TP, Feeney EP, Auty MA, Fox PF (2002) Effect of pH and Calcium Concentration on Some textural and functional properties of mozzarella cheese. J Dairy Sci 85: 1655-1669.
29. Zalazar CA, Zalazar CS, Bernal S, Bertola N, Bevilacqua A, et al. (2002) Effect of moisture level and fat replacer on physicochemical, rheological and sensory properties of low fat soft cheeses. Int Dairy J 12: 45-50.
30. Rowney MK, Roupas P, Hickeya MW, Everettc DW (2004) Salt-induced structural changes in 1-day old Mozzarella cheese and the impact upon free oil formation. Int Dairy J 14: 809-816.
31. Brown JA, Foegeding EA, Daubert CR, Drake MA, Gumpertz M (2003) Relationships among rheological and sensorial properties of young cheeses. J Dairy Sci 86: 3054-3067.
Submit your next manuscript and get advantages of OMICS Group submissionsUnique features:
User friendly/feasible website-translation of your paper to 50 world’s leading languagesAudio Version of published paperDigital articles to share and explore
Special features:
250 Open Access Journals20,000 editorial team21 days rapid review processQuality and quick editorial, review and publication processingIndexing at PubMed (partial), Scopus, DOAJ, EBSCO, Index Copernicus and Google Scholar etcSharing Option: Social Networking EnabledAuthors, Reviewers and Editors rewarded with online Scientific CreditsBetter discount for your subsequent articles
Submit your manuscript at: http://www.omicsonline.org/submission
Citation: Rahimi J, Khosrowshahi A, Moradi MM, Mohamadi H, Abbasi H, et al. (2013) Texture and Chemistry of Iranian White Cheese as Influenced by Brine Treatments. J Food Process Technol 4: 219. doi:10.4172/2157-7110.1000219