texture analysis for the segmentation of sugar cane
TRANSCRIPT

adfa, p. 1, 2011.
© Springer-Verlag Berlin Heidelberg 2011
Texture Analysis for the Segmentation of Sugar Cane
Multispectral Images
1Agustín Solano, 1Gerardo Schneider, 2Alejandra Kemerer, 1Alejandro Hadad
1Grupo de Investigación en Inteligencia Artificial
Fac. de Ingeniería – Universidad Nacional de Entre Ríos
Oro Verde, Entre Ríos Argentina
[email protected],[email protected],hadad@santaf
e-conicet-gov.ar 2Grupo de Recursos Naturales y Factores Abióticos
EEA Paraná - INTA
Oro Verde, Entre Ríos Argentina
Abstract. In this paper is presented an analysis of the impact of texture features
for segmentation of multispectral aerial images of sugar cane. Currently there
are no precise techniques to estimate objectively areas of fallen cane and this
causes significant losses in crop productivity and industrialization. For the real-
ization of this work was made an image dataset. To build this dataset was im-
plemented a software from which were obtained labeled regions in the images
related to this agronomic phenomenon and then were extracted some texture
features and a typical agronomic index (NDVI). The features related to segmen-
tation task were analyzed with classical techniques such as Principal Compo-
nent Analysis and Decision Trees. The results obtained show good performance
to distinguish normal sugar cane versus fallen sugar cane but not between dif-
ferent fallen sugar cane classes. However this approach was satisfactory to es-
timate the normal and fallen sugar cane areas and this increase the information
quality available to support agronomic decisions.
Keywords: sugar cane; multiespectral images; texture features; principal com-
ponents analysis; decision trees
1 Introduction
The cultivation of sugar cane in Argentina is found principally localized in the north-
west region of the country (99 %), where represents, in agreement with [1], one of the
most important productive activities, and in scarce extension in the littoral region (1
%). The productive systems present different technological levels according to the
6º Congreso Argentino de AgroInformática, CAI 2014
43 JAIIO - CAI 2014 - ISSN 1852-4850 - Página 87

system of crop used, with systems ranging from manual to fully mechanized. Howev-
er, at present, over 70% of the total volume is harvested in a mechanized way. One of
the most critical aspects of the process of harvesting sugar cane are the losses that are
produced and are acceptable levels about 2,5%. The presence of fallen cane is one of
the factors with biggest influence. Incidence of overturning superior to 20% produces
increments in the losses that go from 4 to 6,4%, according to [2].
The presence of fallen sugar cane (CC) at the moment of harvesting brings im-
portant losses of product during the collection and in the sugar mill. In the phenome-
non of CC take part random and unpredictable aspects. It is normal that the sugar cane
plantation in a productive square reach an average height, but presents variations of
this feature in different sectors of the field. This might be because of the different
conditions of the earth that presents different levels of fertility, humidity, compress-
ing, etc. On the other hand, each plant of the sugar cane plantation is constituted in a
different way and they will manifest in unique form the different external stimulus.
When the plant is young and has developed under the best conditions, reaches cer-
tain height and for its own weight it begins to warp, moving close to break once its
breakage tension is surpassed, product of the wind or environmental phenomena as
the hail. The CC appears with great space heterogeneity.
Once produced the phenomenon, the earth can remain exposed or, on the contrary,
can appear a product with green color because of the appearance of new green sheets,
with phototropic growth. This adds heterogeneity to an external observation. The
above mentioned factors make clear the great complexity of the phenomenon under
study, which makes it difficult to analyze and quantify.
When strange matter called „trash‟, that is not sugar cane, enters the sugar mill rep-
resents an important loss of efficiency in the process of manufacture of the sugar, as
assure [3]. The challenge of industrial engineering is to explore the alternatives to
control the harmful effects that these tailings or trash and the dust present in the cane
have in the equipment, processes and operative performance of the factory. That is to
say that the quality of the cane affects in direct form the industrial performance and
the quality of the obtained sugar [4]. In turn, the quality of the raw material (cane) can
be affected by changing aspects of the agriculture of the sugar cane, such as the intro-
duction of new cultivars, climatic variations, the use of ripening chemists, changes in
the cultural practices and in the systems of harvest or the appearance in the cultiva-
tions of illnesses or infections. As for the types of harvest, it is observed that the con-
tents of trash and dust in cane harvested in mechanized way are appreciably lower
that in the semi-mechanized, being more than 2 to 5,7 %. At the same time, the values
of fiber (plant residues) rise from 14 to about 18% due to the presence of increased
amount of plant parts with a less efficient harvesting [5]. This means that the indus-
tries pay to the producers a significant part of the weight of the trash of the entered
raw material at the same price of the cane, because the form of sampling and analysis
of this parameter is generally inadequate. To this must be incorporated the other addi-
tional costs produced by this strange product in the mill:
1. Abrasive wear in mills and a progressive loss of capacity to extract the cane juice.
6º Congreso Argentino de AgroInformática, CAI 2014
43 JAIIO - CAI 2014 - ISSN 1852-4850 - Página 88
2. Significant increase in the amount of "cachaza" and in the losses of sugar present
in it.
3. Increased use of chemicals to treat the juices.
4. Increase of juice's color intensity and sugar's color intensity, thereby to avoid it the
crystallization cycles must be reduced decreasing the manufacturing efficiency.
5. Wear on equipment, tubes and pumps.
6. Diminution of the calorific value of the sugarcane bagasse and consequently of the
burning efficiency, with an increase of the boiler consumption and emissions.
7. Other.
To reduce to the minimum possible the percentage of trash in the sugarcane, several
mills installed washing tables of cane, where they remove the content of dust by
means of big quantities of water (about 3 m3 of water by ton. of cane). This supposes
a saving of money, but adds problems like bigger costs for the required power, the
water and the additional manual labor, added to the new discussions with the produc-
ers since some studies confirm that during washing it is lost a percentage of the per-
formance of sugar extraction. Moreover, the technique requires availability of terrain
to install settling tanks of sand and mud to reuse the water. A promising strategy to
achieve the reduction of this impact takes root in achieving a bigger operative effi-
ciency in the tasks of harvesting the cane, previous stage to the entrance to the facto-
ries, and fundamentally in sectors with broken cane that increases notably the per-
centage of trash. This is an area of intensive manual labor where for its particular
properties, considers [5], it was no possible to introduce technological solutions to
reduce its negative impact in the production.
At present, the quantization of the fallen cane in productive squares is an expensive
and inefficient process. It requires sending evaluators to the terrain that must explore
big surfaces to obtain a representative sampling that permit an estimation. The dis-
placement around the field produces damage, requires many man hours of work and
generates estimations with a high degree of uncertainty. In turn, the presence of space
variations in the productivity of the cane is very wide, [6] determined variations until
50 tn/has. It is expected that this production pattern, as well as variations in the quali-
ty of the cane, be observed at diverse scales, in a similar way to other variables that
influence in the production, as the properties of earth [7], making it difficult to estab-
lish a single sampling distance and has a negative impact on costs.
Other strategy is carrying out flights over the cultivations with specialists who es-
timate the percentage of fallen cane according to their experience and what is ob-
served from the air. This strategy is subjective and dependent on the available special-
ists in each area of interest.
Keeping in mind these antecedents is evident that has not observed a report of
some methodology with measurable certainty to decide the affected area, in order to
help to plan a better way of harvesting and the associates costs.
With this goal in mind and in conjunction with the National Institute of Agricultur-
al Technology of Argentina (INTA), the group has worked on a number of algorithms
for processing high-resolution aerial photographs of sugarcane productive
squares[8,9].
6º Congreso Argentino de AgroInformática, CAI 2014
43 JAIIO - CAI 2014 - ISSN 1852-4850 - Página 89

2 Materials
A set of images obtained for the National Institute of Agricultural Technology of
Argentina (INTA) from a Sky Arrow 650TCNS ERA airplane , whose system of cap-
ture is composed of a Global Positioning System, a Geospatial MS4100 multi-spectral
camera and a system of control and storage of data. The camera permits the acquisi-
tion of photograms in three bands of the electromagnetic spectrum: green (530-580
nm), red (650-685 nm) and near infrared (770-830 nm) with a resolution of 1920 x
1075 pixels. The GPS provides the position, altitude and height in synchronism with
the acquisition of each photogram.
A flight was carried out on 5th May 2008, moment of the cultivation cycle where
the presence of fallen cane is clearly evident. The flight was carried out in the solar
midday to have homogeneous illumination in the surface. The flight plan was de-
signed for an altitude of 1200 m, resulting a size of pixel of 0.7 m by side. There were
obtained 540 photograms that were assembled by means of reconnaissance points in
consecutive photograms generating a mosaic.
With the supervision of an agricultural engineer it was carried out the labelling of
the images in the classes of interest, using the application Label Me [10] of the Mas-
sachusetts Institute of Technology (M.I.T.), which was in a local server to facilitate
the access to the data and the incorporation to a pipeline of processing. The Fig. 1
shows the process of labeling which consisted in delimiting the images with polygons
that contained representative portions of the cane classes: standing cane (CP), fallen
in form of patch (CCP), fallen cane in big areas (CCA), fallen cane with phototropism
(CCF) and areas of exposed ground (C).
From this stage resulted a dataset composed of 5678 samples or square images of
60x60 pixels.
With the red and near infrared channels was obtained the Normalized Difference
Vegetation Index (NDVI) [11] of each image.
Fig. 1. Capture of screen of an example image and of the process of labeling with LabelMe.
6º Congreso Argentino de AgroInformática, CAI 2014
43 JAIIO - CAI 2014 - ISSN 1852-4850 - Página 90
3 Methodology and Results
3.1 Data analysis
Usually the methodologies used in the field of image analysis in agriculture when
studying the state of the sugar cane are oriented to the use of photometric indices such
as NDVI. On the other hand considering that this type of cultivation has more pro-
nounced alterations in the spatial distribution compared to other crops suggests ad-
dress the problem using texture characteristics of aerial images and evaluate their
capability to describe it.
In this regard, it has been reported by [9] that the entropy, which is a common used
texture feature in agriculture, provides insufficient information to distinguish the dif-
ferent states of the cane, so in this work is proposed to complete the set of texture
features, incorporating other first-order statistics such as mean and standard deviation
of the different channels of the image, in order to determine the relative contributions
of each one in relation to the problem.
Before feature extraction, the three channels of the original images were prepro-
cessed by applying the Cartoon+Texture image decomposition, proposed by [12]. For
each image point, a decision is made of whether it belongs to the cartoon part or to the
textural part. This decision is made by computing a local total variation of the image
around the point, and comparing it to the local total variation after a low pass filter
has been applied. This algorithm gave texture images with normalized brightness.
Then all images were processed with 11x11 pixel windows defining the following
characteristics or indicators of interest applied to the windows:
Entropy
Standard Deviation
Mean
Thus, each window was characterized by a set of 12 texture parameters, 3 for each
channel in the image (Infrared, Red and Green) and 3 for the NDVI images.
As a first step, was carried out a Principal Components Analysis (PCA), which al-
lowed to condense the information from a large set of correlated variables in fewer
variables, without losing most of the variability present in the data set.
By applying PCA resulted that 96.6% of the variability in the data was explained
by the first 3 principal components encountered. However it was observed that in the
space generated by the main components only three classes were distinguished: CP, C
and CC (which contains the types CCA, CCP and CCF).
In the Fig. 2 is shown the distribution of the types of cane in the Principal Compo-
nents space.
6º Congreso Argentino de AgroInformática, CAI 2014
43 JAIIO - CAI 2014 - ISSN 1852-4850 - Página 91

Fig. 2. Distribution of the types of cane in the Principal Components space.
Then all data was analyzed by Decision Trees, a prediction model based on induc-
tive inference which identifies examples of one of several possible categories.
For this, data was normalized and clustered in Training groups and Test groups,
picking up examples randomly from the groups CP, CC and C.
In the Fig. 3 is shown the percentage of success versus the level of pruning made to
the original tree. Each curve corresponds to a different tree, obtained by subsampling
the original data. It is also shown an average curve (red).
6º Congreso Argentino de AgroInformática, CAI 2014
43 JAIIO - CAI 2014 - ISSN 1852-4850 - Página 92
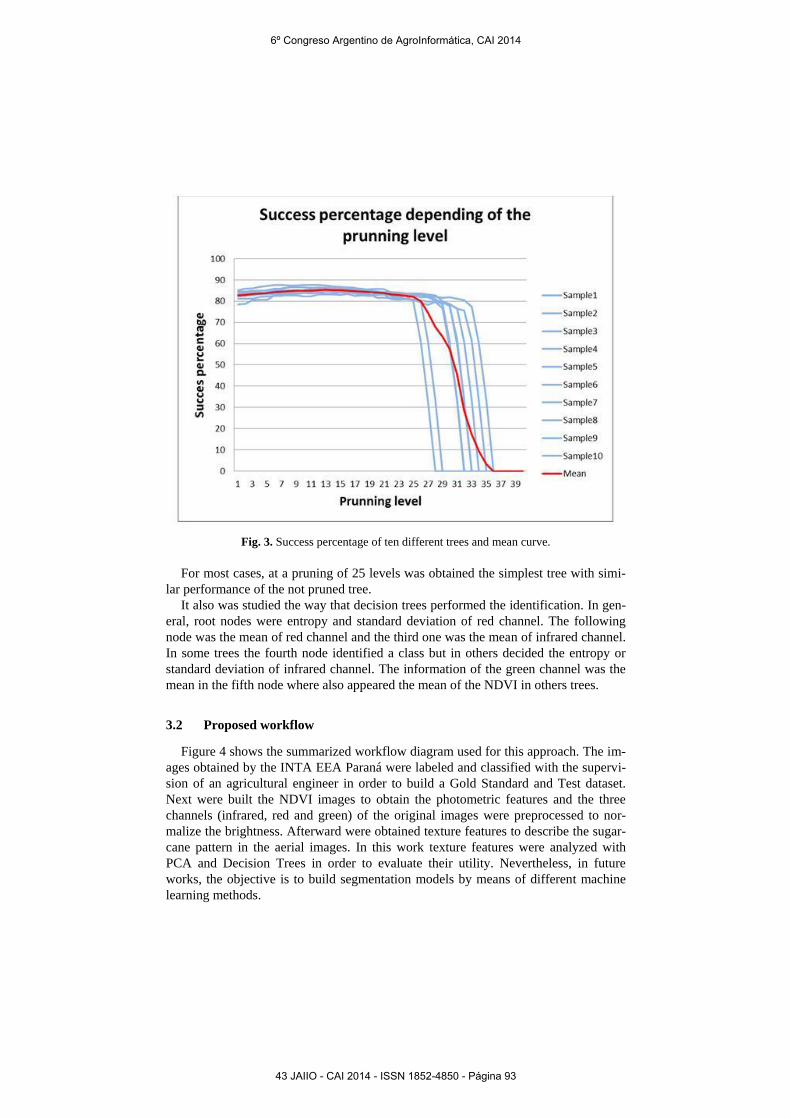
Fig. 3. Success percentage of ten different trees and mean curve.
For most cases, at a pruning of 25 levels was obtained the simplest tree with simi-
lar performance of the not pruned tree.
It also was studied the way that decision trees performed the identification. In gen-
eral, root nodes were entropy and standard deviation of red channel. The following
node was the mean of red channel and the third one was the mean of infrared channel.
In some trees the fourth node identified a class but in others decided the entropy or
standard deviation of infrared channel. The information of the green channel was the
mean in the fifth node where also appeared the mean of the NDVI in others trees.
3.2 Proposed workflow
Figure 4 shows the summarized workflow diagram used for this approach. The im-
ages obtained by the INTA EEA Paraná were labeled and classified with the supervi-
sion of an agricultural engineer in order to build a Gold Standard and Test dataset.
Next were built the NDVI images to obtain the photometric features and the three
channels (infrared, red and green) of the original images were preprocessed to nor-
malize the brightness. Afterward were obtained texture features to describe the sugar-
cane pattern in the aerial images. In this work texture features were analyzed with
PCA and Decision Trees in order to evaluate their utility. Nevertheless, in future
works, the objective is to build segmentation models by means of different machine
learning methods.
6º Congreso Argentino de AgroInformática, CAI 2014
43 JAIIO - CAI 2014 - ISSN 1852-4850 - Página 93

Fig. 4. Workflow Diagram
4 Conclusions
It was compiled a reference dataset and a database for the study of the cultivation
of sugar cane in its different states.
PCA could distinguish between standing cane and fallen cane, but resulted insuffi-
cient to differentiate most of the fallen classes. The only CC that could be identified
was the C class, which corresponds to the zone of lower fertility.
Another conclusion is that the most quantity of information is contained in the
same channels considered by the NDVI indicator but from a geometric point of view.
Then the information of the green channel and the variations of the NDVI were incor-
porated.
By the analysis carried out it was possible to measure and rank the importance of
the incorporation of new descriptors in order to evaluate the state of cultivation. Fur-
thermore it was noted that the approach of textures from the statistical viewpoint is
insufficient for complete detection of fallen canes, so it must include spectral or mul-
tiscale approach to the problem.
As future work is planned to incorporate new descriptors in order to build a classi-
fier oriented to the segmentation of the images.
5 References
1. Pérez D, Fandos C, Mazzone L, Soria F, Scandalaris P and Scandalaris J. 2005 “Caña de
azúcar en Tucumán y Argentina: evolución de algunos aspectos económicos y productivos
en la campaña 2004” [on line]. Reporte agroindustrial. Estadísticas y márgenes de cultivos
tucumanos. Vol. 2, Boletín Nº 6, (ene.). Tucumán (Argentina): Estación Experimental
Agroindustrial Obispo Colombres, EEAOC. p 1-6.
http://www.eeaoc.org.ar/upload/publicaciones/archivos/189/20120316170830000000.pdf
[consulted: 02/04/2013]
2. Rodríguez R.A, Sopena, R.A, Saleme P.M and Vicini L.E 2010 “Pérdidas durante la Cose-
cha del Cultivo de Caña de Azúcar: Evaluaciones 2009 en la Provincia de Tucumán – Ar-
6º Congreso Argentino de AgroInformática, CAI 2014
43 JAIIO - CAI 2014 - ISSN 1852-4850 - Página 94

gentina” Informes Técnicos del proyecto Precop, No. 1. Famaillá (Tucumán, Argentina):
INTA EEA Famaillá, Nº1, 18 p. ISSN: 1852-9399.
3. Tonatto J, Romero E.R., Leggio Neme M.F., Scandalaris J, Alonso J, Digonzelli P, Alonso
L and Casen S 2005 “Importancia de la calidad de la materia prima en la productividad de
la agroindustria azucarera” Gacetilla Agroindustrial de la EEAOC, No. 67, Tucumán (Ar-
gentina): EEAOC. 13 p.
4. Larrahondo J.E. 1995 “Calidad en la Caña de Azúcar” CENICAÑA. El cultivo de la caña
en la zona azucarera de Colombia, Cali, CENICAÑA. p.349-350.
5. Sustaita G 2005 “Modelo estratégico para la industria azucarera regional”. Tesis Final
MBA, San Miguel deTucumán (Tucumán, Argentina): Universidad Católica del Norte
Santo Tomás de Aquino, Fundación del Tucumán y Pontificia Universidad Católica de
Valparaíso.
6. Viccini L 2007 “Determinación de la variación de rendimiento cultural de caña de azúcar
en Tucumán, Argentina, posicionada con GPS” Actualización Técnica Nº 8 (jun.). Man-
fredi (Córdoba, Argentina): Proyecto Nacional Agricultura de Precisión, INTA, 18 p.
7. Anderson D.L., Portier K.M., Obreza T.A., Collins M.E. and Pitts D.J. 1999 “Tree regres-
sion analysis to determine effects of soil variability on sugarcane yields” Soil Science So-
ciety of America Journal, Vol. 63, No. 3, Madison (WI, USA), Soil Science Society of
America, p. 592–600, ISSN:0361-5995.
8. Kemerer A., Melchiori A, Albarenque S and Melchiori R 2010 “Utilización de fotografías
aéreas multiespectrales para caracterizar la variabilidad espacial en la producción de caña
de azúcar” 9º Curso de Agricultura de Precisión y 4ª Expo de Máquinas Precisas (14-
16/07/2010), Manfredi (Córdoba, Argentina): INTA - EEA Manfredi. Material del 9º Cur-
so de Agricultura de Precisión, p. 177-182, 2010
9. Melchiori A, Kemerer A, Melchiori R and Bellomo M 2009 “Utilización de fotografías aé-
reas multiespectrales de alta resolución para la cuantificación de caña de azúcar caída” I
Congreso Argentino de Agroinformática (24-25/08/2009), Mar del Plata (Argentina): So-
ciedad Argentina de Informática y el Instituto Nacional de Tecnología Agropecuaria,
INTA.
10. Russel B.C., Torralba A, Murphy K.P. and Freeman W.T. 2008 LabelMe: a database and
webbased tool for image annotation International Journal of Computer Vision, Vol. 77,
No. 1-3 (may.). New York (USA): Springer US. p. 157-173, ISSN: 0920-5691.
11. Rouse J.W., Haas R.H., Schell J.A. and Deering D.W. 1973 Monitoring vegetation sys-
tems in the great plains with ERTS Third ERTS Symposium (10-14/12/1973), Washington
D.C. (USA): NASA. Proceedings of Third ERTS Symposium Vol. 1., p. 309-317.
12. Buades, A., Le, T., Morel, J.M., Vese, L. 2011 Cartoon+Texture Image Decomposition.
Image Processing Online, 1(2011). http://dx.doi.org/10.5201/ipol.2011.blmv_ct
6º Congreso Argentino de AgroInformática, CAI 2014
43 JAIIO - CAI 2014 - ISSN 1852-4850 - Página 95