textural, compositional, and sulfur isotope variations of ...processes by which minerals formed...
TRANSCRIPT

0361-0128/01/3468/1509-24 $6.00 1509
Textural, Compositional, and Sulfur Isotope Variations of Sulfide Minerals in the Red Dog Zn-Pb-Ag Deposits, Brooks Range, Alaska: Implications for Ore Formation
K. D. KELLEY,† D. L. LEACH,U.S. Geological Survey, Box 25046, MS 973, Denver, Colorado 80225
C. A. JOHNSON,U.S. Geological Survey, Box 25046, MS 963, Denver, Colorado 80225
J. L. CLARK,Teck Cominco American Inc., 15918 East Euclid Avenue, Spokane, Washington 99216
M. FAYEK,Oak Ridge National Laboratories, P.O. Box 2008, Oak Ridge, Tennessee 37831
J. F. SLACK,U.S. Geological Survey, National Center, MS 954, Reston, Virginia 20192
V. M. ANDERSON,1175 C Bear Mountain Drive, Boulder, Colorado 80305
R. A. AYUSO,U.S. Geological Survey, National Center, MS 954, Reston, Virginia 20192
AND W. I. RIDLEY
U.S. Geological Survey, Box 25046, MS 973, Denver, Colorado 80225
AbstractThe Red Dog Zn-Pb deposits are hosted in organic-rich mudstone and shale of the Mississippian Kuna For-
mation. A complex mineralization history is defined by four sphalerite types or stages: (1) early brown spha-lerite, (2) yellow-brown sphalerite, (3) red-brown sphalerite, and (4) late tan sphalerite. Stages 2 and 3 consti-tute the main ore-forming event and are volumetrically the most important. Sulfides in stages 1 and 2 weredeposited with barite, whereas stage 3 largely replaces barite. Distinct chemical differences exist among thedifferent stages of sphalerite. From early brown sphalerite to later yellow-brown sphalerite and red-brownsphalerite, Fe and Co content generally increase and Mn and Tl content generally decrease. Early brown spha-lerite contains no more than 1.9 wt percent Fe and 63 ppm Co, with high Mn (up to 37 ppm) and Tl (126 ppm),whereas yellow-brown sphalerite and red-brown sphalerite contain high Fe (up to 7.3 wt %) and Co (up to 382ppm), and low Mn (<27 ppm) and Tl (<37 ppm). Late tan sphalerite has distinctly lower Fe (< 0.9 wt %) andhigher Tl (up to 355 ppm), Mn (up to 177 ppm), and Ge (426 ppm), relative to earlier sphalerite. Wide rangesin concentrations of Ag, Cu, Pb, and Sb characterize all sphalerite types, particularly yellow-brown sphaleriteand red-brown sphalerite, and most likely reflect submicroscopic inclusions of galena, chalcopyrite and/ortetrahedrite in the sphalerite. In situ ion microprobe sulfur isotope analyses show a progression from extremelylow δ34S values for stage 1 (as low as –37.2‰) to much higher values for yellow-brown sphalerite (mean of3.3‰; n = 30) and red-brown sphalerite (mean of 3.4; n = 20). Late tan sphalerite is isotopically light (–16.4to –27.2‰).
The textural, chemical, and isotopic data indicate the following paragenesis: (1) deposition of early brownsphalerite with abundant barite, minor pyrite, and trace galena immediately beneath the sea floor in uncon-solidated mud; (2) deposition of yellow-brown sphalerite during subsea-floor hydrothermal recrystallizationand coarsening of preexisting barite; (3) open-space deposition of barite, red-brown sphalerite and other sul-fides in veins and coeval replacement of barite; and (4) postore sulfide deposition, including the formationof late tan sphalerite breccias. Stage 1 mineralization took place in a low-temperature environment wherefluids rich in Ba mixed with pore water or water-column sulfate to form barite, and metals combined withH2S derived from bacterial sulfate reduction to form sulfides. Higher temperatures and salinities and rela-tively oxidized ore-stage fluids (stages 2 and 3) compared with stage 1 were probably important controls on
©2004 by Economic GeologyVol. 99, pp. 1509–1532
†Corresponding author: e-mail, [email protected]
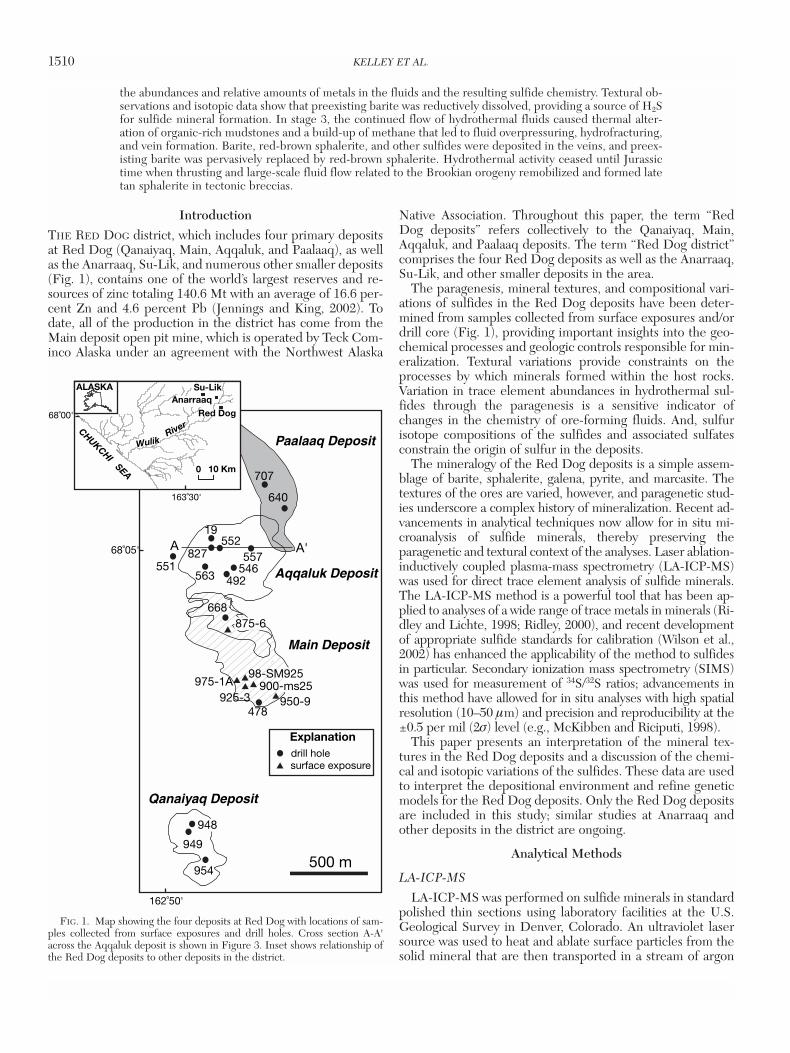
IntroductionTHE RED DOG district, which includes four primary depositsat Red Dog (Qanaiyaq, Main, Aqqaluk, and Paalaaq), as wellas the Anarraaq, Su-Lik, and numerous other smaller deposits(Fig. 1), contains one of the world’s largest reserves and re-sources of zinc totaling 140.6 Mt with an average of 16.6 per-cent Zn and 4.6 percent Pb (Jennings and King, 2002). Todate, all of the production in the district has come from theMain deposit open pit mine, which is operated by Teck Com-inco Alaska under an agreement with the Northwest Alaska
Native Association. Throughout this paper, the term “RedDog deposits” refers collectively to the Qanaiyaq, Main,Aqqaluk, and Paalaaq deposits. The term “Red Dog district”comprises the four Red Dog deposits as well as the Anarraaq,Su-Lik, and other smaller deposits in the area.
The paragenesis, mineral textures, and compositional vari-ations of sulfides in the Red Dog deposits have been deter-mined from samples collected from surface exposures and/ordrill core (Fig. 1), providing important insights into the geo-chemical processes and geologic controls responsible for min-eralization. Textural variations provide constraints on theprocesses by which minerals formed within the host rocks.Variation in trace element abundances in hydrothermal sul-fides through the paragenesis is a sensitive indicator ofchanges in the chemistry of ore-forming fluids. And, sulfurisotope compositions of the sulfides and associated sulfatesconstrain the origin of sulfur in the deposits.
The mineralogy of the Red Dog deposits is a simple assem-blage of barite, sphalerite, galena, pyrite, and marcasite. Thetextures of the ores are varied, however, and paragenetic stud-ies underscore a complex history of mineralization. Recent ad-vancements in analytical techniques now allow for in situ mi-croanalysis of sulfide minerals, thereby preserving theparagenetic and textural context of the analyses. Laser ablation-inductively coupled plasma-mass spectrometry (LA-ICP-MS)was used for direct trace element analysis of sulfide minerals.The LA-ICP-MS method is a powerful tool that has been ap-plied to analyses of a wide range of trace metals in minerals (Ri-dley and Lichte, 1998; Ridley, 2000), and recent developmentof appropriate sulfide standards for calibration (Wilson et al.,2002) has enhanced the applicability of the method to sulfidesin particular. Secondary ionization mass spectrometry (SIMS)was used for measurement of 34S/32S ratios; advancements inthis method have allowed for in situ analyses with high spatialresolution (10–50 µm) and precision and reproducibility at the±0.5 per mil (2σ) level (e.g., McKibben and Riciputi, 1998).
This paper presents an interpretation of the mineral tex-tures in the Red Dog deposits and a discussion of the chemi-cal and isotopic variations of the sulfides. These data are usedto interpret the depositional environment and refine geneticmodels for the Red Dog deposits. Only the Red Dog depositsare included in this study; similar studies at Anarraaq andother deposits in the district are ongoing.
Analytical Methods
LA-ICP-MS
LA-ICP-MS was performed on sulfide minerals in standardpolished thin sections using laboratory facilities at the U.S.Geological Survey in Denver, Colorado. An ultraviolet lasersource was used to heat and ablate surface particles from thesolid mineral that are then transported in a stream of argon
1510 KELLEY ET AL.
0361-0128/98/000/000-00 $6.00 1510
the abundances and relative amounts of metals in the fluids and the resulting sulfide chemistry. Textural ob-servations and isotopic data show that preexisting barite was reductively dissolved, providing a source of H2Sfor sulfide mineral formation. In stage 3, the continued flow of hydrothermal fluids caused thermal alter-ation of organic-rich mudstones and a build-up of methane that led to fluid overpressuring, hydrofracturing,and vein formation. Barite, red-brown sphalerite, and other sulfides were deposited in the veins, and preex-isting barite was pervasively replaced by red-brown sphalerite. Hydrothermal activity ceased until Jurassictime when thrusting and large-scale fluid flow related to the Brookian orogeny remobilized and formed latetan sphalerite in tectonic breccias.
500 m
552
492
557827
563551
19
Main Deposit
Aqqaluk Deposit
Paalaaq Deposit
Qanaiyaq Deposit
A A'
478950-9
975-1A
Red Dog
River
0 10 Km
163˚30'
CHUKCHI SEA
Wulik
68˚00'
Su-LikALASKAAnarraaq
949
954
162˚50'
surface exposure
Explanationdrill hole
875-6
900-ms2598-SM925
948
668
707
640
925-3
546
68˚05'
FIG. 1. Map showing the four deposits at Red Dog with locations of sam-ples collected from surface exposures and drill holes. Cross section A-A'across the Aqqaluk deposit is shown in Figure 3. Inset shows relationship ofthe Red Dog deposits to other deposits in the district.

gas to an inductively coupled argon plasma where they are va-porized, dissociated, and ionized. The ions, dominated bysingly charged species, are extracted from the plasma andseparated according to their mass-to-charge ratio using aquadruple mass spectrometer.
A spot size of 50 µm was chosen for the analyses and usedfor all sulfide minerals to provide consistency in the data. Al-though care was taken to choose analytical points free of sur-ficial mineral inclusions, the depth of penetration of the laserbeam (ca. 5–10 µm) makes the incorporation of small inclu-sions possible. However, the software program used to reducethe data allows the user to include only specific portions ofthe total spectra generated by the analyses; therefore, thoseparts of the spectra that were obviously produced by submi-croscopic inclusions were identified and excluded during datareduction. The results of the analyses were calibrated usingeither a glass or a synthetic sulfide standard developed byWilson et al. (2002). Precision of the technique is about 2 to8 percent (Ridley, 2000; Norman et al., 2003). Details of themethod and detection limits are included in Ridley andLichte (1998) and Ridley (2000).
Prior to LA-ICP-MS analysis, many samples were indepen-dently analyzed for major and minor elements using the elec-tron microprobe (EMP). This allowed a determination of thelevel of heterogeneity of the samples and provided a crosscheckon some of the elements analyzed by the LA-ICP-MS method.
Secondary ionization mass spectrometry
Sulfur isotope compositions of pyrite, galena, and sphaleritewere measured in situ using a CAMECA ims 4f ion micro-probe at Oak Ridge National Laboratories in Oak Ridge, Ten-nessee. The analytical protocol for S isotope measurements issimilar to that described by Riciputi (1996). Sulfur isotope ra-tios (34S/32S) from sulfides were measured using a Cs+ primarybeam. A normal-incidence flood gun was employed to neutral-ize potential sample charging. The primary ion beam was fo-cused to a 15 × 30 µm spot using a 100 µm aperture in the pri-mary column. Secondary sulfur ions were detected sequentiallyby switching the magnetic field. The detection system (Balzerselectron multiplier) was coupled with an ion counting systemwith an overall dead time of 8.5 ns. A typical analysis lasts ~12min, comprising 100 analysis cycles (Riciputi et al., 1998).
During the isotope measurement by ion microprobe, an in-trinsic mass dependent bias (referred to as instrumental massfractionation) is introduced. A variety of processes combine toproduce this fractionation, including secondary atom extrac-tion (sputtering) and ionization (e.g., Williams, 1979; Yu andLang, 1986) and secondary ion transmission (Shimizu andHart, 1982; Valley and Graham, 1991). The greatest contrib-utors to instrumental mass fractionation are sputtering andionization, which depend most strongly on sample composi-tion, referred to as compositionally dependent fractionationsor matrix effects (e.g., Valley et al., 1997). Correction for thismass fractionation is done by comparing measurements of achemically and isotopically homogeneous mineral standardthat is chemically similar to the unknown sample. Ion micro-probe results for the standard are compared with its acceptedisotopic composition in order to compute a correction factorthat is applied to the unknowns measured during the sameanalysis session (e.g., Leshin et al., 1998). Standards used in
this study are Balmat sphalerite (14.0‰ CDT), Balmat pyrite(14.6‰ CDT), and Balmat galena (15.6‰ CDT) from theBalmat mine, New York (Crowe and Vaughan, 1996).
The precision and accuracy of analyses include errors aris-ing from counting statistics, calibration to a known standard,and uncertainty in dead-time corrections owing to variablecount rates. In general, the overall analytical precision for thesulfides is ±0.8 per mil. Values are reported in standard nota-tion relative to Cañon Diablo Troilite (CDT).
Geology of the Red Dog Deposits
Basin setting and age
The Red Dog Zn-Pb-Ag strata-bound massive sulfide bod-ies are hosted by black shale and mudstone of the Mississip-pian Kuna Formation. Subduction during the Jurassic to Cre-taceous Brookian orogeny resulted in a complex structuralsetting consisting of multiple, fault-bounded and age-equiva-lent allochthons (Mull, 1982; Mayfield et al., 1988). In thesouthern Brooks Range, the rocks were metamorphosed toblueshist and greenschist facies (informally called the schistbelt), whereas in the north (foothills of the Brooks Rangewhere Red Dog is located) they are primarily folded unmeta-morphosed to weakly metamorphosed sedimentary rocks(Moore et al., 1994). Paleogeographic reconstructions suggestthat mineralization occurred along a passive continental mar-gin in a Carboniferous basin containing calcareous turbidite,mudstone, and shale of the Kuna Formation (Dumoulin etal., 2004; Young, 2004) and overlying conglomerates andsandstones of Late Devonian to Early Mississippian age. Vol-umetrically minor alkali basalts and felsic volcanic and intru-sive rocks in the Kuna Formation are present both regionallyand locally in the Red Dog area (Moore et al., 1986; Werdon,1996). The entire succession of Upper Devonian-Carbonifer-ous sedimentary strata (clastic rocks and overlying shale-car-bonate sequence) in the Red Dog area is less than 1 km thick(Young, 2004), but about 200 km to the east the sedimentarypackage is nearly 4 km thick (Mull and Werdon, 1994).
The ore deposits are restricted to the uppermost unit, in-formally named the Ikalukrok unit, of the Kuna Formation(Mull et al., 1982). The upper Ikalukrok, which hosts the de-posits, is late Meramecian to early Chesterian in age (about340 to 330 Ma; Harland et al., 1990) on the basis of conodontsand radiolarians (Dumoulin et al., 2004). The age of Red Dogore is constrained by Re-Os dating of hydrothermal pyrite,which yields an isochron age of 338 ± 5.8 Ma (Morelli et al.,2004). The Ikalukrok unit, which is 30 to 240 m thick in thedistrict (Dumoulin et al., 2004), consists of finely laminated,black, siliceous and carbonaceous shale and mudstone withlocally abundant carbonate turbidites. Deposition of theKuna Formation took place in a basin and slope setting char-acterized by anoxic or dysaerobic bottom waters and by highproductivity of organic matter possibly related to local up-welling (Slack et al., 2004a). The locally abundant calcareousturbidite layers (2 cm to >4 m thick) were derived by erosionof carbonate platforms that flanked the basin (Dumoulin etal., 2004). On the basis of the presence of minor alkali basaltsand regional Carboniferous tectonic relationships, the basin isinferred to have been of extensional origin (Young, 2004).Deposition of the upper Kuna Formation during late
SULFIDE MINERALOGY AND GEOCHEMISTRY OF THE RED DOG DEPOSITS 1511
0361-0128/98/000/000-00 $6.00 1511
Meramecian time coincided with very sharp reductions insedimentation rates owing to the drowning of adjacent plat-forms and the end of carbonate deposition in the basin (Du-moulin et al., 2004). Rifting and tectonic subsidence andflooding of cold upwelling currents from the Kuna basin ontoadjacent carbonate platforms may have been factors in thedemise of these platforms (Dumoulin et al., 2004).
Ore deposit stratigraphy and zoning
All sulfide ore is hosted by Ikalukrok shale and mudstone ofthe uppermost Kuna Formation (Figs. 2 and 3). Base-metal
sulfide minerals are present in only minor amounts in the un-derlying calcareous shale (informally named the Kivalinaunit). All four Red Dog deposits have similar ore assem-blages, degree of silicification, and host-rock lithology, butsome of the primary characteristics have been obscured bypostmineralization deformation during the Jurassic to Creta-ceous Brookian orogeny. The deposits are structurally sepa-rated, and the Qanaiyaq, Main, Aqqaluk, and Paalaaq ore-bodies lie in distinct thrust panels within an overall duplexstructure (Jennings and King, 2002). The result is a series ofstacked orebodies, in which each deposit lies at successively
1512 KELLEY ET AL.
0361-0128/98/000/000-00 $6.00 1512
Qanaiyaq Main Aqqaluk Paalaaq
600 m
S N
Orebody
Kuna Fm Structural hangingwall
Structural footwall
Orebody thickness
Amount of layered/banded ore
Degree of brecciation
Average Fe content
Cu content
Zn/
Pb
Average Pb and Zn grade
HIGH
LOW
Zn/
Fe
60 m 175 m
rare to absent present
lowhigh
>10%
Up to 0.1% or higher low
7.5%
(Pb) 5.5%(Zn) 17.8%
(Pb) < 3.65%(Zn) < 13.7%
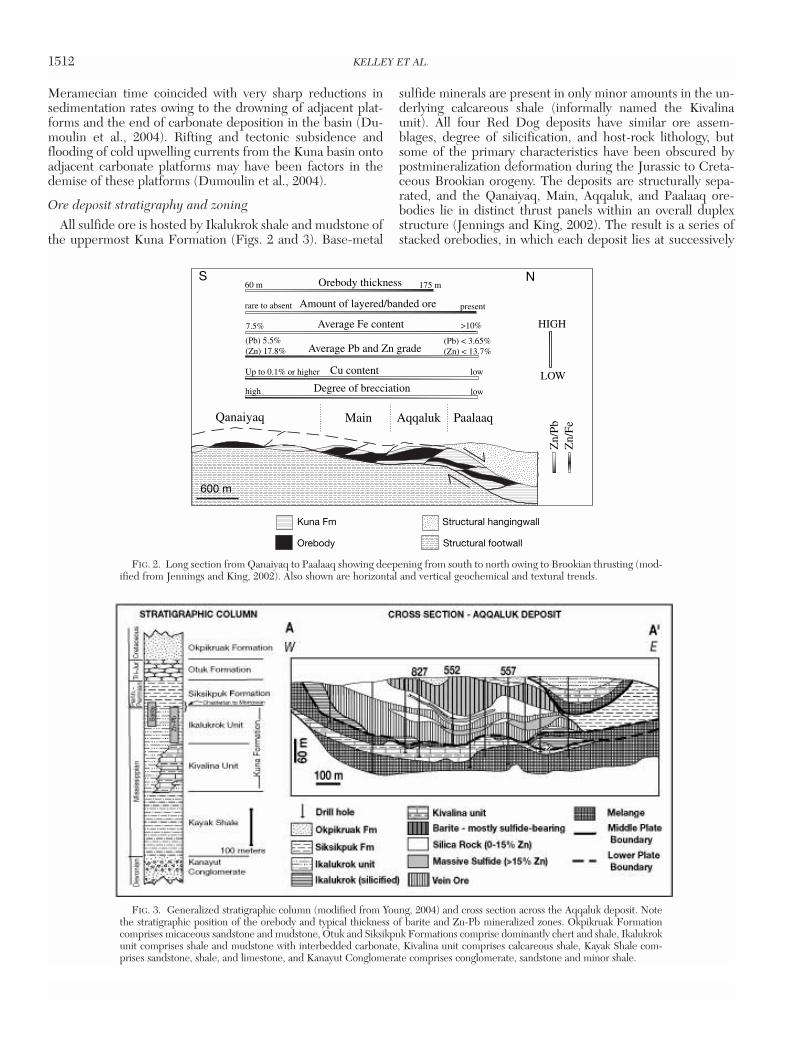
FIG. 2. Long section from Qanaiyaq to Paalaaq showing deepening from south to north owing to Brookian thrusting (mod-ified from Jennings and King, 2002). Also shown are horizontal and vertical geochemical and textural trends.
FIG. 3. Generalized stratigraphic column (modified from Young, 2004) and cross section across the Aqqaluk deposit. Notethe stratigraphic position of the orebody and typical thickness of barite and Zn-Pb mineralized zones. Okpikruak Formationcomprises micaceous sandstone and mudstone, Otuk and Siksikpuk Formations comprise dominantly chert and shale, Ikalukrokunit comprises shale and mudstone with interbedded carbonate, Kivalina unit comprises calcareous shale, Kayak Shale com-prises sandstone, shale, and limestone, and Kanayut Conglomerate comprises conglomerate, sandstone and minor shale.

greater depths from south to north (Fig. 2). The degree of de-formation and faulting, particularly in the Main and Paalaaqdeposits, makes reconstruction of the original deposit config-uration difficult. However, Aqqaluk displays a relatively con-tinuous, less structurally disrupted section compared with theother deposits.
From the top down, the ore deposits are characterized by(1) sulfide-poor barite, (2) sulfide-bearing barite, (3) silicarock or silicified barite, (4) massive sulfide, and (5) sulfide-veins of the Ikalukrok unit (Fig. 3). These ore types have beenthoroughly described by Moore et al. (1986) and Sims (1996)and are only briefly discussed here. Sulfide-poor barite is pre-sent at the top of each deposit at the contact between theIkalukrok unit and the Siksikpuk Formation, which occupiesa stratigraphic position of Chesterian to Morrowan (Late Mis-sissippian to Early Pennsylvanian), on the basis of conodontand radiolarian ages in the Red Dog area (Dumoulin et al.,2004). Sulfide-poor barite is white to light gray, fine-grained,and commonly well bedded (Moore et al., 1986). Sulfide-bearing barite is characterized by two distinct textural types:white to gray, fine-grained (10–50 µm) equigranular grains in-tergrown with sulfides, and white, coarse-grained (up to 3cm) crystals with interstitial sulfides. Although rare, iron orother base-metal sulfides crudely interlayered with bariteare locally present, particularly in the Aqqaluk and Paalaaqdeposits.
The term silica rock is applied to strongly silicified barite(Sims, 1996; Leach et al., 2004); it consists of a white totranslucent gray rock composed of mostly medium-grained,zoned euhedral quartz. Massive sulfide (Fig. 3) has greaterthan 40 wt percent sulfide minerals and includes both semi-massive and massive sulfide ore as described by Moore et al.(1986) and Young (1989). Rare banded sulfides in shale havebeen observed, mainly at Aqqaluk and Paalaaq. Most of theore is massive and unbedded, consisting of abundant sulfidegrains and aggregates disseminated in a dense silica matrix.Fragmental textures also are present in massive sulfide ore.
Although sulfide veins are present in all of the deposits,they are most abundant and consistently developed atAqqaluk, where they are found at the base and periphery andless commonly in the center of the deposit. The veins typi-cally cut silicified black shale of the Ikalukrok unit, silica rock,and massive sulfide ore but are absent in sulfide-bearingbarite. The veins are steeply dipping, trend north-northeast(Moore et al., 1986), and vary in width from 1 mm to onemeter. Vein density can be high enough to constitute bulk oregrade zones. Coarse, angular, sulfide-cemented breccias re-lated to the main mineralizing system are particularly well de-veloped near areas of intense veining, but they also are pre-sent throughout the deposits (Moore et al., 1986).
Other breccias consist of very fine grained, light-tan spha-lerite and silica enclosing angular fragments of host rocks andclasts of vein sulfide. These breccias have not been describedpreviously at Red Dog, but they cut all rock types and henceformed late in the history of the deposits. The breccia bodiesor masses generally display shallow dips consistent with dipsof thrust faults in the region and contrasting with the steeplydipping veins.
Proportions of the total tonnage contributed by the differ-ent ore types are estimated from mine statistics for the Main
deposit. About 20 percent of the tonnage being mined is fromsulfide-bearing barite, 58 percent is from massive sulfide, and21 percent is from vein ore (T. Krolak, writ. commun., 2002).Similar percentages are calculated from resources and re-serves at Aqqaluk.
Although all four deposits display a similar sequence of oretypes from top to bottom, differences exist in orebody thick-ness, proportion of ore types and styles, and average gradefrom south to north (Fig. 2). Estimates of prethrusting thick-nesses of combined barite and sulfides suggest that Qanaiyaqis thinner than Aqqaluk (Edgerton, 1997), which in turn isthicker than Paalaaq (T. Krolak, writ. commun., 2002).Qanaiyaq is approximately 60 m thick, the Main deposit is 90to 120 m thick, and Aqqaluk (Fig. 3) is 175 m thick. Paalaaqhas not been extensively drilled, but estimates suggest theoriginal thickness was 20 to 30 m, although some intervalsmay have been 100 m thick.
In addition to thickness variations, there are differencesin the proportions of ore types. The amount of brecciationdecreases and the layered or banded sulfides increase inabundance from south to north (Fig. 2). Massive sulfidebreccias and late breccias composed of tan sphalerite areprevalent in Qanaiyaq and the Main deposit but are rarelyobserved in Aqqaluk or Paalaaq. In contrast, layered orbanded sulfides in barite or shale appear to be absent inQanaiyaq and are rarely and erratically distributed in theMain deposit, but they are abundant in parts of the Aqqalukand Paalaaq deposits.
Among the four Red Dog deposits, there is an apparentgeochemical zoning (Fig. 2). Qanaiyaq and the Main deposithave higher average Pb and Zn grades than Aqqaluk andPaalaaq. Qanaiyaq averages 17.8 percent Zn and 5.5 percentPb, the Main deposit has average grades of 19.5 percent Znand 5.3 percent Pb, and Aqqaluk has 13.7 percent Zn and 3.6percent Pb. On the basis of available drilling, Paalaaq isslightly lower grade than Aqqaluk. Copper concentrationsreach >0.1 percent in Qanaiyaq but are much lower in theother deposits, whereas iron increases from south to north.Qanaiyaq averages 7.5 percent Fe, the Main deposit contains7.9 percent Fe, Aqqaluk has close to 8.5 percent Fe, andPaalaaq contains more than 10 percent Fe (T. Krolak, pers.commun., 2002).
Vertical geochemical zoning in the deposits is evident fromvariations in Zn/Fe and Zn/Pb ratios for the Main deposit(Sims, 1996) and Aqqaluk (T. Krolak, writ. commun., 2003)(Fig. 2). The Zn/Fe ratios increase from sulfide-bearing bariteto “regular” massive sulfide ore (excluding irregularly distrib-uted Fe-rich portions) and decrease in basal vein ore. Aver-age Zn/Fe ratios for sulfide-bearing barite for both the Mainand Aqqaluk deposits combined are 2.6, massive sulfide oreaverages 4.0, and vein ore averages 1.5. The Zn/Pb ratio in-creases from top to bottom, with an average Zn/Pb ratio of 3in the sulfide-bearing barite, 4.4 in the massive sulfide ore,and 4.5 in the vein ore. The vertical geochemical variationsmay reflect changes in the overall abundances of ore miner-als, or alternatively, they could reflect the chemical composi-tion of the sulfides. For example, there is a greater abundanceof iron sulfide in vein ore compared with regular massive sul-fide ore, and sphalerite in vein ore is Fe rich compared withthat in other ore types (discussed below).
SULFIDE MINERALOGY AND GEOCHEMISTRY OF THE RED DOG DEPOSITS 1513
0361-0128/98/000/000-00 $6.00 1513

Mineralogy, Textural Variations, and ParagenesisA paragenetic sequence for the Red Dog deposits (Fig. 4)
was developed from drill core, hand specimens, and thin sec-tion samples (Figs. 5 and 6). The stages are defined primarilyby sphalerite type and summarized as follows: (1) early depo-sition of barite, early brown sphalerite, pyrite, and minorgalena on or immediately beneath the sea floor; (2) hy-drothermal recrystallization of previously formed barite anddeposition of yellow-brown sphalerite; (3) deposition ofbarite, red-brown sphalerite and other sulfides in open spaceveins and coeval replacement of barite; and (4) late-stage, po-store formation of late tan sphalerite breccias (Fig. 4) and de-position of minor barite, pyrite, witherite, and calcite in lateveins and open vugs.
Sulfides deposited during the four stages are texturally dis-tinct, and sphalerite exhibits marked compositional differ-ences between stages. Stage 1 and 4 sulfides are volumetri-cally minor, whereas stages 2 and 3 form the bulk of the ore(Fig. 4). Silica is a major constituent of the ore deposits andadjacent wall rocks. The timing of silicification remains con-troversial. Slack et al. (2004b) suggest that some silica in andaround the orebodies was introduced with the metal-bearingore fluid (just prior to or with stage 2 fluids), whereas Leachet al. (2004) suggest that the majority of the silica was de-posited after main stage mineralization. The focus of thispaper is on the barite and sulfide minerals.
Stage 1
Fine- to medium-grained barite (± sulfides) is typically ob-served at the stratigraphic top of the deposits in black mud-stone or shale (Fig. 3). The distribution of this assemblagemay have been more extensive, but main-stage sulfide miner-alization (described below) and postore silicification (Leachet al., 2004) have obscured the original distribution.
Sulfide minerals that coprecipitated with early barite in-clude dark- to light-brown sphalerite, minor pyrite, and tracesof galena (Fig. 4). On a deposit scale, brown sphalerite is vol-umetrically minor. However, it is the dominant sulfide in thestage 1 assemblage. In all thin sections containing brownsphalerite, it is present in proportions equal to barite, and it isat least twice as abundant as pyrite or galena.
Stage 1 barite is white or light gray and is present as irreg-ularly distributed crystals (up to 0.5 cm long but generallysmaller) or thin laminae in black shale or mudstone (Figs. 5A,6A), as equigranular aggregates (10–50 µm) intergrown withcolloform or dendritic brown sphalerite (Figs. 5B, 6B-E), oras irregular, discontinuous wispy layers alternating with spha-lerite (Figs. 5C, 6F). Ores containing the latter two types aregenerally free of sediment.
In samples of mudstone, compaction features and disrup-tion of laminae by barite crystals (Fig. 6A) indicate that bariteformed in unconsolidated sediment. Early barite of stage 1 iscommonly intergrown with early brown sphalerite. Colloform
1514 KELLEY ET AL.
0361-0128/98/000/000-00 $6.00 1514
Barite
MINERAL
Pyrite or marcasite
Galena
Early brown sphalerite (EBS)
Yellow-brown spalerite (YBS)
Red-brown sphalerite (RBS)
Late tan sphalerite (LTS)
STAGE 1 Early synsedimentary
TEMPERATURE 100-200˚C100-200˚C?
STAGE 2Recrystallization of barite
STAGE 3Replacement of barite and vein formation
STAGE 4Late sulfide
<<100˚C? 180-220˚C
MAIN ORE-FORMING EVENTS
Massive ore Vein ore
FIG. 4. Simplified paragenetic sequence of sulfides and barite from the Red Dog deposits. Stages are defined primarilyby sphalerite type. Temperatures for stage 3 sphalerite were determined by fluid inclusion microthermometry (Leach et al.,2004). Temperatures for other stages are estimates (see text). Solid bars represent the distribution of major minerals withina given stage; four broken bars represent minor occurrences; two broken bars represent trace occurrences. Stages 1 and 4are volumetrically minor in the deposits overall, whereas stages 2 and 3 form the bulk of the ore. Other minerals present inthe deposits, such as quartz, chalcopyrite, calcite, and witherite are not shown on the diagram but are discussed in the text.
SULFIDE MINERALOGY AND GEOCHEMISTRY OF THE RED DOG DEPOSITS 1515
0361-0128/98/000/000-00 $6.00 1515
A B
2cm
1cm
E
2cm"worm fossils"
1cm
1cm
F
approximatelocation of Figure 6G
C D
G
0.5cm
K
1cm1cm
I J
2cm
H
1cm
YBS
psuedomorphof barite
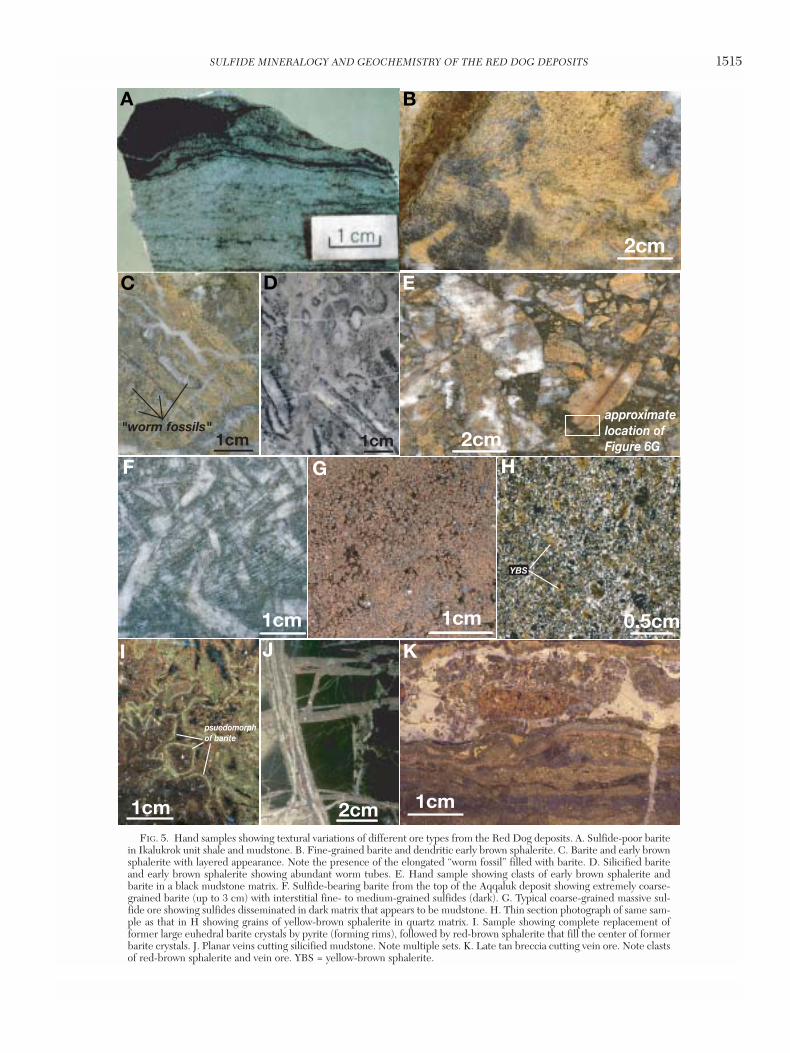
FIG. 5. Hand samples showing textural variations of different ore types from the Red Dog deposits. A. Sulfide-poor baritein Ikalukrok unit shale and mudstone. B. Fine-grained barite and dendritic early brown sphalerite. C. Barite and early brownsphalerite with layered appearance. Note the presence of the elongated “worm fossil” filled with barite. D. Silicified bariteand early brown sphalerite showing abundant worm tubes. E. Hand sample showing clasts of early brown sphalerite andbarite in a black mudstone matrix. F. Sulfide-bearing barite from the top of the Aqqaluk deposit showing extremely coarse-grained barite (up to 3 cm) with interstitial fine- to medium-grained sulfides (dark). G. Typical coarse-grained massive sul-fide ore showing sulfides disseminated in dark matrix that appears to be mudstone. H. Thin section photograph of same sam-ple as that in H showing grains of yellow-brown sphalerite in quartz matrix. I. Sample showing complete replacement offormer large euhedral barite crystals by pyrite (forming rims), followed by red-brown sphalerite that fill the center of formerbarite crystals. J. Planar veins cutting silicified mudstone. Note multiple sets. K. Late tan breccia cutting vein ore. Note clastsof red-brown sphalerite and vein ore. YBS = yellow-brown sphalerite.

1516 KELLEY ET AL.
0361-0128/98/000/000-00 $6.00 1516
50µm
D
YBS
EBS
CC
20µm
Galena
EBS
A
400µm
20µm
E
20µm
B
EBS
F
100µm
EBS
Py
G
200µmbarite clast(now qtz)
EBS
mudstone matrix (now qtz)
bitumen
200µm
I
J
100µm
bariteYBS
galena
pyrite
pyrite
galena inclusions
50µm
L
1cm
M
100µm
H
Barite displaces largesphalerite grain
100µmN
K
100µm
O100µm pyrite
galena
patch of LTS
Barite
brown sphalerite forms well-defined, micrometer-scale bandsthat alternate with bands of barite (Fig. 6B-D). Locally,brown sphalerite appears to be partially replaced by baritebecause it is present as rounded aggregates floating in a baritematrix (Fig. 6B). Minor galena is present as thin, discontinu-ous, micrometer-scale bands with sphalerite (Fig. 6C). Sub-hedral pyrite with highly irregular grain boundaries is inti-mately intergrown with barite and sphalerite (Fig. 6D). Someof these pyrite grains enclose brown sphalerite or barite.
A more common form of early brown sphalerite is dendriticintergrowths with barite (Fig. 6E). As with the colloform va-riety, the dendritic sphalerite is typically observed in unsilici-fied barite. Barite and sphalerite are equigranular and fine-grained, averaging about 10 to 50 µm, but locally grainscoalesce to form patches that are 100 µm in size. Dendritictextures are interpreted as having formed by rapid coprecipi-tation from supersaturated solutions that limits growth oflarge crystals (cf. Naslund et al, 1984; Frisia et al., 2000).
In the northwest portion of Aqqaluk and in Paalaaq, bariteand early brown sphalerite display a crude layering in handsamples (Fig. 5C). Examination of thin sections reveals mini-mal layering, but there is a discontinuous alignment of earlybrown sphalerite (Fig. 6F). In some of these samples, struc-tures referred to as “worm fossils” are a notable feature (Fig.5C-D). These structures are cylindrical with dimensions of afew millimeters wide and up to 10 cm long. Moore et al.(1986) interpreted them to be fossil remnants of a vent-spe-cific fauna analogous to modern sea-floor tube worms (Mooreet al., 1986). More recent work suggests that the structuresare tube walls, now composed of quartz, but originally se-creted by annelid-like organisms that lived in a variety of set-tings within the Kuna basin (Anderson et al., in prep.). Wormtubes are most commonly observed in silica rock (silicifiedsulfide-bearing barite; Fig. 5D), probably because silicifica-tion sharpens the contrast between the wall and center of thestructure.
The textural evidence from Red Dog is permissive for for-mation of early barite and sulfides on or immediately belowthe sea floor. Compaction of surrounding mudstone and
disruption of mudstone laminae by some barite crystals (Fig.6A) are evidence that barite formed during sedimentationand before lithification of the sediments. At least some of thesediment-free massive and irregular accumulations of fine-grained barite and sulfides may have formed in the water col-umn above the sediment-seawater interface, although tex-tural evidence to evaluate this is lacking, owing to thewidespread silicification of barite at Red Dog. One drill holethrough the Aqqaluk deposit intersected a breccia that con-sists of what appear to be subangular to angular clasts of earlybrown sphalerite and barite in a black mudstone matrix (Fig.5E). However, in thin section the sample is so thoroughly sili-cified that any original primary textures have been obliterated(Fig. 6G). One possibility for the origin of the brecciated tex-ture is that it formed by slumping of barite and sphalerite intoa baritic mud on the sea floor. Alternatively, its origin may besimilar to breccias in modern sediment-hosted sea-floor sul-fide deposits (e.g., Middle Valley: Ames et al., 1993) that formby collapse of a mound through dissolution or replacement ofanhydrite. Replacement of carbonate is another possibility.
Stage 2
Precipitation of early brown sphalerite was followed by yel-low-brown sphalerite and the beginning of main-stage oreformation. Evidence for the relative timing includes crosscut-ting relationships and overgrowths of yellow-brown sphaleriteon early brown sphalerite (Fig. 6D). Yellow brown sphaleriteis volumetrically the most significant sulfide in the Red Dogdeposits and is the dominant sulfide mineral in sulfide-bear-ing barite, silica rock (silicified sulfide-bearing barite), andmassive sulfide ore. Together these ore types make up about78 percent of the total tonnage being mined.
Yellow-brown sphalerite and other sulfide minerals are pre-sent interstitial to sulfide-bearing barite (Figs. 5F, 6H-J). Incontrast to the early barite, the barite associated with yellow-brown sphalerite is white and extremely coarse grained withindividual crystals forming euhedral prisms up to 3 cm long(Fig. 5F). Sulfide grain sizes range from 50 to 200 µm. Yel-low-brown sphalerite crystals are typically elongate and have
SULFIDE MINERALOGY AND GEOCHEMISTRY OF THE RED DOG DEPOSITS 1517
0361-0128/98/000/000-00 $6.00 1517
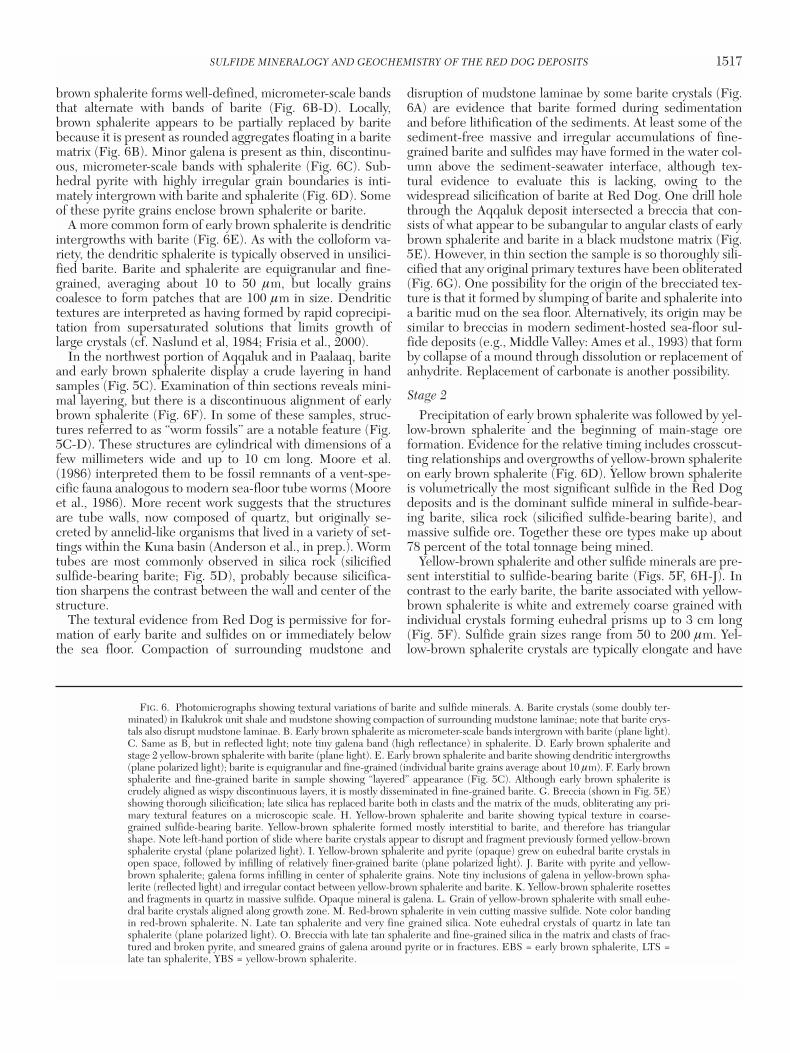
FIG. 6. Photomicrographs showing textural variations of barite and sulfide minerals. A. Barite crystals (some doubly ter-minated) in Ikalukrok unit shale and mudstone showing compaction of surrounding mudstone laminae; note that barite crys-tals also disrupt mudstone laminae. B. Early brown sphalerite as micrometer-scale bands intergrown with barite (plane light).C. Same as B, but in reflected light; note tiny galena band (high reflectance) in sphalerite. D. Early brown sphalerite andstage 2 yellow-brown sphalerite with barite (plane light). E. Early brown sphalerite and barite showing dendritic intergrowths(plane polarized light); barite is equigranular and fine-grained (individual barite grains average about 10 µm). F. Early brownsphalerite and fine-grained barite in sample showing “layered” appearance (Fig. 5C). Although early brown sphalerite iscrudely aligned as wispy discontinuous layers, it is mostly disseminated in fine-grained barite. G. Breccia (shown in Fig. 5E)showing thorough silicification; late silica has replaced barite both in clasts and the matrix of the muds, obliterating any pri-mary textural features on a microscopic scale. H. Yellow-brown sphalerite and barite showing typical texture in coarse-grained sulfide-bearing barite. Yellow-brown sphalerite formed mostly interstitial to barite, and therefore has triangularshape. Note left-hand portion of slide where barite crystals appear to disrupt and fragment previously formed yellow-brownsphalerite crystal (plane polarized light). I. Yellow-brown sphalerite and pyrite (opaque) grew on euhedral barite crystals inopen space, followed by infilling of relatively finer-grained barite (plane polarized light). J. Barite with pyrite and yellow-brown sphalerite; galena forms infilling in center of sphalerite grains. Note tiny inclusions of galena in yellow-brown spha-lerite (reflected light) and irregular contact between yellow-brown sphalerite and barite. K. Yellow-brown sphalerite rosettesand fragments in quartz in massive sulfide. Opaque mineral is galena. L. Grain of yellow-brown sphalerite with small euhe-dral barite crystals aligned along growth zone. M. Red-brown sphalerite in vein cutting massive sulfide. Note color bandingin red-brown sphalerite. N. Late tan sphalerite and very fine grained silica. Note euhedral crystals of quartz in late tansphalerite (plane polarized light). O. Breccia with late tan sphalerite and fine-grained silica in the matrix and clasts of frac-tured and broken pyrite, and smeared grains of galena around pyrite or in fractures. EBS = early brown sphalerite, LTS =late tan sphalerite, YBS = yellow-brown sphalerite.

triangular shapes as a result of having formed interstitial to, oras epitaxial growths on, large barite crystals (Fig. 6H-I).Abundant textural evidence suggests that, like early brownsphalerite, precipitation of yellow-brown sphalerite over-lapped and alternated with deposition of barite. The growthof large barite blades disrupted, relocated, and fragmentedsphalerite crystals that had previously formed or were form-ing during barite growth (Fig. 6H). In some samples, yellow-brown sphalerite and other sulfides grew on previouslyformed euhedral barite crystals in what appears to have beenopen space, followed by infilling of relatively finer-grainedbarite (Fig. 6I). Locally, irregular grain boundaries betweenbarite and yellow-brown sphalerite (Fig. 6I-J) suggest thatyellow-brown sphalerite partially replaced barite.
Intergrowths and inclusions of galena in yellow-brownsphalerite are common features of stage 2 (Fig. 6J). Pyrite isanhedral to euhedral and free of sphalerite or barite inclu-sions. Where pyrite is present, the typical sequence of depo-sition was pyrite followed by yellow-brown sphalerite andthen galena.
Yellow-brown sphalerite, galena, and pyrite are present asdisseminated 50- to 200-µm grains in massive sulfide orebelow sulfide-bearing barite (Figs. 5G-H, 6K-L). As in sul-fide-bearing barite, yellow-brown sphalerite is commonly in-tergrown with galena. In hand samples, the sulfide grains ap-pear disseminated in black mudstone (Fig. 5G), but thinsection examination reveals a dense silica matrix (Fig. 6K-L).Petrographic and fluid inclusion studies show that the silica inthese rocks replaced preexisting barite (Leach et al., 2004).Thus, prior to silica introduction, most massive sulfide origi-nally consisted of barite and sulfide minerals. The presence ofsmall euhedral barite crystals aligned along sphalerite growthzones is direct evidence of sulfide and barite coprecipitationduring formation of massive sulfide (Fig. 6L).
Massive sulfide ore is locally fragmental or clastic in ap-pearance (Fig. 5H) and has been interpreted by previousworkers as having formed in situ by “invasions of growthzoned crustiform sphalerite that disrupted the rock” (Mooreet al., 1986), by sedimentary processes (Moore et al., 1986;Edgerton, 1997), or through brecciation (Edgerton, 1997).Some yellow-brown sphalerite in massive sulfide ore appearsto be angular and broken fragments of originally larger grains(Fig. 6K), and many fragments show a strong resemblance toyellow-brown sphalerite grains in sulfide-bearing barite (Fig.6H). For example, the elongate fragment in the center of Fig-ure 6K may have been sphalerite and galena that originallygrew on or interstitial to barite. Thus, some of the fragmenta-tion probably occurred during stage 2 barite crystal growthwhere preexisting grains of yellow-brown sphalerite were dis-rupted. However, because fragmental textures are mostprevalent in massive sulfide ore (i.e., silicified barite and sul-fides), it is probable that late silicification also contributed tothe fragmental textures (Leach et al., 2004).
Stage 3
Coarse-grained, red-brown sphalerite marks stage 3 or thelate main ore stage (Fig. 4). Red-brown sphalerite replacesbarite and also is present in vein ore, which constitutesabout 21 percent of the total tonnage mined. The mineral-ogy of the veins consists of barite, red-brown sphalerite,
pyrite, marcasite, galena, calcite, growth zoned quartz, andchalcedonic silica.
Red-brown sphalerite was deposited after coarse barite(stage 2), and red-brown sphalerite pseudomorphs afterbarite are up to 2 cm long (Fig. 5I). Red-brown sphalerite alsois present in veins and spatially associated breccias that cutsilicified shale or mudstone (Fig. 5J), silica rock (preexistingsulfide-bearing barite), and massive sulfide ore (Fig. 6M).Multiple episodes of polymetallic veining with red-brownsphalerite are evident (Fig. 5J). The veins of sphalerite exhibitcolor variation (Fig. 6M) that corresponds with compositionalzonation (discussed below). Colors range from nearly color-less to yellow to orange to dark red. Red-brown sphaleritetypically contains abundant pyrite inclusions with rare minuteinclusions of pyrrhotite, chalcopyrite and tetrahedrite.
The light-dark zonation of red-brown sphalerite sometimesparallels the vein walls, but banding of individual sphaleritegrains and symmetry of color banding in the veins is not uni-form. Dark-colored sphalerite predating light-colored spha-lerite and light-colored sphalerite predating dark sphaleriteare equally common. Optically continuous sphalerite crystalstransgress the color zones, suggesting some recrystallizationoccurred after deposition. Subordinate coarse-grained pyrite,marcasite, and galena also form bands parallel to vein walls(Fig. 5J), but the order in which these minerals are foundfrom wall to center within the veins is not consistent.
The dominant gangue mineral associated with stage 3 veinsis quartz; barite and calcite are volumetrically minor. Quartzand barite form infillings in the center of the veins but alsoare present along vein margins (Moore et al., 1986). Most ofthe quartz is white and distinctly zoned (Leach et al., 2004).Strikingly different, minor gray-blue chalcedonic quartz ispresent in the centers of some veins (Slack et al., 2004b). Pet-rographic observation using cathodoluminescence and thescanning electron microscope indicate that much of thegrowth-zoned quartz in the veins replaced preexisting barite,whereas the chalcedonic quartz may have been depositedcontemporaneously with sulfides (Slack et al., 2004b).
Stage 4
Late tan sphalerite defines stage 4 (Fig. 4), which is repre-sented exclusively in 1- to 10-cm wide breccias (Fig. 5K) thatcut all rock and ore types. The breccias are present predomi-nantly in the Qanaiyaq and Main deposits and less commonlyin the Aqqaluk deposit; they have not been described at otherdeposits in the district. Although they are economically in-significant and not mappable as separate units, they do markthe last mineralizing event in the Red Dog deposits. Late tansphalerite is present with silica in the matrix of the breccias.Although patches (up to 100 µm) of nearly pure late tan spha-lerite are present locally, the matrix typically consists of finelyintergrown late tan sphalerite and silica (Fig. 6N-O). In somethin sections, subhedral to euhedral quartz crystals enclosedin patches of sphalerite (Fig. 6N) and trains of sphaleritegrains along growth zones within individual quartz crystalssuggest coeval deposition of sphalerite and silica.
Clasts in the breccias are composed of earlier-formed veinminerals and silicified shale (Fig. 5K). Pyrite is present asfractured and broken grains, whereas galena is plastically de-formed into irregular fractures (Fig. 6O). Galena in these late
1518 KELLEY ET AL.
0361-0128/98/000/000-00 $6.00 1518
breccias also displays curved cleavages. The overall fine grainsize of the sulfides (especially sphalerite) and deformationstyles of pyrite and galena suggest that the breccias formed bycataclastic tectonic processes like those described by Marshallet al. (2000), most likely at the onset of Brookian orogenesisor metamorphism at about 190 to 170 Ma (Moore et al., 1994;Rombach and Layer, 2004). If the breccias are Brookian, theyformed more than 100 m.y. after the main stage of Zn-Pbmineralization.
Minor barite, calcite, and witherite veins cut earlier bariteat Red Dog, and euhedral pyrite and barite are present withgrowth-zoned quartz in late vugs and veinlets throughout thedeposit. Witherite is characterized by consistently low δ18Ovalues that were interpreted by Leventhal et al. (2002) to in-dicate precipitation from meteoric water sometime after theZn-Pb mineralization. White mica associated with quartz andpyrite in a vug from the Main deposit yields a 40Ar/39Ar age of126.1 ± 0.7 Ma, suggesting that these minerals formed duringthe Brookian orogeny (Rombach and Layer, 2004).
Trace Elements in Sphalerite and Pyrite
Sphalerite
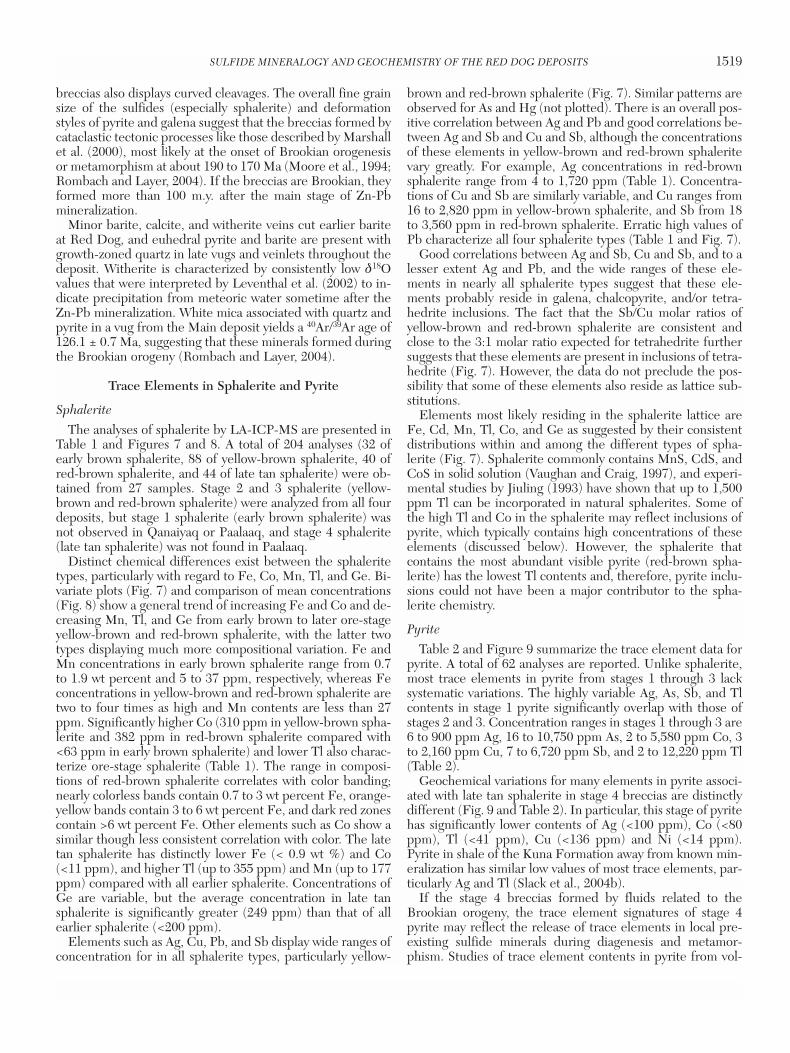
The analyses of sphalerite by LA-ICP-MS are presented inTable 1 and Figures 7 and 8. A total of 204 analyses (32 ofearly brown sphalerite, 88 of yellow-brown sphalerite, 40 ofred-brown sphalerite, and 44 of late tan sphalerite) were ob-tained from 27 samples. Stage 2 and 3 sphalerite (yellow-brown and red-brown sphalerite) were analyzed from all fourdeposits, but stage 1 sphalerite (early brown sphalerite) wasnot observed in Qanaiyaq or Paalaaq, and stage 4 sphalerite(late tan sphalerite) was not found in Paalaaq.
Distinct chemical differences exist between the sphaleritetypes, particularly with regard to Fe, Co, Mn, Tl, and Ge. Bi-variate plots (Fig. 7) and comparison of mean concentrations(Fig. 8) show a general trend of increasing Fe and Co and de-creasing Mn, Tl, and Ge from early brown to later ore-stageyellow-brown and red-brown sphalerite, with the latter twotypes displaying much more compositional variation. Fe andMn concentrations in early brown sphalerite range from 0.7to 1.9 wt percent and 5 to 37 ppm, respectively, whereas Feconcentrations in yellow-brown and red-brown sphalerite aretwo to four times as high and Mn contents are less than 27ppm. Significantly higher Co (310 ppm in yellow-brown spha-lerite and 382 ppm in red-brown sphalerite compared with<63 ppm in early brown sphalerite) and lower Tl also charac-terize ore-stage sphalerite (Table 1). The range in composi-tions of red-brown sphalerite correlates with color banding;nearly colorless bands contain 0.7 to 3 wt percent Fe, orange-yellow bands contain 3 to 6 wt percent Fe, and dark red zonescontain >6 wt percent Fe. Other elements such as Co show asimilar though less consistent correlation with color. The latetan sphalerite has distinctly lower Fe (< 0.9 wt %) and Co(<11 ppm), and higher Tl (up to 355 ppm) and Mn (up to 177ppm) compared with all earlier sphalerite. Concentrations ofGe are variable, but the average concentration in late tansphalerite is significantly greater (249 ppm) than that of allearlier sphalerite (<200 ppm).
Elements such as Ag, Cu, Pb, and Sb display wide ranges ofconcentration for in all sphalerite types, particularly yellow-
brown and red-brown sphalerite (Fig. 7). Similar patterns areobserved for As and Hg (not plotted). There is an overall pos-itive correlation between Ag and Pb and good correlations be-tween Ag and Sb and Cu and Sb, although the concentrationsof these elements in yellow-brown and red-brown sphaleritevary greatly. For example, Ag concentrations in red-brownsphalerite range from 4 to 1,720 ppm (Table 1). Concentra-tions of Cu and Sb are similarly variable, and Cu ranges from16 to 2,820 ppm in yellow-brown sphalerite, and Sb from 18to 3,560 ppm in red-brown sphalerite. Erratic high values ofPb characterize all four sphalerite types (Table 1 and Fig. 7).
Good correlations between Ag and Sb, Cu and Sb, and to alesser extent Ag and Pb, and the wide ranges of these ele-ments in nearly all sphalerite types suggest that these ele-ments probably reside in galena, chalcopyrite, and/or tetra-hedrite inclusions. The fact that the Sb/Cu molar ratios ofyellow-brown and red-brown sphalerite are consistent andclose to the 3:1 molar ratio expected for tetrahedrite furthersuggests that these elements are present in inclusions of tetra-hedrite (Fig. 7). However, the data do not preclude the pos-sibility that some of these elements also reside as lattice sub-stitutions.
Elements most likely residing in the sphalerite lattice areFe, Cd, Mn, Tl, Co, and Ge as suggested by their consistentdistributions within and among the different types of spha-lerite (Fig. 7). Sphalerite commonly contains MnS, CdS, andCoS in solid solution (Vaughan and Craig, 1997), and experi-mental studies by Jiuling (1993) have shown that up to 1,500ppm Tl can be incorporated in natural sphalerites. Some ofthe high Tl and Co in the sphalerite may reflect inclusions ofpyrite, which typically contains high concentrations of theseelements (discussed below). However, the sphalerite thatcontains the most abundant visible pyrite (red-brown spha-lerite) has the lowest Tl contents and, therefore, pyrite inclu-sions could not have been a major contributor to the spha-lerite chemistry.
Pyrite
Table 2 and Figure 9 summarize the trace element data forpyrite. A total of 62 analyses are reported. Unlike sphalerite,most trace elements in pyrite from stages 1 through 3 lacksystematic variations. The highly variable Ag, As, Sb, and Tlcontents in stage 1 pyrite significantly overlap with those ofstages 2 and 3. Concentration ranges in stages 1 through 3 are6 to 900 ppm Ag, 16 to 10,750 ppm As, 2 to 5,580 ppm Co, 3to 2,160 ppm Cu, 7 to 6,720 ppm Sb, and 2 to 12,220 ppm Tl(Table 2).
Geochemical variations for many elements in pyrite associ-ated with late tan sphalerite in stage 4 breccias are distinctlydifferent (Fig. 9 and Table 2). In particular, this stage of pyritehas significantly lower contents of Ag (<100 ppm), Co (<80ppm), Tl (<41 ppm), Cu (<136 ppm) and Ni (<14 ppm).Pyrite in shale of the Kuna Formation away from known min-eralization has similar low values of most trace elements, par-ticularly Ag and Tl (Slack et al., 2004b).
If the stage 4 breccias formed by fluids related to theBrookian orogeny, the trace element signatures of stage 4pyrite may reflect the release of trace elements in local pre-existing sulfide minerals during diagenesis and metamor-phism. Studies of trace element contents in pyrite from vol-
SULFIDE MINERALOGY AND GEOCHEMISTRY OF THE RED DOG DEPOSITS 1519
0361-0128/98/000/000-00 $6.00 1519
1520 KELLEY ET AL.
0361-0128/98/000/000-00 $6.00 1520
TABLE 1. Basic Statistics for Minor and Trace Element Contents in Sphalerite from the Red Dog Deposits
Min Mean Median 25th 75th Max % above MDL
Stage 1: Early brown sphalerite, n = 32, deposits M, A
Fe wt % 0.7 1 1 0.8 1.3 1.9 100Cd 0.1 0.4 0.4 0.4 0.5 0.6 97Ag 56 381 226 144 279 1,500 100As 4 175 42 18 192 2,100 100Co 9 39 43 27 52 63 94Cu 33 591 360 254 681 1,990 100Ge 54 192 149 108 244 423 100Hg 13 283 80 64 187 1,810 91Mn 5 20 20 14 26 37 91Pb 31 3,651 2,390 965 5,990 9,830 97Sb 32 595 307 174 546 2,520 100Tl 11 43 31 21 49 126 100Cu/Ag .6 2 1.4 1.2 2 5 100
Stage 2: Yellow-brown sphalerite, n = 88, deposits Q, M, A, P
Fe wt % 0.6 1.9 2 1.5 2.4 4.2 100Cd 0.2 0.5 0.5 0.4 0.6 0.9 100Ag ppm 5 172 129 79 199 758 100As 0.05 48 27 7 68 294 95Co 11 122 102 74 176 310 100Cu 16 745 574 293 1,082 2,820 100Ge 1.5 104 103 65 143 261 100Hg 18 181 77 44 212 1,460 97Mn 0.7 8 7 5 9 27 94Pb 4 822 332 103 1,428 5,730 92Sb 0.5 480 343 151 673 2,440 100Tl 0.07 6 3 1.6 8 37 91Cu/Ag 1 5 4 3 6 27 100
Stage 3: Red-brown sphalerite, n = 40, deposits Q, M, A, P
Fe wt % 0.7 3 3 1.8 4 7.3 100Cd 0.2 0.4 0.4 0.3 0.5 1 100Ag ppm 4 219 94 45 238 1,720 100As 0.9 168 52 9 222 916 93Co 14 149 149 82 207 382 98Cu 88 438 335 164 533 1,610 100Ge 14 116 82 47 160 425 100Hg 18 727 108 61 1,192 3,650 100Mn 1.3 11 11 5 16 23 93Pb 0.8 366 212 79 557 2,030 98Sb 18 464 204 57 629 3,560 100Tl 0.3 5 5 1.5 8.2 15 95Cu/Ag 0.4 6 3 2 6 103 100
Stage 4: Late tan sphalerite, n = 44, deposits Q, M, A
Fe wt % 0.1 0.3 0.3 0.2 0.4 0.9 100Cd 0.3 0.6 0.8 0.6 0.8 0.9 98Ag ppm 144 373 359 243 497 640 100As 2 39 15 9 41 264 98Co 0.6 3 2 0.8 4 11 89Cu 29 319 332 238 436 525 100Ge 100 249 247 191 288 426 100Hg 10 177 46 30 106 1,570 95Mn 28 77 67 57 88 177 100Pb 61 1,585 919 325 2,072 8,750 100Sb 266 450 430 335 539 774 100Tl 15 141 140 62 190 355 100Cu/Ag 0.1 0.9 0.9 0.5 1 3 100
A = Aqqaluk, M = Main, Max = maximum value, MDL = minimum detection limits, Min = minimum value, P = Paalaaq, Q = Qanaiyaq, 25th = 25th per-centile, 75th = 75th percentile
Values for minimum MDL vary, but maximum MDL for this data set are as follows: Fe = 0.01, Cd = 0.05, Ag = 0.05, As = 0.05, Co = 0.5, Cu = 0.5, Ge= 0.5, Hg = 0.1, Mn = 0.5, Pb = 0.5, Sb = 0.5, Tl = 0.05

SULFIDE MINERALOGY AND GEOCHEMISTRY OF THE RED DOG DEPOSITS 1521
0361-0128/98/000/000-00 $6.00 1521
.5
5
50
500
Co
(pp
m)
.05 .5 5Fe (wt.%)
r = 0.8
1
10
100
1000
Ge
(pp
m)
.05 .5 5
Fe (wt.%)
r = -0.5.5
5
50
500
Mn
(pp
m)
.05 .5 5 50 500Tl (ppm)
r = 0.7
.5
5
50
500
Mn
(pp
m)
.05 .5 5Fe (wt.%)
Stage 4:LTS
Stage 3:RBS
Stage 2:YBS
Stage 1:EBS
r = -0.5
A B
C D
Ag
(pp
m)
1
10
100
1000
1 10 100 1000 10000
Pb (ppm)
r = 0.3
0
.0005
.001
.0015
.002
Sb
(mol
e%)
0 .001 .002 .003 .004 .005
Cu (mole%)
Sb/Cu=1:3
r = 0.7
EXPLANATION
1
10
100
1000
Sb (ppm)
Ag
(pp
m)
.1 1 10 100 1000
r = 0.8
E F
G
FIG. 7. Bivariate plots of trace element concentrations determined by LA-ICP-MS in the four stages of sphalerite fromthe Red Dog deposits. A. Mn vs. Fe. B. Co vs. Fe. C. Ge vs. Fe. D. Mn vs. Tl. E. Ag vs. Sb. F. Ag vs. Pb. G. Sb vs. Cu in molpercent; line showing Sb/Cu = 1:3 is typical stoichiometric ratio of Sb and Cu in tetrahedrite. Fe values in wt percent, otherelements in parts per million. Correlation coefficients calculated from analyses in which both elements exceed the detectionlimits are shown for each diagram. See Table 1 for statistics of each sphalerite stage. EBS = early brown sphalerite, LTS =late tan sphalerite, RBS = red-brown sphalerite, YBS = yellow-brown sphalerite.

canogenic massive sulfide deposits suggest that elements likeCu, Ag, As, and Tl that are present as inclusions are mobilizedduring hydrothermal and metamorphic recrystallization(Huston et al., 1995). Thus, Cu, Ag, As, and Tl in early pyriteat Red Dog may have been leached during circulation of sea-water or by burial and metamorphic dewatering related to theBrookian orogeny.
Sulfur IsotopesThe results of sulfur isotope analyses are listed in the Ap-
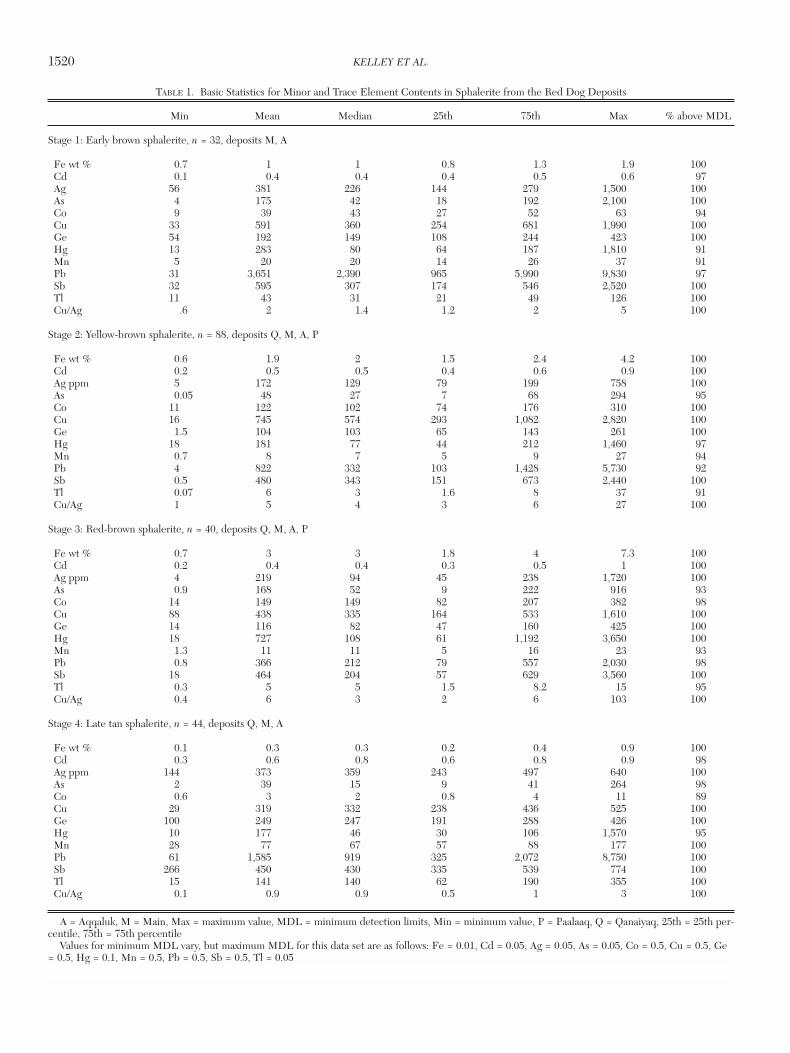
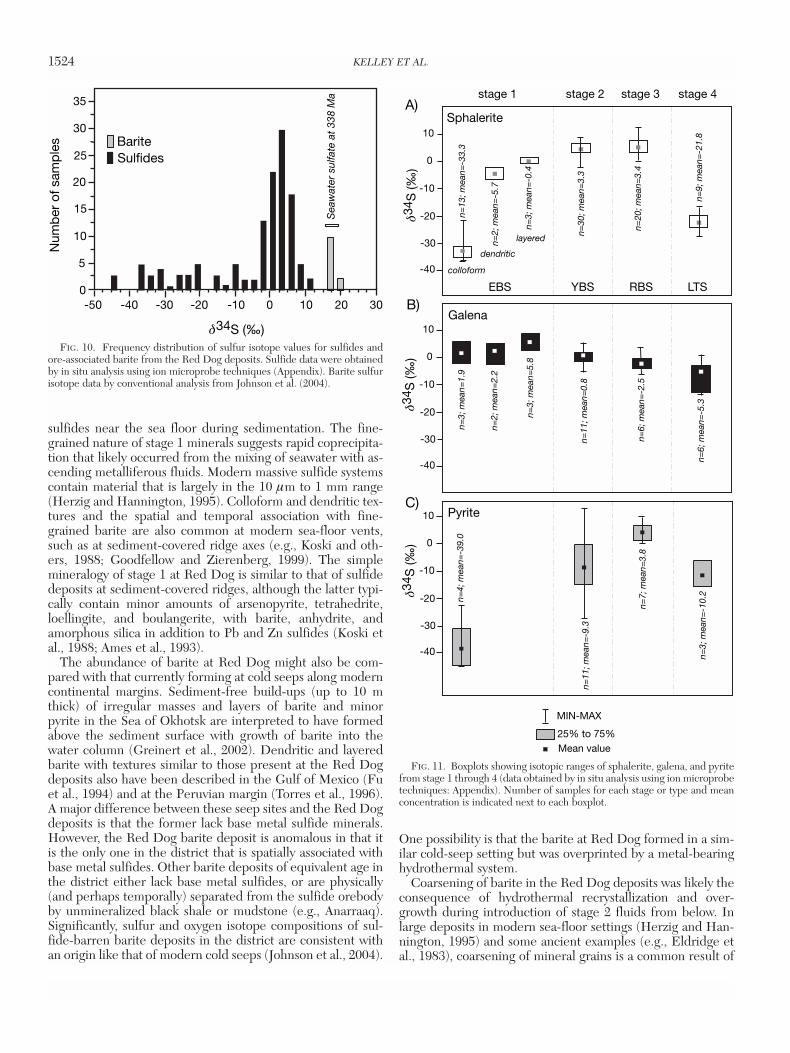
pendix and shown on Figures 10 and 11. Sulfides have a widerange of δ34S values from –45.8 to 12.3 per mil, with a major-ity at about –2.5 to 7.5 per mil (Fig. 10). Isotopic data pro-duced by analyses of bulk mineral separates cluster aroundzero per mil (Schmidt and Zierenberg, 1988; Zierenberg andSchmidt, 1988), consistent with the major population deter-mined by the ion microprobe.
Data for specific minerals include 77 analyses of sphalerite,31 analyses of galena, and 25 analyses of pyrite (Fig. 11). Astriking feature of the sphalerite data is the close correlation
between texture or paragenetic stage and δ34S values. Earlyformed, fine-grained, early brown sphalerite has primarilynegative values, whereas coarser disseminated or interstitialsulfides that form the main ore stages 2 and 3 (yellow-brownand red-brown sphalerite) have significantly higher values(means of yellow-brown and red-brown sphalerite are 3.3 and3.4‰, respectively). Late-stage late tan sphalerite samples allhave low δ34S values (Fig. 11).
Although nearly all δ34S values of early brown sphalerite arenegative, the δ34S composition varies with texture. The meanvalue is –33.3 per mil (n = 13) for colloform early brown spha-lerite, –5.7 per mil (n = 2) for dendritic sphalerite and –0.4per mil (n = 3) for layered sphalerite. These variations mayrecord differences in the extent of bacteriogenic fractionation(discussed below). Alternatively, the higher δ34S values ofdendritic and layered forms compared with colloform earlybrown sphalerite may reflect contamination from adjacentbarite, which is isotopically heavy (Fig. 10). All forms of earlybrown sphalerite are intergrown with barite, but colloformvarieties commonly are present as aggregates up to 200 µm indiameter that are free of microscopically visible barite orother sulfide minerals.
Data for pyrite follow a similar pattern. Pyrite associatedwith colloform early brown sphalerite has δ34S values as lowas –45.8 per mil (Appendix and Fig. 11), whereas pyrite inmassive sulfide (stage 2) and vein ore (stage 3) have highervalues from –27.3 to 9.9 per mil. Similar to late tan spha-lerite, pyrite in late stage 4 breccias has low negative δ34Svalues.
Sulfur in stage 2 and 3 ore-related galena is isotopicallylighter than that of associated sphalerite and shows a smallrange in composition. Stage 2 galena has a mean δ34S value of0.8 per mil (n = 11), whereas galena from vein ore (stage 3)has a mean value of –2.5 per mil (n = 6). Stage 1 galena ana-lyzed by ion microprobe does not have the negative values ofearly brown sphalerite or stage 1 pyrite (Fig. 11). However, agalena separate from one stage 1 sample containing dendriticearly brown sphalerite and barite, analyzed by conventionaltechniques, has a value of –14.3 per mil (C.A. Johnson,unpub. data). The most likely explanation for the high δ34Svalues of stage 1 galena is that the ion microprobe analyses in-cluded traces of barite.
1522 KELLEY ET AL.
0361-0128/98/000/000-00 $6.00 1522
.1
1
10
100
1000
Stage 1 EBS
Stage 2 YBS
Stage 3 RBS
Stage 4 LTS
Fe
Cd
Tl
MnCo
CuAg
Mea
n co
ncen
trat
ion Ge
Cu/Ag
FIG. 8. Comparison of mean concentrations of Ag, Cd, Co, Cu, Ge, Fe,Mn, Tl, and Cu/Ag determined by LA-ICP-MS in stages 1 through 4 spha-lerite from the Red Dog deposits. All elements in parts per million except Feand Cd, which are in percent. See Table 1 for data statistics.
As Ag Tl Sb0.1
1
10
100
1000
10000
100000
Co Ni Cu
Con
cent
ratio
n (p
pm
)
Minimum-Maximum
25th to 75th percentile;horizontal line is median value
Stage 1
Stage 2
Stage 3
Stage 4
FIG. 9. Boxplots showing ranges of selected trace element concentrations in pyrite from stages 1 through 4 determinedby LA-ICP-MS.

Discussion
Depositional environment
Although the simple mineralogy of stage 1 is similar to thatof many sediment-hosted Zn-Pb deposits worldwide (Good-fellow et al., 1993, Lydon, 1995; Large et al., 2002), the textures
are unlike those believed to have formed by exhalativeprocesses. Delicate monomineralic bands of sulfide and shalethat characterize deposits such as Sullivan (Lydon et al.,2000), Rammelsberg (Large and Walcher, 1999), andMcArthur River (Large et al., 2002) are rare at Red Dog.However, Red Dog textures are consistent with formation of
SULFIDE MINERALOGY AND GEOCHEMISTRY OF THE RED DOG DEPOSITS 1523
0361-0128/98/000/000-00 $6.00 1523
TABLE 2. Basic Statistics for Trace Element Contents in Pyrite from the Red Dog Deposits
Min Mean Median 25th 75th Max % above MDL
Stage 1: Pyrite associated with early brown sphalerite, n = 49, deposits M, A
Ag ppm 20 198 116 42 223 900 100As 121 1,430 1,070 497 1,450 10,750 100Co 2 138 41 22 103 1,420 100Cu 41 438 300 156 638 2,160 100Hg 1.3 9 6 4 10 63 94Ni 6 315 185 71 482 1,660 98Pb 1 13,230 1,770 274 2,720 170,660 100Sb 7 908 421 204 925 6,720 100Se 0.05 84 18 14 94 358 14Tl 60 554 431 130 756 2,330 100Zn 30 11,990 462 83 9,380 208,400 100
Stage 2: Pyrite associated with yellow-brown sphalerite, n = 24, deposits Q, M, A, P
Ag ppm 8 206 58 31 763 800 100As 24 2,600 1,370 481 4,040 8,990 100Co 0.1 491 60 29 371 5,580 100Cu 3 227 90 63 323 934 100Hg 0.2 3 3 0.9 4.5 13 96Ni 0.03 197 44 11 127 1,630 100Pb 1 17,580 2,650 153 12,910 250,480 100Sb 21 1,430 520 181 1,920 6,160 100Se 0.05 19 18 9 26 46 21Tl 2 436 366 100 597 12,220 100Zn 3 5,690 2,530 310 10,570 23,470 100
Stage 3: Pyrite/marcasite associated with red-brown sphalerite, n = 20, deposits Q, M, A
Ag ppm 6 80 30 18 98 480 100As 16 551 372 126 793 1,960 100Co 2 127 7 2.8 42 1,380 100Cu 27 226 109 71 341 801 100Hg 2 11 7 3 15 41 95Ni 1 171 11 5 110 1,250 95Pb 5 1,170 718 88 1,358 5,420 100Sb 96 502 366 206 604 2,310 100Se 3 58 45 11 61 181 30Tl 7 400 273 87 542 1,170 100Zn 22 18,290 409 177 3,525 192,010 100
Stage 4: Pyrite associated with late tan sphalerite, n = 9, deposit M
Ag ppm 2 54 80 3 94 100 100As 201 734 757 525 1,045 1,210 100Co 1 33 45 1.6 59 80 100Cu 0.7 57 73 1.3 103 136 100Hg 0.2 3 3 2 3.6 4 100Ni 0.03 6 5 2 9 14 100Pb 2 1,170 516 88 1,360 5,420 100Sb 49 415 613 77 653 820 100Se NA NA NA NA NA NA 0Tl 4 19 16 5 33 41 100Zn 1 108 76 21 199 318 100
A = Aqqaluk, M = Main, Max = maximum value, MDL = minimum detection limits, Min = minimum value, NA = not applicable, P = Paalaaq, Q =Qanaiyaq, 25th = 25th percentile, 75th = 75th percentile
Values for MDL vary, but maximum MDL for this data set are as follows: Ag = 0.05, As = 0.05, Co = 0.5, Cu = 0.5, Hg = 0.1, Ni = 0.01, Pb = 0.5, Sb =0.5, Se = 0.05, Tl = 0.05, Zn = 0.5
sulfides near the sea floor during sedimentation. The fine-grained nature of stage 1 minerals suggests rapid coprecipita-tion that likely occurred from the mixing of seawater with as-cending metalliferous fluids. Modern massive sulfide systemscontain material that is largely in the 10 µm to 1 mm range(Herzig and Hannington, 1995). Colloform and dendritic tex-tures and the spatial and temporal association with fine-grained barite are also common at modern sea-floor vents,such as at sediment-covered ridge axes (e.g., Koski and oth-ers, 1988; Goodfellow and Zierenberg, 1999). The simplemineralogy of stage 1 at Red Dog is similar to that of sulfidedeposits at sediment-covered ridges, although the latter typi-cally contain minor amounts of arsenopyrite, tetrahedrite,loellingite, and boulangerite, with barite, anhydrite, andamorphous silica in addition to Pb and Zn sulfides (Koski etal., 1988; Ames et al., 1993).
The abundance of barite at Red Dog might also be com-pared with that currently forming at cold seeps along moderncontinental margins. Sediment-free build-ups (up to 10 mthick) of irregular masses and layers of barite and minorpyrite in the Sea of Okhotsk are interpreted to have formedabove the sediment surface with growth of barite into thewater column (Greinert et al., 2002). Dendritic and layeredbarite with textures similar to those present at the Red Dogdeposits also have been described in the Gulf of Mexico (Fuet al., 1994) and at the Peruvian margin (Torres et al., 1996).A major difference between these seep sites and the Red Dogdeposits is that the former lack base metal sulfide minerals.However, the Red Dog barite deposit is anomalous in that itis the only one in the district that is spatially associated withbase metal sulfides. Other barite deposits of equivalent age inthe district either lack base metal sulfides, or are physically(and perhaps temporally) separated from the sulfide orebodyby unmineralized black shale or mudstone (e.g., Anarraaq).Significantly, sulfur and oxygen isotope compositions of sul-fide-barren barite deposits in the district are consistent withan origin like that of modern cold seeps (Johnson et al., 2004).
One possibility is that the barite at Red Dog formed in a sim-ilar cold-seep setting but was overprinted by a metal-bearinghydrothermal system.
Coarsening of barite in the Red Dog deposits was likely theconsequence of hydrothermal recrystallization and over-growth during introduction of stage 2 fluids from below. Inlarge deposits in modern sea-floor settings (Herzig and Han-nington, 1995) and some ancient examples (e.g., Eldridge etal., 1983), coarsening of mineral grains is a common result of
1524 KELLEY ET AL.
0361-0128/98/000/000-00 $6.00 1524
0
35
30
25
20
15
10
5
-50 -40 -30 -20 -10 0 302010
Sea
wat
er s
ulfa
te a
t 33
8 M
a
Num
ber
of s
amp
les Barite
Sulfides
δ34S (‰)FIG. 10. Frequency distribution of sulfur isotope values for sulfides and
ore-associated barite from the Red Dog deposits. Sulfide data were obtainedby in situ analysis using ion microprobe techniques (Appendix). Barite sulfurisotope data by conventional analysis from Johnson et al. (2004).
n=13
; mea
n=-3
3.3
-40
-30
-20
-10
0
10
stage 1 stage 2 stage 3 stage 4
n=2;
mea
n=-5
.7
n=3;
mea
n=-0
.4
n=30
; mea
n=3.
3
n=20
; mea
n=3.
4
n=9;
mea
n=-2
1.8
-40
-30
-20
-10
0
10
n=2;
mea
n=2.
2
n=11
; mea
n=0.
8
n=6;
mea
n=-2
.5
n=6;
mea
n=-5
.3
-40
-30
-20
-10
0
10
n=4;
mea
n=-3
9.0
n=11
; mea
n=-9
.3
n=7;
mea
n=3.
8
n=3;
mea
n=1.
9
n=3;
mea
n=5.
8
EBS RBSYBS LTS
n=3;
mea
n=-1
0.2
colloform
dendritic
layered
MIN-MAX
25% to 75%Mean value
δ34 S
(‰)
δ34 S
(‰)
δ34 S
(‰)
Sphalerite
Galena
Pyrite
A)
B)
C)
FIG. 11. Boxplots showing isotopic ranges of sphalerite, galena, and pyritefrom stage 1 through 4 (data obtained by in situ analysis using ion microprobetechniques: Appendix). Number of samples for each stage or type and meanconcentration is indicated next to each boxplot.
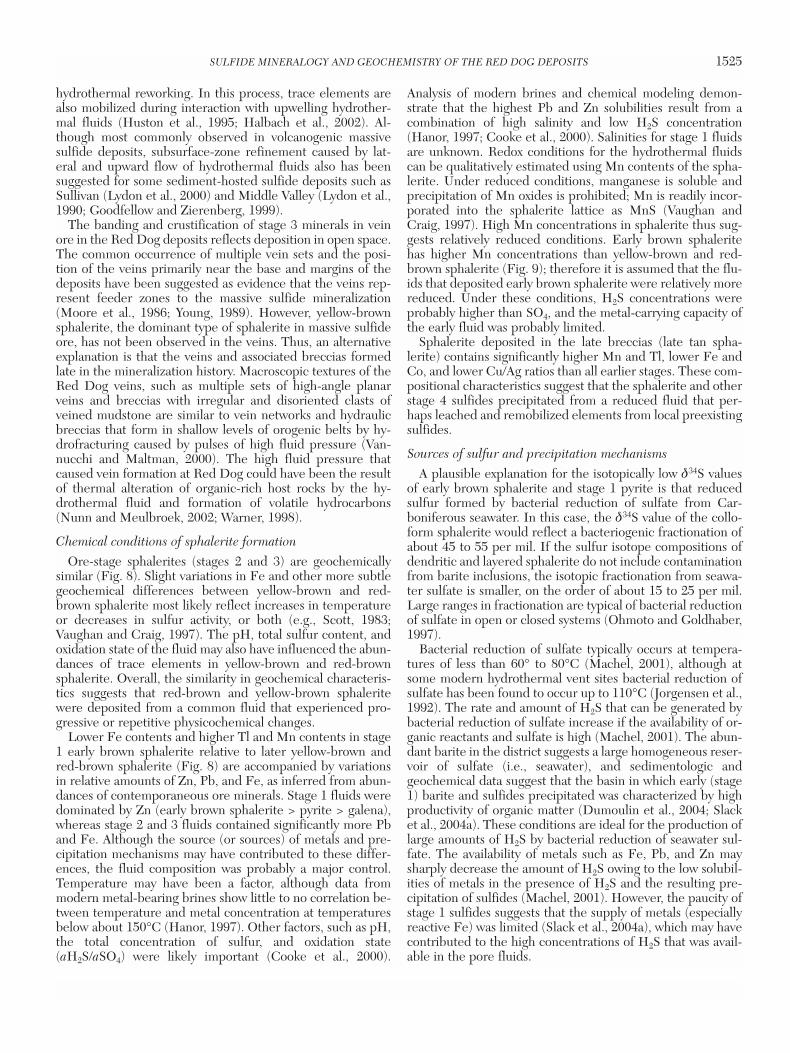
hydrothermal reworking. In this process, trace elements arealso mobilized during interaction with upwelling hydrother-mal fluids (Huston et al., 1995; Halbach et al., 2002). Al-though most commonly observed in volcanogenic massivesulfide deposits, subsurface-zone refinement caused by lat-eral and upward flow of hydrothermal fluids also has beensuggested for some sediment-hosted sulfide deposits such asSullivan (Lydon et al., 2000) and Middle Valley (Lydon et al.,1990; Goodfellow and Zierenberg, 1999).
The banding and crustification of stage 3 minerals in veinore in the Red Dog deposits reflects deposition in open space.The common occurrence of multiple vein sets and the posi-tion of the veins primarily near the base and margins of thedeposits have been suggested as evidence that the veins rep-resent feeder zones to the massive sulfide mineralization(Moore et al., 1986; Young, 1989). However, yellow-brownsphalerite, the dominant type of sphalerite in massive sulfideore, has not been observed in the veins. Thus, an alternativeexplanation is that the veins and associated breccias formedlate in the mineralization history. Macroscopic textures of theRed Dog veins, such as multiple sets of high-angle planarveins and breccias with irregular and disoriented clasts ofveined mudstone are similar to vein networks and hydraulicbreccias that form in shallow levels of orogenic belts by hy-drofracturing caused by pulses of high fluid pressure (Van-nucchi and Maltman, 2000). The high fluid pressure thatcaused vein formation at Red Dog could have been the resultof thermal alteration of organic-rich host rocks by the hy-drothermal fluid and formation of volatile hydrocarbons(Nunn and Meulbroek, 2002; Warner, 1998).
Chemical conditions of sphalerite formation
Ore-stage sphalerites (stages 2 and 3) are geochemicallysimilar (Fig. 8). Slight variations in Fe and other more subtlegeochemical differences between yellow-brown and red-brown sphalerite most likely reflect increases in temperatureor decreases in sulfur activity, or both (e.g., Scott, 1983;Vaughan and Craig, 1997). The pH, total sulfur content, andoxidation state of the fluid may also have influenced the abun-dances of trace elements in yellow-brown and red-brownsphalerite. Overall, the similarity in geochemical characteris-tics suggests that red-brown and yellow-brown sphaleritewere deposited from a common fluid that experienced pro-gressive or repetitive physicochemical changes.
Lower Fe contents and higher Tl and Mn contents in stage1 early brown sphalerite relative to later yellow-brown andred-brown sphalerite (Fig. 8) are accompanied by variationsin relative amounts of Zn, Pb, and Fe, as inferred from abun-dances of contemporaneous ore minerals. Stage 1 fluids weredominated by Zn (early brown sphalerite > pyrite > galena),whereas stage 2 and 3 fluids contained significantly more Pband Fe. Although the source (or sources) of metals and pre-cipitation mechanisms may have contributed to these differ-ences, the fluid composition was probably a major control.Temperature may have been a factor, although data frommodern metal-bearing brines show little to no correlation be-tween temperature and metal concentration at temperaturesbelow about 150°C (Hanor, 1997). Other factors, such as pH,the total concentration of sulfur, and oxidation state(aH2S/aSO4) were likely important (Cooke et al., 2000).
Analysis of modern brines and chemical modeling demon-strate that the highest Pb and Zn solubilities result from acombination of high salinity and low H2S concentration(Hanor, 1997; Cooke et al., 2000). Salinities for stage 1 fluidsare unknown. Redox conditions for the hydrothermal fluidscan be qualitatively estimated using Mn contents of the spha-lerite. Under reduced conditions, manganese is soluble andprecipitation of Mn oxides is prohibited; Mn is readily incor-porated into the sphalerite lattice as MnS (Vaughan andCraig, 1997). High Mn concentrations in sphalerite thus sug-gests relatively reduced conditions. Early brown sphaleritehas higher Mn concentrations than yellow-brown and red-brown sphalerite (Fig. 9); therefore it is assumed that the flu-ids that deposited early brown sphalerite were relatively morereduced. Under these conditions, H2S concentrations wereprobably higher than SO4, and the metal-carrying capacity ofthe early fluid was probably limited.
Sphalerite deposited in the late breccias (late tan spha-lerite) contains significantly higher Mn and Tl, lower Fe andCo, and lower Cu/Ag ratios than all earlier stages. These com-positional characteristics suggest that the sphalerite and otherstage 4 sulfides precipitated from a reduced fluid that per-haps leached and remobilized elements from local preexistingsulfides.
Sources of sulfur and precipitation mechanisms
A plausible explanation for the isotopically low δ34S valuesof early brown sphalerite and stage 1 pyrite is that reducedsulfur formed by bacterial reduction of sulfate from Car-boniferous seawater. In this case, the δ34S value of the collo-form sphalerite would reflect a bacteriogenic fractionation ofabout 45 to 55 per mil. If the sulfur isotope compositions ofdendritic and layered sphalerite do not include contaminationfrom barite inclusions, the isotopic fractionation from seawa-ter sulfate is smaller, on the order of about 15 to 25 per mil.Large ranges in fractionation are typical of bacterial reductionof sulfate in open or closed systems (Ohmoto and Goldhaber,1997).
Bacterial reduction of sulfate typically occurs at tempera-tures of less than 60° to 80°C (Machel, 2001), although atsome modern hydrothermal vent sites bacterial reduction ofsulfate has been found to occur up to 110°C (Jorgensen et al.,1992). The rate and amount of H2S that can be generated bybacterial reduction of sulfate increase if the availability of or-ganic reactants and sulfate is high (Machel, 2001). The abun-dant barite in the district suggests a large homogeneous reser-voir of sulfate (i.e., seawater), and sedimentologic andgeochemical data suggest that the basin in which early (stage1) barite and sulfides precipitated was characterized by highproductivity of organic matter (Dumoulin et al., 2004; Slacket al., 2004a). These conditions are ideal for the production oflarge amounts of H2S by bacterial reduction of seawater sul-fate. The availability of metals such as Fe, Pb, and Zn maysharply decrease the amount of H2S owing to the low solubil-ities of metals in the presence of H2S and the resulting pre-cipitation of sulfides (Machel, 2001). However, the paucity ofstage 1 sulfides suggests that the supply of metals (especiallyreactive Fe) was limited (Slack et al., 2004a), which may havecontributed to the high concentrations of H2S that was avail-able in the pore fluids.
SULFIDE MINERALOGY AND GEOCHEMISTRY OF THE RED DOG DEPOSITS 1525
0361-0128/98/000/000-00 $6.00 1525
Temperatures of yellow-brown and red-brown sphaleritewere 100° to 200°C (Leach et al., 2004), and therefore somereduced sulfur could have been produced by thermochemicalsulfate reduction (Machel, 2001). The fractionation betweenyellow-brown or red-brown sphalerite and most barite at RedDog is about 15 per mil, which is typical for thermochemicalsulfate reduction (Ohmoto and Goldhaber, 1997). Rates ofthermochemical sulfate reduction are not well constrained,but experimental data (Goldhaber and Orr, 1995) suggest thatin the presence of high initial concentrations of H2S, rates areabout 10–9 mol/l/year at 100°C, increasing three orders ofmagnitude at 150°C. This could have supplied significant H2Sduring stages 2 and 3, with sulfate most likely derived fromseawater or pore waters, and/or from reductive dissolution ofpreexisting barite (Johnson et al., 2004). Sulfate reductionand sulfide precipitation probably took place at the same site,but some H2S likely migrated to the site of deposition.
The last stage of breccia formation and mineralization atRed Dog is characterized by low δ34S values for all sulfides(mean δ34S is –21.8‰ for late tan sphalerite; –5.3‰ forgalena, and –10.2‰ for pyrite), suggesting derivation of H2Sby bacterial reduction of sulfate. Biogenic sulfur was likelyproduced during the 100 million years of sedimentation be-tween stage 3 and 4.
The order of δ34S values of pyrite, sphalerite, and galena instages 1 and 4 (Fig. 11) indicates that the sulfides were pre-cipitated out of isotopic equilibrium, most likely because ofrapid precipitation rates or low temperatures (Ohmoto andGoldhaber, 1997). In contrast, δ34S values for stage 2 and 3sphalerite and galena follow expected patterns (i.e., values forsphalerite higher than galena), suggesting that isotopic equi-librium was achieved during precipitation. At the likely high-est temperature for stages 2 and 3 (ca. 200°C: Leach et al.,2004), the isotopic difference between sphalerite and galenashould be about 3.3 per mil (Ohmoto and Goldhaber, 1997).Texturally intergrown stage 2 and 3 sphalerite and galenapairs have isotopic differences ranging from 1.9 to 3.4 per mil,suggesting at least partial equilibrium.
Summary of Mineralizing EventsThe history of mineralization at Red Dog is partly obscured
by the “zone refining” process during introduction of stage 2fluids, by late silicification that overprinted the orebody andreplaced much of the barite, and by postmineralization(Jurassic to Cretaceous) deformation and thrusting during theBrookian orogeny. Nevertheless, textural and compositionaldata for barite and sulfides provide important insights into theenvironment of deposition of the Red Dog deposits and sug-gest that the distribution of ore and gangue minerals in theRed Dog deposits did not result from a single mineralizingevent but rather from a four- stage process.
Stage 1—Deposition of barite and sulfides in unconsolidated muds
Stage 1 mineralization produced complex intergrowths offine-grained barite, sphalerite, minor pyrite, and rare galenathat were deposited mainly as subsurface impregnations inunconsolidated organic-rich muds of the Ikalukrok unit (Fig.12A). By analogy with modern and ancient systems, upflow ofhydrothermal fluids in unconsolidated sediments likely
formed a diapir of fluid that completely permeated the sub-surface (Lydon et al., 2000). Textures indicating exhalation ofbrines on the sea floor, such as monomineralic banding of sul-fide and shale, are rare at Red Dog. Elsewhere in the district,paragenetic and textural studies suggest that barite and sul-fides replaced carbonate (e.g., Anarraaq; Kelley et al., 2004).However, the Red Dog deposits contain only minor amountsof carbonate, and unequivocal evidence for replacement ofcarbonate by barite or sulfides has not been documented.Possible explanations for the scarcity of carbonate at Red Doginclude a lack of original carbonate turbidite deposition, dis-solution by acidic ore fluids, or complete replacement of car-bonate by barite and/or sulfides.
On the basis of sulfur and oxygen isotope data for sulfide-barren barite in the Red Dog district, Johnson et al. (2004) sug-gest that the barite formed at sites that were generating Ba andmethane. Thick accumulations of sediment-free massive, lay-ered, and dendritic barite at some of these sites have a numberof textural similarities to Red Dog barite. Colloform early brownsphalerite and pyrite that coprecipitated with barite have aver-age δ34S values of –33.3 and –39.0 per mil, respectively, sug-gesting that H2S was produced by bacterial sulfate reduction.
The chemistry of early brown sphalerite is characterized bylow Fe and high Mn contents. The high Mn likely indicatesthat the fluids were reduced, and it may be inferred that H2S> SO4 (cf. Cooke et al., 2000). Sulfide proportions provide in-formation about the metal budget. Compared with laterstages, the amount of sulfide deposited during stage 1 wasminor, and sphalerite was more abundant than pyrite orgalena (i.e., Zn > Fe > Pb). It is assumed that H2S was avail-able at the site of deposition during stage 1, and therefore theamount of sulfides deposited during stage 1 was probablycontrolled largely by the availability of metals. Although themetal sources are uncertain, they may have been derived insitu from the organic-rich muds of the Ikalukrok unit. If thisinterpretation is correct, the low abundances of pyrite can beexplained by low amounts of reactive Fe in the mudstones, asinferred by Slack et al. (2004a). Furthermore, in a high H2Senvironment like that which is assumed at the site of deposi-tion for stage 1, any Fe present would immediately precipi-tate as pyrite, resulting in low Fe contents of sphalerite andother sulfides that coprecipitated with pyrite.
Textural observations indicate that the early mineralizingevent occurred during sedimentation and prior to lithificationof the mudstones in the late Meramecian, which roughly co-incides with the cessation of carbonate turbidite depositionfrom adjacent carbonate platforms (Dumoulin et al., 2004).
Stage 2—Hydrothermal coarsening of barite and precipitation of sulfides
Stage 2 is defined as the early main ore stage at Red Dog.Any genetic model for stage 2 must account for the followingcharacteristics: (1) variable sulfide grain sizes of 50 µm to 200mm; (2) textures indicating alternating and overlapping depo-sition of yellow-brown sphalerite and barite; (3) an increase inthe abundance of galena and pyrite compared with the stage1 mineral assemblage; (4) significantly higher Fe and Co andlower Mn and Tl contents in yellow-brown sphalerite com-pared with early brown sphalerite; (5) higher temperatures offormation (100°–200°C); (6) higher δ34S values (avg = 3.35‰)
1526 KELLEY ET AL.
0361-0128/98/000/000-00 $6.00 1526

for yellow-brown sphalerite compared with stage 1; and (7) aconsistent vertical ore stratigraphy with massive sulfide at thebase and coarse-grained, sulfide-bearing barite at the top(Fig. 12B).
Stage 2 coincided with the demise of carbonate platformsowing to tectonic subsidence (Dumoulin et al., 2004). Evi-dence for rifting includes the presence of minor alkalinemafic igneous rocks in Kivalina and Ikalukrok units that pre-date stage 2 sulfides (Fig. 12B). The timing of this igneous ac-tivity is constrained by a 40Ar/39Ar age of 344 ± 3 Ma on biotitefrom a mafic intrusion in the Aqqaluk deposit (Werdon,1999), by field relationships that show the intrusion predatesmassive sulfide mineralization, and by a Re-Os isochron ageof 338 ± 5.8 Ma for stage 2 and 3 pyrite (Morelli et al., 2004).Although the volume of exposed igneous rocks at Red Dog isminor, there is evidence of significant intrusive activity farthereast at the Drenchwater deposit (ca. 140 km east of RedDog). Biotite from three Drenchwater intrusions yielded agesof 335 ± 2 Ma, 336 ± 3 Ma and 337 ± 3 Ma (Werdon, 1999),which are broadly contemporaneous with mineralization.Whereas igneous activity may have provided heat that pro-moted hydrothermal fluid flow, rare gas contents of sphaleritefluid inclusions indicate little contribution of magmaticvolatiles to the ore fluids (Leach et al., 2004).
In addition to having a higher temperature, stage 2 fluidsmay have been relatively more oxidized than stage 1 fluids(SO4 > H2S). Moore et al (1986) and Young (1989) suggestedthat the reservoir for the metal-bearing fluids was clasticrocks of the Kanayut Conglomerate and/or Noatak Sandstonethat stratigraphically underlie the Kuna Fm (Fig. 3). Withinthe underlying clastic rocks, stratabound but discordant sul-fide-rich veins and breccias contain banded sulfides that aresimilar in appearance to veins at Red Dog. Geochemical andisotopic similarities between these veins and Red Dog sulfideveins argue for a similar origin (Young, 1995; Kelley et al.,2000). Lead isotope compositions of sulfides also suggest re-gional-scale mixing of two reservoirs. Lead from isotopicallyevolved crustal rocks probably mixed with deeply circulatingfluids that mobilized less radiogenic lead from underlyingDevonian-Mississippian clastic rocks (Ayuso et al., 2004).
The Kanayut Conglomerate and Noatak Sandstone thatstratigraphically underlie the Kuna Formation formed in afluvial-deltaic environment (Nilsen and Moore, 1982). Localaccumulations of ferric iron-bearing minerals in these clasticrocks indicate oxidized conditions (L. Chapman, writ. com-mun., 2003). These rock compositions most likely bufferedthe stage 2 fluids and provide independent evidence thatthese fluids were oxidized.
Abundant textural evidence indicates that stage 2 sulfidedeposition overlapped with precipitation of coarse-grainedbarite. Together with isotopic compositions, the data suggestthat preexisting barite was reductively dissolved and hy-drothermally coarsened during stage 2 mineralization (Fig.12B). Reductive dissolution of barite by microbially mediatedreactions (bacterial reduction of sulfate) has been demon-strated at low temperatures or by abiotic reactions (thermo-chemical sulfate reduction) at elevated temperatures. Thetemperatures inferred for stage 2 sphalerite (100°–200°C) aresufficient for thermochemical sulfate reduction. Duringbarite dissolution, Ba2 would be remobilized upward and
reprecipitated as barite when Ba-rich fluids encountered sul-fate-stable conditions (Johnson et al., 2004). The process de-scribed above probably took place entirely in the subsurface.
Stage 3—Deposition of barite and sulfides in veins and replacement of preexisting barite
The onset of stage 3 was marked by hydrofracturing andvein formation. During initial stage 3 and previous stages, hy-drothermal fluids probably thermally altered the organic-richmudstones and generated petroleum and hydrocarbon gases(Simoneit, 1993; Warner, 1998). If the sediments were un-lithified or partly lithified, and therefore relatively porous andpermeable, as is assumed for stage 1 and 2 (Fig. 12A-B), porefluid and gas pressures could have been readily dissipated(e.g., Nunn and Meulbroek, 2002). However, with continuedlithification and/or silicification prior to and during stage 2mineralization (Slack et al., 2004b), permeability would haveprogressively decreased, leading to overpressuring, hy-drofracturing, and vein formation (e.g., Vannucchi and Malt-man, 2000; Bons, 2001) that was focused beneath the ore-bodies (Fig. 12C). Barite, red-brown sphalerite, pyrite ormarcasite, galena, and minor chalcedonic silica were de-posited in the veins, concurrent with replacement of barite inveins, massive sulfide, and sulfide-bearing barite (Fig. 12C).
Chemical and isotopic data for stage 3 sulfides indicate thefluids were similar to stage 2 fluids. However, fluctuations inT, pH, and/or the activities of sulfur species affected themetal ratios and metal abundances through time, resulting incompositionally zoned red-brown sphalerite. The ore fluidscontinued to flow through the clastic aquifer underlying theshale and ascended to the site of sulfide deposition in theKuna Formation (Fig. 12C).
Similar sulfur isotope compositions of red-brown and yel-low-brown sphalerite indicate a common source of H2S fromthe reductive dissolution of barite ± pore-water sulfate. Onedistinctive textural feature of stage 3 is that sphalerite perva-sively replaces barite whereas stage 2 sulfides do not. The im-plication is that physiochemical conditions were such thatbarite was relatively more soluble during stage 3. Solubility ofbarite increases as a function of increasing pressure and salin-ity and with decreasing temperature from 200° to 100°C(Rimstidt, 1997; Hanor, 2000). It is assumed that tempera-ture, pressure, and salinity remained fairly constant fromstage 2 to 3, but it is possible that owing to hydrofracturingand vein development at the onset of stage 3, the tempera-ture-pressure regime changed such that greater amounts ofbarite were dissolved.
Stage 4—Late breccias and deposition of fine-grained silica and tan sphalerite
The shallow dips of the late breccias containing late tansphalerite are similar to flat-lying thrust faults in the area, al-though a consistent spatial association of the breccias withfaults has not been observed. Pyrite clasts are fractured andbroken indicating brittle deformation, whereas galena is plas-tically deformed and smeared into fractures.
The sulfide textures are consistent with formation of thebreccias by tectonic processes during the Jurassic-CretaceousBrookian orogeny. This timing implies that hydrothermalactivity ceased after stage 3 mineralization. Sedimentary
SULFIDE MINERALOGY AND GEOCHEMISTRY OF THE RED DOG DEPOSITS 1527
0361-0128/98/000/000-00 $6.00 1527
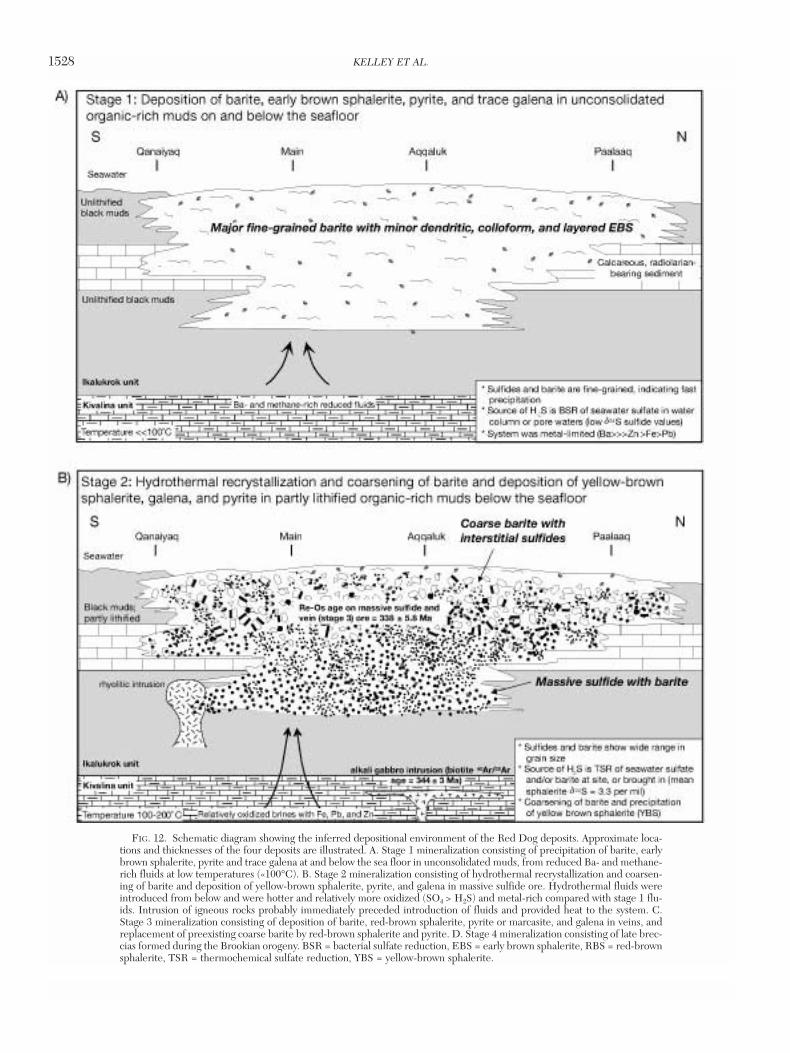
1528 KELLEY ET AL.
0361-0128/98/000/000-00 $6.00 1528
FIG. 12. Schematic diagram showing the inferred depositional environment of the Red Dog deposits. Approximate loca-tions and thicknesses of the four deposits are illustrated. A. Stage 1 mineralization consisting of precipitation of barite, earlybrown sphalerite, pyrite and trace galena at and below the sea floor in unconsolidated muds, from reduced Ba- and methane-rich fluids at low temperatures («100°C). B. Stage 2 mineralization consisting of hydrothermal recrystallization and coarsen-ing of barite and deposition of yellow-brown sphalerite, pyrite, and galena in massive sulfide ore. Hydrothermal fluids wereintroduced from below and were hotter and relatively more oxidized (SO4 > H2S) and metal-rich compared with stage 1 flu-ids. Intrusion of igneous rocks probably immediately preceded introduction of fluids and provided heat to the system. C.Stage 3 mineralization consisting of deposition of barite, red-brown sphalerite, pyrite or marcasite, and galena in veins, andreplacement of preexisting coarse barite by red-brown sphalerite and pyrite. D. Stage 4 mineralization consisting of late brec-cias formed during the Brookian orogeny. BSR = bacterial sulfate reduction, EBS = early brown sphalerite, RBS = red-brownsphalerite, TSR = thermochemical sulfate reduction, YBS = yellow-brown sphalerite.

SULFIDE MINERALOGY AND GEOCHEMISTRY OF THE RED DOG DEPOSITS 1529
0361-0128/98/000/000-00 $6.00 1529
FIG. 12. (Cont.)
processes in Pennsylvanian-Triassic basins included forma-tion of barite and local high organic matter production(Young, 2004). Biogenic H2S that accumulated in pore waterthroughout the sedimentary section may have been circulatedto depths during fluid flow related to the Brookian orogeny,thereby providing a source of sulfur for stage 4 sulfides. Pre-existing sulfides that were leached and remobilized by stage 4fluids were a possible source of metals.
There is ample evidence that fluid flow during Mesozoicthrusting was widespread. On the basis of high formation pres-sures (500–3,400 bars) and temperatures (180°–220°C) influid inclusions, Leach et al. (2004) conclude that much of thequartz in and around the Red Dog deposits formed duringMesozoic thrusting. A similar Mesozoic timing was proposedfor regionally widespread quartz-carbonate veinlets (Kelley etal., 2000). The texture of galena in the late breccias is also con-sistent with experimental results showing that at about 200°Cand 500–2,000 bars, galena behaves plastically, displaying kinkbands or curved cleavages (Salmon et al., 1974).
If the Brookian origin for the stage 4 breccias is correct,then the absence of these breccias in deposits other than RedDog requires explanation. The simplest explanation is thatRed Dog was the site of more focused, prolonged, and re-peated hydrothermal fluid flow, not only in the Carboniferousbut also later during Brookian time. Other deposits in the dis-trict not only lack stage 4-type breccias, but they also havemarkedly less abundant vein-type mineralization and less late(Brookian) quartz.
ConclusionsThroughout the Red Dog orebodies, four stages of spha-
lerite have distinct morphological, chemical, and isotopiccharacteristics. Evidence for exhalative processes is lacking,and unlike other deposits in the district, large-scale replace-ment of carbonate by barite or sulfides is not documented atthe Red Dog deposits. Rather, the petrographic, geochemical,and isotopic data support a model in which early fine-grainedbarite and volumetrically minor sulfides formed at or near thesea floor in unconsolidated mud (stage 1). This stage was fol-lowed by subsea-floor zone refining and hydrothermal coars-ening of barite caused by the introduction of ore-stage metal-rich fluids (stage 2). Metal-rich fluids reductively dissolvedthe preexisting barite to produce H2S and induce sulfide min-eral formation. With continued flow of hydrothermal fluids,progressive thermal alteration of organic-rich mudstones pro-duced methane that led to fluid overpressuring, hydrofrac-turing, and vein formation (stage 3). Barite was pervasivelyreplaced by sphalerite suggesting that barite solubility in-creased during stage 3. Hydrothermal activity ceased and sed-imentary processes resumed until Jurassic time when thrust-ing and large-scale fluid flow related to the Jurassic toCretaceous Brookian orogeny resulted in metal remobiliza-tion and formation of sphalerite-rich tectonic breccias. Abun-dant quartz formed during this event replaced some remain-ing barite and obscured primary textural features.
AcknowledgmentsThis work, a cooperative project between the U.S. Geolog-
ical Survey and Teck Cominco, was initiated in 1998. We aregrateful to all previous and current Teck Cominco staff
involved in the study. Specifically, we thank George Cole andScott Jennings for their role in getting the research plan un-derway and, together with Adrian King, for scientific, logistic,and financial support throughout the project. Tom Krolak,Bob Robinson, Gary Coulter, and Lorne Young providedvaluable background information that was critical for buildingthe necessary framework for our studies. Cameron Rombach,Erin Marsh, and Erin Kelley helped with various aspects ofreport preparation including drafting, editing, and assembly.Technical reviews by Randy Koski and Peter McGoldrickgreatly improved the manuscript.
REFERENCESAmes, D.E., Franklin, J.M., and Hannington, M.D., 1993, Mineralogy and
geochemistry of active and inactive chimneys and massive sulfide, MiddleValley, northern Juan de Fuca Ridge; an evolving hydrothermal system:Canadian Mineralogist, v. 31, p. 997–1024.
Ayuso, R.A., Kelley, K.D., Leach, D.L., Young, L.E., Slack, J.F., Wandless,G., Lyon, A.M., and Dillingham, J.L., 2004, Origin of the the Red Dog Zn-Pb-Ag deposits, Brooks Range, Alaska: Evidence from regional Pb and Srisotope sources: ECONOMIC GEOLOGY, v. 99, p. 1533–1553.
Bons, P.D., 2001, The formation of large quartz veins by rapid ascent of flu-ids in mobile hydrofractures: Tectonophysics, v. 336, p. 1–17.
Cooke, D.R., Bull, S.W., Large, R.R., and McGoldrick, P.J., 2000, The im-portance of oxidized brines for the formation of Australian Proterozoicstratiform sediment-hosted Pb-Zn (sedex) deposits: ECONOMIC GEOLOGY,v. 95, p. 1–18.
Crowe, D.E., and Vaughan, R.G., 1996, Characterization and use of isotopi-cally homogeneous standards for in situ laser microprobe analysis of 34S/32Sratios: American Mineralogist, v. 81, p. 187–193.
Dumoulin, J.A., Harris, A.G., Blome, C.D., and Young, L.E., 2004, Deposi-tional settings, correlation, and age of Carboniferous rocks in the westernBrooks Range, Alaska: ECONOMIC GEOLOGY, v. 99, p. 1355–1384.
Edgerton, D., 1997, Reconstruction of the Red Dog Zn-Pb-Ba orebody,Alaska: Implications for the vent environment during the mineralizingevent: Canadian Journal of Earth Sciences, v. 34, p. 1581–1602.
Eldridge, C.S., Barton, P.B., Jr., and Ohmoto, H., 1983, Mineral textures andtheir bearing on the formation of the Kuroko orebodies: ECONOMIC GEOL-OGY MONOGRAPH 5, p. 241–281.
Frisia, S., Borsato, A., Fairchild, I.J., and McDermott, F., 2000, Calcite fab-rics, growth mechanisms, and environments of formation in speleothemsfrom the Italian Alps and southwestern Ireland: Journal of Sedimentary Re-search, v. 70, p. 1183–1196.
Fu, B., Aharon, P., Byerly, G.R., and Roberts, H.H., 1994, Barite chimneyson the Gulf of Mexico slope: Initial report on their petrography and geo-chemistry: Geo-Marine Letters, v. 14, p. 81–87.
Goldhaber, M.B., and Orr, W.L., 1995, Kinetic controls on thermochemicalsulfate reduction as a source of sedimentary H2S: American Chemical So-ciety Symposium Series, v. 612, p. 412–425.
Goodfellow, W.D., and Zierenberg, R.A., 1999, Genesis of massive sulfidedeposits at sediment-covered spreading centers: Reviews in EconomicGeology, v. 8, p. 297–324.
Goodfellow, W.D., Lydon, J.W., and Turner, R.J.W., 1993, Geology and gen-esis of stratiform sediment-hosted (sedex) zinc-lead-silver sulfide deposits:Geological Association of Canada Special Paper 40, p. 201–251.
Greinert, J., Bollwerk, S.M., Derkacev, A., Bohrmann, G., and Suess, E.,2002, Massive barite deposits and carbonate mineralization in the Deruginbasin, Sea of Okhotsk: Precipitation processes at cold seep sites: Earth andPlanetary Science Letters, v. 203, p. 165–180.
Halbach, M., Halbach, P., and Lüders, V., 2002, Sulfide-impregnated andpure silica precipitates of hydrothermal origin from the central IndianOcean: Chemical Geology, v. 182, p. 357–375.
Hanor, J.S., 1997, Controls on the solubilization of lead and zinc in basinalbrines: Society of Economic Geologists Special Publication 4, p. 483–500.
——2000, Barite-celestite geochemistry and environments of formation: Re-views in Mineralogy and Geochemistry, v. 40, p. 193–275.
Harland, W.B., Armstrong, R.L., and others, 1990, A geologic time scale1989: Cambridge, Cambridge University Press, 263 p.
Herzig, P.M., and Hannington, M.D., 1995, Polymetallic massive sulfides atthe modern seafloor: A review: Ore Geology Reviews, v. 10, p. 95–115.
1530 KELLEY ET AL.
0361-0128/98/000/000-00 $6.00 1530

Huston, D.L., Sie, S.H., Suter, G.F., Cooke, D.R., and Both, R.A., 1995,Trace elements in sulfide minerals from eastern Australian volcanic-hostedmassive sulfide deposits: Part I. Proton microprobe analyses of pyrite, chal-copyrite, and sphalerite, and Part II. Selenium levels in pyrite: Comparisonwith δ34S values and implications for the source of sulfur in volcanogenichydrothermal systems: ECONOMIC GEOLOGY, v. 90, p. 1167–1196.
Jennings, S., and King, A.R., 2002, Geology, exploration history and futurediscoveries in the Red Dog district, western Brooks Range, Alaska: Centrefor Ore Deposit Research Special Publication 4, p. 151–158.
Jiuling, Li, 1993, The Tl-Zn-S and Tl-Cd-S systems in comparison with theTl-Hg-S system: Neues Jahrbuch Miner. Abh., v. 166, p. 53–58.
Johnson, C.A., Kelley, K.D., and Leach, D.L., 2004, Sulfur and oxygen iso-topes in barite deposits of the western Brooks Range, Alaska, and implica-tions for the origin of the Red Dog massive sulfide deposits: ECONOMIC GE-OLOGY, v. 99, p. 1435–1448.
Jorgensen, B.B., Isaksen, M.F, Jannasch, H.W., 1992, Bacterial sulfate re-duction above 100°C in deep-sea hydrothermal vent sediments: Science, v.258, p. 1756–1757.
Kelley, K.D., Leach, D.L., and Johnson, C.A., 2000, Sulfur-, oxygen-, andcarbon-isotope studies of Ag-Pb-Zn vein-breccia occurrences, sulfide-bear-ing concretions, and barite deposits in the north-central Brooks Range,with comparisons to shale-hosted stratiform massive sulfide deposits: U.S.Geological Survey Professional Paper 1615, p. 189–201.
Kelley, K.D., Dumoulin, J.A., and Jennings, S., 2004, The Anarraaq Zn-Pb-Ag and barite deposit, northern Alaska: Evidence for replacement of car-bonate by barite and sulfides: ECONOMIC GEOLOGY, v. 99, p. 1577–1591.
Koski, R.A., Shanks, W.C. III., Bohrson, W.A., and Oscarson, R.L., 1988, Thecomposition of massive sulfide deposits from the sediment-covered floor ofEscanaba trough, Gorda Ridge: Implications for depositional processes:Canadian Mineralogist, v. 26, p. 655–673.
Large, D.E., and Walcher, E., 1999, The Rammelsberg massive sulfide Cu-Zn-Pb-Ba deposit, Germany: An example of sediment-hosted, massive sul-fide mineralization: Mineralium Deposita, v. 34, p. 522–538.
Large, R.R., Bull, S.W., Selley, D., Yang, J., Cooke, D., Garven, G., and Mc-Goldrick, P., 2002, Northern Australian Proterozoic sediment-hosted Zn-Pb-Ag deposits: A summary: Centre for Ore Deposit Research SpecialPublication 4, p. 159–160.
Leach, D.L., Marsh, E., Emsbo, P., Rombach, C., Kelley, K.D., and Anthony,M., 2004, Nature of hydrothermal fluids at the shale-hosted Red Dog Zn-Pb-Ag deposits, Brooks Range, Alaska: ECONOMIC GEOLOGY, v. 99, p.1449–1480.
Leshin, L.A., McKeegan, K.D., Carpenter, P.K., and Harvey, R.P., 1998, Oxy-gen isotopic constraints on the genesis of carbonates from Martian mete-orite ALH84001: Geochimica Cosmochimica Acta, v. 62, p. 3–13.
Leventhal, J.S., Johnson, C.A., and Kelley, K.D., 2002, Isotopic and geo-chemical constraints for witherite (BaCO3) from the sediment-hosted Zn-Pb-Ag massive sulfide deposits, Red Dog district, Alaska [abs.]: GeologicalSociety of America Abstracts with Programs, v. 34, p. 220.
Lydon, J.W., 1995, Sedimenary exhalative sulphides (sedex): Geological Sur-vey of Canada—Geology of Canada 8, p. 130–152.
Lydon, J.W., Goodfellow, W.D., and Franklin, J.M., 1990, Chemistry of sed-iment pore waters around active hydrothermal vents, Middle Valley [abs.]:EOS, Transactions American Geophysical Union, v. 71, p. 1569.
Lydon, J.W., Paakki, J.J., Anderson, H.E., and Reardon, N.C., 2000,Overview of te geology and geochemistry of the Sullivan deposit: Geologi-cal Association of Canada Special Publication 1, p. 505–522.
Machel, H.G., 2001, Bacterial and thermochemical sulfate reduction in dia-genetic settings—Old and new insights: Sedimentary Geology, v. 140, p.143–175.
Marshall, B., Vokes, F.M., and Larocque, A.C.L., 2000, Regional metamor-phic remobilization: Upgrading and formation of ore deposits: Reviews inECONOMIC GEOLOGY, v. 11., p. 19–38.
Mayfield, C.F., Tailleur, I.L., and Ellersieck, Inyo, 1988, Stratigraphy, struc-ture, and palinspastic synthesis of the western Brooks Range, northwesternAlaska: U.S. Geological Survey Professional Paper 1399, p. 143–186.
McKibben, M.A., and Riciputi, L.R., 1998, Sulfur isotopes by ion micro-probe: Reviews in ECONOMIC GEOLOGY, v. 7, p. 121–139.
Moore, D.W., Young, L.E., Modene, J.S., and Plahuta, J.T., 1986, Geologicsetting and genesis of the Red Dog zinc-lead-silver deposit, western BrooksRange, Alaska: ECONOMIC GEOLOGY, v. 81, p. 1696–1727.
Moore, T.E., Wallace, W.K., Bird, K.J., Karl, S.M., Mull, C.G., and Dillon,J.T., 1994, Geology of northern Alaska: Geological Society of America—The geology of North America, v. G-1, p. 49–140.
Morelli, R.M., Creaser, R.A., Selby, D., Kelley, K.D., Leach, D.L., and King,A.R., 2004, Re-Os sulfide geochronology of the Red Dog sediment-hostedZn-Pb-Ag deposits, Brooks Range, Alaska: ECONOMIC GEOLOGY, v. 99, p.1569–1576.
Mull, C.G., 1982, The tectonic evolution and structural style of the BrooksRange, Alaska—An illustrated summary, in Powers, R.B., ed., Geologicalstudies of the Cordilleran thrust belt: Rocky Mountain Association of Ge-ologists, v. 1, p. 1–45.
Mull, C.G., and Werdon, M.B., 1994, Generalized geologic map of the west-ern Endicott Mountains, central Brooks Range, Alaska: Alaska Division ofGeological and Geophysical Surveys Public Data File 94-55, 1 sheet, scale1:250,000.
Mull, C.G., Tailleur, I.L., Mayfield, C.F., Ellersieck, Inyo, and Curtis, Steve,1982, New upper Paleozoic and lower Mesozoic stratigraphic units, centraland western Brooks Range, Alaska: American Association of Petroleum Ge-ologists Bulletin, v. 66, no. 7, p. 348–362.
Naslund, H.R., 1984, Supersaturation and crystal growth in the roof-zone ofthe Skaergaard magma chamber: Contributions to Mineralogy and Petrol-ogy, v. 86, p. 89–93.
Nilsen, T.H., and Moore, T.E., 1982, Sedimentology and stratigraphy of theKanayut Conglomerate, central and western Brooks Range, Alaska: U.S.Geological Survey Open File Report 82-0674, 68 p.
Norman, M., Robinson, P., and Clark, D., 2003, Major- and trace-elementanalysis of sulfide ores by laser-ablation ICP-MS, solution ICP-MS, andXRF: New data on international reference materials: Canadian Mineralo-gist, v. 41, p. 293–305.
Nunn, J.A., and Meulbroek, P., 2002, Kilometer-scale upward migration ofhydrocarbons in geopressured sediments by buoyancy-driven propagationof methane-filled fractures: American Association of Petroleum GeologistsBulletin, v. 86, p. 907–918.
Ohmoto, H., and Goldhaber, M.B., 1997, Sulfur and carbon isotopes, inBarnes, H.L., ed., Geochemistry of hydrothermal ore deposits—third edi-tion: New York, John Wiley, p. 517–612.
Riciputi, L.R., 1996, A comparison of extreme energy filtering and highmass resolution techniques for the measurement of 34S/32S ratio by ionmicroprobe: Rapid Communications in Mass Spectrometry, v. 10, p.282–286.
Riciputi, L.R., Paterson, B.A., and Ripperdan, R.L., 1998, Measurement oflight stable isotope ratios by SIMS: Matrix effects for oxygen, carbon, andsulfur isotopes in minerals: International Journal of Mass Spectrometry, v.178, p. 81–112.
Ridley, W.I., 2000, The ICP-MS laser microprobe: A new geochemical tool:Trends in Geochemistry, v. 1, p. 1–14.
Ridley, W.I., and Lichte, F.E., 1998, Major, trace, and ultratrace elementanalysis by laser ablation ICP-MS: Reviews in Economic Geology, v. 7, p.199–215.
Rimstidt, J.D., 1977, Gangue mineral transport and deposition, in Barnes,H.L., ed., Geochemistry of hydrothermal ore deposits—third edition: NewYork, John Wiley, p. 487–515.
Rombach, C.S, and Layer, P.W., 2004, Geochronology of the western andcentral Brooks Range: Implications for the geologic evolution of the Anar-raaq and Red Dob Zn-Pb-Ag deposits: ECONOMIC GEOLOGY, v. 99, p.1307–1322.
Salmon, B.C., Clark, C.R., and Kelly, W.C., 1974, Sulfide deformation stud-ies: II. Experimental deformation of galena to 2,000 bars and 400°C: ECO-NOMIC GEOLOGY, v. 69, p. 1–16.
Schmidt, J.M., and Zierenberg, R.A., 1988, Reconstruction of primary fea-tures and isotopic evidence for multiple sulfur sources at the Red Dog zinc-lead-silver deposit, Noatak district, Alaska: U.S. Geological Survey Circular1035, p. 62–63.
Scott, S.D., 1983, Chemical behavior of sphalerite and arsenopyrite in hy-drothermal and metamorphic environments: Mineralogical Magazine, v.47, p. 427–435.
Shimizu, N., and Hart, S.R., 1982, Applications of the ion microprobe to geo-chemistry and cosmochemistry: Annual Review of Earth and Planetary Sci-ences, v. 10, p. 483–526.
Simoneit, B.R.T., 1993, Hydrothermal alteration of organic matter in marineand terrestrial systems, in Engel, M.H., and Macko, S.A., eds., Organicgeochemistry: Principles and applications: New York, Plenum Press, p.397–418.
Sims, D.B, 1996, The relationships of ore and structural geology at the RedDog zinc-lead-silver deposit, western Brooks Range, Alaska: UnpublishedPh.D. dissertation, Tucson, Arizona, University of Arizona, 142 p.
SULFIDE MINERALOGY AND GEOCHEMISTRY OF THE RED DOG DEPOSITS 1531
0361-0128/98/000/000-00 $6.00 1531

Slack, J.F., Dumoulin, J.A., Schmidt, J.M., Young, L.E., and Rombach, C.S.,2004a, Paleozoic sedimentary rocks in the Red Dog Zn-Pb-Ag district andvicinity, western Brooks Range, Alaska: Provenance, deposition, and metal-logenic significance: ECONOMIC GEOLOGY, v. 99, p. 1385–1414.
Slack, J.F., Kelley, K.D., Anderson, V.M., Clark, J.L., and Ayuso, R.A., 2004b,Multistage silicification and Fe-Tl-As-Sb-Ge-REE enrichment in the RedDog Zn-Pb-Ag district, northern Alaska: Geochemistry, origin, and explo-ration applications: ECONOMIC GEOLOGY, v. 99, p. 1481–1508.
Torres, M.E., Bohrmann, G., Suess, E., 1996, Authigenic barites and fluxesof barium associated with fluid seeps in the Peru subduction zone: Earthand Planetary Science Letters, v. 144, p. 469–481.
Valley, J.W., and Graham, C.M., 1991, Ion microprobe analyses of oxygen iso-topes in magnetite and ilmenite [abs.]: Eos, Transactions, American Geo-physical Union, v. 72, p. 17, 292.
Valley, J.W., Eiler, J.M., Graham, C.M, Gibson, E.K, Jr., and Romanek, C.S.,1997, Ion microprobe analysis of oxygen and carbon isotope ratios in theALH84001 [abs.]: Lunar and Planetary Science Conference, v. 28, p.1475–1476.
Vannucchi, P., and Maltman, A.J., 2000, Insights into shallow-level processesof mountain building from the northern Apennines, Italy: Geological Soci-ety of London Journal, v. 157, p. 105–120.
Vaughan, D.J., and Craig, J.R., 1997, Sulfide mineral stabilities, morpholo-gies, and intergrowth textures, in Barnes, H.L., ed., Geochemistry of hy-drothermal ore deposits—third edition: New York, John Wiley, p. 367–434.
Warner, M.C., 1998, Geochemical characterization of sedimentary organicmatter and hydrothermal petroleum in the black-shale-hosted Zn-Pb de-posit at Red Dog mine, western Brooks Range, Alaska: Unpublished Ph.D.thesis, Bloomington, Indiana University, 216 p.
Werdon, M.B., 1996, Drenchwater, Alaska:Zn-Pb-Ag mineralization in amixed black shale-volcanic environment, in Coyner, A.R., and Fahey, P.L.,eds., Geology and ore deposits of the American Cordillera: Geological So-ciety of Nevada Symposium, Reno/Sparks, Nevada, April 1995, Proceed-ings, p. 1341–1354.
——1999, Geology and timing of Zn-Pb-Ag mineralization, northern BrooksRange, Alaska: Unpublished Ph.D. dissertation, Fairbanks, University ofAlaska, 130 p.
Williams, G.E., 1979, Sedimentology, stable-isotope geochemistry and paleo-environment of dolostones capping late Precambrian glacial sequences inAustralia: Journal of the Geological Society of Australia, v. 26, p. 377–386.
Wilson, S.A., Ridley, W.I., and Koenig, A.E., 2002, Development of sulfidecalibration standards for the laser ablation inductively-coupled plasma massspectrometry technique: Journal of Analytical Atomic Spectrometry, v. 17,p. 406–409.
Young, L.E., 1989, Geology and genesis of the Red Dog deposit, westernBrooks Range, Alaska: Canadian Institute of Mining and Metallurgy Bul-letin, v. 82, p. 57–67.
——1995, Empirical applications of common lead-isotope ratios to explo-ration: Society of Economic Geologists Newsletter, no. 22, p. 7–12.
——2004, A geologic framework for mineralization in the western BrooksRange, Alaska: ECONOMIC GEOLOGY, v. 99, p. 1281–1306.
Yu, M.L., and Lang, N., 1986, Mechanisms of atomic ion emission duringsputtering: Nuclear Instruments and Methods in Physics Research, v. 14, p.403–413.
Zierenberg, R.A., and Schmidt, J.M., 1988, Isotopic evidence for multiple sul-fur sources at the Red Dog Zn-Pb-Ag deposit, Noatak district, Alaska [abs.]:Geological Society of America Abstracts with Programs, v. 20, p. A-37.
1532 KELLEY ET AL.
0361-0128/98/000/000-00 $6.00 1532

SULFIDE MINERALOGY AND GEOCHEMISTRY OF THE RED DOG DEPOSITS 1533
0361-0128/98/000/000-00 $6.00 1533