textual information analysis for the integration of different data repositories
TRANSCRIPT
TEXTUAL INFORMATION ANALYSIS FOR THE INTEGRATION
OF DIFFERENT DATA REPOSITORIES
Ministero dell’Economia e delle FinanzeDipartimento per le Politiche di Sviluppo
UVER – Unità di verifica degli investimenti pubblici
Carlo Amati

THE DEPARTMENT FOR DEVELOPMENT POLICY

UVER: PUBLIC INVESTMENT VERIFICATION UNIT
ProjectVerification
InvestmentanalysisAssessment of results
On-site inspections
MonitoringdatabasesAssistance
and support
Forecastingmodels
EffectivenessAppraisal
MonitoringAnd Statistics
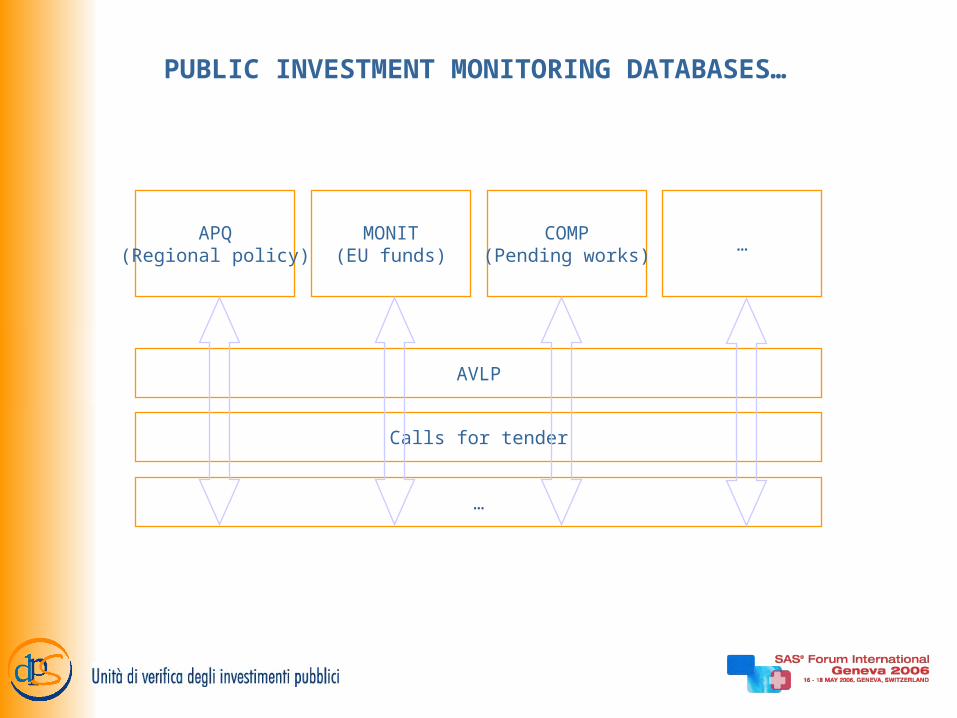
PUBLIC INVESTMENT MONITORING DATABASES…
APQ(Regional policy)
MONIT(EU funds)
COMP(Pending works)
…
AVLP
Calls for tender
…

… WERE BORN WITH DIFFERENT PURPOSES…
Progress monitoring (duration and expenditure)
Financial audit
Compliance to regulation
Notification to contractors

… AND INFORMATION IS EXTREMELY HETEROGENEOUS
Variable 1 Variable 2 Variable 3 Variable 4 Variable 5 Variable 6 Variable 7 Variable 8 Variable 9Project 1 DB 1 2 3 DB 1 3 DB 1 2 DB 2 3 DB 2 DB 1 2 3 DB 1 2 3 DB 3 DB 1Project 2 DB 1 3 DB 1 3 DB 1 DB 3 DB DB 1 3 DB 1 3 DB 3 DB 1Project 3 DB 1 2 DB 1 DB 1 2 DB 2 DB 2 DB 1 2 DB 1 2 DB 3 DB 1Project 4 DB 1 3 DB 1 3 DB 1 DB 3 DB DB 1 3 DB 1 3 DB 3 DB 1Project 5 DB 2 3 DB 3 DB 2 DB 2 3 DB 2 DB 2 3 DB 2 3 DB 3 DBProject 6 DB 1 2 3 DB 1 3 DB 1 2 DB 2 3 DB 2 DB 1 2 3 DB 1 2 3 DB 3 DB 1Project 7 DB 1 3 DB 1 3 DB 1 DB 3 DB DB 1 3 DB 1 3 DB 3 DB 1Project 8 DB 1 2 DB 1 DB 1 2 DB 2 DB 2 DB 1 2 DB 1 2 DB DB 1Project 9 DB 1 2 DB 1 DB 1 2 DB 2 DB 2 DB 1 2 DB 1 2 DB DB 1Project 10 DB 1 2 DB 1 DB 1 2 DB 2 DB 2 DB 1 2 DB 1 2 DB DB 1
Exact data
Incoherent data
Wrong data
Missing data

OUR GOAL
ASSEMBLE ALL THE
AVAILABLE INFORMATION
INTO A
UNIQUE FRAMEWORK
FOR THE ANALYSIS
OF PUBLIC INVESTMENTS

TOWARDS INTEGRATION
Data integration
(matching at micro-level)
Informationalapproach
Normativeapproach
MIP–CUP
(new primary key)

NORMATIVE APPROACH
MIP: Monitoring system of public investment (Monitoraggio Investimenti Pubblici), established by the Interministerial Committee for Economic Planning in order to produce timely information on the implementation of development policy (L.144/99).
CUP: Project primary key (Codice unico di progetto), required for each new or on-going project as of 1st Jan 2003 (L.3/03).Must be quoted in every administrative and accounting document, both paper and digital, regarding a public investment project and must be reported in every database related to the above projects (Reg. 24/04).

INFORMATIONAL APPROACH
Recognition of information related to same projects in different data repositories: each repository usually represents the same item in a specific format so that it is virtually unfeasible to find a common variable across different repositories and create an automatic join between information on the same project.
Integration of the related information: as the relevant information on a project is dispersed across several databases, some rules must be defined in order to merge it all into a single repository.
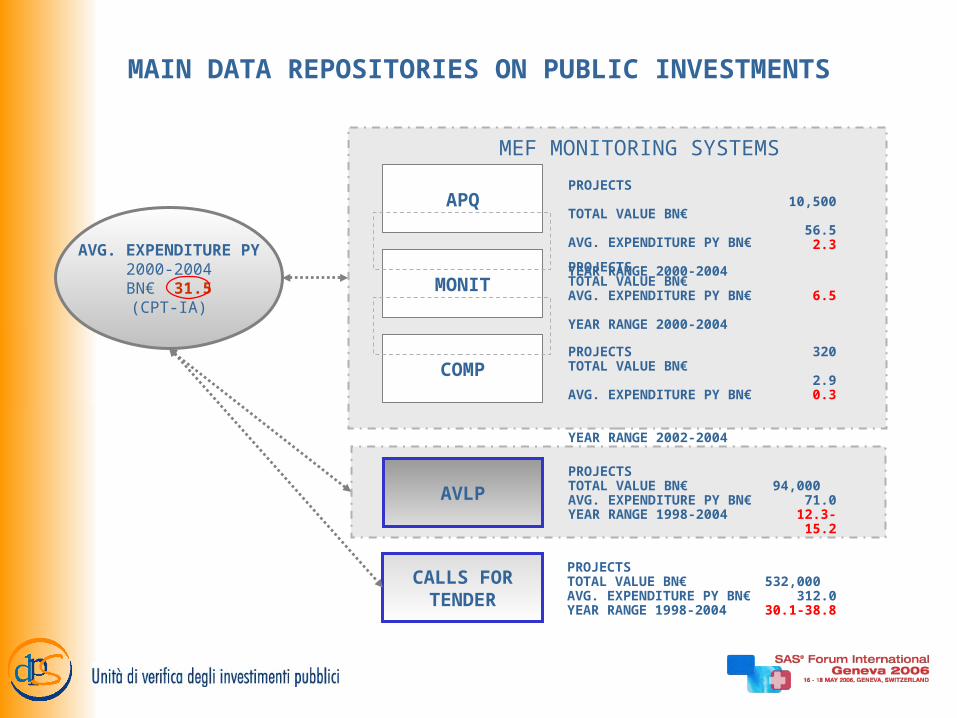
MAIN DATA REPOSITORIES ON PUBLIC INVESTMENTS
APQ
MONIT
COMP
PROJECTS TOTAL VALUE BN€ AVG. EXPENDITURE PY BN€ YEAR RANGE 2000-2004
CALLS FORTENDER
PROJECTSTOTAL VALUE BN€AVG. EXPENDITURE PY BN€YEAR RANGE 1998-2004
AVLP
MEF MONITORING SYSTEMS
PROJECTSTOTAL VALUE BN€ AVG. EXPENDITURE PY BN€ YEAR RANGE 2000-2004
PROJECTSTOTAL VALUE BN€ AVG. EXPENDITURE PY BN€ YEAR RANGE 2002-2004
AVG. EXPENDITURE PY2000-2004BN€ 31.5(CPT-IA)
PROJECTSTOTAL VALUE BN€AVG. EXPENDITURE PY BN€YEAR RANGE 1998-2004
10,500
56.52.3
6.5
320 2.90.3
94,000
71.012.3-15.2
532,000
312.030.1-38.8
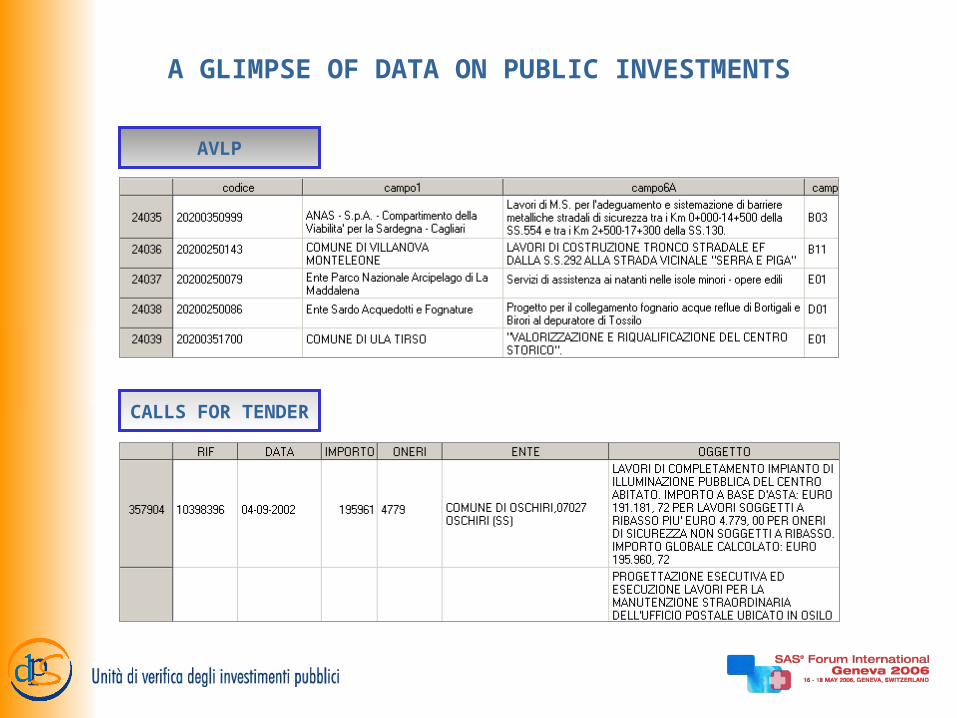
A GLIMPSE OF DATA ON PUBLIC INVESTMENTS
AVLP
CALLS FOR TENDER

OUR TOOLS
X445
Version 9.1.3
Client-serverarchitecture

DescriptionOther textual information
QUALITATIVE DATA
AmountsTimesLocation
QUANTITATIVE DATA
Representationof each projectin an N-dimensionalspace
PROJECT MATCHING
THE MATCHING PROCESS
Define a control sample with known matches/no matches
Define a best strategy to retrieve the known matches
Define an optimal stratification for potential matches
Apply the process to stratified test data

1 – THE CONTROL SAMPLE
Find a common variable with the least repeated values and treat the values with a single occurrency in each database as keys for a 1-to-1 matching.
50 billion potential matches between records of the two repositories (AVLP-CFT)
____________________________
____________________________
A good example of such variable is thecost of safety-plan.
The dataset built on single occurrencies of cost of safety-plan contains nearly 5,000 potential matches. 74% of them are visually processed and classified as MATCH (47%) or NO_MATCH (27%) and form the control sample.

2 – THE RETRIEVAL STRATEGY
Define a set of rules in order to classify matches on each variable
Define a combination method in order to synthesize the variable matches
Define a matching rule in order to separate out good candidates
The retrieval strategy is tested against the control sample.

2.1 – THE CLASSIFICATION RULES
Quantitative variables crisp rule based on a cut-off value for the difference between same variable in different databases (binary matches)
Qualitative variables (textual information) transformation into quantitative variables by means of:
Text analysis functions
Text mining algorithms
Then treatment as quantitative variables.

QUANTITATIVE VARIABLES
= Base bid, winning percentage, year of procurement, implementing body(*)
(*) Implementing bodies match if their strings are identicalSafety-plan cost is discarded as it is used to build the control sample
ix
Default cut-off value is zero.
Matching rule
iMATCH
dxxabs CFTi
AVLPi )(1 if
dxxabs CFTi
AVLPi )(0 if

CONTROL SUBSAMPLE AND QUANTITATIVE VARIABLES MATCHES
VariableCorrect matches incontrol subsample
% correct matchesin control subsample
Extra matches incontrol subsample
% extra matchesin control subsample
Base bid 7 16,7% 0 0,0%
Winning percentage 28 66,7% 44 2,0%
Year of procurement 39 92,9% 707 32,9%
Implementing body 40 95,2% 96 4,5%
For subsequent textual analysis it is easier to use a subset of the control sample.
51 candidate matches for Municipalities in Umbria:
42 matches 1 no match 8 no match (Umbria AVLP misclassfied)
Cartesian product for all possible combinations has 51x43=2193 records.

QUALITATIVE VARIABLE: PROJECT DESCRIPTION

TEXT MINING PROCESS
Project descriptions from both sets are appended into a single dataset which is fed into the Text Miner node.

TEXT MINING – DIMENSION REDUCTION
The initial number of roll-up terms is set equal to the number of terms appearing in more than one title. All other terms are dropped.
Roll-up terms
Singular value decomposition
The number of dimensions given by the roll-up terms is reduced. The new space has a lower dimension and can be handled more easily.

TEXT MINING – SVD DISTANCE
The distance in the new space is computed for all couples of projects from the two repositories.
The optimal cut-off value that discriminates matches from no-matches is obtained with a binary tree.

MATCHES IN THE CONTROL SUBSAMPLE
The best result is that of the SVD on targeted roll-up terms. This can be made even better by counting as match also the minimum SVD distance for each project (42 correct matches – 11 extra matches).
Differencemeasure
Correct matches incontrol subsample
% correct matchesin control subsample
Extra matches incontrol subsample
% extra matchesin control subsample
Raw SVD 22 52,4% 1 0,0%
Raw Roll-up 31 73,8% 5 0,2%
Spedis 34 81,0% 3 0,1%
Compged 28 66,7% 2 0,1%
Complev 26 61,9% 6 0,3%
Targeted Roll-up 37 88,1% 5 0,2%
SVD on targeted roll-up 39 92,9% 6 0,3%

2.2 – THE COMBINATION METHOD2.3 – THE DISCRIMINATING RULE
Combination method Sum of the binary matching flags for all the variables
Other methods: weighted sum, logistic model
Discriminating rule Strict match if # matching vars GE 3
Loose match if # matching vars GE 2
Other rules: conditions on single variables

CONTROL SAMPLE RESULTS
1
15
21
50
5
10
15
20
25
0 1 2 3 4 5
Number of matching variables
Num
ber
of c
orre
ct m
atch
es
Lo
os e
cu
t-o
ff v
alu
e
Str
ict
c ut -
off
va
lue
With textual info the proportion of false positives decreases up to 58 percentage points.
Number of matching variables with (without) textual info
Correctmatches
% correctmatches
Extra matcheswith textual info
Extra matcheswithout textual info
% false positiveswith textual info
% false positiveswithout textual info
4 (3) 26 61,9% 0 0 0,0% 0,0%
3 (2) 41 97,6% 1 63 2,4% 60,6%
2 (1) 42 100,0% 67 784 61,5% 94,9%

3 – THE OPTIMAL STRATIFICATION
Stratification variables: type of implementing body, region, year of procurement.
The number of potential matches grows like n2.
Municipalities only, covering more than one half of the projects, would lead to 12,200 million potential matches.
Regional stratification, causes drop to total 968 million (regional variation in the range 0.4 - 400 million). Further stratification may be needed in more dense regions (compressed dataset of 400 million records requires nearly 15GB for a match on one quantitative variable).
Number of matches

4 – APPLICATION TO STRATIFIED TEST DATA
Type of implementing body: MunicipalitiesRegion: MarcheYear of procurement: 2004
Matches in control sample: 2
AVLP projects: 247CFT projects: 506
Automatic strict matches: 128 (52%)Automatic loose matches: 160 (65%)

USAGE OF MATCHING RESULTS
Replacement of missing data
Correction of mistakes
Identification of potential evaders
Data integration
FURTHER DEVELOPMENT
Textual information preprocessing Built-in macros Exploratory analyses with Text Miner
Use of fuzzy classification rules (intervals and levels of
uncertainty, instead of cut-off values)
Stratification variables error-handling
Tie-breaks Multiple records in CFT referring to the same tender Multiple tenders in CFT referring to the same project Very similar records
