textproposals: a text-speci c selective search algorithm
TRANSCRIPT

TextProposals: a Text-specific Selective Search
Algorithm for Word Spotting in the Wild
Lluıs Gomez, Dimosthenis Karatzas
Computer Vision Center, Universitat Autonoma de Barcelona. Edifici O, Campus UAB,08193 Bellaterra (Cerdanyola) Barcelona, Spain. E-mail: lgomez,[email protected]
Abstract
Motivated by the success of powerful while expensive techniques to recognize
words in a holistic way [1, 2, 3], object proposals techniques emerge as an
alternative to the traditional text detectors. In this paper we introduce a
novel object proposals method that is specifically designed for text. We rely
on a similarity based region grouping algorithm that generates a hierarchy
of word hypotheses. Over the nodes of this hierarchy it is possible to apply
a holistic word recognition method in an efficient way.
Our experiments demonstrate that the presented method is superior in
its ability of producing good quality word proposals when compared with
class-independent algorithms. We show impressive recall rates with a few
thousand proposals in different standard benchmarks, including focused or
incidental text datasets, and multi-language scenarios. Moreover, the com-
bination of our object proposals with existing whole-word recognizers [2, 3]
shows competitive performance in end-to-end word spotting, and, in some
benchmarks, outperforms previously published results. Concretely, in the
challenging ICDAR2015 Incidental Text dataset, we overcome in more than
10 percent f-score the best-performing method in the last ICDAR Robust
Preprint submitted to Pattern Recognition February 2, 2017
arX
iv:1
604.
0261
9v3
[cs
.CV
] 1
Feb
201
7

Reading Competition [4]. Source code of the complete end-to-end system is
available at https://github.com/lluisgomez/TextProposals.
Keywords: object proposals, scene text, perceptual organization, grouping
1. Introduction
Textual content in images can provide relevant information in the pro-
cess of image understanding and retrieval. It can be used for image search in
large collections, and in many other applications such as automatic transla-
tion, aid tools for visually impaired people, robot navigation, etc. However,
robust reading of text in uncontrolled environments is a challenging task due
to a multitude of factors such as the diversity of acquisition conditions, low
resolution, font variability, complex backgrounds, different lighting condi-
tions, blur, etc.
Until recently, existing methods have approached this difficult task by
relying on the detection and recognition of individual characters. So the ini-
tial set of detected character candidates are then grouped into words based
on spatial and/or lexicon constraints. Individual character segmentation is
central on such methods, and has attracted vast interest from researchers in
the scene text understanding field [5, 6, 7, 8, 9]. However, a proper character
segmentation is not always feasible with existing techniques. Figure 1 shows
some examples of scene text where individual character segmentation is par-
ticularly difficult: e.g. cursive text, dot-matrix text, text with low contrast,
degraded characters, heavily-cluttered backgrounds, and characters affected
by highlights, shadows, blur, partial occlusions, or with very low quality.
In this paper we take a different approach that generates word propos-
2

Figure 1: Examples of scene text instances where region based methods
performing individual character classification are prone to fail. We show the
word proposals generated by our method (blue) with better Intersection over
Union (IoU) over their corresponding ground truth bounding boxes (green).
als without an explicit character segmentation. Similarly to state-of-the-art
object detection systems [10, 11], the main idea is to produce a set of good
quality word proposals and then run a classifier on the proposed bounding
boxes. Jaderberg et al. [3] have recently shown that such a holistic approach
can lead to impressive performance gains in end-to-end word spotting bench-
marks. Their system is based on a deep Convolutional Neural Network for
holistic word recognition that is applied to a set of region proposals pro-
vided by a fast detector [12] and a class-independent object proposals algo-
rithm [13]. In this paper we show how this performance gain can be even
broader by using class-specific proposals.
Our main contribution is the design of a text-specific object proposals
algorithm by taking into account the particular specificities of text. Our
3

method is grounded in the same intuitions developed during the last decade
for traditional text detection methods based on connected components group-
ing [14, 15, 16, 17, 18, 19]: we rely on a hierarchical clustering analysis that
iteratively agglomerates a set of connected components by their proximity
and similarity. But there are three fundamental differences in the way we
design this agglomerative process: (1) we do not assume that the initial con-
nected components correspond to individual characters; (2) we do not aim to
model the exact formation of a well-defined hierarchy of character sequences
(i.e. with characters at the first level, bi-grams at the second level, etc.); and
(3) we do not presume that there is a single best similarity measure that is
going to generate the correct text groupings in all possible cases. Instead,
we consider here of our interest any connected component extracted from
the input image by casting them as potential text-parts candidates – that
may potentially be just small strokes, disjoint character-parts, or merged
groups of characters such as in cursive text. Then, we build several simi-
larity hierarchies, using complementary similarity cues, with the hope that
every text instance (e.g. words) in the input image will correspond to some
connected component grouping (a node) in, at least, one of such hierarchies.
Figure 1 shows how our method is able to produce good quality word propos-
als in different real cases for which existing individual character segmentation
techniques are not well-suited.
The complete list of contributions made in this paper is as follows:
• We present a text-specific object proposals algorithm. To the best of
our knowledge this is the first object proposals method specifically de-
signed for text detection. As mentioned before, this approach supposes
4

a methodological shift in the way text detectors have been traditionally
designed and integrated in end-to-end pipelines.
• We design a novel text proposals ranking strategy, and a non-maximal
suppression procedure, that are made efficient by exploiting the inclu-
sion relation of the nodes in the hierarchies provided by our method.
• We provide exhaustive experimentation to compare our algorithm with
well-known generic object proposals methods on the task of text de-
tection in the wild. These experiments demonstrate that our method
is superior in its ability of producing good quality word proposals in
an efficient way. We show impressive recall rates with a few thousand
proposals in different standard benchmarks, including focused or inci-
dental text datasets, and multi-language scenarios.
• We combine our text proposals algorithm with existing whole-word
recognizers [2, 3]. This combination shows state-of-the-art end-to-end
word spotting performance in several standard datasets, and, in some
benchmarks, outperforms previously published results with a noticeable
gain.
• The source code of the complete end-to-end system is made publicly
available.
2. Related Work
An exhaustive survey of recent developments in scene text detection and
recognition can be found in [20] and [21], while corresponding surveys of
earlier works on camera-based document and scene text analysis are also
available in [22, 23].
5

Scene text detection methods can be categorized into sliding window
search methods and connected component based approaches. In the first
category, Coates et al. [5] propose the use of unsupervised feature learning
to generate the features for character versus background classification and
character recognition. They evaluate a single-layer Convolutional Neural
Network (CNN) model on each possible window of the input image at mul-
tiple scales. Wang et al. [6] and Jaderberg et al. [7] have also used CNNs for
text detection in a similar manner, but using deeper CNN models.
Other than CNNs, more traditional hand-crafted features and statistical
models have been also used within this exhaustive search approach. Wang et
al. [24] propose an end-to-end recognition system based on a sliding window
character classifier using Random Ferns, with features originating from a
HOG descriptor. Other methods based on HOG features have been proposed
by Mishra et al. [25] and Minetto et al. [26] among others.
Methods based in sliding window yield good text localization results.
Their main drawback compared to connected component based methods is
their high computational cost, as sliding window approaches are confronted
with a huge search space. Moreover, these methods are limited to detection
of a single language and orientation for which they have been trained on.
Connected component based methods, on the other hand, are based on
a typical bottom-up pipeline: first, they apply a segmentation algorithm
to extract regions (connected components); then, they classify the resulting
regions into character or background; and finally, the identified characters
are grouped into longer sequences (i.e. words or text lines).
Yao et al. [16, 27] have proposed a method for detecting multi-script
6
and arbitrarily oriented text by extracting regions (connected components)
from the Stroke Width Transform (SWT) domain, a local image operator
proposed earlier for text detection by Epshtein et al. [28]. Other methods
have build on top of the SWT algorithm by combining it with specialized
edge detectors [29] or deep belief networks [30].
On the other hand, another technique extensively used to extract char-
acter candidate connected components is the Maximally Stable Extremal
Regions (MSER) [31] algorithm. Neumann and Matas [32] have proposed
a method for scene text detection and recognition that performs individual
MSER classification using hand-crafted region-based features (e.g. aspect ra-
tio, compactness, etc.), demonstrating the ability of MSER algorithm for de-
tecting promising character candidates. They further extend their work in [8]
proposing a region representation derived from MSER where character/non-
character classification is done for each possible Extremal Region (ER).
The effectiveness of MSER for character candidates detection is also ex-
ploited by Chen et al. [33], Novikova et al. [34], Shi et al. [35, 36], Alsharif et
al. [37], and Yin et al. [18] among many others. Some of this works have
proposed extensions of the MSER algorithm in order to filter or enhance the
regions in the component tree. Yin et al. [18] method prunes the MSER
tree using the strategy of minimizing regularized variations. Chen et al. [33]
and Sun et al. [38] have proposed the edge-enhanced and color-enhanced
contrasting extremal region (CER) algorithms respectively.
Huang et al. [39] make use of the MSER tree as a character proposals
generator and apply a deep CNN text classifier to their locations. A similar
approach is also used by Sun et al. [38] but using a fully connected network.
7
This way, they take advantage of both texture-based and region-based text
detection approaches. Another method that combines the advantages of
sliding-window and region-based approaches is proposed by Neumann and
Matas in [9], where characters are detected as image regions that contain
certain strokes with specific orientations in specific positions.
All the aforementioned mentioned methods, either region-based or texture-
based, rely in generating individual character candidates and are comple-
mented with a post-processing step where regions assessed to be characters
are grouped together into words or text lines based on spatial, similarity,
and/or collinearity constraints. This way, the hierarchical and recursive
structure of text has been traditionally exploited in a post-processing stage
with heuristic rules [28, 33, 32, 8], usually constrained to search for horizon-
tally aligned text in order to avoid the combinatorial explosion of enumerat-
ing all possible text lines.
Yao et al. [16] make use of a greedy agglomerative clustering for arbi-
trarily oriented text components grouping in which neighboring regions are
grouped together if their average alignment is under a certain threshold. Yin
et al. [18] propose a self-training distance metric learning algorithm that can
learn distance weights and clustering thresholds simultaneously for charac-
ter groups detection in a similarity feature space. A similar metric learning
approach has been also explored by the authors if this paper in [19].
It is important to notice that all these grouping processes are assuming
that their atomic elements are well-segmented individual characters. Either
because they directly validate the arrangement of character sequences using
a typographic model [28, 33, 32, 8], or because they learn an optimal group-
8
ing strategy from examples of well-segmented character groupings [18, 19].
In this paper we introduce a scene text detection methodology that takes
inspiration from existing connected components based methods but does not
make such an assumtion. Thus, we do not rely in individual character seg-
mentation, neither in a rigid grouping model to describe the way individual
characters are organized in well-organized sequences.
Over and above the specific problem of scene text detection the use of
object proposals methods to generate candidate class-independent object lo-
cations has become a popular trend in computer vision in recent times [40].
The main benefits are the reduction of the search space by providing a small
set of high quality locations, thus allowing the use of more expensive and
powerful recognition techniques, and the ability to naturally localize objects
without a fixed aspect ratio. Object proposals algorithms are aligned with
the object-level saliency detection paradigm [41, 42] in modeling a selective
process to guide the recognition analysis towards particular regions of interest
in the image.
In general terms we can distinguish between two major types of object
proposals methods: the ones that make use of exhaustive search to evaluate
a fast to compute objectness measure [43, 13], and the ones where the search
is driven by segmentation and grouping processes [11, 44, 45].
Overall, generic object proposals algorithms are designed to target objects
that can be isolated from its background as a single body: grouping-based
methods do it by agglomerating adjacent regions; and most of the sliding
window based methods do it intrinsically as they are actually trained with
examples of such object type. Thus, in their majority these generic methods
9

are not adequate for text detection, just because they are designed for a
different task.
However, the use of generic object proposals techniques for scene text
understanding has been exploited recently by Jaderberg et al. [3] with im-
pressive results. Their end-to-end pipeline combines object proposals from
the EdgeBoxes [13] algorithm and a trained aggregate channel features de-
tector [12] with a powerful deep Convolutional Neural Network for holistic
word recognition. Still, their method uses a CNN-based bounding box re-
gression module on top of region proposals in order improve their quality.
In this paper we design a text-specific selective search method that, con-
trary to existing generic algorithms, aims directly to the detection of text
component groupings. Our method is similar to the generic selective search
algorithm [11], but differs from it in many aspects by taking into account the
specificities of text regions, that are fundamentally different of the generic
notion of object as normally used in Computer Vision research.
3. TextProposals: a text-specific selective search algorithm
Our text-specific object proposals algorithm is grounded on a basic “seg-
mentation and grouping” procedure: first we extract connected components
from the input image, and then we group them by their similarity using the
Single Linkage Clustering (SLC) method. This clustering analysis produces
a dendrogram where each node corresponds to a group of connected com-
ponents and defines a bounding box proposal. The main drawback of this
simple “segmentation and grouping” approach is that we must found the
optimal segmentation strategy and the optimal similarity metric in order to
10

robustly deal with the extreme variability of scene text. The choice of a
single segmentation and similarity metric, no matter which, will often result
in missing detections for some particular text instances.
The TextProposals algorithm solves this problem and increases the over-
all detection recall of the basic “segmentation and grouping” by consider-
ing several input channels, and several complementary similarity measures.
Moreover, our method includes an efficient ranking strategy that priori-
tizes the best word proposals found. Figure 2 presents the diagrams of the
“segmentation-grouping” and TextProposals algorithms.
As illustrated in Figure 3 our method is able to produce good quality word
proposals in different cases for which a single best segmentation strategy and
similarity metric does not exists. From left to right we show: the detail of
a single word from the original input image, the initial over-segmentation
(each connected component in a different color), and the group of connected
components that generates the word proposal with better Intersection over
Union with the ground truth word bounding box. In the case of the word
in the top row, the best proposal has been generated by applying the Single
Linkage Clustering (SLC) algorithm using the Euclidean distance in a three-
dimensional space defined by the average intensity value of the connected
components and the x, y coordinates of their centers. In the other rows
the same strategy does not produce a good word proposal, either because
the shadowing effect breaks the color similarity of text regions or because
they have different colors by design. Instead the best proposal is generated
respectively in the spaces defined by the diameter of the regions and the x, y
coordinates of their centers (middle row), or by the mean background color
11

Input image Segmentation Grouping
(a) The basic “segmentation and grouping” procedure used in our method: first we extract
connected components from the input image, then we group the connected components
by their similarity using the SLC algorithm. Each node in the dendrogram generated this
way corresponds to a bounding box proposal.
NIn
put
channels
M Similarity measures
Ranked
pro
posa
ls
(b) The TextProposals algorithm increases the overall detection recall of the basic “seg-
mentation and grouping” (a) by considering several input channels and scales, and several
similarity measures. A ranking strategy prioritizes the best word proposals found.
Figure 2: Diagrams of the “segmentation-grouping” (a) and TextProposals
(b) algorithms.
12

(a) (b) (c)
Figure 3: Detailed steps of our method giving rise to good proposals for three
different scene text words. From left to right: the detail of a single word from
the original input image, the initial over-segmentation (each region in a dif-
ferent color), and the group of regions that generates the word proposal with
better Intersection over Union with its corresponding ground truth bounding
box.
and the x, y coordinates of their centers (bottom row).
These examples make clear that our grouping can not rely in a single
similarity measure of text-parts, as due to design, scene layout, and envi-
ronment effects different similarity cues might be active in each case. As a
result a flexible approach is proposed, where various weak similarity cues are
explored independently in parallel. It is also important to notice how in these
examples we make use of many overlapping regions (connected components)
that are not filtered in any way by their shapes or any other attribute. Also
notice how the best grouping in the top row example would be rejected by
any discriminative rule/classifier based on regions collinearity. Contrary to
13

traditional text detection methods in here we avoid the use of such filters.
3.1. Region decomposition
The first step in our method is the initial pixel-level segmentation where
the atomic parts, that will give rise to text groupings, are identified. For
this we make use of the Maximally Stable Extremal Regions (MSER) algo-
rithm [31] as in many existing text detection methods. However, since the
regions that are of our interest are not only well-segmented characters, we
can relax the parametrization of the MSER algorithm in order to produce
a richer over-segmentation with many overlapping regions. The obtained
regions are not filtered in any way.
In fact, the proposed method is not strictly dependent on the MSER
algorithm and would be able to produce similar results with any other over-
segmentation technique as far it is able to extract small level sets (connected
components) corresponding to text parts. Thus, the use of the MSER al-
gorithm here can be seen as a way to optimize the whole object proposals
method by reducing the number of regions to analyze compared with using
the whole component tree of the image.
3.2. Group Hypothesis Creation
The grouping process starts with a set of regions Rc extracted with the
MSER algorithm. Initially each region r ∈ Rc starts in its own cluster and
then the closest pair of clusters (A,B) is merged iteratively, using the single
linkage criterion (SLC) (min { d(ra, rb) : ra ∈ A, rb ∈ B }), until all regions
are clustered together (C ≡ Rc).
14

For defining the distance metric d(ra, rb) in order to describe similarity
relations between text-parts of a higher-level text grouping (e.g. words) we
aim to use a set of complementary features with low computational cost. In
here we use a set of seven weak similarity cues for which the corresponding
region features can be easily computed in a sequence as illustrated in Figure 4.
The list of features is as follows:
Intensity and color mean of the region. We calculate the mean intensity
value and the mean color, in L*a*b* colorspace, of the pixels that belong to
the connected component. For this we make use of the region pixels as a
mask (see Figure 4d) on the grayscale or color image as shown in Figure 4e.
Stroke width. We approximate the stroke width using a Distance Trans-
formed version of the connected component mask. Concretely, for each pixel
of the connected component mask (4d) we calculate the L1 distance to the
closest zero pixel using the algorithm described in [46] with default parame-
ters. From the distance transformed image (see Figure 4f) we take the average
of the row-wise maximum distance values as an approximation of the stroke
width of the region.
Intensity and color mean of the outer boundary. Similarly as for the
intensity and color mean of the region, we calculate the mean intensity value
and the mean color, in L*a*b* colorspace, of the pixels that belong to the
outer boundary of the connected component. For this we first create a mask
with the outer boundary pixels (see Figure 4g) by dilation of the original
region mask with a 3× 3 rectangular kernel, and subtraction of the original
region pixels. Then, we apply this mask on the grayscale, as in Figure 4h, or
color image.
15

(a) (b) (c)
(d)
µI = 122
µI = 145
µI = 151
(e)
µS = 18.0
µS = 16.5
µS = 15.1
(f) (g)
µI = 109
µI = 118
µI = 122
(h) (i)
µ∆ = 20
µ∆ = 31
µ∆ = 31
(j)
Figure 4: Computation sequence of the region features comprising the sim-
ilarity measures used in the SLC grouping analysis. Different masks (d,g,i)
are applied to the input color image (a), its gray scale version (b), or its gra-
dient magnitude values (c) to calculate simple features: e.g. mean intensity
value of the region (e), stroke width (f), mean intensity value on the outer
boundary (h), or mean gradient magnitude on the region border. Feature
computation details are provided on the main text.
16

Gradient magnitude mean on the border. We calculate the mean of
the gradient magnitude on the border of the region. Here we make use of a
mask covering the pixels of both the inner and outer boundaries of the region
(see Figure 4i). We proceed similarly as before but combining a dilation and
an erosion operation with the same 3 × 3 rectangular kernel. In this case
the mask is applied to the gradient magnitude values of the input image as
shown in Figure 4j.
Diameter of the region. We fit an ellipse to the original region pixels
using the algorithm described in [47] and take the length of the major axis
of the ellipse as the diameter of the region.
Each of these similarity features is used independently but coupled with
spatial information, i.e. the x, y coordinates of the regions’ centers. So,
independently of the similarity feature, we restrict the groups of regions that
are of our interest to those that comprise spatially close regions. Thus, in the
end we run the SLC analysis with seven different complementary distance
metrics d(i) with i = {1, . . . , 7}:
d(i)(ra, rb) = (f i(ra)− f i(rb))2 + (xa − xb)2 + (ya − yb)2 (1)
where f i is one of the simple similarity features listed above, and {xa, ya},
{xb, yb} are the coordinates of the centers of regions ra and rb respectively.
Using d(i)(ra, rb) as defined equation 1 our clustering analysis remains rota-
tion invariant by using the squared Euclidean distance between the regions’
centers. And thus our method is able to generate proposals for arbitrarily
oriented text instances. Optionally it is possible to prioritize horizontally
aligned regions to merge first by adding a small factor λ ∈ [0, 1] to the x
17

coordinates term:
d(i)(ra, rb) = (f i(ra)− f i(rb))2 + λ(xa − xb)2 + (ya − yb)2 (2)
At this point it is obvious that the more we diversify our grouping strate-
gies, the more chances we have to find a good proposal for a given target
word, but this is at the cost of increasing the total number of word propos-
als. In the following we list a number of possible diversification strategies
that can be combined in different ways. In the experimental section 4.1.1 we
will analyze the performance of different combinations of these strategies in
order to find an optimal configuration as trade-off between detection recall
and number of generated proposals.
Diversification by complementary similarity cues. We use SLC clus-
tering as explained before with different similarity measures.
Diversification by use of different color channels. We extract regions
using the MSER algorithm on different color channels separately.
Diversification by use of different spatial pyramid levels. We extract
MSER regions from a three-level spatial pyramid.
Using all mentioned diversification strategies would generate a total of
84 similarity hierarchies (3 pyramid levels × 4 color channels × 7 similarity
cues). Accordingly, the complete TextProposals method is detailed in Algo-
rithm 1, where the procedure used to score and rank bounding boxes will be
explained in the next section.
3.3. Text Proposals Ranking
Once we have created a similarity hierarchy using SLC, with each of its
nodes representing a text proposal, we need an efficient way to sort the nodes
18
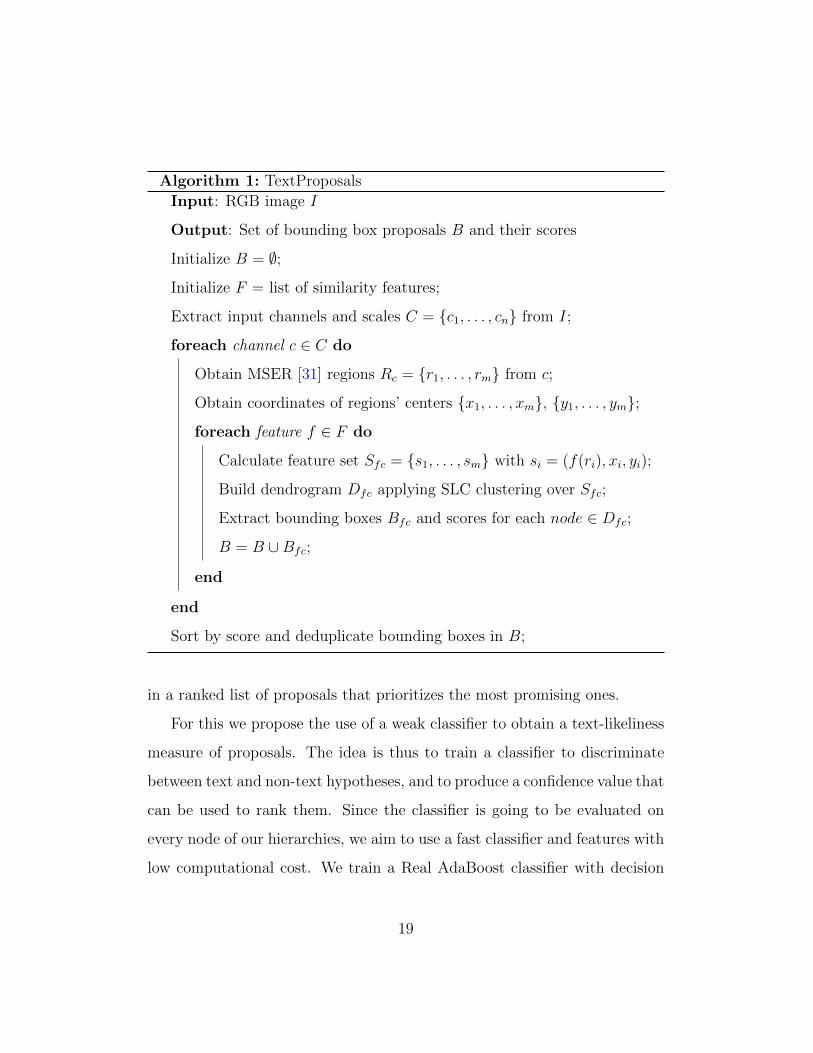
Algorithm 1: TextProposals
Input: RGB image I
Output: Set of bounding box proposals B and their scores
Initialize B = ∅;
Initialize F = list of similarity features;
Extract input channels and scales C = {c1, . . . , cn} from I;
foreach channel c ∈ C do
Obtain MSER [31] regions Rc = {r1, . . . , rm} from c;
Obtain coordinates of regions’ centers {x1, . . . , xm}, {y1, . . . , ym};
foreach feature f ∈ F do
Calculate feature set Sfc = {s1, . . . , sm} with si = (f(ri), xi, yi);
Build dendrogram Dfc applying SLC clustering over Sfc;
Extract bounding boxes Bfc and scores for each node ∈ Dfc;
B = B ∪Bfc;
end
end
Sort by score and deduplicate bounding boxes in B;
in a ranked list of proposals that prioritizes the most promising ones.
For this we propose the use of a weak classifier to obtain a text-likeliness
measure of proposals. The idea is thus to train a classifier to discriminate
between text and non-text hypotheses, and to produce a confidence value that
can be used to rank them. Since the classifier is going to be evaluated on
every node of our hierarchies, we aim to use a fast classifier and features with
low computational cost. We train a Real AdaBoost classifier with decision
19

stumps using as features F i(G) the coefficients of variation of the individual
region features f i described in the previous section 3.2 (e.g. stroke width,
diameter, foreground mean intensity value, etc.):
F i(G) = σi/µi (3)
where µi and σi are respectively the mean and standard deviation of the i’th
feature f i in a particular group G, {f i(r) : r ∈ G}.
In addition we also use another set of simple bounding box based features
that proved to improve the weak classifier performance. First we obtain the
bounding box of the group constituent regions, and the bounding box en-
closing only the regions’ centers. A set of simple features originates from
calculating: (1) the ratio between the areas of both bounding boxes, (2)
the ratio between their widths, (3) the ratio between their heights, (4) the
ratio between the difference of their left-most x coordinates and the differ-
ence of their right-most x coordinates, and (5) the same as in 4 but for the
top/bottom y coordinates differences.
All the used group-level features can be computed efficiently in an incre-
mental way along the SLC hierarchies, and all f i individual region features
have been previously computed for the cluster analysis.
To train the classifier we mine for positive and negative samples in the
ICDAR2013 training set images with the following procedure: first, for each
training image we generate similarity hierarchies using all the diversification
strategies described in section 3.2; second, for each regions grouping (node)
in each of the 84 generated hierarchies we find the best matching ground-
truth annotation in terms of their bounding box Intersection over Union
20

(IoU); then we take the group as a positive sample if IoU > 0.7, otherwise
we take it as a negative sample if IoU < 0.2 and it does not fully overlap
with a ground truth bounding box. This way we obtain approximately 200k
positive samples and 1 million negative samples, then we balance the training
data by randomly selecting 200k of the negative samples.
At test time we obtain a list of proposals ranked with scores provided by
evaluation of the AdaBoost classifier on every node of our hierarchies.
3.3.1. Hierarchy-based inference and optimization
With the ranked list of word proposals we can build an end-to-end pipeline
straightforward by evaluating a holistic word recognition method in all of
them (or in the N best ranked) and then performing a Non-Maximal Sup-
pression (NMS) strategy as in [3]. However, being our word proposals orga-
nized in a hierarchy where each node (i.e. proposal) has an inclusion relation
with its respective childs allows us to do a much more efficient inference.
First of all, object proposals algorithms normally need to remove dupli-
cated detections in order to not waste computation resources by evaluating
the final classification model more than once in the same bounding box. In
our case the number of duplicated detections may account for large numbers,
because in many cases our agglomerative clustering merges overlapping re-
gions that produce no change in the merged grouping bounding box. At the
time of building our similarity hierarchies we take this into account and set a
flag for whether the classifier response (both the word transcription and the
classification score/probability) has to be calculated in a particular node or it
can be just propagated from it’s childs. This process of deduplication within
a single hierarchy has no cost for us. Since we have several independent
21
hierarchies, we also maintain a hash table of evaluated bounding boxes.
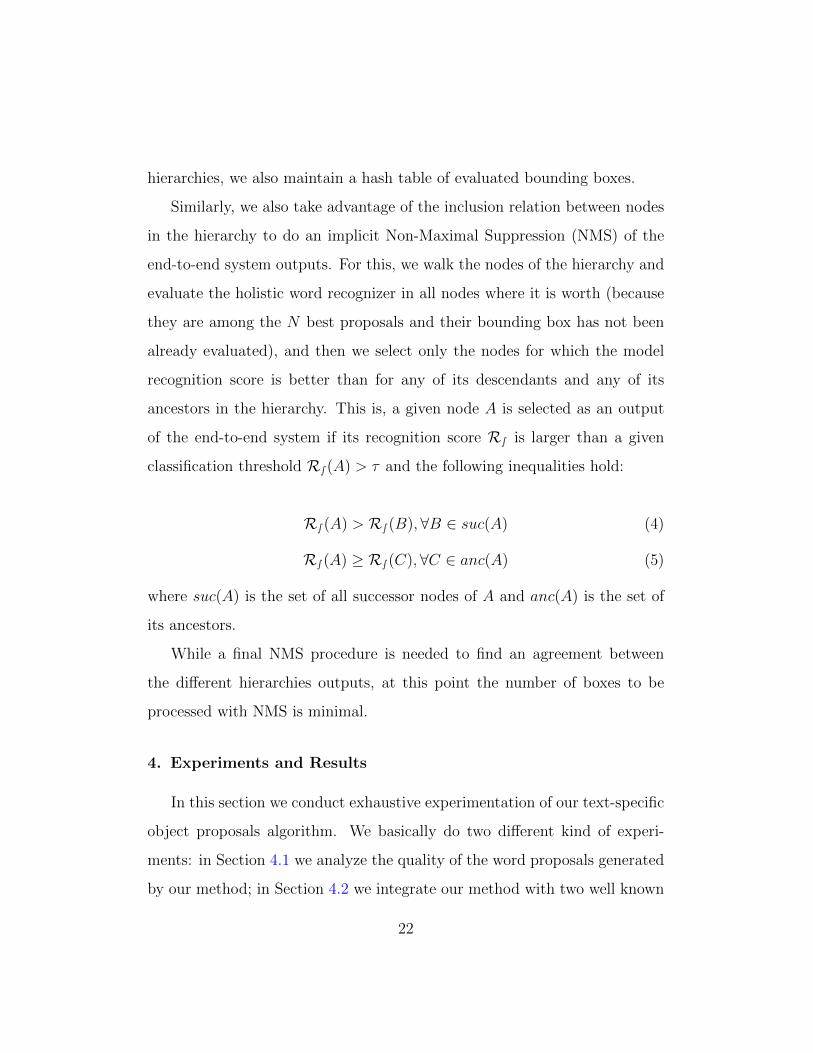
Similarly, we also take advantage of the inclusion relation between nodes
in the hierarchy to do an implicit Non-Maximal Suppression (NMS) of the
end-to-end system outputs. For this, we walk the nodes of the hierarchy and
evaluate the holistic word recognizer in all nodes where it is worth (because
they are among the N best proposals and their bounding box has not been
already evaluated), and then we select only the nodes for which the model
recognition score is better than for any of its descendants and any of its
ancestors in the hierarchy. This is, a given node A is selected as an output
of the end-to-end system if its recognition score R∫ is larger than a given
classification threshold R∫ (A) > τ and the following inequalities hold:
R∫ (A) > R∫ (B),∀B ∈ suc(A) (4)
R∫ (A) ≥ R∫ (C),∀C ∈ anc(A) (5)
where suc(A) is the set of all successor nodes of A and anc(A) is the set of
its ancestors.
While a final NMS procedure is needed to find an agreement between
the different hierarchies outputs, at this point the number of boxes to be
processed with NMS is minimal.
4. Experiments and Results
In this section we conduct exhaustive experimentation of our text-specific
object proposals algorithm. We basically do two different kind of experi-
ments: in Section 4.1 we analyze the quality of the word proposals generated
by our method; in Section 4.2 we integrate our method with two well known
22

holistic word classifiers [2, 3] and evaluate the end-to-end word spotting per-
formance of the system.
In our experiments we make use of the following scene text datasets:
the ICDAR Robust Reading Competitions datasets (ICDAR2003 [48], IC-
DAR2013 [49], and ICDAR2015 [4]), the Street View Text dataset (SVT) [50],
and the Multi-Language end-to-end (MLe2e) dataset [51]. In all cases we pro-
vide results for their official test sets. The ICDAR2013 train set has been
used to train the proposals ranking model described in Section 3.3.
4.1. Quality of object proposals
The evaluation framework used in all this section is the standard for ob-
ject proposals methods [40] and is based on the analysis of the detection
recall achieved by a given method under certain conditions. Recall is calcu-
lated as the ratio of ground truth bounding boxes that have been predicted
among the word proposals with an intersection over union (IoU) larger than
a given threshold. This way, we evaluate the recall at a given IoU threshold
as a function of the number of proposals, and the quality of the first ranked
N proposals by calculating their recall at different IoU thresholds.
4.1.1. Evaluation of diversification strategies
We analyze the performance of different variants of our method by eval-
uating different combinations of diversification strategies presented in Sec-
tion 3. Table 1 shows the average number of proposals per image, recall rates
at various IoU thresholds, and average time performance obtained with some
of the possible combinations.
23

Method # prop. 0.5 IoU 0.6 IoU 0.7 IoU 0.8 IoU 0.9 IoU Avg. time(s)
P0+I+D 1614 0.86 0.74 0.53 0.26 0.07 0.36
P0+I+F 1455 0.88 0.81 0.63 0.31 0.09 0.36
P0+I+B 1488 0.84 0.73 0.52 0.23 0.06 0.36
P0+I+S 1596 0.80 0.71 0.50 0.20 0.06 0.36
P0+I+DFBGS 4588 0.94 0.88 0.71 0.41 0.11 0.87
P0+I+DFBGSFlabBlab 5441 0.94 0.88 0.71 0.41 0.11 1.16
P0+RGB+DFBGS 12996 0.94 0.91 0.82 0.52 0.19 2.42
P0P1+RGB+DFBGS 16795 0.95 0.94 0.88 0.59 0.22 2.74
P0P1P2+RGB+DFBGS 18297 0.95 0.94 0.88 0.61 0.25 2.91
P0P1P2+RGBI+DFBGS 21663 0.96 0.94 0.88 0.61 0.26 3.66
Table 1: Detection recall at different IoU thresholds and running time com-
parison using different diversification strategies in validation data. Color
channels: (R), (G), (B), and (I). Spatial pyramid levels: (P0) 1 : 1 scale,
(P1) 1 : 2 scale, (P2) 1 : 4 scale. Similarity cues: (D) Diameter, (F) Fore-
ground intensity, (B) Background intensity, (G) Gradient, (S) Stroke width,
(Flab) Foreground Lab color, and (Blab) Background Lab color.
Notice that while an IoU score of 0.5 is normally accepted in generic ob-
ject detection tasks, for scene text detection we would rather prefer better
quality proposals, e.g. with IoU around 0.7, because intuitively proposals
with a 0.5 IoU are likely to contain only part of the ground-truth word and
thus may complicate the final recognition. On the other hand good word pro-
posals do not necessary need to reach large IoU scores because in some cases
the ground-truth information is quite ambiguous in describing the bound-
ing box padding allowed for a “word object” annotation. To illustrate this
issues we show in Figure 5 some examples of word proposals generated by
24

our method and the IoU with their matching ground truth bounding boxes.
Ultimately, we note that IoU-based analysis of object proposals is not only
task dependent but also very sensible to the dataset bounding boxes anno-
tations quality/consistency. By manual inspection in the validation dataset
we decided to focus our baseline analysis at the 0.6 and 0.7 IoU thresholds.
(a) “EYES” IoU=0.56 (b) “Donald” IoU=0.53 (c) “STARBUCKS”
IoU=0.52
(d) “Martin” IoU=0.50 (e) “Colorado” IoU=0.65 (f) “FOOD” IoU=0.54
Figure 5: Examples of word proposals (blue) matching ground-truth anno-
tations (green) and their IoU scores. IoU scores around 0.5 may correspond
to bad localizations covering only part of the word (a) or neighboring char-
acters (b) (c). However in some cases also good localizations are scored
low (d) (e) (f) due to human annotation inconsistency. In the extreme case
missing detections (in red) correspond to correctly detected words with IoU
scores under 0.5 (d) (f).
As a result of this analysis we have selected for further evaluation a par-
ticular combination of diversification strategies (see bold text in Table 1) as a
25

trade-off between detection recall and number of proposals. This combination
will be used in the rest of the experiments in this paper as “TextProposals”.
It can be appreciated that the selected combination produces significant
gains at 0.6 and 0.7 IoU thresholds compared to other less diverse options.
In particular, the difference of using three color channels (RGB) instead of
one (I) is notable, and adding the second level (P1) while produces a rather
small gain has practically no cost in number of proposals. We also observe
redundancy in using the intensity channel in combination with RGB channels,
as well as in adding the Lab color similarity cues (Flab,Blab).
4.1.2. Evaluation of proposals’ rankings
Figure 6 shows the effect that different ranking strategies have in our
TextProposals in three different datasets. The provided plots illustrate how
the recall varies by taking into account only a certain number of proposals,
prioritizing the ones with higher rank. Apart of the ranking provided by the
weak text classifier described in section 3.3 we analyze the performance of
three other ranking strategies: a pseudo-random ranking, a cluster meaning-
fulness ranking, and a totally flat ranking (i.e. every proposal has the same
priority and thus the first generated is the first evaluated).
The pseudo-random ranking is the one proposed in [11].For the meaning-
fulness ranking (NFA), we make use of the cluster quality measure detailed
in [52]. Intuitively this value is small for groups comprising a set of very
similar regions, that are densely concentrated in small volumes of the fea-
ture space, and Thus seems well indicated for measuring text-likeliness of our
proposals.
As can be appreciated the area under the curve (AUC) provided by the
26

100
101
102
103
104
0
0.2
0.4
0.6
0.8
1
# of proposals
Dete
ction R
ate
NoRank
PR
NFA
Prob
100
101
102
103
104
0
0.2
0.4
0.6
0.8
1
# of proposals
Dete
ction R
ate
NoRank
PR
NFA
Prob
100
101
102
103
104
0
0.2
0.4
0.6
0.8
1
# of proposals
Dete
ction R
ate
NoRank
PR
NFA
Prob
Figure 6: TextProposals performance at 0.5 IoU using various ranking strate-
gies in ICDAR2013(left), SVT(middle), and MLe2e(right) datasets: (PR)
Pseudo-random ranking, (NFA) Meaningfulness ranking, (Prob) the ranking
provided by the weak classifier.
weak text classifier is better than the rest of strategies analyzed. Particularly
important is the observation that with this ranking using only the best 100
proposals (in average) we reach around 70% of the maximum attainable
recall. Since the overhead of using the classifier is negligible we use this
ranking strategy for the rest of the experiments in this paper.
4.1.3. Comparison with state of the art generic methods
In this section we analyze the performance of our TextProposals in com-
parison with the following state-of-the-art generic object proposals methods:
BING [43], EdgeBoxes [13], Randomized Prim’s [44] (RP), and Geodesic ob-
ject proposals [45] (GOP). We use publicly available code of these methods
with default parameters.
Table 2 shows the performance comparison of all the evaluated methods
in the ICDAR2013 dataset, while a more detailed comparison is provided in
Figure 7. All time measurements have been calculated by executing code in
27

Method # prop. 0.5 IoU 0.7 IoU 0.9 IoU time(s)
BING [43] 2716 0.63 0.08 0.00 1.21
EdgeBoxes [13] 9554 0.85 0.53 0.08 2.24
RP [44] 3393 0.77 0.45 0.08 12.80
GOP [45] 855 0.45 0.18 0.08 4.76
TextProposals 13719 0.98 0.96 0.84 2.85
Table 2: Average number of proposals, recall at different IoU thresholds, and
running time comparison with Object Proposals state of the art algorithms
in the ICDAR2013 dataset.
a single thread on the same i7 CPU.
As can be appreciated our method outperforms all evaluated algorithms in
terms of detection recall on this dataset. Moreover, it is important to notice
that detection rates of all the generic Object Proposals heavily deteriorate
for large IoU thresholds while our method provides much more stable rates,
indicating a better coverage of text objects (see the high AUC difference in
Figure 7 bottom plots).
The low recall rates of grouping-based object proposals algorithms were
foreseeable, since as discussed before these methods are designed to detect
generic objects by agglomerating adjacent regions. Similarly, the BING pro-
posals algorithm is trained to detect single body objects with compact shapes.
In the case of the EdgeBoxes algorithm the provided comparison makes more
sense, because it has been already integrated in a scene text end-to-end recog-
nition pipeline [3] with good results. Thus, a direct comparison can be es-
tablished, and the better performance of our TextProposals in Table 2 and
28

100
101
102
103
104
0
0.2
0.4
0.6
0.8
1
# of proposals
Dete
ction R
ate
IoU = 0.5
100
101
102
103
104
0
0.2
0.4
0.6
0.8
1
# of proposals
Dete
ction R
ate
IoU = 0.7
100
101
102
103
104
0
0.2
0.4
0.6
0.8
1
# of proposals
Dete
ction R
ate
IoU = 0.9
0.5 0.6 0.7 0.8 0.9 10
0.2
0.4
0.6
0.8
1
IoU
De
tectio
n R
ate
1000 Proposals
0.5 0.6 0.7 0.8 0.9 10
0.2
0.4
0.6
0.8
1
IoU
De
tectio
n R
ate
5000 Proposals
0.5 0.6 0.7 0.8 0.9 10
0.2
0.4
0.6
0.8
1
IoU
De
tectio
n R
ate
10000 Proposals
Figure 7: A comparison of various state-of-the-art object proposals methods
in the ICDAR2013 dataset. (top) Detection rate versus number of proposals
for various intersection over union thresholds. (bottom) Detection rate versus
intersection over union threshold for various fixed numbers of proposals.
29

Method # prop. 0.5 IoU 0.7 IoU 0.9 IoU time(s)
BING [43] 2987 0.64 0.09 0.00 0.81
EdgeBoxes [13] 15319 0.94 0.63 0.04 2.71
RP [44] 5620 0.02 0.00 0.00 10.51
GOP [45] 778 0.53 0.19 0.03 4.31
TextProposals 17358 0.94 0.65 0.09 3.21
Table 3: Average number of proposals, recall at different IoU thresholds, and
running time comparison with Object Proposals state of the art algorithms
in the SVT dataset.
Figure 7 allows us to hypothesize a consequent improvement on the end-to-
end results of [3] by exchanging the proposals generation module. This claim
is supported with experimental evidence in section 4.2.
Table 3 and Figures 8 and 9 show analogous experiments for the SVT
dataset.
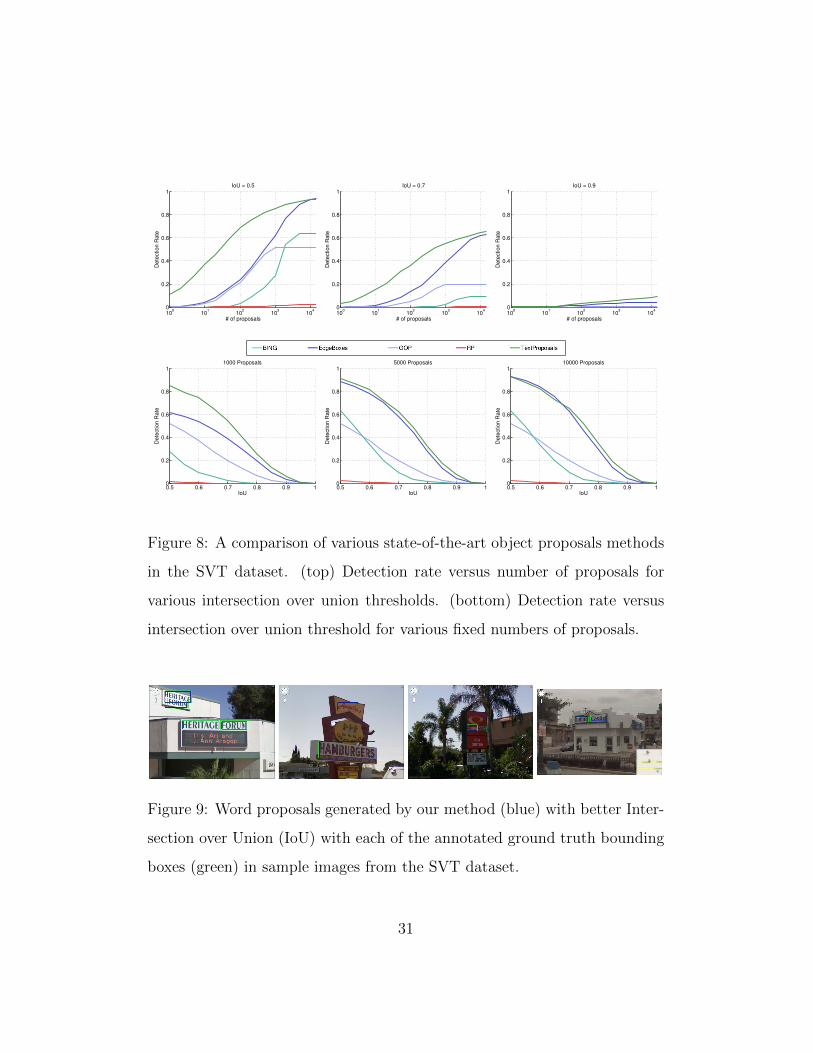
Results on the SVT dataset exhibit a distinct scenario than in ICDAR2013.
In general, recall rates are lower for all evaluated methods while still there is
a clear difference between the two best performing methods (TextProposals
and EdgeBoxes) and the rest. However, TextProposals and EdgeBoxes max-
imum recalls at 0.5 IoU threshold are equal in SVT, while TextProposals is
slightly better at 0.7 and 0.9. The difference between the results in the IC-
DAR2013 and SVT datasets can be explained because both datasets are very
different in nature, SVT contains more challenging text, with lower quality
and many times under bad illumination conditions, while in ICDAR2013 text
is mostly well focused and flatly illuminated.
30
100
101
102
103
104
0
0.2
0.4
0.6
0.8
1
# of proposals
Dete
ction R
ate
IoU = 0.5
100
101
102
103
104
0
0.2
0.4
0.6
0.8
1
# of proposals
Dete
ction R
ate
IoU = 0.7
100
101
102
103
104
0
0.2
0.4
0.6
0.8
1
# of proposals
Dete
ction R
ate
IoU = 0.9
0.5 0.6 0.7 0.8 0.9 10
0.2
0.4
0.6
0.8
1
IoU
De
tectio
n R
ate
1000 Proposals
0.5 0.6 0.7 0.8 0.9 10
0.2
0.4
0.6
0.8
1
IoU
De
tectio
n R
ate
5000 Proposals
0.5 0.6 0.7 0.8 0.9 10
0.2
0.4
0.6
0.8
1
IoUD
ete
ctio
n R
ate
10000 Proposals
Figure 8: A comparison of various state-of-the-art object proposals methods
in the SVT dataset. (top) Detection rate versus number of proposals for
various intersection over union thresholds. (bottom) Detection rate versus
intersection over union threshold for various fixed numbers of proposals.
Figure 9: Word proposals generated by our method (blue) with better Inter-
section over Union (IoU) with each of the annotated ground truth bounding
boxes (green) in sample images from the SVT dataset.
31

Moreover, in this dataset our method does not provide the same stability
property shown before for large IoU thresholds. This behavior is also related
with the distinct nature of the datasets, but also, as discussed before, with
the fact that SVT ground-truth annotations are less consistent in terms of
the extra padding allowed around word instances.
Still top plots in Figure 8 demonstrate that the AUC of our TextProposals
are much better that the ones of EdgeBoxes at all IoU thresholds. This
provides an noticeable boost in performance when we limit our analysis to a
relatively small set of proposals (e.g. as for 1000 proposals in the bottom-left
plot in Figure 8).
In order to evaluate our method in more unconstrained scenarios we con-
duct a similar analysis on the MLe2e and ICDAR2015 datasets. In this
experiment we only evaluate the TextProposals and EdgeBoxes algorithms.
The MLe2e dataset contains well-focused and horizontal text instances in
four different scripts. On the other hand, while the type of text found in the
ICDAR2015 “Incidental Scene Text” dataset can be considered similar to the
one in SVT, the ICDAR2015 contains a large number of non-horizontal and
very small text instances.
Figure 10 shows performance plots for our TextProposals and the Edge-
Boxes detector in these two datasets. Figure 11 show the best word proposals
generated by our method on MLe2e images. As can be appreciated TextPro-
posals is clearly superior to EdgeBoxes in both cases.
The most important observation from Figure 10 is the tiny recall rate of
EdgeBoxes in the ICDAR2015 dataset. This result makes clear that the
EdgeBoxes algorithm is not well suited for detecting non-horizontal and
32
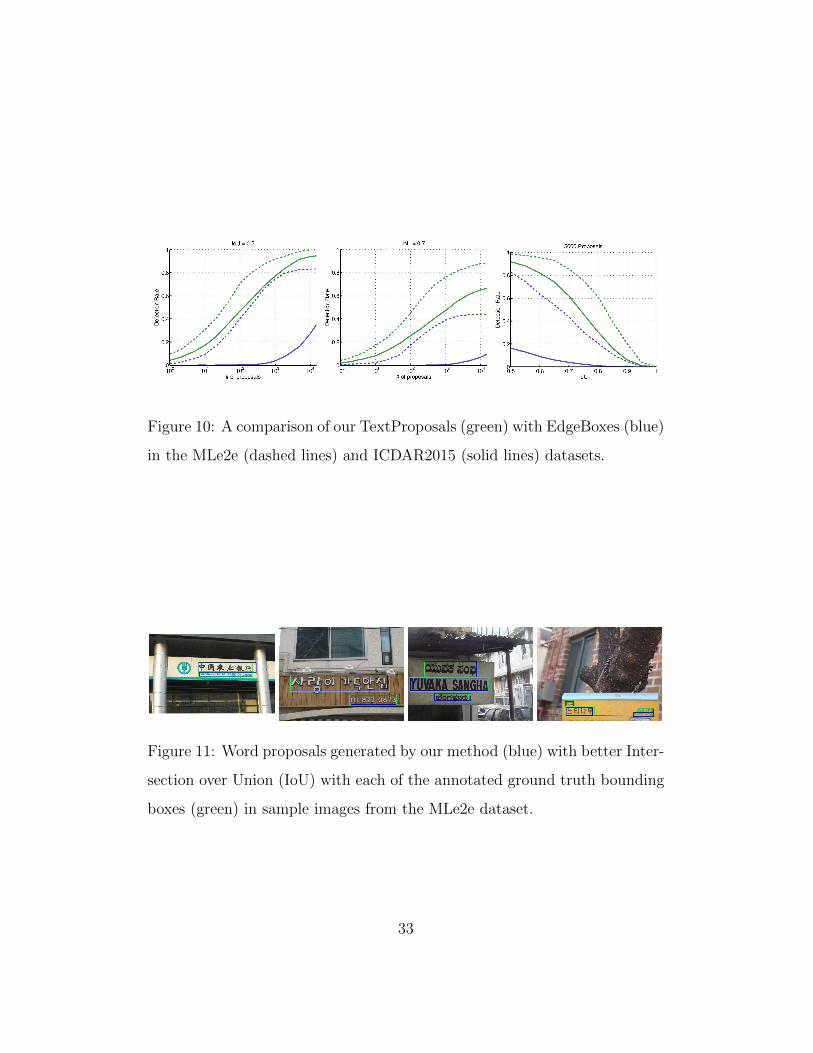
Figure 10: A comparison of our TextProposals (green) with EdgeBoxes (blue)
in the MLe2e (dashed lines) and ICDAR2015 (solid lines) datasets.
Figure 11: Word proposals generated by our method (blue) with better Inter-
section over Union (IoU) with each of the annotated ground truth bounding
boxes (green) in sample images from the MLe2e dataset.
33

−90 −75 −60 −45 −30 −15 0 15 30 45 60 75 90rotation in degrees
0.0
0.2
0.4
0.6
0.8
1.0
dete
ctio
n re
call
λ=0.25
λ=1.00
(a) (b)
Figure 12: TextProposals detection recall at 0.7 IoU as a function of the
text orientation degree (a). We provide recall for two different values of
the λ parameter in the SLC distance metric (equation 2). Recall values are
calculated on different rotated versions of the ICDAR2013 dataset (b).
small-sized text. Contrary to EdgeBoxes, our TextProposals perform sim-
ilarly in both SVT and ICDAR2015 datasets. Thus, proving to be more
robust on detecting these challenging types of text.
In order to further evaluate the performance of TextProposals on arbi-
trarily oriented text detection, we have done an extra experiment where our
method is applied to different versions of the ICDAR2013 dataset where im-
ages were deliberately rotated at various degrees. Figure 12 shows the overall
detection recall of the method at 0.7 IoU as a function of the text orientation
degree, as well as the generated rotated versions (15◦, 30◦, 45◦, 60◦, 75◦, and
90◦) for one sample image of the ICDAR dataset. We provide the obtained
recall for two different values of the λ parameter in the SLC distance metric
34

(equation 2). As mentioned in section 3.2, setting λ = 1 makes our clustering
analysis rotation invariant while smaller values are better for detecting hor-
izontally aligned text. In fact, we have found by manual inspection that the
recall oscillation for the λ = 1 curve in Figure 12 is due to errors introduced
on the IoU calculation for non axis-aligned bounding boxes. Moreover, we
appreciate that the version used in the rest of the experiments of this section,
with λ = 0.25, performs robustly for text with slight rotations (up to 30◦)
which is the common scenario in most of the cases.
4.1.4. Error Analysis
In this section we offer a brief analysis of failure cases in order to identify
the limitations of the method. For this error analysis we focus on the SVT
dataset because, as we have seen in the previous experiments, it provides a
more challenging benchmark for our method. SVT text instances are many
times smaller and have lower quality than the ones found in other scene text
datasets, and thus are more difficult to detect.
Our analysis consists in manually inspecting the particular images where
the TextProposals algorithm does not provide correct detections. If we con-
sider the intersection over union (IoU) detection threshold of 0.5, we found
that there are only 39 words (out of 647) in the SVT test set for which our
method is not able to provide a correct bounding box. From these 39 text
instances, 20 of them correspond to cases where the ground truth bounding
boxes are not well annotated as shown in Figure 13. From the remaining 19
errors a representative set is shown in Figure 14. We appreciate that they
mostly correspond to extremely difficult cases in terms of contrast and/or im-
age quality. This kind of degraded texts effectively supposes a limitation for
35

Figure 13: Examples of correctly detected words that are computed as miss-
detections due to human annotation inconsistency. Blue boxes correspond
to ground truth annotations and red boxes to TextProposals results.
the proposed method, as the initial segmentation will rarely provide mean-
ingful regions for them to be detected. A possible solution to this limitation
would be to use the whole component tree of the image as the set of initial
regions in our algorithm. However, by doing so the number of generated
proposals would be much larger.
Actually, apart of the problems in detecting those difficult text instances,
we can see as a more important limitation of the method the large number
of proposals provided. An interesting observation here is that while class-
independent object detection generic methods suffice with near a thousand
proposals to achieve high recalls, in the case of text we still need around
10000 in order achieve similar rates. This indicates that there is a large
room for improvement in specific text object proposals methods.
36

Figure 14: Examples of errors of the TextProposals algorithm. Blue boxes
correspond to ground truth annotations and red boxes to the TextProposals
hypotheses with a larger IoU.
4.2. End-to-end word spotting
In this section we build an end-to-end scene text recognition pipeline by
combining our TextProposals with two state-of-the-art holistic word recog-
nizers: the word embeddings method of Almazan et al. [2] and the holistic
CNN classifier of Jaderberg et al. [3]. The evaluation framework used in all
this section is the standard for end-to-end text recognition datasets [50, 4].
A result bounding box is counted as a correct match if it overlaps a ground
truth bounding box by more than 50% and the provided word transcription
is correct (ignoring case). Based on this simple rule a single F-score mea-
sure is calculated for a given method from the standard precision and recall
metrics.
Table 4 shows the obtained end-to-end word spotting F-scores on IC-
DAR2003 and SVT datasets and compare them with the state-of-the-art.
37

The combination of TextProposals with Jaderberg et al. [3] CNN model out-
performs the best previously published results, which are actually from [3],
in most of the columns in the Table. The other variant, using Almazan et
al. [2] for recognition, provides also competitive results. Figure 15 shows
qualitative word spotting results of the combination of TextProposals with
Jaderberg et al. [3] CNN model on ICDAR2003 and SVT sample images.
IC03-50 IC03-Full IC03 SVT-50 SVT
Wang et al.[24] 0.68 0.61 - 0.38 -
Wang and Wu [6] 0.72 0.67 - 0.46 -
Alsharif [37] 0.77 0.70 0.63* 0.48 -
Jaderberg et al.[7] 0.80 0.75 - 0.56 -
Jaderberg et al.[3] 0.90 0.86 0.78 0.76 0.53
TextProposals + Watts [2] 0.82 0.73 - 0.67 -
TextProposals + DictNet [3] 0.92 0.90 0.75 0.85 0.54
Table 4: Comparison of end-to-end word spotting F-scores on the IC-
DAR2003 and SVT datasets.
In Table 4 it is particularly interesting the comparison with the end-
to-end pipeline in [3]. Since both pipelines make use of object proposals
algorithms and the same final recognition model, this comparison directly
relates to the quality of the object proposals algorithms. This demonstrates
that our TextProposals provide an extra boost of performance to the end-to-
end system.
Tables 5 and 6 show a comparison of our end-to-end pipeline with the par-
ticipants in the last ICDAR Robust Reading Competition on the ICDAR2013
(focused text) and ICDAR2015 (incidental text) datasets. As can be appreci-
38

End-to-End results Word spotting Results
IC13-100 IC13-Full IC13 IC13-100 IC13-Full IC13
BeamSearch CUNI +S 26.38 23.32 20.28 28.17 24.95 21.94
OpenCV+Tessaract[53] 59.47 56.14 43.29 63.05 59.43 44.46
BeamSearch CUNI 63.20 61.10 56.04 67.34 65.05 59.38
MSER-MRF [54] 71.13 - - 75.74 - -
Deep2Text-I [18, 3] 74.36 74.36 74.36 76.93 76.93 76.93
NJU Text 74.49 - - 77.96 - -
Deep2Text-II [18, 3] 75.29 75.29 75.29 77.37 77.37 77.37
TextSpotter [8] 77.02 63.19 54.28 81.84 66.48 56.69
Stradvision-1 81.28 78.51 67.15 85.82 82.84 70.19
VGGMaxBBNet [3, 7] 86.18 - - 90.25 - -
TextProposals + DictNet [3] 81.16 79.49 68.54 85.37 83.58 70.71
Table 5: Comparison of end-to-end recognition and word spotting F-scores
on ICDAR2013 (Focused Text) dataset.
ated, the combination of TextProposals with the DictNet [3] CNN recognizer
shows competitive results on the ICDAR2013 dataset, while outperforms
with a clear margin all the competition participants on the ICDAR2015 In-
cidental Text challenge.
It is important to notice here that ICDAR2015 is a much more chal-
lenging dataset than ICDAR2013. In the case of ICDAR2013 Focused Text
dataset, specialized text detectors can still perform very well in combination
with strong statistical models for recognition. See for example the very good
performance of methods combining traditional text detectors with holistic
word recognition CNNs (Deep2Text-I and Deep2Text-II), Recurrent Neu-
ral Networks (Megvii-Image++), or even the more traditional shape based
character classifiers with dictionary-based language models (TextSpotter).
39

End-to-End results Word spotting Results
IC15-50 IC15-Full IC15 IC15-50 IC15-Full IC15
Beam Search CUNI +S 13.26 10.85 6.86 14.01 11.48 7.24
OpenCv + Tessaract [53] 13.84 12.01 8.01 14.65 12.63 8.43
Deep2Text-MO [18, 3] 16.77 16.77 16.77 17.58 17.58 17.58
Beam Search CUNI 22.14 19.80 17.46 23.37 21.07 18.38
NJU Text 32.63 - - 34.10 - -
Stradvision-1 33.21 - - 34.65 - -
TextSpotter [8] 35.06 19.91 15.60 37.00 20.93 16.38
Stradvision-2 43.70 - - 45.87 - -
Megvii-Image++ 46.74 40.00 32.86 49.95 42.71 34.57
TextProposals + DictNet [3] 53.30 49.61 47.18 56.00 52.26 49.73
Table 6: Comparison of end-to-end recognition and word spotting F-scores
on ICDAR2015 (Incidental Text) dataset.
On the other hand, the incidental text instances found in ICDAR2015
dataset are normally less suitable for traditional specialized text detectors.
Incidental text is many times very small in size, has low quality, and/or is
not strictly horizontal. This qualities make of our TextProposals a better
solution in this dataset.
Moreover, it is also important to notice that the DictNet [3] CNN model
that we integrate with our TextProposals is limited to a list of 90k words that
was not designed for the ICDAR2015 dataset. While it includes all words in
ICDAR2003 and SVT test sets ground-truth, the list of 90k words matches
only 70% of the words that appear in the ICDAR2015 test set, so limiting
the maximum attainable recall to 0.7.
40

Figure 15: Word spotting results using our TextProposals + DictNet [3] CNN
model on SVT sample images.
5. Conclusion
In this paper we have presented a text specific object proposals algorithm
that is able to reach impressive recall rates with a few thousand proposals in
different standard datasets, including focused or incidental text, and multi-
language scenarios.
We have seen how the proposed algorithm, while still rooted in the same
intuitions developed in existing specialized text detectors, introduces impor-
tant methodological contributions. By not making any assumption about
the nature of the initial set of regions (connected components) to analyze
or about the structure of the region groupings that are of our interest, we
ended up with a less rigid definition of the involved grouping process. This
methodological shift has proved to be beneficial from the perspective of an
object proposals approach.
The performed experiments allow to conclude that text-specific object
proposals are a realistic alternative to generic object proposals algorithms,
and also to specialized text detectors. This is further supported by experi-
mental evidence showing how the use of our TextProposals leads to improve
the state-of-the-art in challenging end-to-end scene text recognition datasets.
41
Acknowledgment
This project was supported by the Spanish project TIN2014-52072-P,
the fellowship RYC-2009-05031, and the Catalan government scholarship
2014FI B1-0017.
References
[1] V. Goel, A. Mishra, K. Alahari, C. Jawahar, Whole is greater than sum
of parts: Recognizing scene text words, in: Document Analysis and
Recognition (ICDAR), 2013 12th International Conference on, IEEE,
2013, pp. 398–402.
[2] J. Almazan, A. Gordo, A. Fornes, E. Valveny, Word spotting and recog-
nition with embedded attributes, Pattern Analysis and Machine Intelli-
gence, IEEE Transactions on 36 (12) (2014) 2552–2566.
[3] M. Jaderberg, K. Simonyan, A. Vedaldi, A. Zisserman, Reading text in
the wild with convolutional neural networks, International Journal of
Computer Vision 116 (1) (2016) 1–20.
[4] D. Karatzas, Icdar 2015 competition on robust reading, in: Document
Analysis and Recognition (ICDAR), 2015 13th International Conference
on, IEEE, 2015, pp. 1156–1160.
[5] A. Coates, B. Carpenter, C. Case, S. Satheesh, B. Suresh, T. Wang,
D. J. Wu, A. Y. Ng, Text detection and character recognition in scene
images with unsupervised feature learning, in: Document Analysis and
42

Recognition (ICDAR), 2011 International Conference on, IEEE, 2011,
pp. 440–445.
[6] T. Wang, D. J. Wu, A. Coates, A. Y. Ng, End-to-end text recognition
with convolutional neural networks, in: Pattern Recognition (ICPR),
2012 21st International Conference on, IEEE, 2012, pp. 3304–3308.
[7] M. Jaderberg, A. Vedaldi, A. Zisserman, Deep features for text spotting,
in: Computer Vision–ECCV 2014, Springer, 2014, pp. 512–528.
[8] L. Neumann, J. Matas, Real-time scene text localization and recogni-
tion, in: Computer Vision and Pattern Recognition (CVPR), 2012 IEEE
Conference on, IEEE, 2012, pp. 3538–3545.
[9] L. Neumann, J. Matas, Scene text localization and recognition with
oriented stroke detection, in: Proceedings of the IEEE International
Conference on Computer Vision, 2013, pp. 97–104.
[10] R. Girshick, J. Donahue, T. Darrell, J. Malik, Rich feature hierarchies for
accurate object detection and semantic segmentation, in: Proceedings of
the IEEE conference on computer vision and pattern recognition, 2014,
pp. 580–587.
[11] J. R. Uijlings, K. E. van de Sande, T. Gevers, A. W. Smeulders, Selective
search for object recognition, International journal of computer vision
104 (2) (2013) 154–171.
[12] P. Dollar, R. Appel, S. Belongie, P. Perona, Fast feature pyramids for ob-
ject detection, Pattern Analysis and Machine Intelligence, IEEE Trans-
actions on 36 (8) (2014) 1532–1545.
43

[13] C. L. Zitnick, P. Dollar, Edge boxes: Locating object proposals from
edges, in: Computer Vision–ECCV 2014, Springer, 2014, pp. 391–405.
[14] K. Kim, H. Byun, Y. Song, Y.-W. Choi, S. Chi, K. K. Kim, Y. Chung,
Scene text extraction in natural scene images using hierarchical feature
combining and verification, in: Pattern Recognition, 2004. ICPR 2004.
Proceedings of the 17th International Conference on, Vol. 2, IEEE, 2004,
pp. 679–682.
[15] S. Lee, J. Seok, K. Min, J. Kim, Scene text extraction using image
intensity and color information, in: Pattern Recognition, 2009. CCPR
2009. Chinese Conference on, IEEE, 2009, pp. 1–5.
[16] C. Yao, X. Bai, W. Liu, Y. Ma, Z. Tu, Detecting texts of arbitrary orien-
tations in natural images, in: Computer Vision and Pattern Recognition
(CVPR), 2012 IEEE Conference on, IEEE, 2012, pp. 1083–1090.
[17] H. I. Koo, D. H. Kim, Scene text detection via connected component
clustering and nontext filtering, Image Processing, IEEE Transactions
on 22 (6) (2013) 2296–2305.
[18] X.-C. Yin, X. Yin, K. Huang, H.-W. Hao, Robust text detection in
natural scene images, Pattern Analysis and Machine Intelligence, IEEE
Transactions on 36 (5) (2014) 970–983.
[19] L. Gomez, D. Karatzas, A fast hierarchical method for multi-
script and arbitrary oriented scene text extraction, arXiv preprint
arXiv:1407.7504.
44

[20] Q. Ye, D. Doermann, Text detection and recognition in imagery: A
survey, Pattern Analysis and Machine Intelligence, IEEE Transactions
on 37 (7) (2015) 1480–1500.
[21] Y. Zhu, C. Yao, X. Bai, Scene text detection and recognition: Recent
advances and future trends, Frontiers of Computer Science 10 (1) (2016)
19–36.
[22] K. Jung, K. I. Kim, A. K. Jain, Text information extraction in images
and video: a survey, Pattern recognition 37 (5) (2004) 977–997.
[23] J. Liang, D. Doermann, H. Li, Camera-based analysis of text and docu-
ments: a survey, International Journal of Document Analysis and Recog-
nition (IJDAR) 7 (2-3) (2005) 84–104.
[24] K. Wang, B. Babenko, S. Belongie, End-to-end scene text recognition,
in: Computer Vision (ICCV), 2011 IEEE International Conference on,
IEEE, 2011, pp. 1457–1464.
[25] A. Mishra, K. Alahari, C. Jawahar, Top-down and bottom-up cues for
scene text recognition, in: Computer Vision and Pattern Recognition
(CVPR), 2012 IEEE Conference on, IEEE, 2012, pp. 2687–2694.
[26] R. Minetto, N. Thome, M. Cord, N. J. Leite, J. Stolfi, T-hog: An ef-
fective gradient-based descriptor for single line text regions, Pattern
recognition 46 (3) (2013) 1078–1090.
[27] C. Yao, X. Bai, W. Liu, A unified framework for multioriented text de-
tection and recognition, Image Processing, IEEE Transactions on 23 (11)
(2014) 4737–4749.
45

[28] B. Epshtein, E. Ofek, Y. Wexler, Detecting text in natural scenes with
stroke width transform, in: Computer Vision and Pattern Recognition
(CVPR), 2010 IEEE Conference on, IEEE, 2010, pp. 2963–2970.
[29] A. Mosleh, N. Bouguila, A. B. Hamza, Image text detection using a
bandlet-based edge detector and stroke width transform., in: BMVC,
2012, pp. 1–12.
[30] H. Xu, L. Xue, F. Su, Scene text detection based on robust stroke width
transform and deep belief network, in: Computer Vision–ACCV 2014,
Springer, 2014, pp. 195–209.
[31] J. Matas, O. Chum, M. Urban, T. Pajdla, Robust wide-baseline stereo
from maximally stable extremal regions, Image and vision computing
22 (10) (2004) 761–767.
[32] L. Neumann, J. Matas, A method for text localization and recognition
in real-world images, in: Computer Vision–ACCV 2010, Springer, 2010,
pp. 770–783.
[33] H. Chen, S. S. Tsai, G. Schroth, D. M. Chen, R. Grzeszczuk, B. Girod,
Robust text detection in natural images with edge-enhanced maximally
stable extremal regions, in: Image Processing (ICIP), 2011 18th IEEE
International Conference on, IEEE, 2011, pp. 2609–2612.
[34] T. Novikova, O. Barinova, P. Kohli, V. Lempitsky, Large-lexicon
attribute-consistent text recognition in natural images, in: Computer
Vision–ECCV 2012, Springer, 2012, pp. 752–765.
46
[35] C. Shi, C. Wang, B. Xiao, Y. Zhang, S. Gao, Scene text detection us-
ing graph model built upon maximally stable extremal regions, Pattern
recognition letters 34 (2) (2013) 107–116.
[36] C. Shi, C. Wang, B. Xiao, S. Gao, J. Hu, End-to-end scene text recog-
nition using tree-structured models, Pattern Recognition 47 (9) (2014)
2853–2866.
[37] O. Alsharif, J. Pineau, End-to-end text recognition with hybrid hmm
maxout models, arXiv preprint arXiv:1310.1811.
[38] L. Sun, Q. Huo, W. Jia, K. Chen, A robust approach for text detection
from natural scene images, Pattern Recognition 48 (9) (2015) 2906–
2920.
[39] W. Huang, Y. Qiao, X. Tang, Robust scene text detection with convo-
lution neural network induced mser trees, in: Computer Vision–ECCV
2014, Springer, 2014, pp. 497–511.
[40] J. Hosang, R. Benenson, P. Dollar, B. Schiele, What makes for effective
detection proposals?, Pattern Analysis and Machine Intelligence, IEEE
Transactions on 31.
[41] L. Huo, L. Jiao, S. Wang, S. Yang, Object-level saliency detection with
color attributes, Pattern Recognition 49 (2016) 162–173.
[42] I. Gonzalez-Dıaz, V. Buso, J. Benois-Pineau, Perceptual modeling in the
problem of active object recognition in visual scenes, Pattern Recogni-
tion 56 (2016) 129–141.
47

[43] M.-M. Cheng, Z. Zhang, W.-Y. Lin, P. Torr, Bing: Binarized normed
gradients for objectness estimation at 300fps, in: Proceedings of the
IEEE Conference on Computer Vision and Pattern Recognition, 2014,
pp. 3286–3293.
[44] S. Manen, M. Guillaumin, L. Gool, Prime object proposals with ran-
domized prim’s algorithm, in: Proceedings of the IEEE International
Conference on Computer Vision, 2013, pp. 2536–2543.
[45] P. Krahenbuhl, V. Koltun, Geodesic object proposals, in: Computer
Vision–ECCV 2014, Springer, 2014, pp. 725–739.
[46] G. Borgefors, Distance transformations in digital images, Computer vi-
sion, graphics, and image processing 34 (3) (1986) 344–371.
[47] A. Fitzgibbon, R. B. Fisher, A buyer’s guide to conic fitting, in: In
British Machine Vision Conference, 1995.
[48] S. M. Lucas, A. Panaretos, L. Sosa, A. Tang, S. Wong, R. Young,
K. Ashida, H. Nagai, M. Okamoto, H. Yamamoto, et al., ICDAR 2003
robust reading competitions: entries, results, and future directions, In-
ternational Journal of Document Analysis and Recognition (IJDAR)
7 (2-3) (2005) 105–122.
[49] D. Karatzas, Icdar 2013 robust reading competition, in: Document
Analysis and Recognition (ICDAR), 2013 12th International Conference
on, IEEE, 2013, pp. 1484–1493.
[50] K. Wang, S. Belongie, Word spotting in the wild, in: Proceedings of the
48

11th European conference on Computer vision: Part I, Springer-Verlag,
2010, pp. 591–604.
[51] L. Gomez, D. Karatzas, A fine-grained approach to scene text script
identification, in: Document Analysis Systems (DAS), 2016 12th IAPR
International Workshop on, IEEE, 2016.
[52] F. Cao, J. Delon, A. Desolneux, P. Muse, F. Sur, An a contrario ap-
proach to hierarchical clustering validity assessment, Research Report
RR-5318, INRIA (2004).
[53] L. Gomez, D. Karatzas, Scene text recognition: No country for old men?,
in: Computer Vision-ACCV 2014 Workshops, Springer, 2014, pp. 157–
168.
[54] X. Liu, T. Lu, Natural scene character recognition using markov ran-
dom field, in: Document Analysis and Recognition (ICDAR), 2015 13th
International Conference on, IEEE, 2015, pp. 396–400.
49