texting versus talking: age sex and extroversion as
TRANSCRIPT
East Tennessee State UniversityDigital Commons @ East
Tennessee State University
Electronic Theses and Dissertations Student Works
5-2011
Texting Versus Talking: Age Sex and Extroversionas Predictors of Frequency and Preference Amongan Undergraduate Cohort.Chris J. LaBoweEast Tennessee State University
Follow this and additional works at: https://dc.etsu.edu/etd
Part of the Communication Technology and New Media Commons, and the Social Psychologyand Interaction Commons
This Thesis - Open Access is brought to you for free and open access by the Student Works at Digital Commons @ East Tennessee State University. Ithas been accepted for inclusion in Electronic Theses and Dissertations by an authorized administrator of Digital Commons @ East Tennessee StateUniversity. For more information, please contact [email protected].
Recommended CitationLaBowe, Chris J., "Texting Versus Talking: Age Sex and Extroversion as Predictors of Frequency and Preference Among anUndergraduate Cohort." (2011). Electronic Theses and Dissertations. Paper 1279. https://dc.etsu.edu/etd/1279

Texting Versus Talking: Age, Sex, and Extroversion as Predictors of Frequency and Preference
Among an Undergraduate Cohort
_____________________
A thesis
presented to
the faculty of the Department of Sociology and Anthropology
East Tennessee State University
In partial fulfillment
of the requirements for the degree
Master of Arts in Sociology
_____________________
by
Chris LaBowe
May 2011
_____________________
Dr. Paul Kamolnick, Chair
Dr. Scott Beck
Dr. Melissa Schrift
Keywords: texting, text messaging, voice call, cell phone, sms, communication

2
ABSTRACT
Texting Versus Talking: Age, Sex, and Extroversion as Predictors of Frequency and Preference
Among an Undergraduate Cohort
by
Chris LaBowe
This study examines text messaging behavior of ETSU undergraduates. Data come from a
survey of 485 students enrolled during the 2010 fall semester. The current study explores
the effects of sex, age, and extroversion on (1) the volume of texts a person sends and (2)
preferences for texting or calling. The study also explores the use of cell phones as a means of
avoiding others during co-present interaction. Findings reveal that age is the strongest predictor
of text messaging, with younger respondents being more likely to text. The study also finds that
women prefer texting, while men prefer voice calls. Age affects preference as well, with younger
respondents preferring texting and older respondents preferring voice calls. The study also finds
that women are much more likely to use cell phones to avoid others during co-present
interaction.

3
ACKNOWLEDGEMENTS
First, I would like to thank my chair, Dr. Paul Kamolnick, for his tireless efforts in
helping me edit the manuscript. More importantly, I would like to thank him for being a mentor
and friend to me throughout my graduate career. I would especially like to thank Dr. Scott Beck.
His willingness to share his profound knowledge has been inspirational to me. Finally, I would
like to thank my family for their support throughout my life.

4
Copyrighted by Chris LaBowe 2011
All Rights Reserved

5
CONTENTS
Page
ABSTRACT .................................................................................................................. 2
ACKNOWLEDGEMENTS .............................................................................................. 3
LIST OF TABLES ........................................................................................................... 7
Chapter
1. INTRODUCTION ..................................................................................................... 8
Brief History of the Cell Phone .............................................................................. 8
Literature Review .................................................................................................. 11
Operationalizaton of Variables............................................................................... 21
Hypotheses ............................................................................................................ 21
2. METHODS .............................................................................................................. 23
Research Method and Sampling Strategy ............................................................... 23
Subjects and Collection Method ............................................................................ 23
Statistics and Data Analysis ................................................................................... 24
3. FINDINGS ............................................................................................................... 26
General Characteristics of Cell Phone Use Among Undergraduates ..................... 26
Whom Are Respondents Texting and Voice Calling? ............................................ 28
Reasons for Texting and Voice Calling ................................................................. 29
Student Preferences for Texting and Talking ......................................................... 31
Using the Cell Phone to Avoid Others .................................................................. 32
Effects of Sex, Age, and Extroversion on Frequency.............................................. 32
Effects of Sex, Age, and Extroversion on Preference ............................................. 35
Effects of Sex, Age, and Extroversion on Avoidance ............................................. 38
4. CONCLUSION ........................................................................................................ 41
Discussion ............................................................................................................ 41

6
Limitations ........................................................................................................... 46
REFERENCES ................................................................................................................. 47
APPENDIX: LaBowe Cell Phone Questionnaire ............................................................. 51
VITA …………………………………………… .............................................................. 55

7
LIST OF TABLES
Table Page
1. General Information on Undergraduate Cell Phone Use ............................................. 27
2. Quantity of Texts Sent and Received ......................................................................... 27
3. People Respondents Text the Most ............................................................................ 28
4. People Respondents Call the Most ............................................................................. 29
5. Reasons for Texting Rather Than Calling .................................................................. 30
6. Reasons for Calling Rather Than Texting .................................................................. 31
7. Respondent Preferences for Texting or Voice Calls ................................................... 31
8. Using the Cell Phone to Avoid Others ....................................................................... 32
9. Multinomial Logistic Regression Model of Average Number of Daily Texts on Predictors
(Weighted Data) ....................................................................................................... 34
10. Multinomial Logistic Regression Model of Average Number of Daily Texts on Predictors
(Non-Weighted Data) ............................................................................................... 35
11. Multinomial Logistic Regression Model of Preferences for Texting or Talking on Predictors
(Weighted Data) ....................................................................................................... 37
12. Multinomial Logistic Regression Model of Preferences for Texting or Talking on Predictors
(Non-Weighted Data) ............................................................................................... 38
13. Binary Logistic Regression Model of the Dependent Variable of Pretending to Talk on a
Cell Phone on Predictors (Weighted Data) ................................................................ 39
14. Binary Logistic Regression Model of the Dependent Variable of Pretending to Talk on a
Cell Phone on Predictors (Non-Weighted Data) ........................................................ 40

8
CHAPTER 1
INTRODUCTION
With the cell phone’s popularity increasing each year, research into this technology has
proliferated. The explosive growth of text messaging has attracted great interest from
researchers. Specifically, researchers are interested in why texting has become prolific. In some
countries, for example, texting is now preferred to voice calls (Baron 2009). For American teens,
texting is also preferred to voice calls (CTIA 2008; Lenhart et al. 2010). The present study
examined texting versus talking among undergraduates at a regional university. In particular, this
study examined potential predictor variables of texting such as sex, age, and extroversion.
Brief History of the Cell Phone
The origins of the mobile telephone go back to the late nineteenth century as an extension
of radio communications. The use of radio waves for compunction purposes dates back to the
1860s. Between 1866 and 1873, Dr. Mahlon Loomis, a dentist from Virginia, successfully
transmitted electric discharges a distance of 18 miles between two mountaintops. Loomis
discovered that these electric discharges could carry information if senders arranged the
information into Morse code. Although Loomis received a patent for his work, for financial
reasons, he never pursued it (Farley 2003). Loomis’s work, however, was continued by other
scientists. By the late 1880s, Heinrich Hertz, a German professor, delineated the process of how
electromagnetic waves, which he called radio waves, travel through the atmosphere. After
Hertz’s discovery, various inventors began exploring how radio waves could be used for
communication (Ling and Donner 2009).
Guglielmo Marconi laid the foundation for the development of radio communication. In
1894, Marconi began experimenting with methods of sending radio signals over long distances.

9
He succeeded, when, in 1901, he successfully sent radio signals across the Atlantic Ocean to the
United States (Farley 2003). Nine years later, Marconi had so improved his radio system he sent
a radio signal from the United Kingdom to Buenos Aires (Ling and Donner 2009). Thus, with
Marconi, radio communication became a viable option (Farley 2003).
Radio communication continued to advance with the introduction of the vacuum tube.
This invention allowed voice communication to occur over radio channels rather than just Morse
code, thus allowing radio communication among police officers, fire fighters, fishermen, and the
U.S. military (Ling and Donner 2009). As these examples show, mobile communication through
radio initially focused on public rather than private use.
Alongside radio communication, the landline telephone grew in popularity. In existence
since 1876, it began to slowly diffuse through the U.S. during the early part of the twentieth
century; in 1900, there was one telephone subscription per 10,000 U.S. residents. By 1915,
phone subscriptions increased to one per 1,000 U.S. residents. Though not yet ubiquitous, by the
early part of the twentieth century, it had slowly gained a foothold (Ling and Donner 2009).
The merger of the landline telephone and radio communication eventually led to the
mobile phone. AT&T and Southwestern Bell introduced the first radio-telephone service in St.
Louis, Missouri in 1946 (Farley 2003). These mobile phones were huge by today’s standards and
consumed high levels of energy. Moreover, this new system functioned within a limited area.
Further, the new system could handle only a limited number of subscribers, which constrained its
use (Ling and Donner 2009). Prohibitive price also kept many people from purchasing mobile
phones (Farley 2003).
The inventions of the transistor and integrated chip, along with the development of the
cellular tower system for handling calls, provided technological means for the creation of a
10
contemporary mobile phone network. The transistor and integrated chip enabled mobile devices
to become smaller and more energy efficient. The need to expand the range of mobile phones led
developers to create the cellular system; instead of having one central tower, engineers decided
that having many small towers in different locations would be more practical. With one central
tower, mobile calls are dropped when a user goes out of range; in contrast, the cellular system
allows the calls to be routed from tower to tower as a mobile phone user moves from area to
area.
Although the basic technological platform was in place, the mobile phone did not gain
popularity in the U.S. Regulatory problems, lack of uniform standards, the configuration of
mobile handsets, and subscription problems hindered the growth of the cell phone in the U.S.
(Farley 2003; Ling and Donner 2009). European countries, however, did a much better job
solving these problems (Lacohee, Wakeford, and Pearson 2003). By the early part of the twenty-
first century, U.S. developers had solved most of the previously mentioned logistical problems,
so that by 2002, nearly 47 in 100 persons owned a mobile phone in the U.S (Ling 2004).
Text messaging is a mobile phone feature growing in popularity in nearly every country
with mobile phone technology. Designing mobile phones that also permit the option of a short
written messaging service, better known as “text messages,” emerged in Europe during the
1980s. European developers wanted to create a short messaging data service to augment the
calling feature of mobile phones. At the time, ironically, texting was not viewed as integral to
mobile phones but an ancillary feature that could attract more customers. Designers envisioned
text messaging as a quick way to send a message to someone out on the job or to receive a notice
from the phone company. Finn Trosby, considered the inventor of text messaging, compared the
enormous popularity of text messaging to a fairy tale. “The story [of texting] has a slight

11
resemblance to those of the Norwegian fairy tale character Askeladden, who picks up all kinds of
items that he encounters given the presumption that it may come to use some day. In the
adventure, they always do, resulting in massive success (quoted in Goggin 2006, p. 71).” In fact,
companies considered text messaging so unimportant that they did not charge for it. This fact
made it very popular among younger users in Europe. Even when companies closed the loop
hole, the price of texting was less than that of a voice call, resulting in its continued popularity in
Europe (Longoria and Stark-Smith N.d.).
Literature Review
The ubiquity of cell phone use has led researchers to examine why so many persons have
readily taken up mobile communication and how this communication has changed everyday life.
In addition, researchers are also exploring how persons with various psychological temperaments
use of the cell phone either through voice calls or text messaging.
Why do persons use cell phones? Studies in recent years have found that safety and
security were important motives. In 1999, the EURESCOM P903 study, a qualitative study
consisting of 36 focus groups from nine European countries, found that safety was a predominant
motive. For example, 82 percent of the respondents reported that the cell phone was useful
during an emergency. No other attitudinal indicator had such an extreme score in the study,
revealing the importance of safety for cell phone users. A follow up study conducted in 2000 in
Norway also showed the importance of safety as a motive for cell phone use. In this study, 56
percent of the respondents stated that the cell phone was most useful during an emergency
situation. Interestingly, the study found that age was a robust predictor for whether respondents
perceived the cell phone as a safety and security tool. Seventy-seven percent of the respondents
over the age of 67 agreed with the statement that cell phones were the most helpful during an

12
emergency, whereas only 44 percent of respondents between the ages of 35 and 44 agreed with
this statement (Ling 2004).
Other research has revealed the importance of safety for using a cell phone. In a study of
U.S. teens, Lenhart et al. (2010) reported that 93 percent of teenagers ages 12 to 17 agreed that
they felt safer with cell phones. However, the sex of the respondent also seemed important, with
teenage girls in the study placing greater emphasis on describing the cell phone as a safety
device. This same study revealed that safety concerns were the primary reason parents purchased
a cell phone for their child: 98 percent of parents in the study identified safety as the reason for
buying a cell phone for their child.
Other motivations than safety do, however, exist. For instance, the mobile phone has
changed the way individuals coordinate their activities with family and friends (Campbell 2005).
Ling and Donner (2007) found that before the diffusion of the mobile phone, individuals often
called a certain location such as the home or office to reach a person. Persons thus had difficulty
changing plans. The cell phone, by contrast, allowed one to be reached directly no matter the
location, allowing finer means of synchronization. If an individual was in traffic, he or she could
use the mobile phone to reschedule a rendezvous. In essence, time became more flexible since
individuals could be contacted wherever they might be, allowing for schedule changes. The
previously cited EURESCOM P903 study also confirmed the importance of the cell phone as a
coordination tool. Around 92 percent of the respondents in the study agreed that cell phones were
useful for informing the other party of one’s delay, and approximately 75 percent of the
respondents agreed with the notion that cell phones could be used to call ahead (Ling 2004).
Lenhart et al. (2010) also found that around 87 percent of American teens aged 14 to 17 used

13
their cell phones for social coordination. Meanwhile, approximately 75 percent of the parents
surveyed reported using their cell phones for coordinating their schedules.
Focus groups of teens in this study also revealed these same patterns. For example, one
male focus group participant stated that he could not envision making plans without his cell
phone. At the same time, however, teens in the focus groups also noted some of the trade-offs
that accompanied social coordination via the mobile phone. Some teens, for instance, believed
that the ability to change plans quickly resulted in less commitment to schedules. Nevertheless,
the majority of the teens in the focus groups viewed the social coordination enabled by the cell
phone as a blessing.
Negative effects have also been reported to accompany cell phone use among certain
categories of users. Workers with families appeared to experience more stress. In a longitudinal
study of 1, 367 couples, Chesley (2005) found that cell phone use resulted in higher levels of
distress and lower levels of family satisfaction, since persistent cell phone communication more
readily enabled family issues to affect a person during work hours. Ling and Donner (2007)
noted that cell phones have allowed work life to crowd out, compete with, and compromise a
person’s private life.
Cell phones have also affected interaction between divorced parents and their children.
Ling and Donner (2007) cited a Norwegian study revealing that children from divorced homes
received cell phones earlier than other children. In Ling and Donner’s view, the cell phone
benefited divorced couples and their children. They argued that the cell phone may reduce
confrontations between ex-spouses by allowing a parent to call his or her children directly rather
than indirectly via the ex-spouse.

14
Researchers have also noted the importance of cell phones as status symbols. Ling (2004)
found that the type of phone a person owned acted as a status marker. For example, one
respondent in his 20s stated that he could tell if a person was a businessman by the type of phone
the person carried, and another respondent reported being proud of his particular type of cell
phone. The use of the cell phone as a status symbol has been especially prevalent in cross-
cultural studies. For instance, Varbanov (2002) found that Bulgarians of low social status often
used cell phones as a way of increasing their standing in the eyes of others, noting that persons
enjoyed talking loudly on their phones in public to get attention. These “new” cell phone owners
hoped that this attention would gain them status. Fortunati (2002) also found that Italians viewed
cell phones as status markers. The cell phone also appeared to be especially important as a status
symbol among Norwegian teens. Using survey data from 2,979 high school students along with
survey data collected from 120 self-selected teen boys and girls, Skog (2002) found a correlation
between social class and cell phone use. Skog noted that teens from working class backgrounds
had higher rates of mobile phone ownership than teens from higher social strata. However, this
difference in mobile phone ownership was significant only for working class and upper class
boys, not girls. The importance of cell phones as status symbols has also been found in the U.S.
An online survey of 2,000 U.S. teens, for example, revealed that the cell phone ranked second
only to clothes for determining a person’s social status (CTIA 2008).
As cell phone use has increased in the U.S. and in parts of Europe, analysts have started
examining its impact on interpersonal etiquette. These studies of etiquette have focused on
voice calls rather than text messaging. Commentators have noted three major areas where the
cell phone has affected norms of etiquette. First, cell phone use in public places such as
restaurants and theaters may lead to breaches in etiquette if the user speaks too loudly, thus
15
disturbing others. For example, nearly two-thirds of the respondents from a European-wide
survey agreed with the statement that the cell phone disturbed people, with nonusers agreeing
more strongly than users (Ling 2004). A study of 383 U.S. college students found that the
majority of respondents believed it was inappropriate to use cell phones in some public areas
such as theaters and libraries (Lipscomb et al. 2007). Cell phones may also alter or interrupt
physical co-present interaction with another person. When a person decides to take the call and
suspend his or her interaction, it may be considered impolite and rude. Finally, Ling (2004)
found that some people felt uncomfortable hearing another person’s call.
Studies have also highlighted the differences in perception of cell phone users and non-
users. Ling (2004) found that persons who did not use cell phones appeared more likely to view
cell phones as a nuisance. However, this view may change when a person starts using a cell
phone. Palen, Salzman, and Youngs (2000) noted this trend in a study of the behavioral changes
in 19 persons subsequent to adopting the cell phone in their daily lives. Nearly all of the subjects
initially held negative views about cell phones; however, afterwards, the subjects began to
temper their views. All but one subject, in fact, changed their perceptions from negative to
positive. Moreover, several subjects did not even care how others perceived their use of cell
phones in public.
The explosive growth of text messaging has captured the research community. In some
countries texting has actually replaced voice calls as the preferred method of cell phone
communication; for example, more Japanese mobile users preferred texting to talking (Baron and
Ling 2007). The popularity of text messaging has also led researchers to compare it directly to
voice calls in order to examine the usage differences between the two methods of
communication.

16
Baron and Ling (2007) provided one of the most descriptive studies exploring both the
frequency of talking and texting and the reasons behind the usage of both mediums. Their study
of 93 college undergraduates from two U.S. universities found that talking was more prevalent
than texting. For example, of the last 10 mobile communications sent or received from
respondents at the two universities, only 27 percent were texts. Despite this disparity, nearly all
of the respondents used texting: 91 percent of respondents from university one and 96 percent of
respondents from university two used text messaging. They also examined to whom students
most often texted or called. Respondents at both universities directed most of their calls to same-
age friends, with nearly 60 percent of the last 10 calls going to this category. Parents were the
next most frequently called, with around 22 percent of calls at the first university and 17 percent
of calls at the second university going to parents. Moreover, students from each university were
more likely to text their friends than other categories. Students from university one sent 76
percent of their texts to friends, while students from university two sent 54 percent of their texts
to friends. Siblings were the second most frequently texted from university one, and the category
of “other” received the second most texts from the second university in the study.
Baron and Ling (2007) also examined reasons why respondents preferred voice calls to
texting. For both universities, voice calling was preferred for keeping in touch and also for
making arrangements to meet. Making arrangements was also a major reason for sending text
messages. Why might a person choose to text rather than make a voice call? The researchers
found that a majority of respondents cited the fact that it was an inconvenient time for them to
talk as their primary reason for texting. A desire for brevity and better timing were the next most
frequently cited reasons. Finally, the researchers examined if respondents had ever pretended to
talk on their phones and the reasons behind this behavior. Approximately 35 percent of the

17
respondents at university one admitted such pretense, while 68 percent at the second university
admitted to this behavior. For females at each university, being out alone at night was the
primary reason for feigning cell phone use, followed by the desire to avoid someone. Although
this study explored several areas of cell phone use, it had two major weaknesses. Limitations of
this study included the use of a small convenience sample and the absence of male respondents at
the second university.
Baron (2009), in a recent cross-cultural study of 2,001 university students aged 18 to 24
from Sweden, the U.S., Japan, Italy, and South Korea, compared the frequency of voice calls to
text messages. She found Japanese, Korean, and Italian students send more text messages than
students from Sweden and America. In fact, around 81 percent of Korean students sent more
than 11 text messages the day prior to the study, compared to just 32 percent of American
students. Meanwhile, nearly 44 percent of Korean students sent 30 or more texts the previous
day, while only 11 percent of U.S. students did so.
Although texting rates in the U.S. have not eclipsed the texting rates of some European
countries, this trend may be changing. Lenhart et al. (2010) found that U.S. teens now text more
frequently. Data came from a survey of 800 U.S. teens aged 12 to 17 and nine focus groups with
teens aged 12 to 18. This study revealed that between 2008 and 2009 teens who said they texted
rose from 38 percent to 54 percent, a remarkable 42 percent increase in only one year. Moreover,
half of all teens in the survey reported sending 50 texts a day, and nearly 15 percent reported
sending 200 texts a day.
The study also highlighted differences between males and females with regard to texting.
Girls typically sent and received approximately 80 messages versus boys who sent and received
approximately 30 texts per day. Girls were also more likely than boys to send messages to

18
friends. Around 84 percent of girls said they exchanged long text messages dealing with personal
matters, while only 67 percent of boys did the same. With regard to voice calls, teens in the
survey averaged approximately five calls per day and cited voice calls as being important for
connecting with their parents. Again, the study revealed differences between teen boys and girls.
For example, approximately 59 percent of girls used their cell phones to call friends each day
compared to 42 percent of boys. Prior research from the U.K. and other European countries has
also found that females send more texts than males send (Crystal 2008; Faulkner and Culwin
2005).
Psychological variables may also influence a person’s preference for texting rather than
talking. Reid and Reid (2007), using the Leary Social Anxiousness scale and the UCLA
Loneliness scale, found that lonelier participants preferred voice calls to text messaging, while
socially anxious participants preferred texting. Data came from an internet survey of 158
participants aged 16 to 55 from the U.K and the U.S. The study revealed a weak negative
correlation between texting and loneliness (r = -.18, p < 0.05). The study also demonstrated that
socially anxious participants preferred texting to talking, although the researchers admitted that
the correlation was weak and non-significant (r = .12). Nevertheless, the t test contrasts revealed
significant differences between the groups, t (155) = -3.83, p < 0.01. In fact, all of the t tests
showed significant differences between anxious and lonely participants in terms of texting and
voice calls. The researchers thus believed that psychological temperament may be a mediating
factor with texting and talking. These findings were consistent with other research that has noted
significant differences between people who text and those who prefer talking (Reid and Reid
2004; Rettie 2007). Nevertheless, one study of college students found that loneliness did not lead
19
to a preference for texting (Jin and Park 2010). Consequently, additional research needs to be
done examining how psychological variables interact with preferences for texting and talking.
Researchers have also examined other factors that may lead to a preference for texting
over talking. Ceccucci, Peslak, and Sendall (2010) found that a person’s attitude toward texting,
compatibility of texting with existing values, ease of use, and visibility were all significant
predictors of texting. Data came from a sample of 153 students and faculty members at two
northeastern universities. The study revealed that visibility proved the most significant predictor
of texting. This variable had a standardized coefficient of .381. The researchers hypothesized that
seeing other individuals text may influence a person to do the same. Attitude toward the
technology was also significant with a standardized coefficient of .351. Ease of use and
compatibility were the next strongest predictors of texting, with standardized coefficients of .271
and .255. The results were significant at the p < .05 level. These findings were consistent with
another recent study using similar variables as predictors of text messaging (Ceccucci, Peslak,
and Sendall 2010a).
Taylor and Harper (2003) provided one of the more unique explanations of why people
text. The researchers speculated that texting was a form of gift giving, with texts being offered as
gifts to friends and others. Using field observation and participant interviews, the researchers
found that some respondents refused to delete texts from friends and significant others because
of the value they had. When asked why they did not transfer the message to another medium
such as paper, the respondents said that the messages somehow lost their value during the
transfer. Taylor and Harper also noted that when a person did not respond to a text message, he
or she breached texting etiquette. If one person texted a friend, the friend was supposed to text

20
back in a timely manner or risk breaching etiquette. The researchers thus viewed texting
behaviors and texting etiquette as analogous to gifting.
The researchers also found that text messaging was very important for keeping romantic
relationships intact. One respondent noted that his wife expected him to text her several times a
day. When prodded what would happen if he did not text, the respondent said that it may cause
relationship problems with his spouse. For some individuals, texting also appeared important for
maintaining friendships. One respondent, for example, reported feeling depressed when she did
not receive texts from a friend during the day.
Other facets of texting have also been studied. For example, researchers have recently
started examining the grammatical structure of text messages (Crystal 2008; Ling and Baron
2007), the use of text messaging to harass others (Short and McMurray 2009), and the impact of
texting on driving behavior (Madden and Lenhart 2009). If texting continues to grow as a
medium, studies on its facets will proliferate. The same can be said of the cell phone in general.
Goggin (2006), for example, argued that improvements in technology will add new facets to the
cell phone. Hence, texting may at some point be replaced by another form of communication.
The current study was an extension of prior studies examining texting. Although previous
research has examined sex and age, very few have examined the effects of these variables on
undergraduate texting frequency and preference using a logistic regression model. Moreover,
prior research has not examined the effects of extroversion on frequency and preference among
undergraduates. Finally, to add to the findings reported by Baron and Ling (2007), this study
explored how sex, age, and extroversion affected the dependent variable of pretending to talk on
a cell phone to avoid someone.

21
Operationalization of Variables
As previously mentioned, the independent variables in the study consisted of sex, age,
and a variable measuring extroversion. In the study, males were coded 1 and females 0. The age
variable was scaled and measured the respondent’s age in years. The mean age of students in this
study was 21.18 years with a standard deviation of 4.7. To examine if a respondent had an
extroverted personality, questions derived from the NEO-Five Factor Inventory (FFI) were used.
The NEO-FFI scale consists of 60 questions designed to measure five factors of personality:
neuroticism, extroversion, agreeableness, openness, and conscientiousness (Costa and McCrae
1992). Through factor analysis, the NEO-FFI has proven reliable for measuring the correlation
of these traits in individuals (Srivastava 2011). Students in this study responded to four questions
measuring extroversion. The NEO-FFI divides extroversion into three categories: positive affect,
sociability, and activity. For the present study, students answered questions measuring the
sociability aspect of extroversion (See question 8 in survey for these items). The extroversion
scale for sociability has a range of 1 to 20, with higher scores indicating increased extroversion.
Undergraduates in the study averaged 13.63 on the scale with a standard deviation of 2.9.
The variable quantifying texting frequency was trichotomous: 0 to 99 messages, 100 to
199 messages, and 200 or more messages. The variable examining preference for texting or
voice calls was divided into three categories. Respondents could choose (1) texting, (2) talking,
or (3) having no preference. Finally, respondents were asked if they had ever pretended to talk on
their cell phones to avoid someone. This question was dichotomous: yes or no.
Hypotheses
Three independent variables—sex, age, and extroversion—and three dependent
variables—texting frequency, preference for texting or talking, and use of the cell phone to avoid
22
others—were examined in this study. For sex, it was hypothesized that females would send
more texts than males would send (H1a), prefer texting over talking (H1b), and be more likely
than males to feign talking on their phones to avoid someone (H1c). This hypothesis was based
on the research of Baron and Ling (2007) who found that females were much more likely than
males to feign cell phone use to avoid others.
A second set of hypotheses explored the effects of age on these dependent variables.
It was hypothesized that younger respondents would send more texts than older respondents
would send (H2a) and be more likely to prefer texting to voice calls (H2b). The effect of age on
using a cell phone to avoid someone was also tested. It was predicted that younger respondents
would be more likely to feign using their cell phones to avoid someone (H2c).
Extroversion was the final independent variable examined in this study. It was
hypothesized that more extroverted participants would send more texts (H3a) and would be more
likely to prefer texting (H3b). It was hypothesized that extroversion affected whether a person
had feigned talking on his or her mobile phone to avoid others, with less extroverted participants
being more likely to use their phones for avoiding others (H3c).

23
CHAPTER 2
METHODS
Research Method and Sampling Strategy
Data were collected using an online survey administered to currently-enrolled students at
a regional Southern university. The survey consisted of items measuring a broad range of cell
phone behaviors and attitudes. Questions measured texting frequency, motivations for texting
and voice calling, preferences for texting or voice calls, and extroversion as well as demographic
variables. A convenience sampling design was employed for data collection.
Subjects and Collection Method
Students enrolled during the fall semester of 2010 were sampled. The study used data
only from undergraduate respondents. A total of 500 students took the survey; however, 15 non-
undergraduate respondents were removed from analysis, leaving a total of 485. Thus, this study
consisted of information collected on 485 undergraduate respondents. Of these, around 75.9
percent (365) were female and 24.1 percent (116) were male. Four respondents declined to
answer this question. Nevertheless, the study over-sampled females.
Data derived from students of all class ranks. Approximately 43 percent of respondents
were freshman, while sophomores, juniors, and seniors made up a combined 57 percent of the
sample. In terms of age, 87.4 percent of respondents were between 17 and 24 years of age, while
12.6 percent were 25 years or older. A majority of the sample was white non-Hispanic (83.2
percent). African Americans made up 8.1 percent of the sample, while Asians, Hispanics, and a
category of “other” made up 8.7 percent combined. Two respondents declined to answer this
question, however.

24
To collect the self-reported data on cell phone behaviors and attitudes, the SONA website
was used. The SONA website is an online survey forum designed by SONA Systems and
administered by this Southern university’s psychology department. Students enrolled in
introductory psychology courses at this university are often required to take a number of surveys
on the site as part of their final grade or for extra credit. However, other departments also use the
SONA site for their classes. Students enrolled in classes that use SONA are assigned an
identification number. At the end of the semester, the system sends an email to each instructor
telling him or her how many surveys each student has completed. Unlike instructors, researchers
who put their surveys on the SONA site have access only to a student’s identification number
rather than his or her name, thus protecting each student’s anonymity. Surveys on the SONA site
are analogous to paper surveys. Students, for example, can answer open ended questions as well
as close-ended questions in exactly the same fashion as a paper survey. The site also allows
students to quit participating in a survey at any time. Further, students have the option to decline
answering particular questions if they so choose. The survey used for this study was
administered to students via the SONA website during the fall 2010 semester. The survey
consisted of 51 questions measuring various cell phone attitudes and behaviors, with the bulk of
questions focusing on texting and voice calls (see Appendix for survey).
Statistics and Data Analysis
To test hypotheses, the study used two forms of logistic regression. Because texting
frequency and preferences for texting or talking had more than two categories, the study used
multinomial logistic regression for these variables. This type of regression allows predictions to
be made for dependent variables with more than two response categories However, multinomial
regression does not involve assumptions of ordinality. The “pretending to talk on the cell phone”

25
variable had only two categories, thus binary logistic regression was used for analysis. The
logistic regression model is expressed as ln(P1)= , where ln(P1) is the logged odds that the
dependent variable is 1 as opposed to 0, is a constant term in the regression model, i is a
vector of coefficients representing the effect of each predictor on the dependent variable, and Xi
is the corresponding vector of values of the independent variable. All of the independent
variables were included together in the models rather than being placed in separately. Thus, the
models revealed the net effects of the independent variables on the dependent variables. To
better analyze the data, two models were used for each dependent variable. The first model for
each dependent variable used weighted data, while the second model for each variable used non-
weighted data. A weight variable was used because of the preponderance of females in the study.
Females constituted nearly 76 percent of the respondents in the study, while in the actual student
body population females made up 57 percent. To make the data analogous to the student body
population, females were weighted down by a value of .746, while males were given a weight of
1.8.

26
CHAPTER 3
FINDINGS
General Characteristics of Cell Phone Use Among Undergraduates
The survey revealed the ubiquity of cell phone use among undergraduates, with 482
respondents (99.4 percent) reporting cell phone use, and 449 respondents (92.8 percent)
reporting the cell phone as their primary communication device. As noted in table 1, concomitant
to the upsurge in cell phone use, use of landline phones has declined among undergraduates, with
287 respondents (59.2 percent) reporting that they do not have landline telephones. Four hundred
sixty-six undergraduates (96.5 percent) reported generally keeping their cell phones turned on,
and 460 respondents (95 percent) generally kept their cell phones within reach. The responses
showed the popularity of text messaging among undergraduates. As can be seen in table 1, in
terms of text messaging, 479 respondents (99 percent) reported having this function on their
phones, while 477 respondents (99 percent) used their phones for texting. Unlimited texting
plans also appeared common among sample respondents, with 439 (91.3 percent) stating they
had unlimited texting plans. Table 2 shows that in terms of texting frequency, 284 respondents
(59 percent) said they send an average of between 0 and 99 messages per day; however, 126
respondents (26.2 percent) said they send between 100 and 199 messages per day. Only 71
respondents (14.8 percent) said they send and receive 200 or more texts per day. These findings
clearly highlight the importance of the cell phone to the lives of these respondents; these findings
also indicate the importance of text messaging for undergraduates.

27
Table 1 General Information on Undergraduate Cell Phone Use
Yes
(frequency)
No
(frequency)
Do you use a cell phone?
99.4%
(482)
0.6%
(3)
Is the cell phone your primary device of communication?
92.8%
(449)
7.2%
(35)
Do you have a landline phone?
40.8%
(198)
59.2%
(287)
Do you generally keep your cell phone turned on?
96.5%
(466)
3.5%
(17)
Do you generally keep your phone within reach?
95%
(460)
5%
(24)
Do you have text messaging on your phone?
99%
(479)
1%
(5)
Do you use your phone for text messaging?
99%
(477)
1%
(5)
Do you have unlimited texting on your phone?
91.3%
(439)
8.7%
(42)
Note: Because of non-response on several questions, not all row frequencies sum to 485.
Table 2 Quantity of Texts Sent and Received
Average texts sent daily
(frequency)
Average texts received daily
(frequency)
0-99 messages
59.0%
(284)
59.7%
(287)
100-199 messages
26.2%
(126)
25.4%
(122)
200 or more messages
14.8%
(71)
15.0%
(72)
Note: Because of non-response on several questions, not all column frequencies sum to 485.

28
Whom Are Respondents Texting and Voice Calling?
The survey also asked respondents whom they texted the most and those frequencies are
summarized in table 3. Around 60 percent (289) said they texted their friends very frequently
compared to other categories. The next most frequently texted group was the “others” category.
Twenty-six percent of respondents (118) very frequently texted “others,” while 15.1 percent (69)
texted siblings very frequently. Approximately eight percent (37) and five percent (15) texted
their parents or child very frequently.
Table 3 People Respondents Text the Most
Text very
frequently
(frequency)
Text
frequently
(frequency)
Occasionally
text
(frequency)
Sometimes
text
(frequency)
Never text
(frequency)
Parents
7.7%
(37)
20.8%
(100)
33.3%
(160)
21.6%
(104)
16.6%
(80)
Child
4.7%
(15)
4.0%
(13)
5.6%
(18)
6.2%
(20)
79.4%
(255)
Friends
60%
(289)
23.4%
(113)
11.8%
(57)
3.9%
(19)
0.8%
(4)
Siblings
15.1%
(69)
21.0%
(96)
30.9%
(141)
18.2%
(83)
14.9%
(68)
Others 26.0%
(118)
16.6%
(75)
28.0%
(127)
18.5%
(84)
10.8%
(49)
Note: Because of non-response on several questions, not all row frequencies sum to 485.
When asked how often they voice call friends, around 34 percent of respondents (164)
stated they called their friends frequently or very frequently. By contrast, as shown in table 4,
nearly 70 percent respondents (339) frequently or very frequently called their parents. Parents
were thus the most likely category to receive voice calls from participants. Table 4 summarizes
these results.

29
Table 4 People Respondents Call the Most
Call very
frequently
(frequency)
Call
frequently
(frequency)
Occasionally
call
(frequency)
Sometimes
call
(frequency)
Never call
(frequency)
Parents
33.7%
(163)
36.4%
(176)
17.8%
(86)
8.3%
(40)
3.9%
(19)
Child
3.5%
(11)
6.4%
(20)
9.3%
(29)
6.7%
(21)
74.1%
(232)
Friends
10.6%
(51)
23.5%
(113)
39.7%
(191)
23.7%
(114)
2.5%
(12)
Siblings
9.0%
(41)
15.8%
(72)
32.4%
(148)
26.5%
(121)
16.4%
(75)
Others
12.8%
(58)
17.4%
(79)
31.6%
(143)
26.0%
(118)
12.1%
(55)
Note: Because of non-response on several questions, not all row frequencies sum to 485.
Reasons for Texting and Voice Calling
The survey also examined reasons for texting rather than voice calling. Table 5 reveals
that restrictions on the respondent’s and recipient’s ability to engage in a call at the particular
time of the communication were the two top reasons for texting rather than talking, with
approximately 80 percent of respondents (385, 396) citing these as either somewhat important or
very important. For instance, the respondent or recipient may be in a place where voice
communication would be disruptive, promoting the use of texting rather than calling.
Respondents also said that some messages were better delivered through texting, with 72 percent
of respondents (345) considering this as important. Similarly, around 70 percent of respondents
(335) cited wanting to keep the message short being an important reason for texting rather than
calling. Interestingly, the lower price of text messaging did not appear to be an important reason

30
for using this medium over talking. Some respondents cited keeping distance from the recipient
as an important reason for texting, although the percentage was low. For example, around 37
percent of students cited distance as an important reason for texting. Texting thus allows some
respondents an escape from confronting recipients via voice calls.
Table 5 Reasons for Texting Rather Than Calling
Very
important
(frequency)
Somewhat
important
(frequency)
Not very
important
(frequency)
Not important
at all
(frequency)
Not a good time for caller to
talk
33.8%
(162)
46.5%
(223)
16.0%
(77)
3.8%
(18)
Not a good time for the
recipient to talk
32.2%
(155)
50.1%
(241)
15.0%
(72)
2.7%
(13)
Wants to keep the message
short
32.2%
(155)
37.4%
(180)
21.6%
(104)
8.7%
(42)
Particular communication is
better done through texting
28.7%
(138)
43.0%
(207)
20.2%
(97)
8.1%
(39)
Texting is cheaper
14.0%
(67)
14.3%
(68)
22.6%
(108)
49.1%
(234)
Wants to keep some distance
from the recipient
8.4%
(40)
28.7%
(137)
30.8%
(147)
32.2%
(154) Note: Because of non-response on several questions, not all row frequencies sum to 485.
Respondents were also asked about reasons for voice calling rather than texting. Table 6
shows that nearly 87 percent of students (421) said that some types of communication were
better mediated through voice calls. Respondents also stated that making a voice call was
influenced by whether the recipient texted or not, with 72 percent of students (348) identifying
this reason as important. Hearing the voice of the recipient was also important to some
respondents; close to 70 percent of respondents (337) identified wanting to hear the recipient’s
voice as important for making a voice call. The difficulty in composing text messages did not

31
appear a significant reason for voice calling. In fact, 65 percent of students (310) did not consider
the difficulty of composing texts as a reason to switch to voice calls.
Table 6 Reasons for Calling Rather Than Texting
Very
important
(frequency)
Somewhat
important
(frequency)
Not very
important
(frequency)
Not important
at all
(frequency)
Texting takes too much effort
10.9%
(52)
24.3%
(116)
26.8%
(128)
38.1%
(182)
Some communication is
better done through talking
53.5%
(259)
33.5%
(162)
8.1%
(39)
5.0%
(24)
Recipient does not text
32.0%
(155)
39.9%
(193)
17.4%
(84)
10.7%
(52)
Wants to hear recipient’s
voice
32.6%
(157)
37.3%
(180)
22.0%
(106)
8.1%
(39) Note: Because of non-response on several questions, not all row frequencies sum to 485.
Student Preferences for Texting and Talking
Responses from the survey indicated that texting appeared to be more popular with
students than voice calls. As shown in table 7, close to 44 percent of students (210) preferred
texting, while only 13 percent (64) preferred talking. Nevertheless, 43 percent of students (207)
preferred neither texting nor talking, using both mediums for different situations. Even though
texting was more popular than voice calling among some of the respondents, it has not replaced
talking as a medium of communication.
Table 7 Respondent Preferences for Texting or Voice Calls
Prefers texting (frequency)
43.7% (210)
Prefers talking (frequency)
13.3% (64)
Has no preference (frequency) 43.0% (207) Note: Because of non-response, the column frequencies do not sum to 485
32
Using the Cell Phone to Avoid Others
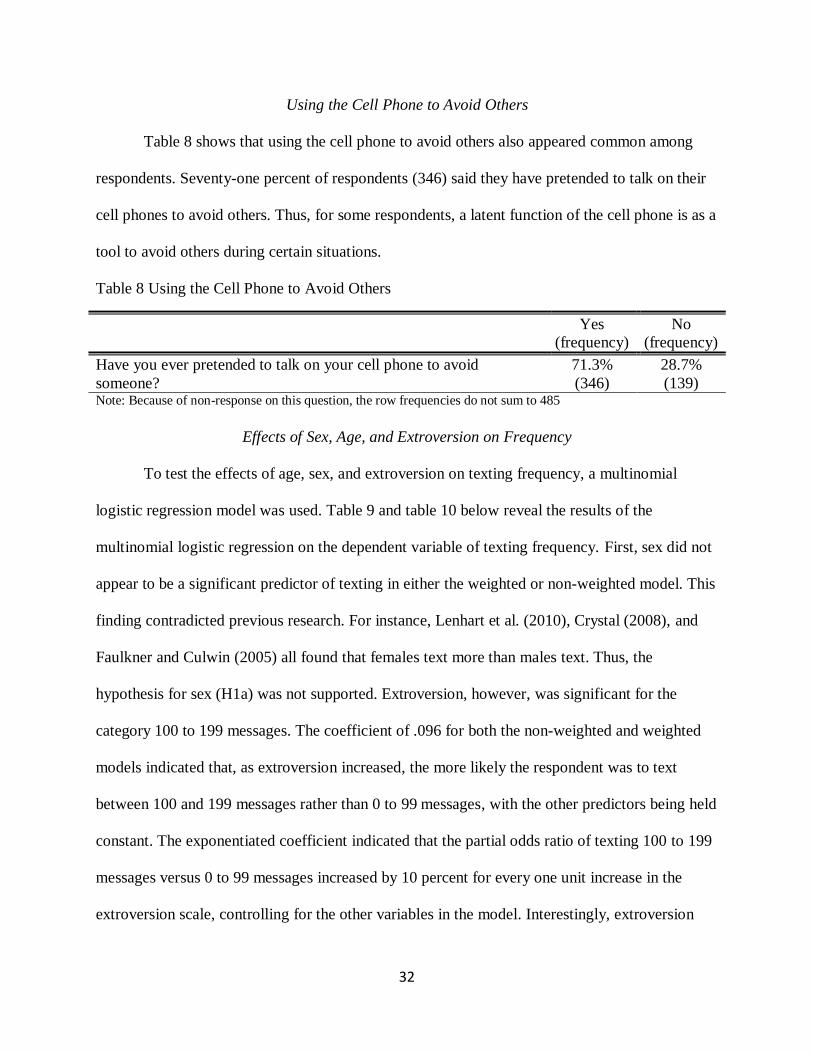
Table 8 shows that using the cell phone to avoid others also appeared common among
respondents. Seventy-one percent of respondents (346) said they have pretended to talk on their
cell phones to avoid others. Thus, for some respondents, a latent function of the cell phone is as a
tool to avoid others during certain situations.
Table 8 Using the Cell Phone to Avoid Others
Yes
(frequency)
No
(frequency)
Have you ever pretended to talk on your cell phone to avoid
someone?
71.3%
(346)
28.7%
(139) Note: Because of non-response on this question, the row frequencies do not sum to 485
Effects of Sex, Age, and Extroversion on Frequency
To test the effects of age, sex, and extroversion on texting frequency, a multinomial
logistic regression model was used. Table 9 and table 10 below reveal the results of the
multinomial logistic regression on the dependent variable of texting frequency. First, sex did not
appear to be a significant predictor of texting in either the weighted or non-weighted model. This
finding contradicted previous research. For instance, Lenhart et al. (2010), Crystal (2008), and
Faulkner and Culwin (2005) all found that females text more than males text. Thus, the
hypothesis for sex (H1a) was not supported. Extroversion, however, was significant for the
category 100 to 199 messages. The coefficient of .096 for both the non-weighted and weighted
models indicated that, as extroversion increased, the more likely the respondent was to text
between 100 and 199 messages rather than 0 to 99 messages, with the other predictors being held
constant. The exponentiated coefficient indicated that the partial odds ratio of texting 100 to 199
messages versus 0 to 99 messages increased by 10 percent for every one unit increase in the
extroversion scale, controlling for the other variables in the model. Interestingly, extroversion

33
did not retain its significance for the category of texting 200 or more messages per day, although
for the weighted model it came somewhat close to significant at the p < .05. The hypothesis that
extroverts send more texts (H3a) thus received partial support.
Age proved to be the most significant predictor of texting frequency for both the
weighted and non-weighted models. The coefficients for the models revealed that as age
increased the odds of texting decreased. The exponentiated coefficients for both models provide
a more illustrative interpretation of how age attenuates texting frequency. For the weighted
model, a one year increase in age decreased the odds of texting 100 to 199 messages daily by
14.1 percent, controlling for the other variables in the model; stated differently, with a one year
decrease in age, the odds ratio of texting 100 to 199 as opposed to 0 to 99 messages per day
increased by 16 percent ( ). For the category of 200 or more messages, age remained
significant. A one year increase in age lowered the odds of texting 200 or more messages per day
as opposed to 0 to 99 messages per day by 20 percent, holding other variables in the model
constant. The interpretations for the non-weighted model indicated that a one year increase in
age decreased the odds of texting 100 to 199 messages by 13 percent, controlling for the other
variables. Again, older respondents were even less likely to send 200 or more text messages per
day as opposed to 0 to 99 messages, with the odds decreasing by 23 percent for each year of age,
holding the other variables constant. These findings thus supported the hypothesis of the effect of
age on texting frequency (H2a). Despite these findings, the low pseudo R2 values, which
calculate the reduction in the log-likelihood statistic, indicated that these predictors did not
substantially reduce errors in prediction of the dependent variable. In the weighted model, the
Cox and Snell value of nearly 10 percent and the Nagalkerke of roughly 12 percent revealed that
the introduction of the three predictor variables did not improve the model fit of the observed

34
log-odds ratios to a great extent. The non-weighted model had nearly identical pseudo R2 values,
indicting the same need for further explanation.
Table 9 Multinomial Logistic Regression Model of Average Number of Daily Texts on
Predictors (Weighted Data), N= 462
100-199 messages per day vs. 0-99 texts per day
Variables B
(SE)
Exp(B) 95% CI Lower 95% CI Upper
Constant
1.067
(1.031)
Sex
-.212
(.229)
.809 .517 1.267
Age
-.151***
(.041)
.859 .793 .932
Extrovert
.096*
(.040)
1.101 1.018 1.190
200 or more messages per day vs. 0-99 texts per day
Variables B
(SE)
Exp(B) 95% CI Lower 95% CI Upper
Constant
1.927
(1.537)
Sex
-.405
(.293)
.667 .376 1.184
Age
-.219***
(.067)
.803 .704 .916
Extrovert
.092
(.050)
1.096 .993 1.209
R2=.098 (Cox & Snell), .117 (Nagalkerke). Model 2(6)=47.996, p < .001. *p < .05, ** p < .01, *** p < .001.

35
Table 10 Multinomial Logistic Regression Model of Average Number of Daily Texts on
Predictors (Non-Weighted) Data, N= 462
100-199 messages per day vs. 0-99 texts per day
Variables B
(SE)
Exp(B) 95% CI Lower 95% CI Upper
Constant
.838
(.992)
Sex
-.211
(.266)
.810 .481 1.363
Age
-.140***
(.039)
.869 .805 .938
Extrovert
.096*
(.040)
1.101 1.019 1.190
200 or more messages per day vs. 0-99 texts per day
Variables B
(SE)
Exp(B) 95% CI Lower 95% CI Upper
Constant
2.965
(1.606)
Sex
-.414
(.346)
.661 .335 1.303
Age
-.259***
(.072)
.772 .670 .889
Extrovert
.073
(.050)
1.076 .976 1.186
R2=.097 (Cox & Snell), .115 (Nagalkerke). Model 2(6)=47.288 p < .001. *p < .05, ** p < .01, *** p < .001
Effects of Sex, Age, and Extroversion on Preference
Sex, age, and extroversion were also assessed for their effects on preferences for texting
or talking. Again, multinomial logistic regression was used to test these variables. The results are
shown in tables 11 and 12. Both the weighted and non-weighted models revealed the importance

36
of sex and age as predictors for preferring texting to talking; however, extroversion did not
approach significance in either of the models. The models highlighted that males preferred voice
calls to texting. For instance, the exponentiated coefficients for sex in the weighted and non-
weighted models showed that the odds of women preferring texting to talking were more than
three times higher than those of men, holding the other variables in the model constant. Put
another way, the odds of men preferring texting over talking were less than one-third of the odds
that women will prefer texting, controlling for other variables in the models. For the odds of no
preference, sex did not reach statistical significance, although the odds ratios indicated that the
odds of men having no preference versus preferring talking were 36.2 percent and 38.2 percent
lower than the odds for women. These models supported the hypothesis that females preferred
texting more than males preferred texting (H1b).
The models showed that older respondents seemed to prefer voice calls to texting. The
weighted model revealed that a one year increase in age decreased the odds of preferring texting
to voice calls by 11 percent, holding other variables constant. The non-weighted model revealed
that a one year increase in age decreased the odds of preferring texting to talking by 13 percent,
controlling for other variables in the model. Simply stated, older respondents appeared more
likely to prefer voice calls to text messaging. For the contrast of “has no preference” versus
“preferring talking,” age was also significant, revealing the importance of voice calls for older
respondents. For the weighted model, a one year increase in age decreased the odds of having no
preference in comparison to preferring voice calls by 7.3 percent. In the non-weighted model, a
one year increase in age decreased the odds of having no preference as opposed to preferring
voice calls by 9.1 percent. In simpler terms, older students were more likely to respond that they
preferred talking rather than to indicate not having a preference. The data thus supported (H2b).

37
Again, the models did not show much of an improvement in predicting the observed
probabilities. The Cox and Snell values were .094 for the weighted model and .90 for the non-
weighted model. The Nagelkerke for the weighted model was .108, while for the non-weighted
model it was .105.
Table 11 Multinomial Logistic Regression Model of Preferences for Texting or Talking on
Predictors (Weighted Data), N=461
Prefers texting vs. reference category of preferring talking
Variables B
(SE)
Exp(B) 95% CI Lower 95% CI Upper
Constant
3.308
(1.001)
Sex
-1.277***
(.302) .279 .154 .504
Age
-.111***
(.030) .894 .844 .948
Extrovert
.050
(.050) 1.051 .953 1.158
Has no preference vs. reference category of preferring talking
Variables B
(SE)
Exp(B) 95% CI Lower 95% CI Upper
Constant
2.262
(.928)
Sex
-.449
(.289) .638 .362 1.125
Age
-.076**
(.025) .927 .883 .973
Extrovert
.057
(.048) 1.058 .963 1.162
R2=.094 (Cox & Snell), .108 (Nagalkerke). Model 2(6)=45.638, p < .001. *p < .05, ** p < .01, *** p < .001.

38
Table 12 Multinomial Logistic Regression Model of Preferences for Texting or Talking on
Predictors (Non-Weighted Data), N= 461
Prefers texting vs. reference category of preferring talking
Variables B
(SE)
Exp(B) 95% CI Lower 95% CI Upper
Constant
4.441
(1.040)
Sex
-1.313***
(.342) .269 .138 .526
Age
-.140***
(.031) .869 .818 .923
Extrovert
.013
(.053) 1.013 .914 1.123
Has no preference vs. reference category of preferring talking
Variables B
(SE)
Exp(B) 95% CI Lower 95% CI Upper
Constant
3.182
(.979)
Sex
-.482
(.318) .618 .331 1.153
Age
-.095***
(.026) .909 .863 .957
Extrovert
.022
(.052) 1.022 .924 1.130
R2=.090 (Cox & Snell), .105 (Nagalkerke). Model 2(6)=43.704, p < .001. *p < .05, ** p < .01, *** p < .001.
Effects of Sex, Age, and Extroversion on Avoidance
Pretending to talk on a cell phone was also examined in this study. Using binary logistic
regression to test the variables, both models revealed that sex was a significant predictor. Age,

39
however, was significant only in the non-weighted model. Extroversion did not reach
significance in either model. In both models, females were twice as likely as males to pretend to
talk on their cell phones to avoid someone. Thus, H1c was supported by the models. As
previously mentioned, only in the non-weighted model did age prove significant. For this model,
older respondents were less likely to feign talking on their cell phones to avoid others. The
exponentiated coefficient indicated that a one year increase in age decreased the odds of
pretending to talk on a cell phone by five percent. Thus, younger rather than older respondents
appeared to use their cell phones as tools to avoid others. The data thus provided support for
H2c. As in previous models, the two pseudo R2 were very small, showing that the predictors did
not greatly improve the fit of the model.
Table 13 Binary Logistic Regression Model of the Dependent Variable of Pretending to Talk on
a Cell Phone on Predictors (Weighted Data), N= 465
Variables B
(SE)
Exp(B) 95% CI Lower 95% CI Upper
Constant
1.346
(.699)
Sex
-.885***
(.204) .413 .277 .616
Age
-.031
(.020) .969 .931 1.009
Extrovert
.036
(.035) 1.037 .969 1.110
R2=.008 (Hosmer & Lemeshow), .051 (Cox & Snell), .071 (Nagalkerke). Model 2(3)=24.384, p < .001. *p < .05, ** p < .01, *** p < .001.

40
Table 14 Binary Logistic Regression Model of the Dependent Variable of Pretending to Talk on
a Cell Phone on Predictors (Non-Weighted Data), N= 465
Variables B
(SE)
Exp(B) 95% CI Lower 95% CI Upper
Constant
1.544
(.704)
Sex
-.880***
(.231) .415 .264 .652
Age
-.051*
(.021) .950 .911 .991
Extrovert
.053
(.036) 1.054 .982 1.131
R2=.233 (Hosmer & Lemeshow), .050(Cox & Snell), .072 (Nagalkerke). Model 2(3)=24.029, p < .001. *p < .05, ** p < .01, *** p < .001.

41
CHAPTER 4
CONCLUSION
Discussion
This study revealed many interesting findings. First and foremost, the cell phone has
become a part of everyday life for an overwhelming majority of undergraduates: 99 percent of
the sample reported using cell phones. Respondents texted friends more than any other group,
while parents received the most voice calls from respondents. As Ling (2004) pointed out,
texting is often used to plan meetings with friends; consequently, students likely texted friends to
make arrangements. Although the survey did not ask respondents about their living
arrangements, many in the sample may live on campus. Because some students who live on
campus may not see their parents regularly, they may choose to call rather than text their parents.
Hearing the voice of their parents over a call is also more intimate than seeing words on a small
phone screen, giving respondents a closer connection to their parents than a text message.
Distance from a recipient may thus prompt the use of voice calling rather than text messaging; in
essence, those the respondent sees on a regular basis, such as friends, receive more texts, while
those the respondent does not see on a regular basis, receive calls. Around 70 percent of
undergraduates rated wanting to hear the other persons voice as either somewhat important or
very important. Thus, respondents who do not regularly see someone in their close circle most
likely want to call the person rather than text. Nevertheless, future research should examine this
topic in more detail than the present study. Particularly, researchers need to examine how
propinquity may influence the use of texting and voice calling.
The study also highlighted the pragmatic nature of texting. For example, when asked to
rate the importance of various reasons for texting rather than talking, respondents rated “not a

42
good time for the caller to talk” and “not a good time for the recipient to talk” as being
significant reasons for texting. Texting has thus given people a way to overcome limitations of
traditional voice calls. When the caller or recipient cannot engage in a call, he or she can use
texting instead. Respondents also rated keeping the message short as a reason for texting rather
than calling. Thus, if respondents do not wish to engage in a lengthy conversation with someone,
he or she may text to convey a short message without the hassle. Undergraduates also cited the
fact that some messages were better conveyed through text as being important. The study did not
identify which types of messages respondents considered better for texting; however, short
messages, such as those sent to significant others or friends, would be included. Taylor and
Harper (2003) noted that couples often texted each other short messages such as “good night”
and “good morning” rather than call. Nonetheless, future research should explore in more detail
reasons for choosing texting over talking.
Motivations for voice calls also revealed a kind of pragmatism. A majority of respondents
cited that certain communication was better done through calling rather than texting. Again,
this study did not examine the particular types of communications amenable to voice calls.
However, several respondents in the survey answered the open-ended question about motivations
for calling rather than texting. Respondents who answered the question stated that longer
messages are simply better taken care of through a voice call rather than a text message. Some
respondents also pointed out that they cannot tell how the recipient feels during a texting
exchange. Consequently, some respondents may choose to call so they can hear how recipients
handle certain types of information. Moreover, some respondents cited the effort it takes to send
a text as being a reason for voice calling. These types of responses highlighted a pragmatic
motivation for voice calling. However, researchers should explore this area in more depth. As

43
stated previously, distance may play a role in a person’s decision to make a call rather than text.
Time may affect a person’s decision as well. For instance, if a person has not seen a friend or
loved one for a long period of time, he or she may choose to call rather than text, desiring to hear
the voice of the person. Time and distance, although not the only variables, deserve further
examination.
The models predicting texting frequency showed that age appeared to be the strongest
predictor. This finding raises the question as to why age is such a strong predictor for texting
frequency. Lenhart et al. (2010) highlighted the surging popularity of texting for teens. It may be
the case that younger users simply have a comfort level with the technology that older users do
not have. The trend of younger users texting more than older users will most likely change as the
young mature. Texting will most likely continue to be an integral part of their lives. As a
consequence, age may not be a significant predictor in future studies as younger users become
adults and continue their texting behaviors. However, it is possible that texting may disappear as
a medium of communication as new technologies emerge, thus negating any of these
propositions.
Although Lenhart et al. (2010) found that females were more likely to text than males,
this study of undergraduate students did not confirm this finding. In fact, in both models of
texting frequency, sex did not reach significance. However, prior research has mainly focused on
younger teens. When they reach college age, differences in texting may decrease between males
and females. For example, Baron and Ling (2007) did not find significant differences in texting
between male and female students. In fact, their study revealed males text slightly more than
females. Further study needs to be done examining possible differences for males and females of
various ages. The lack of significance for the extroversion variable may be attributable to the use

44
of only a small part of the NEO-FFI scale of extroversion. Nevertheless, in the first two models,
extroverted respondents were more likely to text between 100 and 199 messages versus sending
0 to 99 messages, indicating that extroversion did play some role. A future study should
incorporate the entire extroversion scale of the NEO-FFI. The addition of these questions could
add to the predictive power of this variable. If possible, researchers should also include other
types of personality measures, such as anxiety, into their studies of texting. Although these
questions would add significantly to the length of a questionnaire, their addition would provide
valuable insight into how personality factors affect the use of text messaging.
The preference for texting or talking variable provided interesting results. First, although
sex did not appear to be a powerful predictor of texting frequency, it did have an impact in terms
of preference. In this sample, females were more likely to prefer texting and males more likely to
prefer talking. Why females prefer texting is difficult to discern. It may be that females network
differently and thus choose to text in order to keep up with a large network of friends. It may also
be that females are more proficient than males in using the cell phone for texting. These
suppositions warrant exploration in future studies, although they do not exhaust the possibilities
for reasons why males and females differ in preferences for texting or talking. Age again proved
to be a significant predictor, with older respondents more likely to prefer talking versus texting.
Again, this finding is most likely attributable to the fact that some older respondents do not have
the same proficiency with texting as younger users. However, this trend may change as younger
users become more mature.
This study, along with Baron and Ling (2010), examined the use of the cell phone to
avoid others. Sex proved to be the strongest predictor of using a cell phone to avoid others, with
females being much more likely than males to pretend talking on their phones. As Baron and

45
Ling (2007) pointed out, some women pretend to talk on their phones as a form of protection
while walking alone. Protection thus appears to be a primary reason why females engage in this
behavior. Age was slightly significant as a predictor, with older respondents being less likely to
pretend talking on their cell phones. Again, it may be that younger users have more comfort with
the technology and using it in such fashion, while older users may not think to use it in this way.
Younger users may also be out more in situations where they feel threatened or wish to avoid
someone, while an older user may not encounter these situations. These explanations, however,
are limited, resulting in a need for research into why people, especially women and younger
users, use the cell phone to avoid others.
The low pseudo R2 values for the logistic regression models reveal the need for inclusion
of other variables. Age, sex, and extroversion did not have large effects on the dependent
variables in this sample. Future research should include other variables to add to these models.
For example, a variable or variables that examine a person’s social network may help explain a
great deal of variation in text messaging. A person with many friends may be more likely to send
a lot of texts than someone with a small group. Social networks do not include friends only, but
they may also include contacts from work or other places. For instance, if a person coaches a
little league team, he or she may receive many texts from parents inquiring about games and
practices. Consequently, this person would have to send texts to all the parents. Size and type of
social networks may thus explain a lot of variation in texting frequency. Examining the types of
jobs respondents hold may also be worthwhile. People working at jobs that do not allow them to
be near their phones, such as factory workers, are limited in the amount of texts they can send.
By contrast, a person working at a job with a lot of freedom may have access to their phones and
be able to send a large quantity of texts during their workday. Thus, future researchers may want
46
to incorporate this variable into a future study of texting. To conclude, this study showed the
need for the inclusion of more variables in future models that examine texting frequency,
preferences for texting or talking, and use of the cell phone to avoid others.
Limitations
The use of a convenience sample was a major limitation of the current study.
Consequently, it was not possible to generalize the findings to the general population. Moreover,
respondents sometimes provide untruthful answers to survey questions. Respondents may do this
because they feel embarrassed or for other personal reasons. As a result, some information in this
study may reflect this lack of truthfulness. The study would have been more complete had focus
groups been used in conjunction with questionnaires. Focus groups provide researchers the
opportunity to gain a more in-depth knowledge about subjects than questionnaires alone.
Breaking up groups into various ages and dividing them by sex would have greatly enhanced the
results of this study. Hence, the study would have benefited by using student focus groups. Each
of these deficiencies can be easily corrected by future researchers. Nevertheless, even with these
limitations, the current study adds to the body of literature on cell phone behavior and provides
valuable direction for future research.
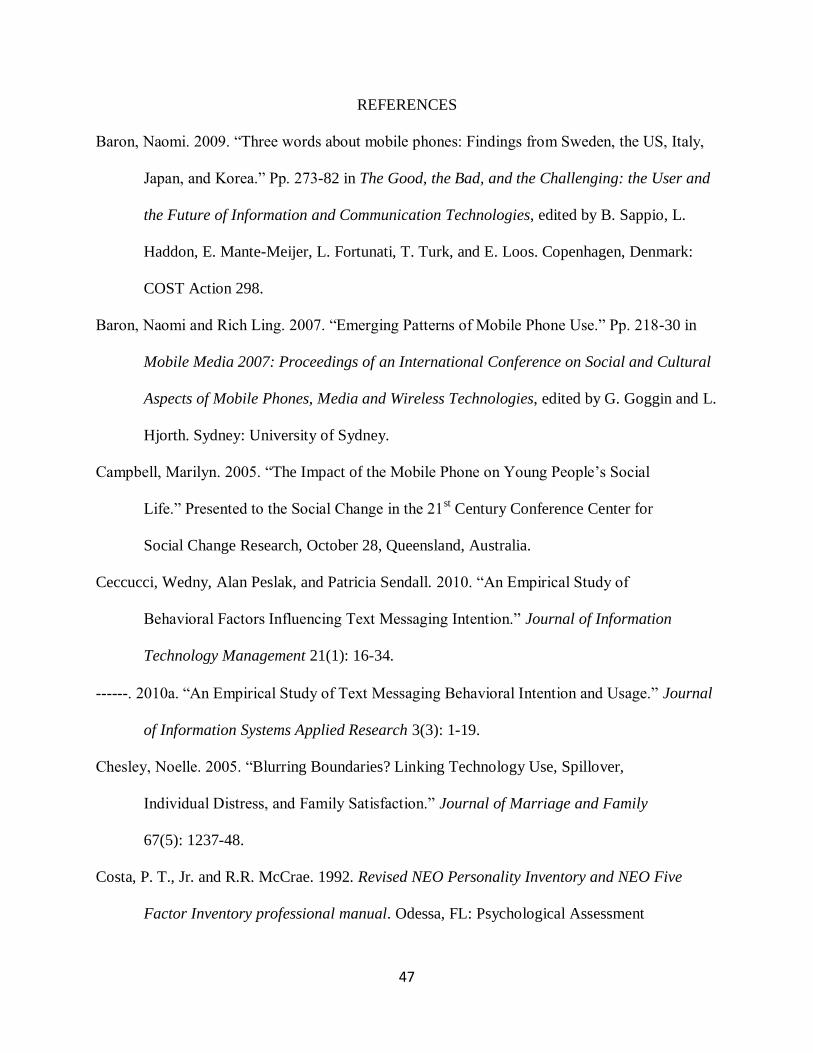
47
REFERENCES
Baron, Naomi. 2009. “Three words about mobile phones: Findings from Sweden, the US, Italy,
Japan, and Korea.” Pp. 273-82 in The Good, the Bad, and the Challenging: the User and
the Future of Information and Communication Technologies, edited by B. Sappio, L.
Haddon, E. Mante-Meijer, L. Fortunati, T. Turk, and E. Loos. Copenhagen, Denmark:
COST Action 298.
Baron, Naomi and Rich Ling. 2007. “Emerging Patterns of Mobile Phone Use.” Pp. 218-30 in
Mobile Media 2007: Proceedings of an International Conference on Social and Cultural
Aspects of Mobile Phones, Media and Wireless Technologies, edited by G. Goggin and L.
Hjorth. Sydney: University of Sydney.
Campbell, Marilyn. 2005. “The Impact of the Mobile Phone on Young People’s Social
Life.” Presented to the Social Change in the 21st Century Conference Center for
Social Change Research, October 28, Queensland, Australia.
Ceccucci, Wedny, Alan Peslak, and Patricia Sendall. 2010. “An Empirical Study of
Behavioral Factors Influencing Text Messaging Intention.” Journal of Information
Technology Management 21(1): 16-34.
------. 2010a. “An Empirical Study of Text Messaging Behavioral Intention and Usage.” Journal
of Information Systems Applied Research 3(3): 1-19.
Chesley, Noelle. 2005. “Blurring Boundaries? Linking Technology Use, Spillover,
Individual Distress, and Family Satisfaction.” Journal of Marriage and Family
67(5): 1237-48.
Costa, P. T., Jr. and R.R. McCrae. 1992. Revised NEO Personality Inventory and NEO Five
Factor Inventory professional manual. Odessa, FL: Psychological Assessment

48
Resources.
Crystal, David. 2008. Txt: the Gr8 Db8. New York: Oxford University Press.
CTIA. 2008. “National Study Reveals How Teens are Shaping and Reshaping Their
Wireless World. Retrieved January 15, 2011
(http://ctia.org/media/press/body.cfm/prid/1774).
Farley, Tom. 2003. “Mobile Telephone History.” Retrieved January 24, 2011
(http://www.privateline.com/PCS/history.htm).
Faulkner, Xristine, and Fintan Culwin. 2005. “When Fingers Do the Talking: a Study of Text
Messaging.” Interacting with Computers 17: 167.85.
Fortunati, Leopoldina. 2002. “Italy: Stereotypes, True and False.” Pp. 42-62 in Perpetual
Contact: Mobile Communication, Private Talk, and Public Performance, edited by James
E. Katz and Mark Aakhus. New York: Cambridge University Press.
Goggin, Gerard. 2006. Cell Phone Culture: Mobile Technology in Everyday Life. New York:
Routledge.
Jin, Borae, and Namkee Park. 2010. “In-Person Contact Begets Calling and Texting:
Interpersonal Motives for Cell Phone Use, Face-to-Face Interaction, and Loneliness.”
Cyberpsychology, Behavior, and Social Networking 13(6): 611-18.
Lacohee, Hazel, Nina Wakeford, and Ian Pearson. 2003. “A Social History of the Mobile
Telephone with a View of Its Future.” BT Technology Journal 21(3): 203-11.
Lenhart, Amanda, Rich Ling, Scott Campbell, and Kristen Purcell. 2010. Teens and Mobile
Phones. Retrieved December 30, 2010 (http://pewinternet.org/Reports/2010/Teens-and-
Mobile-Phones.aspx).
Ling, Rich. 2004. The Mobile Connection: the Cell Phone’s Impact on Society. San Francisco,
49
CA: Morgan Kauffmann Publishers.
Ling, Rich and Naomi Baron. 2007. “Text Messaging and IM: Linguistic Comparison of
American College Data.” Journal of Language and Social Psychology 26: 291-98.
Ling, Rich and Jonathan Donner. 2009. Mobile Communication. Malden, MA: Polity Press.
Lipscomb, Thomas J., Jeff W. Totten, Roy A. Cook, and William C. Lesch. 2007. “Cellular
Phone Etiquette among College Students.” International Journal of Consumer Studies
31(1): 46-56.
Longoria, Arturo, and Gesse Stark-Smith. N.d. “Information Exchange and Relationship
Maintenance among American Youth: the Case of Text Messaging.” University of Texas,
Austin, TX. Unpublished manuscript. Retrieved December 15, 2010
(http://www.ischool.utexas.edu/~alongo/mgmt/i_txt_my_bf_all_the_time.pdf).
Madden, Mary and Amanda Lenhart. 2009. Teens and Distracted Driving. Retrieved February
10, 2011 (http://www.youblisher.com/p/4906-Teens-and-Distracted-Driving/).
Palen, Leysia, Merilyn Salzman, and Ed Youngs. 2000. “Going Wireless: Behavior and Practice
of New Mobile Phone Users.” Pp. 201-10 in Proceedings of the 2000 ACM Conference
on Computer Supported Cooperative Work, edited by Wendy Kellog and Steve
Whittaker. Philadelphia, PA: ACM Press.
Reid, Donna J. and Fraser Reid. 2004. “Insights into the Social and Psychological Effects
of SMS Text Messaging.” Working Paper, University of Plymouth, Plymouth, UK.
------2007. “Text or Talk: Social Anxiety, Loneliness, and Divergent Preferences for Cell Phone
Use.” CyberPsychology & Behavior 10(3): 424-35.
Rettie, Ruth. 2007. “Texters not Talkers: Phone Aversion among Mobile Phone Users.”
Psychology Journal 5(1): 33-57.

50
Short, Emma and Isabella McMurray. 2009. “Mobile Phone Harassment: an Exploration of
Students’ Perceptions of Intrusive Texting Behavior.” Human Technology 5(2): 163-80.
Skog, Berit. 2002. “Mobiles and the Norweigen Teen: Identity, Gender, and Class.” Pp. 255-73
in Perpetual Contact: Mobile Communication, Private Talk, and Public Performance,
edited by James E. Katz and Mark Aakhus. New York: Cambridge University Press.
Srivastava, S. 2011. “Measuring the Big Five Personality Factors.” Retrieved March 24,
2010 (http://www.uoregon.edu/~sanjay/bigfive.html).
Taylor, Alexander S. and Richard Harper. 2003. “The Gift of the Gab?: a Design Oriented
Sociology of Young People’s Use of Mobiles.” Journal of Computer Supported
Cooperative Work 12(3): 267-96.
Varbanov, Valentin. 2002. “Bulgaria: Mobile Phones as Post-Communist Cultural Icons.” Pp.
126-36 in Perpetual Contact: Mobile Communication, Private Talk, and Public
Performance, edited by James E. Katz and Mark Aakhus. New York: Cambridge
University Press.
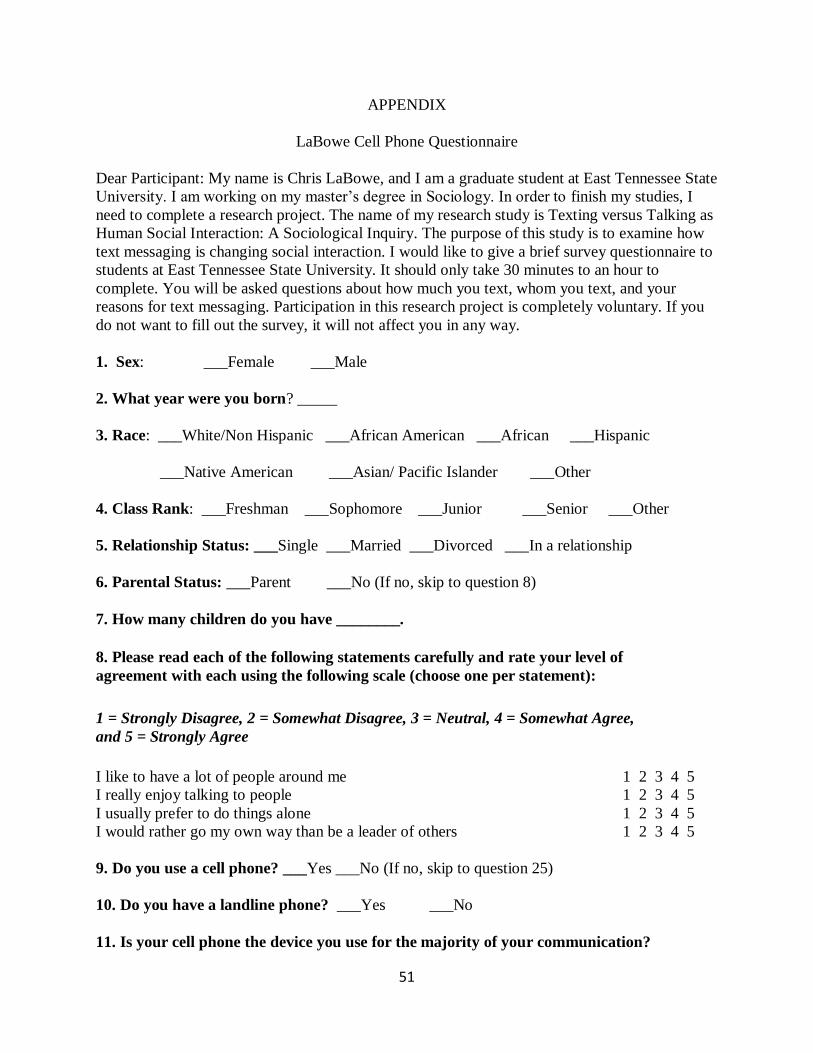
51
APPENDIX
LaBowe Cell Phone Questionnaire
Dear Participant: My name is Chris LaBowe, and I am a graduate student at East Tennessee State
University. I am working on my master’s degree in Sociology. In order to finish my studies, I
need to complete a research project. The name of my research study is Texting versus Talking as
Human Social Interaction: A Sociological Inquiry. The purpose of this study is to examine how
text messaging is changing social interaction. I would like to give a brief survey questionnaire to
students at East Tennessee State University. It should only take 30 minutes to an hour to
complete. You will be asked questions about how much you text, whom you text, and your
reasons for text messaging. Participation in this research project is completely voluntary. If you
do not want to fill out the survey, it will not affect you in any way.
1. Sex: ___Female ___Male
2. What year were you born? _____
3. Race: ___White/Non Hispanic ___African American ___African ___Hispanic
___Native American ___Asian/ Pacific Islander ___Other
4. Class Rank: ___Freshman ___Sophomore ___Junior ___Senior ___Other
5. Relationship Status: ___Single ___Married ___Divorced ___In a relationship
6. Parental Status: ___Parent ___No (If no, skip to question 8)
7. How many children do you have ________.
8. Please read each of the following statements carefully and rate your level of
agreement with each using the following scale (choose one per statement):
1 = Strongly Disagree, 2 = Somewhat Disagree, 3 = Neutral, 4 = Somewhat Agree,
and 5 = Strongly Agree
I like to have a lot of people around me 1 2 3 4 5
I really enjoy talking to people 1 2 3 4 5
I usually prefer to do things alone 1 2 3 4 5
I would rather go my own way than be a leader of others 1 2 3 4 5
9. Do you use a cell phone? ___Yes ___No (If no, skip to question 25)
10. Do you have a landline phone? ___Yes ___No
11. Is your cell phone the device you use for the majority of your communication?
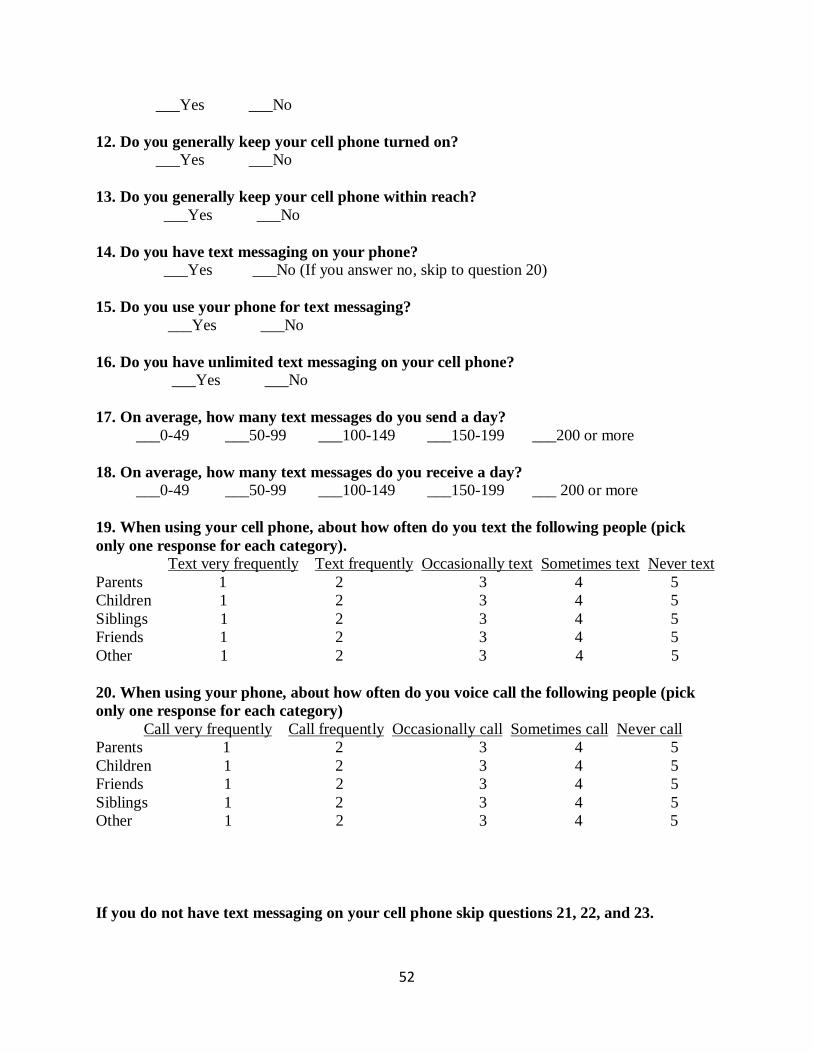
52
___Yes ___No
12. Do you generally keep your cell phone turned on?
___Yes ___No
13. Do you generally keep your cell phone within reach?
___Yes ___No
14. Do you have text messaging on your phone?
___Yes ___No (If you answer no, skip to question 20)
15. Do you use your phone for text messaging?
___Yes ___No
16. Do you have unlimited text messaging on your cell phone?
___Yes ___No
17. On average, how many text messages do you send a day?
___0-49 ___50-99 ___100-149 ___150-199 ___200 or more
18. On average, how many text messages do you receive a day? ___0-49 ___50-99 ___100-149 ___150-199 ___ 200 or more
19. When using your cell phone, about how often do you text the following people (pick
only one response for each category). Text very frequently Text frequently Occasionally text Sometimes text Never text
Parents 1 2 3 4 5
Children 1 2 3 4 5
Siblings 1 2 3 4 5
Friends 1 2 3 4 5
Other 1 2 3 4 5
20. When using your phone, about how often do you voice call the following people (pick
only one response for each category)
Call very frequently Call frequently Occasionally call Sometimes call Never call
Parents 1 2 3 4 5
Children 1 2 3 4 5
Friends 1 2 3 4 5
Siblings 1 2 3 4 5
Other 1 2 3 4 5
If you do not have text messaging on your cell phone skip questions 21, 22, and 23.

53
21. Overall, do you prefer text messaging to voice calls?
___Yes, I prefer texting ___No, I prefer voice calls ___I like both equally
___It depends on what I want to do
22. When you decide to send a text message to a friend on your cell phone, how important
(in general) are the following reasons for sending a text message rather than calling?
It’s not a good time for me to talk.
___ very important ___ somewhat important ___ not very important ___not important at all
It’s not a good time for the recipient to talk.
___ very important ___ somewhat important ___ not very important ___not important at all
I want to make my message short, and talking takes too long.
___ very important ___ somewhat important ___ not very important ___not important at all
Some communication is better done by sending a text message rather than talking.
___ very important ___ somewhat important ___ not very important ___not important at all
Sending a text message is cheaper.
___ very important ___ somewhat important ___ not very important ___not important at all
I want to keep some distance from the person I’m communicating with.
___ very important ___ somewhat important ___ not very important ___not important at all
23. When you decide to call a friend on your cell phone, how important (in general) are the
following reasons for calling rather than sending a text message?
Sending a text message takes too much effort.
___ very important ___ somewhat important ___ not very important ___not important at all
Some communication is better done by talking rather than sending a text message.
___ very important ___ somewhat important ___ not very important ___not important at all
Some of the people I want to contact don’t do texting.
___ very important ___ somewhat important ___ not very important ___not important at all
I want to hear the voice of the person I’m communicating with.
___ very important ___ somewhat important ___ not very important ___not important at all
Other (please write another reason you may choose to call a friend rather than text).
______________________________________________________________________________
______________________________________________________________________________
______________________________________________________________________________
______________________________________________________________________________
54
24. Have you ever pretended to talk on your cell phone to avoid someone?
___Yes ___No
25. If you do not use a cell phone at all, please briefly explain the reasons why.
______________________________________________________________________________
______________________________________________________________________________
______________________________________________________________________________
______________________________________________________________________________
______________________________________________________________________________
Thank you very much for taking the time to complete this survey.
55
VITA
CHRIS LABOWE
Personal Data: Date of Birth: June 15, 1982
Place of Birth: Prince George’s County, Maryland
Marital Status: Single
Education: Sullivan North High School, Kingsport, Tennessee 2000
B.A. History, East Tennessee State University, Johnson
City, Tennessee 2004, summa cum laude
M.A. Sociology, East Tennessee State University, Johnson
City, Tennessee 2011
Professional Experience Graduate Assistant, East Tennessee State University, Department
of Sociology and Anthropology, 2009-10
Lecturer, East Tennessee State University, Department of
Sociology and Anthropology, 2010-11.