texas timber price trends may/june 2020 · 2020. 8. 12. · texas timber price trends is a...
TRANSCRIPT

According to the latest statistics reported by
the US Census Bureau, privately-owned hous-
ing starts in June were at a seasonally adjust-
ed annual rate of 1,241,000 which is 2.1%
above the May rate of 1,216,000. Single-family
housing starts in June were at a rate of
834,000 which is 11.8% above the May figure
of 746,000. As the COVID-19 pandemic con-
tinues, many industries have been impacted.
Decreasing timber prices are likely the result of
the oversupply of timber dating back to the
Great Recession, slack demand, and market
uncertainty related to the pandemic.
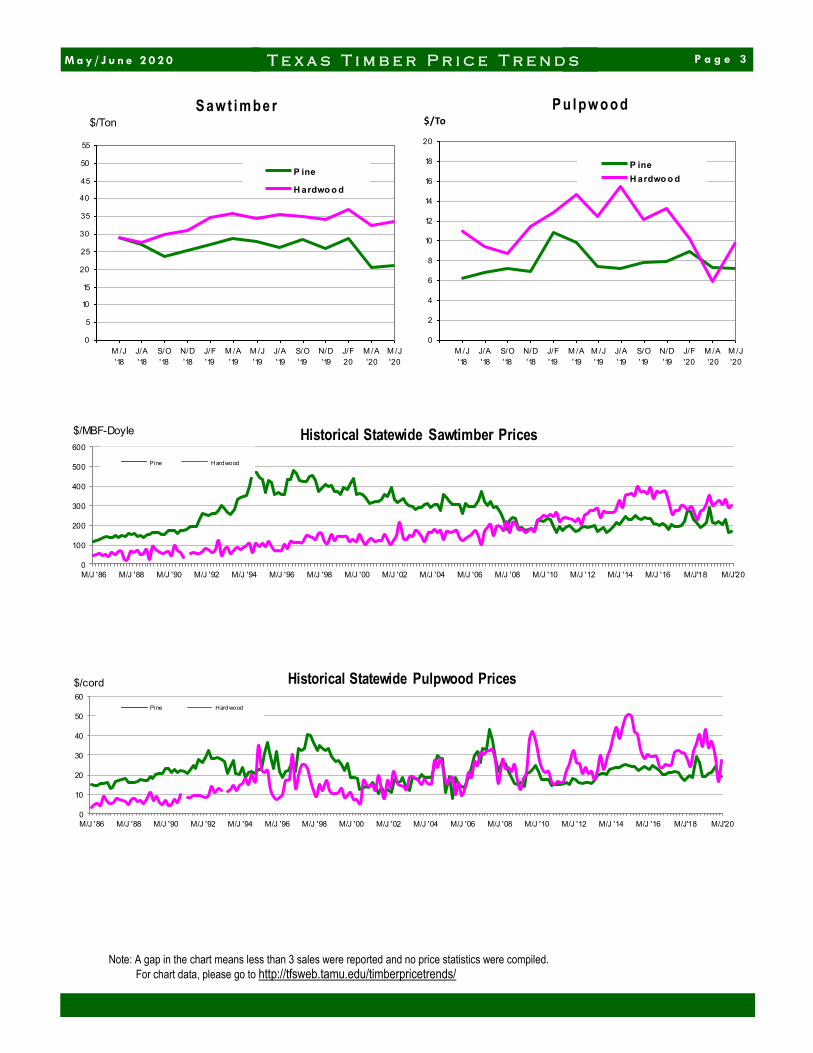
Statewide pine sawtimber prices averaged
$21.01 per ton, up 2% from last period and
down 24% from a year ago. Average pine saw-
timber price was $20.53 per ton in Northeast
Texas and $24.14 per ton in Southeast Texas.
The statewide average pine pulpwood price
was $7.17 per ton. This was down 2% from
last period and down 3% from the price a year
ago. In Northeast Texas, the average pine
pulpwood price was $6.64 per ton. It was
$7.91 per ton in Southeast Texas.
Chip-N-Saw averaged $11.75 per ton
statewide, down 2% from last period. It was
down 19% from the price a year ago.
The statewide average mixed hardwood saw-
timber price was $33.28 per ton, up 3% from
last period and down 3% from the price a year
ago.
The statewide average hardwood pulpwood
price was $9.81 per ton, up 67% from last peri-
od and down 21% from the price a year ago.
*The average prices reported here represent
statewide volumes reported for 48,571 tons of
pine sawtimber, 57,731 tons of pine pulpwood,
9,545 tons of pine Chip-N-Saw, 404 tons of mixed
hardwood sawtimber, and 1,941 tons of hardwood
pulpwood during May/June 2020.
M a r k e t O ve r v i e w *
A Bimonthly Market Report
Texas Timber Price Trends

T e x a s T i m b e r P r i c e T r e n d s P a g e 2
Product /Region Average Price Last Period Year Ago Report
PINE
Sawtimber $/Ton $/MBF $/Ton $/MBF Chg $/Ton $/MBF Chg Number
Northeast TX
$20.53 $164.24 $20.37 $162.98 1% ↑ $27.85 $219.18 -26% ↓ 58
Southeast TX
$24.14 $193.12 $22.77 $182.15 6% ↑ $27.12 $196.93 -11% ↓ 16
Statewide
$21.01 $168.04 $20.51 $164.09 2% ↑ $27.67 $213.25 -24% ↓ 74
Pulpwood $/Ton $/Cord $/Ton $/Cord Chg $/Ton $/Cord Chg Number
Northeast TX $6.64 $17.93 $6.02 $16.24 10% ↑ $7.35 $19.33 -10% ↓ 31
Southeast TX $7.91 $21.37 $8.26 $22.29 -4% ↓ $7.66 $20.68 3% ↑ 20
Statewide $7.17 $19.35 $7.30 $19.70 -2% ↓ $7.37 $19.40 -3% ↓ 51
Chip-N-Saw $/Ton $/Cord $/Ton $/Cord Chg $/Ton $/Cord Chg Number
Northeast TX $12.80 $34.55 $12.00 $32.40 7% ↑ $15.11 $40.80 -15% ↓ 12
Southeast TX $11.27 $30.43 ** ** $14.45 $39.01 -22% ↓ 4
Statewide $11.75 $31.73 $12.00 $32.40 -2% ↓ $14.49 $39.12 -19% ↓ 16
HARDWOOD
Mixed Sawtimber $/Ton $/MBF $/Ton $/MBF Chg $/Ton $/MBF Chg Number
Northeast TX $33.28 $299.49 $32.22 $290.00 3% ↑ $35.51 $337.27 -6% ↓ 3
Southeast TX ** ** ** ** $32.89 $272.17 **
Statewide $33.28 $299.49 $32.22 $290.00 3% ↑ $34.17 $301.86 -3% ↓ 3
Pulpwood $/Ton $/Cord $/Ton $/Cord Chg $/Ton $/Cord Chg Number
Northeast TX $9.81 $27.46 $5.87 $16.45 67% ↑ $15.68 $43.90 -37% ↓ 3
Southeast TX ** ** ** ** $9.77 $27.34 **
Statewide $9.81 $27.46 $5.87 $16.45 67% ↑ $12.38 $34.68 -21% ↓ 3
S tu mp ag e P r i c e s i n Te x a s
M a y / J u n e 2 0 2 0
1. Stumpage price statistics include gatewood sales. Stumpage prices for gatewood sales are estimated by subtracting cut-and-haul costs, other expens-
es, and profits provided by reporter.
2. Price is calculated from a specific conversion factor reported for each sale if available; otherwise, the average conversion factors listed on page 4 are
used. MBF = Thousand Board Feet. The DOYLE LOG SCALE is used for board foot measurements.
3. ** indicates insufficient sales to report price statistics (less than three sales).
4. Prices listed for previous periods may differ from previously published values because additional data were received.
5. Price changes are calculated based on price per ton.
6. Extreme outliers from reported data are detected and removed using statistical methods.
P a g e 3 T e x a s T i m b e r P r i c e T r e n d s M a y / J u n e 2 0 2 0
S aw t i m be r P u l pw o o d
Note: A gap in the chart means less than 3 sales were reported and no price statistics were compiled.
For chart data, please go to http://tfsweb.tamu.edu/timberpricetrends/
0
100
200
300
400
500
600
M/J '86 M/J '88 M/J '90 M/J '92 M/J '94 M/J '96 M/J '98 M/J '00 M/J '02 M/J '04 M/J '06 M/J '08 M/J '10 M/J '12 M/J '14 M/J '16 M/J'18 M/J'20
$/MBF-Doyle Historical Statewide Sawtimber Prices
Pine Hardwood
0
10
20
30
40
50
60
M/J '86 M/J '88 M/J '90 M/J '92 M/J '94 M/J '96 M/J '98 M/J '00 M/J '02 M/J '04 M/J '06 M/J '08 M/J '10 M/J '12 M/J '14 M/J '16 M/J'18 M/J'20
$/cord Historical Statewide Pulpwood Prices
Pine Hardwood
0
2
4
6
8
10
12
14
16
18
20
M /J
'18
J/A
'18
S/O
'18
N/D
'18
J/F
'19
M /A
'19
M /J
'19
J/A
'19
S/O
'19
N/D
'19
J/F
'20
M /A
'20
M /J
'20
P ine
H ardwo o d
$/Ton
$/To
0
5
10
15
20
25
30
35
40
45
50
55
M /J
'18
J/A
'18
S/O
'18
N/D
'18
J/F
'19
M /A
'19
M /J
'19
J/A
'19
S/O
'19
N/D
'19
J/F
20
M /A
'20
M /J
'20
P ine
H ardwo o d
$/Ton
P a g e 4
Texas Timber Price Trends is a bi-
monthly publication reporting average
prices paid for standing timber and gate-
wood in Texas. This report is intended
only as a guide to general price levels.
Individuals interested in buying and selling timber can use this
report to monitor market trends and get a general idea of what
timber is worth. However, it should not be used to judge the fair
market value of a specific timber sale, which may vary
considerably due to many factors.
HOW ARE AVERAGE PRICES CALCULATED?
Data published in this report are from actual timber sales as
reported by as many as 60 cooperators active in the East Texas
timber market. Reporters include forest product companies,
logging contractors, consulting foresters, family forest landowners,
and financial institutions.
The prices are volume weighted average prices. The price
per ton for each product category is as reported or using a specific
conversion factor provided by the reporters. When a specific
conversion factor for each sale is not available, an average
conversion factor listed here is used instead.
T e x a s T i m b e r P r i c e T r e n d s M a y / J u n e 2 0 2 0
VOLUME CONVERSION FACTORS Sawtimber & Chip-N-Saw Pine— 8 tons=1 MBF-Doyle Pine Chip-N-Saw— 2.7 tons= 1 Cord Hardwood— 9 tons= 1 MBF-Doyle
Pulpwood Pine— 2.7 tons=1 Cord Hardwood— 2.8 tons= 1 Cord
This publication is also available on the Texas A&M Forest
Service website at: http://tfsweb.tamu.edu/timberpricetrends/
WANT TO BE A REPORTER?
If you are active in the East Texas timber market, please
consider becoming a cooperating price reporter. You will receive
report forms bi-monthly with a self-return envelope. In addition, you
will receive a hard copy of the report in exchange for your price
information.