texas department of transportation - welcome to ctisctis.utep.edu/reports/0-4046-1.pdf · july 2002...
TRANSCRIPT

Optimizing Construction Quality Management of Pavements Using
Mechanistic Performance Analysis
Conducted for
Texas Department of Transportation
Research Report 4046-1 July 2002
Center for Highway Materials Research
The University of Texas at El Paso El Paso, TX 79968
(915) 747-6925

Optimizing Construction Quality Management of Pavements Using
Mechanistic Performance Analysis
by
Imad Abdallah, MSCE Hao Yin, BSCE
Soheil Nazarian, PD, PE and
Carlos Ferregut, PhD Research Project TX-0-4046
Impacts of Construction Quality on Life-Cycle Performance of Pavements Using Mechanistic Analysis
Conducted for
Texas Department of Transportation
The Center for Highway Materials Research
The University of Texas at El Paso El Paso, TX 79968-0516
Research Report 4046-1 July 2002

TECHNICAL REPORT STANDARD TITLE PAGE 1. Report No. TX-02 4046-1
2. Government Accession No.
3. Recipient's Catalog No.
5. Report Date July 2002
4. Title and Subtitle Optimizing Construction Quality Management of Pavements Using Probabilistic Life-Cycle Performance Analysis Impacts of Construction Quality on Life-Cycle Performance of Pavements Using Mechanistic Analysis
6. Performing Organization Code
7. Author(s) Abdallah, I., Yin, H., Nazarian, S., Ferregut, C.
8. Performing Organization Report No. Research Report TX-4046-1
10. Work Unit No.
9. Performing Organization Name and Address
Center for Highway Materials Research The University of Texas at El Paso El Paso, Texas 79968-0516
11. Contract or Grant No. Study No. 0-4046
13. Type of Report and Period Covered Interim Report (Sept. 2000 –July 2002)
12. Sponsoring Agency Name and Address
Texas Department of Transportation P.O. Box 5051 Austin, Texas 7876
14. Sponsoring Agency Code 15. Supplementary Notes Research Performed in Cooperation with TxDOT and FHWA 16. Abstract The goal in any highway construction project is to produce durable rigid or flexible pavements that will perform satisfactorily throughout their expected design lives. The consensus amongst transportation agencies is that cost incentive/disincentive should be a part of the process to implement an effective performance-based construction quality management program. To properly account for the pay factors, relevant construction processes and parameters that directly impact the life cycle performance and the overall remaining life of a pavement should be identified and quantified. A protocol and software to prioritize project-specific parameters that should be used in the construction quality management are described in this report. The algorithm, reconciles in a rational manner the results from realistic pavement-performance models used in the state of practice, with systematic s tatistical process control techniques and uncertainty analysis methods. The algorithm also carefully considers the fact that relevant construction processes and parameters are different for different types of pavements (rigid vs. flexible) and for different pavement cross-sections. 17. Key Words Pavement Performance, Flexible, Rigid, Quality Control, Mechanistic
18. Distribution Statement No restrictions. This document is available to the public through the National Technical Information Service, 5285 Port Royal Road, Springfield, Virginia 22161
19. Security Classif. (of this report) Unclassified
20. Security Classif. (of this page) Unclassified
21. No. of Pages 78
22. Price

The contents of this report reflect the view of the authors, who are responsible for the facts and the accuracy of the data presented herein. The contents do not necessarily reflect the official views or policies of the Texas Department of Transportation or the Federal Highway Administration. This report does not constitute a standard, specification, or regulation.
NOT INTENDED FOR CONSTRUCTION, BIDDING, OR PERMIT PURPOSES Imad Abdallah, MSCE Hao Yin, BSCE Soheil Nazarian, PhD, PE (69263) Carlos Ferregut, PhD

iii
Acknowledgements The successful progress of this project could not have happened without the help and input of many personnel of TxDOT. The authors acknowledge Mr. Steve Smith, Project Director, and Mr. Lauren Garduño, Project Coordinator of this study. Mr. Jim Hunt, and Dr. Magdy Mikhail provided numerous valuable suggestions to improve this project.

iv

v
Abstract The goal in any highway construction project is to produce durable rigid or flexible pavements that will perform satisfactorily throughout their expected design lives. The consensus amongst transportation agencies is that cost incentive/disincentive should be a part of the process to implement an effective performance-based construction quality management program. To properly account for the pay factors, relevant construction processes and parameters that directly impact the life cycle performance and the overall remaining life of a pavement should be identified and quantified. A protocol and software to prioritize project-specific parameters that should be used in the construction quality management are described in this report. The algorithm, reconciles in a rational manner the results from realistic pavement-performance models used in the state of practice, with systematic statistical process control techniques and uncertainty analys is methods. The algorithm also carefully considers the fact that relevant construction processes and parameters are different for different types of pavements (rigid vs. flexible) and for different pavement cross-sections.

vi

vii
Implementation Statement The software developed is ready for limited implementation. However, further calibration is necessary. We recommend that TxDOT personnel knowledgeable in design, material testing and construction quality management to utilize this program for evaluation purposes, and for providing recommendations for future improvements. We also recommend training courses for a few members of the districts to determine the ease of use and to recommend means to make it more practical for their use.

viii

xi
Table of Contents Chapter 1 - Introduction.................................................................................................................. 1
Objective ..................................................................................................................................... 2 Organization................................................................................................................................ 2
Chapter 2 - Background .................................................................................................................. 3
Flexible Pavements ..................................................................................................................... 6 Rigid Pavements ....................................................................................................................... 12 AASHTO Design Models ......................................................................................................... 15
Chapter 3 - Development of Methodology ................................................................................... 18
Algorithms ................................................................................................................................ 20 Flexible Pavement Algorithm................................................................................................ 20 Rigid Pavement Algorithm.................................................................................................... 29 AASHTO Pavement Algorithms............................................................................................ 30
Chapter 4 - Description of Software ............................................................................................. 34
Sample Case .............................................................................................................................. 35 Chapter 5 - Typical Sensitivity Analyses...................................................................................... 42
Flexible Pavements ................................................................................................................... 42 Rigid Pavements ....................................................................................................................... 55
Chapter 6 - Closure ....................................................................................................................... 60
Summary................................................................................................................................... 60 Recommendations ..................................................................................................................... 61
References ..................................................................................................................................... 62

xii
List of Figures Figure 2.1 – Variation in Layer Coefficient with Modulus for Dense-Graded Asphalt Concrete .............................................................................. 16 Figure 3.1 – Conceptual Framework Developed for this Project ................................................. 19 Figure 3.2 – Flow chart of Mechanistic Algorithm ...................................................................... 21 Figure 3.3 – Comparison of Deterministic and Probabilistic Analyses ........................................ 23 Figure 3.4 – Illustration of an Impact Chart ................................................................................. 25 Figure 3.5 – Impact of Sample Size Used in Monte Carlo Simulation on Final Distribution of a Variable ........................................................ 26 Figure 3.6 – Repeatability of Monte Carlo Simulation for Four Sample Sizes ............................ 27 Figure 3.7 – Illustration of Two Point Mass Method.................................................................... 28 Figure 3.8 – Algorithm for Continuously Reinforced Concrete Pavements................................. 31 Figure 3.9 – Algorithm Modification for AASHTO Flexible Pavement Model .......................... 32 Figure 3.10 – Algorithm Modification for the AASHTO Rigid Model ....................................... 33 Figure 4.1 – Snapshots of Input Parameters for Software ............................................................ 36 Figure 4.2 – Two Alternative Approaches for Determining Important Parameters ..................... 38 Figure 4.3 – Two Processes of Determining Significant Parameters Using Impact Charts ......... 41 Figure 5.1 – Sensitivity Analyses Results of the Design Parameters for Four Flexible Pavement Sections ......................................... 45 Figure 5.2 – Sensitivity Analyses Results of Thin-Thin Pavement Sections ............................... 47 Figure 5.3 – Sensitivity Analyses Results of Thin-Thick Pavement Sections .............................. 48 Figure 5.4 – Sensitivity Analyses Results of Thick-Thin Pavement Sections .............................. 49 Figure 5.5 – Sensitivity Analyses Results of Thick-Thick Pavement Sections ............................ 50 Figure 5.6 – Sensitivity Analysis Results of Rigid Pavement Based on CRCP-8........................ 57 Figure 5.7 – Sensitivity Analysis Results of Rigid Pavement (AASHTO Equation) ................... 59

xiii
List of Tables Table 2.1 - Fatigue Cracking Model and Rutting Model Parameters Used to etermine Remaining Life of a Flexible Pavement (from Huang, 1993).......... 7 Table 2.2 – Summary of Material Models (Thompson et al., 1998) ............................................ 10 Table 2.3 - Parameters Affecting Modulus of Granular Base and Subgrade After Hardin and Drnevich, 1972).............................................................. 11 Table 4.1 - Parameters Used in Sample Case Demonstration ...................................................... 37 Table 4.2 – Results of Impact Analysis ........................................................................................ 37 Table 4.2 – Results of Impact Analysis ........................................................................................ 38 Table 4.3 – Results of Impact Analysis after Modification to COV of Selected Construction Parameters................................................................. 40 Table 5.2 – Construction Parameters Values Used in Flexible Pavement Case Study................. 44 Table 5.3 - Impact of Construction Parameters for Flexible Pavement on Fatigue Cracking ...... 51 Table 5.4 - Impact of Construction Parameters for Flexible Pavement on Subgrade Rutting...... 52 Table 5.5 - Impact of Construction Parameters for Flexible Pavement on AC Rutting ............... 53 Table 5.6 - Impact of Construction Parameters for Flexible Pavement on AASHTO Failure Criteria ........................................................................................... 54 Table 5.7 - Construction Parameters Values Used in Rigid Pavement Case Study ..................... 56 Table 5.8 - Impact of Construction Parameter for Rigid Pavement Based on CRCP-8 ............... 58

xiv

1
CHAPTER 1 INTRODUCTION The goal in any highway construction project is to produce durable rigid or flexible pavements that can perform satisfactorily throughout their expected design lives. To realize this goal, a well-calibrated design algorithm that can accurately predict the life-cycle performance is necessary. In practicality, the quality of construction also plays a significant role in the actual performance of the pavement. In this context, the quality of construction is defined as meeting a structural-related target variable with minimal variance. Experienced-based laboratory tests are necessary to ensure durability of a pavement’s layers. Material selection and construction techniques are fine-tuned to provide a durable product. Quality assurance programs are geared towards ensuring the durability of the final product. The concept of pavements that perform satisfactorily throughout their design life is often discussed, but, to date, it has only been implemented on a limited level and, for the most part, in a primitive fashion. The consensus among transportation agencies is that cost incentive/disincentive should be a part of the process to implement an effective performance-based construction quality management program. To properly account for the pay factors, relevant parameters that directly impact the remaining life should be identified and quantified. This process should carefully cons ider the fact that relevant parameters are obviously different for different types of pavements (rigid vs. flexible). What is not so obvious is that for the same type of pavement, the relevant parameters change with the relative structure of the pavement. As demonstrated in this report, many parameters that are important for a thick pavement designed for an interstate highway may be of secondary significance to a secondary road. Simply put, defining one set of parameters that can be used in all projects is not appropriate because it may not be cost effective. As such, we are developing a method based on statistical techniques, which for a given project, will guide TxDOT personnel to determine what parameters would significantly impact the performance, what parameters will moderately impact and those that are of small importance.

2
Objective This research study is based on three objectives. The first objective is the development of rational algorithms. These algorithms reconcile the results from several pavement-performance models used in the state of practice with systematic statistical process control techniques and uncertainty analysis methods to determine project-specific parameters that should be the focus of the construction quality management. Second objective is to propose field tests that can be used to measure parameters identified in a cost-effective manner. Finally, the development of protocols to validate the algorithms and processes developed during this project. In this report the efforts and work carried out to accomplish the first of the three objectives is presented. This work includes the following tasks: a) investigate existing techniques and current software packages that relate construction quality to
pavement performance, b) develop algorithms using statistical tools to identify the impact of construction parameters on
performance of flexible and rigid pavements commonly built in Texas, and c) based on the algorithms determine the importance of parameters using a sensitivity analysis. The level of acceptable deviations from the target design value for each parameter has been established based on quantification of the variability of the construction parameters introduced by: (a) the construction processes, (b) the material properties, (c) the models used to predict pavement performance and those used for data analysis, and (d) the resolution of the devices used in the field for quality control. Organization Chapter 2 of this report introduces information on existing methods, presents an overview of performance-based methodologies and provides a background on some of the tools used in this project. In chapter 3, the methodology produced for this project is presented in detail. Chapter 4 contains a description of the software and a sample case study to demonstrate the use of methodology being developed in this project. Typical sensitivity analyses results on several typical pavement sections are included in Chapter 5. Chapter 6, the last chapter includes the summary of the work accomplished, the work remaining and the status of the project.

3
CHAPTER 2 BACKGROUND Pavements are designed and built to withstand a specified number of traffic loads. If however, the pavement is not constructed to certain specifications it may fail prematurely. As a result of such a premature failure, the pavement has to be rehabilitated or maintained earlier than expected. This in turn leads to cost reallocation for early maintenance and upkeep that can otherwise be used more effectively. One solution that addresses this problem is performance-based specifications where it can be use to verify compliance, without stating methods for achieving the required results. Performance-based specifications will allow the as-built pavement service life to be estimated. Until such specifications are developed, several alternatives utilizing existing design procedures can be explored. Aside from traffic and environmental loading, the primary parameters that affect the performance of a pavement section are the modulus, strength and thickness of each layer. Current mechanistic-empirical procedures for structural design of pavements consider these parameters. To successfully implement any mechanistic pavement design procedure and to move toward performance-based specifications, it is essential to develop tools that can measure parameters such as the modulus, strength and thickness of each layer. Furthermore, the results should be in a manner that can be readily shared by the design engineer, laboratory personnel and the construction engineer. Based on this discussion, the goal of performance-based quality management is to ensure that the modulus, strength and thickness of the pavement throughout the project are similar to the specified design values with a small variation. To achieve this goal, the development of the following elements should be considered: 1. Mechanistic or mechanistic-empirical models that predict performance of pavements. 2. Accurate and precise laboratory and field tests that can directly measure the parameters
input into the above performance model. 3. Realistic relationship between the performance determined from Item 1 and the pay
factor1.
1 Task 3 is outside the scope of this project.

4
The random lack of uniformity (variance), which is related to the condition of the equipment and the experience of the crew, is normally difficult to observe during construction and can only be determined after the completion of a given section. These types of problems, which typically manifest as variability in the thickness, strength and modulus, are only discovered during the quality control phase. The existence of a statistical construction process control plan for QA/QC helps in the understanding of how variability of the parameters is affected by every aspect of the construction process and helps to take steps to reduce such variability proactively. However, this variability is never eliminated and should be accounted for in the determination of performance-based QA/QC specifications. Aside from the random variations, other construction-related parameters impact the performance of the pavement. These parameters, such as joint density and segregation, cannot be accounted for in a deterministic design process. As such, these problems should be minimized or eliminated during construction. The discrete lack of uniformity is a problem with well-understood reasons for their occurrences at a job site. These types of problems can be readily minimized with some effort from the contractor and the inspector. Highway agencies require appropriate equipment, test protocols and analytical algorithms to identify the extent of this type of lack of uniformity in the construction, and to determine the consequences on the performance of the pavement. Other construction parameters that significantly impact the performance of the pavement also exists, but they are either not considered or are not quantified in mechanistic models. These parameters are not and cannot be considered in algorithms like ours. They simply have to be accounted for by emphasizing to the inspector the significance of them, and by providing guidelines to her/him about unacceptable practices in those areas. As indicated before, the primary goal of this project is to provide a concept that, in a rational manner, combines the results from laboratory and field tests performed for quality control during construction to address the impact of variability on the performance of the pavement. Six general topics are considered in this endeavor. These topics include: 1. identify models that predict performance of pavements, 2. identify primary design parameters of the above models, 3. identify parameters that can be controlled during construction that impact the primary design
parameters, 4. determine the feasibility of measuring these parameters in the field, 5. establish means to quantify variability of the construction parameters and its sources, and 6. develop a methodology to assess how variability of the construction parameters affects the
predicted life cycle performance of the pavement.
TxDOT, amongst other highway agencies, has adopted statistic-based quality assurance/quality control (QA/QC) techniques to improve the quality of roadways. The goal with this approach is to minimize the variability in material properties that impact the performance of the pavement. This will promote a pavement that will uniformly develop distress. Even though such uniformity is desirable, the threshold for acceptable level for different parameters should be carefully selected to ensure a performance period compatible with the expected life of the pavement.

5
Several major studies have been carried out in relating quality of constructed materials to the pavement performance. Smith and Vlatas (1989) discuss the cost-effective means of procuring highway pavements that will provide satisfactory service over their design life using life-cycle performance specifications. Weed has published several papers related to performance-related specifications. Weed (1998) describes a conceptual method that utilizes the AASHTO 1993 design procedure with the statistical-based quality control to predict the as-built life of the pavement and to tie to it a value using engineering economy principles. Weed (1999a) discusses the use of existing analytical models and survey data to link construction quality to expected life and eventually a pay schedule. Weed (1999b) lays the groundwork for the development of a practical construction acceptance procedures linked closely to quantified performance models. Patel and Thompson (1998) also provide a comprehensive probabilistic-based method for estimating the as-built performance of a pavement using statistical-based quality control. Unlike Weed (1998), they used a calibrated mechanistic-empirical model developed for the Illinois Department of Transportation. Hoerner and Darter. (2000) developed a prototype performance-related specifications (PRS) program (PaveSpec 3.0) for jointed concrete pavement construction. This tool requires the measurement of quality characteristics to estimate future performance and life-cycle costs based on four distress indicators: transverse slab cracking, transverse joint faulting, transverse joint spalling and pavement smoothness over time. The program has a default model for each of the distress indicators that can be calibrated for a specific project. This program uses four main quality characteristics: concrete strength, slab thickness, air content and initial smoothness that are specified in terms of a mean and standard deviation for each of the variables and simulate several cases using the Monte Carlo approach to calculate performance using prediction models and then apply cost models to determine pay factors. Although this program is a prototype, it is available for use for jointed concrete pavements. Since TxDOT uses jointed concrete pavements on a limited basis, and since PaveSpec is available, upon consultation with the project management committee (PMC) of this project, further development of our software for this type of pavement was discontinued. Another prototype for performance-related specifications, named HMASpec (Scholz and Seeds, 2001), was developed under the WesTrack project. HMA Spec is designed to generate performance-related specifications (PRS) for hot-mix asphalt (HMA) pavements. This program utilizes a Monte Carlo simulation process to develop specifications to predict the life-cycle costs of as-designed and as-constructed pavement lots. The prediction of pavement performance (in the form of distress types) is used to develop maintenance and rehabilitation decision trees. Default performance models for predicting the magnitude of rut depth and the percentage of fatigue cracking are based on parameters such as air void content, asphalt content, percentage of aggregate passing the No. 200 sieve and traffic loading. In addition user-defined pavement performance prediction models and maintenance and rehabilitation decision trees can be incorporated.

6
A mechanistic-empirical design system called PCASE has been developed by the Army Corps of Engineers (Joint Departments of the Army and Air Force, 1994). The program PCASE is a comprehensive package for design, evaluation and rehabilitation of rigid, flexible and unpaved roads and runways. The unique feature of PCASE is that the reduction, interpretation, and analysis of a large number of destructive and nondestructive test methods are already incorporated into the software and is interfaced with the performance models. The structural models, employed in design and analysis, is the program WESLEA (Van Cauwelaert et al., 1989), which are based on conventional and layered elastic methodologies. Dossey et al. (1996) also presented a methodology for estimating the remaining life of a continuously reinforced concrete pavement (CRCP). The methodology developed is incorporated into a computer program (PAVLIF) that requires inputs such as pavement thickness, crack spacing data, swelling condition, coarse aggregate type, concrete flexural strength and traffic data. A program has also been developed under LTPP (long term pavement performance) to implement AASHTO Guide for design of pavement structures (LTPP, 1998). This software allows engineers to tailor the rigid pavement design to the site-specific conditions, materials, nature of traffic and design details. Since one of the goals of this project is to develop a software package that relates the quality of construction to pavement performance, it is necessary to investigate different types of material models and mechanistic-based remaining life models that are commonly used. The pavement performance models, material models and construction parameters are discussed separately for flexible and rigid pavements Flexible Pavements The initial intention was to use the failure models incorporated in the AASHTO 2002 pavement design guide in our algorithm. Unfortunately, these models were not readily available and were not finalized at the time the development of the algorithm for this project was initiated. However, the developed software is adequately modular so that when the AASHTO 2002 models become available, they can be reasonably easily incorporated in the algorithm. The performance indicators selected for flexible pavements were fatigue cracking, rutting of subgrade and rutting of AC layer. The general form of the three failure models are described in Huang (1993). For fatigue cracking 32 )()( 11
fftf EfN −−= ε (2.1)
and for the subgrade rutting 5)(4
fcd fN −= ε (2.2)
where Nf and Nd are the allowable number of load repetitions to prevent fatigue cracking and rutting respectively, ε t is the tensile strain at the bottom of asphalt-concrete layer, E1 is the elastic

7
modulus of asphalt-concrete layer (in psi), εc is the compressive strain at the top of subgrade. Table 2.1 contains suggested values recommended by a number of institutions that can be substituted for parameters f1 through f5 of the equations. The so-called Asphalt Institute (AI) models were incorporated in this project. The rutting model adapted by the Asphalt Institute is based on the assumption that the rutting occurs in the subgrade layer. Based on many observations, this may not be the primary mode of rutting in Texas. Finn et al recommended a set of equations for predicting the rutting in the AC layer. For conventional construction with hot-mix-asphalt (HMA) less than 6 in. in thickness cNwRR σlog118.1)log(167.0log343.4617.5log 180 −−+−= (2.3) for full-depth asphalt with HMA equal to or greater than 6 in. in thickness cNwRR σlog666.0)log(658.0log717.0173.1log 180 +−+−= (2.4) where RR is the rate of rutting in micro-inches (1 µin. =10-6 in.) per axle load repetition, wo is the surface deflection in mil (1 mil=10-3 in.), σc is the vertical compressive stress under HMA in psi, and N18 is the equivalent 18-kip (80-kN) single-axle load in 105 ESALS. As indicated before, failure due to fatigue cracking is related to the elastic strain at the bottom of the asphalt-concrete layer, the rutting failure is related to compressive strain that occurs at the top of the subgrade layer, and the rate of rut is related to the compressive stress at the bottom of the asphalt-concrete layer. To obtain any of the three critical strains, a structural model is necessary.
Table 2.1 - Fatigue Cracking Model and Rutting Model Parameters Used to Determine Remaining Life of a Flexible Pavement (from Huang, 1993)
Fatigue Cracking Model Nf = f1 ( ε t) –f2 (EAC)-f3
Subgrade Rutting Model Nd = f4 ( ε c) -f5 Model
f1 f2 f3 f4 f5 Asphalt Institute 0.0796 3.291 0.854 1.365*10-9 4.477
Shell 0.0685 5.671 2.363 6.15*10-7 4.0
Shell (50% reliability) - - - 6.15*10-7 4
Shell (85% reliability) - - - 1.94*10-7 4
Shell (95% reliability) - - - 1.05*10-7 4
Illinois Dept. of Transportation 5E-6 3 - 3 -
Transport and Road Research Laboratory 1.66*10-10 4.32 - 4.32 - U.K Research & Road Research Laboratory (85% reliability) - - - 6.18*10-8 3.95
University of Nottingham - - - 1.13*10-6 3.571
Belgian Road Research Center 4.92*10-14 4.76 - 3.05*10-9 4.35
Note: constants are for US customary units

8
The structural model can be either a multi- layer linear system, or a multi- layer equivalent-linear system, or a finite element code for a comprehensive nonlinear dynamic system. A multi- layer linear system is the simplest simulation of a flexible pavement. In this system, all layers are considered to behave linearly elastic. Program WESLEA is one of the popular programs in this category that is also incorporated in FPS19W. The equivalent- linear model is based on the static linear elastic layered theory (Meshkani et al., 2002). Nonlinear constitutive material models can be implemented in them. As such, they are more representative of the actual field condition. The all-purpose finite element software packages allows a user to model the behavior of a pavement in the most comprehensive manner and to select the most sophisticated constitutive models for each layer of pavement. The dynamic nature of the loading can also be considered. But the execution time is prohibitive. In this study, the equivalent linear program developed by Ke et al. (2000) was adapted as the structural model. This algorithm seems to be a reasonable compromise between the required accuracy and the execution time. With the performance models established, the next step is selecting material models. This step allows us to tie into the performance indicators. A flexible pavement consists of a top layer that is made of asphalt-concrete (AC) over one or more base and subgrade layers. The models for each material are described below. Upon consultation with the PMC, the stabilized layers were excluded from this phase of the project. The material model for the AC layer is an equation that relates the dynamic modulus of the AC to parameters such as temperature, asphalt content and air voids content. A popular model known as the “Witczak” model serves this purpose. The equation that is used for this project is given as (Ayres et al., 1998):
( )
( ) ∋++
−++
−+=
−+
+
02774.01.1
5.0log49825.03.1
5.0log49825.03.1
17033.0200
931757.000189.0
000005.0 070377.0
03476.0028829.0553833.5log
ff
Pt
Pt
VfP
E
acfp
acf
p
VAC
η (2.5)
where EAC is dynamic modulus of AC mix (in 105 psi), η is bitumen viscosity (in 106 poise), f is the load frequency (in Hz), Vv is percent air voids in the mix by volume, Pac is percent effective bitumen content by volume, and P200 is percent passing No. 200 sieve by total aggregate weight. The “Witczak” model that is part of the AASHTO 2002 design guide can easily be implemented in this program upon the release of the final version of the design guide. Material models for base and subgrade layers for granular and cohesive materials are needed. As part of the literature search several models were found. The popular constitutive that can be used

9
for base and subgrade layers is the universal model (Barksdale et al., 1997). The general form of the universal equation is 32
1 kd
kR kM σθ= (2.6)
where 321 σσσθ ++= = bulk stress ; 31 σσσ −=d = deviator stress (σ1, σ2 and σ3 are the three principal stresses). Parameters k1, k2 and k3 are material regression constants statistically obtained from laboratory tests. In the AASHTO 1993 design manual, two separate models are proposed for the coarse-grained and fine-grained materials. For coarse-grained materials, AASHTO proposes 2
1 kR kM θ= (2.7)
and for the fine-grained materials 3
1 kdR kM σ= (2.8)
The universal model can be easily modified to simulate these two equations. To obtain Equation 2.7 from Equation 2.6, parameter k3 is set to zero. Similarly to obtain Equation 2.8, parameter k2 is set to zero in Equation 2.6. Thompson et al. (1998) provide a review of the development and predictive performance of models that characterize the nonlinear stress-strain behavior of materials under traffic. Table 2.2 lists several models described in that report. The table provides the name of the models accompanied by its reference, the form of the equations and identifies the variables of each equation. These models are in general very similar to Equation 2.6. The report also contains a thorough explanation of different factors that affect the moduli of base and subgrade materials. Hardin and Drnevich (1972) also provided a list of parameters that affect the moduli of both fine-grained and coarse-grained materials. Their observations are summarized in Table 2.3. The state of stress, void ratio, and the strain amplitude are the main parameters that affect the modulus of a material. For fine-grained material, the degree of saturation is also important. As reflected in Table 2.3, these parameters also affect parameters k1 through k3 in Equation 2.6. Daleiden et al. (1994) devised methods for determining the subgrade modulus based on soil properties and nondestructive data found in the Strategic Highway Research Program (SHRP) Long-Term Pavement Performance (LTPP) database. Subgrade materials were classified into three types: clay, sand, and silt. Regression models were developed for each type. The regression equations developed contained applied load and deflection measured with sensor seven of a Falling Weight Deflectometer, layer thickness, percent saturation, dry density, and specific gravity of the material. Mohammad et al. (1999) proposed regression models that are used to determine parameters k of the octahedral stress-state model (Table 2.2) to determine the moduli of subgrade layer using index parameters such as moisture content, dry density, degree of compaction, liquid limit and plastic limit of the soil. These models, which were developed for different soil types, were validated with

10
eight different soil types from Louisiana. These models fit the criteria and were candidates for developing the methodology in this project.
Table 2.2 – Summary of Material Models (Thompson et al., 1998)
K - Θ ?Model
21
kR kM θ=
where 321 σσσθ ++= = bulk stress ; k1 and k2 are material regression constants obtained from repeated load triaxial tests performed on granular materials.
Uzan ?Model
321
kd
kR kM σθ=
where 321 σσσθ ++= = bulk stress ; 31 σσσ −=d = deviator stress; k1, k2 and k3 are material regression constants obtained from repeated load triaxial tests performed on granular materials.
Octahedral Shear Stress ?Model
32
1
k
a
oct
k
aaR PP
PkM
=
τθ
where 321 σσσθ ++= = bulk stress; τoct = Octahedral shear stresses; σatm = Atmospheric pressure, and k1, k2 and k3 are multiple regression constants evaluated from resilient modulus test data
Itani? Model
ba kkd
k
aR PkM 33
2
31 3σσ
θ
=
where 321 σσσθ ++= = bulk stress; 31 σσσ −=d = deviator stress; σ3 = confining stress; τoct = Octahedral shear stresses; σatm = Atmospheric pressure, and k1, k2 , k3a and k3b are multiple regression constants obtained from repeated load triaxial tests performed on granular materials.
UTEP ?Model
32 )(1k
ak
R kM εθ= where 321 σσσθ ++= = bulk stress; εa = induced resilient axial strain; k1, k2 and k3 are multiple regression constants.
UT-Austin Model
3231
kkR kM σθ=
where 321 σσσθ ++= = bulk stress; σ3 = confining stress; k1, k2 and k3 are multiple regression constants obtained from repeated load triaxial tests.
Bilinear Approximation
(Arithmetic ?Model)
)( 231 daR kkkM σ−+= when σd < k2
)( 231 kkKM dbR −+= σ when σd > k2 where 31 σσσ −=d = deviator stress; k1, k2, k3a and k3b are material constants obtained from laboratory repeated load tests

11
Table 2.3 - Parameters Affecting Modulus of Granular Base and Subgrade (After Hardin and Drnevich, 1972)
Importance* Parameter Affected in Equation 2.6
Parameter Coarse-Grained Materials
Fine-Grained Materials
k1 k2 k3
Strain Amplitude V V √ Effective Mean Principal Stress (Confining
pressure) V V √ √
Void Ratio V V √ Degree of Saturation R V √ √
Overconsolidation Ratio R V √ Effective Stress Envelop R L √
Octahedral Shear Stress L L √ Frequency of Loading L L √
Long-Term Time Effects (Thixotropy) R R √ Grain Characteristics R L √ √
Soil Structures R R √ √ Volume Change Due to Shear Strain V R √
Note: V means important, L means less important, R means relatively unimportant. Another model that best suites this project at this time is the one developed by the Georgia Department of Transportation (GADOT). In that study, Santha (1994) collected and tested a number of soil samples to determine parameters k from resilient modulus tests. He also obtained various construction parameters such as the moisture content, compaction, percent saturation. He then developed regression equations for cohesive and granular materials that estimate parameters k from the construction parameters using the octahedral shear stress model shown in Table 2.2. The regression equations for granular material is in the form of
)40/(*003.0
)/(*004.0*039.0*025.0
*006.0*011.0*681.3 *24.0*07.0479.3)log(
2
2
1
SDEN
CLYSWDENSW
CLYSLTCOMPMCRMCk
+
+−−
++++−=
(2.9a)
CLYSHSWCLYSW
CBRDENSHSWCLYSATU
COMPMOISTk
/)(*31.0)/(*003.0
*012.0*027.0*0069.0 *0088.0*0056.0*0053.0
*076.2*053.0044.6)log(
2
2
+−+
+−−+−+
−−=
(2.9b)
12
)*(*0026.0)/(*00004.0
)/(*0009.0*033.0
*026.0*0053.0*006.0
*309.0*068.0752.3)log(
2
2
3
SHCBRSHSATU
CLYSWDEN
SHCLYSLT
MCRMCk
−+
−−
−+−+−=
(2.9c)
and for cohesive materials,
)*40(*00001.0
*052.0*021.0*016.0 *015.0*0037.0*171.9
*131.0*045.0813.19)log( 1
SATUS
DENSWPILLSLTCOMP
MCMOISTk
+−−−
++−−−=
(2.10a)
DENSH
PISCOMP
MCRMOISTk
*0246.0*014.0
*0087.040*0088.0*471.3
*06.1*097.0274.10)log( 3
−+−+−
−−= (2.10b)
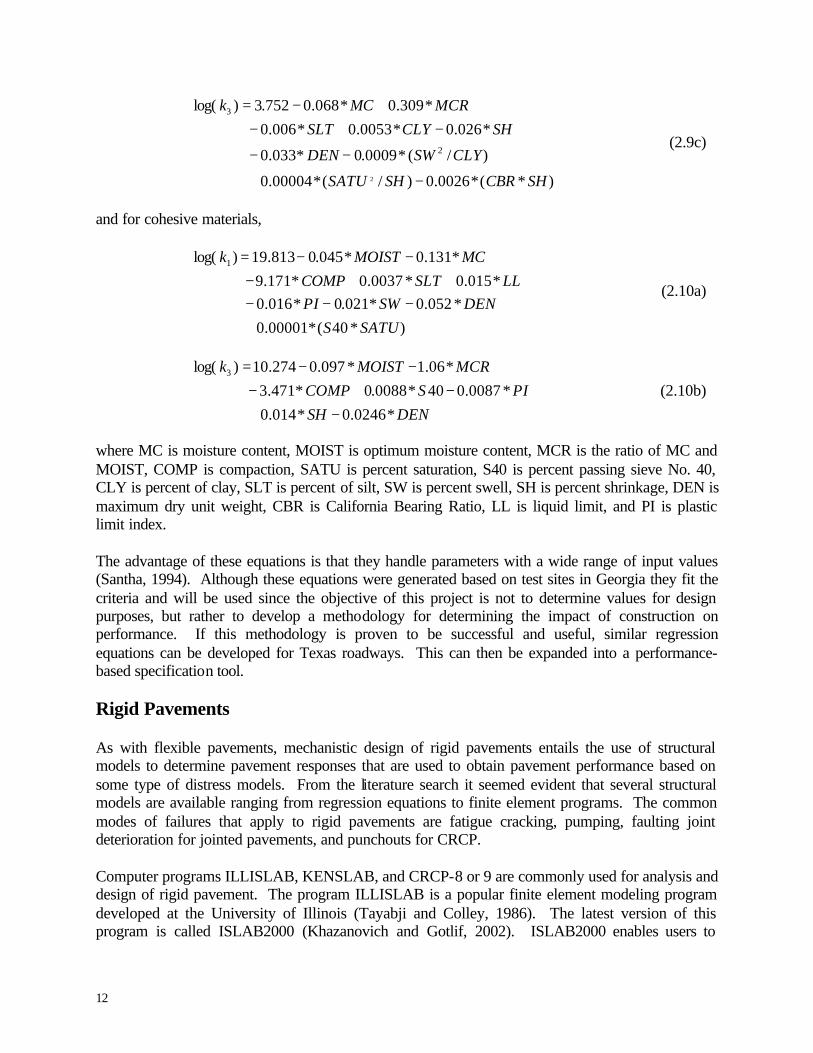
where MC is moisture content, MOIST is optimum moisture content, MCR is the ratio of MC and MOIST, COMP is compaction, SATU is percent saturation, S40 is percent passing sieve No. 40, CLY is percent of clay, SLT is percent of silt, SW is percent swell, SH is percent shrinkage, DEN is maximum dry unit weight, CBR is California Bearing Ratio, LL is liquid limit, and PI is plastic limit index. The advantage of these equations is that they handle parameters with a wide range of input values (Santha, 1994). Although these equations were generated based on test sites in Georgia they fit the criteria and will be used since the objective of this project is not to determine values for design purposes, but rather to develop a methodology for determining the impact of construction on performance. If this methodology is proven to be successful and useful, similar regression equations can be developed for Texas roadways. This can then be expanded into a performance-based specification tool. Rigid Pavements As with flexible pavements, mechanistic design of rigid pavements entails the use of structural models to determine pavement responses that are used to obtain pavement performance based on some type of distress models. From the literature search it seemed evident that several structural models are available ranging from regression equations to finite element programs. The common modes of failures that apply to rigid pavements are fatigue cracking, pumping, faulting joint deterioration for jointed pavements, and punchouts for CRCP. Computer programs ILLISLAB, KENSLAB, and CRCP-8 or 9 are commonly used for analysis and design of rigid pavement. The program ILLISLAB is a popular finite element modeling program developed at the University of Illinois (Tayabji and Colley, 1986). The latest version of this program is called ISLAB2000 (Khazanovich and Gotlif, 2002). ISLAB2000 enables users to

13
incorporate a wide range of conditions that are potentially encountered in the field. Several examples of these conditions include: 1. Variable bond between layers (full bond vs. partial bond) 2. Mismatched joints and cracks 3. Widened base KENSLAB computer program (Huang, 1993) is also a finite element program that features three types of foundations: liquid, solid and layer with either bonded or unbonded slabs. The documentation of this program can be found in Huang (1993). The analysis of CRC pavements is a highly complex problem. A large number of variables influence the pavement behavior and the variables are highly interacted. Since the mid-seventies, researchers at the Center for Transportation Research (CTR) have been developing and improving mechanistic models for CRC pavements. These models have been calibrated over the years using field data from actual pavement test sections. The program CRCP-8 simulates the early age behavior of CRC pavements and is used to calculate performance measures based on design, construction and environmental factors. Because CRCP-8 in a sense packages the prediction model with the structural model, it was not necessary to investigate its components. Since this program is currently being used by TXDOT, it seemed logical to incorporate it into our algorithm. This resulted in several advantages and disadvantages in the development process. These concerns will be addressed appropriately in this report. Table 2.4 lists the equations involved in the modeling process. These theoretical models are used to solve for stresses and strains, and to estimate representative movements and crack width. The outputs of the CRCP-8 in terms of failure indicators that reflect the performance of CRC pavement are: a) Crack spacing, b) Crack width, c) Steel stress at a crack, d) Bond development, and e) Failure per mile. These five performance indicators were used in our algorithm. A substantial amount of input data relating to pavement design, environmental factors and loading must be provided to the CRCP-8 program. As a result, the main parameters that will be part of the impact analysis using the CRCP-8 program are: a) thickness of concrete section, b) modulus of concrete, c) modulus of steel, d) modulus of subgrade, e) percent of steel reinforcement, f) bar diameter, g) yield stress of steel,

14
h) drying shrinkage of concrete, i) tensile strength of concrete, j) compressive strength of concrete, and k) flexural strength of concrete.
Table 2.4 – Mechanistic Equations Used in CRCP-8
00 =−+∫
PPD
dxFcm
sm
L
i
scσ
σσ
( )[ ]sccs
c TZEn
αασ
σ −∆++=
TLEdxdx ss
b
as
a
s ∆=+ ∫∫ ασσ0
+
−=P
nD
Fdx
d is
1σ
Φ=
udx
d s 4σ
Φ−−=
uPDF
dxd ic 4σ
( )dxTZdxyx
ccc ∫ ∆+−=0
αε
( )
∆+−=∆ ∫ LTZdxx
L
cc0
2 αε
σsc=stress in the steel at the crack, σsm=stress in the steel between cracks, σcm=stress in the concrete between cracks, Fi = friction force per unit length along the slab, L = half of the crack spacing, D = thickness of concrete slab, P = ratio of area of longitudinal steel to the cross-sectional area of
concrete per unit width, A s/Ac, As = cross-sectional area of longitudinal steel, and Ac = cross-sectional area of concrete. σc= the total stress in the concrete along the bonded section of the
slab, σs= the total stress in the steel along the bonded section of the slab, ∆T=drop in concrete temperature, Ec = elastic modulus of concrete, n = Es/Ec, moduli ratio, Z = drying shrinkage strain of concrete, αc=linear thermal coefficient of concrete, αs=linear thermal coefficient of Steel, ∆T=drop in concrete temperature, a = the length of fully bonded zone, b = the length of bond slip zone, L = a+b, and dx = the length of a slab element in the fully bonded section of the
unit, φ = the bar diameter, u = the shear bond stress, yc=the movement of the concrete due to shrinkage Z, εc= the strain of concrete, ∆x = the crack width.
These parameters are classified as either construction or design parameters. Since the impact of the materials that impact the strength and stiffness of concrete is well-understood and well controlled, these items were not included in this program. The ongoing effort in Research Project 0-1700 as well as the computer program Hiperpave (Rasmussen et al., 2002) will adequately allow the control of the components of the concrete mixtures. In Chapter 3 the process of incorporating this module into the impact analysis will be further discussed. The program CRCP-9, a revision of CRCP-8, has been developed that is based on finite element analysis. This new version of the program uses a two-dimensional finite element code to create a mechanistic model. In CRCP-9 the crack spacing prediction model was developed using the Monte Carlo simulation process, and the failure prediction model was developed using probabilistic

15
analysis. The major characteristics of CRCP-9 is the consideration of nonlinear variations in temperature and drying shrinkage through the depth of the concrete slab, nonlinear bond-slip relationship between concrete and steel bars, viscoelastic effect of concrete, curling and warping effects, and the ability of changing locations of the longitudinal steel bars. Since this program was based on finite element analysis it would not be practical for the impact analysis in the existing form. This will become clearer in Chapter 3 when the impact algorithm is described. However, there is no technical reason why CRCP could not be used in the impact analysis in the future. AASHTO Design Models So far only mechanistic models have been discussed since this is the main focus of the project. At the suggestion of the PMC, the empirical design models in the current AASHTO design guide were also investigated. The AASHTO equations for flexible and rigid pavements estimate the cumulative expected 18-kip equivalent single-axle load. Models for both pavement types were developed with consideration to environmental, serviceability and reliability factors. For flexible pavements the performance model is in the form of:
07.8log32.2
)1(1094
4.0
]5.12.4
[log20.0
)1(log36.9)(log
10
19.5
10
1001810
−×+
++
−∆
+−
+×+×=
R
R
M
SN
PSI
SNSZW
(2.11a)
2211 DaDaSN += (2.11b) where W18 is the number of 18-kip equivalent single axle load repetitions to failure, ∆PSI is the design serviceability loss, ΖR is the reliability factor, S0 is the overall standard deviation, SN is the structural number of pavement. Parameters a1 and a2 are layer coefficients for the surface and base layers respectively; and D1 and D2 are the thicknesses of the surface and base layers respectively. Parameter MR is the effective roadbed soil resilient modulus. In the AASHTO model for flexible pavements, the only parameters that can be related to design or construction are SN and MR. Parameter SN is a function of layer coefficients and layer thicknesses. AASHTO design guide proposes a relationship between layer coefficients and the resilient modulus of the corresponding layer (see Figure 2.2). The relationship shown in Figure 2.2 can be approximated with: 70.0278 - 0.295 0.0967 - 0.0174 0.0012- 1
21
31
411 EEEEa ++= (2.12)
where E1 is modulus of top layer.

16
Figure 2.1 – Variation in Layer Coefficient with Modulus for Dense-Graded Asphalt Concrete
Similarly, layer coefficient for granular base, a2, can be related to its modulus, E2, using: 977.0)(log249.0 22 −= Ea (2.13) For rigid pavements, the performance model is in the form of:
( )
( )
( ) [ ]
( )
−
−−+
++
−∆
−++=
25.075.0
75.0'
10
46.8
10
101810
/42.18
63.215
132.1log32.022.4
17624.1
1
5.12.4log
06.01log35.7log
kEDJ
DCSp
De
PSI
DSzW
c
dct
OR
(2.14)
where W18 = the number of 18-kip equivalent single axle load repetitions to failure, ∆PSI = design serviceability loss, zR = reliability, SO = overall standard deviation, Ec = concrete elastic modulus (in psi), S’c = modulus of rupture of concrete (in psi), D = thickness of PCC (in inches), k = effective modulus of subgrade reaction (in pci), Cd
= drainage coefficient, and J = load transfer coefficient.
0
0.1
0.2
0.3
0.4
0.5
0 1 2 3 4 5
HMA Resilient Modulus at 70oF (10^5 psi)
Stru
ctur
al C
oeff
icie
nt, a
1

17
In this case, the PCC properties are well represented in the design by three parameters (i.e. concrete elastic modulus, modulus of rupture and thickness). Even though the thickness of the PCC is checked during the construction, moduli of elasticity and rupture are usually determined based on testing a small number of moist-cured cylinders in the laboratory. It is clear that the impact of construction on the properties is ignored. Once again, the impact of the underlying layers is included as a composite modulus of subgrade reaction obtained based on empirically developed relationships.

18
CHAPTER 3 DEVELOPMENT OF METHODOLOGY Theoretically, if a pavement section is designed with the same cross section and constructed with the same materials, its performance should be uniform throughout the section. Practically, distress may develop randomly in different subsections of the pavement even though the vehicular and environmental loads are more or less uniform along the section. One reason for the random development of distress is the variability in construction quality. The performance of the pavement can be more consistent for the entire section if the construction quality is uniform. This uniformity is accomplished by reducing the variability of construction-based parameters. One method for assessing the uniformity in construction is statistic-based quality assurance/quality control (QA/QC) techniques. The goal with these techniques is to minimize the variability in performance of the pavement by reducing the variability in the material properties that impact the performance of the section the most. One appropriate way to achieve this goal is by developing a probabilistic approach using mechanistic-based algorithms that would easily identify the impact of construction parameters on pavement performance. More specifically, widely accepted mechanistic models, which consider the impact of stresses due to environmental factors, repeated load applications, and deterioration of material with age, are desirable. The models should be based on parameters that are directly related to the performance of the pavement and that are readily measurable either in the laboratory or in situ. Many performance-related parameters that are universally accepted by the designers can be controlled during mixing and placing. Therefore, one can measure surrogate parameters such as the asphalt content of the AC layer or gradation for bases during material processing. Parameters such as modulus or strength in place can be measured during construction. As quality is related to performance, the determination of parameters that should be used in pavement design is the framework of the quality management. Consequently, the distress prediction algorithms for both flexible and rigid pavements should typically have models in the form of (Patel and Thompson, 1998): ( ) ε+= ,...,, 321 XXXfP (3.1)

19
where P is the performance of the pavement, Xi’s are the parameters that impact the performance, and ε is the error term related to several sources of uncertainty. One major source of uncertainty in determining the input parameters, Xi’s, is the combined errors due to testing procedure and replication error due to differences in testing devices. Since most performance models today are either empirical or empirical-mechanistic in nature, another major source of uncertainty is attributed to error in predicting performance. This source of uncertainty is commonly known as model uncertainty. As the performance model becomes more mechanistic, the model-based uncertainties will become smaller. With that framework, the primary goal of this project is to provide a concept that, in a rational manner, combines the results from laboratory and field tests performed for quality control during construction to address the impact of variability on the performance of the pavement. To develop this concept, three critical steps are essential. First, structural models that predict performance of pavements have to be identified. Second, material models that relate construction parameters to primary design parameters based on primary design parameters (thickness and modulus) have to be assessed. Finally, a statistical algorithm that can relate the impact of each construction parameter on the performance of a pavement needs to be implemented. Figure 3.1 provides a general framework of the methodology. The three circles presented in the figure represent the main aspect of the process starting from construction parameters, which is represented by the inner circle. The material characteristics models, represented by the middle circle, are the links between the construction and pavement performance. Performance is represented by the outer circle. The two sets of arrows indicate the flow of the development and execution processes. To develop the algorithm, the following steps have to be taken: 1. A performance model has to be selected (e.g. Asphalt Institute Rutting Model). 2. The parameters that impact the performance model should be identified (e.g. moduli of different
layers and thickness of each layer). 3. For each parameter in Item 2, the construction parameters that impact them should be identified
(e.g. modulus of AC is impacted by air void, asphalt content percent fine etc.)
Figure 3.1 – Conceptual Framework Developed for this Project
ConstructionParameters
Flow of DesignFlow of Execution
ConstructionParameters
Flow of DesignFlow of Execution

20
To execute the developed algorithm, the following steps should be followed:
1. Determine the thickness and target modulus of each layer from the design engineer 2. Determine the optimum value for each parameter that impact the modulus of each layer 3. Determine the impact of variability of each relevant parameter on the modulus of the layer 4. Determine the impact of variability in modulus and thickness on the remaining life 5. Identify the most significant construction parameters 6. Minimize the variability in the values of the parameters identified in Item 5. As described above, one of the most important items in developing the algorithm is the performance model. In collaboration with the project advisory committee members, several mechanistic-based performance models were agreed upon. The existing AASHTO design procedures for flexible and rigid pavements were also incorporated into the process to provide alternatives to users. The selection of the final performance models were based on the following criteria: a) the needs of the end users mainly TxDOT personnel, b) the current design programs used by TxDOT and c) the desire of TxDOT to eventually adapt the new ASHTTO 2002 design guide.
An algorithm to assess the importance of construction parameters was developed. This algorithm combines the performance, structural and material models, as shown in the circles of Figure 3.1. Although the process of determining the impact of the construction parameters (called impact analysis hereafter) is similar for both flexible and rigid pavements, the specific algorithm used for each type is described separately. Algorithms Flexible Pavement Algorithm The models and parameters used to develop the algorithm for flexible pavements were discussed in Chapter 2. The integration of the performance, structural and material models is illustrated in Figure 3.2. The algorithm flow is from construction parameters linked to material models and finally to pavement performance. Relevant construction parameters and their values are specified by the user in Step 1. In Step 2, the construction parameters are input to the relevant material models to determine the moduli of the layers. For example, the modulus of AC is estimated directly from the construction parameters such as air voids, asphalt content, asphalt viscosity, etc. Step 3 is to evaluate the critical stresses based on the layer properties from Step 2 and determine the performance of the pavement. The structural model that is used to calculate the appropriate stresses and strains is the program WESLEA. The source code from WESLEA was modified to incorporate the material models, and to serve as the engine that performed all the numerical calculations. Ke (1999) provides a detail explanation of the approach taken to incorporate nonlinear material models into the layer elastic algorithm. In his algorithm, Ke divided each pavement layer into several sublayers and the stresses and strains were calculated at the middle of each sublayer. In this project,

21
Figure 3.2 – Flow chart of Mechanistic Algorithm
32
1
k
a
d
k
aaR PP
PkM
Θ=
σ
Impact of Construction Parameterson Performance
10%
12%5% 6%
48%
21%P200 Percent Air VoidsViscosity Percent asphalt contentDry density of base Specific gravity of subgrade
Construction Parameters for the AC layerAggregate Passing #200 Sieve, Air Void, Asphalt Viscosity, Asphalt Content, etc…
Construction Parameters for the base and subgrade layers
Aggregate Passing #40 Sieve, Compaction, Saturation, Percent Clay, Percent Silt, Percent
Shrinkage, Dry Density, Moisture Content etc…
)
f()Log(k
S40DEN,SW,CLY,
SLT, COMP,MC,1 =
)
f()Log(k
S40DEN,SW,CLY,
SLT, COMP,MC,2 =
)f()Log(k
S40DEN,SW,CLY, SLT, COMP,MC,3 =
?),V,P,tf,,P(log vacp200fE AC =
Asphalt-concrete
Base
Subgrade
Asphalt-concrete
Base
Subgrade
Step
1:
Des
ign
and
Con
stru
ctio
nPa
ram
eter
s
Step
2:
Mat
eria
l Cha
ract
eris
tic
Mod
els
Step
4:
Impa
ct C
hart
Step
3:
Pave
men
t Per
form
ance
0
20
40
60
80
100
1.E+00 1.E+02 1.E+04 1.E+06Traffic, KESALS
DA
MA
GE
Note: - indicates probabilistic analysis
a1 = -0.0012E14 + 0.0174E1
3 -0.0967E1
2 + 0.295E1 - 0.0278
977.0)(log249.0 22 −= Ea
2211 DaDaSN +=
07.8log32.2
)1(1094
4.0
]5.12.4
[log20.0
)1(log36.9)(log
10
19.5
10
1001810
−×+
++
−∆
+−
+×+×=
R
R
M
SN
PSISNSZW
07.8log32.2
)1(1094
4.0
]5.12.4
[log20.0
)1(log36.9)(log
10
19.5
10
1001810
−×+
++
−∆
+−
+×+×=
R
R
M
SN
PSISNSZW

22
the stresses and strains were calculated at the bottom of the base layer and at the top of the subgrade layer where the load-induced nonlinear behavior is more evident. For the models used for the base and subgrade, a structural model is also needed to calculate the appropriate stresses as input in the materials models. This is also achieved using WESLEA. So far a link between a large number of construction parameters and the three remaining life models are developed. The number of construction parameters is too many to be used in the quality management. An algorithm to evaluate the impact of each construction parameter is needed so that the parameters that affect the remaining life the most can be determined. This will be represented in an impact chart (Step 4). A cost-effective quality management program should focus on only the parameters that impact the performance of the pavement the most. A probabilistic analysis is needed to achieve this goal. This process is described in the next section. In a deterministic analysis, a representative value of each input parameter is input into a mathematical model (a system) to determine an output value (see Figure 3.3a). To implement a deterministic analysis in our case, a typical value for each construction parameter is obtained from either a specification manual or a laboratory test, or a field test. These values are used as input to a mechanistic algorithm (system) to obtain a performance value. In the deterministic analysis, the uncertainties that are associated with the input parameters are ignored or accounted for by inflating or deflating some of the input parameters. Any engineering measurement associated with a construction parameter demonstrates a certain variation. Therefore a probabilistic analysis is a more rational engineering approach. The probabilistic approach differs from a deterministic approach by explicitly accounting for the variability of a parameter. A random parameter can take a range of values and can be represented by different types of probability distributions. In this research project all input parameters are assumed to be normally distributed. A current TxDOT study by Zhang et al. (2002) is developing actual distribution for different construction parameters. As soon as these distributions are available, they can be incorporated in the algorithm developed here. Figure 3.3b shows how an input parameter with a normal distribution can be represented by a mean and a coefficient of variation (COV). A Monte Carlo simulation technique is used to simulate each input parameter based on its mean and coefficient of variation (COV). The simulated cases are input to the analysis system to determine the associated performance indicator as described for the deterministic analysis. The performance indicators obtained from all cases are then used to establish the associated mean and COV. The COV of a given input construction parameter is compared with the COV calculated for the performance indicator to assess whether the performance indicator is sensitive to the construction parameter. In this manner, one can assess whether a given parameter is worth considering in the quality management of a given project. To prioritize the significance of different construction parameters relative to one another, the approach described next is followed. The algorithm used to determine the significance of a parameter relative to all other parameters involved is based on a so-called “Impact value.” The impact value for a parameter i, Ii, is

23
Figure 3.3 – Comparison of Deterministic and Probabilistic Analyses
a)
b)
ConstructionParameters
ConstructionParameters
Several values simulated per construction parameter
Several values calculated per performance indicator
One Value per performance
indicator
One value per construction parameter
SYSTEM
Input Input
Output Output
Deterministic Analysis Probabilistic Analysis
ConstructionParameters
ConstructionParametersSYSTEM
ConstructionParameters
ConstructionParameters
Several values simulated per construction parameter
Several values calculated per performance indicator
One Value per performance
indicator
One value per construction parameter
SYSTEM
Input Input
Output Output
Deterministic Analysis Probabilistic Analysis
ConstructionParameters
ConstructionParametersSYSTEM
Mean, COV
Mean, COV

24
determined from
ALL
ii COV
COVI = (3.2)
where COVi is the coefficient of variation of a performance indicator based on perturbing parameter i, and COVALL is the coefficient of variation of the same performance indicator when all input parameters are simultaneously varied. As a reminder, COVx is determined by: 1. simulating the input parameter using Monte Carlo technique, 2. inputting each simulated case into the analysis system, and 3. calculating the COV of the output values. Parameter COVALL is calculated in a similar fashion except that in the Monte Carlo simulations all parameters involved are allowed to vary. This process is then repeated for all construction parameters. Once the impact values for all parameters are determined, the relative significance of each parameter is assessed by determining its normalized impact value, NIVi, using
( )
niI
INIV
n
ii
ii ,...,2,1
1
==
∑=
(3.3)
where Ii is the impact value for the ith input parameter. The larger the normalized impact value is, the larger its impact on the performance of the pavement will be. A pie chart can be used to conveniently represent all the NIV values simultaneously. Such a pie chart, which is called the impact chart, allows the user to visually assess the significance of each parameter. Figure 3.4 shows an example of an impact chart that exhibits the relative impact values of six parameters labeled P1 to P6. In this example, P1 is very significant and impacts the performance indicator the most, while parameters P3 and P6 have negligible impact on the performance indicator. If one is interested in changing the mean and COV of the performance indicator associated with these parameters, she/he should focus on P1 and essentially ignore P3 and P6. One important factor to consider in the above algorithm is the size of the sample to be generated by the Monte Carlo technique. In general, the larger the sample, the more representative the distribution of the simulated variable will be. The larger number of simulations also translates to more lengthy computation time. For practical applications, the desire for more simulations should be balanced with the time period required to obtain the results. The results from one exercise to determine the number of simulations necessary are presented in Figure 3.5. In this case, thickness of base is simulated 25, 100, 500, and 1000 times using a normal distribution with a mean thickness of 12 inches and a COV of 10%. The frequency distribution

25
Figure 3.4 – Illustration of an Impact Chart (left-hand axis) and the cumulative frequency distribution (right-hand axes) for each simulation are shown in the figure. The frequency distribution is a histogram that represents the frequency of occurrence of a parameter (thickness of base) at different values of the parameter. Visually the shape of a histogram can be used to determine the appropriateness of a simulation. The shape of the histogram or frequency distribution should be a bell-shaped curve. The smoother the bell-shaped curve is, the closer the distribution to a normal distribution will be. For larger numbers of simulation (n = 500 or 1000) the distribution curves are smooth (see Figure 3.5c and 3.5d). The cumulative frequency distribution (CFD) is an alternative way to present the results. The cumulative distribution always varies between 0% and 100%. Ideally, the CDF is an s-shaped curve with an inflection point at 50% (which represents the mean value). Once again, the smoother the shape of the CFD is, the more representative of an ideal distribution the curve will be. For each of the four cases, the mean and the COV of the simulation are shown in the corresponding figure. The mean and COV values for the simulated results should be close to 12 inches and 10% as specified in the simulation. As reflected in the figure, the mean values for all four graphs are close to 12 inches. However, as the number of simulations, n, increases, the COV becomes closer to the actual value. For example in Figure 3.5a (n = 25) the COV of the simulated values is 8.6% and if this was used in the impact algorithm the results will be based on the variability of 8.6% and not the 10% specified. Another criterion to determine the optimum number of simulations is the repeatability of the simulation. Simulating the same number of cases several times should yield approximately the same means and COVs. The repeatability for each of the four different simulation sizes, based on 10 different simulations, is shown in Figure 3.6. When the simulation size is 25, the repeatability is poor; whereas for the 500 and 1000 simulations the repeatability is quite acceptable. Based on this and many other similar exercises, a simulation size of 500 was selected.
P5 (25%)
P3 (1%)
P4 (8%)
P6 (1%)
P2 (9%)
* P1 (57%)
* P1 is the most significant parameter with the highest normalized impact value relative to other parameters
P5 (25%)
P3 (1%)
P4 (8%)
P6 (1%)
P2 (9%)
* P1 (57%)
P5 (25%)
P3 (1%)
P4 (8%)
P6 (1%)
P2 (9%)
* P1 (57%)
* P1 is the most significant parameter with the highest normalized impact value relative to other parameters

26
Figure 3.5 – Impact of Sample Size Used in Monte Carlo Simulation on Final Distribution of a Variable
0
2
4
6
8
10
12
9 10 11 12 13 14 15More
Thihickness of Base, in.
Fre
quen
cy D
istr
ibut
ion
0%10%20%30%40%50%60%70%80%90%100%
Cum
ulat
ive
Fre
quen
cy
Dis
trib
utio
n
05
10152025303540
9 10 11 12 13 14 15More
Thihickness of Base, in.
Fre
quen
cy D
istr
ibut
ion
0%10%20%30%40%50%60%70%80%90%100%
Cum
ulat
ive
Fre
quen
cy
Dis
trib
utio
n
020406080
100120140160180
9 10 11 12 13 14 15More
Thihickness of Base, in.
Fre
quen
cy D
istr
ibut
ion
0%10%20%30%40%50%60%70%80%90%100%
Cum
ulat
ive
Fre
quen
cy
Dis
trib
utio
n0
50100150200250300350
9 10 11 12 13 14 15M
ore
Thihickness of Base, in.
Fre
quen
cy D
istr
ibut
ion
0%10%20%30%40%50%60%70%80%90%100%
Cum
ulat
ive
Fre
quen
cy
Dis
trib
utio
n
a) n=25Mean = 12.2COV = 8.6%
b) n=100Mean = 12.1COV = 9.4%
c) n=500Mean = 12.1COV = 10.1%
d) n=1000Mean = 12COV = 9.9%
Inflection point Inflection point
Inflection point Inflection point

27
Figure 3.6 – Repeatability of Monte Carlo Simulation for Four Sample Sizes Given the large number of construction parameters that have to be simulated, this process may be too time-consuming. Alternative methods, other than Monte Carlo technique, are available that can accelerate the process. One such alternative is the two-point mass method. The two-point-mass (TPM) method, a derivative of the Point-Estimate method, can be used to approximate low-order moments of functions (such as mean, variance and standard deviation) of random variables. Without going into too much detail, a continuous random variable is replaced with a discrete random variable. In this case the continuous random variable (represented by a mean, a COV, and a skewness coefficient) is replaced by two masses representing the distribution of the function with the characteristic that the discrete distribution has the same mean, COV and skewness coefficient as the continuous one. Figure 3.7 illustrates this concept. The left-hand side of the figure shows a parameter represented by three distributions: a) normal distribution (symmetric), b) left skewed distribution, and c) right skewed distribution. Each distribution is continuous and can take any value between a and b. To represent these distributions using TPM method, only two discrete points are required. The TPM representation is shown on the right-hand side of the figure. All three cases show each point representing one side of the areas to the left or right of the mean value. The distances the two points are located from the mean are calculated to represent the distribution of the continuous function. The two points are also assigned weights. The weight in depending on the distribution, is a measure of which of the two points is most likely representative of the function. In the case of a normal distribution (symmetric), the points are at a distance one standard deviation from the mean with equal weights of 0.5. This means that either point represents the parameter equally. The other two distributions show different distances from the mean with larger weight values depending on the skewness of the distribution.
7%
8%
9%
10%
11%
12%13%
14%
1 2 3 4 5 6 7 8 9 10
Simulation Number
Coe
ffic
ient
of V
aria
tion
n=25 n=100 n=500 n=1000
7%
8%
9%
10%
11%
12%13%
14%
1 2 3 4 5 6 7 8 9 10
Simulation Number
Coe
ffic
ient
of V
aria
tion
n=25 n=100 n=500 n=1000

28
Figure 3.7 – Illustration of Two Point Mass Method The advantage of the TPM method is that it can rapidly determine the sensitivity of one variable since only two executions are required instead of 500 as in the case of the Monte Carlo technique. However, for determining the impact value of several parameters, the number of simulations increases exponentially. To put this statement in perspective, recall that for a flexible pavement, 28 construction parameters are identified. From Equation 3.2, two COVs are required to determine the impact value: 1) based on one variable, and 2) with all parameters simulated together. For the first part the TPM method is more practical than the Monte Carlo technique, since it reduce the number of total cases that are simulated from 14000 cases (500 simulations multiplied by 28 parameters) to 56 cases (2 simulations multiplied by 28 parameters). However for the second part, where all parameters are simulated together, the number of simulations with the Monte Carlo technique is only 500 cases compared to the TPM which require 228 cases. Therefore, the TPM method is only practical if the number of variables is small. The algorithm developed uses the TPM technique to calculate the COV of individual parameters and the Monte Carlo technique to simulate all parameters concurrently. This improves processing time with small sacrifice in accuracy.
µ ba
µ ba
µ ba
µ
µ
µ
mass1 mass2
mass1
mass2
mass1
mass2
normal(-∞, +∞)
left skewed distribution
right skewed distribution
Continuous Function TPM Function
µ ba
µ ba
µ ba
µ
µ
µ
mass1 mass2
mass1
mass2
mass1
mass2
normal(-∞, +∞)
left skewed distribution
right skewed distribution
Continuous Function TPM Function

29
Rigid Pavement Algorithm As explained in Chapter 2, the program CRCP-8 was incorporated into the impact analysis algorithm. Again CRCP-8 was used instead of CRCP-9 solely based on the processing speed. Program CRCP-8 is actually a combination of three executable modules. Upon the execution of the program, the pre-processing module is loaded. This serves as a tool to allow the user to provide and generate an input file. Once the input is generated, the processing module performs the appropriate calculations, and generates the output file. The post-processing module is then activated to extract and display the most relevant information. Only the processing module of the CRCP-8 is required in this project. The algorithm to determine the impact of construction parameters shown in Figure 3.8, is quite similar to the one described for the flexible pavement except that relevant input construction parameters and the structural models are different. The figure is divided into three sections, namely input parameters, performance models, and impact chart. In the first step, i.e. input parameters section, the user provides the average and COV for each construction parameter. Using the Monte Carlo simulation, each relevant parameter and the combination of all parameters are randomly simulated five hundred times. In Step 2, each simulated input is fed into the CRCP-8 to obtain the performance indicators. The third step consists of performing the appropriate statistical operations, calculating the impact values based on Equations 3.2 and 3.3, and presenting the results in an impact chart. If solely Monte Carlo simulation is utilized, and the number of simulation is set to 500 per parameter (as discussed earlier in the chapter), the number of times program CRCP-8 is executed is about five thousand times. This translates to 5 hours of analysis. However, as indicated earlier, a method that combines both Monte Carlo simulation and the Two-Point-Mass techniques is being used and has decreased the processing time to 20 minutes. Several limitations can be attributed to this model. Despite the practical observations that the modulus of subgrade impacts the performance of the pavement, that parameter has small impact in the models adopted by the CRCP8. Since as a primary design parameter, the impact of subgrade is small, it is not prudent to assign a material model to this parameter. We could have easily utilized the models described in Chapter 2 for this case as well. But irrespective of values assigned to construction parameters, the performance would change only slightly. The impact of the subgrade can be incorporated using CRCP10 or ISLAB 2000 but the execution time would be prohibitive. Our extensive information search did not provide a model that is superior to those used in the CRCP8. Should such a model become available, it can be readily incorporated in our algorithm. The parameters associated with the strength or stiffness of the concrete were also maintained at the primary design levels. Project 0-1700 is developing a series of models that we can readily incorporate in our algorithm. Since no other realistic model is available, we decided to wait until later and incorporate those models.

30
AASHTO Pavement Algorithms The algorithm used to determine the impact values for the AASHTO flexible design, is almost identical to the mechanistic flexible algorithm except that the damage model is different. Referring to Figure 3.9, the input construction parameters used in this analysis are the same as the mechanistic model. The same structural model (WESLEA) is also used to estimate the moduli of the base and subgrade. The failure models used in the mechanistic algorithm are exchanged with the AASHTO equation (Equation 2.11a) so that the number of ESALs can be estimated. Since AASHTO equation requires structural number, the layer moduli are input in Equations 2.12 and 2.13 to calculate the layer coefficients as indicated in Figure 3.9. The layer coefficients are in turn input to Equation 2.11b to calculate the structural number. In this process no external links are required since the AASHTO equation can be programmed into the Excel sheet, therefore processing several thousands of cases is possible in a few minutes. In this situation only the Monte Carlo technique has been implemented with the number of simulation equal to 500. Similarly, the algorithm used for determining the impact charts for the mechanistic approach based on the CRCP-8 is modified so that the AASHTO equation for rigid pavements can be used as the failure model. Figure 3.10 illustrates this process. As before, the average and COV of the construction parameters used in the analysis are input to the algorithm so that the appropriate Monte Carlo simulations can be carried out. In the second step the performance indicator, number of ESALs to failure, is calculated for each simulated case. As soon as the performance indicator values are determined, the process described in Figure 3.2 is used to develop impact charts. The AASHTO rigid pavement model is rather simplistic and does not require a structural model. As such, this approach is extremely fast.

31
Figure 3.8 – Algorithm for Continuously Reinforced Concrete Pavements
Step
1:
Des
ign
and
Con
stru
ctio
nPa
ram
eter
s
Step
2:
Pave
men
t Per
form
ance
Step
3:
Impa
ct C
hart
Thickness of ConcreteModulus of ConcreteModulus of SteelModulus of SubgradePercent of SteelBar DiameterYield StressDrying ShrinkageTensile StrengthCompressive StrengthConcrete Flexural Strength
Processor FORT8.EXE
Crack SpacingCrack Width,Steel Stress at a CrackBond DevelopmentFailure Per Mile
0%
0%
20%
17%
0%0%0%
27%
34%2%
0%
The Steel Stress at A Crack
20%
17%
27%
34%2%
Note: - indicates probabilistic analysis
Impact of Construction Parameterson Performance
Step
1:
Des
ign
and
Con
stru
ctio
nPa
ram
eter
s
Step
2:
Pave
men
t Per
form
ance
Step
3:
Impa
ct C
hart
Thickness of ConcreteModulus of ConcreteModulus of SteelModulus of SubgradePercent of SteelBar DiameterYield StressDrying ShrinkageTensile StrengthCompressive StrengthConcrete Flexural Strength
Processor FORT8.EXE
Crack SpacingCrack Width,Steel Stress at a CrackBond DevelopmentFailure Per Mile
0%
0%
20%
17%
0%0%0%
27%
34%2%
0%
The Steel Stress at A Crack
20%
17%
27%
34%2%
Note: - indicates probabilistic analysis
Impact of Construction Parameterson Performance

32
Figure 3.9 – Algorithm Modification for AASHTO Flexible Pavement Model
32
1
k
a
d
k
aaR PP
PkM
Θ=
σ
Impact of Construction Parameterson Performance
10%
12%5% 6%
48%
21%P200 Percent Air VoidsViscosity Percent asphalt contentDry density of base Specific gravity of subgrade
Construction Parameters for the AC layerAggregate Passing #200 Sieve, Air Void, Asphalt Viscosity, Asphalt Content, etc…
Construction Parameters for the base and subgrade layers
Aggregate Passing #40 Sieve, Compaction, Saturation, Percent Clay, Percent Silt, Percent
Shrinkage, Dry Density, Moisture Content etc…
)
f()Log(k
S40DEN,SW,CLY,
SLT, COMP,MC,1 =
)
f()Log(k
S40DEN,SW,CLY,
SLT, COMP,MC,2 =
)f()Log(k
S40DEN,SW,CLY, SLT, COMP,MC,3 =
?),V,P,tf,,P(log vacp200fE AC =
Asphalt-concrete
Base
Subgrade
Asphalt-concrete
Base
Subgrade
Step
1:
Des
ign
and
Con
stru
ctio
nPa
ram
eter
s
Step
2:
Mat
eria
l Cha
ract
eris
tic
Mod
els
Step
4:
Impa
ct C
hart
Step
3:
Pave
men
t Per
form
ance
0
2 0
4 0
6 0
8 0
100
1.E+00 1.E+02 1.E+04 1.E+06Traffic, KESALS
DA
MA
GE
Note: - indicates probabilistic analysis
a1 = -0.0012E14 + 0.0174E1
3 -0.0967E1
2 + 0.295E1 - 0.0278
977.0)(log249.0 22 −= Ea
2211 DaDaSN +=
07.8log32.2
)1(1094
4.0
]5.12.4
[log20.0
)1(log36.9)(log
10
19.5
10
1001810
−×+
++
−∆
+−
+×+×=
R
R
M
SN
PSISNSZW
07.8log32.2
)1(1094
4.0
]5.12.4
[log20.0
)1(log36.9)(log
10
19.5
10
1001810
−×+
++
−∆
+−
+×+×=
R
R
M
SN
PSISNSZW

33
Figure 3.10 – Algorithm Modification for the AASHTO Rigid Model
Step
1:
Des
ign
and
Con
stru
ctio
n Pa
ram
eter
s
Step
2:
AA
SHTO
Pe
rfor
man
ce
Mod
el
Step
3:
Impa
ct C
hart
( )
( )
( ) [ ]
( )
−
−−+
++
−∆
−++=
25.075.0
75.0'
10
46.8
10
101810
/
42.1863.215
132.1log32.022.4
1
7624.11
5.12.4log
06.01log35.7log
kEDJ
DCSp
D
e
PSI
DSzW
c
dct
OR
46%
46%
3%6%
D: Thickness of The Pavement Slab S’c:Modulus of Rupture
Ec :Modulus of Elasticity k : Modulus of Subgrade reaction
Thickness of PCCModulus of ElasticityModulus of RuptureModulus of Subgrade Reaction
Note: - indicates probabilistic analysis
Impact of Construction Parameterson Performance
Step
1:
Des
ign
and
Con
stru
ctio
n Pa
ram
eter
s
Step
2:
AA
SHTO
Pe
rfor
man
ce
Mod
el
Step
3:
Impa
ct C
hart
( )
( )
( ) [ ]
( )
−
−−+
++
−∆
−++=
25.075.0
75.0'
10
46.8
10
101810
/
42.1863.215
132.1log32.022.4
1
7624.11
5.12.4log
06.01log35.7log
kEDJ
DCSp
D
e
PSI
DSzW
c
dct
OR
46%
46%
3%6%
D: Thickness of The Pavement Slab S’c:Modulus of Rupture
Ec :Modulus of Elasticity k : Modulus of Subgrade reaction
Thickness of PCCModulus of ElasticityModulus of RuptureModulus of Subgrade Reaction
Note: - indicates probabilistic analysis
Impact of Construction Parameterson Performance

34
CHAPTER 4 DESCRIPTION OF SOFTWARE The methodology presented in the previous chapters is prototyped in a program. Since the general algorithms are essentially similar for both the flexible and rigid pavements, only the algorithm for the flexible pavement is demonstrated in this chapter. A user’s manual for this program can be accessed from the help file of the program. The software can be potentially used at several junctions within a project. First, it can be used during the development of project-specific specifications to outline a cost-effective quality management program by emphasizing the quality control on parameters that make the biggest impact in the life of the pavement. The engineer can utilize typical values from previous project in the area to come up with those parameters. The program can potentially be used a second time at the time that the actual construction is about to be initiated. In that matter, the actual parameters measured in the lab based on the selected mix design for the AC or PCC and the selected quarry for the base, to re-evaluate the parameters that can potentially have detrimental affect on the performance. The construction engineer at this time can also inform the design engineer whether the primary design parameters can be achieved with the selected materials. If the target moduli for the base cannot be met with the selected material, either the thickness of the layers or the quarry has to be changed. At this stage, adequate information about the variability of the subgrade materials, based on the site investigation, is also available so that the construction engineer can make an informed decision on the impact of the subgrade variability on the performance of the pavement. Finally, the program can be used by the construction engineer and the contractor during construction to fine-tune the construction. If the target variability for a parameter cannot be met based on data collected at the site during construction, the two parties can meet to determine whether the variability can be controlled better or whether the target variability is not set realistically. In that manner, an appropriate solution can be found to the problem.

35
The platform for the software is Microsoft Excel 2000. The program is also compatible with the Office 97, and Office XP. Excel is popular software that many computer users are familiar with. As such, TxDOT personnel hardly require any training to execute the algorithm. All the input parameters to the program and the resulting outputs are carried out in spreadsheets. The pertinent analyses in turn are performed using macros and other built- in tools of Excel. External modules, such as the structural model WESLEA, are linked internally to the Excel workbook. Figure 4.1a demonstrates the main worksheet of the program. This worksheet allows the user to input the average and coefficient of variation (COV) of each construction parameter. Once the inputs are provided and the analysis is performed the results window is displayed. As shown in Figure 4.1b, the results are presented in two ways. A table containing the statistical information about the performance indicators is presented first. This table contains results based on both deterministic and probabilistic analyses. In the probabilistic portion, the mean, COV and standard deviation are presented for each distress indicator. The purpose of this table is to allow the user to determine whether under the selected COVs for the construction parameters, the variability of a critical distress indicator is acceptable. If the variability for a given distress is unacceptable, the user can use the impact charts such as the one displayed in Figure 4.1b to determine which and to what level should the variability of one or more construction parameters should be adjusted. The user can reduce the variability (COV) of those parameters and rerun the analysis. This process continues until a satisfactory result is achieved. A sample exercise is presented to demonstrate this progression. Sample Case Let us assume that a three-layer pavement system is to be built with the specifications listed in Table 4.1. The means and COVs of the parameters listed in the table are arbitrary and are used to illustrate the features of the software. The design life of the pavement is 1 million ESALs. Let us also assume that the variability in the pavement performance criteria cannot exceed 25%. Given this information, the user sets up the problem by entering the values of the parameters in Table 4.1 into the program. The user then initiates the analyses so that the results shown in Table 4.2 are obtained. She/he first has to ensure that the design life (i.e. average ESALs) for all modes of failure exceeds the projected ESALs with an acceptable level of confidence. If the performance life is not adequate for any mode, thicker layers or higher quality materials should be specified until the design ESALs are greater than the projected ESALs. Note that the larger the viability in the performance is, the lower the expected ESALs that the road can carry will be. The next step consists of ensuring that the variability in remaining life is not excessive (i.e. the uniformity of the quality along the project is maintained). In this case study, the acceptable variability is defined by a COV of less than 25% for the design life obtained for each performance indicator. As reflected in Table 4.2, the COVs of three of the four performance indicators exceed 25%. As such, the construction process has to be improved. To achieve better uniformity, a two-step approach is followed. As depicted in Figure 4.2, the impact of primary design parameters (thickness and moduli) on the performance indicators is

36
Figure 4.1 – Snapshots of Input Parameters for Software
a) Main Menu (Input Screen)
b) Results Window
a) Main Menu (Input Screen)
b) Results Window
a) Main Menu (Input Screen)
b) Results Window

37
Table 4.1 - Parameters Used in Sample Case Demonstration
Value
Asphalt-Concrete Layer 5 inBase Layer 10 inDepth to Bedrock 200 in
ModulusAsphalt-Concrete Layer 500000 psiBase Layer 50000 psiSubgrade Layer 10000 psi
Aggregate Passing No.200 0.06AC Mix Air Void 0.055Asphalt Viscosity 2*10^6 poiseAsphalt Content 0.05
Maximum Dry Density 110 pcfMoisture Content 10%Optimum Moisture Content 10%Compaction 96%Aggregate Passing No.40 25%Saturation 85%Shrinkage 2%Swell 2%Percent of Clay 1%Percent of Silt 10%CBR 100
Maximum Dry Density 90 pcfMoisture Content 33%Optimum Moisture Content 25%Compaction 80%Aggregate Passing No.40 80%Saturation 100%Shrinkage 2%Swell 2%Percent of Clay 50%Percent of Silt 20%CBR 10Liquid Limit 50Plastic Index 30
10.0%10.0%
10.0%8.0%8.0%5.0%
8.0%5.0%
10.0%8.0%
5.0%
9.0%8.0%
10.0%
8.0%10.0%8.0%8.0%
10.0%8.0%5.0%
10.0%
8.0%
9.0%8.0%
COV
5.0%10.0%10.0%
Base Layer
Subgrade Layer
Construction
ParametersThickness
Design
Asphalt Layer5.0%
10.0%5.0%

38
Table 4.2 – Results of Impact Analysis No. of ESALs to Failure (106)
Method of Analysis Fatigue Cracking
Subgrade Rutting
AASHTO Failure
Criterion
AC Rutting
Deterministic 3.72 4.92 56.17 500
Mean 3.78 5.22 60.15 440 COV 17% 33% 39% 27%
Probabilistic Std.Dev 0.7 1.7 23.6 118.8
Figure 4.2 – Two Alternative Approaches for Determining Important Parameters
Select Important Construction
Parameters And Rerun Analysis
Reduce Variability of Distress Indicators
Impact of Design
Parameters on Distress Indicators
Impact of Construction Parameters on Distress
Indicators
Impact of Construction Parameters on Design
ParametersAC
Base
Subgrade
Modulus
Thickness
a) GlobalApproach
b) Layer Specific Approach
Ensure That Design Life of Distress Indicators Exceeds Projected ESALs
Select Important Construction
Parameters And Rerun Analysis
Reduce Variability of Distress Indicators
Impact of Design
Parameters on Distress Indicators
Impact of Design
Parameters on Distress Indicators
Impact of Construction Parameters on Distress
Indicators
Impact of Construction Parameters on Distress
Indicators
Impact of Construction Parameters on Design
Parameters
Impact of Construction Parameters on Design
ParametersAC
Base
Subgrade
Modulus
Thickness
a) GlobalApproach
b) Layer Specific Approach
Ensure That Design Life of Distress Indicators Exceeds Projected ESALs

39
investigated first. Depending on the level of impact of these parameters, the user can decide to reduce the variability in the performance indicators by either reducing the specified COV for the thickness or the modulus values of layers. If the user selects to control the variability in the thickness, no further investigation is needed. She/he will rerun the analysis after inputting a reduced COV for the thickness. However if she/he decides to reduce the variability in the modulus, further investigation is necessary to determine how such an improvement can be achieved. For the cases when the variability in moduli is being improved, the user can take advantage of two different impact charts for each mode of failure. She/he has the option of inspecting a global impact chart that represents the impact of all construction parameters on the performance indicator. In that manner, the construction parameters that matter the most is identified, and their specified COVs are reduced (see Figure 4.2a). These are also the parameters that should also be carefully monitored either during mixing or placing. The global impact charts are sometimes difficult to follow, since a large number of construction parameters are charted at one time. For instance, 28 construction parameters that may impact the performance of flexible pavement were identified in Chapter 3. To provide a more convenient way to study the impact of different construction parameters, the user may select to study a second set of impact charts. These charts demonstrate the relative significance of construction parameter in a layer-specific manner. The user can freely and readily explore parameters that are related to any of the pavement layers (AC, base, or subgrade) and identify in more detail the important construction parameters. For example, as shown in Figure 4.2b, the user can request the parameters that are related to the base layer. As a reminder, the term ‘impact value” in any of the impact charts is a relative value, which means that it a measure of relative importance (relative significance) to the other parameters in the chart and should be used as such. Back to the sample case, let us attempt to reduce the variability in performance due to subgrade rutting. The impact of the primary design parameters on rutting is shown in Figure 4.3a. According to that impact chart, moduli of the base and subgrade layers seem to contribute the most to the variability in the subgrade rutting life. To reduce these impact values both the global and layer specific approaches are presented. In the global approach the user will simultaneously examine the impact construction parameters for both base and subgrade layers for subgrade rutting. As indicted previously the impact chart of the global approach is divided into three folds for visual appeal. In this case since only the base and subgrade parameters are examined, the impact chart is presented twice; once to highlight the base parameters and once to highlight the subgrade parameters. From the base impact chart, the maximum dry density and degree of compaction exhibit the highest impact values and are therefore the most critical parameters of the base. In the chart that highlights the impact of subgrade, the degree of compaction and the moisture content at placement are very important. Therefore based on the global method the variability of these four parameters needs to be reduced to improve the variability of subgrade rutting. The same conclusion is reached using the layer specific method. In the case the user wishes to reduce the impact of the base and subgrade modulus, therefore the impact on the base and the impact on the subgrade are investigated separately. The first chart examined for the layer specific approach is that of the base. Two parameters impact the base most, the maximum dry density and degree of compaction. In the next chart the impact on the subgrade is presented. As with the global approach, degree of compaction and the moisture content are important. For the subgrade, the maximum moisture content also plays an important role, by controlling this parameter may be

40
difficult. The conclusion from both approaches lead to the same conclusion. That conclusion is: if the variability of the four identified parameters is reduced then the variability of rutting is reduced. The problem is resolved with the following modification: 1. The COV of maximum dry density of the base is reduced from 9% to 3% 2. The COV of compaction of the is reduced from 8% to 3% 3. The COV of compaction of the subgrade is reduced from 8% to 3% 4. The COV of moisture content of the subgrade is reduced from 8% to 3% Once the modifications are entered into the program and the analysis is performed the results presented in Table 4.3 is obtained. The COV of the pavement performance with respect to subgrade rutting is reduced to 16%, which is less than the criteria set. Also presented in the table are the results of the other performance indicators. The adjustment to the four parameters seems to also reduce the variability of the other performance indicators. This example shows that through an iterative process the variability of the performance parameters can be reduced. From this example, it is also obvious that the inspector has to place utmost care on these four parameters. The moisture content and the density of the base and subgrade should be checked frequently. On the other hand, it is not very necessary to check the thickness of the AC and base as frequently since for this condition their contribution to the performance is small. This example shows the process of using this algorithm to ensure that highway construction projects will produce durable rigid or flexible pavements that can perform satisfactorily throughout their expected design lives. It allows engineers to focus their efforts in laboratory testing, material selection, and construction techniques to provide a durable product. The will put pavement engineers one step closer to ensuring pavements performing satisfactorily throughout their design life.
Table 4.3 – Results of Impact Analysis after Modification to COV of Selected Construction Parameters
No. of ESALs to Failure (106)
Method of Analysis Fatigue Cracking
Subgrade Rutting
AASHTO Failure
Criterion AC Rutting
Deterministic 3.3 4.2 45.2 333.3
Mean 3.3 4.3 46.6 333.4
COV 9% 16% 18% 12%
Probabilistic Std.Dev 0.30 0.98 12.66 40

41
Figure 4.3 – Two Processes of Determining Significant Parameters Using Impact Charts
20%
38%
6%42%
10%0%
TAC TBS TSGCumAC CumBS CumSG
Impact of design on subgrade rutting
Impact of construction on subgrade rutting(highlighting base parameters)
Impact of construction on subgrade rutting(highlighting subgrade parameters)
Impact of construction on base
Impact of construction on subgrade
a) GlobalApproach
b) Layer specificApproach
Important Parameters
•Maximum Dry Density of Base•Compaction of Base•Optimum Moisture Content•Compaction of Subgrade•Moisture content of Subgrade
5%
50%
10%
5%4%0%
4%
3%
4% 8%
0%
2%4%
OMC MDD Com MCSat SH SW PClayPSilt P40 CBR CumACCumSG
5%
45%
20%
2%10%
0%0%0%0%0%0%0%2%3%
11%
OMC MDD Com MC SatSH SW PClay PSilt P40CBR LL PI CumAC CumBS
7%
5%
12%
7%
2%6%
1%
7% 8%
20%
26%
OMC MDD Com MC Sat SHSW PClay PSilt P40 CBR
0%0%0%0%0% 0%0%2% 4%
45%
22%
2%
24%
OMC MDD Com MC SatSH SW Pclay PSilt P40CBR LL PI
20%
38%
6%42%
10%0%
TAC TBS TSGCumAC CumBS CumSG
Impact of design on subgrade rutting
Impact of construction on subgrade rutting(highlighting base parameters)
Impact of construction on subgrade rutting(highlighting subgrade parameters)
Impact of construction on base
Impact of construction on subgrade
a) GlobalApproach
b) Layer specificApproach
Important Parameters
•Maximum Dry Density of Base•Compaction of Base•Optimum Moisture Content•Compaction of Subgrade•Moisture content of Subgrade
5%
50%
10%
5%4%0%
4%
3%
4% 8%
0%
2%4%
OMC MDD Com MCSat SH SW PClayPSilt P40 CBR CumACCumSG
5%
45%
20%
2%10%
0%0%0%0%0%0%0%2%3%
11%
OMC MDD Com MC SatSH SW PClay PSilt P40CBR LL PI CumAC CumBS
7%
5%
12%
7%
2%6%
1%
7% 8%
20%
26%
OMC MDD Com MC Sat SHSW PClay PSilt P40 CBR
0%0%0%0%0% 0%0%2% 4%
45%
22%
2%
24%
OMC MDD Com MC SatSH SW Pclay PSilt P40CBR LL PI

42
CHAPTER 5 TYPICAL SENSITIVITY ANALYSES Two sensitivity analyses were conducted with the developed algorithms to demonstrate the types of trends one can expect from the impact of the construction parameters on the performance indicators. These case studies will aid us in identifying parameters that are sensitive to performance and those that are not for this specific case study. By changing the modulus of any of the layers, the results would be significantly different (see Ke et al., 2000). Therefore, the focus of the reader should be on the process more than the actual numbers. The outcomes of the analyses from four flexible pavements will be presented first, followed by those for four rigid pavements. Flexible Pavements The focus of the sensitivity analysis for flexible pavements is on four categories of pavements typically found in Texas: Thick AC-Thick Base (e.g. interstate roads), Thick AC-Thin Base (e.g. farm-to-market roads), Thin AC-Thick Base (e.g. secondary roads) and Thin AC-Thin Base (e.g. street roads). The performance indicators are the four failure modes discussed in Chapter 3 (fatigue cracking, subgrade rutting, AC rutting, and number of ESALs to failure according to the AASHTO failure criteria). The Asphalt Institute fatigue cracking and subgrade rutting models and the so-called Finn model were used to assess the performance for the first three failure indicators. The first step in the analysis consisted of defining the typical properties for the pavement sections. Typical primary design parameters assumed for each pavement section are presented in Table 5.1. As indicated in the table, the target modulus of all four-pavement sections were set to typical design values of 500 ksi for the AC, 50 ksi for the base, and 10 ksi for the subgrade. The thicknesses of the pavement layers are the combination of 3 in. or 6 in. of AC with 6 in. or 12 in. of base. The depth to bedrock was set at 200 in. for all sections. Once the primary design parameters are defined, typical values for construction parameters that impact each of these parameters need to be defined. These values are listed in Table 5.2. The construction parameters used for the analysis were selected in a manner that the calculated moduli were close to the target moduli set in Table 5.1. The construction parameters are categorized by

43
Table 5.1 – Primary Design Parameters of Flexible Pavement Sections Pavement Type Layer Thickness (in.) Modulus (ksi)
AC 3 500 Base 6 50
Thin AC - Thin Base
Subgrade 200 10 AC 3 500 Base 6 50
Thin AC - Thick Base
Subgrade 200 10 AC 3 500 Base 6 50
Thick AC - Thin Base
Subgrade 200 10 AC 3 500 Base 6 50
Thick AC - Thick Base
Subgrade 200 10 layers. The abbreviations included in the table will be used in displaying the results of the study. The parameters are limited to those that the contractor can possibly control during the construction. To assure that each parameter is weighed equally in the analysis, a COV of 5% was assigned to all perturbed parameters. This level of variation corresponds to a well-constructed road by a careful contractor. For many parameters, achieving such a small COV is practically impossible. Once again, we emphasize that this sensitivity study is carried out to demonstrate trends. Each input parameter was simulated 500 times using the Monte Carlo technique described in Chapter 3. The results from each simulation were input into the developed algorithm and the four performance indicators were calculated. The coefficient of variation from each performance indicator was then divided by the COV of the corresponding construction parameter to develop a parameter called the “Relative Importance of the Parameter (RIOP).” The impact of each parameter on performance is classified into four categories: very significant, significant, moderately significant, and not significant. To quant ify these levels of significance subjective limits were set based on similar studies performed by Ke et al. (2000) and Meshkani et al. (2002). The levels of significant are quantified as follows: • very significant (VS): RIOP >2 • significant (S): 2 > RIOP > 1 • moderately significant (MS): 1 > RIOP > 0.5 • not significant (NS): RIOP < 0.5 The first step is to determine the level of significance of the primary design parameters (i.e. moduli and thicknesses). The relative importance of the primary design parameters is shown in Figure 5.1.

44
Table 5.2 – Construction Parameters Values Used in Flexible Pavement Case Study
The thickness of the AC layer and the moduli of the base and subgrade are significant for all four types of pavement. The thickness of the base, depending on the mode of failure may or may not be significant. The modulus of the AC is less important for thinner AC layers and is moderately important for the thicker ones. The thickness of the subgrade (depth to bedrock) has no impact at all since the rigid layer is deep. At shallower depths to bedrock, the subgrade thickness more significantly impacts the performance of the pavement.
Layer Construction Parameters Symbol ValueAggregate Passing No. 200 P200 6%Air Void Content VR 6%Asphalt Viscosity (million poise) Vis 2Asphalt Content PAC 5%Maximum Dry Density (pcf) MDD 110Moisture Content MC 10%Optimum Moisture Content OMC 10%Compaction Com 96%Aggregate Passing No. 40 P40 25%Saturation Sat 85%Shrinkage SH 2%Swell SW 2%Percent Clay PClay 1%Percent Silt PSilt 10%California Bearing Ratio CBR 100Maximum Dry Density (pcf) MDD 90Moisture Content MC 33%Optimum Moisture Content OMC 25%Compaction Com 80%Aggregate Passing No. 40 P40 80%Saturation Sat 100%Shrinkage SH 2%Swell SW 2%Percent Clay PClay 50%Percent Silt PSilt 20%California Bearing Ratio CBR 10Liquid Limit LL 50Plastic Index PI 30
Asphalt Layer
Base Layer
Subgrade Layer

45
Figure 5.1 – Sensitivity Analyses Based on Primary Design Parameters for Four Flexible Pavement Sections
0.1
1.0
10.0
100.0
TAC TBS TSG EAC EBS ESG
RIO
P
0.1
1.0
10.0
100.0
TAC TBS TSG EAC EBS ESG
RIO
P
0.1
1.0
10.0
100.0
TAC TBS TSG EAC EBS ESG
RIO
P
0.1
1.0
10.0
100.0
TAC TBS TSG EAC EBS ESG
RIO
P
Fatigue Cracking
Subgrade Rutting
AC Rutting
AASHTO Failure Criteria
a)Thin-Thin b)Thin-Thick
d)Thick-Thickc)Thick-Thin
0.1
1.0
10.0
100.0
TAC TBS TSG EAC EBS ESG
RIO
P
0.1
1.0
10.0
100.0
TAC TBS TSG EAC EBS ESG
RIO
P
0.1
1.0
10.0
100.0
TAC TBS TSG EAC EBS ESG
RIO
P
0.1
1.0
10.0
100.0
TAC TBS TSG EAC EBS ESG
RIO
P
Fatigue Cracking
Subgrade Rutting
AC Rutting
AASHTO Failure Criteria
Fatigue CrackingFatigue Cracking
Subgrade RuttingSubgrade Rutting
AC RuttingAC Rutting
AASHTO Failure CriteriaAASHTO Failure Criteria
a)Thin-Thin b)Thin-Thick
d)Thick-Thickc)Thick-Thin

46
The next step consists of determining the impact of the construction parameters on the modulus of each layer. Typical results from the thin AC-thin base pavement are shown in Figure 5.2. The figure contains three graphs each corresponding to one of the three pavement layers. For each construction parameter, the results for all four performance indicators are included. From Figure 5.2a, the performance indicators are either moderately sensitive or not sensitive to the overall performance of the pavement. The two most sensitive parameters in this case are the air void content (VR) and Asphalt content (PAC). The air void content impacts the AC rutting model the most, and the subgrade rutting model the least. The asphalt content, on the other hand, moderately impacts both the AC rutting and subgrade rutting. For the base layer, as shown in Figure 5.2b, the two most significant parameters are the variation in the maximum dry density (MDD) and the compaction effort (Com). These two parameters are very significant for all four modes of failure considered. From the figure, one should also be aware of the variability in percent clay in the base being used. The sensitivities of the thirteen construction-related subgrade parameters are shown in Figure 5.2c. Since both the AC and base layers are thin, the subgrade, which is the foundation layer, should naturally significantly contribute to the load carrying capacity of the pavement. The dominant parameters in this layer are clearly the optimum moisture content (OMC), maximum dry density (MDD), compaction effort (Com), and moisture content (MC). The liquid limit (LL) and plasticity index (PI) should also be controlled. A number of other subgrade parameters also play a role in the uniformity of the performance. This case clearly demonstrates that for thin pavements, most of the effort should be concentrated towards inspecting the subgrade. From practical stand point, a number of parameters that cannot be controlled by the contractor for the subgrade also contribute to the performance. In this case, the construction engineer and design engineer should be aware that the variability in the performance is inevitable and should consider it in their design. The impact of construction parameters for the other three types of flexible pavements (i.e. thick AC-thick Base, thick AC-thin base and thin AC-thick base) are shown in Figures 5.3 through 5.5. As the thickness of the layers vary and for different modes of failure, the significance of parameters varies. Instead of discussing each case one by one, it would be more beneficial to summarize the sensitivity of the parameters in tables. Tables 5.3 through 5.6 contain these summaries for the four modes of failures considered. For the fatigue cracking mode of failure, as shown in Table 5.3, the variability in performance can be reduced by decreasing the variability in the AC content. For thick AC layers, it is prudent to also require a reasonably uniform air voids for the mat. For the base layer in this mode of failure, a number of parameters that can be controlled should be considered, especially when the base becomes thick. The most significant parameters consist of maintaining the density and ensuring that the degree of compaction specified is consistently achieved. From Table 5.3, as the pavement layers (combination of AC and base) become thicker, the significance of subgrade parameters diminishes. For the subgrade rutting mode of failure, as shown in Figure 5.4, the trends are more or less similar to those of fatigue cracking. A subtle difference between the trends observed for the two modes of

47
Figure 5.2 – Sensitivity Analyses Results of Thin-Thin Pavement Sections
Fatigue Cracking
Subgrade Rutting
AC Rutting
AASHTO Failure Criterion
0.1
1.0
10.0
P200 VR Vis PAC EAC
RIO
Pa) AC Construction Parameters
0.1
1.0
10.0
100.0
OMCMDD
Com MC Sat
SH SWPC
lay PSilt
P40CBR EB
S
RIO
P
b) Base Construction Parameters
0.1
1.0
10.0
100.0
OMCMDD
Com MC Sat
SH SWPC
lay PSilt P40
CBR LL PIESG
RIO
P
c) Subgrade Construction Parameters
Fatigue Cracking
Subgrade Rutting
AC Rutting
AASHTO Failure Criterion
Fatigue CrackingFatigue Cracking
Subgrade RuttingSubgrade Rutting
AC RuttingAC Rutting
AASHTO Failure Criterion
0.1
1.0
10.0
P200 VR Vis PAC EAC
RIO
Pa) AC Construction Parameters
0.1
1.0
10.0
100.0
OMCMDD
Com MC Sat
SH SWPC
lay PSilt
P40CBR EB
S
RIO
P
b) Base Construction Parameters
0.1
1.0
10.0
100.0
OMCMDD
Com MC Sat
SH SWPC
lay PSilt P40
CBR LL PIESG
RIO
P
c) Subgrade Construction Parameters
0.1
1.0
10.0
100.0
OMCMDD
Com MC Sat
SH SWPC
lay PSilt P40
CBR LL PIESG
RIO
P
c) Subgrade Construction Parametersc) Subgrade Construction Parameters

48
Figure 5.3 – Sensitivity Analyses Results of Thin-Thick Pavement Sections
0.1
1.0
10.0
100.0
OMCMDD
Com MC Sat
SH SWPClay PSil
tP40
CBR LL PIESG
RIO
P
0.1
1.0
10.0
P200 VR Vis PAC EAC
RIO
P
0.1
1.0
10.0
100.0
OMCMDD Com MC Sa
tSH SW
PClay PSil
tP40
CBREB
S
RIO
P
b) Base Construction Parameters
a) AC Construction Parameters
c) Subgrade Construction Parameters
Fatigue Cracking
Subgrade Rutting
AC Rutting
AASHTO Failure Criterion
0.1
1.0
10.0
100.0
OMCMDD
Com MC Sat
SH SWPClay PSil
tP40
CBR LL PIESG
RIO
P
0.1
1.0
10.0
P200 VR Vis PAC EAC
RIO
P
0.1
1.0
10.0
100.0
OMCMDD Com MC Sa
tSH SW
PClay PSil
tP40
CBREB
S
RIO
P
b) Base Construction Parameters
a) AC Construction Parameters
c) Subgrade Construction Parameters
Fatigue Cracking
Subgrade Rutting
AC Rutting
AASHTO Failure Criterion
Fatigue CrackingFatigue Cracking
Subgrade RuttingSubgrade Rutting
AC RuttingAC Rutting
AASHTO Failure Criterion

49
Figure 5.4 – Sensitivity Analyses Results of Thick-Thin Pavement Sections
0.1
1.0
10.0
100.0
OMCMDD
Com MC Sat
SH SWPC
lay PSilt P40
CBR LL PIESG
RIO
P
0.1
1.0
10.0
P200 VR Vis PAC EAC
RIO
P
0.1
1.0
10.0
100.0
OMCMDD
Com MC Sat
SH SWPC
lay PSilt P40
CBREB
S
RIO
P
Fatigue Cracking
Subgrade Rutting
AC Rutting
AASHTO Failure Criterion
b) Base Construction Parameters
a) AC Construction Parameters
c) Subgrade Construction Parameters
0.1
1.0
10.0
100.0
OMCMDD
Com MC Sat
SH SWPC
lay PSilt P40
CBR LL PIESG
RIO
P
0.1
1.0
10.0
P200 VR Vis PAC EAC
RIO
P
0.1
1.0
10.0
100.0
OMCMDD
Com MC Sat
SH SWPC
lay PSilt P40
CBREB
S
RIO
P
Fatigue Cracking
Subgrade Rutting
AC Rutting
AASHTO Failure Criterion
Fatigue CrackingFatigue Cracking
Subgrade RuttingSubgrade Rutting
AC RuttingAC Rutting
AASHTO Failure Criterion
b) Base Construction Parameters
a) AC Construction Parameters
c) Subgrade Construction Parameters

50
Figure 5.5 – Sensitivity Analyses Results of Thick-Thick Pavement Sections
0.1
1.0
10.0
100.0
OMCM
DDCom MC Sa
tSH SW
PClay PS
ilt P40CBR LL PI
ESG
RIO
P
0.1
1.0
10.0
P200 VR Vis PAC EAC
RIO
P
0.1
1.0
10.0
100.0
OMCMDD
Com MC Sat
SH SWPC
lay PSilt P40
CBREB
S
RIO
P
b) Base Construction Parameters
a) AC Construction Parameters
c) Subgrade Construction Parameters
Fatigue Cracking
Subgrade Rutting
AC Rutting
AASHTO Failure Criterion
0.1
1.0
10.0
100.0
OMCM
DDCom MC Sa
tSH SW
PClay PS
ilt P40CBR LL PI
ESG
RIO
P
0.1
1.0
10.0
P200 VR Vis PAC EAC
RIO
P
0.1
1.0
10.0
100.0
OMCMDD
Com MC Sat
SH SWPC
lay PSilt P40
CBREB
S
RIO
P
b) Base Construction Parameters
a) AC Construction Parameters
c) Subgrade Construction Parameters
Fatigue Cracking
Subgrade Rutting
AC Rutting
AASHTO Failure Criterion
Fatigue CrackingFatigue Cracking
Subgrade RuttingSubgrade Rutting
AC RuttingAC Rutting
AASHTO Failure Criterion
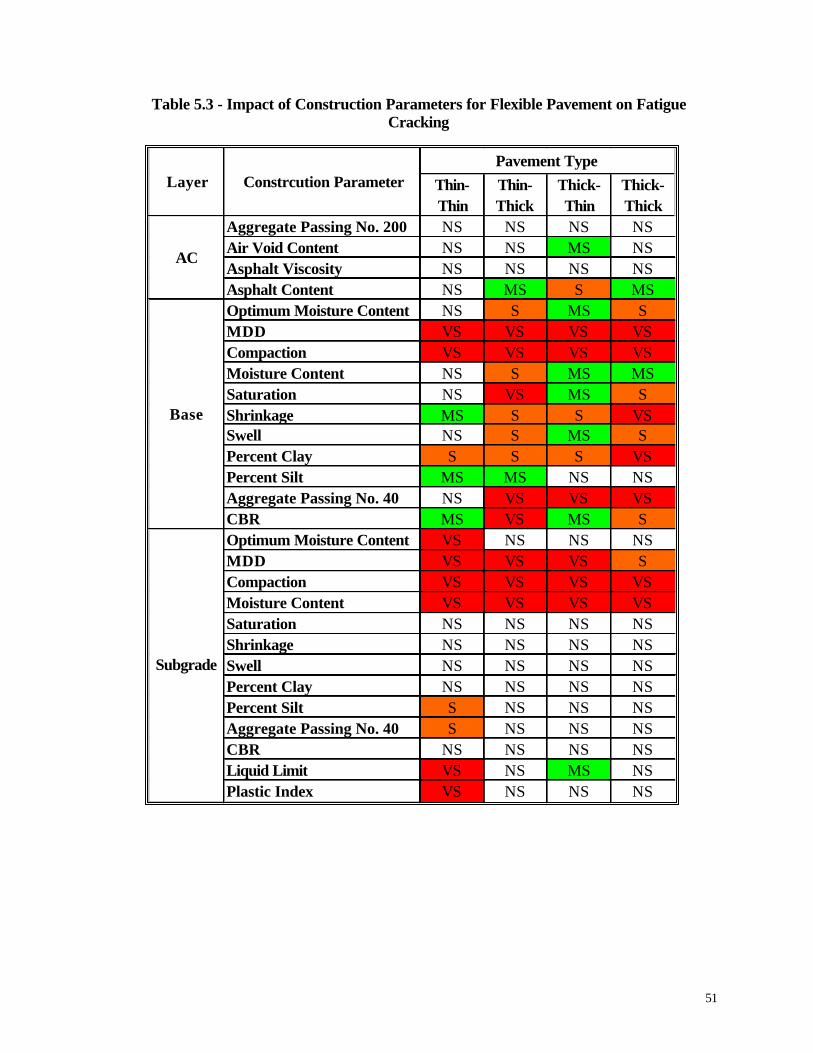
51
Table 5.3 - Impact of Construction Parameters for Flexible Pavement on Fatigue Cracking
Thin-Thin
Thin-Thick
Thick-Thin
Thick-Thick
Aggregate Passing No. 200 NS NS NS NSAir Void Content NS NS MS NSAsphalt Viscosity NS NS NS NSAsphalt Content NS MS S MSOptimum Moisture Content NS S MS SMDD VS VS VS VSCompaction VS VS VS VSMoisture Content NS S MS MSSaturation NS VS MS SShrinkage MS S S VSSwell NS S MS SPercent Clay S S S VSPercent Silt MS MS NS NSAggregate Passing No. 40 NS VS VS VSCBR MS VS MS SOptimum Moisture Content VS NS NS NSMDD VS VS VS SCompaction VS VS VS VSMoisture Content VS VS VS VSSaturation NS NS NS NSShrinkage NS NS NS NSSwell NS NS NS NSPercent Clay NS NS NS NSPercent Silt S NS NS NSAggregate Passing No. 40 S NS NS NSCBR NS NS NS NSLiquid Limit VS NS MS NSPlastic Index VS NS NS NS
Pavement Type
AC
Base
Subgrade
Constrcution ParameterLayer

52
Table 5.4 - Impact of Construction Parameters for Flexible Pavement on Subgrade Rutting
Thin-Thin
Thin-Thick
Thick-Thin
Thick-Thick
Aggregate Passing No. 200 NS NS NS NSAir Void Content NS NS MS MSAsphalt Viscosity NS NS MS NSAsphalt Content NS MS S SOptimum Moisture Content NS S NS MSMDD VS VS S VSCompaction VS VS VS VSMoisture Content NS S NS MSSaturation NS S NS SShrinkage NS S MS SSwell NS S NS MSPercent Clay MS S MS VSPercent Silt NS MS NS NSAggregate Passing No. 40 NS VS MS VSCBR NS S NS SOptimum Moisture Content VS VS S SMDD VS VS VS VSCompaction VS VS VS VSMoisture Content VS VS VS VSSaturation NS NS NS NSShrinkage NS NS NS NSSwell NS NS NS NSPercent Clay NS NS NS NSPercent Silt MS NS NS NSAggregate Passing No. 40 S MS MS SCBR SN NS NS NSLiquid Limit VS VS VS VSPlastic Index VS VS VS S
Base
Subgrade
Layer Constrcution ParameterPavement Type
AC

53
Table 5.5 - Impact of Construction Parameters for Flexible Pavement on AC Rutting
Thin-Thin
Thin-Thick
Thick-Thin
Thick-Thick
Aggregate Passing No. 200 NS NS NS NSAir Void Content NS NS NS NSAsphalt Viscosity NS NS NS NSAsphalt Content MS NS NS NSOptimum Moisture Content NS S NS NSMDD VS VS S MSCompaction VS VS S SMoisture Content NS S NS NSSaturation NS VS NS NSShrinkage MS S NS NSSwell NS VS NS NSPercent Clay S S NS NSPercent Silt MS MS NS NSAggregate Passing No. 40 VS MS MSCBR MS VS NS NSOptimum Moisture Content VS S NS NSMDD VS VS S SCompaction VS VS S SMoisture Content VS VS S SSaturation NS NS NS NSShrinkage NS NS NS NSSwell NS NS NS NSPercent Clay NS NS NS NSPercent Silt S NS NS NSAggregate Passing No. 40 VS NS NS NSCBR NS NS NS NSLiquid Limit VS VS NS NSPlastic Index VS S NS NS
Pavement Type
AC
Layer Constrcution Parameter
Base
Subgrade

54
Table 5.6 - Impact of Construction Parameters for Flexible Pavement on AASHTO Failure Criteria
Thin-Thin
Thin-Thick
Thick-Thin
Thick-Thick
Aggregate Passing No. 200 NS NS NS NSAir Void Content MS MS MS MSAsphalt Viscosity NS NS MS NSAsphalt Content MS S S SOptimum Moisture Content MS VS S VSMDD VS VS VS VSCompaction VS VS VS VSMoisture Content MS VS MS SSaturation NS VS S VSShrinkage S VS VS VSSwell MS VS S VSPercent Clay VS VS VS VSPercent Silt S S MS MSAggregate Passing No. 40 NS VS VS VSCBR S VS S VSOptimum Moisture Content VS S S SMDD VS VS VS VSCompaction VS VS VS VSMoisture Content VS VS VS VSSaturation NS NS NS NSShrinkage NS NS NS NSSwell NS NS NS NSPercent Clay NS NS NS NSPercent Silt VS NS NS NSAggregate Passing No. 40 VS MS MS SCBR NS NS NS NSLiquid Limit VS VS VS VSPlastic Index VS VS VS S
Base
Subgrade
Layer Constrcution ParameterPavement Type
AC

55
failures exists. For rutting mode, the base construction parameters play smaller role and the subgrade parameters play a greater role. Ironically, as shown in Figure 5.5, for the failure mode due to rutting in the AC layer, the base parameters play a more predominant role in contributing to variability in the base than the AC layer itself. Since the rutting in the AC layer is related to the compressive strain at the bottom of the base this observation is logical. The construction parameters related to the subgrade only play a role when the AC layers are thin. If the design is based on the AASHTO design guide, a significant number of parameters have to be considered as very sensitive. This can be attributed to the empirical and statistical nature of the equations and the conservatism built into determining structural numbers. Rigid Pavements The sensitivity study for rigid pavements was carried out using both the CRCP algorithm and the AASHTO 1993 design equation. The parameters considered in the analysis with the CRCP8 and the typical values considered for them are included in Table 5.7. About a dozen parameters are considered. The sensitivity analyses were performed for four slab thicknesses of 8 in., 10 in., 12 in. and 14 in. Five distress indicators were considered. As indicated before, these indicators consist of mean crack spacing, crack width, steel stress, bond development and failure per mile. The values of the relative importance of parameters (RIOP) of different input parameters for the five distress indicators are shown in Figure 5.6. Variability in the modulus of subgrade reaction (MSG) and yield strength of steel do not seem to induce any variability in any of the four slab thicknesses considered. For slabs thicker than 10 in., the drying/shrinkage properties (DS) and concrete flexural strength (CFS) also do not impact the performance of the concrete. For slabs thicker than 12 in., only three parameters (percent reinforcement, PR, bar diameter, BD, and elastic modulus of concrete, EMS) should be of concern. Perhaps one of the reasons that so many parameters are not impacting the variability of performance indicator may be due to practical limits imposed in the CRCP8 to ensure reasonable design. The most critical distress parameter is perhaps failure per mile of road. As reflected in Figure 5.6, depending on the thickness of the slab, the parameters that impact the number of failures per mile vary. For an 8-in.-thick slab (Figure 5.6a), the variability in the thickness of the slab (ST), the tensile strength (CTS) and flexural strengths of concrete (CFS) significantly impact the variability in the distress indicator. For the 10 in. slab (Figure 5.6b), only the variability in the thickness of the slab seems to impact the variability in the number of distresses per mile. For the 12 in. and 14 in. thick slabs (Figures 5.6c and 5.6d), the number of failures per mile is not impacted by any of the eleven construction parameters that are selected. Again, the practical limits imposed on the distress indicators may be the reason for this matter.

56
Table 5.7 - Construction Parameters Values Used in Rigid Pavement Case Study
The results from all thicknesses and for all five distress indicators are summarized in Table 5.8. The variability in the mean crack spacing and crack width seems to be controlled by the variability in the percent reinforcement (PR) in the cross section, elastic modulus of concrete (CEM) and the tensile strength of concrete (CTS). For a 10 in. slab, the thickness of the slab (ST) also plays a role; while for other three slab thicknesses, it does not play a major role. The variability in steel stress at crack is somewhat impacted by the tensile strength of the concrete (CTS) and the percent reinforcement (PR). Finally, the bond development is moderately impacted by the tensile strength of concrete (CTS) and bar diameter (BD). Based on this study, it seems that CRCP-9 or CRCP-10 maybe a better candidate for incorporation in this type of analysis. Since those two programs are more mechanistic, the distress models are better developed and seem to be better related to the distress indicators. Alternatively, the hard design limits imposed on the CRCP-8 can be relaxed to allow a more representative variability analysis. The sensitivity analyses based on the AASHTO model are presented in Figure 5.7. The stress indicator in this case is the number of ESALs to failure (W18). In the figure, the PPRI values for all four-pavement thicknesses and for the construction parameters indicated in Table 5.7 are included. The two significant construction parameters that impact the distress indicator seem to be the slab thickness (ST) and the concrete flexural strength (CFS). The modulus of concrete (CEM) and the modulus of subgrade reaction (MSR) seem to have little or no impact on the variability in the distress indicators.
Model Design and Construction Parameters Symbol Value
Slab Thickness (in.) ST 8, 10, 12 &14
Elastic Modulus of Steel (ksi) EMS 37000
Modulus of Subgrade Reaction (pci) MSR 300
Percent Reinforcement PR 0.4
Bar Diameter (in.) BD 0.625
Yield Stress of Steel (ksi) YS 60
Concrete Elastic Modulus of Concrete (ksi) CEM 5000
Drying Shrinkage DS 0.000195
Concrete Tensile Strength (psi) CTS 500
Concrete Compressive Strength (psi) CCS 5000
Concrete Flexural Strength (psi) CFS 580Slab Thickness (in.) ST 8, 10, 12 &14Concrete Flexural Strength (psi) CFS 580Concrete Elastic Modulus (ksi) CEM 5000Modulus of SubgradeReaction (pci) MSR 300
CRCP
AASHTO

57
Figure 5.6 – Sensitivity Analysis Results of Rigid Pavement Based on CRCP-8
0.1
1.0
10.0
STEMS
MSR PR BD YS
CEM DSCTS CCS
CFS
Construction Parameters
RIO
P0.1
1.0
10.0
STEM
SM
SR PR BD YSCEM DS
CTS CCSCFS
Construction Parameters
RIO
P
0.1
1.0
10.0
STEMS
MSR PR BD YSCEM DS
CTSCCS
CFS
Construction Parameters
RIO
P
0.1
1.0
10.0
100.0
STEMS
MSR PR BD YSCEM DS
CTS CCSCFS
Construction Parameters
RIO
P
c) 12 in. slab d) 14 in. slab
a) 8 in. slab b) 10 in. slab
Mean Crack Spacing Crack Width Steel Stress at A Crack
Bond Deviation Length Failure Per Mile
0.1
1.0
10.0
STEMS
MSR PR BD YS
CEM DSCTS CCS
CFS
Construction Parameters
RIO
P0.1
1.0
10.0
STEM
SM
SR PR BD YSCEM DS
CTS CCSCFS
Construction Parameters
RIO
P
0.1
1.0
10.0
STEMS
MSR PR BD YSCEM DS
CTSCCS
CFS
Construction Parameters
RIO
P
0.1
1.0
10.0
100.0
STEMS
MSR PR BD YSCEM DS
CTS CCSCFS
Construction Parameters
RIO
P
c) 12 in. slab d) 14 in. slab
a) 8 in. slab b) 10 in. slab
Mean Crack Spacing Crack Width Steel Stress at A Crack
Bond Deviation Length Failure Per Mile

58
Table 5.8 - Impact of Construction Parameter for Rigid Pavement Based on CRCP-8
The Mean Crack Spacing
(ft)
The Crack Width (in)
The Steel Stress at A Crack (psi)
The Bond Development Length (in)
Failure Per Mile (ESALs)
Slab Thickness NS NS NS NS VSElastic Modulus of Steel NS NS NS NS NSModulus of Subgrade NS NS NS NS NSPercent Reinforcement MS MS MS MS NSBar Diameter NS NS NS MS NSYield Stress NS NS NS NS NSElastic Modulus of Concrete MS MS NS NS NSDrying Shrinkage NS NS NS NS NSTensile Strength S S MS MS VSCompress Strength NS NS NS NS NSConcrete Flexural Strength NS NS NS NS VSSlab Thickness S S MS MS SElastic Modulus of Steel NS NS NS NS NSModulus of Subgrade NS NS NS NS NSPercent Reinforcement MS MS NS NS NSBar Diameter NS NS NS MS NSYield Stress NS NS NS NS NSElastic Modulus of Concrete NS NS NS NS NSDrying Shrinkage NS NS NS NS NSTensile Strength S S MS MS NSCompress Strength NS NS NS NS NSConcrete Flexural Strength NS NS NS NS NSSlab Thickness NS NS NS NS NSElastic Modulus of Steel NS NS NS NS NSModulus of Subgrade NS NS NS NS NSPercent Reinforcement S S S S NSBar Diameter NS NS NS MS NSYield Stress NS NS NS NS NSElastic Modulus of Concrete S S NS NS NSDrying Shrinkage NS NS NS NS NSTensile Strength NS NS NS NS NSCompress Strength NS NS NS NS NSConcrete Flexural Strength NS NS NS NS NSSlab Thickness NS NS NS NS NSElastic Modulus of Steel NS NS SN NS NSModulus of Subgrade NS NS NS NS NSPercent Reinforcement S S MS MS NSBar Diameter NS NS NS MS NSYield Stress NS NS NS NS NSElastic Modulus of Concrete S S NS NS NSDrying Shrinkage NS NS NS NS NSTensile Strength NS NS NS NS NSCompress Strength NS NS NS NS NSConcrete Flexural Strength NS NS NS NS NS
14 in
. Sla
bParameters
8 in
. Sla
b10
in. S
lab
12 in
. Sla
b

59
Figure 5.7 – Sensitivity Analysis Results of Rigid Pavement (AASHTO Equation)
0.01
0.10
1.00
10.00
ST CFS CEM MSR
Program Parameters
RIO
P
8 in Slab 10 in Slab 12 in Slab 14 in Slab

60
CHAPTER 6 CLOSURE Summary Pavements are designed and built to withstand a specified number of traffic loads. If however, the pavement is not constructed to certain specifications it may fail prematurely. The goal of performance-based quality management is to ensure that the modulus, strength and thickness of the pavement throughout the project are similar to the specified design values with a small variation. In this study, analytical tools have been developed to assist the construction engineer in identifying the parameters that most impact the performance of a project under consideration and guide her/him in reducing the variability associated with them. An algorithm that in a rational manner reconciles the results from existing pavement-performance models used in the state of practice, with systematic statistical process control techniques and uncertainty analys is methods has been developed. The algorithm carefully cons iders the fact that relevant construction processes and parameters are different for different types of pavements (rigid vs. flexible) and for different pavement cross-sections. This report summarizes the logic and steps taken to develop the algorithm. The outcome of the project so far has been a software package developed in Excel that identifies the impact of construction parameters on performance indicators for both flexible and rigid pavement. A combination of two probabilistic techniques, Monte Carlo simulation and two point mass methods were used to assess the impact of construction and design parameters on pavement performance. This algorithm allows users to optimize construction quality for a specific pavement. A sensitivity analysis was conducted to primarily identify the relative importance of construction parameters on performance indicators. Based on the results of this study further research will conducted to determine means to measure and control relevant construction parameters.

61
Recommendations This study is an initial step toward a performance based specifications and can be used as an optimization tool in construction quality management. The recommendations for improvements of the algorithm and for future work are as follows:
1. Demonstrating the application of this algorithm using actual case studies.
2. Investigate the use of other types of distribution such as lognormal distribution. Currently the program uses normal distribution for all construction parameters.
3. Expand the flexible pavement algorithm to handle multiple layers. At this time the
program handles a three- layer system
4. Research the impact of eliminating insensitive parameters to speed up processing time.
5. Investigate the feasibility of adopting the AASHTO 2002 Design models into program. Since the program is a prototype and is under development, it can further be optimized for speed. This can be accomplished by using more sophisticated probabilistic techniques that require less simulation, or utilizing programming languages, such as C++, for calculations instead of Excel.

62
REFERENCES • Ayres M. Jr. and Witczak M.W., (1998), “AYMA – A Mechanistic Probabilistic System to
Evaluate Flexible Pavement Performance,” presented in Transportation Transportation Research Board 77th Annual Meeting Washington, DC.
• Barksdale, R.D., Alba, J., Khosla, P.N., Kim, R., Lambe, P.C. and Rahman, M.S. (1997)
“Laboratory Determination of Resilient Modulus for Flexible Pavement Design,” NCHRP Web Document 14, Federal Highway Administration, Washington, D.C., 486p.
• Daleiden, Jerome F., Brian M. Killingsworth, Amy L. Simpson, and Richard A. Zamora (1994),
“Analysis of Procedures for Establishing In Situ Subgrade Moduli”, Transportation Research Record 1462, Washington, D.C., pp. 102-107.
• Dossey, Terry, Steve Easley, and B. Frank McCullough (1996), “Methodology for Estimating
Remaining Life of Continuously Reinforced Concrete Pavements”, Transportation Research Record 1525, Washington, D.C., pp. 83-90.
• Hardin, B. O. and Drnevich, V. P. (1972), “Shear Modulus and Damping in Soils: Design
Equations and Curves,’ Journal of Soil Mechanics and Foundations Division, ASCE, Vol. 98, No. SM7, New York, NY, pp. 667-692.
• Hoerner, T.E. and Darter, M.I., (2000), Improved Prediction Models for PCC Pavement
Performance-Related Specifications, Volume II: PaveSpec 3.0 User's Guide,” ERES Consultants (Adivision of Applied Research Associates, Inc.), 505 W. University Avenue, Champaign, IL 61820-3915.
• Huang, Y. H., (1993), “Pavement Analysis and Design”, Prentice Hall, Englewood Cliffs, New
Jersey 07632.

63
• Joint Departments of the Army and Air Force, (1994), “Pavement Design for Roads, Streets, and Open Storage Areas, Elastic Layered Method,” TM 5-822-13/AFJMAN 32-1018, October 24, 1994.
• Ke, L., (1999), “Feasibility of Incorporating Seismic moduli in Pavement Design and Analysis,”
Masters Thesis, The University of Texas at El Paso. • Ke, L., Nazarian, S., Abdallah, I., and Yuan, D., (2000), “A Sensitivity Study of Parameters
Involved in Design with Seismic Moduli,” Research Report 1780-2, Center for Highway Materials Research, the University of Texas at El Paso.
• Khazanovich, L. and Gotlif, A., (2002), “ISLAB2000 Simplified Friction Model,” Presented at
Transportation Research Board Annual Meeting, January 13–17, 2002 Washington, D.C. • Long Term Pavement Performance, (1998), “Rigid Design Software: A new Tool for Improved
Rigid Pavement Design” Federal Highway Administration, Research, Development, and Technology, Turner-Fairbank Highway Research Center, 6300 Georgetown Pike • McLean, VA 22101.
• Meshkani, A., Abdallah, I., and Nazarian, S., (2002), “Determination of Nonlinear Parameters
of Flexible Pavement Layers from Nondestructive Testing,” Research Report 1780-3, Center for Highway Materials Research, the University of Texas at El Paso.
• Mohammad, Louay N., Baoshan Huang, Anand J. Puppala, and Aaron Allen (1999),
“Regression Model for Resilient Modulus of Subgrade Soils”, Transportation Research Record 1687, Washington, D.C., pp. 47-54.
• Patel A.J. and Thompson, M.R., (1998), “Consideration and Characterization of Pavement
Construction Variability,” presented in Transportation Research Board 77th Annual Meeting Washington, DC.
• Puskorius, G. and Feldkamp, L., (1991), "Decoupled Extended Kalman Filter Training of
Feedforward Layered Networks", Proceedings of the International Joint Conference on Neural Networks, IEEE.
• Rasmussen, R.O., Ruiz, J.M., Rozycki, D.K. and McCullough B.F., (2002) Constructing High
Performance Concrete Pavements using the FHWA HIPERPAV Systems Analysis Software,” Presented at Transportation Research Board Annual Meeting, January 13–17, 2002 Washington, D.C.
• Santha, B.L. (1994), “Resilient Modulus of Subgrade Soils: Comparison of Two Constitutive
Equations,” Transportation Research Record 1462, Washington D.C., pp. 79-90. • Scholz, T.V., and Seeds, S.B., (2001), Development of a Prototype Performance-Related
Specification for Hot-Mix Asphalt Pavement Construction,” Presented at Transportation Research Board 80th Annual Meeting, January 7-11, 2001 Washington, D.C.

64
• Smith, R.E. and Vlatas, D.A., (1989), “Implications of Life-Cycle Performance Specifications,” Transportation Research Record no1215, pp. 25-30.
• Stokoe K.H., II, Hudson, W.R. and Miner, B.F. (1991), “The Falling Weight Deflectometer and
Spectral Analysis of Surface Waves Test for Characterizing Pavement Moduli: A Case Study,” Research Report 1123-7F, Center for Transportation Research, the University of Texas at Austin, pp. 3-25.
• Tayabji S.D. and Colley, B.E., (1983), “Improved Rigid Pavement Joints”, Transportation
Research Record no930, pp. 69-78. • Thompson, Marshall R., Erol Tutumluer, Manuel Bejarano (1998), “Granular Material and Soil
Moduli Review of the Literature”, Center of Excellence for Airport Pavement Research Report #1, Department of Civil Engineering at the University of Illinois at Urbania-Champaign, Urbania, Illinois.
• Van Cauwelaert, F. J., Alexander, D. R., White, T. D., and Baker, W. R. (1989). “Multilayer
Elastic Program for Backcalculating Layer Moduli in Pavement Evaluation,” ASTM, STP 1026, Philadelphia, PA, pp.171-188.
• Weed, R.M., (1998), “ A Rational Method for Relating As-Built Quality to Pavement
Performance and Value, ” presented in Transportation Transportation Research Board 77th Annual Meeting Washington, DC., pp. 32-39.
• Weed, Richard M. (1999a), “Method to Model Performance Relationships and Pay Schedules”,
Transportation Research Board Record, Washington D.C. • Weed, Richard M. (1999b), “Practical Framework for Performance-Related Specifications”,
Transportation Research Record 1654, TRB, National Research Council, Washington D.C., pp. 81-87.
• Zhang Z., Fowler, D.W., Hudson, W.R. and Ceballos, R., (2002), “Development of a
Methodology to Determine the Appropriate Minimum Testing Frequencies for a Construction and Maintenance of Highway infrastructure,” Research Report 1781-1, Center for Transportation Research, The University of Texas at Austin.