tetra recart soup lca2014 · why life cycle assessment? ever-increasing demand and need for...
TRANSCRIPT

Life Cycle Assessment of Tetra Recart
Cartons and Alternative Soup
Containers on the U.S. MarketJuly 2014
Presentation Overview
1. LCA Methodology
2. Soup Packaging LCA Goal & Scope
3. Soup Packaging LCA Results
� Ready to serve soup packaging
� Condensed soup packaging
4. Key takeaway messages
2

Soup Packaging LCA Conducted by
Franklin Associates, a Division of ERG
Franklin Associates
� Founded by original developers of LCI
methodology in the U.S.
� Continuous LCA practice for 40 years
� Instrumental in development of U.S. LCI Database;
provided many key data sets (fuels, transport,
resins and precursors)
� Extensive private database for U.S. processes and
materials
3
Why Life Cycle Assessment?
� Ever-increasing demand and need for environmental
information for sound decision-making
� Qualitative characteristics alone are not a sufficient
basis for informed decision - need a quantified
assessment of their effect on environmental profile
� LCA provides comprehensive set of quantified metrics
– environmental “nutrition” label
� LCA identifies main contributors to environmental
impacts for focusing improvement efforts
4

ISO Standards for LCA
Fundamental LCA guidance documents:
– ISO 14040: Principles and framework
– ISO 14044: Requirements and guidelines
ISO 14040 definition: LCA is the “compilation
and evaluation of the inputs, outputs and the
potential environmental impacts of a product
system throughout its life cycle.”
ISO = International Organization for Standardization
5

1. Goal and scope
definition
2. Inventory
analysis (LCI)
3. Impact
assessment (LCIA)
4. Interpretation
Direct application:
• Product development
and improvement
• Strategic planning
• Public policy making
• Marketing
• Other
Source: ISO 140406
Phases of an LCAFour different phases of LCA are distinguished:

Life Cycle Inventory
� Quantified inventory of flows to/from the
environment for each system studied:
– Raw materials, including water
– Energy use (non-renewable and renewable)
– Solid wastes
– Atmospheric emissions
– Waterborne emissions
� Can draw some conclusions from LCI, but
emissions results can be difficult to interpret –
many diverse emissions, mixed results
7
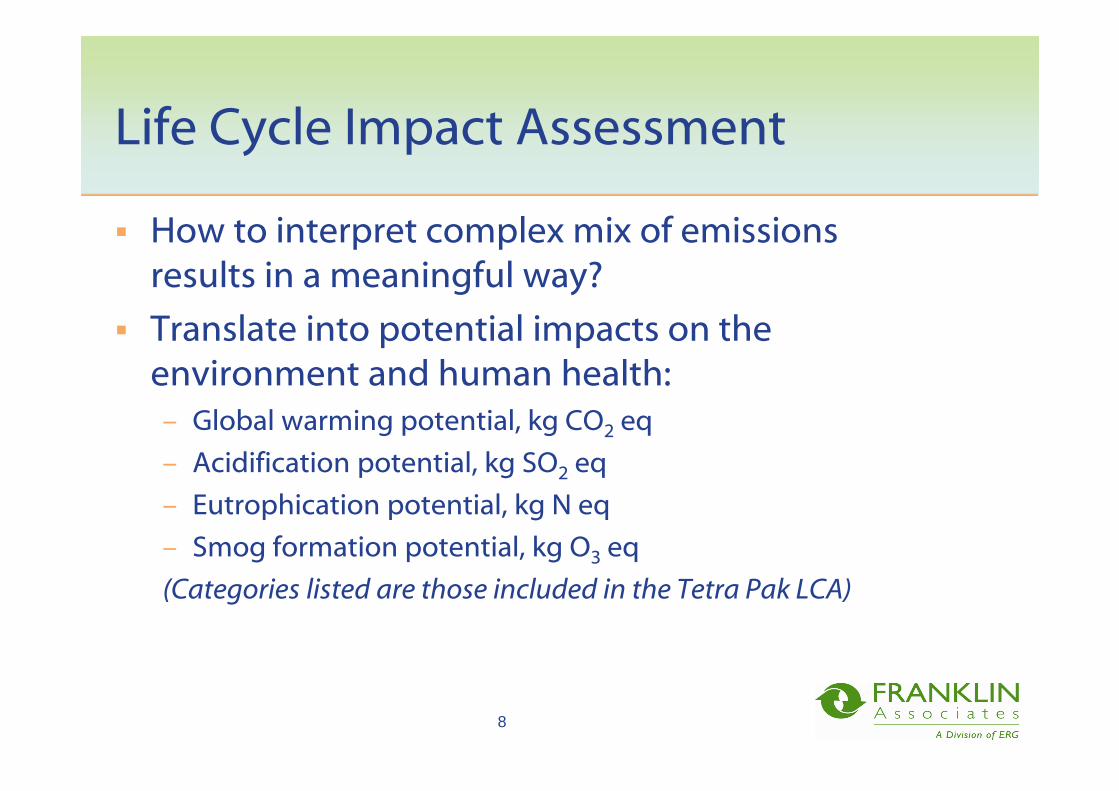
Life Cycle Impact Assessment
� How to interpret complex mix of emissions
results in a meaningful way?
� Translate into potential impacts on the
environment and human health:
– Global warming potential, kg CO2 eq
– Acidification potential, kg SO2 eq
– Eutrophication potential, kg N eq
– Smog formation potential, kg O3 eq
(Categories listed are those included in the Tetra Pak LCA)
8

Global Warming Potential
9
� Metric describing the potential to contribute to increases in the average temperature of the Earth’s surface, caused by emissions of greenhouse gases
� Example air emissions: carbon dioxide,methane, nitrous oxide
� Expressed as kg CO2 equivalents

Acidification Potential
� Accumulation of acidifying substances (SO2, NOx) in the water particles suspended in the atmosphere ('acid rain')
� Deposited onto the ground by rains, these acidifying pollutants have a wide variety of adverse impact on soil, organisms, ecosystems and materials (buildings)
� Expressed as kg SO2 eq
10

Eutrophication Potential
11
� The release of nutrients (phosphorus, nitrogen, BOD) to the aquatic and the terrestrial environment which can lead to a decrease in the oxygen content
� This impacts flora and fauna, and disturbs the ecosystems
� Expressed as kg N equivalents

Smog Formation Potential
12
� Smog formation is the photochemical creation of reactive substances (mainly ozone) which affect human health and ecosystems
� This ground-level ozone is formed in the atmosphere by nitrogen oxides (NOx) and volatile organic compounds (VOCs) in the presence of sunlight
� Expressed as kg O3 equivalents

Soup Packaging LCA
Goal & Scope

Study Goal
� Provide Tetra Pak with life cycle impacts of Tetra Recart
(TRC) cartons on the U.S. market compared to alternative
soup packaging
� Containers evaluated in the LCA:
– Ready-to-serve (RTS) soup:
• 500 ml TRC compared to 18.6 oz (550 ml) steel can, 14.5 oz (429 ml) steel
can, 500 ml laminate pouch
– Condensed soup:
• 340 ml TRC compared to 10.75 oz (318 ml) steel can
14

Functional Unit
� Containers within each category (RTS or condensed) are
compared on a functional equivalence basis of 1,000 liters
of prepared soup
� Condensed soup diluted 1:1 with water, so 500 liters of
packaged condensed soup per 1,000 liters of prepared
soup
� No comparisons made between RTS and condensed soup
packaging systems
15

System Boundaries
16
Raw Material
Extraction
Material
Production
Converting
Filling
T
Retail
T
Consumer Use
End-of Life
Disposal Recycling
Secondary
Packaging
Production
Secondary
Packaging
Disposal and
Recycling
Legend
TStep within
transportation
life cycle stage
Retorting
Outside System
Boundaries
Within System
Boundaries
Critical Review and Use of Results
17
� The study has been peer reviewed and approved by
an external panel of 3 LCA experts– Beth Quay, Former Director of Environmental Technical Affairs for
Coca-Cola
– Dr. Greg Keoleian, Director of the Center for Sustainable Systems at the
University of Michigan
– Dr. David Allen, Director of the Center for Energy and Environmental
Resources at the University of Texas at Austin
� Peer review ensures compliance with ISO 14040/44
Standards for LCA
� Peer review allows public comparative assertions

Soup Packaging LCA:
Study Findings for Ready-to-Serve
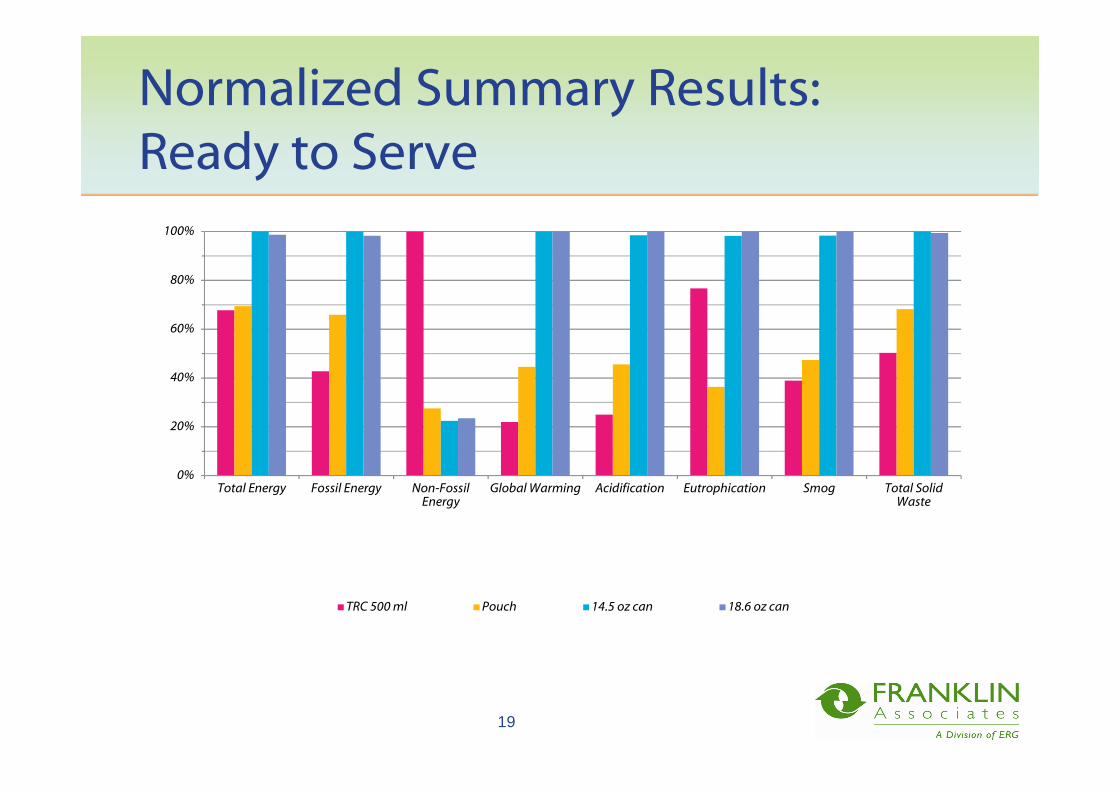
Normalized Summary Results:
Ready to Serve
19
0%
20%
40%
60%
80%
100%
Total Energy Fossil Energy Non-FossilEnergy
Global Warming Acidification Eutrophication Smog Total SolidWaste
TRC 500 ml Pouch 14.5 oz can 18.6 oz can

Ready to Serve Soup Packages
20
500 ml TRC20 g
Steel cans
500 ml Laminate Pouch, 10.4 g
18.6 oz (550 ml)70.5 g
14.5 oz (429 ml)54.4 g
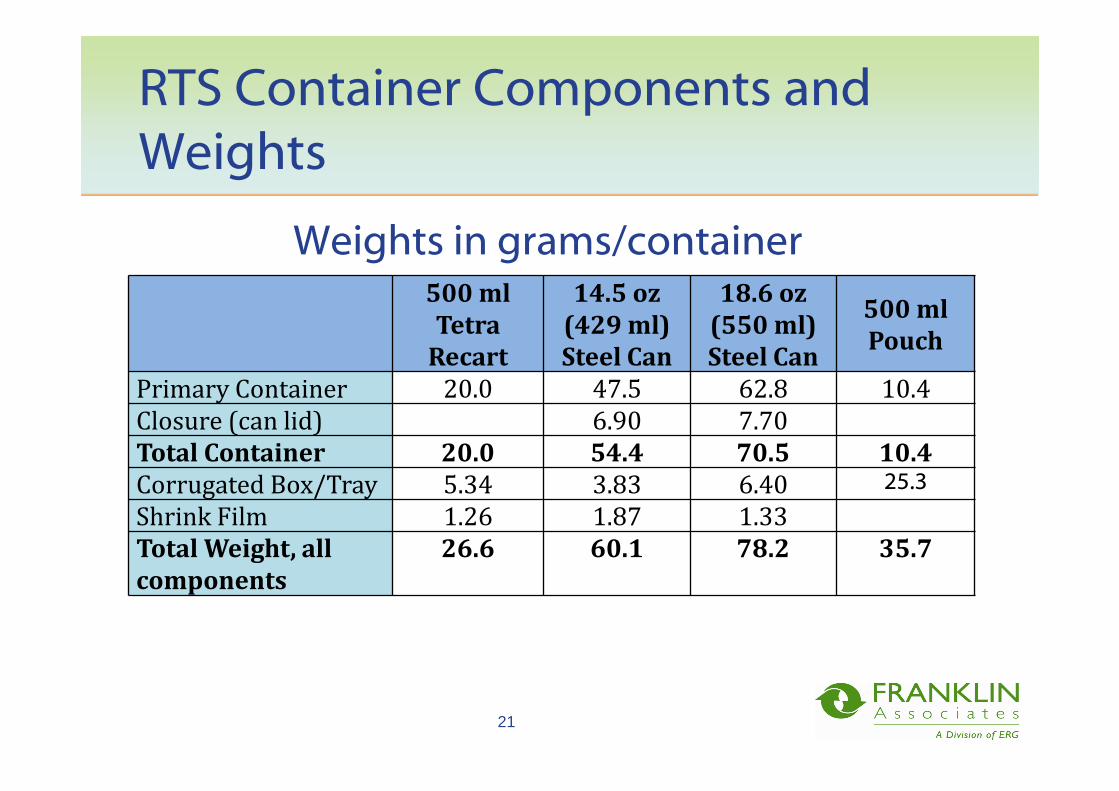
RTS Container Components and
Weights
500 ml
Tetra
Recart
14.5 oz
(429 ml)
Steel Can
18.6 oz
(550 ml)
Steel Can
500 ml
Pouch
Primary Container 20.0 47.5 62.8 10.4
Closure (can lid) 6.90 7.70
Total Container 20.0 54.4 70.5 10.4
Corrugated Box/Tray 5.34 3.83 6.40 25.3
Shrink Film 1.26 1.87 1.33
Total Weight, all
components
26.6 60.1 78.2 35.7
21
Weights in grams/container

Ready to Serve Soup Packages
(kg per 1,000 liters of soup)
22
500 ml TRC39.9 kg
500 ml Laminate Pouch, 20.8 kg
Steel cans
14.5 oz (429 ml)127 kg
18.6 oz (550 ml)128 kg

RTS Total Energy Demand
Results by Life Cycle Stage
� TRC has lower total energy demand than steel cans, mainly due to
lower material production energy
� Total energy similar for TRC and pouch; material energy higher for
TRC, but pouch has much higher secondary packaging requirements
23
3 487 3 575
5 149 5 081
-1 000
0
1 000
2 000
3 000
4 000
5 000
6 000
TRC 500ml Pouch 14.5 oz can 18.6 oz can
MJ
eq
End of life
Distribution
Filling/Retorting
Transportation
Secondary Packaging
Container Production
Materials Production
Net

RTS Net Energy Demand Results by
Fossil/Non-Fossil Energy
� Majority of energy for pouch and can systems is fossil (non-renewable)
energy
� TRC has larger share of non-fossil energy, associated with biomass
feedstock and process energy for paper content of the TRC rollstock
24
-1 000
0
1 000
2 000
3 000
4 000
5 000
6 000
TRC 500ml Pouch 14.5 oz can 18.6 oz can
MJ
eq
Non-fossil Energy
Fossil Energy

RTS Solid Waste Results by Life
Cycle Stage
25
� Solid waste for TRC is dominated by postconsumer disposal
� Material production wastes are highest for pouch and steel cans
� At end-of-life, heavier weight of cans offset by high recycling rate
0
10
20
30
40
50
60
70
80
90
TRC 500ml Pouch 14.5 oz can 18.6 oz can
kg
End of life
Distribution
Filling/Retorting
Transportation
Secondary Packaging
Container Production
Materials Production

RTS Global Warming Results by Life
Cycle Stage
26
90
183
410 410
-100,0
00,0
100,0
200,0
300,0
400,0
500,0
600,0
TRC 500ml Pouch 14.5 oz can 18.6 oz can
kg
CO
2 e
q
End of life
Distribution
Filling/Retorting
Transportation
Secondary Packaging
Container Production
Materials Production
Net
� TRC has significantly lower GWP compared to other systems, with
main advantage seen in material production stage
� End-of-Life negative value for TRC is from landfill carbon storage,
while cans have credit for virgin steel production avoided by recycling
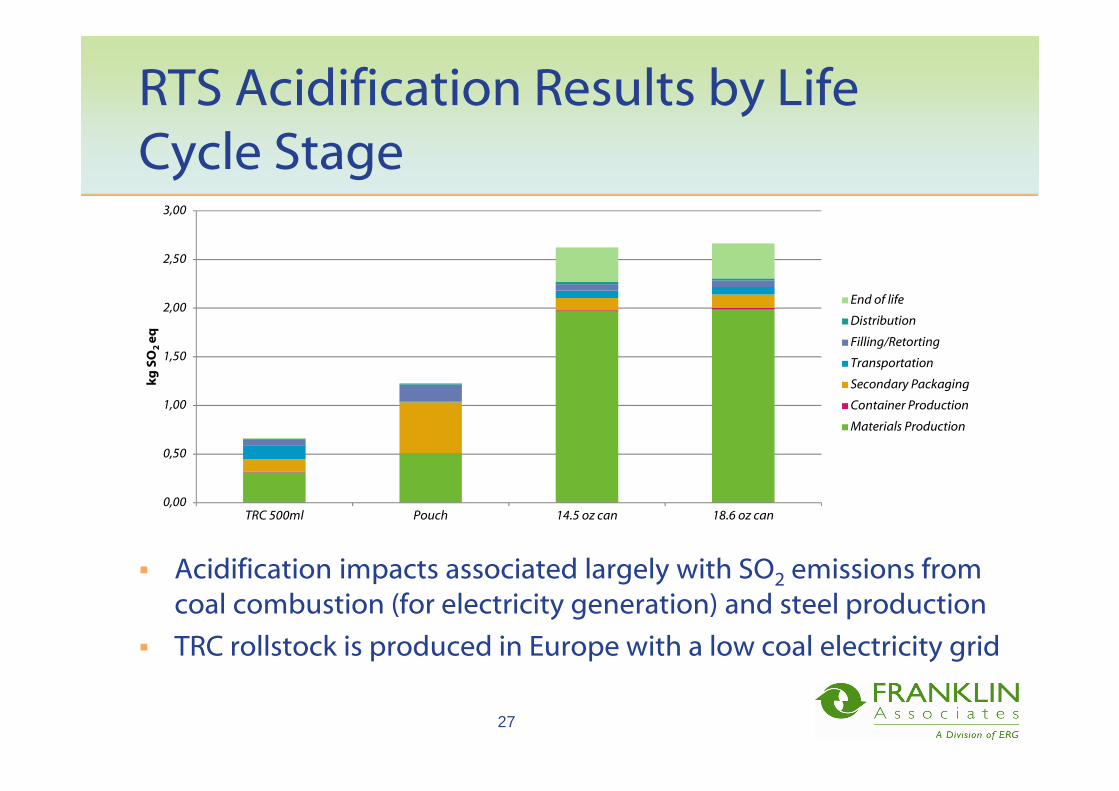
RTS Acidification Results by Life
Cycle Stage
� Acidification impacts associated largely with SO2 emissions from
coal combustion (for electricity generation) and steel production
� TRC rollstock is produced in Europe with a low coal electricity grid
27
0,00
0,50
1,00
1,50
2,00
2,50
3,00
TRC 500ml Pouch 14.5 oz can 18.6 oz can
kg
SO
2 e
q
End of life
Distribution
Filling/Retorting
Transportation
Secondary Packaging
Container Production
Materials Production

RTS Eutrophication Results by Life
Cycle Stage
� Main eutrophication impacts for TRC and pouch due to water
emissions from papermaking (TRC fiber, corrugated packaging)
� Eutrophication for cans associated with can material production
and recycling
28
0,000
0,020
0,040
0,060
0,080
0,100
0,120
TRC 500ml Pouch 14.5 oz can 18.6 oz can
kg
N e
q
End of life
Distribution
Filling/Retorting
Transportation
Secondary Packaging
Container Production
Materials Production
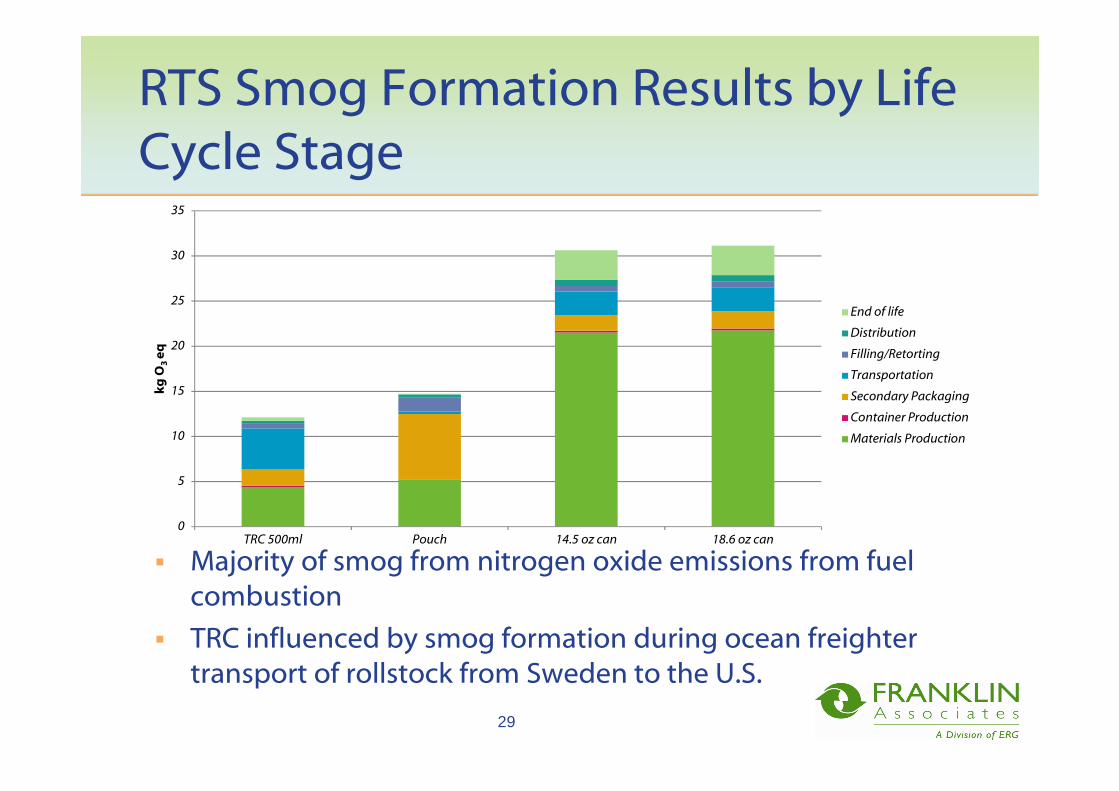
RTS Smog Formation Results by Life
Cycle Stage
� Majority of smog from nitrogen oxide emissions from fuel
combustion
� TRC influenced by smog formation during ocean freighter
transport of rollstock from Sweden to the U.S.
29
0
5
10
15
20
25
30
35
TRC 500ml Pouch 14.5 oz can 18.6 oz can
kg
O3
eq
End of life
Distribution
Filling/Retorting
Transportation
Secondary Packaging
Container Production
Materials Production
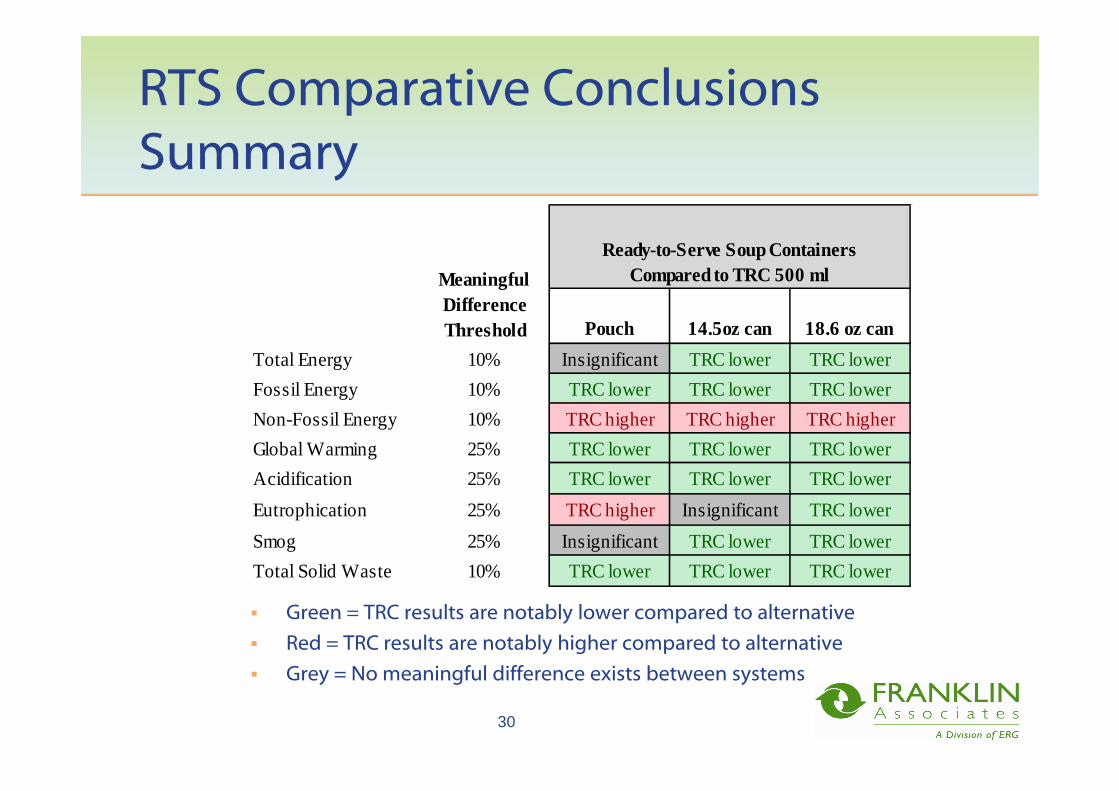
RTS Comparative Conclusions
Summary
30
Pouch 14.5oz can 18.6 oz can
Total Energy 10% Insignificant TRC lower TRC lower
Fossil Energy 10% TRC lower TRC lower TRC lower
Non-Fossil Energy 10% TRC higher TRC higher TRC higher
Global Warming 25% TRC lower TRC lower TRC lower
Acidification 25% TRC lower TRC lower TRC lower
Eutrophication 25% TRC higher Insignificant TRC lower
Smog 25% Insignificant TRC lower TRC lower
Total Solid Waste 10% TRC lower TRC lower TRC lower
Meaningful Difference Threshold
Ready-to-Serve Soup Containers Compared to TRC 500 ml
� Green = TRC results are notably lower compared to alternative
� Red = TRC results are notably higher compared to alternative
� Grey = No meaningful difference exists between systems
Soup Packaging LCA:
Study Findings for Condensed

Normalized Summary Results:
Condensed
32
0%
20%
40%
60%
80%
100%
Total Energy Fossil Energy Non-FossilEnergy
Global Warming Acidification Eutrophication Smog Total SolidWaste
TRC 340 ml 10.75 oz can

Condensed Soup Packages
33
340 ml TRC16 g
10.75 oz Steel Can(318 ml)41.2 g

Condensed Soup Container
Components and Weights
500 ml
Tetra
Recart
14.5 oz
(429 ml)
Steel Can
Primary Container 16.0 35.6
Closure (can lid) 5.60
Total Container 16.0 41.2
Corrugated Tray 3.58 3.80
Shrink Film 0.84 0.64
Total Weight, all
components
20.4 45.6
34
Weights in grams/container
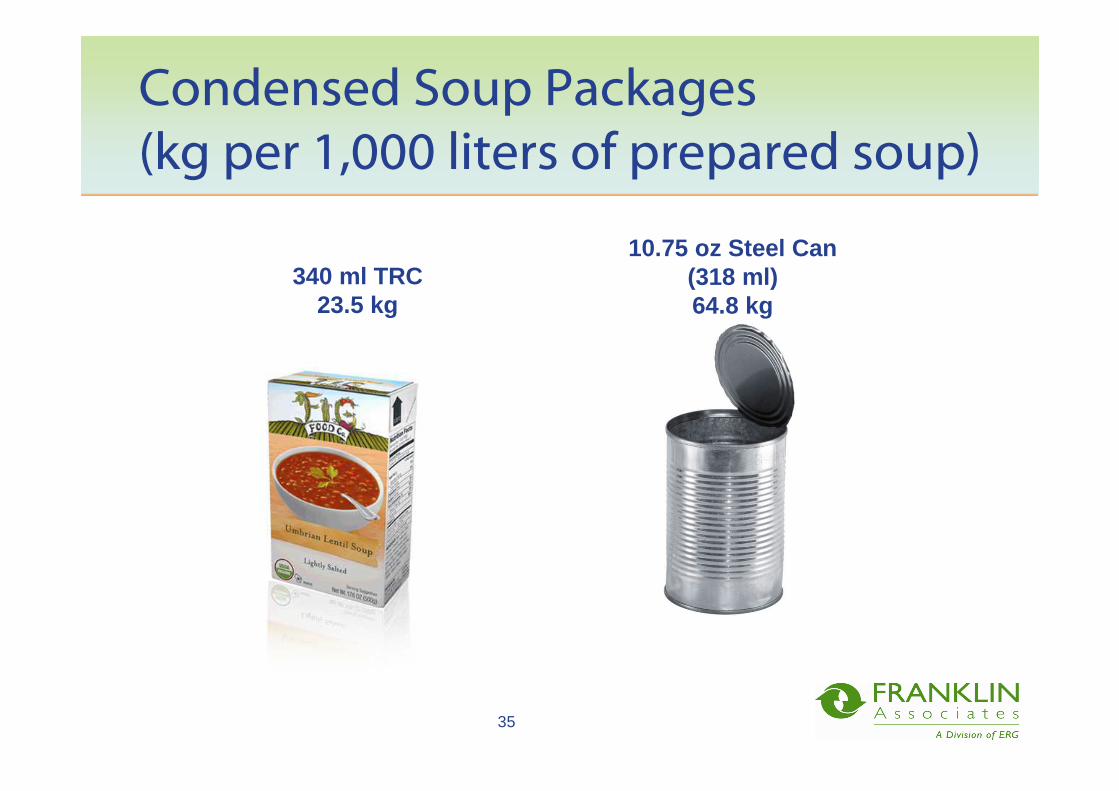
Condensed Soup Packages
(kg per 1,000 liters of prepared soup)
35
340 ml TRC23.5 kg
10.75 oz Steel Can(318 ml)64.8 kg

� TRC has lower total energy demand than steel can, mainly due to
lower material production energy requirements for TRC
36
2 023
2 551
-500
0
500
1 000
1 500
2 000
2 500
3 000
TRC 340ml 10.75 oz can
MJ
eq
End of life
Distribution
Filling/Retorting
Transportation
Secondary Packaging
Container Production
Materials Production
Net
Condensed Soup Net Energy Demand
Results by Life Cycle Stage
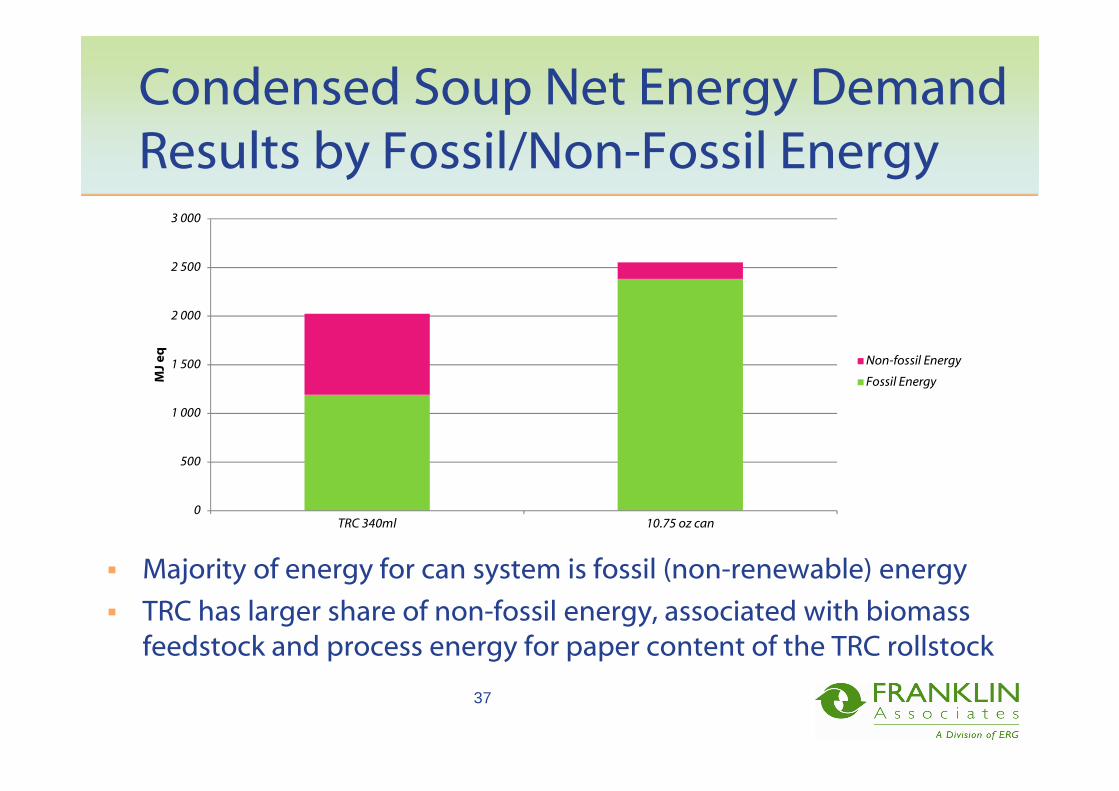
Condensed Soup Net Energy Demand
Results by Fossil/Non-Fossil Energy
� Majority of energy for can system is fossil (non-renewable) energy
� TRC has larger share of non-fossil energy, associated with biomass
feedstock and process energy for paper content of the TRC rollstock
37
0
500
1 000
1 500
2 000
2 500
3 000
TRC 340ml 10.75 oz can
MJ
eq
Non-fossil Energy
Fossil Energy

Condensed Soup Solid Waste
Results by Life Cycle Stage
38
� Solid waste for TRC is dominated by postconsumer disposal
� Material production wastes are much higher for steel cans, but end-of-
life wastes lower due to high recycling rate for cans
0
5
10
15
20
25
30
35
40
45
TRC 340ml 10.75 oz can
kg
End of life
Distribution
Filling/Retorting
Transportation
Secondary Packaging
Container Production
Materials Production

Condensed Soup Global Warming
Results by Life Cycle Stage
� TRC has significantly lower GWP compared to steel cans, with main
advantage seen in material production stage
� End-of-Life negative value for TRC is from landfill carbon storage,
while can has credit for virgin steel production avoided by recycling
39
53
207
-50,00
0,00
50,00
100,00
150,00
200,00
250,00
300,00
TRC 340ml 10.75 oz can
kg
CO
2 e
q
End of life
Distribution
Filling/Retorting
Transportation
Secondary Packaging
Container Production
Materials Production
Net

Condensed Soup Acidification
Results by Life Cycle Stage
40
0,00
0,20
0,40
0,60
0,80
1,00
1,20
1,40
1,60
TRC 340ml 10.75 oz can
kg
SO
2 e
q
End of life
Distribution
Filling/Retorting
Transportation
Secondary Packaging
Container Production
Materials Production
� Acidification impacts associated largely with SO2 emissions from
coal combustion (for electricity generation) and steel production
� TRC rollstock is produced in Europe with a low coal electricity grid
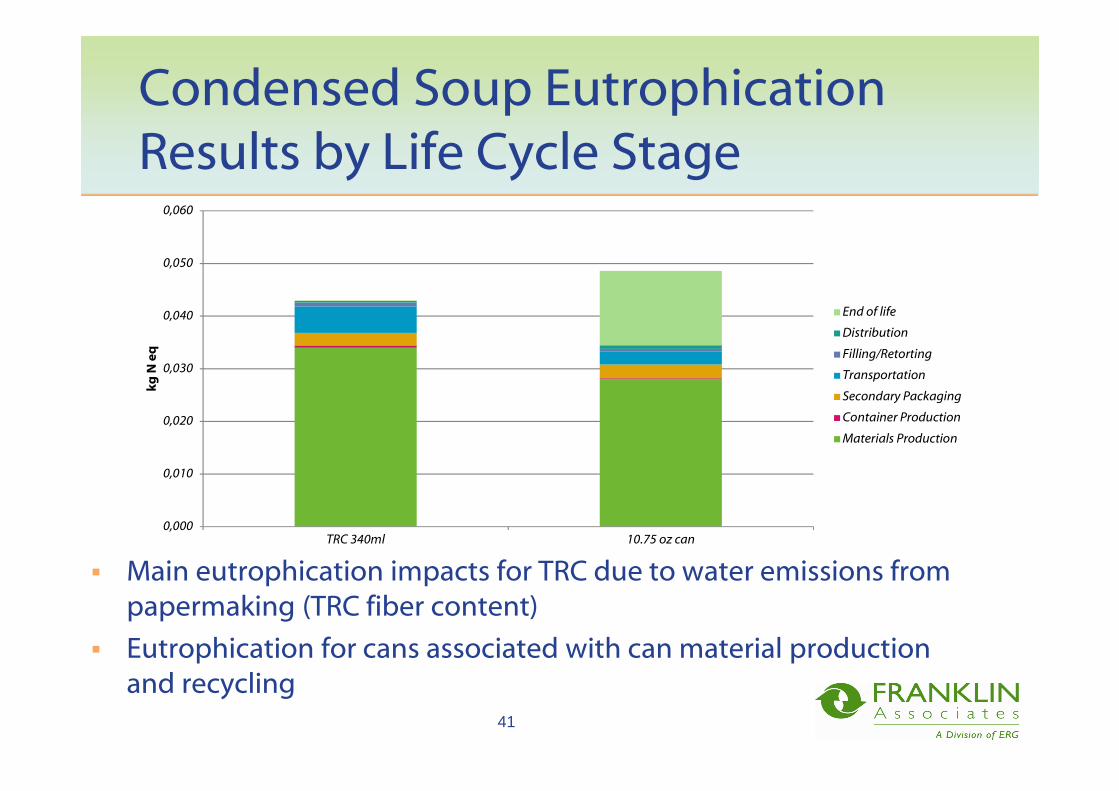
Condensed Soup Eutrophication
Results by Life Cycle Stage
41
0,000
0,010
0,020
0,030
0,040
0,050
0,060
TRC 340ml 10.75 oz can
kg
N e
q
End of life
Distribution
Filling/Retorting
Transportation
Secondary Packaging
Container Production
Materials Production
� Main eutrophication impacts for TRC due to water emissions from
papermaking (TRC fiber content)
� Eutrophication for cans associated with can material production
and recycling

Condensed Soup Smog Formation
Results by Life Cycle Stage
42
0
2
4
6
8
10
12
14
16
18
TRC 340ml 10.75 oz can
kg
O3
eq
End of life
Distribution
Filling/Retorting
Transportation
Secondary Packaging
Container Production
Materials Production
� Majority of smog from nitrogen oxide emissions from fuel
combustion
� TRC influenced by smog formation during ocean freighter
transport of rollstock from Sweden to the U.S.

Condensed Soup Comparative
Conclusions Summary
Confidential43
Condensed Soup Container Compared
to TRC 340 ml
10.75 oz can
Total Energy 10% TRC lower
Fossil Energy 10% TRC lower
Non-Fossil Energy 10% TRC higher
Global Warming 25% TRC lower
Acidification 25% TRC lower
Eutrophication 25% Insignificant
Smog 25% TRC lower
Total Solid Waste 10% TRC lower
Meaningful Difference Threshold
� Green = TRC results are notably lower compared to alternative
� Red = TRC results are notably higher compared to alternative
� Grey = No meaningful difference exists between systems

Tetra Recart Soup Packaging LCA
Key Takeaway Messages

Summary Conclusions
� LCA is an important tool to understand the full
environmental impact of different product systems
� There can be trade-offs between Tetra Recart and other
soup packaging systems depending upon the impact
category examined
� Overall, TRC shows benefits in most results compared to
heavier steel can systems, despite the high recycling rate
for cans.
� Comparative results are more mixed for TRC compared to
soup pouches, which are about half the weight of TRC
� TRC has a larger share of energy that is derived from
renewable resources45

Depletion of Finite Natural Resources
� Tetra Recart contributes less to depletion of finite
natural resources (fossil fuels)
– TRC cartons are made of 68% paper, a renewable
resource. As a result TRC results in less depletion of fossil
fuel resources than steel cans and pouches on a lifecycle
basis
– Help secure sustainable supply for future growth
– TRC consumes at least 50% less fossil energy than steel
cans throughout the lifecycle and 35% less vs. lightweight
pouches
46

Carbon Footprint Reduction
� Tetra Recart results in less greenhouse gas
emissions than steel cans and pouches on a life
cycle basis
– 75% less greenhouse gas emissions vs. heavier steel
can systems
– 51% less GWP than lightweight flexible pouch system
47
Main Takeaway Messages
� TRC soup cartons perform favorably when comparing to
heavier steel cans
– Significantly lower total energy, fossil energy, solid waste, GWP,
acidification, smog, and solid waste
– TRC has higher non-fossil energy and mixed eutrophication results,
associated with renewable fiber content of TRC
� Even when compared to significantly lighter pouches, TRC
performs well in many areas
– Lower fossil energy, GWP, acidification, and solid waste; comparable
results for total energy, smog
� Study has been peer reviewed by a panel of 3 external
experts, who have validated it was conducted according to
ISO standards for LCA, so results can be shared
48