tests on 3g-base stations to ts 25.141 with r&s spectrum ... · pdf filewith r&s...
TRANSCRIPT
Subject to change – Detlev Liebl -- 10/2002 – 1MA37_1e
Products: FSP, FSIQ, FSU, FSQ, SMIQ
Tests on 3G-Base Stations to TS 25.141with R&S Spectrum Analyzers and
SMIQ Vector Signal Generator
This application note describes how to measure the various WCDMA signals which are used for transmittertests on FDD base stations with either an FSP, FSIQ, FSU, or FSQ spectrum analyzer, and how to
generate the stimulus signals for the receiver and performance tests with an SMIQ vector signal generator.
The demo program 3GDemoBSU is included. Run 3GDemoBSU to set up the instruments and carry outthe tests to TS 25.141 via remote control. The demo program is distributed as source code. Adopt theremote control commands and test sequences for your own test routines, and integrate analyzer and
generator into your test systems with maximum ease.

Tests on 3G - Base Stations
1MA37 2 Rohde & Schwarz
Contents1 Overview ................................................................................................. 42 Installing the demo program 3GDemoBSU ............................................ 53 Principles of Operation............................................................................ 6
First steps with the demo program .................................................... 6Advanced information about the demo program ............................... 8Uncertainty of the complete test system............................................ 9
4 . ............................................................................................................... 95 . ............................................................................................................... 96 Transmitter Tests .................................................................................. 10
Test set up for transmitter tests ....................................................... 11Transmitter tests step by step.......................................................... 12Base station maximum output power (6.2.1) .................................. 13CPICH power accuracy (6.2.2) ....................................................... 14Frequency error (6.3) ...................................................................... 17Power control steps (6.4.2)............................................................. 19Power control dynamic range (6.4.3).............................................. 21Total power dynamic range (6.4.4) ................................................. 23Occupied bandwidth (6.5.1)............................................................ 25Spectrum emission mask (6.5.2.1) ................................................. 27Adjacent Channel Leakage Power Ratio (6.5.2.2) ......................... 29Spurious emissions (6.5.3) ............................................................. 31
Spurious emissions Category A (6.5.3.4.1)............................... 32Spurious emmisions Category B (6.5.3.4.2).............................. 33Protection of the base station receiver (6.5.3.4.3)..................... 33Co-existence with GSM 900 (6.5.3.4.4)..................................... 34Co-existence with DCS 1800 (6.5.3.4.5) ................................... 34Co-existence with PHS (6.5.3.4.6) ............................................ 35Co-existence with services in adjacent bands (6.5.3.4.7) .......... 35Co-existence with UTRA-TDD (6.5.3.4.8) ................................. 36
Transmit intermodulation (6.6)........................................................ 36Error Vector Magnitude (6.7.1) ....................................................... 37Peak Code Domain Error (6.7.2) .................................................... 39
7 Receiver Tests ...................................................................................... 41Test Setup for Receiver tests .......................................................... 41Receiver Test Demonstration Step by Step .................................... 42Reference Sensitivity Level (7.2) .................................................... 43Dynamic Range (7.3) ...................................................................... 45Adjacent Channel Selectivity (7.4).................................................. 46Blocking Characteristics (7.5) ......................................................... 48Intermodulation Characteristics (7.6).............................................. 49Spurious Emissions (7.7)................................................................ 51Verification of Internal BER Calculation (7.8) ................................. 53
8 PerformanceTests................................................................................. 53Test Setup for Performance Tests................................................... 54Performance Test Demonstration Step by Step .............................. 55Demodulation of DCH in Static Propagation Conditions (8.2)........ 55Demodulation of DCH in Multipath Fading Conditions (8.3)........... 57Demodulation of DCH in Moving Propagation Conditions (8.4) ..... 60Demodulation of DCH in Birth / Death Conditions (8.5) ................. 61Verification of Internal BLER Calculation (8.6) ............................... 62
9 Test Signals Only .................................................................................. 63Synchronising Base Station and SMIQ............................................ 64Generating Test Signals .................................................................. 64
10 Literature ............................................................................................... 6511 Abbreviations ........................................................................................ 66
Tests on 3G - Base Stations
1MA37 3 Rohde & Schwarz
12 Hardware and Software Requirements................................................. 673GDemoBSU Hardware Requirements for PC................................ 673GDemoBSU Software Requirements for PC ................................. 67Options required for SMIQ and FSx ................................................ 67
13 Ordering information ............................................................................. 7014 Contact.................................................................................................. 71
Tests on 3G - Base Stations
1MA37 4 Rohde & Schwarz
1 OverviewThis application note describes how to measure the various WCDMAsignals which are used for the transmitter tests on FDD base stations witheither an FSP, FSIQ, FSU, or FSQ spectrum analyzer, and how togenerate the diverse stimulus signals needed for the receiver andperformance tests with an SMIQ vector signal generator.
The demo program 3GDemoBSU is included. Run 3GDemoBSU to set upthe instruments and carry out the tests to TS 25.141 via remote control.
Note: The measurements described here can be performed with an FSPSpectrum Analyzer with options FSP-B15 and FSP-B70, or with anFSIQ, FSU, or FSQ Signal Analyzer and the application firmware3GPP BTS Code Domain Power Measurements FS-K72.
In the following chapters, these analyzers are referred tocollectively as FSx.
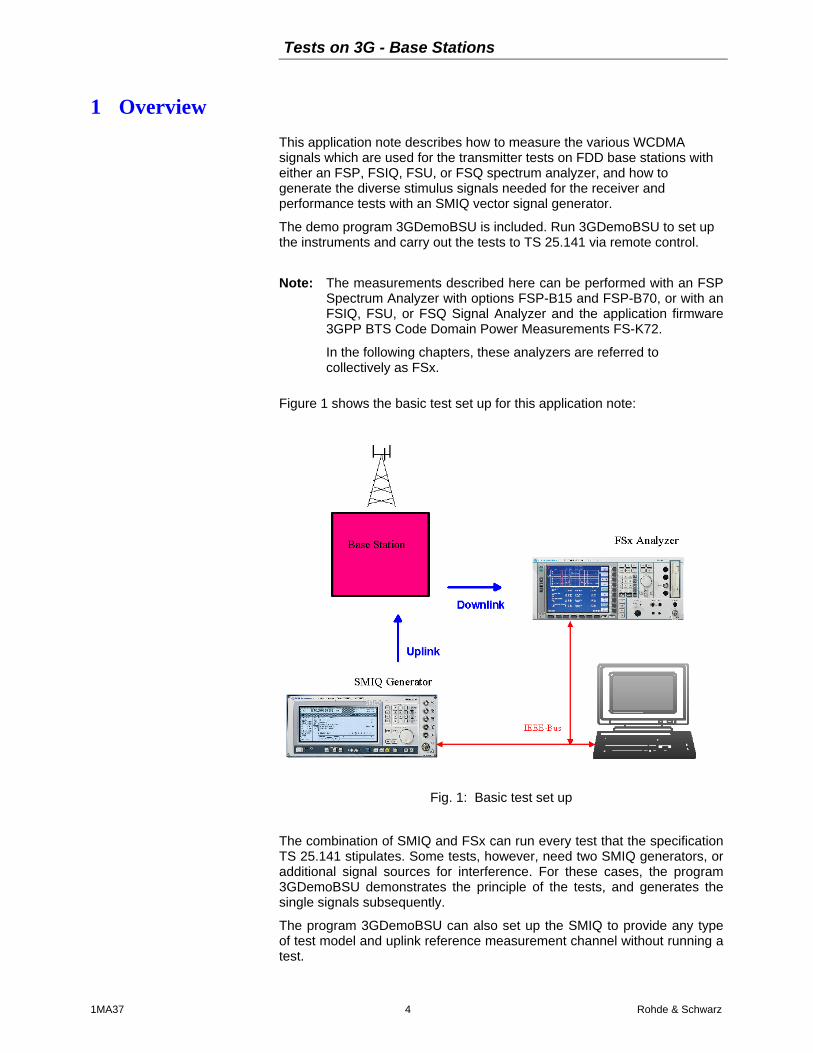
Figure 1 shows the basic test set up for this application note:
Fig. 1: Basic test set up
The combination of SMIQ and FSx can run every test that the specificationTS 25.141 stipulates. Some tests, however, need two SMIQ generators, oradditional signal sources for interference. For these cases, the program3GDemoBSU demonstrates the principle of the tests, and generates thesingle signals subsequently.
The program 3GDemoBSU can also set up the SMIQ to provide any typeof test model and uplink reference measurement channel without running atest.
Tests on 3G - Base Stations
1MA37 5 Rohde & Schwarz
Demo Mode:If there is no base station available, simulate the downlink signal withSMIQ. For receiver and performance tests, monitor the uplink test signalwith FSx. Both tasks are supported by the application program3GDemoBSU automatically.
3GDemoBSU is distributed as source code. Adopt the remote controlcommands and test sequences for your own test routines, and integrateyour type of analyzer and the SMIQ into your test systems with maximumease.
To modify the code and generate a version of your own, you need theLabWindows CVI software from National Instruments Rev. 5.5 or higher.
The following pages describe how to use the 3GDemoBSU demo programand give a detailed description of each transmitter, receiver andperformance test.
Notes: For 3GPP base stations, Rohde & Schwarz offers theTS9850 Test System, for measurements at the air interfaceCMU200 / 300 Universal Radio Communication Tester,see section Ordering Information.
An overview of the application notes currently available for3GPP from Rohde & Schwarz is given in section 10 onpage 65.
For a list of abbreviations used in this application note, seesection 11 on page 66.
2 Installing the demo program 3GDemoBSU
The 3GPP tests require some specific hardware and software options inboth the SMIQ generator and the analyzer.
1. Check the hardware and software requirements. See the section 12on page 67.
2. Download the file 1ma_x.x.exe (x.x is the program version) from
http://www.rohde-schwarz.com --> products --> Application Notes.(Search for 1MA37).
3. Run 1ma_x.x.exe. ´This will extract the four files
3GDemoBSU.MSI, DistFile.cap, Setup.ini, and Setup.exe
4. If the Microsoft Installer is not yet available at your PC, download itfrom the R&S website containing 1MA37, and install it first.
5. Run Setup.exe.
6. Follow the instructions of the installation dialog.
Tests on 3G - Base Stations
1MA37 6 Rohde & Schwarz
Note: If the installation program finds an older version of 3GDemoBSUon your computer, it will deinstall this version first. After thedeinstallation, run Setup.exe again to install the new version.
Principles of Operation
First steps with the demo programFor running transmitter tests, you need the FSx spectrum analyzer. Forreceiver and performance tests with the demo program, you need at leastone SMIQ vector signal generator.
Note: To navigate through the 3GDemoBSU program without anyinstruments connected, continue from step 3.
1. Connect the FSx analyzer and SMIQ generator to the controller via theIEEE bus.
2. Switch the analyzer and the generator on. Wait until initialisation iscompleted.
3. Run 3GDemoBSU.exe.
On program start, the demo program checks whether the FSx and SMIQare connected to the IEC/IEEE-bus, and stores the correspondingaddresses. If only one or no instrument is detected, a message is output toindicate that the missing instruments will be simulated.
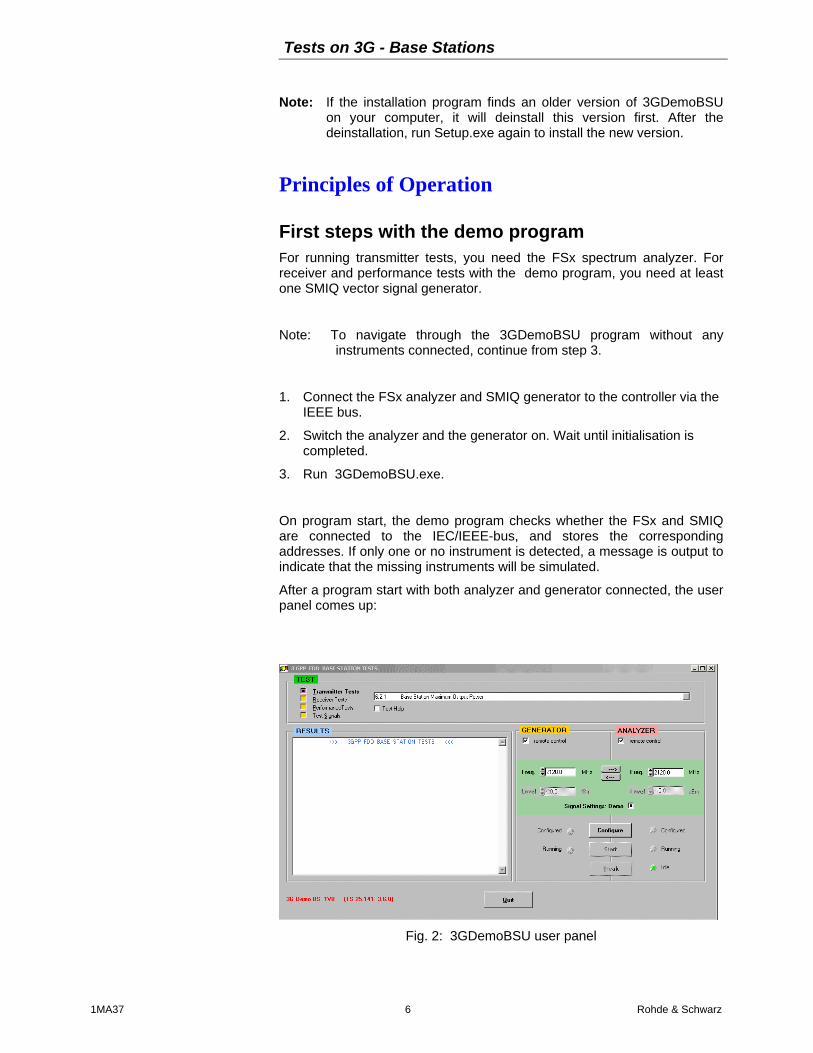
After a program start with both analyzer and generator connected, the userpanel comes up:
Fig. 2: 3GDemoBSU user panel
Tests on 3G - Base Stations
1MA37 7 Rohde & Schwarz
In the TEST field above, the type of test (e.g. Transmitter Test), and thetest itself (e.g. 6.2.1 Base Station Maximum Output Power) are selected.
Clicking Test Help will give you an overview of the test purpose and themethod of test.
Set instrument parameters in the two fields GENERATOR and ANALYZER.Enter the frequency and level for the generator and analyzer. Threebuttons control the program flow, LEDs indicate the instrument status.
Tests results are displayed in the RESULTS window on the left.
To run a test:
1. Prepare and connect the Device Under Test (DUT).
2. Select the test from the test list in the TEST field.
3. Adjust frequency and level, if necessary, in the parameter field.
4. Configure the instruments by clicking the Configure button.
5. Start the test by clicking the Start button.
6. Check the results in the RESULTS window.
Clicking the Configure button sets up both FSx and SMIQ completely. Ifyou don't need both instruments, you can disable the program control forthe unused device. This speeds up the configuration process considerably.
This also applies if you want to make two tests subsequently which needthe same generator configuration, for example, configure the generator forthe first test, and disable the program control for the generator before youclick the Configure button for the second test. This will be described morein detail later.
Once the instruments are configured, you can repeat a test by clicking Startagain (without a new configuration).
Special features:
Signal Settings Demo:To run 3GDemoBSU program without a base station, SMIQ and FSx haveto be set up with the output from the generator connected to the input ofthe analyzer. Activating the checkbox Signal Settings Demo presets theinstrument levels so that the test can be easily monitored. Please note thatthese levels are very different from the levels stipulated by testspecification TS 25.141.
If you change to another test, click the Configure button to set appropriatenew demo levels.
For the transmitter test Power Control Steps, the activated checkboxmakes the SMIQ simulate the downlink signal of the base station. If thecheckbox is deactivated, the SMIQ will generate an uplink signal to controlthe output power of the DUT.
Tests on 3G - Base Stations
1MA37 8 Rohde & Schwarz
For the uplink signals of chapter Test signals only, an activated SignalSettings Demo checkbox switches the SMIQ to trigger free run and internal10 MHz reference. If deactivated, trigger and reference are set to externalto synchronize with the base station.
Break:Clicking this button breaks a running test. However, as SMIQ alwaysfinishes a current configuration, the break is not necessarily instantaneous.
To get familiar with the program, connect the output of your SMIQgenerator to the input of your FSx analyzer, and run some tests.
Advanced information about the demo program
Remote control:You can disable the program control for one or both instruments with theremote control checkboxes on the user panel (see Fig. 2). The entry fieldsfor frequency and level disappear.
! For simulation of the base station tests, the control for FSx and SMIQhas to be switched on.
! For transmitter tests on a base station, switch the remote control ofSMIQ off.
! For BER measurements switch the remote control of FSx off.
See the sections Transmitter, Receiver, and Performance Tests for moreinformation.
Synchronizing SMIQ and FSx:If the Configure button is clicked, the connected instruments are reset first.This switches the SMIQ generator to internal reference, whereas thereference setting of the FSx analyzer is not affected.
To synchronize the generator and the analyzer, connect the 10 MHz portsof the instruments to each other and switch the FSx to external reference(Hardkey SETUP, Softkey REFERENCE INT / EXT).
Program Version:The version of the demo program, and the version of the test specification(TS 25.141) the program applies to, are shown in the lower left corner ofthe user panel (Fig. 2).
Tests on 3G - Base Stations
1MA37 9 Rohde & Schwarz
Modifying tests:The demo program is supplied with its source code. It is written usingLabWindows CVI. To modify the code and generate a version of your own,you need the LabWindows CVI software from National Instruments (Rev.5.5 or higher).
The transmitter tests are contained in the file t_tests.c, the receivertests in the file r_tests.c, the performance tests in the file p_tests.c,and the generation of the test signals in the file test_sigs.c. Edit thesefiles to change or add remote control commands, or to modify the testsequence.
For the configuration of the downlink and uplink signals, see the filesignals.c.
The other program files control the user interface, the program flow, andthe remote control.
! After code modifications, recompile the program and build a newexecutable.
Uncertainty of the complete test systemFor the complete test set up, you need additional components, such aspower attenuators, cables, couplers and filters. Because they all havesome impact on the test results, no PASS / FAIL verdict is given by thedemo program.
Note: Enter your external attenuation on the FSx analyzer asreference level offset (Hardkey REF, Softkey REF LEVELOFFSET) after the configuration of the instrument.
4 .Left intentionally free.
5 .Left intentionally free.

Tests on 3G - Base Stations
1MA37 10 Rohde & Schwarz
6 Transmitter Tests
Transmitter tests are measurements on the base station downlink signal,the base station transmitter is active. For the downlink, TS 25.141 specifiesfour different test signals, the test models, to make sure that measurementresults from different base stations can be compared.
Table 1 gives a summary of the transmitter tests stipulated by TS 25.141.
Table 1: Summary of the transmitter tests
Tests on 3G - Base Stations
1MA37 11 Rohde & Schwarz
The left column of table 1 contains the number of the chapter in the testspecification, the right one the test model that has to be used. All of thesetests can be made with the FSx analyzer.
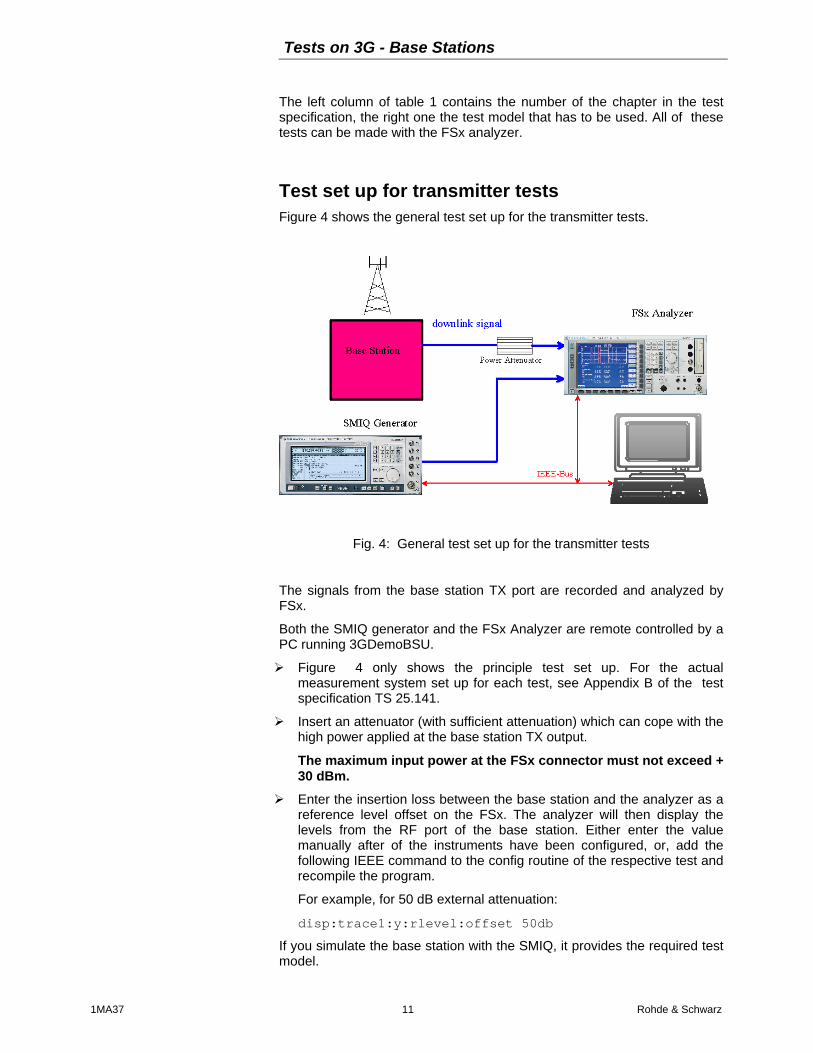
Test set up for transmitter testsFigure 4 shows the general test set up for the transmitter tests.
Fig. 4: General test set up for the transmitter tests
The signals from the base station TX port are recorded and analyzed byFSx.
Both the SMIQ generator and the FSx Analyzer are remote controlled by aPC running 3GDemoBSU.
! Figure 4 only shows the principle test set up. For the actualmeasurement system set up for each test, see Appendix B of the testspecification TS 25.141.
! Insert an attenuator (with sufficient attenuation) which can cope with thehigh power applied at the base station TX output.
The maximum input power at the FSx connector must not exceed +30 dBm.
! Enter the insertion loss between the base station and the analyzer as areference level offset on the FSx. The analyzer will then display thelevels from the RF port of the base station. Either enter the valuemanually after of the instruments have been configured, or, add thefollowing IEEE command to the config routine of the respective test andrecompile the program.
For example, for 50 dB external attenuation:
disp:trace1:y:rlevel:offset 50db
If you simulate the base station with the SMIQ, it provides the required testmodel.
Tests on 3G - Base Stations
1MA37 12 Rohde & Schwarz
Transmitter tests step by step1. Connect your DUT to the analyzer as described in TS 25.141. Insert an
attenuator (with sufficient attenuation and power handling capability)between the base station TX output and the FSx analyzer.
2. Select the test from the demo program user panel.
3. If you do not need the generator, disable the SMIQ’s control in theremote control checkbox. This speeds up the configuration.
4. Start the configuration by clicking the Configure button.
After clicking the Configure button, the connected instruments are reset.Reset switches the SMIQ to internal reference, whereas the FSx’sreference setting will be not affected.
If remote control for the SMIQ generator is enabled, extensive calculationof the required test model inside the SMIQ takes place, which can take upto one minute.
While configuration of SMIQ or FSx is running, the Configured LEDs areyellow. When configuration is completed, the Configured LEDs go green.
The instruments are now correctly configured; the RF output of the SMIQgenerator is still switched off.
5. Enter the insertion loss between the base station and the analyzer asa reference level offset on the FSx. This can be done manually, or, byadding the following IEEE command to the config routine of therespective test. For example, for a 50dB external attenuation
disp:trace1:y:rlevel:offset 50db
Do not forget to recompile the program and build a new executable.
6. Start the selected test by clicking the Start button.
Clicking the Start button switches the RF output of the SMIQ generator onand starts the analyzer. When the measurement is completed, results aredisplayed on the analyzer and in the RESULTS window.
While a test is running, the Running LEDs are green. When themeasurement is completed, the Running LED of the analyzer goes out andthe Idle LED lights.
The generator continues running.
Notes: For the transmitter tests, no changes of the instrumentsettings are performed by the demo program after clickingStart. So, you can repeat a measurement by clicking theStart button again without reconfiguring: you can alsomodify the setting of the instruments manually between twostarts, as required.
If you want to change to another test which still uses thesame test model, to avoid a time consuming recalculationof the test model, disable the remote control of thegenerator before clicking the Configure button.
After a test, check whether an underflow or overflow hasoccurred. Both will be indicated on the analyzer’s screen.
The input attenuation of the FSx is set to auto by default.For best results, adjust it manually to achieve the optimum
Tests on 3G - Base Stations
1MA37 13 Rohde & Schwarz
(rms) mixer level of –12 dBm. (The mixer level equals theinput level minus the input attenuation.)
For basic information about the transmitter tests with FSx,see the application note 1EF44 [6] available from theRohde & Schwarz website.
Base station maximum output power (6.2.1)
Maximum output power, Pmax, of the base station is the mean power levelper carrier measured at the antenna connector.
The test purpose is to verify the accuracy of the maximum output poweracross the frequency range and under normal and extreme conditions forall transmitters in the base station.
! For measurements on a base station, disable the remote control ofSMIQ from the 3GDemoBSU user panel. Insert an attenuator (withsufficient attenuation) which can cope with the high power applied atthe base station TX output.
! For simulation, connect SMIQ output to the input of the FSx, andactivate Signal Settings Demo on the 3GDemoBSU user panel. By this,the level of SMIQ will be set to -20 dBm.
Test procedure on base station:1. Set the DUT to transmit a signal modulated with the channel
combination of test model 1.
2. From the 3GDemoBSU user panel select test 6.2.1 Base stationmaximum output power.
3. Enter Frequency and Levels.
4. Configure the test set up by clicking the Configure button.
5. When the configuration is completed, enter your external attenuationon the FSx analyzer (Hardkey REF, Softkey REF LEVEL OFFSET).
6. Start the test by clicking the Start button on the user panel.
7. Check results in the RESULTS window.
Test results:In normal conditions, the Base station maximum output power shall remainwithin +2.0 dB and –2.0 dB of the manufacturer's rated output power.
In extreme conditions, the Base station maximum output power shallremain within +2.5 dB and –2.5 dB of the manufacturer's rated outputpower.

Tests on 3G - Base Stations
1MA37 14 Rohde & Schwarz
Fig. 5 shows a measurement result displayed on the analyzer. The powerof the test signal was set to -20 dBm; cables and connectors causedadditional loss.
Ref -15 dBm 2.112 GHz Att 0 dB 2.112 GHz
RBW 30 kHz
2.112 GHzVBW 300 kHz
2.112 GHz SWT 2 s 2.112 GHz * 2.112 GHz
*
2.112 GHz*
2.112 GHz * 2.112 GHz
*
2.112 GHz
Center 2.112 GHz
2.112 GHz
Span 10 MHz
2.112 GHz
1 MHz/
2.112 GHz
1 RM
2.112 GHz
CLRWR
2.112 GHz
* 2.112 GHz
A
2.112 GHz
SGL
2.112 GHz
-110
-100
-90
-80
-70
-60
-50
-40
-30
-20
2.112 GHz
Tx Channel Bandwidth 5 MHz Power -21.55 dBm
C0C0
CENTER FREQUENCY
2.112 GHz
Date: 5.APR.2002 10:32:54
Fig. 5: Base station maximum output power: results displayed on theanalyzer
CPICH power accuracy (6.2.2)
CPICH power accuracy is defined as the maximum deviation between theordered channel power and the power in that channel measured at the TXantenna interface.
The purpose of the test is to verify that the base station under test deliversCPICH power within margins.
! For measurements on a base station, disable the remote control ofSMIQ from the 3GDemoBSU user panel. Insert an attenuator (withsufficient attenuation) which can cope with the high power applied atthe base station TX output.
! For simulation, connect SMIQ output to the input of the FSx, andactivate Signal Settings Demo on the 3GDemoBSU user panel. By this,the total output power of SMIQ will be set to -20 dBm. For the test

Tests on 3G - Base Stations
1MA37 15 Rohde & Schwarz
model 2 used here, the levels of CPICH and CCPCH have to be 10 dBlower.
Test procedure on base station:
1. Disable inner loop power control at the base station.
2. Set up the base station to transmit at maximum total power asspecified by the supplier.
3. Set up the base station to transmit a signal modulated with the channelcombination of test model 2.
4. From the 3GDemoBSU user panel select test 6.2.2 CPICH poweraccuracy.
5. Enter Frequency and Levels.
6. Configure the test set up by clicking the Configure button.
7. When the configuration is completed, enter your external attenuationon the FSx analyzer (Hardkey REF, Softkey REF LEVEL OFFSET).
8. Start the test by clicking the Start button.
9. Check results in the RESULTS window.
Test results:In normal conditions, the measurement results shall remain within +2.7 dBand –2.7 dB of the manufacturer's rated output power.
In extreme conditions, measurement results shall remain within +3.2 dBand –3.2 dB of the manufacturer's rated output power.
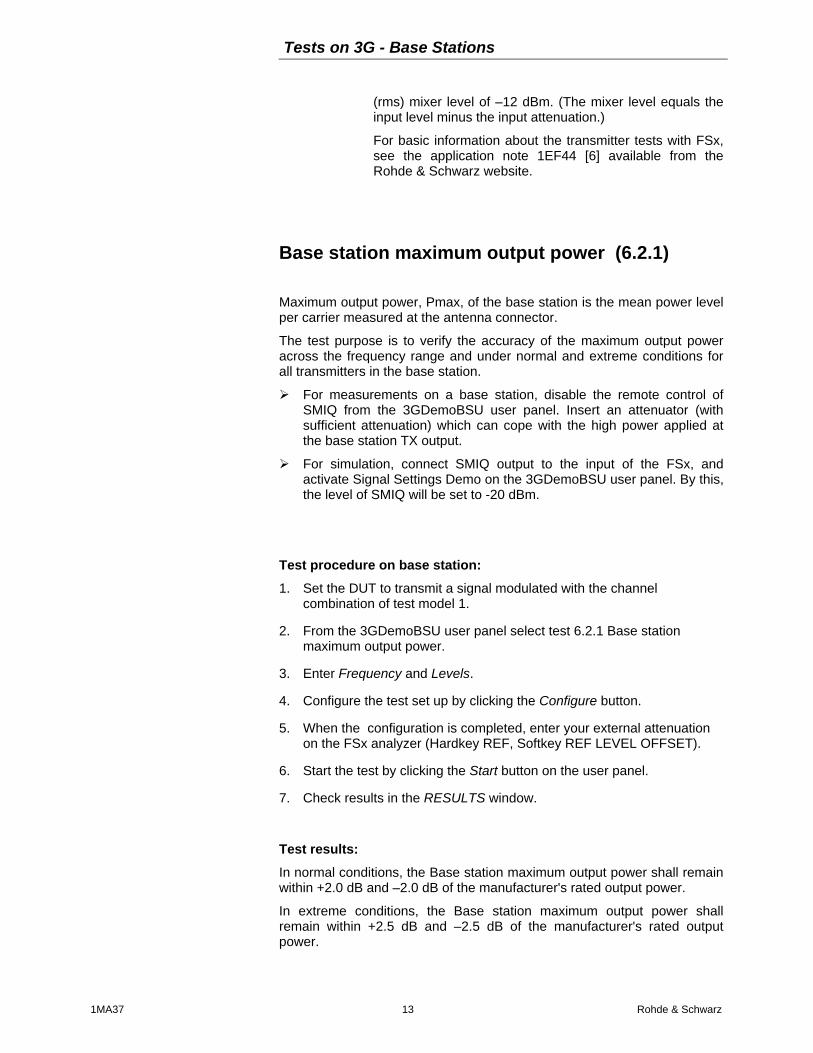
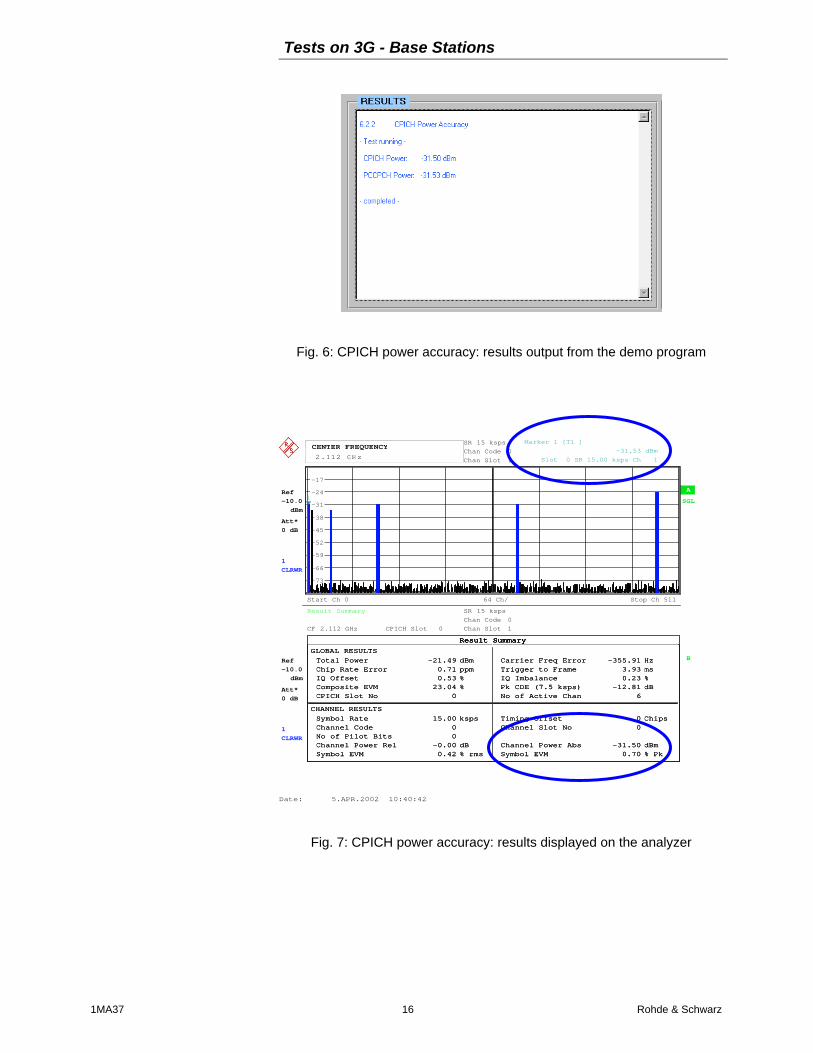
Fig. 6 shows the result output from the demo program, Fig. 7 the resultdisplayed on the analyzer. The total power of the test signal was set to -20dBm. CPICH and CCPCH have to be 10 dB lower; cables and connectorscaused additional loss.
Tests on 3G - Base Stations
1MA37 16 Rohde & Schwarz
Fig. 6: CPICH power accuracy: results output from the demo program
A
2.112 GHz
Result Summary
2.112 GHz
CPICH Slot 0
2.112 GHz
Chan Code 0
2.112 GHz
Chan Slot 1
2.112 GHz
B
2.112 GHz
Att*
2.112 GHz
0 dB
2.112 GHz
Att*
2.112 GHz
0 dB
2.112 GHz
Ref
2.112 GHz
-10.0
2.112 GHz
dBm
2.112 GHz
Ref
2.112 GHz
-10.0
2.112 GHz
dBm
2.112 GHz
Ref
2.112 GHz
-10.0
2.112 GHz
dBm
2.112 GHz
SGL
2.112 GHz
SR 15 ksps
2.112 GHz
Ref
2.112 GHz
-10.0
2.112 GHz
dBm
2.112 GHz
Ref
2.112 GHz
-10.0
2.112 GHz
dBm
2.112 GHz
Ref
2.112 GHz
-10.0
2.112 GHz
dBm
2.112 GHz
1
2.112 GHz
CLRWR
2.112 GHz
2.112 GHz
Code Power AbsoluteCENTER FREQUENCY
2.112 GHzCF 2.112 GHz 2.112 GHz CPICH Slot 0 2.112 GHz
SR 15 ksps
2.112 GHzChan Code 0
2.112 GHz Chan Slot 1 2.112 GHz
Start Ch 0
2.112 GHz
64 Ch/
2.112 GHz
Stop Ch 511
2.112 GHz
1
2.112 GHz
CLRWR
2.112 GHz
2.112 GHz
CF 2.112 GHz
2.112 GHz
Att*
2.112 GHz
0 dB
2.112 GHz
Att*
2.112 GHz
0 dB
2.112 GHz
-73
-66
-59
-52
-45
-38
-31
-24
-17
2.112 GHz 2.112 GHz
Result SummaryResult Summary
GLOBAL RESULTSTotal PowerChip Rate ErrorIQ OffsetComposite EVMCPICH Slot No
-21.490.710.53
23.040
dBmppm%%
Carrier Freq ErrorTrigger to FrameIQ ImbalancePk CDE (7.5 ksps)No of Active Chan
-355.913.930.23
-12.816
Hzms%dB
CHANNEL RESULTSSymbol RateChannel CodeNo of Pilot BitsChannel Power RelSymbol EVM
15.0000
-0.000.42
ksps
dB% rms
Timing OffsetChannel Slot No
Channel Power AbsSymbol EVM
00
-31.500.70
Chips
dBm% Pk
1
Marker 1 [T1 ] -31.53 dBm Slot 0 SR 15.00 ksps Ch 1
Result SummaryResult Summary
GLOBAL RESULTSTotal PowerChip Rate ErrorIQ OffsetComposite EVMCPICH Slot No
-21.490.710.53
23.040
dBmppm%%
Carrier Freq ErrorTrigger to FrameIQ ImbalancePk CDE (7.5 ksps)No of Active Chan
-355.913.930.23
-12.816
Hzms%dB
CHANNEL RESULTSSymbol RateChannel CodeNo of Pilot BitsChannel Power RelSymbol EVM
15.0000
-0.000.42
ksps
dB% rms
Timing OffsetChannel Slot No
Channel Power AbsSymbol EVM
00
-31.500.70
Chips
dBm% Pk
CENTER FREQUENCY
2.112 GHz
Date: 5.APR.2002 10:40:42
Fig. 7: CPICH power accuracy: results displayed on the analyzer
Tests on 3G - Base Stations
1MA37 17 Rohde & Schwarz
Frequency error (6.3)
Frequency error is the measure of the difference between the actual BStransmit frequency and the assigned frequency.
! For measurements on a base station, disable the remote control ofSMIQ from the 3GDemoBSU user panel. Insert an attenuator (withsufficient attenuation) which can cope with the high power applied atthe base station TX output.
! To achieve sufficient accuracy to meet the requirements for this test,you need a high precision external reference for FSx, such as aRubidium or a Cesium standard.
! For simulation, connect SMIQ output to the input of the FSx, andactivate Signal Settings Demo on the 3GDemoBSU user panel.
Test procedure on base station:
1. Set up the base station to transmit at a total power of Pmax - 3 dB.
2. Set up the base station to transmit a signal modulated with the channelcombination of test model 4.
3. Connect a high precision external reference to FSx.
4. Set FSx to external reference (Hardkey SETUP, Softkey REFERENCEINT / EXT).
5. From the 3GDemoBSU user panel select test 6.3 Frequency error.
6. Enter Frequency and Levels.
7. Configure the test set up by clicking the Configure button.
Start the test by clicking the Start button.
9. Check results in the RESULTS window.
10. Repeat the test with total power of Pmax - 18 dB.
Test results:
The Frequency Error shall be within the range (–0.05 PPM – 12 Hz) to(+0.05 PPM + 12 Hz).
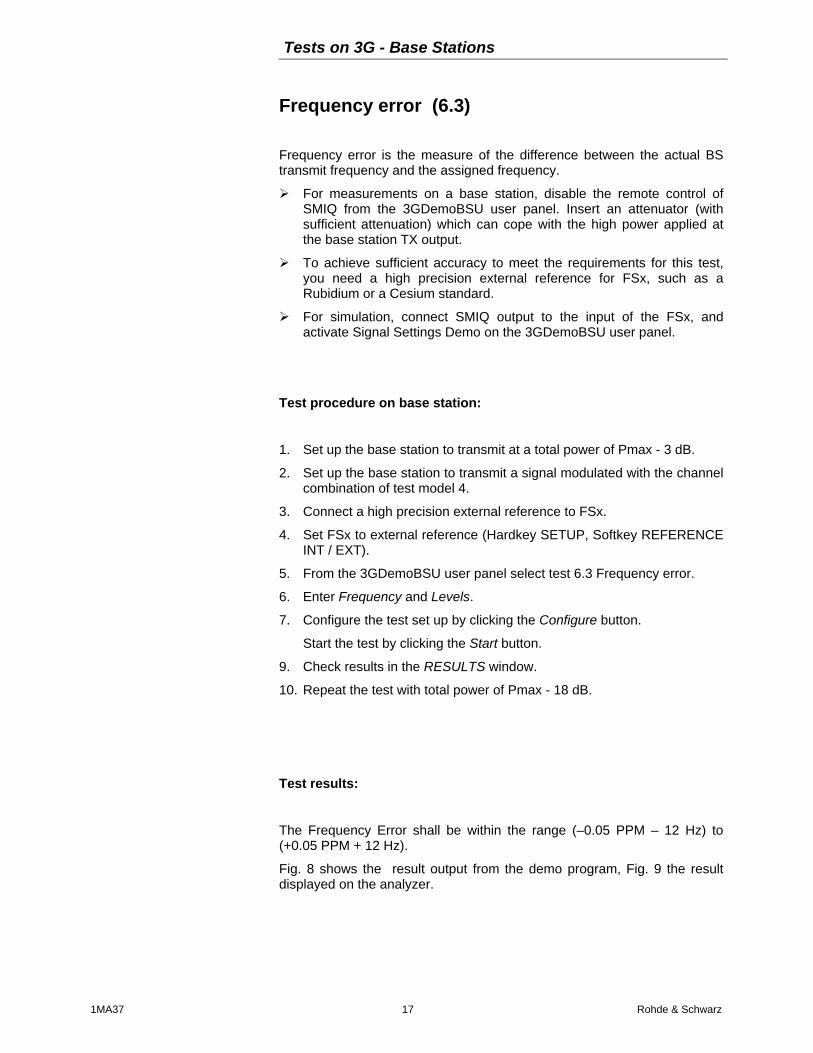
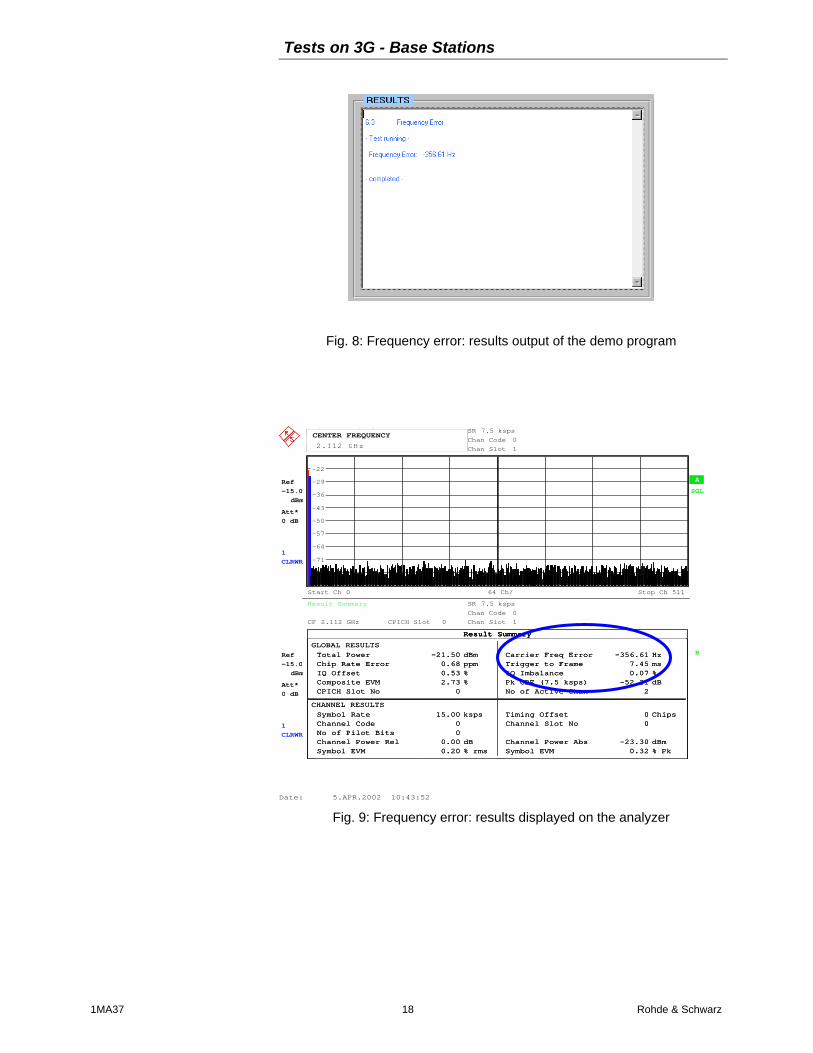
Fig. 8 shows the result output from the demo program, Fig. 9 the resultdisplayed on the analyzer.
Tests on 3G - Base Stations
1MA37 18 Rohde & Schwarz
Fig. 8: Frequency error: results output of the demo program
A
2.112 GHz
Result Summary
2.112 GHz
CPICH Slot 0
2.112 GHz
SR 7.5 ksps
2.112 GHz
Chan Code 0
2.112 GHz
Chan Slot 1
2.112 GHz
B
2.112 GHz
Att*
2.112 GHz
0 dB
2.112 GHz
Att*
2.112 GHz
0 dB
2.112 GHz
Ref
2.112 GHz
-15.0
2.112 GHz
dBm
2.112 GHz
Ref
2.112 GHz
-15.0
2.112 GHz
dBm
2.112 GHz
Ref
2.112 GHz
-15.0
2.112 GHz
dBm
2.112 GHz
SGL
2.112 GHz
Ref
2.112 GHz
-15.0
2.112 GHz
dBm
2.112 GHz
Ref
2.112 GHz
-15.0
2.112 GHz
dBm
2.112 GHz
Ref
2.112 GHz
-15.0
2.112 GHz
dBm
2.112 GHz
1
2.112 GHz
CLRWR
2.112 GHz
2.112 GHz
Code Power AbsoluteCENTER FREQUENCY
2.112 GHzCF 2.112 GHz 2.112 GHz CPICH Slot 0 2.112 GHz
SR 7.5 ksps
2.112 GHzChan Code 0
2.112 GHz Chan Slot 1 2.112 GHz
Start Ch 0
2.112 GHz
64 Ch/
2.112 GHz
Stop Ch 511
2.112 GHz
1
2.112 GHz
CLRWR
2.112 GHz
2.112 GHz
CF 2.112 GHz
2.112 GHz
Att*
2.112 GHz
0 dB
2.112 GHz
Att*
2.112 GHz
0 dB
2.112 GHz
-78
-71
-64
-57
-50
-43
-36
-29
-22
2.112 GHz 2.112 GHz
Result SummaryResult Summary
GLOBAL RESULTSTotal PowerChip Rate ErrorIQ OffsetComposite EVMCPICH Slot No
-21.500.680.532.73
0
dBmppm%%
Carrier Freq ErrorTrigger to FrameIQ ImbalancePk CDE (7.5 ksps)No of Active Chan
-356.617.450.07
-52.212
Hzms%dB
CHANNEL RESULTSSymbol RateChannel CodeNo of Pilot BitsChannel Power RelSymbol EVM
15.0000
0.000.20
ksps
dB% rms
Timing OffsetChannel Slot No
Channel Power AbsSymbol EVM
00
-23.300.32
Chips
dBm% Pk
CENTER FREQUENCY
2.112 GHz
Date: 5.APR.2002 10:43:52
Fig. 9: Frequency error: results displayed on the analyzer
Tests on 3G - Base Stations
1MA37 19 Rohde & Schwarz
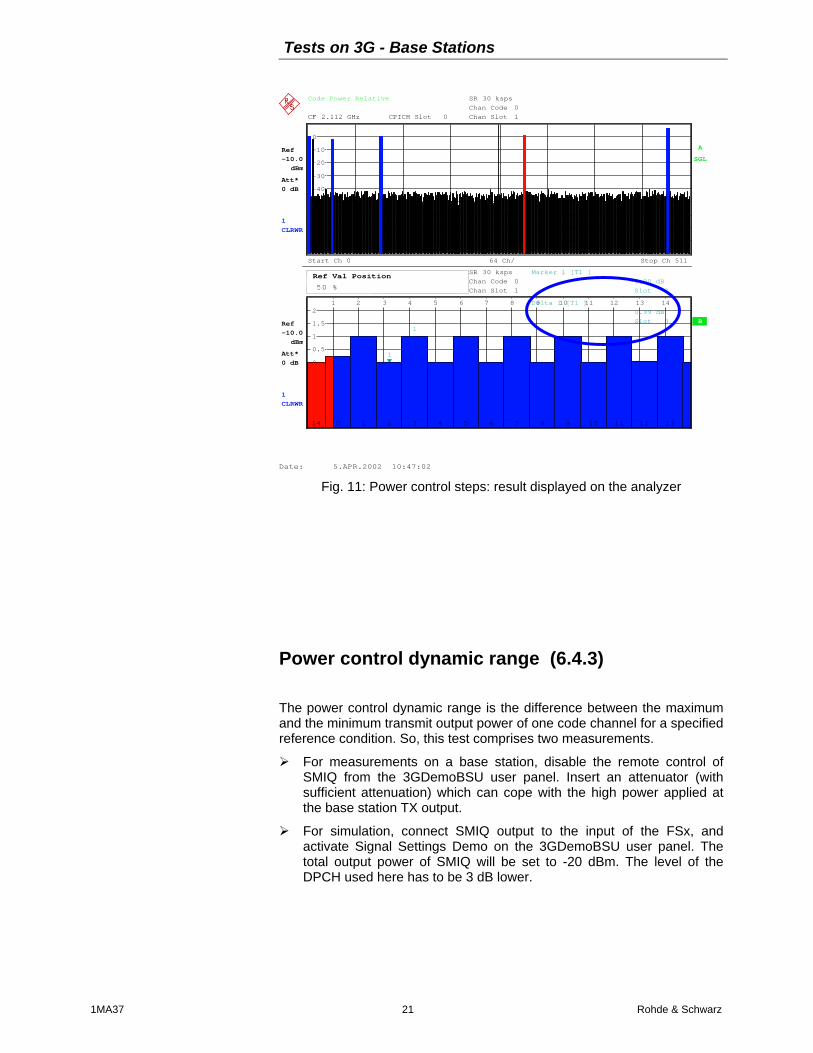
Power control steps (6.4.2)
This test measures the power control step and the combined output powerchange.
The power control step is the required step change in the downlinktransmitter output power of a code channel in response to thecorresponding power control command. The combined output powerchange is the required total change in the downlink transmitter outputpower of a code channel in response to multiple consecutive power controlcommands corresponding to that code channel.
For this test, a user equipment simulator or uplink generator has to set andsend alternating TPC bits in the uplink signal to the base station to controlthe power of the downlink signal for one channel. The FSx as a codedomain analyzer evaluates the power changes versus time.
With 3GDemoBSU, the setting of the checkbox Signal Settings Demodefines whether the SMIQ shall play either the role of the uplink generator,or simulate the downlink signal of a base station.
! To simulate the downlink signal, activate the checkbox Signal SettingsDemo.
! To generate the uplink signal, deactivate the checkbox Signal SettingsDemo.
SMIQ generating an uplink signal:The slot and frame timing of the uplink signal must be fitted to the slot andframe timing of the base station playing the role of a master, and providingtrigger and 10 MHz reference signals for the SMIQ generator.
A suitable trigger is for example a signal indicating the Super FrameNumber (SFN) restart which is output by most of the base stations. Atrigger input for the SFN signal is available at the PAR DATA connector onthe rear panel of the SMIQ generator.
Use an SMIQ-Z5 adapter which provides BNC connectors for all pins of thePAR DATA connector.
1. Connect the 10 MHz reference signal of the base station to the REFconnector on SMIQ’s rear panel.
2. Connect the SFN restart signal of the base station to the TRIG IN pinof the PAR DATA port.
3. Connect FSx - inserting an attenuator (with sufficient attenuation) - tothe base station TX port.
4. Start base station transmission with channel configuration of test model2.
5. Establish downlink power control.
6. From the 3GDemoBSU user panel select test 6.4.2 Power controlsteps.
7. Disable the checkbox Signal Settings Demo.
8. Enter Frequency and Levels.
Tests on 3G - Base Stations
1MA37 20 Rohde & Schwarz
9. Configure the test set up by clicking the Configure button.
10. When the configuration is completed, enter your external attenuationon the FSx analyzer (Hardkey REF, Softkey REF LEVEL OFFSET).
11. Start the test by clicking the Start button.
12. Check power steps on the analyzer.
Note: For further details on synchronizing SMIQ and base station,download the application note 1GP41 [6] from the Rohde &Schwarz website.
SMIQ simulating the downlink signal:
1. Connect SMIQ output to the input of the FSx.
2. From the 3GDemoBSU user panel select test 6.4.2 Power controlsteps.
3. Activate the checkbox Signal Settings Demo.
4. Enter Frequencies.
5. Configure the instruments by clicking the Configure button.
6. Start the test by clicking the Start button.
7. Check the power steps on the analyzer.
Test results:Test 6.4.2 consists of two parts. Part a) uses alternating TPC bits to checkthe single power steps, part b) uses 10 consecutive equal steps tomeasure the combined output tolerance.
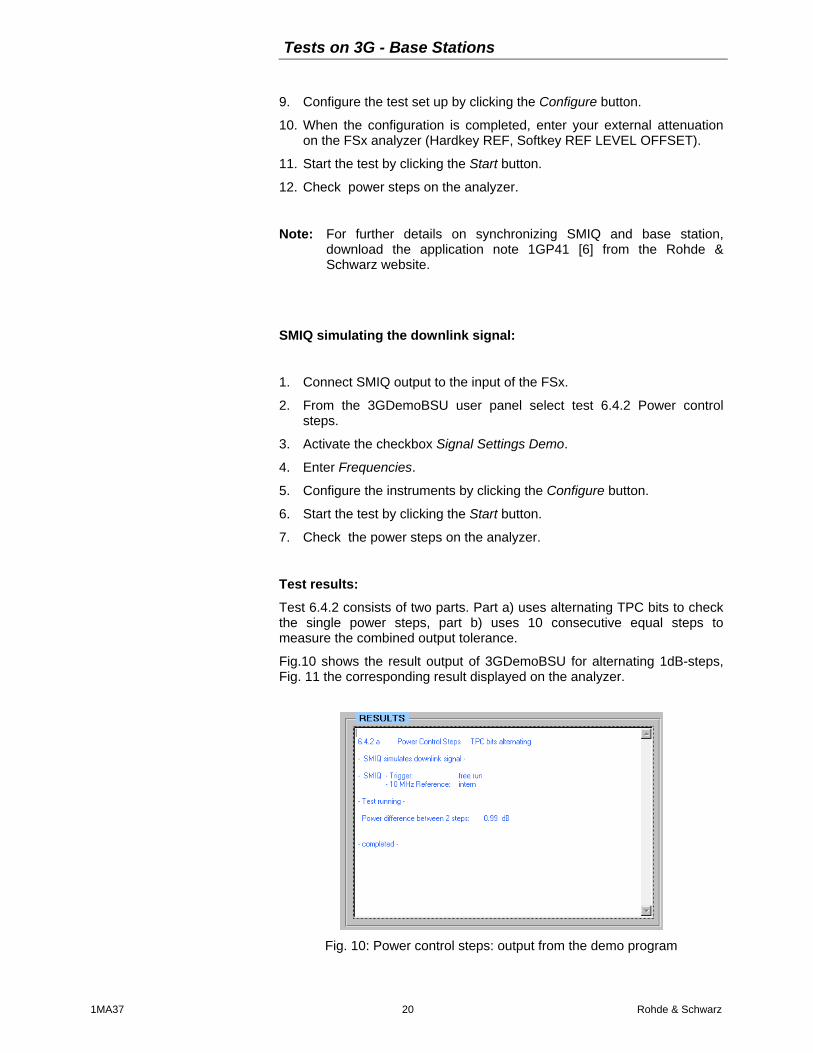
Fig.10 shows the result output of 3GDemoBSU for alternating 1dB-steps,Fig. 11 the corresponding result displayed on the analyzer.
Fig. 10: Power control steps: output from the demo program
Tests on 3G - Base Stations
1MA37 21 Rohde & Schwarz
Ref
50 %
-10.0
50 %
dBm
50 %
Ref
50 %
-10.0
50 %
dBm
50 %
Ref
50 %
-10.0
50 %
dBm
50 %
1
50 %
CLRWR
50 %
50 %
Code Power Relative
50 %
CPICH Slot 0
50 %
SR 30 ksps
50 %
Chan Code 0
50 %
Chan Slot 1
50 %
Start Ch 0
50 %
64 Ch/
50 %
Stop Ch 511
50 %
A
50 %
SGL
50 %
Ref
50 %
-10.0
50 %
dBm
50 %
Ref
50 %
-10.0
50 %
dBm
50 %
Ref
50 %
-10.0
50 %
dBm
50 %
1
50 %
CLRWR
50 %
50 %
Power vs SlotRef Val Position
50 % CPICH Slot 0 50 %
SR 30 ksps
50 %Chan Code 0
50 % Chan Slot 1 50 %
B
50 %
Att*
50 %
0 dB
50 %
Att*
50 %
0 dB
50 %
Att*
50 %
0 dB
50 %
Att*
50 %
0 dB
50 %
CF 2.112 GHz
50 %CF 2.112 GHz 50 %
-80
-70
-60
-50
-40
-30
-20
-10
0
1 2 3 4 5 6 7 8 9 10 11 12 13 14
-2
-1.5
-1
-0.5
0
0.5
1
1.5
2
50 % 50 %
14 0 1 2 3 4 5 6 7 8 9 10 11 12 1314 0 1 2 3 4 5 6 7 8 9 10 11 12 13
1
Marker 1 [T1 ] -0.00 dB Slot 2
1
Delta 1 [T1 ] 0.99 dB Slot 3
14 0 1 2 3 4 5 6 7 8 9 10 11 12 13
Ref Val Position
50 %
Date: 5.APR.2002 10:47:02
Fig. 11: Power control steps: result displayed on the analyzer
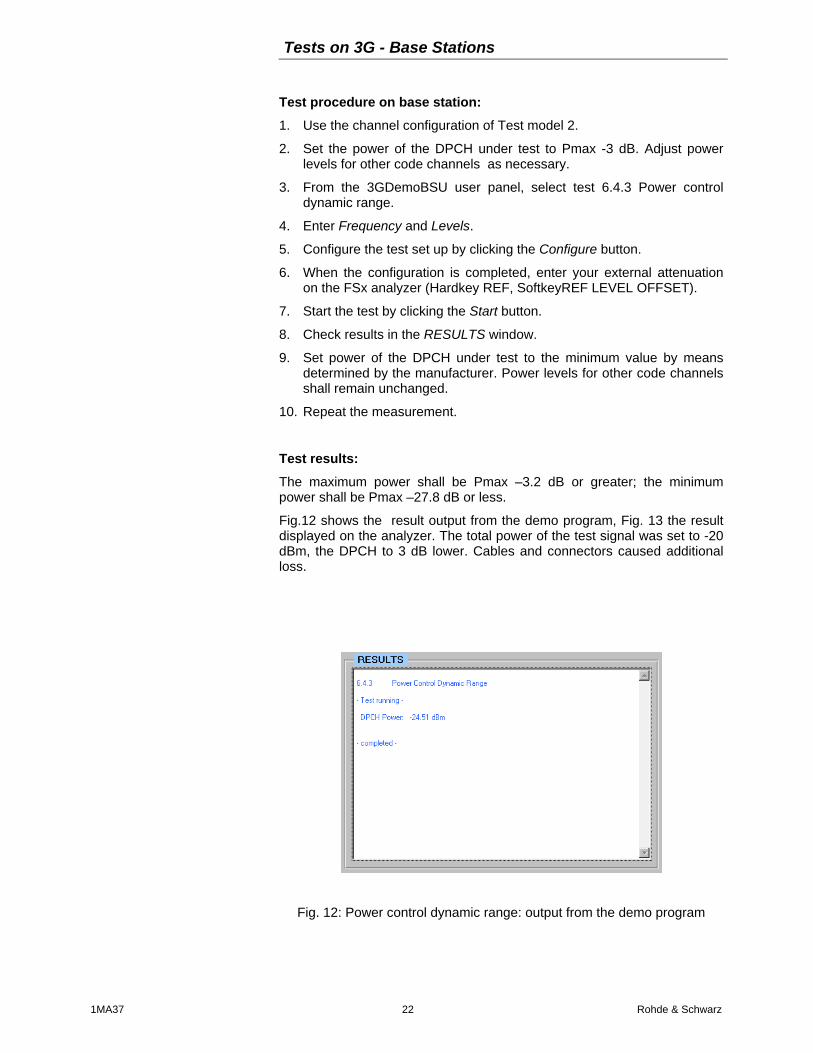
Power control dynamic range (6.4.3)
The power control dynamic range is the difference between the maximumand the minimum transmit output power of one code channel for a specifiedreference condition. So, this test comprises two measurements.
! For measurements on a base station, disable the remote control ofSMIQ from the 3GDemoBSU user panel. Insert an attenuator (withsufficient attenuation) which can cope with the high power applied atthe base station TX output.
! For simulation, connect SMIQ output to the input of the FSx, andactivate Signal Settings Demo on the 3GDemoBSU user panel. Thetotal output power of SMIQ will be set to -20 dBm. The level of theDPCH used here has to be 3 dB lower.
Tests on 3G - Base Stations
1MA37 22 Rohde & Schwarz
Test procedure on base station:1. Use the channel configuration of Test model 2.
2. Set the power of the DPCH under test to Pmax -3 dB. Adjust powerlevels for other code channels as necessary.
3. From the 3GDemoBSU user panel, select test 6.4.3 Power controldynamic range.
4. Enter Frequency and Levels.
5. Configure the test set up by clicking the Configure button.
6. When the configuration is completed, enter your external attenuationon the FSx analyzer (Hardkey REF, SoftkeyREF LEVEL OFFSET).
7. Start the test by clicking the Start button.
8. Check results in the RESULTS window.
9. Set power of the DPCH under test to the minimum value by meansdetermined by the manufacturer. Power levels for other code channelsshall remain unchanged.
10. Repeat the measurement.
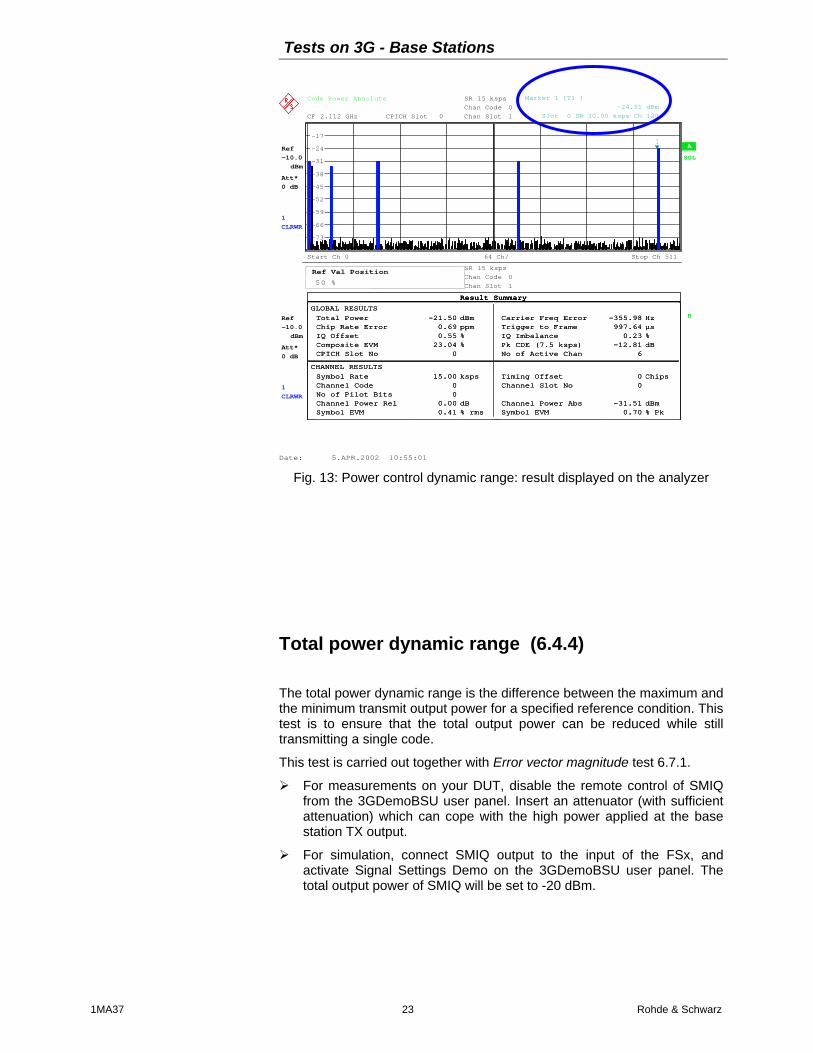
Test results:The maximum power shall be Pmax –3.2 dB or greater; the minimumpower shall be Pmax –27.8 dB or less.
Fig.12 shows the result output from the demo program, Fig. 13 the resultdisplayed on the analyzer. The total power of the test signal was set to -20dBm, the DPCH to 3 dB lower. Cables and connectors caused additionalloss.
Fig. 12: Power control dynamic range: output from the demo program
Tests on 3G - Base Stations
1MA37 23 Rohde & Schwarz
A
50 %
Result SummaryRef Val Position
50 % CPICH Slot 0 50 %Chan Code 0
50 % Chan Slot 1 50 %
B
50 %
SGL
50 %
Att*
50 %
0 dB
50 %
Att*
50 %
0 dB
50 %
Ref
50 %
-10.0
50 %
dBm
50 %
Ref
50 %
-10.0
50 %
dBm
50 %
Ref
50 %
-10.0
50 %
dBm
50 %
SR 15 ksps
50 %
Ref
50 %
-10.0
50 %
dBm
50 %
Ref
50 %
-10.0
50 %
dBm
50 %
Ref
50 %
-10.0
50 %
dBm
50 %
1
50 %
CLRWR
50 %
50 %
Code Power Absolute
50 %
CF 2.112 GHz
50 %
CPICH Slot 0
50 %
SR 15 ksps
50 %
Chan Code 0
50 %
Chan Slot 1
50 %
Start Ch 0
50 %
64 Ch/
50 %
Stop Ch 511
50 %
1
50 %
CLRWR
50 %
50 %CF 2.112 GHz 50 %
Att*
50 %
0 dB
50 %
Att*
50 %
0 dB
50 %
-73
-66
-59
-52
-45
-38
-31
-24
-17
50 % 50 %
Result SummaryResult Summary
GLOBAL RESULTSTotal PowerChip Rate ErrorIQ OffsetComposite EVMCPICH Slot No
-21.500.690.5523.04
0
dBmppm%%
Carrier Freq ErrorTrigger to FrameIQ ImbalancePk CDE (7.5 ksps)No of Active Chan
-355.98997.64
0.23-12.81
6
Hzµs%dB
CHANNEL RESULTSSymbol RateChannel CodeNo of Pilot BitsChannel Power RelSymbol EVM
15.0000
0.000.41
ksps
dB% rms
Timing OffsetChannel Slot No
Channel Power AbsSymbol EVM
00
-31.510.70
Chips
dBm% Pk
1
Marker 1 [T1 ] -24.51 dBm Slot 0 SR 30.00 ksps Ch 120
Result SummaryResult Summary
GLOBAL RESULTSTotal PowerChip Rate ErrorIQ OffsetComposite EVMCPICH Slot No
-21.500.690.5523.04
0
dBmppm%%
Carrier Freq ErrorTrigger to FrameIQ ImbalancePk CDE (7.5 ksps)No of Active Chan
-355.98997.64
0.23-12.81
6
Hzµs%dB
CHANNEL RESULTSSymbol RateChannel CodeNo of Pilot BitsChannel Power RelSymbol EVM
15.0000
0.000.41
ksps
dB% rms
Timing OffsetChannel Slot No
Channel Power AbsSymbol EVM
00
-31.510.70
Chips
dBm% Pk
Ref Val Position
50 %
Date: 5.APR.2002 10:55:01
Fig. 13: Power control dynamic range: result displayed on the analyzer
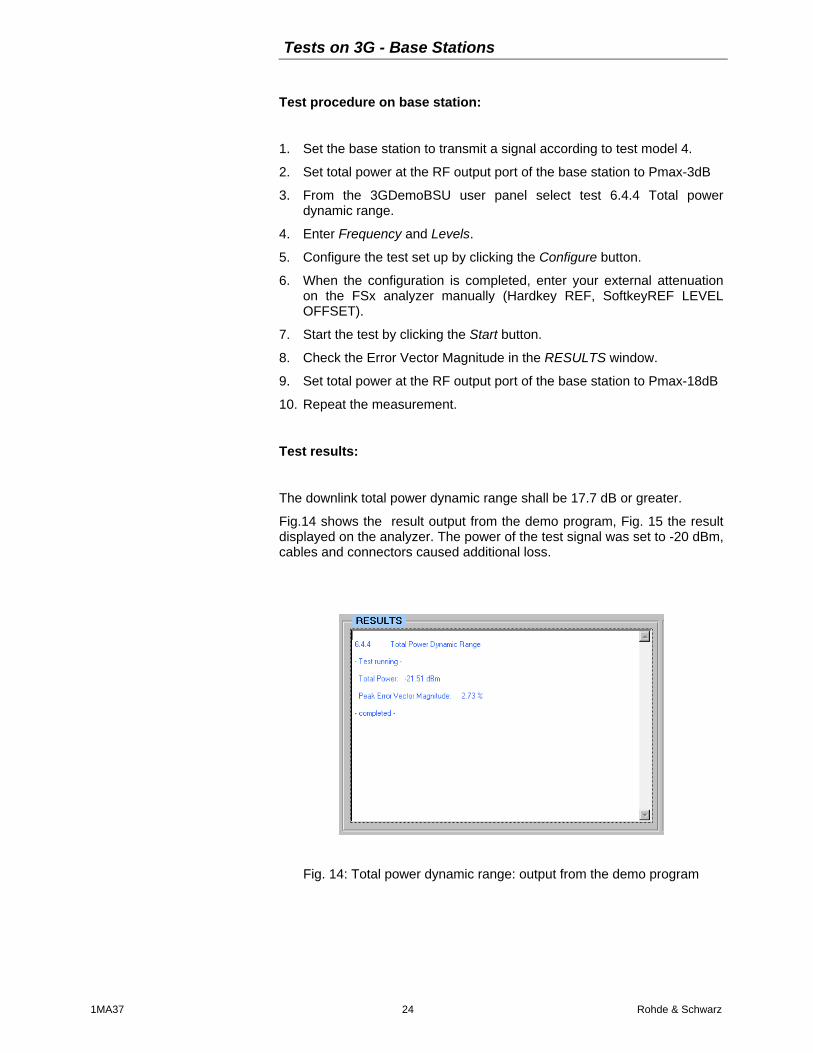
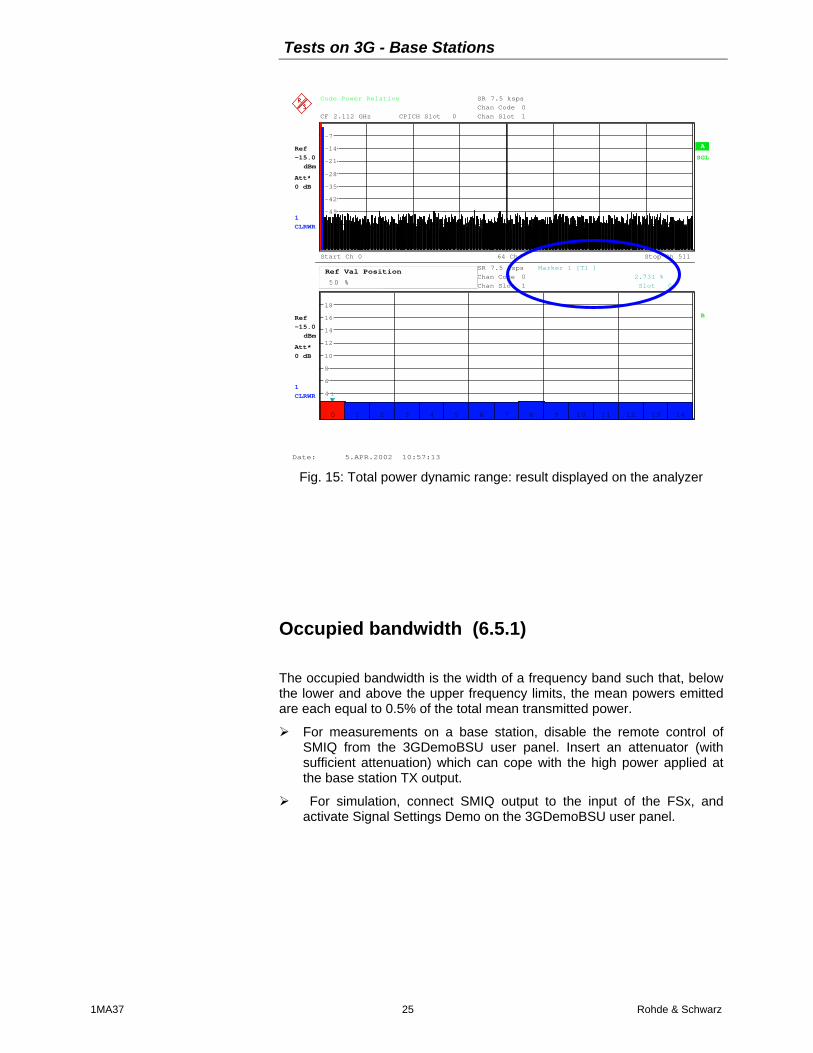
Total power dynamic range (6.4.4)
The total power dynamic range is the difference between the maximum andthe minimum transmit output power for a specified reference condition. Thistest is to ensure that the total output power can be reduced while stilltransmitting a single code.
This test is carried out together with Error vector magnitude test 6.7.1.
! For measurements on your DUT, disable the remote control of SMIQfrom the 3GDemoBSU user panel. Insert an attenuator (with sufficientattenuation) which can cope with the high power applied at the basestation TX output.
! For simulation, connect SMIQ output to the input of the FSx, andactivate Signal Settings Demo on the 3GDemoBSU user panel. Thetotal output power of SMIQ will be set to -20 dBm.
Tests on 3G - Base Stations
1MA37 24 Rohde & Schwarz
Test procedure on base station:
1. Set the base station to transmit a signal according to test model 4.
2. Set total power at the RF output port of the base station to Pmax-3dB
3. From the 3GDemoBSU user panel select test 6.4.4 Total powerdynamic range.
4. Enter Frequency and Levels.
5. Configure the test set up by clicking the Configure button.
6. When the configuration is completed, enter your external attenuationon the FSx analyzer manually (Hardkey REF, SoftkeyREF LEVELOFFSET).
7. Start the test by clicking the Start button.
8. Check the Error Vector Magnitude in the RESULTS window.
9. Set total power at the RF output port of the base station to Pmax-18dB
10. Repeat the measurement.
Test results:
The downlink total power dynamic range shall be 17.7 dB or greater.
Fig.14 shows the result output from the demo program, Fig. 15 the resultdisplayed on the analyzer. The power of the test signal was set to -20 dBm,cables and connectors caused additional loss.
Fig. 14: Total power dynamic range: output from the demo program
Tests on 3G - Base Stations
1MA37 25 Rohde & Schwarz
A
50 %
B
50 %
Code Power Relative
50 %
CPICH Slot 0
50 %
SR 7.5 ksps
50 %
Chan Code 0
50 %
Chan Slot 1
50 %
Start Ch 0
50 %
64 Ch/
50 %
Stop Ch 511
50 %
SGL
50 %
1
50 %
CLRWR
50 %
50 %
1
50 %
CLRWR
50 %
50 %
Composite EVMRef Val Position
50 % CPICH Slot 0 50 %
SR 7.5 ksps
50 %Chan Code 0
50 % Chan Slot 1 50 %
Att*
50 %
0 dB
50 %
Att*
50 %
0 dB
50 %
Att*
50 %
0 dB
50 %
Att*
50 %
0 dB
50 %
Ref
50 %
-15.0
50 %
dBm
50 %
Ref
50 %
-15.0
50 %
dBm
50 %
Ref
50 %
-15.0
50 %
dBm
50 %
CF 2.112 GHz
50 %
Ref
50 %
-15.0
50 %
dBm
50 %
Ref
50 %
-15.0
50 %
dBm
50 %
Ref
50 %
-15.0
50 %
dBm
50 %CF 2.112 GHz 50 %
2
4
6
8
10
12
14
16
18
-63
-56
-49
-42
-35
-28
-21
-14
-7
50 % 50 %
0 1 2 3 4 5 6 7 8 9 10 11 12 13 140 1 2 3 4 5 6 7 8 9 10 11 12 13 14
1
Marker 1 [T1 ] 2.731 % Slot 0
0 1 2 3 4 5 6 7 8 9 10 11 12 13 14
Ref Val Position
50 %
Date: 5.APR.2002 10:57:13
Fig. 15: Total power dynamic range: result displayed on the analyzer
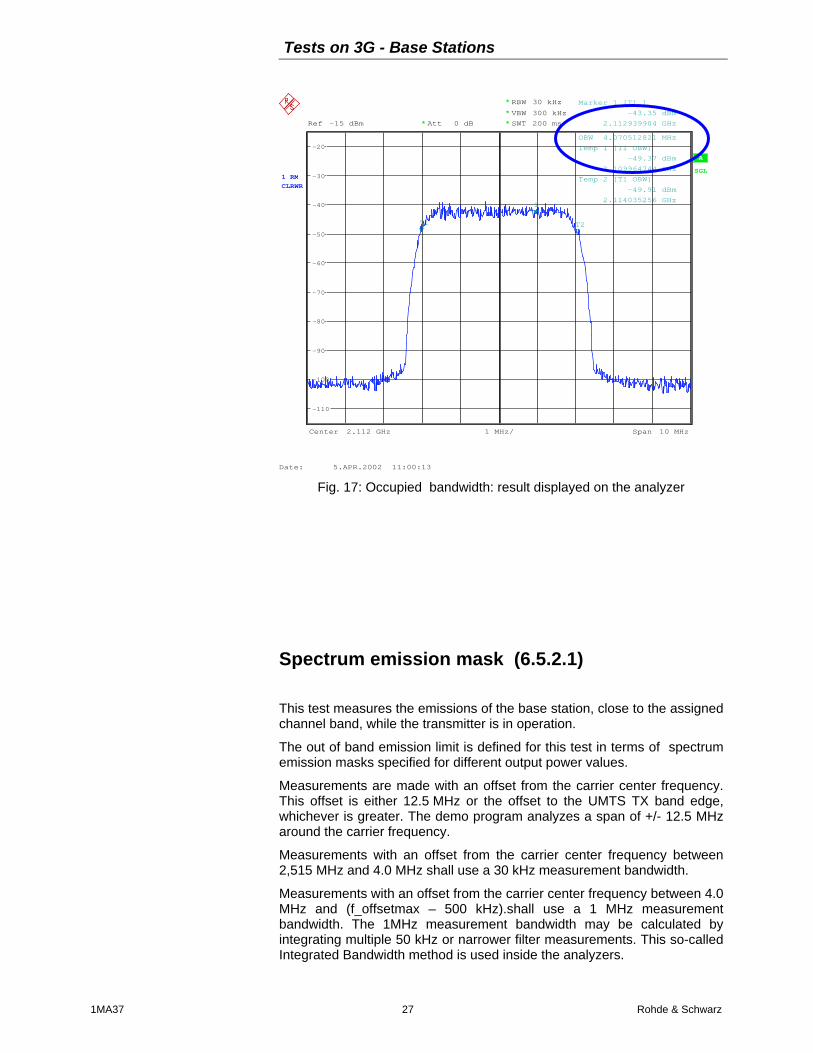
Occupied bandwidth (6.5.1)
The occupied bandwidth is the width of a frequency band such that, belowthe lower and above the upper frequency limits, the mean powers emittedare each equal to 0.5% of the total mean transmitted power.
! For measurements on a base station, disable the remote control ofSMIQ from the 3GDemoBSU user panel. Insert an attenuator (withsufficient attenuation) which can cope with the high power applied atthe base station TX output.
! For simulation, connect SMIQ output to the input of the FSx, andactivate Signal Settings Demo on the 3GDemoBSU user panel.

Tests on 3G - Base Stations
1MA37 26 Rohde & Schwarz
Test procedure on base station:
1. Start transmission of a single carrier according to test model 1.
2. From the 3GDemoBSU user panel select test 6.4.5 Occupiedbandwidth.
3. Enter Frequency and Levels.
4. Configure the test set up by clicking the Configure button.
5. Start the test by clicking the Start button.
6. Check the occupied bandwidth in the RESULTS window.
Test results:The occupied bandwidth shall be less than 5 MHz.
Fig. 16 shows the result output from the demo program, Fig. 17 the resultdisplayed on the analyzer.
Fig. 16: Occupied bandwidth: output from the demo program
Tests on 3G - Base Stations
1MA37 27 Rohde & Schwarz
A
RBW 30 kHz
VBW 300 kHz
SWT 200 ms
*
*
*
1 RMCLRWR
Att 0 dB*Ref -15 dBm
Center 2.112 GHz Span 10 MHz1 MHz/
SGL
-110
-100
-90
-80
-70
-60
-50
-40
-30
-20
1
Marker 1 [T1 ]
-43.35 dBm
2.112939904 GHz
OBW 4.070512821 MHz
T1
Temp 1 [T1 OBW]
-49.37 dBm
2.109964744 GHz
T2
Temp 2 [T1 OBW]
-49.91 dBm
2.114035256 GHz
Date: 5.APR.2002 11:00:13
Fig. 17: Occupied bandwidth: result displayed on the analyzer
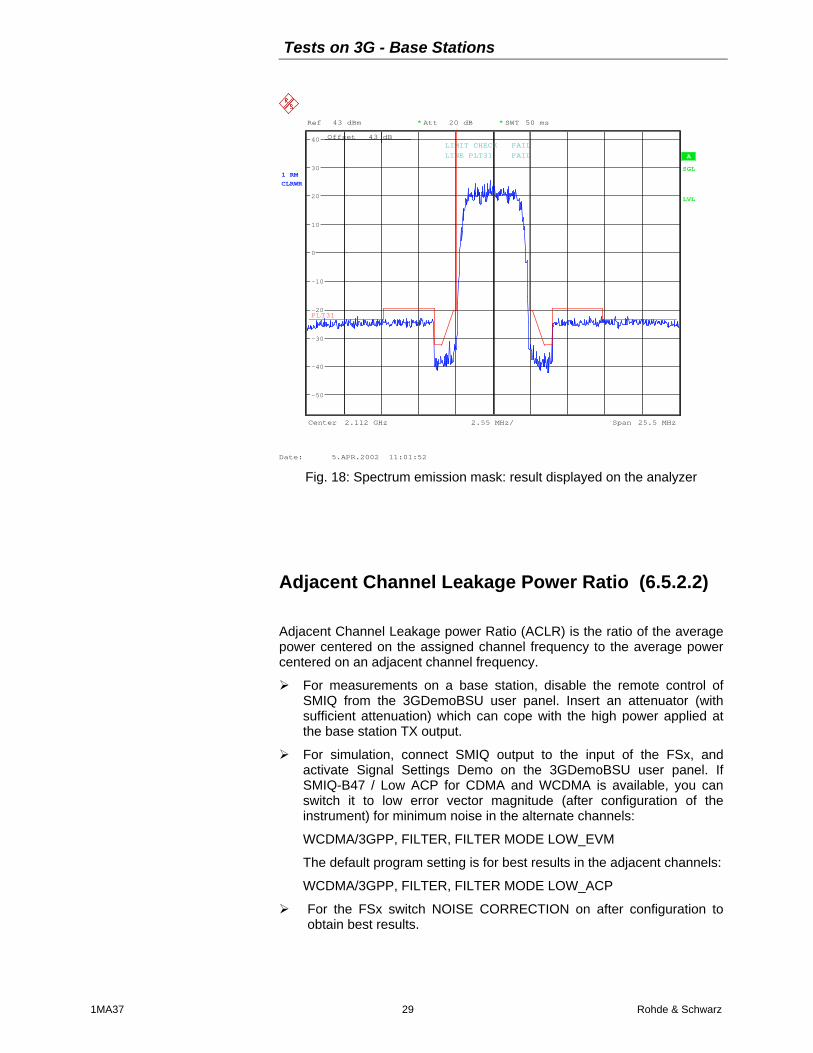
Spectrum emission mask (6.5.2.1)
This test measures the emissions of the base station, close to the assignedchannel band, while the transmitter is in operation.
The out of band emission limit is defined for this test in terms of spectrumemission masks specified for different output power values.
Measurements are made with an offset from the carrier center frequency.This offset is either 12.5 MHz or the offset to the UMTS TX band edge,whichever is greater. The demo program analyzes a span of +/- 12.5 MHzaround the carrier frequency.
Measurements with an offset from the carrier center frequency between2,515 MHz and 4.0 MHz shall use a 30 kHz measurement bandwidth.
Measurements with an offset from the carrier center frequency between 4.0MHz and (f_offsetmax – 500 kHz).shall use a 1 MHz measurementbandwidth. The 1MHz measurement bandwidth may be calculated byintegrating multiple 50 kHz or narrower filter measurements. This so-calledIntegrated Bandwidth method is used inside the analyzers.

Tests on 3G - Base Stations
1MA37 28 Rohde & Schwarz
! For measurements on a base station, disable the remote control ofSMIQ from the 3GDemoBSU user panel. Insert an attenuator (withsufficient attenuation) which can cope with the high power applied atthe base station TX output.
! For simulation, connect SMIQ output to the input of the FSx, andactivate Signal Settings Demo on the 3GDemoBSU user panel.
Test procedure on base station:1. Start transmission of a single carrier according to test model 1.
2. From the 3GDemoBSU user panel select test 6.5.2.1 Spectrumemission mask.
3. Enter Frequency and Levels.
4. Configure the test setup by clicking the Configure button.
5. When the configuration is completed, enter your external attenuationon the FSx analyzer manually (Hardkey REF, SoftkeyREF LEVELOFFSET).
6. Start the test by clicking the Start button.
7. Check the result on the analyzer's screen.
Test results:Limits are marked on the analyzer's screen as red lines (as in fig. 18). Alimit check indicates whether limits are exceeded or not.
Fig. 18 shows the result displayed on the analyzer.
Tests on 3G - Base Stations
1MA37 29 Rohde & Schwarz
A
SWT 50 ms*
1 RMCLRWR
Att 20 dB*
Offset 43 dB
LVL
Ref 43 dBm
Center 2.112 GHz Span 25.5 MHz2.55 MHz/
SGL
-50
-40
-30
-20
-10
0
10
20
30
40LIMIT CHECK FAIL
LINE PLT31 FAIL
PLT31
Date: 5.APR.2002 11:01:52
Fig. 18: Spectrum emission mask: result displayed on the analyzer
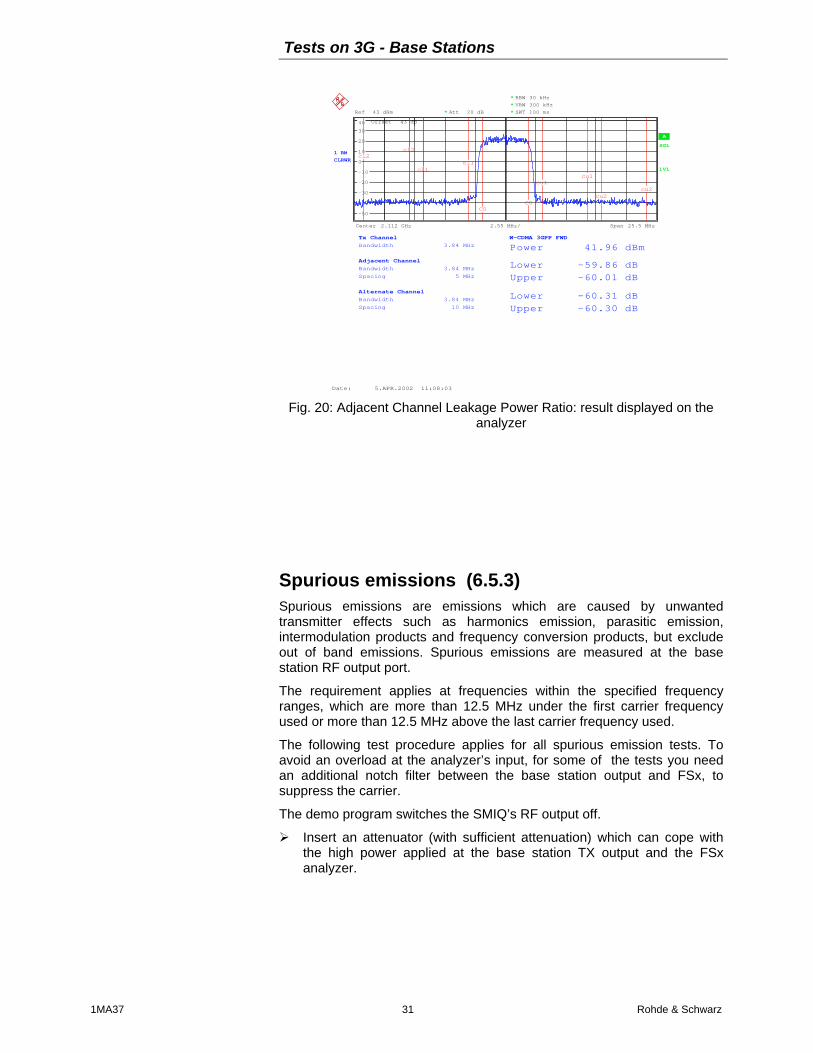
Adjacent Channel Leakage Power Ratio (6.5.2.2)
Adjacent Channel Leakage power Ratio (ACLR) is the ratio of the averagepower centered on the assigned channel frequency to the average powercentered on an adjacent channel frequency.
! For measurements on a base station, disable the remote control ofSMIQ from the 3GDemoBSU user panel. Insert an attenuator (withsufficient attenuation) which can cope with the high power applied atthe base station TX output.
! For simulation, connect SMIQ output to the input of the FSx, andactivate Signal Settings Demo on the 3GDemoBSU user panel. IfSMIQ-B47 / Low ACP for CDMA and WCDMA is available, you canswitch it to low error vector magnitude (after configuration of theinstrument) for minimum noise in the alternate channels:
WCDMA/3GPP, FILTER, FILTER MODE LOW_EVM
The default program setting is for best results in the adjacent channels:
WCDMA/3GPP, FILTER, FILTER MODE LOW_ACP
! For the FSx switch NOISE CORRECTION on after configuration toobtain best results.

Tests on 3G - Base Stations
1MA37 30 Rohde & Schwarz
Test procedure on base station:
1. Start transmission of a single carrier according to test model 1.
2. Set the base station to maximum output power as specified by themanufacturer.
3. From the 3GDemoBSU user panel select test 6.5.2.2 AdjacentChannel Leakage Power Ratio.
4. Enter Frequency and Levels.
5. Configure the test set up by clicking the Configure button.
6. When the configuration is completed, enter your external attenuationon the FSx analyzer (Hardkey REF, SoftkeyREF LEVEL OFFSET).
7. Start the test by clicking the Start button.
8. Check the result on the analyzer's screen.
Test results:
The ACLR of neighbour channels is diplayed on the RESULTS window andon the analyzer's screen.
Fig. 19 shows the result output from the demo program, Fig. 20 the resultdisplayed on the analyzer.
Fig. 19: Adjacent Channel Leakage Power Ratio: output from the demoprogram
Tests on 3G - Base Stations
1MA37 31 Rohde & Schwarz
A
RBW 30 kHzVBW 300 kHzSWT 100 ms
***
1 RMCLRWR
Att 20 dB*
Offset 43 dB
LVL
Ref 43 dBm
Center 2.112 GHz Span 25.5 MHz2.55 MHz/
SGL
-50
-40
-30
-20
-10
0
10
20
30
40
Tx Channel W-CDMA 3GPP FWD Bandwidth 3.84 MHz Power 41.96 dBm Adjacent Channel Bandwidth 3.84 MHz Lower -59.86 dB Spacing 5 MHz Upper -60.01 dB Alternate Channel Bandwidth 3.84 MHz Lower -60.31 dB Spacing 10 MHz Upper -60.30 dB
C0C0
cu2cu2
cu1cu1
cl1cl1
cl2cl2
Date: 5.APR.2002 11:08:03
Fig. 20: Adjacent Channel Leakage Power Ratio: result displayed on theanalyzer
Spurious emissions (6.5.3)Spurious emissions are emissions which are caused by unwantedtransmitter effects such as harmonics emission, parasitic emission,intermodulation products and frequency conversion products, but excludeout of band emissions. Spurious emissions are measured at the basestation RF output port.
The requirement applies at frequencies within the specified frequencyranges, which are more than 12.5 MHz under the first carrier frequencyused or more than 12.5 MHz above the last carrier frequency used.
The following test procedure applies for all spurious emission tests. Toavoid an overload at the analyzer’s input, for some of the tests you needan additional notch filter between the base station output and FSx, tosuppress the carrier.
The demo program switches the SMIQ’s RF output off.
! Insert an attenuator (with sufficient attenuation) which can cope withthe high power applied at the base station TX output and the FSxanalyzer.
Tests on 3G - Base Stations
1MA37 32 Rohde & Schwarz
Test procedure on base station:
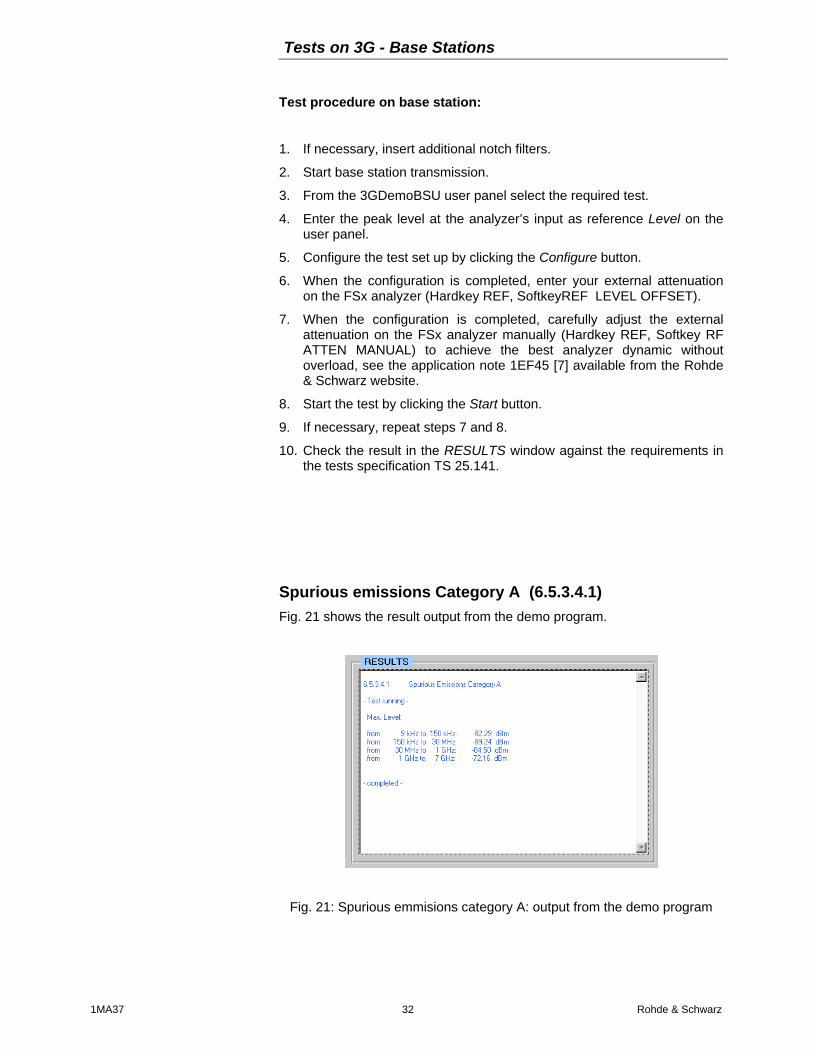
1. If necessary, insert additional notch filters.
2. Start base station transmission.
3. From the 3GDemoBSU user panel select the required test.
4. Enter the peak level at the analyzer’s input as reference Level on theuser panel.
5. Configure the test set up by clicking the Configure button.
6. When the configuration is completed, enter your external attenuationon the FSx analyzer (Hardkey REF, SoftkeyREF LEVEL OFFSET).
7. When the configuration is completed, carefully adjust the externalattenuation on the FSx analyzer manually (Hardkey REF, Softkey RFATTEN MANUAL) to achieve the best analyzer dynamic withoutoverload, see the application note 1EF45 [7] available from the Rohde& Schwarz website.
8. Start the test by clicking the Start button.
9. If necessary, repeat steps 7 and 8.
10. Check the result in the RESULTS window against the requirements inthe tests specification TS 25.141.
Spurious emissions Category A (6.5.3.4.1)Fig. 21 shows the result output from the demo program.
Fig. 21: Spurious emmisions category A: output from the demo program
Tests on 3G - Base Stations
1MA37 33 Rohde & Schwarz
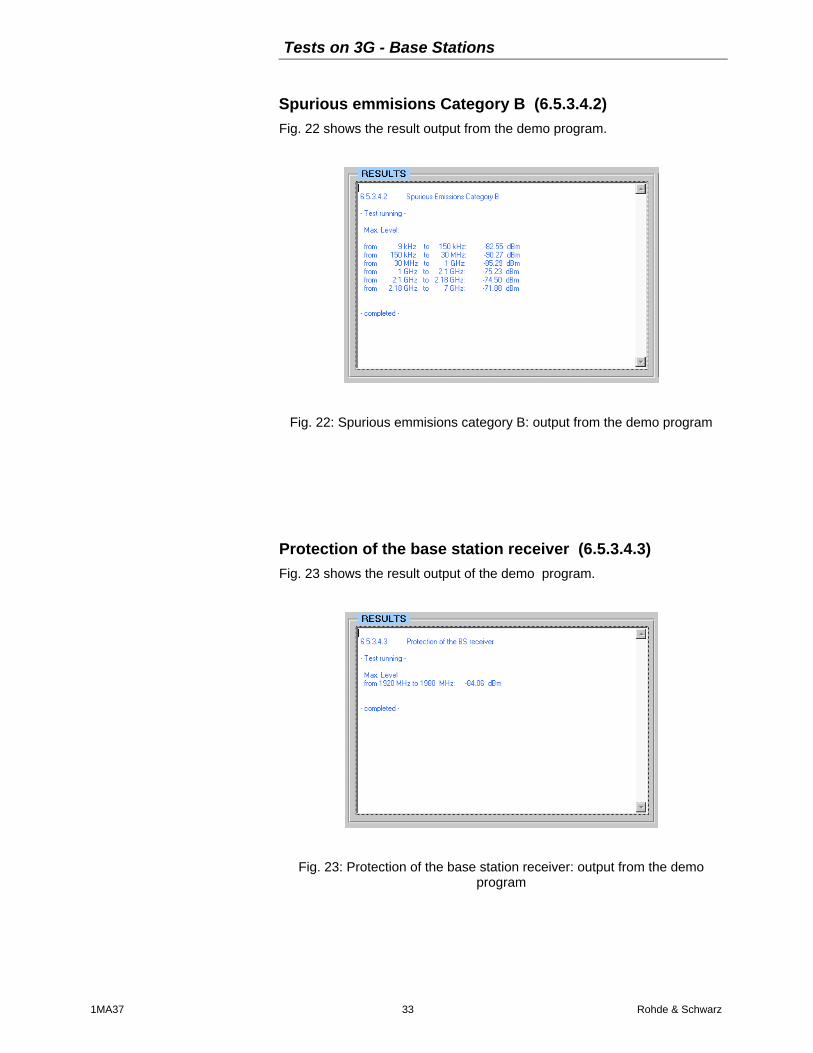
Spurious emmisions Category B (6.5.3.4.2)Fig. 22 shows the result output from the demo program.
Fig. 22: Spurious emmisions category B: output from the demo program
Protection of the base station receiver (6.5.3.4.3)Fig. 23 shows the result output of the demo program.
Fig. 23: Protection of the base station receiver: output from the demoprogram
Tests on 3G - Base Stations
1MA37 34 Rohde & Schwarz
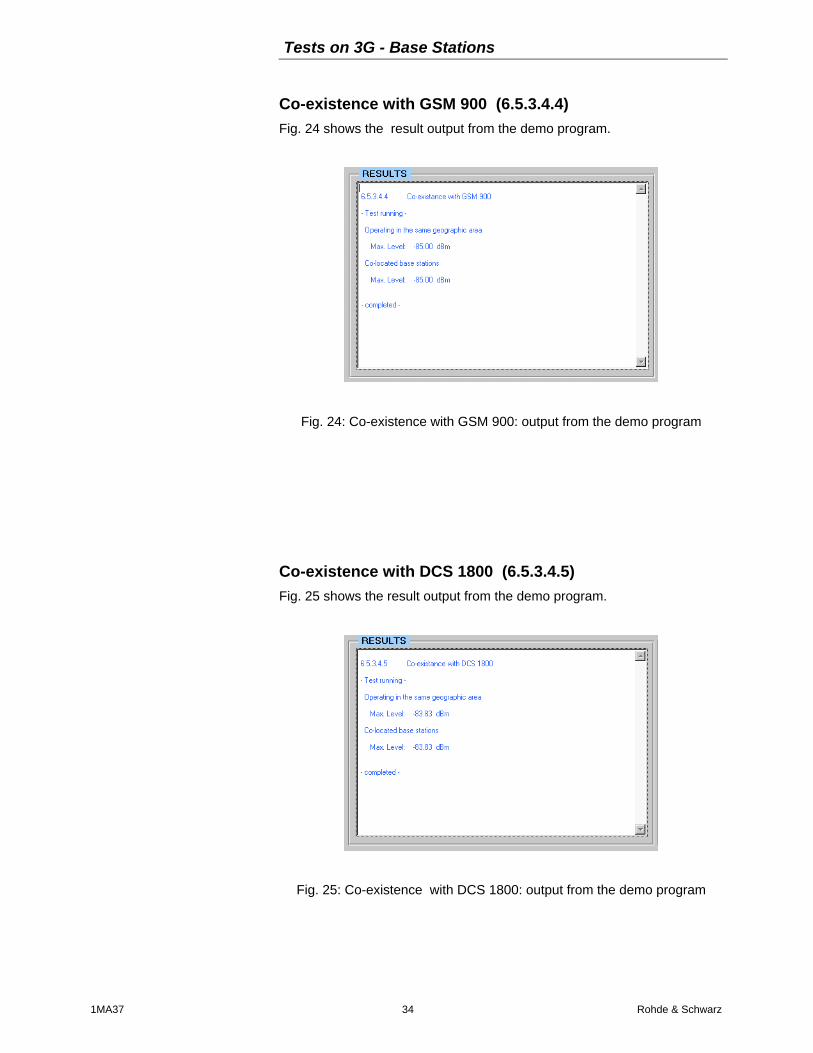
Co-existence with GSM 900 (6.5.3.4.4)Fig. 24 shows the result output from the demo program.
Fig. 24: Co-existence with GSM 900: output from the demo program
Co-existence with DCS 1800 (6.5.3.4.5)Fig. 25 shows the result output from the demo program.
Fig. 25: Co-existence with DCS 1800: output from the demo program
Tests on 3G - Base Stations
1MA37 35 Rohde & Schwarz
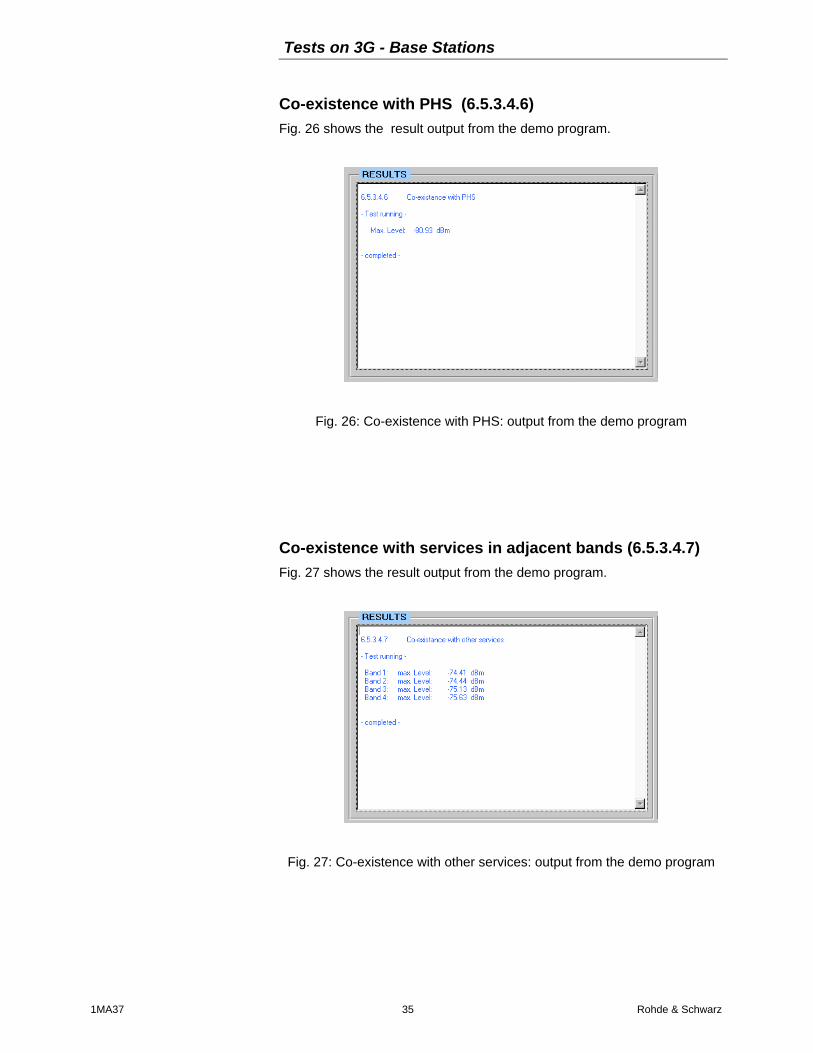
Co-existence with PHS (6.5.3.4.6)Fig. 26 shows the result output from the demo program.
Fig. 26: Co-existence with PHS: output from the demo program
Co-existence with services in adjacent bands (6.5.3.4.7)Fig. 27 shows the result output from the demo program.
Fig. 27: Co-existence with other services: output from the demo program
Tests on 3G - Base Stations
1MA37 36 Rohde & Schwarz
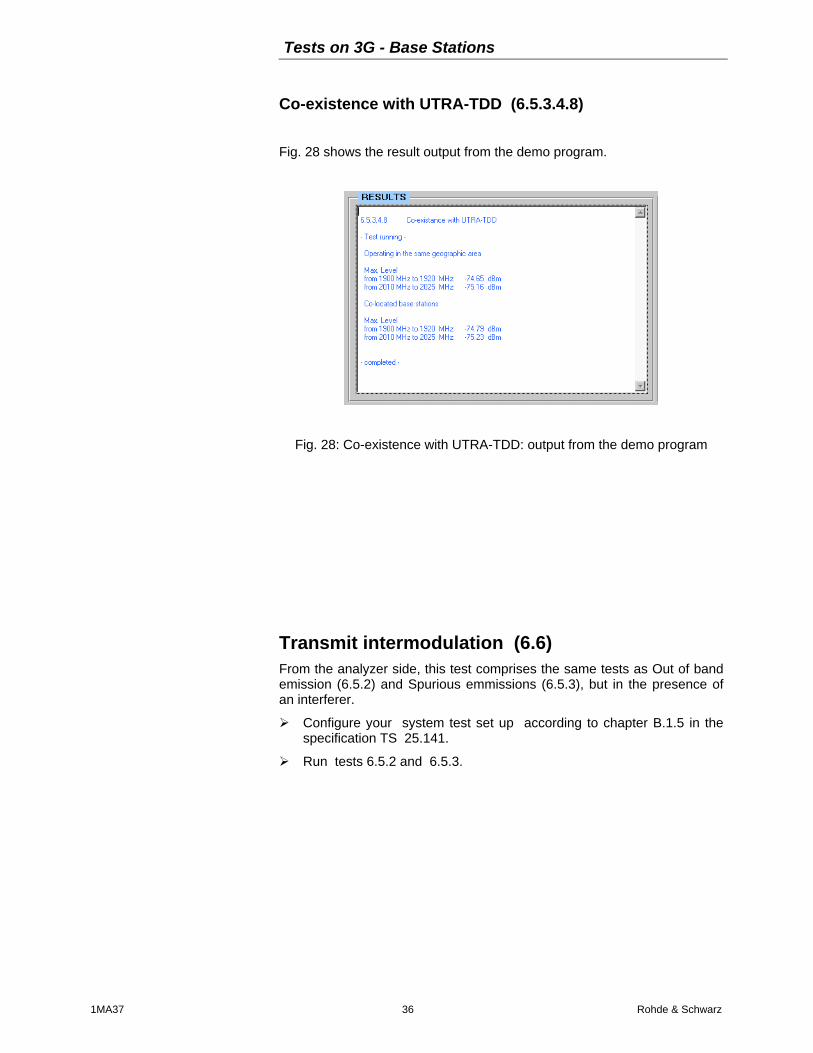
Co-existence with UTRA-TDD (6.5.3.4.8)
Fig. 28 shows the result output from the demo program.
Fig. 28: Co-existence with UTRA-TDD: output from the demo program
Transmit intermodulation (6.6)From the analyzer side, this test comprises the same tests as Out of bandemission (6.5.2) and Spurious emmissions (6.5.3), but in the presence ofan interferer.
! Configure your system test set up according to chapter B.1.5 in thespecification TS 25.141.
! Run tests 6.5.2 and 6.5.3.
Tests on 3G - Base Stations
1MA37 37 Rohde & Schwarz
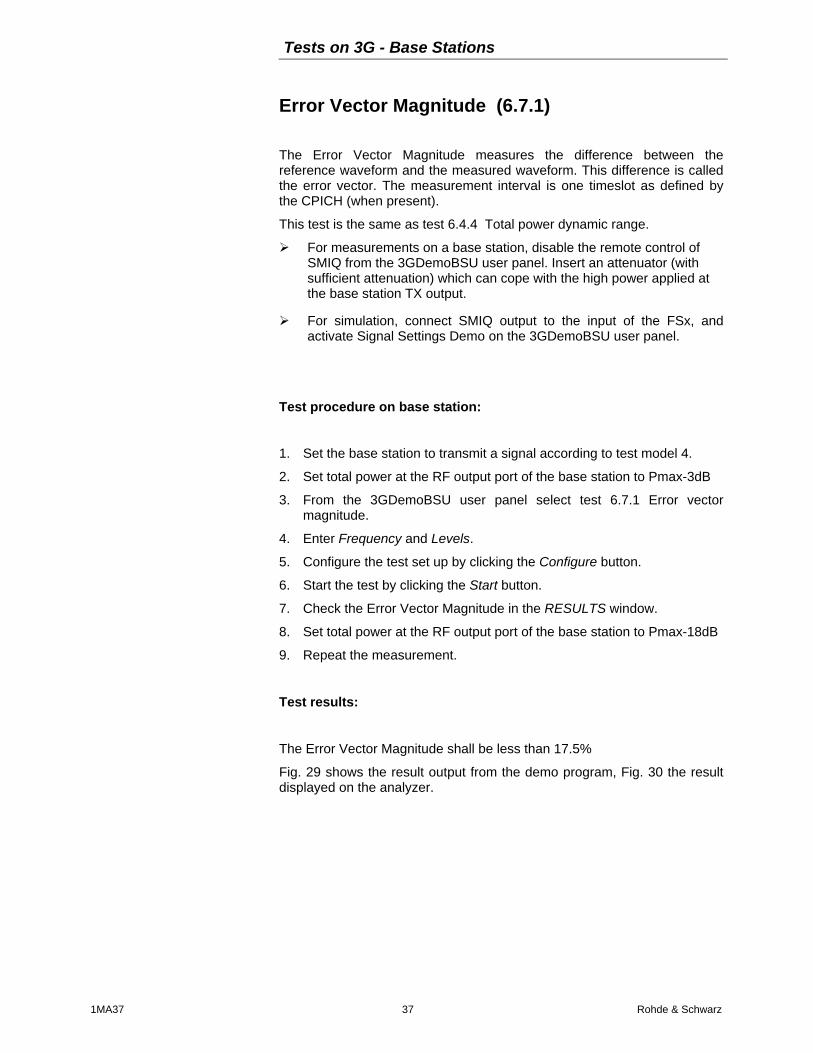
Error Vector Magnitude (6.7.1)
The Error Vector Magnitude measures the difference between thereference waveform and the measured waveform. This difference is calledthe error vector. The measurement interval is one timeslot as defined bythe CPICH (when present).
This test is the same as test 6.4.4 Total power dynamic range.
! For measurements on a base station, disable the remote control ofSMIQ from the 3GDemoBSU user panel. Insert an attenuator (withsufficient attenuation) which can cope with the high power applied atthe base station TX output.
! For simulation, connect SMIQ output to the input of the FSx, andactivate Signal Settings Demo on the 3GDemoBSU user panel.
Test procedure on base station:
1. Set the base station to transmit a signal according to test model 4.
2. Set total power at the RF output port of the base station to Pmax-3dB
3. From the 3GDemoBSU user panel select test 6.7.1 Error vectormagnitude.
4. Enter Frequency and Levels.
5. Configure the test set up by clicking the Configure button.
6. Start the test by clicking the Start button.
7. Check the Error Vector Magnitude in the RESULTS window.
8. Set total power at the RF output port of the base station to Pmax-18dB
9. Repeat the measurement.
Test results:
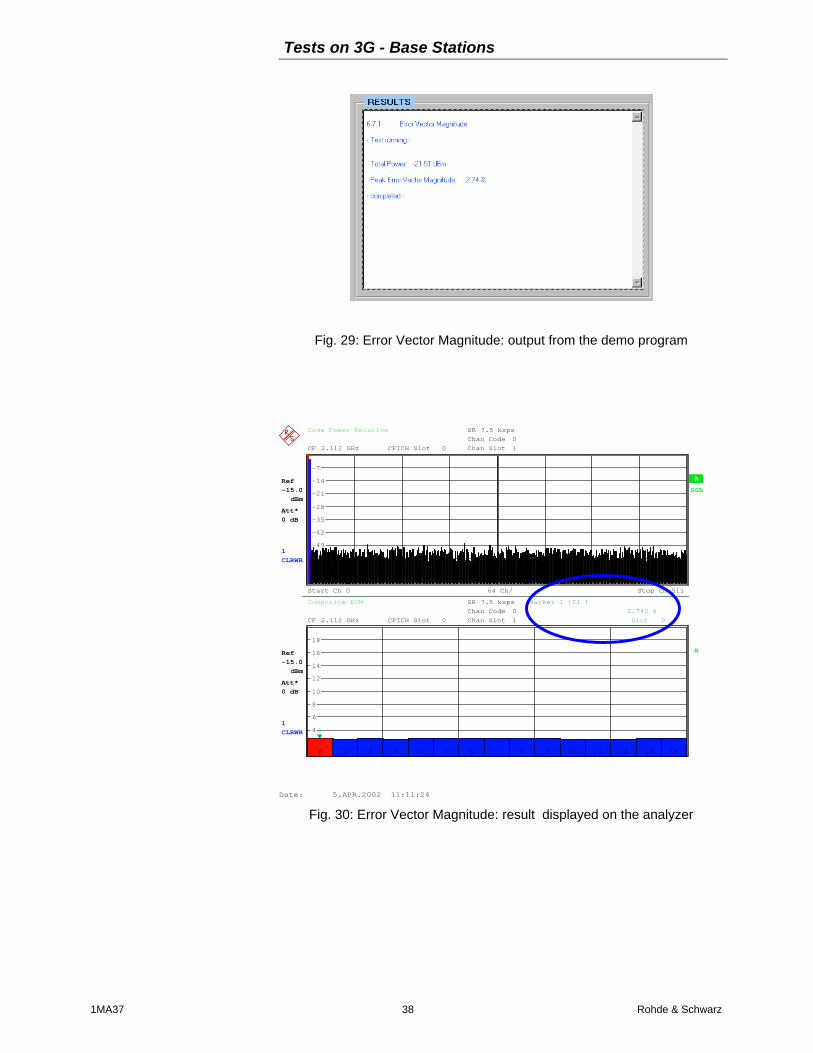
The Error Vector Magnitude shall be less than 17.5%
Fig. 29 shows the result output from the demo program, Fig. 30 the resultdisplayed on the analyzer.
Tests on 3G - Base Stations
1MA37 38 Rohde & Schwarz
Fig. 29: Error Vector Magnitude: output from the demo program
A
B
Code Power Relative
CPICH Slot 0
SR 7.5 kspsChan Code 0 Chan Slot 1
Start Ch 0 64 Ch/ Stop Ch 511
SGL
1 CLRWR
1 CLRWR
Composite EVM
CPICH Slot 0
SR 7.5 kspsChan Code 0 Chan Slot 1
Att* 0 dBAtt* 0 dB
Att* 0 dBAtt* 0 dB
Ref -15.0
dBm
Ref -15.0
dBm
Ref -15.0
dBm
CF 2.112 GHz
Ref -15.0
dBm
Ref -15.0
dBm
Ref -15.0
dBm
CF 2.112 GHz
2
4
6
8
10
12
14
16
18
-63
-56
-49
-42
-35
-28
-21
-14
-7
0 1 2 3 4 5 6 7 8 9 10 11 12 13 140 1 2 3 4 5 6 7 8 9 10 11 12 13 14
1
Marker 1 [T1 ] 2.740 % Slot 0
0 1 2 3 4 5 6 7 8 9 10 11 12 13 14
Date: 5.APR.2002 11:11:24
Fig. 30: Error Vector Magnitude: result displayed on the analyzer

Tests on 3G - Base Stations
1MA37 39 Rohde & Schwarz
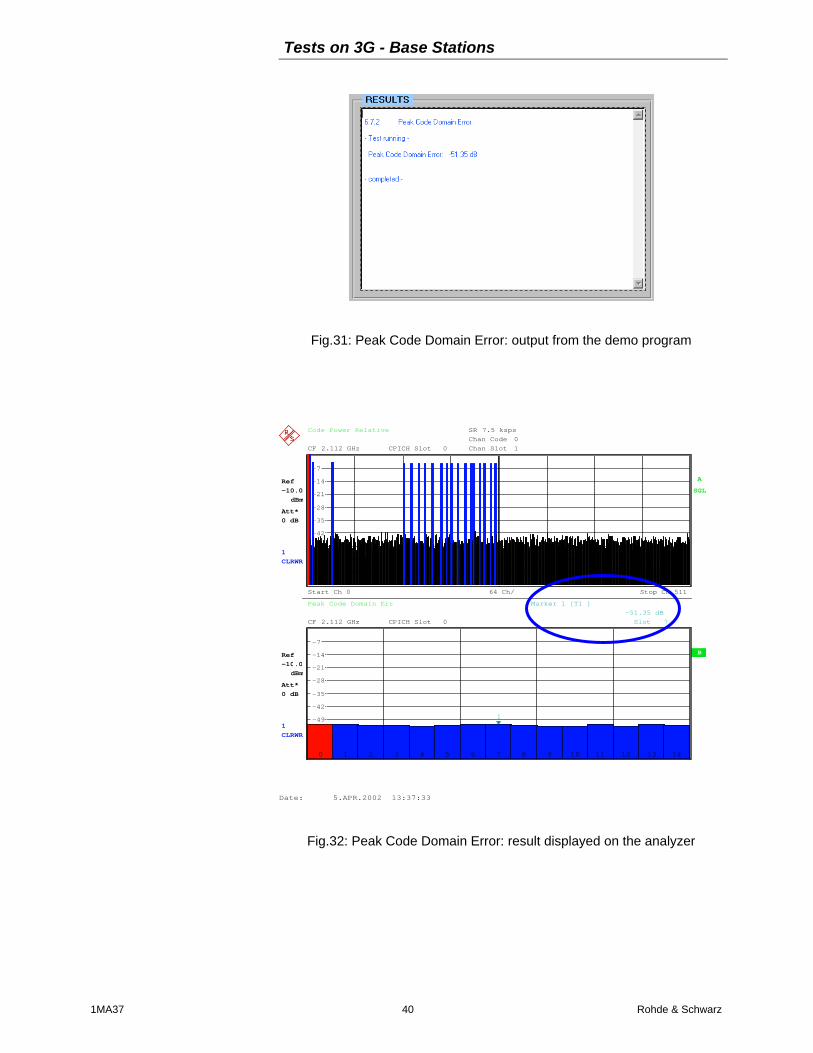
Peak Code Domain Error (6.7.2)
The Peak Code Domain Error is computed by projecting the error vector(as defined in 6.7.1) onto the code domain at a specific spreading factor.The Code Domain Error for every code in the domain is defined as the ratioof the mean power of the projection onto that code, to the mean power ofthe composite reference waveform. This ratio is expressed in dB. The PeakCode Domain Error is defined as the maximum value for the Code DomainError for all codes. The measurement interval is one timeslot as defined bythe CPICH (when present).
! For measurements on a base station, disable the remote control ofSMIQ from the 3GDemoBSU user panel. Insert an attenuator (withsufficient attenuation) which can cope with the high power applied atthe base station TX output and the FSx analyzer.
! For simulation, connect SMIQ output to the input of the FSx, andactivate Signal Settings Demo on the 3GDemoBSU user panel.
Test procedure on base station:
1. Set the base station to transmit a signal according to test model 3.
2. Set total power at the RF output port of the base station to Pmax-3dB
3. From the 3GDemoBSU user panel select test 6.7.2
4. Enter Frequency and Levels.
5. Configure the test set up by clicking the Configure button.
6. Start the test set up by clicking the Start button.
7. Check the peak code domain error in the RESULTS window.
8. Set total power at the RF output port of the base station to Pmax-18dB
9. Repeat the measurement.
Test results:
The peak code domain error shall not exceed -33 dB at spreading factor256.
Fig. 31 shows the result output from the demo program, Fig. 32 the resultdisplayed on the analyzer.
Tests on 3G - Base Stations
1MA37 40 Rohde & Schwarz
Fig.31: Peak Code Domain Error: output from the demo program
lo
Ref -10.0
dBm
Ref -10.0
dBm
Ref -10.0
dBm
1 CLRWR
Code Power Relative
CF 2.112 GHz CPICH Slot 0
SR 7.5 kspsChan Code 0 Chan Slot 1
Start Ch 0 64 Ch/ Stop Ch 511
A
SGL
Ref -10.0
dBm
Ref -10.0
dBm
Ref -10.0
dBm
1 CLRWR
Peak Code Domain Err
CF 2.112 GHz CPICH Slot 0
B
Att* 0 dBAtt* 0 dB
Att* 0 dBAtt* 0 dB
-63
-56
-49
-42
-35
-28
-21
-14
-7
-63
-56
-49
-42
-35
-28
-21
-14
-7
0 1 2 3 4 5 6 7 8 9 10 11 12 13 140 1 2 3 4 5 6 7 8 9 10 11 12 13 14
1
Marker 1 [T1 ] -51.35 dB Slot 7
0 1 2 3 4 5 6 7 8 9 10 11 12 13 14
Date: 5.APR.2002 13:37:33
Fig.32: Peak Code Domain Error: result displayed on the analyzer
Tests on 3G - Base Stations
1MA37 41 Rohde & Schwarz
7 Receiver Tests
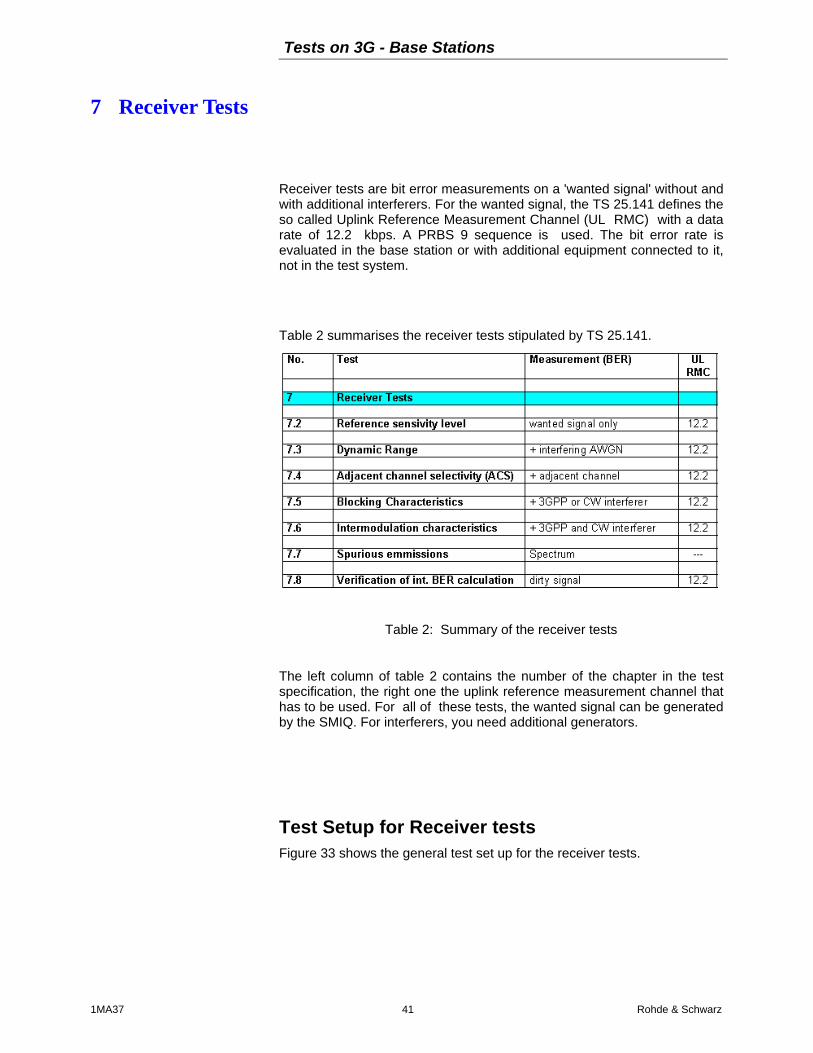
Receiver tests are bit error measurements on a 'wanted signal' without andwith additional interferers. For the wanted signal, the TS 25.141 defines theso called Uplink Reference Measurement Channel (UL RMC) with a datarate of 12.2 kbps. A PRBS 9 sequence is used. The bit error rate isevaluated in the base station or with additional equipment connected to it,not in the test system.
Table 2 summarises the receiver tests stipulated by TS 25.141.
Table 2: Summary of the receiver tests
The left column of table 2 contains the number of the chapter in the testspecification, the right one the uplink reference measurement channel thathas to be used. For all of these tests, the wanted signal can be generatedby the SMIQ. For interferers, you need additional generators.
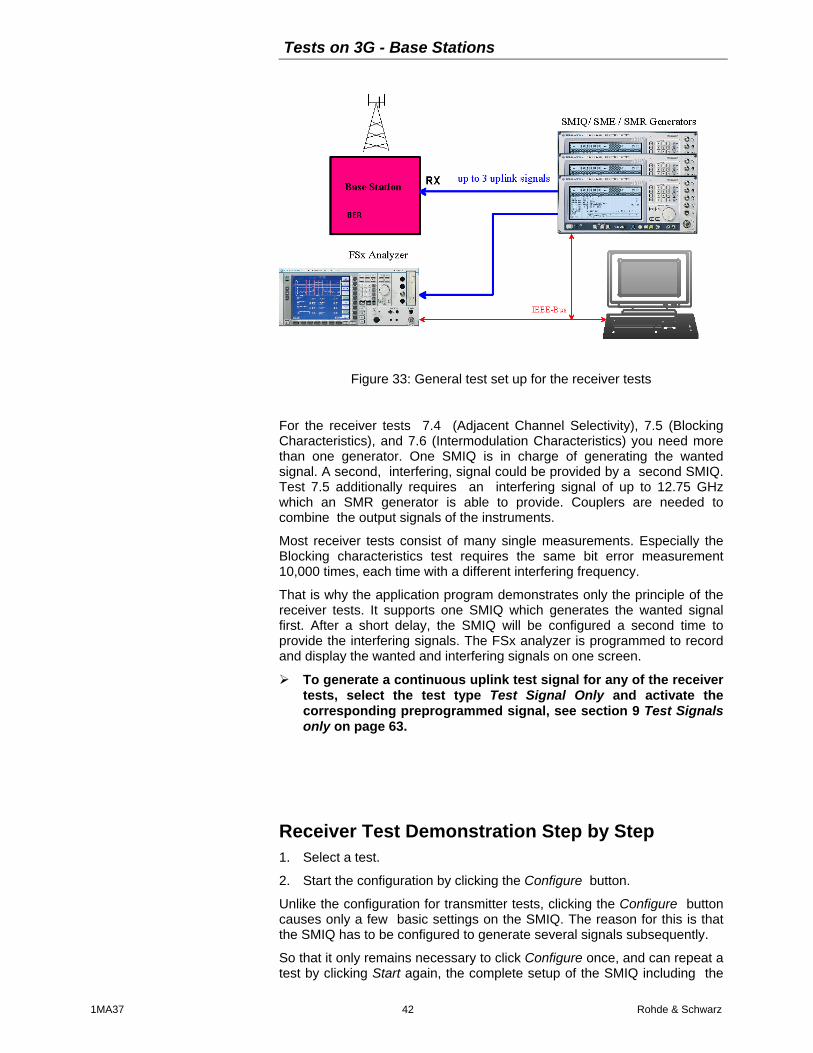
Test Setup for Receiver testsFigure 33 shows the general test set up for the receiver tests.
Tests on 3G - Base Stations
1MA37 42 Rohde & Schwarz
Figure 33: General test set up for the receiver tests
For the receiver tests 7.4 (Adjacent Channel Selectivity), 7.5 (BlockingCharacteristics), and 7.6 (Intermodulation Characteristics) you need morethan one generator. One SMIQ is in charge of generating the wantedsignal. A second, interfering, signal could be provided by a second SMIQ.Test 7.5 additionally requires an interfering signal of up to 12.75 GHzwhich an SMR generator is able to provide. Couplers are needed tocombine the output signals of the instruments.
Most receiver tests consist of many single measurements. Especially theBlocking characteristics test requires the same bit error measurement10,000 times, each time with a different interfering frequency.
That is why the application program demonstrates only the principle of thereceiver tests. It supports one SMIQ which generates the wanted signalfirst. After a short delay, the SMIQ will be configured a second time toprovide the interfering signals. The FSx analyzer is programmed to recordand display the wanted and interfering signals on one screen.
! To generate a continuous uplink test signal for any of the receivertests, select the test type Test Signal Only and activate thecorresponding preprogrammed signal, see section 9 Test Signalsonly on page 63.
Receiver Test Demonstration Step by Step1. Select a test.
2. Start the configuration by clicking the Configure button.
Unlike the configuration for transmitter tests, clicking the Configure buttoncauses only a few basic settings on the SMIQ. The reason for this is thatthe SMIQ has to be configured to generate several signals subsequently.
So that it only remains necessary to click Configure once, and can repeat atest by clicking Start again, the complete setup of the SMIQ including the

Tests on 3G - Base Stations
1MA37 43 Rohde & Schwarz
calculation of the uplink reference measurement channel has been movedto the Start actions.
After clicking the Configure button, the connected instruments are reset,so that no inadvertent setting disturbs the test. Reset switches the SMIQ tointernal reference, whereas the FSx’s reference setting will be not affected.
The FSx – if present with remote control enabled – will be set up asrequired for the selected test. On the SMIQ, only frequency and level is set.The RF is switched off.
Note: If you do not need the analyzer, disable FSx control in the remotecontrol checkbox. This speeds up the configuration.
3. Start the selected test by clicking the Start button.
Clicking the Start button sets up the SMIQ for the wanted signal andswitches the RF output on. If the FSx analyzer is connected, and remotecontrol enabled, a first result is recorded. Then the second signal is set upand recorded as a second trace by the analyzer, and so on. When the testis completed, all signals are displayed on the analyzer’s screen.
The LEDs on the user panel indicate the status of the instruments.
Notes: The receiver tests according to TS 25.141 work with verylow power levels. If you want to monitor these signals, youneed a preamplifier for the analyzer. The Demo SignalSetting, however, is high enough to fit into the dynamicrange of the FSx.
For more detailed information about the receiver tests withSMIQ, see the application note 1GP41 [6] available fromthe Rohde & Schwarz website.
For synchronisation of base station and SMIQ, see section9 Test Signals only on page 63.
Reference Sensitivity Level (7.2)The reference sensitivity is the minimum receiver input power measured atthe antenna connector at which the BER does not exceed 0.001. This testis performed without an interfering signal.
! For measurements on a base station, disable the FSx remote controland Signal Settings Demo from the 3GDemoBSU user panel.
! For simulation, connect the SMIQ output to the input of FSx, andactivate Signal Settings Demo on the 3GDemoBSU user panel.
Test procedure on base station: 1. Set the base station frequency.
2. From the 3GDemoBSU user panel select test 7.2 Reference SensitivityLevel.
3. Set Frequency of the SMIQ to the DUT uplink frequency.
Tests on 3G - Base Stations
1MA37 44 Rohde & Schwarz
4. Set Level of the SMIQ to a nominal value.
5. Configure the test set up by clicking the Configure button.
6. Start the test set up by clicking the Start button.
7. Calculate BER from at least 30,000 received data bits.
8. Set Level of the SMIQ to -121 dBm.
9. Measure BER.
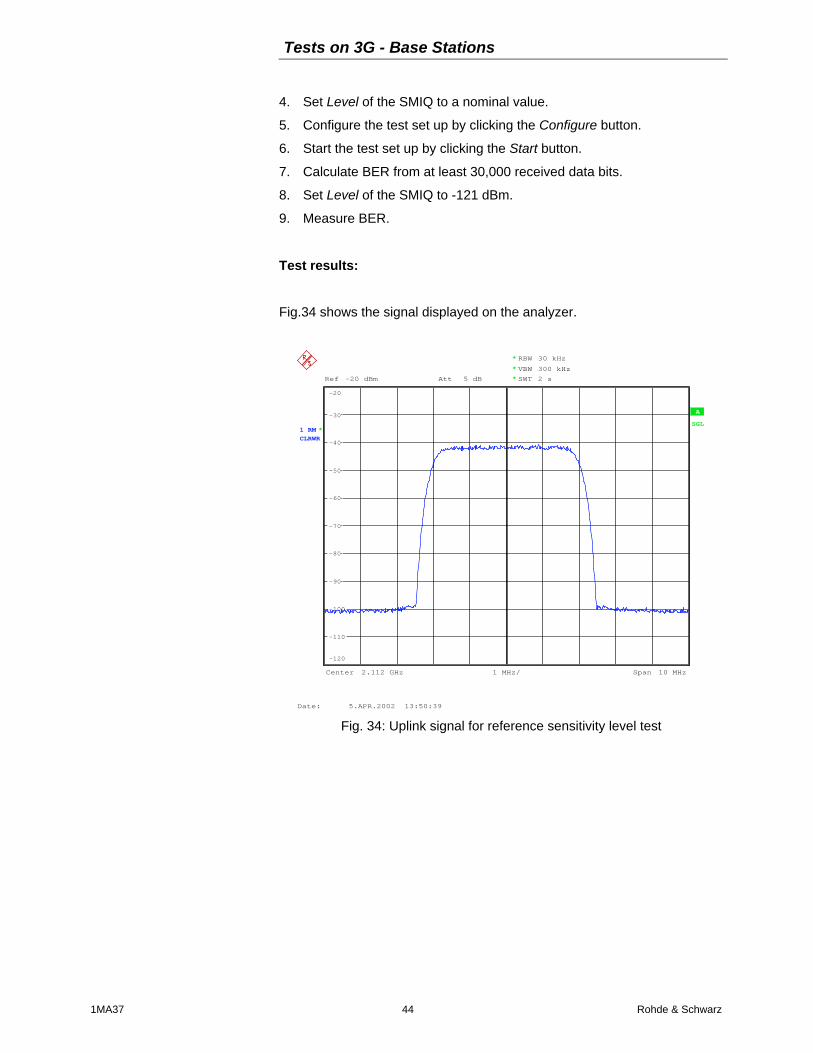
Test results:
Fig.34 shows the signal displayed on the analyzer.
A
Ref -20 dBm Att 5 dB
SGL
Center 2.112 GHz Span 10 MHz1 MHz/
RBW 30 kHz*
* VBW 300 kHz
SWT 2 s
CLRWR*1 RM
*
-120
-110
-100
-90
-80
-70
-60
-50
-40
-30
-20
Date: 5.APR.2002 13:50:39
Fig. 34: Uplink signal for reference sensitivity level test
Tests on 3G - Base Stations
1MA37 45 Rohde & Schwarz
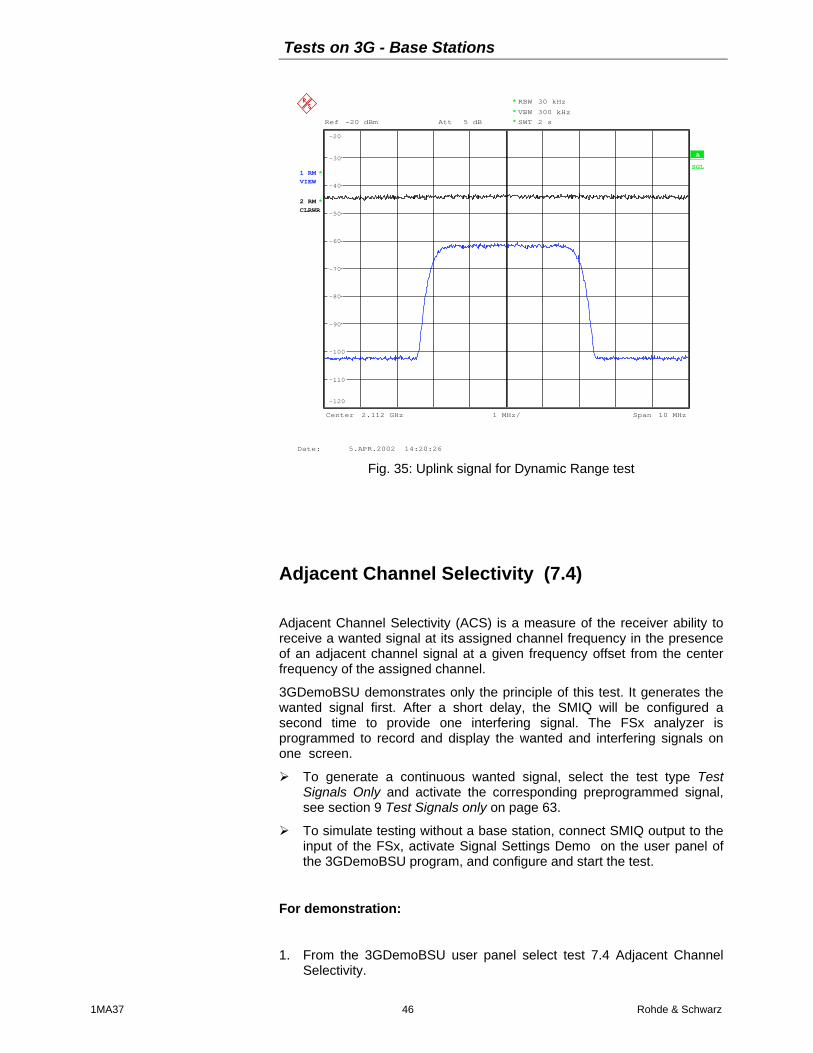
Dynamic Range (7.3)
Receiver dynamic range is the receiver's ability to handle a rise ofinterference in the reception frequency channel.
The test purpose is to verify the ability of the base station to receive asingle-code test signal of -91 dBm in the presence of an interfering AWGNsignal of -73 dBm / 3.84 MHz with a BER not exceeding 0.001.
Because the AWGN generator of the SMIQ uses a system bandwidth oftwo times 3.84 MHz for the demo program, the carrier / noise ratio has tobe decreased by 3 dB:
-(91 dBm - 73 dBm) - 3 dBm = -21 dBm.
! For measurements on a base station, disable the FSx remote controland Signal Settings Demo from the 3GDemoBSU user panel.
! For simulation, connect the SMIQ output to the input of FSx, andactivate Signal Settings Demo on the 3GDemoBSU user panel.
Test procedure on base station:
1. Set the base station frequency.
2. From the 3GDemoBSU user panel select test 7.3 Dynamic Range.
3. Set Frequency of the SMIQ to the DUT uplink frequency.
4. Set Level of the SMIQ to - 91 dBm.
5. Configure the test set up by clicking the Configure button.
6. Start the test by clicking the Start button.
7. Wait until the AWGN noise is switched on.
8. Measure BER.
Test results:
Fig. 35 shows the uplink signal without AWGN (below), and with AWGN(above).
Tests on 3G - Base Stations
1MA37 46 Rohde & Schwarz
Ref -20 dBm Att 5 dB
A
SGL
Center 2.112 GHz Span 10 MHz1 MHz/
RBW 30 kHz*
SWT 2 s
* VBW 300 kHz
*1 RMVIEW
CLRWR*2 RM
*
-120
-110
-100
-90
-80
-70
-60
-50
-40
-30
-20
Date: 5.APR.2002 14:20:26
Fig. 35: Uplink signal for Dynamic Range test
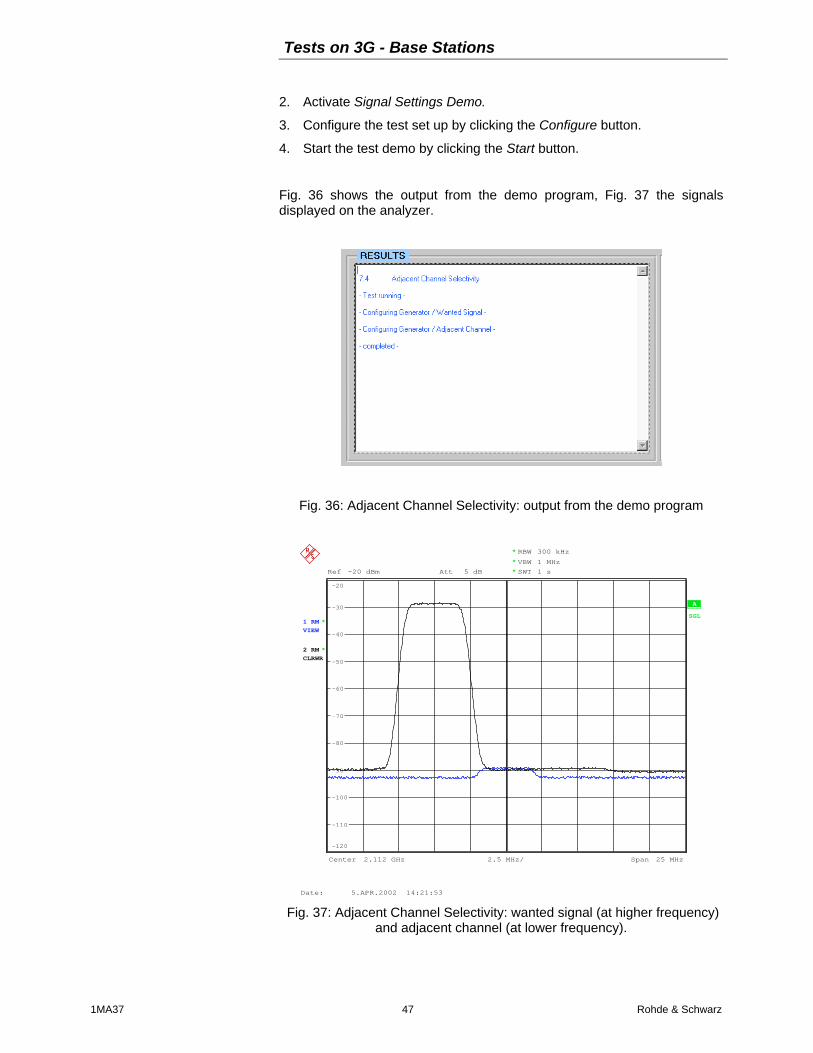
Adjacent Channel Selectivity (7.4)
Adjacent Channel Selectivity (ACS) is a measure of the receiver ability toreceive a wanted signal at its assigned channel frequency in the presenceof an adjacent channel signal at a given frequency offset from the centerfrequency of the assigned channel.
3GDemoBSU demonstrates only the principle of this test. It generates thewanted signal first. After a short delay, the SMIQ will be configured asecond time to provide one interfering signal. The FSx analyzer isprogrammed to record and display the wanted and interfering signals onone screen.
! To generate a continuous wanted signal, select the test type TestSignals Only and activate the corresponding preprogrammed signal,see section 9 Test Signals only on page 63.
! To simulate testing without a base station, connect SMIQ output to theinput of the FSx, activate Signal Settings Demo on the user panel ofthe 3GDemoBSU program, and configure and start the test.
For demonstration:
1. From the 3GDemoBSU user panel select test 7.4 Adjacent ChannelSelectivity.
Tests on 3G - Base Stations
1MA37 47 Rohde & Schwarz
2. Activate Signal Settings Demo.
3. Configure the test set up by clicking the Configure button.
4. Start the test demo by clicking the Start button.
Fig. 36 shows the output from the demo program, Fig. 37 the signalsdisplayed on the analyzer.
Fig. 36: Adjacent Channel Selectivity: output from the demo program
Ref -20 dBm Att 5 dB
A
SGL
Center 2.112 GHz Span 25 MHz2.5 MHz/
* RBW 300 kHz
SWT 1 s
*1 RMVIEW
CLRWR
*
2 RM
VBW 1 MHz*
*
-120
-110
-100
-90
-80
-70
-60
-50
-40
-30
-20
Date: 5.APR.2002 14:21:53
Fig. 37: Adjacent Channel Selectivity: wanted signal (at higher frequency)and adjacent channel (at lower frequency).

Tests on 3G - Base Stations
1MA37 48 Rohde & Schwarz
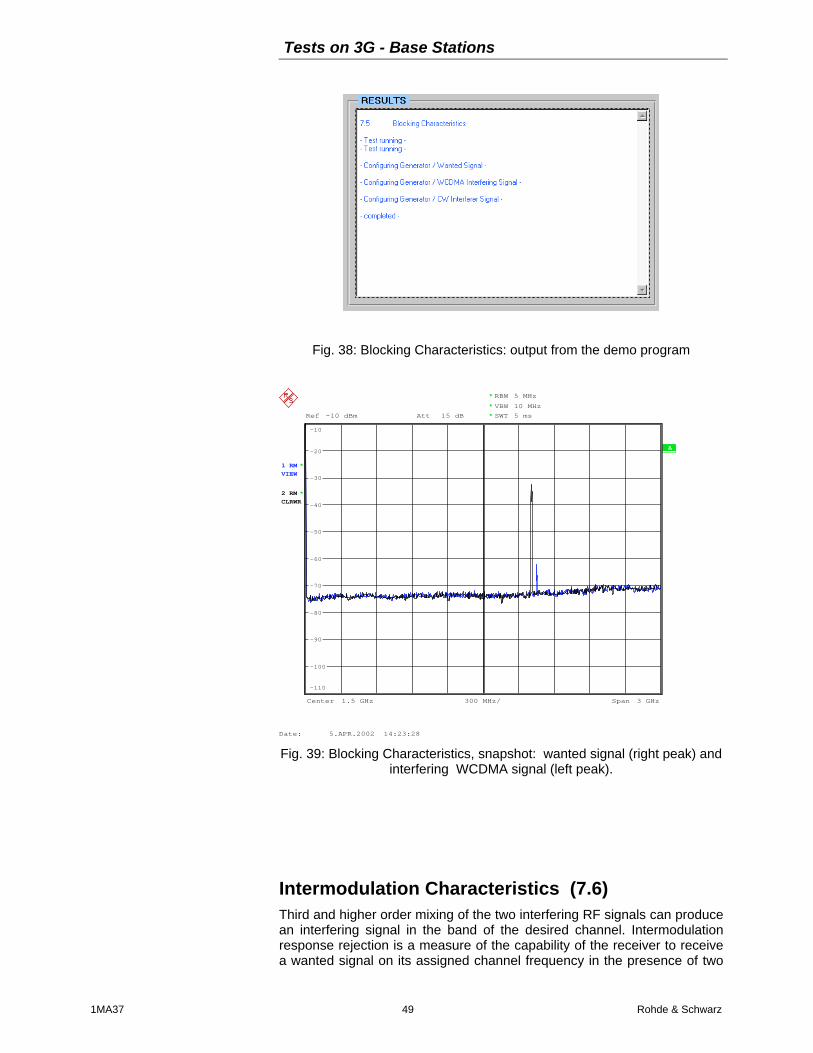
Blocking Characteristics (7.5)
The blocking characteristics is a measure of the receiver ability to receive awanted signal at its assigned channel frequency in the presence of anunwanted interferer on frequencies other than those of the adjacentchannels.
3GDemoBSU demonstrates only the principle of this test. According to TS25.141, you have to completely measure the Bit Error Rate BER at every 1MHz increment in the range from 1 MHz to 12.7 GHz, using 1 MHz steps.This takes too long for a demo program.
This set up is for demonstration only. It generates the wanted signal first.After a short delay, the SMIQ will be configured a second time to provideone WCDMA interfering signal which has to be applied in a range from 20MHz below the uplink band to a frequency 10 MHz below the wantedsignal, and from 10 MHz above the wanted signal to 20 MHz above theuplink band. Afterwards, a second interferer (a CW signal) is generated infrequency range from 1 MHz to 20 MHz range below the uplink band, andup from 20 MHz above the uplink band.
The FSx analyzer is programmed to record and display the wanted andinterfering signals on one screen.
! To generate a continuous wanted signal, select the test type TestSignals Only and activate the corresponding preprogrammed signal,see section 9 Test Signals only on page 63.
! To simulate testing without a base station, connect SMIQ output to theinput of the FSx, activate Signal Settings Demo on the user panel ofthe 3GDemoBSU program, and configure and start the test set up.
For demonstration:
1. Connect the SMIQ output to the FSx input port.
2. From the 3GDemoBSU user panel select test 7.5 Blockingcharacteristics.
3. Activate Signal Settings Demo.
4. Configure the test set up by clicking the Configure button.
5. Start the test by clicking the Start button.
Fig. 38 shows the output from the demo program, Fig. 39 the signalsdisplayed on the analyzer.
Tests on 3G - Base Stations
1MA37 49 Rohde & Schwarz
Fig. 38: Blocking Characteristics: output from the demo program
A
Ref -10 dBm Att 15 dB
Center 1.5 GHz Span 3 GHz300 MHz/
RBW 5 MHz
SWT 5 ms
*
*1 RMVIEW
CLRWR
*
2 RM
VBW 10 MHz*
*
-110
-100
-90
-80
-70
-60
-50
-40
-30
-20
-10
Date: 5.APR.2002 14:23:28
Fig. 39: Blocking Characteristics, snapshot: wanted signal (right peak) andinterfering WCDMA signal (left peak).
Intermodulation Characteristics (7.6)Third and higher order mixing of the two interfering RF signals can producean interfering signal in the band of the desired channel. Intermodulationresponse rejection is a measure of the capability of the receiver to receivea wanted signal on its assigned channel frequency in the presence of two
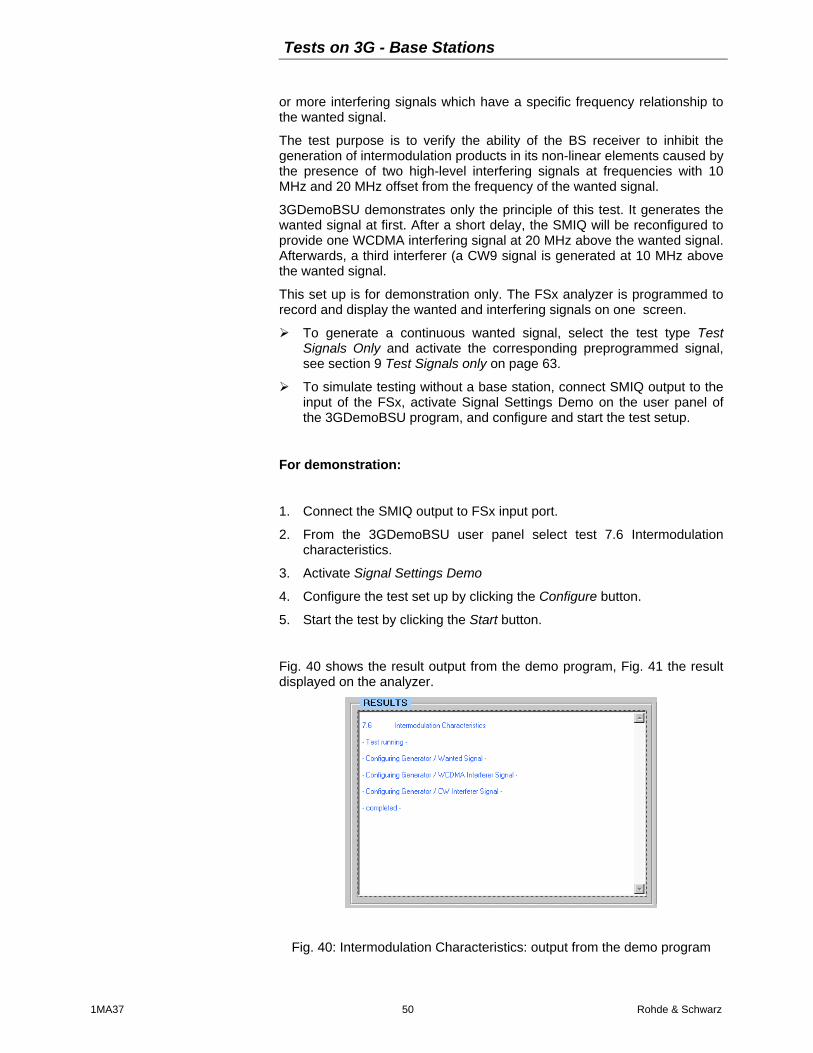
Tests on 3G - Base Stations
1MA37 50 Rohde & Schwarz
or more interfering signals which have a specific frequency relationship tothe wanted signal.
The test purpose is to verify the ability of the BS receiver to inhibit thegeneration of intermodulation products in its non-linear elements caused bythe presence of two high-level interfering signals at frequencies with 10MHz and 20 MHz offset from the frequency of the wanted signal.
3GDemoBSU demonstrates only the principle of this test. It generates thewanted signal at first. After a short delay, the SMIQ will be reconfigured toprovide one WCDMA interfering signal at 20 MHz above the wanted signal.Afterwards, a third interferer (a CW9 signal is generated at 10 MHz abovethe wanted signal.
This set up is for demonstration only. The FSx analyzer is programmed torecord and display the wanted and interfering signals on one screen.
! To generate a continuous wanted signal, select the test type TestSignals Only and activate the corresponding preprogrammed signal,see section 9 Test Signals only on page 63.
! To simulate testing without a base station, connect SMIQ output to theinput of the FSx, activate Signal Settings Demo on the user panel ofthe 3GDemoBSU program, and configure and start the test setup.
For demonstration:
1. Connect the SMIQ output to FSx input port.
2. From the 3GDemoBSU user panel select test 7.6 Intermodulationcharacteristics.
3. Activate Signal Settings Demo
4. Configure the test set up by clicking the Configure button.
5. Start the test by clicking the Start button.
Fig. 40 shows the result output from the demo program, Fig. 41 the resultdisplayed on the analyzer.
Fig. 40: Intermodulation Characteristics: output from the demo program
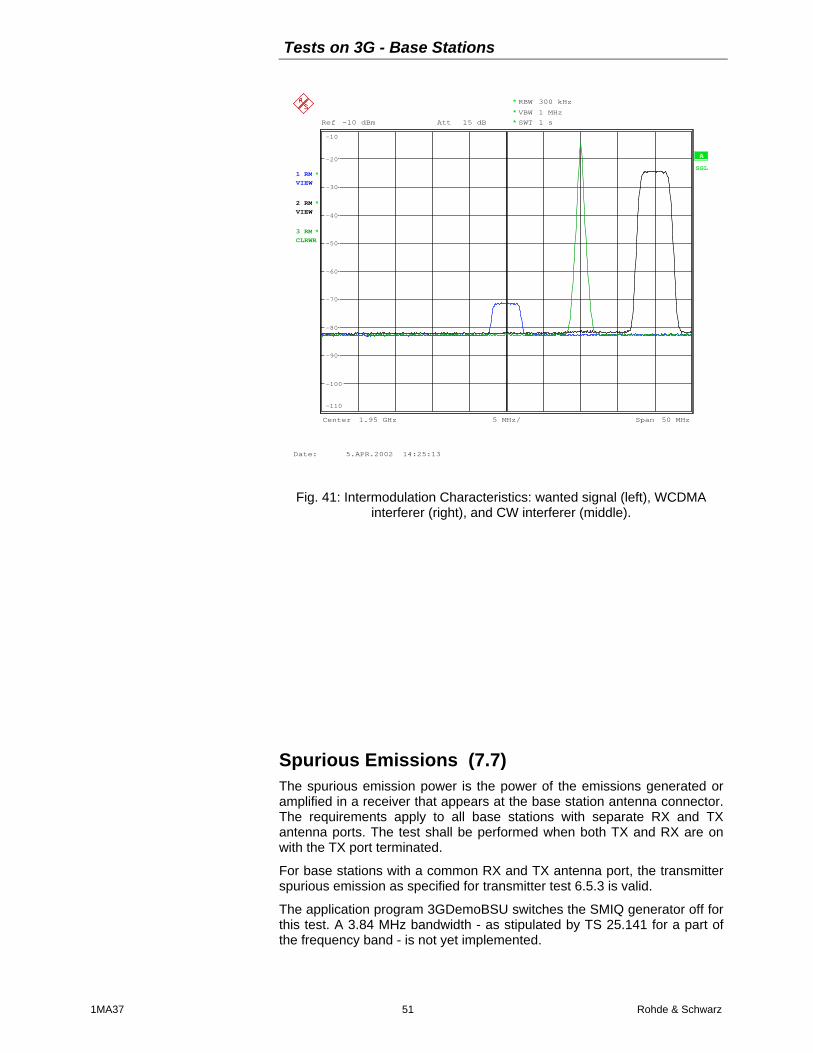
Tests on 3G - Base Stations
1MA37 51 Rohde & Schwarz
A
SGL
Ref -10 dBm Att 15 dB
Center 1.95 GHz Span 50 MHz5 MHz/
* RBW 300 kHz
SWT 1 s
*1 RMVIEW
*2 RMVIEW
CLRWR
*
3 RM
VBW 1 MHz*
*
-110
-100
-90
-80
-70
-60
-50
-40
-30
-20
-10
Date: 5.APR.2002 14:25:13
Fig. 41: Intermodulation Characteristics: wanted signal (left), WCDMAinterferer (right), and CW interferer (middle).
Spurious Emissions (7.7)The spurious emission power is the power of the emissions generated oramplified in a receiver that appears at the base station antenna connector.The requirements apply to all base stations with separate RX and TXantenna ports. The test shall be performed when both TX and RX are onwith the TX port terminated.
For base stations with a common RX and TX antenna port, the transmitterspurious emission as specified for transmitter test 6.5.3 is valid.
The application program 3GDemoBSU switches the SMIQ generator off forthis test. A 3.84 MHz bandwidth - as stipulated by TS 25.141 for a part ofthe frequency band - is not yet implemented.
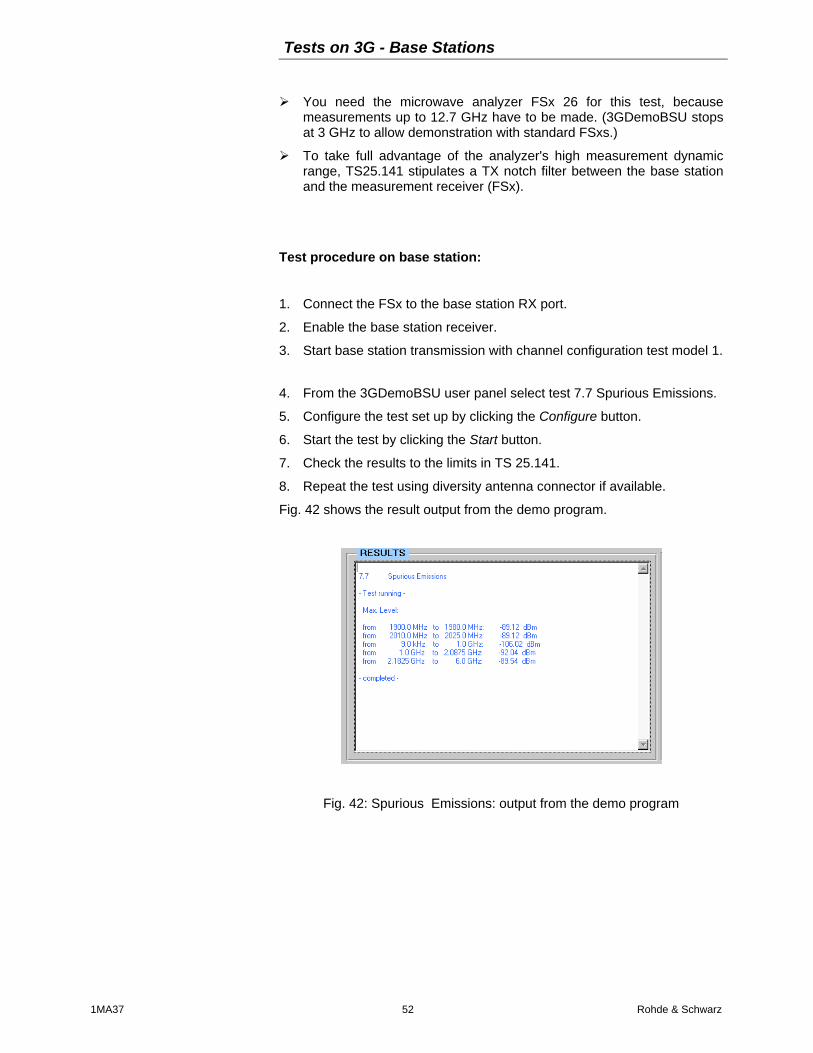
Tests on 3G - Base Stations
1MA37 52 Rohde & Schwarz
! You need the microwave analyzer FSx 26 for this test, becausemeasurements up to 12.7 GHz have to be made. (3GDemoBSU stopsat 3 GHz to allow demonstration with standard FSxs.)
! To take full advantage of the analyzer's high measurement dynamicrange, TS25.141 stipulates a TX notch filter between the base stationand the measurement receiver (FSx).
Test procedure on base station:
1. Connect the FSx to the base station RX port.
2. Enable the base station receiver.
3. Start base station transmission with channel configuration test model 1.
4. From the 3GDemoBSU user panel select test 7.7 Spurious Emissions.
5. Configure the test set up by clicking the Configure button.
6. Start the test by clicking the Start button.
7. Check the results to the limits in TS 25.141.
8. Repeat the test using diversity antenna connector if available.
Fig. 42 shows the result output from the demo program.
Fig. 42: Spurious Emissions: output from the demo program
Tests on 3G - Base Stations
1MA37 53 Rohde & Schwarz
Verification of Internal BER Calculation (7.8)
A base station with internal BER calculation can synchronise its receiver toa known pseudo-random data sequence and calculate the bit error ratiofrom the received data. This test is performed only if the base station hasthis feature.
This test is performed by feeding a measurement signal with known BER tothe input of the receiver.
! For measurements on the base station, disable the FSx remote controland Signal Settings Demo from the 3GDemoBSU user panel.
! For simulation, connect the SMIQ output to the input of FSx, andactivate Signal Settings Demo on the 3GDemoBSU user panel.
Test procedure on base station:
1. Connect SMIQ to the base station antenna port.
2. Set the base station frequency.
3. From the 3GDemoBSU user panel select test 7.8 Verification ofinternal BER calculation.
4. Set the Frequency of SMIQ to the base station uplink frequency.
5. Set the Level of SMIQ to -111 dBm.
6. Configure the test set up by clicking the Configure button.
7. Start the test by clicking the Start button.
8. Calculate BER over at least 50,000 received data bits.
The BER indicated by the base station system shall be within +/- 10 % ofthe BER generated by the RF source.
8 PerformanceTests
Performance tests are receiver tests which simulate wave propagation andmultipath conditions of a realistic operation scenario. They only apply to abase station with dual receiver antenna diversity.
Table 3 summarises the performance tests stipulated by TS 25.141.
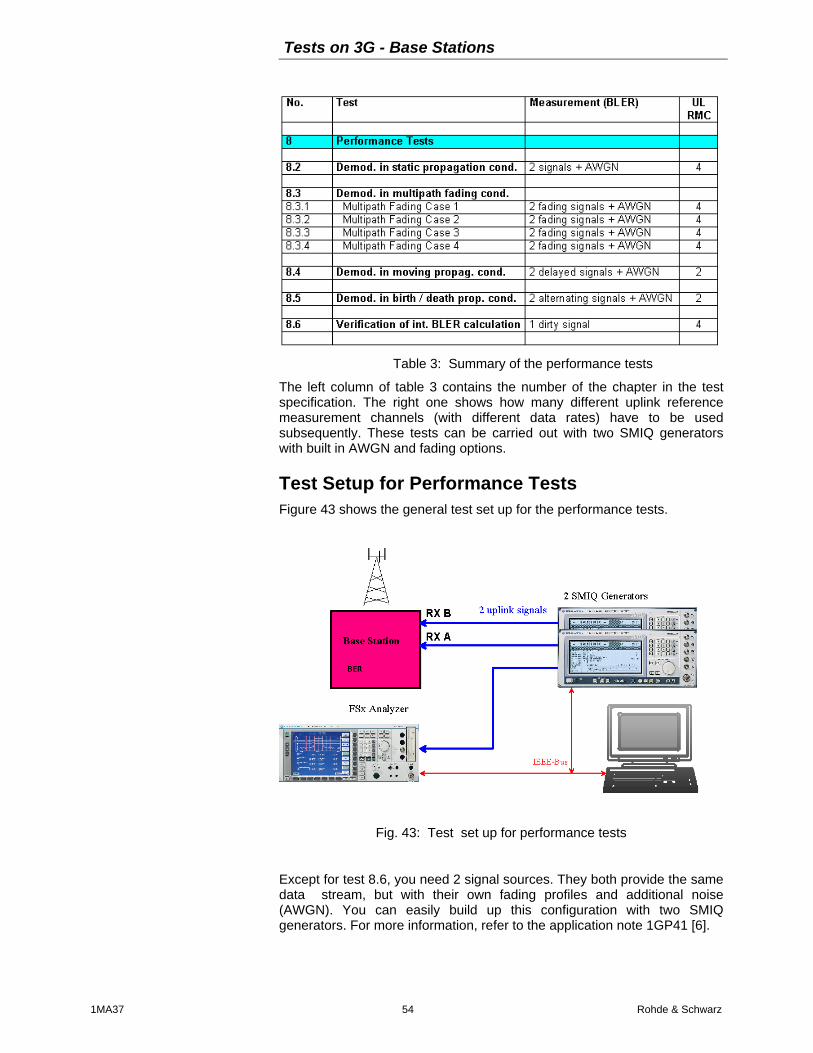
Tests on 3G - Base Stations
1MA37 54 Rohde & Schwarz
Table 3: Summary of the performance tests
The left column of table 3 contains the number of the chapter in the testspecification. The right one shows how many different uplink referencemeasurement channels (with different data rates) have to be usedsubsequently. These tests can be carried out with two SMIQ generatorswith built in AWGN and fading options.
Test Setup for Performance TestsFigure 43 shows the general test set up for the performance tests.
Fig. 43: Test set up for performance tests
Except for test 8.6, you need 2 signal sources. They both provide the samedata stream, but with their own fading profiles and additional noise(AWGN). You can easily build up this configuration with two SMIQgenerators. For more information, refer to the application note 1GP41 [6].
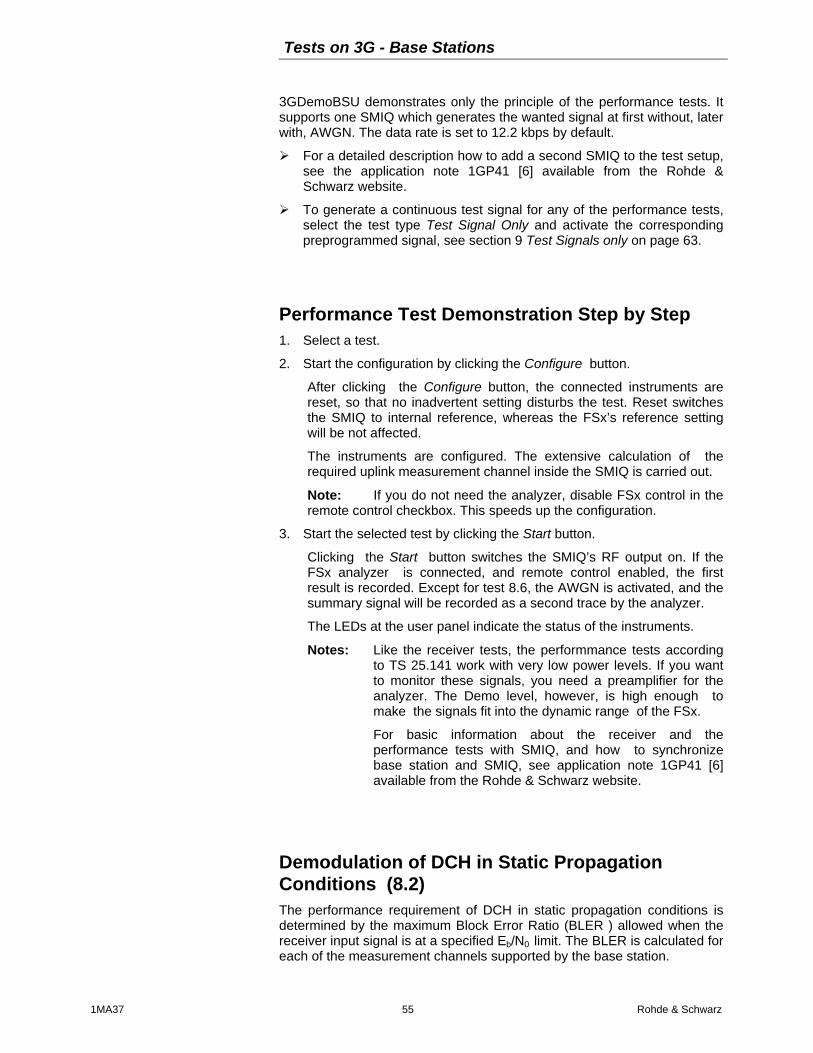
Tests on 3G - Base Stations
1MA37 55 Rohde & Schwarz
3GDemoBSU demonstrates only the principle of the performance tests. Itsupports one SMIQ which generates the wanted signal at first without, laterwith, AWGN. The data rate is set to 12.2 kbps by default.
! For a detailed description how to add a second SMIQ to the test setup,see the application note 1GP41 [6] available from the Rohde &Schwarz website.
! To generate a continuous test signal for any of the performance tests,select the test type Test Signal Only and activate the correspondingpreprogrammed signal, see section 9 Test Signals only on page 63.
Performance Test Demonstration Step by Step1. Select a test.
2. Start the configuration by clicking the Configure button.
After clicking the Configure button, the connected instruments arereset, so that no inadvertent setting disturbs the test. Reset switchesthe SMIQ to internal reference, whereas the FSx’s reference settingwill be not affected.
The instruments are configured. The extensive calculation of therequired uplink measurement channel inside the SMIQ is carried out.
Note: If you do not need the analyzer, disable FSx control in theremote control checkbox. This speeds up the configuration.
3. Start the selected test by clicking the Start button.
Clicking the Start button switches the SMIQ’s RF output on. If theFSx analyzer is connected, and remote control enabled, the firstresult is recorded. Except for test 8.6, the AWGN is activated, and thesummary signal will be recorded as a second trace by the analyzer.
The LEDs at the user panel indicate the status of the instruments.
Notes: Like the receiver tests, the performmance tests accordingto TS 25.141 work with very low power levels. If you wantto monitor these signals, you need a preamplifier for theanalyzer. The Demo level, however, is high enough tomake the signals fit into the dynamic range of the FSx.
For basic information about the receiver and theperformance tests with SMIQ, and how to synchronizebase station and SMIQ, see application note 1GP41 [6]available from the Rohde & Schwarz website.
Demodulation of DCH in Static PropagationConditions (8.2)The performance requirement of DCH in static propagation conditions isdetermined by the maximum Block Error Ratio (BLER ) allowed when thereceiver input signal is at a specified Eb/N0 limit. The BLER is calculated foreach of the measurement channels supported by the base station.

Tests on 3G - Base Stations
1MA37 56 Rohde & Schwarz
3GDemoBSU only demonstrates the principle of the performance tests. Itsupports only one SMIQ which generates the wanted signal at first without,later with, AWGN. The data rate is set to 12.2 kbps by default.
! To generate a wanted signal with a different data rate, and a differentcarrier to noise ratio, select the test type Test Signals Only and activatethe corresponding preprogrammed signal, see section 9 Test Signalsonly on page 63.
! To simulate testing without a base station, connect SMIQ output to theinput of the FSx.
For demonstration:1. From the 3GDemoBSU user panel select test 8.2 Demodulation of
DCH in static propagation conditions.
2. Activate Signal Settings Demo.
3. Configure the test setup by clicking the Configure button.
4. Start the test by clicking the Start button.
Fig. 44 shows the signals displayed on the analyzer.
Ref -20 dBm
A
SGL
Att 0 dB*
Center 1.95 GHz Span 10 MHz1 MHz/
RBW 30 kHz*
SWT 2 s
*1 RMVIEW
CLRWR
*
2 RM
VBW 300 kHz*
*
-120
-110
-100
-90
-80
-70
-60
-50
-40
-30
-20
Date: 5.APR.2002 14:29:43
Fig. 44: Uplink signal for performance test 8.2 without AWGN (below) andwith AWGN (above).
Tests on 3G - Base Stations
1MA37 57 Rohde & Schwarz
Demodulation of DCH in Multipath FadingConditions (8.3)The performance requirement of DCH in multipath fading Case 1 to 4 isdetermined by the maximum Block Error Ratio (BLER ) allowed when thereceiver input signal is at a specified Eb/N0 limit. The BLER is calculated foreach of the measurement channels supported by the base station.
The test shall verify the receiver's ability to receive the test signal underdifferent fading propagation conditions with a BLER not exceeding aspecified limit.
3GDemoBSU only demonstrates the principle of the performance tests. Itsupports only one SMIQ which generates the wanted signal at first without,later with, AWGN. The data rate is set to 12.2 kbps by default.
! To generate a wanted signal with a different data rate, and a differentcarrier to noise ratio, select the test type Test Signals Only and activatethe corresponding preprogrammed signal, see section 9 Test Signalsonly on page 63.
! To simulate testing without a base station, connect SMIQ output to theinput of the FSx.
For demonstration:
1. From the 3GDemoBSU user panel select test 8.3 Demodulation ofDCH in multipath fading conditions.
2. Activate Signal Settings Demo.
3. Configure the test set up by clicking the Configure button.
4. Start the test by clicking the Start button.
Fig. 45 to Fig. 48 show the SMIQ signals with the different stipulatedfading profiles.

Tests on 3G - Base Stations
1MA37 58 Rohde & Schwarz
Ref -20 dBm
A
SGL
Att 0 dB*
Center 1.95 GHz Span 10 MHz1 MHz/
*
*
RBW 30 kHz
VBW 300 kHz
SWT 2 s
*1 RMVIEW
CLRWR*2 RM
*
-120
-110
-100
-90
-80
-70
-60
-50
-40
-30
-20
Date: 5.APR.2002 14:31:18
Fig. 45: Multipath fading case 1 without AWGN (below) and with AWGN(above).
Ref -20 dBm Att 5 dB
A
SGL
Center 1.95 GHz Span 10 MHz1 MHz/
RBW 30 kHz*
SWT 2 s
*1 RMVIEW
CLRWR
*
2 RM
VBW 300 kHz*
*
-120
-110
-100
-90
-80
-70
-60
-50
-40
-30
-20
Date: 5.APR.2002 14:32:07
Fig. 46: Multipath fading case 2 without AWGN (below) and with AWGN(above).

Tests on 3G - Base Stations
1MA37 59 Rohde & Schwarz
Ref -20 dBm Att 5 dB
A
SGL
Center 1.95 GHz Span 10 MHz1 MHz/
RBW 30 kHz*
SWT 2 s
*1 RMVIEW
CLRWR
*
2 RM
VBW 300 kHz*
*
-120
-110
-100
-90
-80
-70
-60
-50
-40
-30
-20
Date: 5.APR.2002 14:33:21
Fig. 47: Multipath fading case 3 without AWGN (below) and with AWGN(above).
Ref -20 dBm Att 5 dB
A
SGL
Center 1.95 GHz Span 10 MHz1 MHz/
RBW 30 kHz*
SWT 2 s
*1 RMVIEW
CLRWR
*
2 RM
VBW 300 kHz*
*
-120
-110
-100
-90
-80
-70
-60
-50
-40
-30
-20
Date: 5.APR.2002 14:34:22
Fig. 48: Multipath fading case 4 without AWGN (below) and with AWGN(above).
Tests on 3G - Base Stations
1MA37 60 Rohde & Schwarz
Demodulation of DCH in Moving PropagationConditions (8.4)The performance requirement of DCH in moving propagation conditions isdetermined by the maximum Block Error Ratio (BLER) allowed when thereceiver input signal is at a specified Eb/N0 limit. The BLER is calculatedfor each of the measurement channels supported by the base station.
The test shall verify the receiver's ability to receive and track the test signalwith a BLER not exceeding the specified limit.
The application program 3GDemoBSU demonstrates only the principle ofthe performance tests. It supports only one SMIQ which generates thewanted signal at first without, later with, AWGN. The data rate is set to 12.2kbps by default.
! To generate a wanted signal with a different data rate, and a differentcarrier to noise ratio, select the test type Test Signals Only and activatethe corresponding preprogrammed signal, see section 9 Test Signalsonly on page 63.
! To simulate testing without a base station, connect SMIQ output to theinput of the FSx.
For demonstration:
1. From the 3GDemoBSU user panel select test 8.4 Demodulation ofDCH in moving propagation conditions.
2. Activate Signal Settings Demo.
3. Configure the test setup by clicking the Configure button.
4. Start the test by clicking the Start button.
Fig. 49 shows the signal for moving propagation conditions
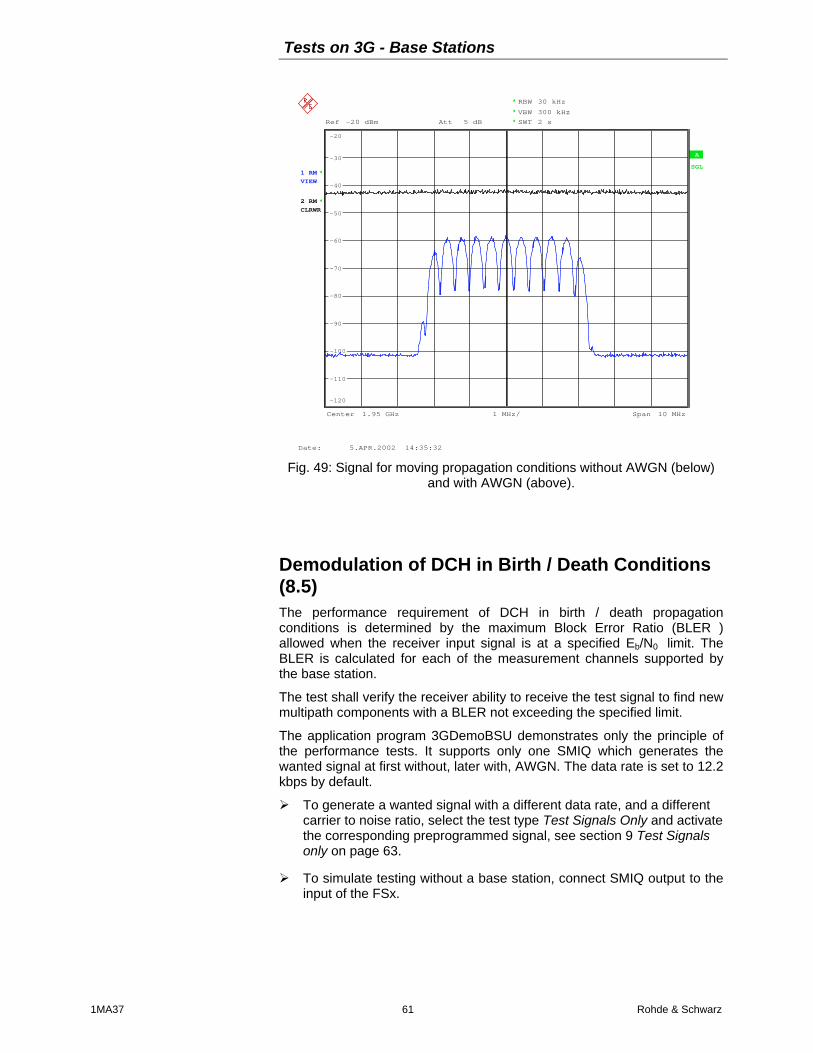
Tests on 3G - Base Stations
1MA37 61 Rohde & Schwarz
Ref -20 dBm Att 5 dB
A
SGL
Center 1.95 GHz Span 10 MHz1 MHz/
RBW 30 kHz*
SWT 2 s
*1 RMVIEW
CLRWR
*
2 RM
VBW 300 kHz*
*
-120
-110
-100
-90
-80
-70
-60
-50
-40
-30
-20
Date: 5.APR.2002 14:35:32
Fig. 49: Signal for moving propagation conditions without AWGN (below)and with AWGN (above).
Demodulation of DCH in Birth / Death Conditions(8.5)The performance requirement of DCH in birth / death propagationconditions is determined by the maximum Block Error Ratio (BLER )allowed when the receiver input signal is at a specified Eb/N0 limit. TheBLER is calculated for each of the measurement channels supported bythe base station.
The test shall verify the receiver ability to receive the test signal to find newmultipath components with a BLER not exceeding the specified limit.
The application program 3GDemoBSU demonstrates only the principle ofthe performance tests. It supports only one SMIQ which generates thewanted signal at first without, later with, AWGN. The data rate is set to 12.2kbps by default.
! To generate a wanted signal with a different data rate, and a differentcarrier to noise ratio, select the test type Test Signals Only and activatethe corresponding preprogrammed signal, see section 9 Test Signalsonly on page 63.
! To simulate testing without a base station, connect SMIQ output to theinput of the FSx.
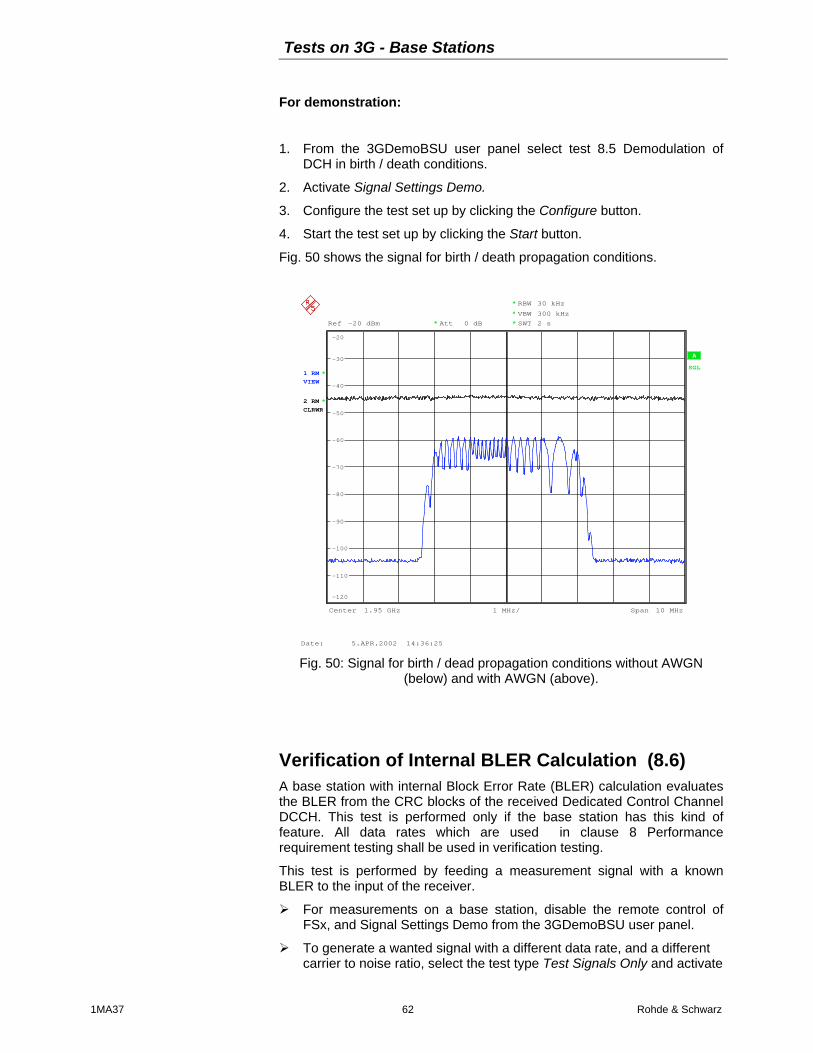
Tests on 3G - Base Stations
1MA37 62 Rohde & Schwarz
For demonstration:
1. From the 3GDemoBSU user panel select test 8.5 Demodulation ofDCH in birth / death conditions.
2. Activate Signal Settings Demo.
3. Configure the test set up by clicking the Configure button.
4. Start the test set up by clicking the Start button.
Fig. 50 shows the signal for birth / death propagation conditions.
Ref -20 dBm
A
SGL
Att 0 dB*
Center 1.95 GHz Span 10 MHz1 MHz/
RBW 30 kHz*
SWT 2 s
*1 RMVIEW
CLRWR
*
2 RM
VBW 300 kHz*
*
-120
-110
-100
-90
-80
-70
-60
-50
-40
-30
-20
Date: 5.APR.2002 14:36:25
Fig. 50: Signal for birth / dead propagation conditions without AWGN(below) and with AWGN (above).
Verification of Internal BLER Calculation (8.6)A base station with internal Block Error Rate (BLER) calculation evaluatesthe BLER from the CRC blocks of the received Dedicated Control ChannelDCCH. This test is performed only if the base station has this kind offeature. All data rates which are used in clause 8 Performancerequirement testing shall be used in verification testing.
This test is performed by feeding a measurement signal with a knownBLER to the input of the receiver.
! For measurements on a base station, disable the remote control ofFSx, and Signal Settings Demo from the 3GDemoBSU user panel.
! To generate a wanted signal with a different data rate, and a differentcarrier to noise ratio, select the test type Test Signals Only and activate

Tests on 3G - Base Stations
1MA37 63 Rohde & Schwarz
the corresponding preprogrammed signal, see section 9 Test Signalsonly on page 63.
! To simulate testing without a base station, connect SMIQ output to theinput of the FSx.
Test procedure on base station: 1. Connect SMIQ - to the base station antenna port.
2. Set the base station frequency.
3. From the 3GDemoBSU user panel select test 8.6 Verification ofinternal BLER calculation.
4. Set Frequency of SMIQ to the DUT uplink frequency.
5. Set Level of SMIQ to -111 dBm.
6. Configure the set up by clicking the Configure button.
7. Start the test by clicking the Start button.
8. Calculate BLER at least over 50,000 blocks.
BLER indicated by the base station system shall be within +/- 10% of theBLER generated by the RF signal source.
9 Test Signals Only
Table 4 contains a list of the test signals currently provided by the program3GDemoBSU. The signal configuration refers to the version number of thetest specification that you can find on the lower left corner of the userpanel.
Test Model 1
Test Model 2
Test Model 3
Test Model 4
Uplink RMC 12.2 kbps (for test 7.2)
Uplink RMC 12.2 kbps with AWGN (for test 7.3)
Uplink RMC 12.2 kbps BER 0.1% (for test 7.8)
Uplink RMC 64 kbps
Uplink RMC 144 kbps
Uplink RMC 384 kbps

Tests on 3G - Base Stations
1MA37 64 Rohde & Schwarz
Table 4: Test Signals available
This part of the demo program only makes sense, if an SMIQ with remotecontrol enabled is connected to your PC.
Synchronising Base Station and SMIQ
For receiving uplink signals, the base station and the generator of theuplink signal have to be synchronized. Normally, the base station plays therole of a master, which provides the 10 MHz reference and a trigger signalfor the generator.
For demonstration, the SMIQ can act as a master as well, with trigger freerun and internal 10 MHz reference.
! Select the master device by the setting of the checkbox Signal SettingsDemo.
If the checkbox Signal Settings Demo is set, the SMIQ is master, otherwisethe base station is master.
If the base station is master, a suitable trigger is for example a signalindicating the Super Frame Number (SFN) restart which is provided bymost of the base stations.
! Connect this trigger signal to TRIG IN of the PAR DATA connector onthe rear panel of the SMIQ. Use SMIQ-Z5 adapter which provides BNCconnectors for all pins of the PAR DATA connector.
! Connect the 10 MHz reference signal of the base station to the REFconnector on SMIQ’s rear panel.
Note: For further details on synchronizing SMIQ and base station,download the application note 1GP41 [6] from the Rohde &Schwarz website.
Generating Test Signals1. Select your test signal.
2. Start the configuration by clicking the Configure button.
After clicking the Configure button, the connected instruments will beconfigured. The calculation of the required test model or uplink RMCinside the SMIQ is initiated. If an FSx is present, it will be set up to copewith the selected uplink or downlink test signal.
Note: If you do not need the analyzer, disable the FSx’s control in theremote control checkbox. This speeds up the configuration.
Tests on 3G - Base Stations
1MA37 65 Rohde & Schwarz
After configuration, you can modify the setting of the instrumentsmanually, e.g. change the signal / noise ratio of the AWGN.
The RF output of the SMIQ generator is still switched off.
3. Start the selected test by clicking the Start button.
Clicking the Start button switches the RF output on. If SMIQ is the master,the output of data and frame trigger starts. If the base station is the master,the SMIQ waits for an external trigger signal.
4. Stop the signal output by clicking the Break button. This disables theRF output of the generator.
Note: No changes of the instrument settings are performed by3GDemoBSU after clicking Start.
10 Literature[1] 3rd Generation Partnership Project; Technical Specification Group
Radio Access Networks; Base Station conformance testing (FDD)(Release 1999) - TS 25.141 (V4.2.0)
[2] René Desquiotz, WCDMA Signal Generator Solutions by Rohde &Schwarz, Application Note 1GP39
[3] Josef Wolf, Measurement on 3GPP Base Station Transmitter Signals,Application Note 1EF44
[4] Josef Wolf, Measurement of Adjacent Channel Power on WidebandCDMA Signals, Application Note 1EF40
[5] Josef Wolf and Bob Buxton, Measure Adjacent Channel Power With aSpectrum Analyzer, Microwaves & RF, January 1997
[6] René Desquiotz, 3GPP FDD Base Station Tests with Vector SignalGenerator SMIQ, Application Note 1GP41
[7] Sander / Wolf, Spurious Emission Measurement on 3GPP BaseStation Transmitters, Application Note 1EF45

Tests on 3G - Base Stations
1MA37 66 Rohde & Schwarz
11 Abbreviations
3GPP Third Generation Partnership Project. Name of theorganization that defines the communicationstandards of the Third Generation.
AWGN Additional White Gaussian Noise.
DCH Dedicated Channel, collectively for DTCH andDCCH.
DTCH Dedicated Traffic Channel. Transport channel that ismapped to the Dedicated Physical Data Channel(DPDCH).
DCCH Dedicated Control Channel. Transport channel thatis mapped to the Dedicated Physical Data Channel(DPDCH).
DPDCH Dedicated Physical Data Channel which containsthe user data (one or more DTCH and one DCCH)
DPCCH Dedicated Physical Control Channel. PhysicalChannel that contains some control information.Among others, the Transmit Power Control (TPC)bits are transmitted in the DPCCH.
FDD Frequency Division Duplex, means that uplink anddownlink transmit on different frequencies.
OCNS Orthogonal Channel Noise Simulation. A "realistic"3GPP background signal.
RMC Reference Measurement Channel. The 3GPPspecifications define uplink Reference MeasurementChannels for base station conformance tests. Theseare 3GPP signals with defined parameter valuesincluding channel coding. RMCs contain a DPCCHand a DPDCH as physical channels. As transportchannels, a DTCH and a DCCH are mapped to theDPDCH.
SFN System Frame Number. System time unit that istransmitted by the BS in the BCH channel.
TPC Transmit Power Control. TPC bits are transmitted bya base station or mobile to tell its counterpart toincrease or decrease transmit power.
Tests on 3G - Base Stations
1MA37 67 Rohde & Schwarz
12 Hardware and Software Requirements
3GDemoBSU Hardware Requirements for PCThe software runs on a PC with the following features:
• CPU: 486, Pentium or better
• RAM: 16 Mbytes or more
• Monitor: VGA colour monitor
• IEC/IEEE bus: IEC/IEEE-bus interface Rohde & Schwarz IEEE 488.2bus interface PS-B4, 1006.6207.04 or National Instruments AT-GPIB/TNT
3GDemoBSU Software Requirements for PC• Windows 95/98 or Windows NT (version 4.0 or better)
• GPIB (IEC/IEEE-bus) driver installed
Options required for SMIQ and FSxTo run all tests, you need the following options:SMIQB11 Data Generator 16 MbitSMIQB12 Memory Extension 32 Mbit (2x)SMIQB14 Fading SimulatorSMIQB15 Second Fading SimulatorSMIQB17 Noise Generator and Distortion SimulatorSMIQB20 Modulation CoderSMIQB45 Dig. Standard WCDMA (3GPP, FDD)SMIQB48 Extended Functions for WCDMA (3GPP)SMIQB49 Extended Fading Function for WCDMAFS-K72 3GPP BS Code Domain Power Measurement FSP-B15 Pulse Calibrator for FSP onlyFSP-B70 Demodulator-Hardware for FSP only
If you want to run only a part of the tests, look at tables 5 to 7 below. Theyshow which options are required for each single test.
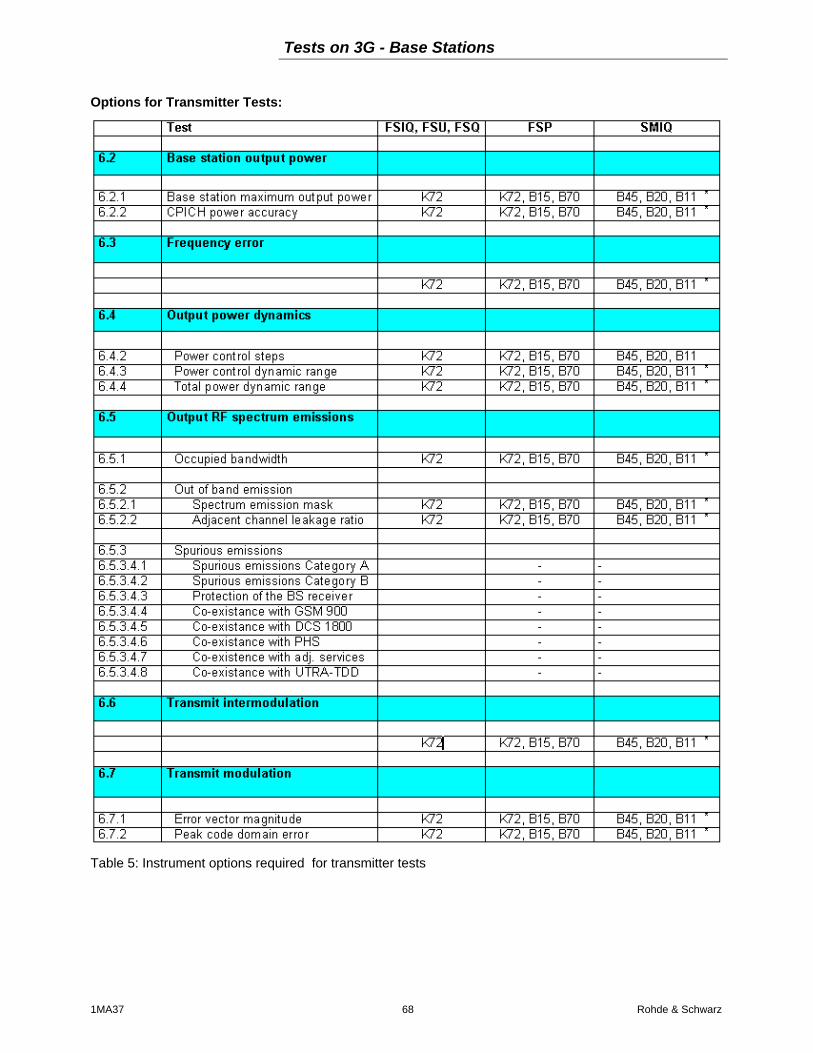
Tests on 3G - Base Stations
1MA37 68 Rohde & Schwarz
Options for Transmitter Tests:
Table 5: Instrument options required for transmitter tests
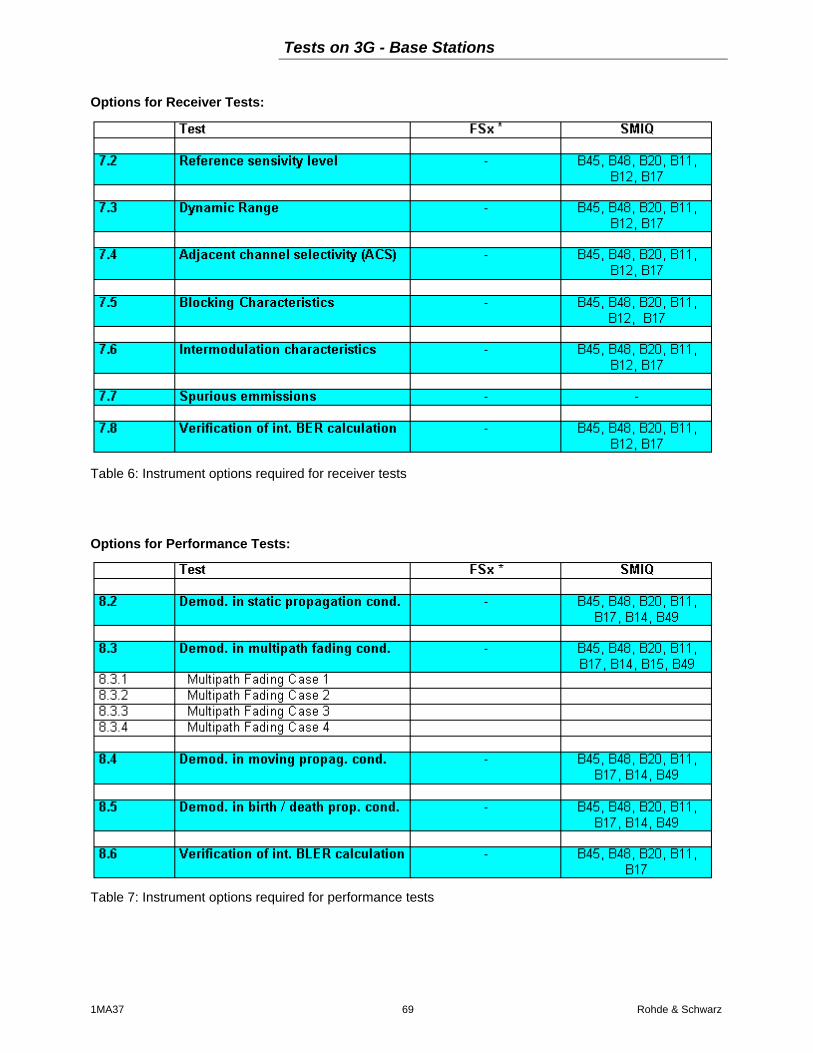
Tests on 3G - Base Stations
1MA37 69 Rohde & Schwarz
Options for Receiver Tests:
Table 6: Instrument options required for receiver tests
Options for Performance Tests:
Table 7: Instrument options required for performance tests
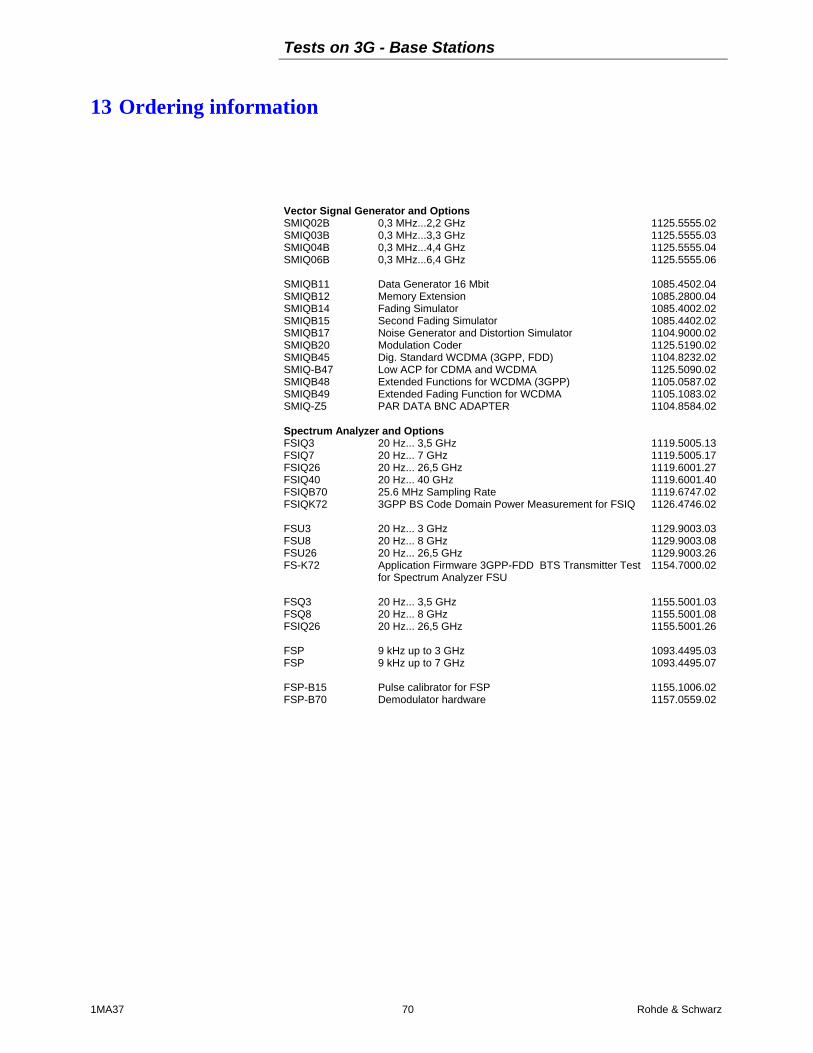
Tests on 3G - Base Stations
1MA37 70 Rohde & Schwarz
13 Ordering information
Vector Signal Generator and OptionsSMIQ02B 0,3 MHz...2,2 GHz 1125.5555.02SMIQ03B 0,3 MHz...3,3 GHz 1125.5555.03SMIQ04B 0,3 MHz...4,4 GHz 1125.5555.04SMIQ06B 0,3 MHz...6,4 GHz 1125.5555.06
SMIQB11 Data Generator 16 Mbit 1085.4502.04SMIQB12 Memory Extension 1085.2800.04SMIQB14 Fading Simulator 1085.4002.02SMIQB15 Second Fading Simulator 1085.4402.02SMIQB17 Noise Generator and Distortion Simulator 1104.9000.02SMIQB20 Modulation Coder 1125.5190.02SMIQB45 Dig. Standard WCDMA (3GPP, FDD) 1104.8232.02SMIQ-B47 Low ACP for CDMA and WCDMA 1125.5090.02SMIQB48 Extended Functions for WCDMA (3GPP) 1105.0587.02SMIQB49 Extended Fading Function for WCDMA 1105.1083.02SMIQ-Z5 PAR DATA BNC ADAPTER 1104.8584.02
Spectrum Analyzer and OptionsFSIQ3 20 Hz... 3,5 GHz 1119.5005.13FSIQ7 20 Hz... 7 GHz 1119.5005.17FSIQ26 20 Hz... 26,5 GHz 1119.6001.27FSIQ40 20 Hz... 40 GHz 1119.6001.40FSIQB70 25.6 MHz Sampling Rate 1119.6747.02FSIQK72 3GPP BS Code Domain Power Measurement for FSIQ 1126.4746.02
FSU3 20 Hz... 3 GHz 1129.9003.03FSU8 20 Hz... 8 GHz 1129.9003.08FSU26 20 Hz... 26,5 GHz 1129.9003.26FS-K72 Application Firmware 3GPP-FDD BTS Transmitter Test
for Spectrum Analyzer FSU1154.7000.02
FSQ3 20 Hz... 3,5 GHz 1155.5001.03FSQ8 20 Hz... 8 GHz 1155.5001.08FSIQ26 20 Hz... 26,5 GHz 1155.5001.26
FSP 9 kHz up to 3 GHz 1093.4495.03FSP 9 kHz up to 7 GHz 1093.4495.07
FSP-B15 Pulse calibrator for FSP 1155.1006.02FSP-B70 Demodulator hardware 1157.0559.02

Tests on 3G - Base Stations
1MA37 71 Rohde & Schwarz
Further instruments from the Rohde & Schwarz product line, which areuseful for 3GPP measurements:
TS8950 B1 RF Precompliance Tester for WCDMA FDDa Node B
CMU200 CMU300
Universal Radio Communication Tester 1100.0008.021100.0008.03
14 ContactPlease contact [email protected] for commentsand further suggestions.
ROHDE & SCHWARZ GmbH & Co. KG . Mühldorfstraße 15 . D-81671 München . P.O.B 80 14 69 . D-81614 München .
Telephone +49 89 4129 -0 . Fax +49 89 4129 - 13777 . Internet: http://www.rohde-schwarz.com
This application note and the supplied programs may only be used subject to the conditions of use set forth in the downloadarea of the Rohde & Schwarz website