tests of various particle filters for removal of oil mists and
TRANSCRIPT

OAK-BRIDGE NATIONAL LABORATORY ’ operated by
UNION CARBIDE CORPORATION for the
U.f. AiOMlC ENERGY COMfilSSlON !
.c’sz:I pBy-?S ORNL- TM- 1623 !
COPY NO. - 9
-’ I
TESTS OF VARIOUS PARTICLE FILTERS FOR REMOVAL~OF OIL MISTS AND BYDROCARBON VAPOR
i
B, F, Hitch, R. G. gross, Ii. F: McDuffie
ABSTRACT
Various filter and adsorbent materials were examined for '. "' possible use in the removal of oil mists and hydrocarbon vapors;
.'* e
A controlled flow of oil was injected into a heated nickel reaction Vessel to cause vaporizationand some cracking of the oil. Helium
~flowing through the reactionvessel carried the oil mist .and hydro- 'carbon-vapor through a filter system. Filter effectiveness was determined by the use of a Perkin-Elmer Hydrocarbon Detector, ._, gravimetric analysis, and gas--chromatographic analysis-~ Good removal of mists was achieved by the use of a combination of felted metal fibers and ceramic fibers-in a configuration proposed
c for use in the MSRE. Granulated charcoal removed hydrocarbon vapors (C, and above)ina manner consistent with the established adsorption isotherms for this material. j tEGA1 NOTICE t
NOTICL
-a. , _ -tains information of a preliminary nature and was prepared
ror ~n~wllal use at the Oak Ridge National Laboratory. It is subject #n or correction and therefore does not represent a final report.
! Ih~s documenr con
prima,ily I-- ?-*---
/ to revisio

LEGAL NOTICE
This report was prepared as an accost of Government sponsored work. Neither the United States,
nor the Commission, nor any person acting on behalf of the Commission: A. Makes any warranty 01 representation. expressed or implied, with respect to the accuracy,
completeness, w usefulness of the information contained in this report, or that the use of any information, apparatus. method, or process disclosed in this report may not infringe privately owned rights; or
B. Assumes any liabilities with respect to the use of, or for damages resulting from the use of any information, apparatus, method. or process disclosed in this report.
As used in the above, “person acting on behalf of the Commission*’ includes any employee or
contractor of the Commission, or l mplo~a of such contractor, to the extent that such employee
or contractor of the Commission, OT l mployee of such contractor pwpares, disseminates, or provides ~cc.ss to, any information pursuant to his employment 01 contract with the Commission, or his l mploynunt with such conhixtor.
i

1.
2.
3.
2
4.
5. TESTING OF MSRE PARTICLE FILTER'. . . . .
6.
CONTENTS
ABSTRACT. . . . . . . . . . . . . . . . .
INTRODUCTION. . . . . . . . . . . . . . .
PROCEDURE . . .- . . . . . . . . . . . . .
OIL MIST FILTERS. . . . . . . . . . . . .
3.1. General Description . . . . . . . .
3.2. Experimental Data . . . . . . . . .
3.3. Experimental Data After Altering Oil Injection . . . . . . . . . . .
CHARCOAL TRAP EFFICIENCY. ; . . . . . . .
4.1. Charcoal Saturation with Hydrocarbons
4.2, Temperature Dependence of Hydro- i ‘carbon Adsorption on Charcoal . . .
5.1.. Pressure Drop Data. . . . . . '. . .
5.2, Pressure Drop Data of Felt Metal at.Elevated Temperatures. . . l . .
ACKNOWLEDGEMENTS. s c. . . . . . . . . . .
r
Page
1
4
4
7
7
7
13
23
25

,
4 _-. 1. '
w INTRODUCTION ; :
3 One of the problems encountered during the early stages
of power operation of the Molten Salt Reactor Experiment was
that some valves and filters in the off-gas system became-
plugged. The plugs were analyzed and found to be of organic
composition.
One possible source of organic material was the oil used
to lubricate the salt circulating pump-. If indeed the pump
were leaking oil into the pump bowl, the maximum credible
leakage would be in the range of 15 to 20 cc per day.
This experiment was.designed to simulate the consequences
of this maximum expected oil leakage and to testvarious
filter and adsorbent materials for removal of oil mist and
hydrocarbon vapors under these conditions.
-2. PROCEDURE
A complete flow diagram of the apparatus is shown in' I‘
Fig. 1 and a picture as Fig. la.
Gulfspin- oil is used to lubricate the Molten Salt
Reactor pump; this same oil was used in our experiments. The
oil was injected by a motor driven syringe connected by-a
capillary tube to a heated reaction vessel. The injection
rate was 0,.67 cc,per hour.
Simulating MSRE off-gas flow conditions, helium was '
passed through the system at 4 liters per minute. The nickel
reaction vessel temperature was about 600°C.
The gas effluent from the filters A, D, C, D, and E .

ORNL DWg. 66-9447 i s-2
Fig. 1. Oil Injection and Filtering Apparatus

__ ._~ . . . - . . I . b “ ” _ . . - . . . . - - - - - . . . . . _ . “ .
. ” . _ . I . . - . 1”” . .
t
Fig. la. Picture of Oil Injection and Filtering Apparatus

/ ’
7
passed through two,,charcoal traps filled with PCB 6X16 P... / I charcoal:. A Perkin-Elmer 213 Hydrocarbon Detector, provided
by the Analytical Chemistry Division, was used to measure the
hydrocarbon levels at three positions (S-l, S-2, S-3) shown on
the flow diagram. Gas samples were taken periodically at these
same three positions for subsequent chromatographic analysis.
Pressure drop measurements were made using Hg and'H,O
manometers. Readings were taken each half hour.
3. OIL MIST FILTERS
3.1. General Description
Limited time necessitated that the investigation of
filter materials'be confined to those easily obtainable.
Materials tested were coarse nickel wool, Supreme #l steel
wool, Supreme #00 steel wool, Pyrex glass wool, Fiberfrax
and a M-S-A air line Ultra Filter.
Fiberfrax showed an appreciable pressure drop when packed
into the glass U-tube traps. This was the short fiber variety \
which packed very tightly when loading the traps. Because the
pressure drop was. in excess of 8 psig, this material was not
tested. 'However, long fiber Fiberfrax proved to be satisfactory. \
3.2. Experimental Data
3.2.1. The first two experiments were ,performed using :
coarse nickel wool in trap A, and Supreme ,#l steel wool in
traps B and C. The data summarized iniTable 1 show this trap
assembly removed 55% of the total oil injected into the

Table 1. Efficiency of Filter.Materials Tested w-w--
Trap A Trap B Trap C Total Oil Total Oil ";;" E"-; Filter wt. of Oil Filter wt. of Oil Filter wt. of Oil Removed Injected Per Cent of
Material Removed Material Removed Material Removed (d (B) Oil Trapped
1,2 6
3 13
4 18
5* 23.5
6A* 22.6
6B* 31.6
71 88
Coarse Ni 0.690 #l Supreme 0.878 #I Supreme 0.501 wool (1) steel wool steel wool
(2) Coarse Ni 1.735 #OO Supreme 3.428 *OO Supreme 0.749 wool steel wool steel wool
(3) Coarse Ni 3.749 Pyrex glass 5.440 Pyrex glass 0.000 wool wool wool #00 Supreme 5.341 Pyrex glass 3.792 Pyrex glass 0.278 steel wool wool wool #00 Supreme 4.929 Pyrex glass 4.188 Pyrex glass 0.123 steel wool wool woo1 X00 Supreme 6.892 steel wool
Pyrex glass 5.374 Pyrex glass 0.001 wool wool
Trap A, B, and C replaced by MSA Ultra Filter using 47.486 7930 cartridge
2.069 3.740 55
5.912 7.410 80
9.189 10.090 91
9.411 13.400
9.240 12.882
12.267 18.012
47.486 50.160
70 co
72 r’
68
95
*These runs were made with 011 being injected into dip-leg. (1) Surface area of 0.016 square meters per gram. (2) Surface area of 0.032 square meters per gram. (3) Surface area of 0.047 square meters per gram.
,
I
-.
- .
I \
.
.
,
,
c )
I 0 T . .h

\ ‘9 *
% b reaction vessel. However, in the first few runs a portion of
'z the oil was probably held up on the walls of exit lines.
3.2.2. Experiment #3 utilized the same coarse nickel
wool in trap A. Traps 3 and C were filled with Supreme #00
steel wool. Eighty perc,ent of the total oil injected was
removed with these traps. .* 3.2.3. Experiment #4 used coarse nickel wool in trap A
and Pyrex glass wool in traps B and C. Although this run was
of greater duration than previous ones, no increase in weight
was found'in trap C. Ninety-one per cent of the oil injected
was removed by this trap assembly.
3.2.4. The following summary indicates the amount of
\ oil retained per gram of filter material used in experiments 6 1 through 4.
r; Expt. # Trap A Trap B Trap C
1 and 2 ,020 . 066 .048
3 . .049 .244 . 078
4 .106 .754 0
3.3. Experimental Data After Altering Oil Injection
To obtain better cracking, the oil entry to the reaction
vessel‘was altered. In experiments 1 through 4 the oil entered
at point p as shown on the flow diagram in Fig. 1. This entry . point was changed to point P' so that the'oil entered directly
into the stream of flowing helium and down the dip-leg of the
reaction vessel. Using this method of injection, the hydrocarbon level at
b

10
the three analysis points S-l, S-2, and S-3 rose to about
ten times previous levels. Obviously, much less cracking
had occurred in experiments 1 through 4. The average hydro-
carbon levels are summarized below:
Expt. # Analysis Analysis ' Point S-l Point S-2
1 -4 75 35 PPrn mw
/ -5 - 7 715 .360 ppm ppm
; 3.03.1. Traps for experiments 5, 6A,
Analysis Point S-3
22 mm 285 ppm
and 6B contained
id n
*
Supreme #00 steel wool in trap A, and Pyrex glass wool in -
traps B and C. Oil recovery ranged from 68% to 72% for this
trap .assembly. More efficient cracking of the oil resulted
in a decreased'oil recovery. It should be noted that in each c of these runs only a small portion of the adsorbable oil mist
c reached trap C as shown in Table 1. *
3.3.2. Experiment 7 investigated the efficiency of a
commercial filter assembly. A M-S-A air line Ultra Filter
as shown in Fig. 2 was used. The particulate filter element
is molded of a cellulose matrix with glass microfibers added
to present a large capturing surface. The cartridge holder
is equipped with a drain plug through which liquids can be
removed periodically.
The M-S-A filter assembly was installed in our apparatus,
replacing traps A, B, and C.
This filter assembly was the most efficient filter
material tested, retaining 95% of' the oil injected into the

11
Fig. 2. 'M-S-A Air Line Ultra Filter
,
?

12
reaction vessel. All of the trapped oil mist was retained
in the filter element, no liquid was present inthe cartridge
holder.
3.3.3. The following summary indicates the grams of oil
mist retained per gram of filter material tested.
Expt. # Trap A Trap B Trap C :
5 0.319 gm 1.365 gm 0.049 gm
6A 0.295 1.243 0.023
6B 0.412 0.925 no wt. gain
7 1.700 -- --
4. CHARCOAL TRAP EFFICIENCY
The charcoal traps used in our experiments were l-in. I I.D. glass Pyrex pipe packed with about 12 inches of PCB
6X16 charcoal.
Under reactor conditions, the decay of fission products
is expected to raise the temperature of a charcoal trap of
the above dimensions to about 100°C. Consequently, charcoal
traps were kept at a temperature of 100°C during our experi-
ments.
A point of interest was the amount of hydrocarbons
necessary to saturate a known amount of charcoal at 100°C.
Data for this investigation were obtained simultaneously with
the filter material tests previously described.
Charcoal trap #l shown in Fig. 1 was filled with a known
amount of charcoal. Sample points S-l, S-2, and S-3 were

monitored with the hydrocarbon detector. Saturation was
5: _ assumed when the hydrocarbon,level at S-2 started approaching
the 'level of S-l.
\ 4.1. Charcoal Saturation with Hydrocarbons r
Figure 3 summarizes the two experiments carried out.
The first experiment made use of a packed bed‘of-about 3 inches
of charcoal in a glass trap. The weight of charcoal was
approximately 6.0 grams per inch. The first evidence of satura-
tion occurred at a total time of 30 hours. A second test with
about 6 inches of charcoal reached'saturation in about 60 hours.
The hydrocarbon level at S-l and S-2 averaged 700 ppm and 425
ppm (C!& eq.) respectively prior to trap saturation.
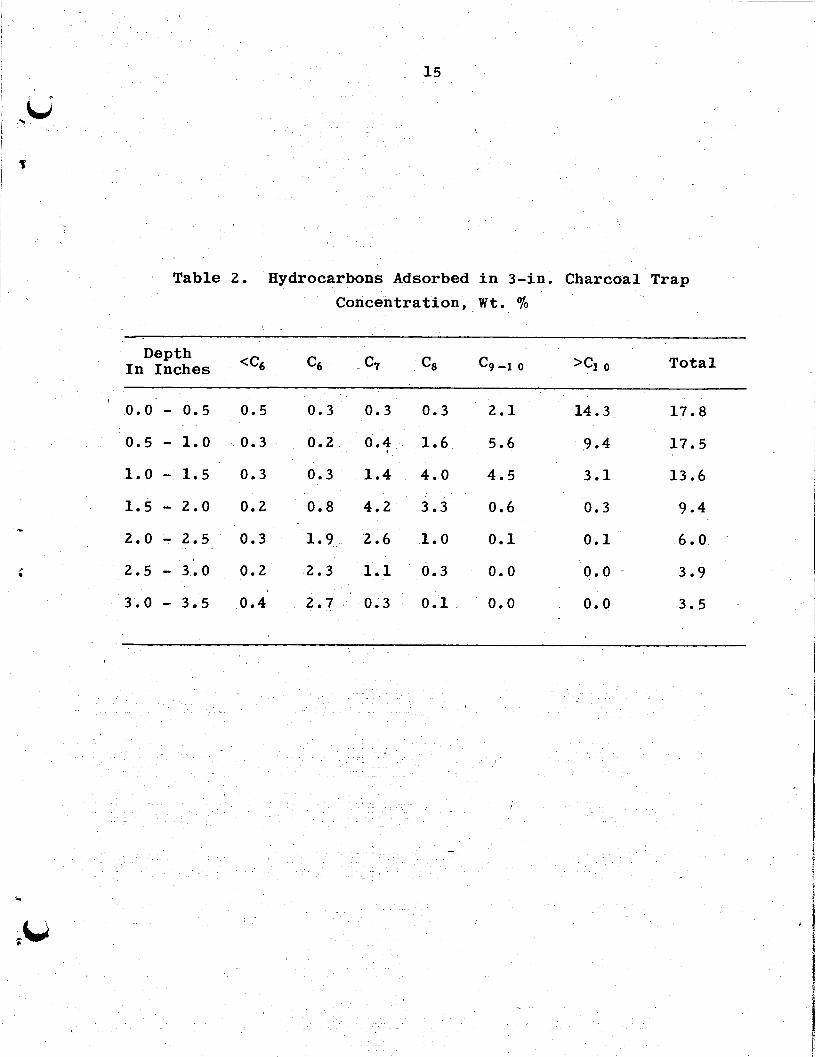
The 3-in. trap was analyzed after it became saturated i
and the results are shown in 'Table 2. This data indicates
that as the heavier hydrocarbons were more strongly adsorbed
in the top of the tra$, the lighter hydrocarbons were forced
to the bottom. "Breakthrough"~ occurred when the Cb hydro-
carbons were forced out, Table 3 contains gas samples taken.
before Andy after hydrocarbon saturation.
E
u P
,4.2. Temperature Dependence of Hydrocarbon Adsorption / on Charcoal
Adsorption of hydrocarbons on the charcoal is,a function
of charcoal temperature as shown in Figs. 4and 5. Upon
booling charcoal trap #2 from 100°C to 25OC the helium efflu-
ent to the trap'was lowered to approximately 40 per cent of
the original hydrocarbon concentration. Cooling from 100°C i \

Fig. 3. Hydrocarbon Saturation of Charcoal Trap #-1
‘_
. /
Table 2. Hydrocarbons Adsorbed in 3-in. Charcdal Trap Concentration,-Wt. %
’ I
Depth In Inches <c6 c6 . c7 c8 c9 -1 0 'Cl 0
’ 0.0 - 0.5 0.5 0.3 0.3 0.3 2.1 14.3. 17.8
0.5 - 1.0 0.3 0.2 0.4 1.6 17.5
1.0 - 1.5. 0.3 0.3 1.4 4.0 4.5 3.1 13.6
1.5 - 2.0 0.2 0.8 4.2 j.3 0.6 0.3 9.4
2.0 - 2.5 0.3' 1.9 2.6 1.0 0.1 0.1 6.0
2.5 - 3:o 0.2 ,2.3 1.1 0.3 0.0 0.0 - 3.9
3.0 - 3.5 0.4 2.7 s' 0.3 0.1 0.0 0.0 3.5

16
Table 3. Analysis of Gas Samples Taken Before and After Hydrocarbon Saturation of-Charcoal Trap
(ppm by Volume)
Before After Components Sample Sample Sample Sample
Pt. S-l Pt. s-2 Pt. S-l Pt. s-2
Methane 25
Ethane 4
Ethylene 70
Propylene 33
Butene-1 7
Isobutylene 3
Cis-Butene-2 4
2-Me Butene-1 4
Pentene-2 1
Branched Hexenes 5
Hexene-1 3
Isomeric Hexenes. 1
30
6
95
40
12
3
8
16
3
41
20
7
4
5
8
2
1
4
1-
28
7
80
41
12
4
8
10
2
3
37
6
,

a .
% P
. Fig. 4. Hydrocarbon Adsorption on Charcoal at 25OC and lbO°C ',

_ . - - . - - - - . - “ . . - .
Fig. 5. Hydrocarbon Adsorption on Char&al at I 25OC, 75'C, and lOO?C.

19
to 75OC lowered the concentration to 70%. When the trap was
returned to 100°C:-aif:ter each cooling'cycle the hydrocarbon
content rose sharply then returned to its original level.
5. TESTING OF MSRE PARTICLE FILTER
Traps A, B, and C were replaced with a prototype of the
MSRE particle filter shown in Fig. 6. This filter was prepared
by personnel of the Reactor Division. The filter consisted
of two Huyck stainless.steel felt metal filters and a chamber
filled with long fiber Fiberfrax. Pressure drop measurements
were made to determine the maximum AP after the felt metal
filters were saturated with oil mist. Measurements were made
using Hz0 and Hg manometers.
A further test was performed in which the felt metal
filters were welded inside a,stainless steel pipe as shown
in Fig. 7. This assembly was placed inside a tube furnace
and tests were conducted at various temperatures.
I‘ 5.1. Pressure Drop Data
Figure 8 shows the pressure drop data obtained from the
MSRE particle filter test. After 24 hours the pressure
remained constant at 2.7 psig. Attempts to blow the oil off
the felt metal filters, by suddenly increasing the flow rate
of helium to 8 liters/min, were not'successful. The AP would
drop slightly, when the-flow rate was returned to 4 liters/min,
but returned to its former level in less than 5 minutes.
The felt metal filters were removed from the system and a
pressure drop across the- Fiberfrax alone was determined. The

20
ORtTL IWO. 664451
TO
,
,-
Fig. 6. Sketch of MSRE Particle Filter Prototype

ORNL WG. 66-9452
i
c
; LJ
r
Fig. 7. *Felt Metal Filter Assembly -Used, At Elevated Temperatures -

ORNT., IXJO. 66-9453
Fig. 8. AP' Ac'ross Prototype at MSRE Particle Filter

c
23
pressure drop was 0.012 psig and remained constant over a
20-hr period.
5 . 2 . Pressure Drop Data of Felt Metal at Elevated Temperatures I
A filter assembly with the coarse and fine felt metal
filters welded in a stainless steel pipe was fabricated as
shown in Fig. 9 . The assembly was placed in a 5-in. tube
furnace. It was desirable to measure the AP of the felt
metal filters at/elevated temperatures, since, during reactor
operations, the decay of fission products would possibly
raise the temperature of the filter assembly.
Measurements at various temperatures were reproducible i
as shown in Fig, 9 . However, the maximum aP at 25OC was
0 . 4 5 psig compared with 2 . 7 psig measured in the previous
experiment.
DOP measurements conducted by the Reactor Division on
the prototype of the MSRE particle filter showed it to be
99.9870 efficient. The welded filter assembly, when tested,
was only about 9570 efficient. Although there was no visible
evidence, cracks may have been present in the welds of the
welded filter assembly. ’ Thirty hours at 25OC were required before the felt metal
filters became saturated with oil mist.
maximum AP required only about one or two minutes. Upon
reaching maximum AP at room temperature, heat was applied to
The transition to the
the filter assembly. At a temperature of 15OoC the AP

1
N
tb

25 - i b f decreased sharply, returning almost to the minimum. When the
temperature was'raised to 400°C and 600°C -the aP rose slightly
in each case but gave no indication of plugging. The rise in
AP associated with a rise in temperature can probably be,attrib-
uted to an increasetin the-viscosity of helium. The viscosity
of helium at 25OC is 180 micropoises, and at 600°C is 405
micropoises. \
A total of 230 grams of Gulfspin- oil was injected into
the heated reaction vessel during the previously described
experiments. Upon termination of the experiments the reaction
vessel was cut apart for visual inspection. The vessel con-
tained 0.5 grams of dry carbon; no 8vidence.of any liquid
hydrocarbons was found.
The welded felt metal filter assembly was also cut apart;
again no liquid hydrocarbons were found.
a.
-u -. t
6. ACKNOWLEDGEMENTS
6.1. Excellent cooperation and much assistance was
received from Messrs. A.~ S. Meyer, C. M:Boyd, and A. D.
Horton, of the Analyt>cal Chemistry Division, who supplied
and installed the hydrocarbon gas analyzer, assisted us with
the interpretation of the results, and .analyzed many samples
of gas and charcoal by~~the gas chromatographic procedure,
~6.2. Continuous operation of-the apparatus over the
period of many days was made possible by the MSRE operations
section through their assignment of personnel for taking
data during the evening and night shifts, I

bl(. .- 6.3. The close cooperation and frequent discussions
with D. Scott,. Jr., were invaluable in guiding the investi-
gation in directions which were bseful for the application
‘r
of fi.lters to the MSRE off-gas syetem.
I

%. 27
i t
\ "
3 \ DISTRIBUTION .
1. G. M; Adamson . 2. C. F. Baes, Jr. '
3. S. E. Beall
4. E. S. Bettis 5 : F. F. Blankenship 6. E. G. 7, C. M. 8. R. B. 9. w. Il.
10. W. R. 11. A. G. 12. P. N.
13-18. B. F, 19. A. D. Horton
Bohlmann Boyd Briggs Cook Grimes Grindell Haubenreich Hitch
20. P. R. Kasten 21. S. S. Kirslis 22. R. B. Lindauer 23. H. G. MacPherson 24. H. F. McDuffie 25. A. S. Meyer, Jr. 26. R. L. Moore 27. R. J. Ross 28. D. Scott, Jr.
29; A. N. Smith ! 30. P. G. Smith
31. J. R. Tallackson 32, R. E. Thoma 33. M. E. Whatley
/ 34-35. Central Research Library 36. Document Reference Section
37-39. Laboratory Records 40. Laboratory Records, ORNL R.C. 41, ORNL Patent Office

28
. DISTRIHJTIOIV
42. Research aid Development Div., OR
43-57. DTIE, OR