tests of financial intermediation and banking reform in china
TRANSCRIPT
Journal of Comparative Economics29, 608–644 (2001)doi:10.1006/jcec.2001.1740, available online at http://www.idealibrary.com on
Tests of Financial Intermediation and BankingReform in China1
Albert Park
Department of Economics and William Davidson Institute, University of Michigan,Ann Arbor, Michigan 48109E-mail: [email protected]
and
Kaja Sehrt
Department of Government, Dartmouth College, Hanover, New Hampshire 03755E-mail: [email protected]
Received November 29, 1999; revised August 20, 2001
Park, Albert, and Sehrt, Kaja—Tests of Financial Intermediation and Banking Reformin China
We develop tests of financial intermediation by national banking systems based on theexpectation that, in commercial systems, financial intermediation should not be overlyinfluenced by policy variables; should be greater in richer, faster growing industrial areas;and should direct funds to the best projects regardless of where deposits originate. UsingChinese provincial data from 1991 to 1997, we test whether financial reforms in the mid-1990s increased efficient intermediation by different financial institutions. We find thatthe importance of policy lending by state banks did not fall during the recent period andthat lending by financial institutions did not respond to economic fundamentals.J. Comp.Econ., December 2001,29(4), pp. 608–644. University of Michigan, Ann Arbor, Michigan48109; and Department of Government, Dartmouth College, Hanover, New Hampshire03755. C© 2001 Elsevier Science
Key Words:financial intermediation; banking; transition; China.
Journal of Economic LiteratureClassification Numbers: G21, O16, O53, P34.
11 Albert Park acknowledges the research assistance of Chunliang Zhang and financial support fromthe Ford and Luce Foundations. We thank Loren Brandt, Claudio Gonzalez-Vegas, Roger Gordon,David Li, and two anonymous referees for helpful comments.
6080147-5967/01 $35.00C© 2001 Elsevier ScienceAll rights reserved.

FINANCIAL INTERMEDIATION IN CHINA 609
1. INTRODUCTION
As economies grow, financial institutions play an increasingly important rolein directing financial resources to their most productive use. Through their greatersize and scope, they are better able than informal institutions to safeguard deposits,diversify portfolio risk, provide liquidity to borrowers and depositors, and achieveeconomies of scale in evaluating projects and providing financial services. Thedepth of financial intermediation, measured by loans as a share of GDP, has beenshown to be positively associated with both the level of development, measuredby GDP per capita, and the rate of economic growth.2
The literature’s emphasis on the size of the financial sector overlooks differ-ences in how well available resources are allocated. The recent Asian financialcrisis and the experience of banks in transition economies (Bonin and Szekely,1994), as well as historically poor bank performance in Latin America and Africa(Haggard and Lee, 1995; Nissanke, 1998), highlight the difficulty of establishingsuccessful commercial banking systems that allocate financial resources efficiently.Policy lending, barriers to interregional lending, distorted pricing, poor manage-rial incentives, and lack of prudential financial regulation can undermine financialperformance.
This paper proposes a new approach to assess the effectiveness of financial inter-mediation by national banking systems. The tests, derived from the optimizationproblem of bank managers, exploit regional financial and economic data and arebased on the expectation that, in efficient systems, financial intermediation shouldnot be overly influenced by policy variables; should be greater where projects aremore profitable and require greater financing, which is typically in faster grow-ing, richer, and more industrial areas; and should direct funds to the best projectsregardless of where deposits originate.
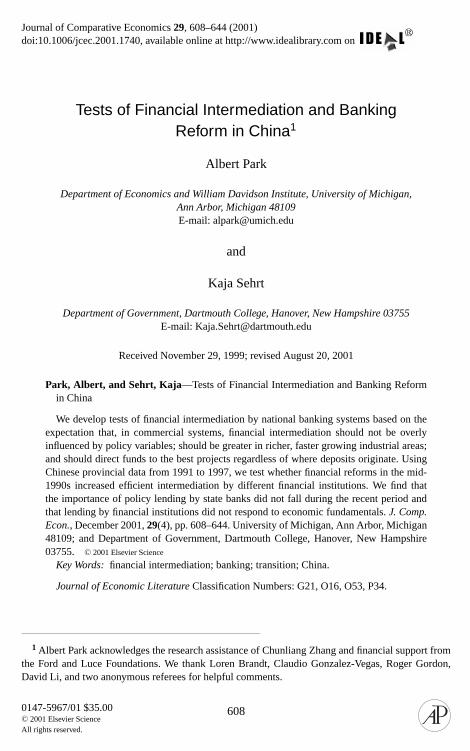
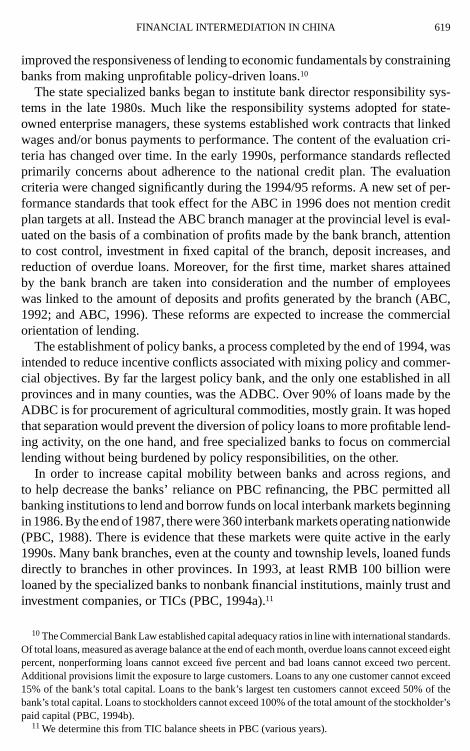
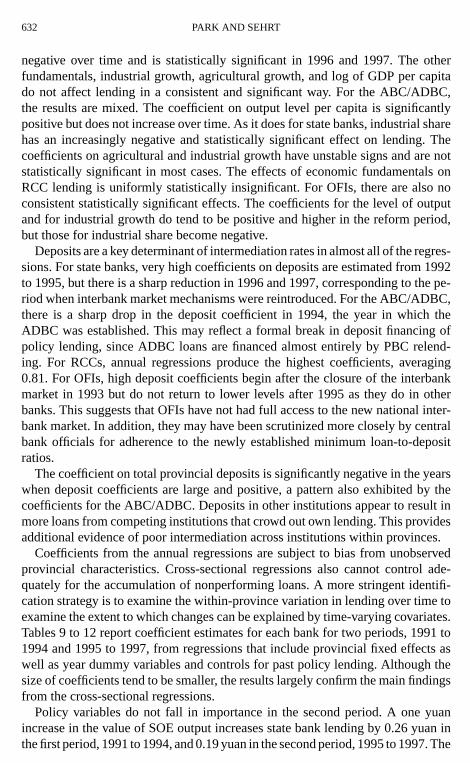
We apply these tests to China. The Asian financial crisis has heightened scrutinyof China’s state banking system, whose fragility stems from the continued use ofthe financial system to support urban-based, state-owned enterprises (Brandt andZhu, 2000). Recent estimates suggest that more than one quarter of the loans ofChina’s four major state-owned banks are nonperforming and that these banksare technically insolvent (Lardy, 1998). Provincial data of 1997 reveals a strikinginverse relationship between financial intermediation and GDP per capita that isat odds with the empirical regularity of positive correlation found in cross-countrystudies (Fig. 1). This pattern suggests that the allocation of financial resourcesacross provinces may be highly inefficient, with richer provinces being taxedrelative to poorer provinces (Sehrt, 1999; Lardy, 1998).
In recent years, the Chinese leadership has recognized the importance of improv-ing financial intermediation and has made financial reforms a top policy priority.
2 See Gertler and Rose (1996), Goldsmith (1969), King and Levine (1993), Levine and Zervos(1998), and Rajan and Zingales (1998). Financial intermediation can also occur through equity markets,but in China the stock market is small and tightly regulated.

610 PARK AND SEHRT
FIG. 1. All bank financial intermediation rate and GDP per capita in Chinese provinces 1997.Note: Excludes Beijing, Tianjin, Shanghai, and Tibet.
The most sweeping changes were implemented in the mid-1990s, i.e., relaxationof binding credit plans following the 1993 antiinflation campaign, centralization ofrelending by the People’s Bank of China (PBC) to reduce excessive local influenceon central bank financing of loans, a shift to ratio management of loans that gavemore autonomy to state banks to reallocate funds among provincial branch offices,adoption of a new Commercial Bank Law to improve managerial incentives andprudential financial regulation, establishment of policy banks to separate policyfrom commercial lending, and the establishment of a national, unified interbankmarket. This paper provides initial empirical evidence on the effect of these reformson loan allocation decisions. We examine the performance of different Chinesefinancial institutions before and after the reforms; these consist of all state banks,including specialized and policy banks; the Agricultural Bank of China (ABC),a specialized bank that was relieved of most of its policy lending duties with theestablishment of China’s largest policy bank, the Agricultural Development Bankof China (ADBC); rural credit cooperatives (RCCs), which are the largest financialinstitutions other than state banks and which have a branch structure reaching tovillages; and other financial institutions (OFIs), including urban cooperatives andUrban Cooperative Banks, national and regional commercial banks, and nationaltrust and investment companies, which constitute a small but dynamic part of thefinancial sector.
We find a significant effect of policy concerns on lending by state specialized andpolicy banks, such as to support state-owned enterprises and grain procurement,and, if anything, this has increased since the financial reforms in the mid-1990s.Economic fundamentals have had little effect on total lending by state banks, butthere is evidence that separation of policy and commercial lending through theestablishment of the ADBC has enabled the ABC to become more commercially
FINANCIAL INTERMEDIATION IN CHINA 611
oriented. Among other financial institutions, RCCs and OFIs both seem poorlyintegrated into financial markets. We conclude that while recent reforms of statebanks, including reforms after 1997, and the growth of OFIs hold promise for futureperformance, remaining restrictions on interbank lending, interest rates, and entryremain serious obstacles to efficient financial intermediation.
The paper is organized as follows. In Section 2, we present a model of financialintermediation that leads to formal tests of efficient financial intermediation. InSection 3, we introduce China’s financial system and describe the main financialreforms. Section 4 outlines the empirical specification and hypotheses to be tested.The empirical analysis is presented in Section 5, including discussions of data,estimation, and results. Section 6 concludes.
2. MODELING FINANCIAL INTERMEDIATION
Consider the problem of a bank or bank branch, denotedb, located in regionrlending to different sectors of the economy, indexed byi .3 Bank profits of bankbin regionr can be expressed as
πrb =∑
i
{(1+r )
Lrbi∫0
Rrbi (L) dL
}+Lrbg(1+r )Rrbg−(1+d)Drb−(1+rT )Trb,
(1)wherer is the loan interest rate,d is the deposit interest rate,rT is the interest ratefor interbank loans,Rrbi is the expected repayment rate for loans to sectori , Rrbg
is the expected repayment rate for government policy loans,Lrbi is the amount ofloans to sectori , Lrbg is the amount of government policy loans,Drb is the amountof deposits, andTrb is the net amount of interbank borrowing.
The bank manager’s utility reflects the dual commercial and policy objectives ofbanks in China. It is a weighted sum of the bank’s profits and the volume of policylending, denotedLrbg. The one-period utility-maximization problem of bankb inregionr can be expressed as
MaxLrbi ,Lrbg,Trb
Urb = πrb + λrb log(Lrbg) (2)
s.t.∑i
Lrbi + Lrbg − Drb − Trb = 0, (3)
whereπrb is bank profits,Lrbg is the volume of policy lending, andλrb is therelative utility weight on policy lending.
3 In China, provincial banks, and many lower level banks, are independent accounting units. How-ever, even if all decisions are made by national headquarters, unless severe information asymmetriesand moral hazard problems are present, the pattern of predicted lending will be the same as in thedecentralized case.

612 PARK AND SEHRT
Assuming a free interbank market for funds, the bank can demand (or supply)funds from (or to) the interbank market so thatTrb can be positive or negative. Thebank takes all interest rates, the amount of deposits, and the expected repaymentrate of policy loans as exogenous. It chooses the amount of lending to each sector,the amount of policy lending, and the amount of net borrowing from the interbankmarket. A balance condition equates the sources and uses of funds, i.e., Eq. (3).
For commercial lending, the main difference between regions and banks is thequality of loan projects, or the expected repayment rate on loans. We assume thatthe repayment rate is a linear function of the economic fundamentals including thesector’s size, as measured by the share of its output,qri , the sector’s rate of growth,gri , interacted with its size, the overall level of development measured by outputper capita, denoted asyr /popr , and the extent of financial intermediation, or theamount of lending by the bank,Lrbi , and lending by other banks in the sector,denotedL-rbi , each normalized by sectoral output,qri yr . Hence, we posit
Rrbi = −α1i
Lrbi
qri yr− α2
i
L-rbi
qri yr+ α3
i qri + α4i qri gri + α5
i ln
(yr
popr
). (4)
Here, all the coefficients,αni , are defined to be positive, and the signs in Eq. (4)
are explained as follows. As lending to the sector increases, good projects becomeharder to find and the expected repayment rate falls as indicated by the first twoterms. The larger and faster growing is the sector, the easier it is to find goodprojects for a given lending volume as represented by the next two terms. Regionswith higher levels of development tend to have greater financing requirementsbecause of more input- and capital-intensive production activities as indicated bythe last term. Furthermore, if different banks serve different client pools within thesector, the effect of loans from other banks on repayment may be less than that ofthe bank’s own lending, i.e.,α1
i > α2i .
With a free interbank market, each bank can borrow or lend as much as it wantsat the interbank interest rate. Lending to each sector in each province equates themarginal expected return to the cost of interbank funds, which, if set to clear themarket, leads to an efficient allocation across sectors and provinces.
Solving the bank’s maximization problem, aggregating lending to different sec-tors and policy lending, normalizing loan volume by economic output, and solvingfor the Nash equilibrium for lending by multiple banks, if each bank takes lend-ing by the other banks to be exogenous, yields the following expression for bankintermediation rates:
l ∗rb =∑
i
(κiα
3i
α1i
qri + κiα4i
α1i
qri gri
)+∑
i
κiα5i
α1i
ln
(yr
popr
)
−∑
i
κi (1+ rT )
α1i (1+ r )
+ λrb
cyr. (5)
FINANCIAL INTERMEDIATION IN CHINA 613
Here,κi are constant parameters that measure the substitutability of lending amongbanks that lend to the same sector andc = (1+ rT )− (1+ r )Rrbg. Equation (5),κi , andc are derived explicitly in the Appendix.
Note that, with a free interbank market, optimal policy lending and commerciallending are separable (see Appendix for expressions for optimal policy and com-mercial lending). Optimal levels of commercial lending are the same regardless ofthe amount of policy lending and vice versa, since in either case, the opportunitycost of funds isrT . Consequently, total bank intermediation is a function both ofeconomic fundamentals and policy lending goals.
If the volume of interbank lending is restricted (TLrb < Trb < TUrb), whereTLrb andTUrb are lower and upper bounds, and one of the constraints is binding,i.e., the bank would like to borrow or lend more at the going interest rate, thefollowing identity must hold:
lrb = Drb
Yr+ TL(TU)rb
yr. (6)
If interbank constraints are identical for all banks in all provinces, the quality ofloan projects still affects lending amounts within the range of the bounds. If, on theother hand, interbank transfers are fully dictated by policy, i.e.,TLrb = TUrb, thebank has no role in affecting the amount of lending and economic fundamentalsbecome irrelevant.
Of course, it is possible that the bounds themselves are responsive to economicfundamentals if officials internalize the goal of efficient intermediation. In the caseof efficient planning, planned transfers would be set equal to the market-determinedamounts and the outcome would be indistinguishable from the decentralized case.However, officials may have other policy objectives. Intermediation could evenbe inversely related to economic fundamentals if prosperous areas are taxed tofinance policy lending elsewhere. Absent a free interbank market, intermediationoutcomes depend on the specific alternative mechanisms that enable funds to moveacross regions.
We can model the transfer bounds as a function of economic fundamentals,policy variables, and deposits by writing
TL(TU)rb = δ0+∑
i
(δ1
i qri + δ2i qri gri
)+ δ3 ln
(yr
popr
)
+ δ4λrb + δ5λr + δ6 Drb
yr. (7)
Inclusion of deposits captures the idea that the government may tax banks withhigh deposit levels by adjusting transfer bounds. In such cases, more deposits donot necessarily translate into an ability to make more loans. Substituting (7) into
614 PARK AND SEHRT
(6) yields the following expression for lending when transfer bounds are binding:
lrb = δ0+∑
i
(δ1
i qri + δ2i qri gri
)+ δ3 ln
(yr
popr
)+ δ4λrb + δ5λr + (1+ δ6)
Drb
yr. (8)
This equation contains two variables that do not appear in the lending equation,Eq. (5), which assumes efficient intermediation. These new variables are provincialpolicy lending goals,λr , which include policy loans not lent by the bank itself, andthe amount of deposits in the bank,Drb/yr . Thus, measuring the effect of thesevariables on lending is a natural test for efficient intermediation. For example,lending by a rural bank could be influenced by the size of the state-owned sectoreven if the rural bank does not lend directly to that sector. Also, with free interbanklending, lending amounts should depend on economic fundamentals and not beinfluenced by the amount of own deposits. Hence, a strong effect of deposits onlending is indicative of inefficient intermediation. However, the lack of an effectis not evidence of efficient intermediation because it may reflect a governmentpolicy of fully taxing surplus deposits, i.e.,δ6 = −1. To the extent that the effectof economic fundamentals on lending may be of opposite sign in (5) and (8), thesign of the coefficients on economic variables become an additional test.
These tests examine financial intermediation across provinces. Even if inter-provincial intermediation is inefficient, we may be interested in assessing inter-mediation within provinces. If there were no financial flows among provinces butunrestricted flows within provinces, provincial policy loans should affect lendingvolume by all institutions. This also may be true if intraprovincial flows are re-stricted, so the effect of provincial policy loans on lending cannot be used to testfor the efficiency of intraprovincial intermediation. A more promising approachis to test the effect of savings in other provincial banks on bank lending. If theinterbank market within the province is free, lending by any one bank should beaffected by total deposits in the province rather than the bank’s own deposits.
3. FINANCIAL INTERMEDIATION IN CHINA
3.1. Description of Financial System
China’s financial system is dominated by four state-owned commercial banksand three policy banks.4 In 1997, these seven banks accounted for two thirds of
4 The three policy banks are the State Development Bank of China (SDB), which finances largeinfrastructure projects, the Agricultural Development Bank of China (ADBC), which provides work-ing capital for the procurement of agricultural commodities, and the Export-Import Bank of China,which provides export credit particularly for enterprises in the shipbuilding, machinery and electronicsindustries. Policy banks do not take deposits but finance their loans via central bank relending or byissuing bonds.
FINANCIAL INTERMEDIATION IN CHINA 615
TABLE 1Deposits and Loan Shares of China’s Financial Institutions, 1997
Deposits Loans
State BanksSpecialized Banks 65% 62%
Industrial and Commercial Bank of China 28% 26%Agricultural Bank of China 14% 13%Bank of China 7% 7%China Construction Bank 16% 15%
Policy Banks 0% 16%Agricultural Development Bank of China 0% 11%State Development Bank of China 0% 5%Export–Import Bank 0% 0%
Other Financial Institutionsa 35% 22%Rural Credit Cooperatives 13% 10%National Commercial Banksb 8% 4%Regional Commercial Banksc 2% 1%Urban Credit Cooperatives/Urban Coop. Banks 7% 5%Postal Savings 3%National Trust-and Investment Companies 1% 1%
Note. Source: Calculated from PBC (China Financial Yearbook 1998) and the banks’ annual reports.a Among the excluded institutions are regional trust-and investment companies and finance compa-
nies, which are estimated to account for three percent of the national total for both loans and deposits.Also excluded are rural cooperative funds (RCFs), rotating savings and credit associations (ROSCAS),interenterprise finance, and other informal lending institutions.
b National commercial banks include the Bank of Communications, CITIC Industrial Bank,Everbright Bank, Huaxia Bank, the China Investment Bank, Zhaoshang Bank and Minsheng Bank.
c Regional commercial banks include Guangdong Development Bank, Shenzhen DevelopmentBank, Fujian Xingye Bank, Shanghia Pudong Development Bank and Hainan Development Bank.
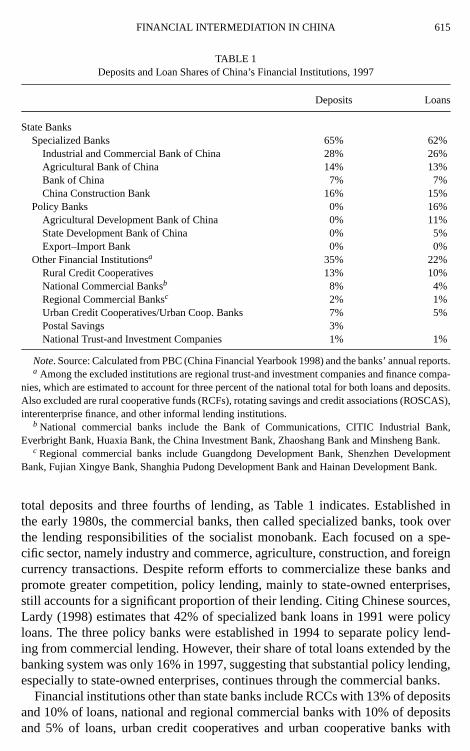
total deposits and three fourths of lending, as Table 1 indicates. Established inthe early 1980s, the commercial banks, then called specialized banks, took overthe lending responsibilities of the socialist monobank. Each focused on a spe-cific sector, namely industry and commerce, agriculture, construction, and foreigncurrency transactions. Despite reform efforts to commercialize these banks andpromote greater competition, policy lending, mainly to state-owned enterprises,still accounts for a significant proportion of their lending. Citing Chinese sources,Lardy (1998) estimates that 42% of specialized bank loans in 1991 were policyloans. The three policy banks were established in 1994 to separate policy lend-ing from commercial lending. However, their share of total loans extended by thebanking system was only 16% in 1997, suggesting that substantial policy lending,especially to state-owned enterprises, continues through the commercial banks.
Financial institutions other than state banks include RCCs with 13% of depositsand 10% of loans, national and regional commercial banks with 10% of depositsand 5% of loans, urban credit cooperatives and urban cooperative banks with
616 PARK AND SEHRT
7% of deposits and 5% of loans, and national trust and investment companieswith insignificant market share.5 The RCCs are the only financial institutionswith a branch network extending to villages. They have received administrativesupervision from the PBC since 1996, and before then from the ABC. RCCslend mainly to farmers and rural enterprises and have no national headquartersto directly intermediate funds across provinces. Other financial institutions (OFIs)are more recently established, dating from the late 1980s, located in richer regions,tend to lend more funds to the nonstate sector, and have grown rapidly in recentyears. OFIs are subject to central bank reserve requirements but do not have accessto central bank refinancing.
3.2. Policy Changes
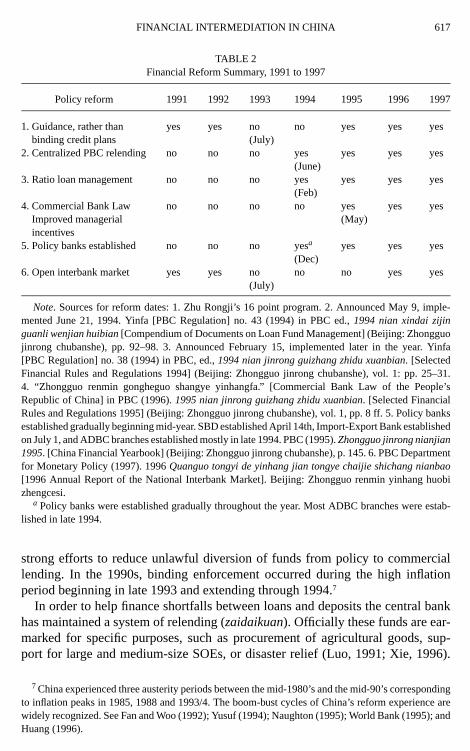
The efficiency of financial intermediation depends on the specific mechanismsthat facilitate financial flows across regions. In China, there are three main channels:central bank fund allocation, mainly through relending by the PBC, reallocationof funds among provincial branches of national banks, or within-bank transfers,and the interbank market. Financial reforms in the 1990s affected all three of thesechannels.6 We discuss briefly six policy changes and their anticipated effects oninterregional financial flows. The changes are summarized in Table 2.
Although production and distribution plans gradually lost their importance inthe mid-1980’s, annual national credit plans have continued to be a key deter-minant of interregional fund allocation. Based on consultation with provincialgovernment leaders and managers of national banks, the State Planning Commis-sion determined credit targets for each bank branch in each province. The plansgave primacy to policy lending goals, which were often linked to specific projects,but also internalized distributional and efficiency considerations. When strictly en-forced, the plans left little room for bank managers to adjust total lending amounts,either through within-bank transfers or interbank lending.
During different periods, credit plan targets either have been enforced as bind-ing (zhilingxing) or have been understood to provide only guidance (zhidaoxing).Binding enforcement has occurred during policy retrenchment periods to combatinflation and reduce excessive total lending. These periods have been associatedwith sharply reduced lending to the nonstate sector (Brandt and Zhu, 2000) and
5 Our data do not include other financial institutions such as regional trust and investment companies,finance companies, rural cooperative funds (RCFs), rotating savings and credit associations (ROSCAs,or hui), interenterprise finance, and other informal financial organizations.
6 The financial reforms of the mid-1990s were designed to improve the quality of loan portfolios andimprove monetary control. They began with what became known as Zhu Rongji’s 16 point programin July 1993, which contained emergency measures aimed at reducing inflation. The December 1993State Council’s Decision on Reform of the Financial System was the blueprint for the financial reformsinstituted in the following year; these include the establishment of policy banks. This was followed bythe promulgation of a new Central Bank Law on March 18, 1995 and a new Commercial Bank Lawon May 5, 1995.
FINANCIAL INTERMEDIATION IN CHINA 617
TABLE 2Financial Reform Summary, 1991 to 1997
Policy reform 1991 1992 1993 1994 1995 1996 1997
1. Guidance, rather than yes yes no no yes yes yesbinding credit plans (July)
2. Centralized PBC relending no no no yes yes yes yes(June)
3. Ratio loan management no no no yes yes yes yes(Feb)
4. Commercial Bank Law no no no no yes yes yesImproved managerial (May)incentives
5. Policy banks established no no no yesa yes yes yes(Dec)
6. Open interbank market yes yes no no no yes yes(July)
Note. Sources for reform dates: 1. Zhu Rongji’s 16 point program. 2. Announced May 9, imple-mented June 21, 1994. Yinfa [PBC Regulation] no. 43 (1994) in PBC ed.,1994 nian xindai zijinguanli wenjian huibian[Compendium of Documents on Loan Fund Management] (Beijing: Zhongguojinrong chubanshe), pp. 92–98. 3. Announced February 15, implemented later in the year. Yinfa[PBC Regulation] no. 38 (1994) in PBC, ed.,1994 nian jinrong guizhang zhidu xuanbian. [SelectedFinancial Rules and Regulations 1994] (Beijing: Zhongguo jinrong chubanshe), vol. 1: pp. 25–31.4. “Zhongguo renmin gongheguo shangye yinhangfa.” [Commercial Bank Law of the People’sRepublic of China] in PBC (1996).1995 nian jinrong guizhang zhidu xuanbian. [Selected FinancialRules and Regulations 1995] (Beijing: Zhongguo jinrong chubanshe), vol. 1, pp. 8 ff. 5. Policy banksestablished gradually beginning mid-year. SBD established April 14th, Import-Export Bank establishedon July 1, and ADBC branches established mostly in late 1994. PBC (1995).Zhongguo jinrong nianjian1995. [China Financial Yearbook] (Beijing: Zhongguo jinrong chubanshe), p. 145. 6. PBC Departmentfor Monetary Policy (1997). 1996Quanguo tongyi de yinhang jian tongye chaijie shichang nianbao[1996 Annual Report of the National Interbank Market]. Beijing: Zhongguo renmin yinhang huobizhengcesi.
a Policy banks were established gradually throughout the year. Most ADBC branches were estab-lished in late 1994.
strong efforts to reduce unlawful diversion of funds from policy to commerciallending. In the 1990s, binding enforcement occurred during the high inflationperiod beginning in late 1993 and extending through 1994.7
In order to help finance shortfalls between loans and deposits the central bankhas maintained a system of relending (zaidaikuan). Officially these funds are ear-marked for specific purposes, such as procurement of agricultural goods, sup-port for large and medium-size SOEs, or disaster relief (Luo, 1991; Xie, 1996).
7 China experienced three austerity periods between the mid-1980’s and the mid-90’s correspondingto inflation peaks in 1985, 1988 and 1993/4. The boom-bust cycles of China’s reform experience arewidely recognized. See Fan and Woo (1992); Yusuf (1994); Naughton (1995); World Bank (1995); andHuang (1996).
618 PARK AND SEHRT
Relending supports credit plan targets by providing low-interest loans to bankbranches that have a quota but no funds. Throughout the late 1980s and early 1990s.PBC relending refinanced about 30% of the specialized banks’ loans, reaching al-most 40% in 1993, as calculated from PBC (various years).
Until 1994, the vast majority of PBC relending, up to 70% according to someestimates, was channeled through the PBC’s local branches at the provincial leveland below (Xie, 1996).8 Decisions by managers of these branches were often in-fluenced by local government officials who controlled their promotion and otherbenefits (Sehrt, 1999). This led to excessive lending that contributed to inflationarypressures. To combat this problem, in May 1994, local PBC branches were pro-hibited from relending to specialized bank branches in their locale (PBC, 1994c).The PBC instead directed refinancing to the national headquarters of specializedor policy banks, which distributed them to local branches based on approved plans.Thus, local branches had to appeal to their headquarters for additional funds, ratherthan, with the help of local government officials, pressuring local PBC branches toextend more funds. If previously excessive lending supported politically desiredprojects of local officials primarily, centralized relending should have strengthenedthe commercial basis of lending.
Reforms in 1994 changed the method for determining approved credit vol-ume of specialized banks. Instead of the previous system of administrative tar-gets (guimo guanli), approved credit volume was based on a maximum ratiobetween loans and deposits (bili guanli) (PBC, 1994b).9 The ratios applied tototal national lending by individual banks, but allowed the headquarters to al-ter the credit allocation for specific provinces. This change should have pro-vided specialized banks with greater flexibility to use within-bank transfers toadjust interregional fund allocation, presumably to pursue commercial lendinggoals.
The new Commercial Bank Law that came into effect in 1995 contained mea-sures to improve managerial profit incentives and, consequently, the quality ofbank loan portfolios. The establishment of capital adequacy ratios should have
8 Officially, PBC refinancing at the local level was intended only to help banks cover temporaryshortages in funds. However, the balance sheets of local PBC branches reflect that, throughout the late1980s and early 1990s, at least 50% of PBC relending extended at the provincial level and below wereloans with a duration of one year or above (HJPBC, 1996; ZPBC, 1997).
9 In line with Basle international banking standards, the average of total loans at the end of eachten day period cannot exceed 75% of the average of total deposits during that time period. Ratiomanagement applies to all domestic commercial banks as well as to foreign joint venture banks. Thefour specialized banks, which had much higher loan–deposit ratios, were given two years to conformto these standards. For the four specialized banks, the average total of new loans at the end of ten dayperiod cannot exceed 75% of the average total new deposits during that time period (PBC, 1994b). It isquestionable whether the specialized banks are actually conforming with these ratios. Although thereis evidence that, since 1994, the ratio of new loans to new deposits of the specialized banks has beenbelow the 75% limit (Xie, 1997), the ratios of outstanding loans to total deposits, remain well abovethe Basle standards.
FINANCIAL INTERMEDIATION IN CHINA 619
improved the responsiveness of lending to economic fundamentals by constrainingbanks from making unprofitable policy-driven loans.10
The state specialized banks began to institute bank director responsibility sys-tems in the late 1980s. Much like the responsibility systems adopted for state-owned enterprise managers, these systems established work contracts that linkedwages and/or bonus payments to performance. The content of the evaluation cri-teria has changed over time. In the early 1990s, performance standards reflectedprimarily concerns about adherence to the national credit plan. The evaluationcriteria were changed significantly during the 1994/95 reforms. A new set of per-formance standards that took effect for the ABC in 1996 does not mention creditplan targets at all. Instead the ABC branch manager at the provincial level is eval-uated on the basis of a combination of profits made by the bank branch, attentionto cost control, investment in fixed capital of the branch, deposit increases, andreduction of overdue loans. Moreover, for the first time, market shares attainedby the bank branch are taken into consideration and the number of employeeswas linked to the amount of deposits and profits generated by the branch (ABC,1992; and ABC, 1996). These reforms are expected to increase the commercialorientation of lending.
The establishment of policy banks, a process completed by the end of 1994, wasintended to reduce incentive conflicts associated with mixing policy and commer-cial objectives. By far the largest policy bank, and the only one established in allprovinces and in many counties, was the ADBC. Over 90% of loans made by theADBC is for procurement of agricultural commodities, mostly grain. It was hopedthat separation would prevent the diversion of policy loans to more profitable lend-ing activity, on the one hand, and free specialized banks to focus on commerciallending without being burdened by policy responsibilities, on the other.
In order to increase capital mobility between banks and across regions, andto help decrease the banks’ reliance on PBC refinancing, the PBC permitted allbanking institutions to lend and borrow funds on local interbank markets beginningin 1986. By the end of 1987, there were 360 interbank markets operating nationwide(PBC, 1988). There is evidence that these markets were quite active in the early1990s. Many bank branches, even at the county and township levels, loaned fundsdirectly to branches in other provinces. In 1993, at least RMB 100 billion wereloaned by the specialized banks to nonbank financial institutions, mainly trust andinvestment companies, or TICs (PBC, 1994a).11
10The Commercial Bank Law established capital adequacy ratios in line with international standards.Of total loans, measured as average balance at the end of each month, overdue loans cannot exceed eightpercent, nonperforming loans cannot exceed five percent and bad loans cannot exceed two percent.Additional provisions limit the exposure to large customers. Loans to any one customer cannot exceed15% of the bank’s total capital. Loans to the bank’s largest ten customers cannot exceed 50% of thebank’s total capital. Loans to stockholders cannot exceed 100% of the total amount of the stockholder’spaid capital (PBC, 1994b).
11We determine this from TIC balance sheets in PBC (various years).
620 PARK AND SEHRT
The possibility that large but unmonitored interregional transactions were lead-ing to substantial outflows from the formal banking system, thus underminingthe effectiveness of the credit plan, prompted policy-makers in the second half of1993 to suspend most interbank market activities. With the exception of tradingcenters run by PBC branches in 35 cities for short-term borrowing and lending, allinterbank market centers were shut down.
A new, national unified interbank market was opened in Shanghai in January1996. The new market is much more tightly controlled than the one that had existedin 1993. Access to the market is reserved for the national headquarters of special-ized banks and PBC branches in 35 cities. Interbank lending is limited to short-termtransactions, with a maximum period of four months. Thus, bank branches are nolonger able to trade independently but must depend on their headquarters to adjusttheir supply of funds (PBC, 1994b; Wang and Yang, 1996; PBC Department forMonetary Policy, 1997). Other financial institutions, such as the headquarters ofnational and regional commercial banks and Urban Cooperative Banks, also haveaccess to the national interbank market in principle.
3.3. Reform
Most of the financial reforms were implemented from mid-1994 to mid-1995;all had the potential to increase the commercial orientation of the banking system.We divide the 1991 to 1997 period into a prereform part from 1991 to 1994 and apostreform part from 1995 to 1997, despite the fact that the timing of a few reformsdo not fit well with this division. First, two retrenchment policies began in 1993,with the binding enforcement of credit plans and suspension of interbank trading.These hurt commercialization in the middle of the pre-reform period. Second, thereestablishment of the interbank market did not occur until January 1996, well intothe postreform period. The timing of these reforms may qualify our interpretationof the empirical analysis, but broadly speaking the postreform period should havebeen more commercialized if the intended reforms were implemented successfully.Evidence on the effect of oddly timed reforms also may appear in annual regressionresults.
The effect of reforms on financial performance may have differed by financialinstitution. The strongest effects should be seen in the performance of state spe-cialized and policy banks, which were directly affected by all six policy changes.The effect of establishing policy banks should be especially pronounced for theABC, China’s second largest specialized bank in 1993, whose policy lending dutieswere taken over by the country’s largest policy bank, the ADBC. The ADBC’s loanportfolio was almost as large as that of the ABC by 1997 (see Table 1). The ABCis also unique as it is the only specialized bank to negotiate a fixed tax contractwith the center as early as 1988. This arrangement could have made managerialprofit incentives stronger than in other banks.
RCCs and OFIs were not affected by all of the financial reforms. For instance,PBC relending and policy banks had no relevance for the decisions of RCCs and
FINANCIAL INTERMEDIATION IN CHINA 621
OFIs. Because of their organizational structure and local lending orientation, RCCsare likely to lend in regionally segmented markets. Hence, they may not be stronglyaffected by the shift to ratio planning or restrictions on the interbank market. Onthe other hand, they may have been affected by the shift in oversight from theABC to the PBC in 1996, which resulted in lower reserve requirements and morehands-off regulatory oversight. This may have reduced the effect of policy lendingon fund availability. For OFIs, on the other hand, the interbank market may havebeen an important source or outlet for funds. Because of their focus on the nonstatesector, OFIs also may have suffered particularly from binding enforcement of creditplans.
4. EMPIRICAL SPECIFICATION AND TESTS
The economy is divided into two sectors, industrial and agricultural, denotedby I and A. The main estimating equation corresponds directly to Eq. (8); wehave
lrbt = β1ISHrt + β2IG∗r t ISHrt + β3AG∗r t (1− ISHrt )+ β4LY
+β5GRAINrt + β6SOEYrt + β7SOEP∗r t SOEYrt + β8BDrt + β9TDrt
+β10
t−1∑i=1
GRAINri + β11
t−1∑i=1
SOEYri + β12
t−1∑i=1
SOEP∗r i SOEYri
+ λr + γt + εr t , (9)
whereISH is the industrial share of output value,IG is the growth rate of industrialoutput value,AG is the growth rate of agricultural output value,LY is the log ofoutput per capita,GRAIN is grain production normalized by total output,SOEYis SOE output value normalized by total output value,SOEPis SOE profits asa share of assets,BD is the bank’s deposits normalized by total output,TD istotal provincial deposits from all financial institutions,λr is a vector of provincialdummy variables, andγt is a vector of year dummies.
The first four variables,ISH, IG, AG, andLY, measure economic fundamentals.The sectoral growth ratesIG andAGare interacted with sectoral shares. The threepolicy variables areGRAIN, SOEY, andSOEP. SOEPis interacted withSOEYbecause the effect of SOE profitability in lending should depend on the size ofthe SOE sector. The provincial dummies capture unobserved regional differencesand the year dummy variables control for national changes in policy or economicperformance, including restrictions on overall lending to control inflation or topursue stabilization goals.
The specification in (9) also includes summations of past policy variablesto control for potential bias from nonperforming loans being included in our
622 PARK AND SEHRT
intermediation measure.12 Nonperforming loans have been estimated to accountfor 20% of outstanding loans of state banks (Lardy, 1998), and could be higherif loans are rolled over and not categorized as overdue. Such loans reflect pastlending decisions rather than the efficiency of current lending decisions.13 Over-due loans should decrease with better economic fundamentals, possibly leadingus to underestimate the response of new lending to fundamentals. Inclusion of thelagged variables affects, but does not appreciably alter, the main estimation resultsin comparison with the model without lagged policy variables.
Before discussing the data and estimation, we review briefly the interpretationof the coefficients on different variable groups. The effect of the policy vari-ables,GRAIN, SOEY, or SOEP, on bank lending has two possible implicationsfor efficient financial intermediation. First, if the bank itself is responsible forpolicy lending, this lending can crowd out commercial lending.14 However, netof policy lending, intermediation may still be efficient if policy loans act like afixed tax and lending responds to economic fundamentals. Second, if the bank isnot responsible for the policy lending, for example, RCCs do not generally lendto SOEs, the effect of a policy variable on lending isprima facieevidence thattransfer bounds are affected by policy variables.
In a commercial system, financial intermediation should increase with the levelof industrialization, the rate of economic growth in all sectors, and the overalllevel of development.15 The extent to which lending by individual banks respondsto fundamentals increases with market power. Lending by aggregations of banksshould respond to fundamentals even in competitive markets. Even with significantpolicy lending, if funds are allowed to flow to their most productive use at themargin, lending should respond positively to fundamentals after controlling forpolicy factors. However, if the government taxes richer, faster growing areas andcontrols the allocation of resources across regions, intermediation may be inverselyrelated to economic fundamentals.
Higher industrialization should increase commercial financial intermediationbecause the industrial sector requires a greater amount of financing per unit of
12Define outstanding loans,Lt , to be the sum of nonperforming loans and new loans:Lt = NPt+NLt .Nonperforming loans at year-end equal the sum of the previous period’s nonperforming loans plus a frac-tion of current year policy lending; hence, we haveNPt = NPt−1+φPOLICYt . Recursive substitutionof this expression into the definition of outstanding loans yieldsLt = NP0+φ
∑lj=1 POLICYt +NLt .
Although initial nonperforming loans, denotedNP0, differ by province, they are time-invariant foreach province and are captured by the provincial dummy variables. Thus, adding variables that mea-sure the cumulative policy obligations of the past can control for the effects of nonperforming loanson intermediation rates.
13Outstanding loans may also reflect loans in previous years rather than in the most recent year, ifloans have a duration of more than one year. In China, the vast majority of loans are short-term; 70%of new loans in 1997 had a duration of one year or less.
14At the national level, central financing still must crowd out commercial lending or becomeunsustainable.
15Firms in rapidly growing areas may be more able to finance activities from retained earnings, butChina’s low official interest rates make loan financing highly desirable.

FINANCIAL INTERMEDIATION IN CHINA 623
output, an effect that Rajan and Zingales (1998) call financial dependence. Whileagriculture relies primarily on land and labor, industry is much more capital in-tensive and uses more intermediate inputs. Household surveys in China find thatthe ratio of purchased inputs to output value is smaller for cropping and livestockthan self-employed nonagricultural activities (Park and Wang, 2000). The levelof lending should also be associated with the rate of economic growth. In a re-view article, Levine (1997) considers the extensive literature that finds a strongcorrelation between the two. Usually, the interpretation is that financial depth in-creases growth, but Levine acknowledges that the opposite direction of causalityis plausible. One explanation is that loans finance working capital associated withthe production process, i.e., current output, but loans are also made for new fixedcapital investments and these occur in areas of higher expected future growth.Thus, an area with no growth gets only working capital loans, but an area withgrowth gets both working capital loans and fixed capital loans, as well as moreloans proportional to the higher output in the next period.
The difficulty with identifying causal direction in the positive association be-tween financial development and economic growth is well known (Levine andZervos, 1998; Rajan and Zingales, 1998). A positive effect of financial interme-diation on growth may lead to an upward bias in our estimates of the effect ofeconomic fundamentals on lending. However, this possible bias only strengthensour findings that many economic fundamentals do not appear to influence the levelof financial intermediation. Nonetheless, we also estimate (9) using instrumentalvariables as a robustness check.
With a free interbank market, loans should be based on economic fundamentalswithout regard to the source of deposits. Thus, a greater influence of own depositson lending implies market segmentation and less efficient intermediation. If theinterbank market is free within a province but not across provinces, lending shouldbe affected by total deposits in the province, but not by own deposits.
To summarize our hypotheses for the empirical analysis, in more commercialbanking systems, we expect the effect of the policy variablesGRAIN, SOEY, andSOEP∗SOEYon intermediation rates to be smaller, the effect of the economicfundamentalsISH, IG∗ISH, AG∗(1-ISH), and LY to be larger, and the effect ofdeposits, denoted byBD andTD, to be smaller.
5. THE DATA AND ESTIMATION RESULTS
5.1. Data and Estimation
Data are from published sources, including various issues of the Statistical Year-book of China, the China Rural Economics Statistical Yearbook, the China RuralFinancial Statistics Yearbook, the Agricultural Yearbook of China, China Almanacof Banking and Finance, and China Provincial Statistics During 20 Years of Eco-nomic Reform. For state banks and OFIs, a complete data set is available for 1991to 1997, and for the ABC/ADBC and RCCs, data are available for 1991 to 1996.For intermediation by state banks and OFIs, output is measured by GDP, where
624 PARK AND SEHRT
I refers to industrial GDP andA to nonindustrial GDP. For intermediation by theABC/ADBC and the RCC, output is measured by rural social output value, whereI refers to nonagricultural rural social output value andA refers to agriculturaloutput value. SOE output is measured by SOE industrial output value. Data onrural social output value in 1995 are not available and are interpolated as the meanof the previous and subsequent years for each province. All values are adjusted to1996 yuan using provincial consumer price indices.
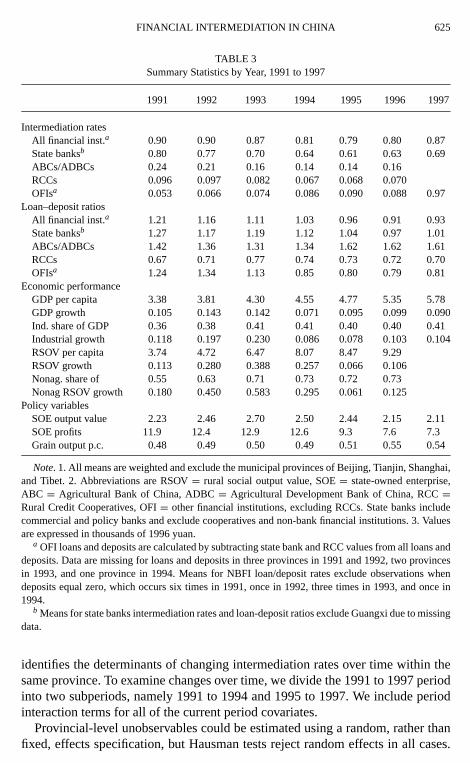
The means for all variables for each year are reported in Table 3. For all banktypes except OFIs, there is a pattern of falling intermediation rates through 1995,followed by a recovery in 1996 and 1997. The level of GDP per capita growssteadily, although the growth rate slows sharply in 1994. For rural growth, thesharp drop-off occurs in 1995. The value of SOE output falls starting in 1993,while SOE profits erode significantly beginning in 1995. Mean grain output percapita is fairly consistent over time, showing an increase in 1996 and 1997 incomparison with previous years.
Our data set excludes some financial intermediaries, such as regional trust andinvestment companies, finance companies, rural cooperative funds (RCFs), rotat-ing savings and credit associations (ROSCAs), interenterprise finance, and otherinformal lending institutions. We do not expect these unmeasured activities to bevery large. Nonetheless, it is possible that other financial intermediaries assumelarger roles in more developed areas or that various informal or even illegal mech-anisms channel funds to their most valued use. Strictly speaking, our results assessonly performance by the institutions for which we have data rather than for theoverall financial system. Nonetheless, in a country where formal financial institu-tions control such a vast amount of resources, we expect their performance to havesignificant aggregate effects on economic growth.
It is straightforward to estimate the intermediation equation for individual banksor aggregations of banks. We estimate (9) for four categories: state banks, theABC/ADBC, RCCs, and OFIs. For each category, we include the bank’s own de-posits as well as total deposits in all financial institutions. Regions are provincesin China, excluding the municipalities of Beijing, Tianjin, and Shanghai, and ex-cluding Tibet and Guangxi provinces.16
To describe the changes over time, we first estimate cross-sectional regressionsof (9) for each year from 1991 to 1997. By necessity, we exclude the lagged policyvariables and the provincial and time dummies. The estimates from these regres-sions are identified by the regional differences that motivate the paper. However,the coefficient estimates could be biased by unobserved provincial differences.To avoid this potential problem, we exploit the panel nature of the data and es-timate (9), which includes provincial fixed effects. This preferred specification
16Municipalities are excluded because they are extreme outliers for variables such as output percapita, rural social output value per capita, deposits, and intermediation rates. For example, includingmunicipal provinces in the intermediation-GDP per capita regressions destroys the clear negative trendin the data seen in Fig. 1. Tibet and Guangxi are excluded because of missing data.
FINANCIAL INTERMEDIATION IN CHINA 625
TABLE 3Summary Statistics by Year, 1991 to 1997
1991 1992 1993 1994 1995 1996 1997
Intermediation ratesAll financial inst.a 0.90 0.90 0.87 0.81 0.79 0.80 0.87State banksb 0.80 0.77 0.70 0.64 0.61 0.63 0.69ABCs/ADBCs 0.24 0.21 0.16 0.14 0.14 0.16RCCs 0.096 0.097 0.082 0.067 0.068 0.070OFIsa 0.053 0.066 0.074 0.086 0.090 0.088 0.97
Loan–deposit ratiosAll financial inst.a 1.21 1.16 1.11 1.03 0.96 0.91 0.93State banksb 1.27 1.17 1.19 1.12 1.04 0.97 1.01ABCs/ADBCs 1.42 1.36 1.31 1.34 1.62 1.62 1.61RCCs 0.67 0.71 0.77 0.74 0.73 0.72 0.70OFIsa 1.24 1.34 1.13 0.85 0.80 0.79 0.81
Economic performanceGDP per capita 3.38 3.81 4.30 4.55 4.77 5.35 5.78GDP growth 0.105 0.143 0.142 0.071 0.095 0.099 0.090Ind. share of GDP 0.36 0.38 0.41 0.41 0.40 0.40 0.41Industrial growth 0.118 0.197 0.230 0.086 0.078 0.103 0.104RSOV per capita 3.74 4.72 6.47 8.07 8.47 9.29RSOV growth 0.113 0.280 0.388 0.257 0.066 0.106Nonag. share of 0.55 0.63 0.71 0.73 0.72 0.73Nonag RSOV growth 0.180 0.450 0.583 0.295 0.061 0.125
Policy variablesSOE output value 2.23 2.46 2.70 2.50 2.44 2.15 2.11SOE profits 11.9 12.4 12.9 12.6 9.3 7.6 7.3Grain output p.c. 0.48 0.49 0.50 0.49 0.51 0.55 0.54
Note. 1. All means are weighted and exclude the municipal provinces of Beijing, Tianjin, Shanghai,and Tibet. 2. Abbreviations are RSOV= rural social output value, SOE= state-owned enterprise,ABC = Agricultural Bank of China, ADBC= Agricultural Development Bank of China, RCC=Rural Credit Cooperatives, OFI= other financial institutions, excluding RCCs. State banks includecommercial and policy banks and exclude cooperatives and non-bank financial institutions. 3. Valuesare expressed in thousands of 1996 yuan.
a OFI loans and deposits are calculated by subtracting state bank and RCC values from all loans anddeposits. Data are missing for loans and deposits in three provinces in 1991 and 1992, two provincesin 1993, and one province in 1994. Means for NBFI loan/deposit rates exclude observations whendeposits equal zero, which occurs six times in 1991, once in 1992, three times in 1993, and once in1994.
b Means for state banks intermediation rates and loan-deposit ratios exclude Guangxi due to missingdata.
identifies the determinants of changing intermediation rates over time within thesame province. To examine changes over time, we divide the 1991 to 1997 periodinto two subperiods, namely 1991 to 1994 and 1995 to 1997. We include periodinteraction terms for all of the current period covariates.
Provincial-level unobservables could be estimated using a random, rather thanfixed, effects specification, but Hausman tests reject random effects in all cases.
626 PARK AND SEHRT
Because we use aggregate data for provinces of different size, we are concernedthat the errors will be heteroscedastic, in particular that the error variance will differby province. We implement the test suggested by Cook and Weisberg (1983) andreject homoscedasticity in all cases. Then we estimate the fixed effects model usingfeasible generalized least squares, allowing the error variance to differ by provinceand also allowing for covariances across provinces.
5.2. Results
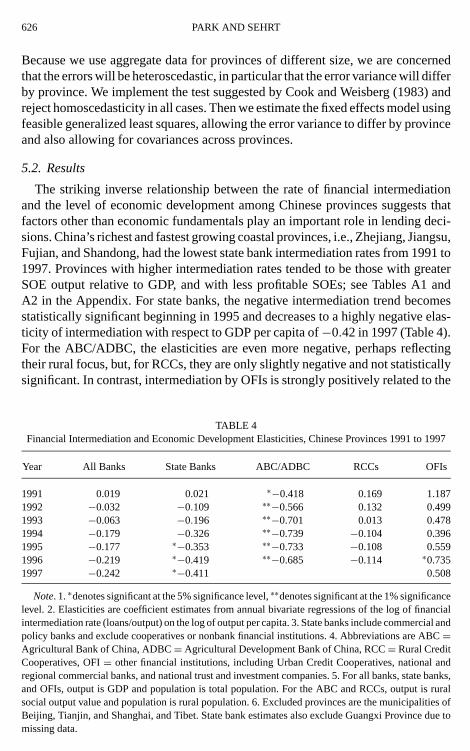
The striking inverse relationship between the rate of financial intermediationand the level of economic development among Chinese provinces suggests thatfactors other than economic fundamentals play an important role in lending deci-sions. China’s richest and fastest growing coastal provinces, i.e., Zhejiang, Jiangsu,Fujian, and Shandong, had the lowest state bank intermediation rates from 1991 to1997. Provinces with higher intermediation rates tended to be those with greaterSOE output relative to GDP, and with less profitable SOEs; see Tables A1 andA2 in the Appendix. For state banks, the negative intermediation trend becomesstatistically significant beginning in 1995 and decreases to a highly negative elas-ticity of intermediation with respect to GDP per capita of−0.42 in 1997 (Table 4).For the ABC/ADBC, the elasticities are even more negative, perhaps reflectingtheir rural focus, but, for RCCs, they are only slightly negative and not statisticallysignificant. In contrast, intermediation by OFIs is strongly positively related to the
TABLE 4Financial Intermediation and Economic Development Elasticities, Chinese Provinces 1991 to 1997
Year All Banks State Banks ABC/ADBC RCCs OFIs
1991 0.019 0.021 ∗−0.418 0.169 1.1871992 −0.032 −0.109 ∗∗−0.566 0.132 0.4991993 −0.063 −0.196 ∗∗−0.701 0.013 0.4781994 −0.179 −0.326 ∗∗−0.739 −0.104 0.3961995 −0.177 ∗−0.353 ∗∗−0.733 −0.108 0.5591996 −0.219 ∗−0.419 ∗∗−0.685 −0.114 ∗0.7351997 −0.242 ∗−0.411 0.508
Note. 1.∗denotes significant at the 5% significance level,∗∗denotes significant at the 1% significancelevel. 2. Elasticities are coefficient estimates from annual bivariate regressions of the log of financialintermediation rate (loans/output) on the log of output per capita. 3. State banks include commercial andpolicy banks and exclude cooperatives or nonbank financial institutions. 4. Abbreviations are ABC=Agricultural Bank of China, ADBC= Agricultural Development Bank of China, RCC= Rural CreditCooperatives, OFI= other financial institutions, including Urban Credit Cooperatives, national andregional commercial banks, and national trust and investment companies. 5. For all banks, state banks,and OFIs, output is GDP and population is total population. For the ABC and RCCs, output is ruralsocial output value and population is rural population. 6. Excluded provinces are the municipalities ofBeijing, Tianjin, and Shanghai, and Tibet. State bank estimates also exclude Guangxi Province due tomissing data.
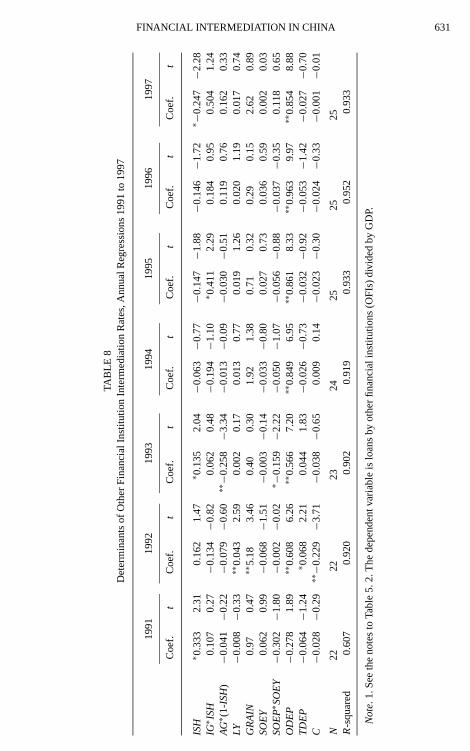
FINANCIAL INTERMEDIATION IN CHINA 627
level of development. This suggests that OFIs are helping to meet credit demandin areas where official state banks are underproviding credit.
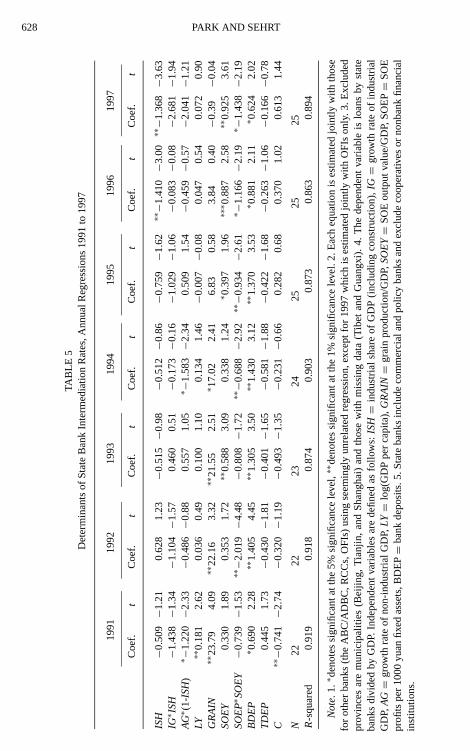
Tables 5 to 8 report the results of the annual regressions, which describe howthe effects of policy variables, economic fundamentals, and deposits on provincialintermediation rates change over time for state banks, the ABC, RCCs, and OFIs.The importance of policy variables increases over time. The effects of SOE outputand profits on state bank lending increases over time, reaching their highest levelsin 1997 (Table 5). Thus, China’s SOE policy lending problem did not abate despiteannounced reforms. Part of this may be due to the steady erosion of SOE profitabil-ity despite declines in SOE output per capita since 1993 (Table 3).17 The effects ofthe SOE variables on lending by the ABC/ADBC, RCCs and OFIs are statisticallyinsignificant and small in magnitude in almost all cases.18 This is not surprisingsince none of these banks had primary responsibility for lending to SOEs.
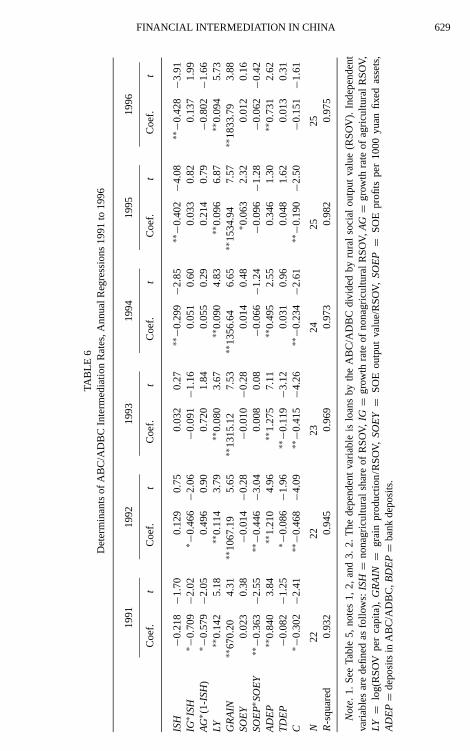
The effect of grain production on lending by the ABC/ADBC also increasessteadily over time (Table 6). The coefficient on grain output is statistically signif-icant in all years and grows steadily over time, reaching a peak of 1834 in 1997.However, the coefficient is smaller, falls over time, and becomes statistically in-significant after 1994 for all state banks. This may reflect the falling relative impor-tance of grain procurement in total state bank lending or a crowding out of lendingby other state banks. Grain does not affect lending by RCCs or OFIs significantly.The grain coefficient can be interpreted as the amount of lending associated withone additional ton of grain production. The size of the coefficients are extremelyhigh when one considers that, in 1996, a ton of grain cost about 1200 yuan19 andChina’s grain bureaus only procure about 20 percent of production on average.Two possible explanations for the large grain coefficients are that procurement asa share of output increases with output and that much of the value is unrecover-able debt, which reportedly accounts for 40% of ADBC outstanding loans (Liu,1998).20 When the ABC and ADBC are separated for the years 1995 to 1997, grainbecomes more significant for the ADBC and less significant for ABC branchesover time, as would be expected (Table A3).
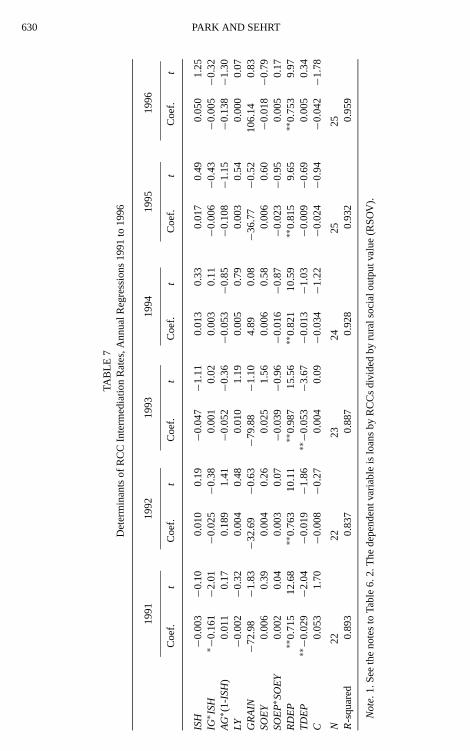
The coefficients on the economic fundamentals are mostly insignificant andfrequently of the wrong sign, suggesting that the regional allocation of resourcesdoes not respond to economic signals, even after controlling for factors affectingpolicy lending. If anything, responsiveness to economic fundamentals worsensover time. For state banks, the coefficient on industrial share becomes increasingly
17We defer the discussion of policy lending for grain to a consideration of the ABC/ADBC.18For ABC lending, SOE profitability is statistically significant in 1991 and 1992 and SOE output
value is statistically significant in 1995 (Table 6). For OFIs, SOE profitability is statistically significantin 1993 (Table 8).
19Procurement prices in 1996 were 1.06 yuan/kg for maize, 1.31 yuan/kg for wheat, and1.33 yuan/kg for paddy rice.
20Such lending is plausible since the ABC has branch offices in major cities and is the primarilylender to agroindustry.
628 PARK AND SEHRT
TAB
LE5
Det
erm
inan
tsof
Sta
teB
ank
Inte
rmed
iatio
nR
ates
,Ann
ualR
egre
ssio
ns19
91to
1997
1991
1992
1993
1994
1995
1996
1997
Coe
f.t
Coe
f.t
Coe
f.t
Coe
f.t
Coe
f.t
Coe
f.t
Coe
f.t
ISH
−0.5
09−1
.21
0.62
81.
23−0
.515−0
.98
−0.5
12−0
.86
−0.7
59−1
.62∗∗−1
.410−3
.00∗∗−1
.368−3
.63
IG∗ I
SH
−1.4
38−1
.34
−1.1
04−1
.57
0.46
00.
51−0
.173−0
.16
−1.0
29−1
.06
−0.0
83−0
.08−2
.681−1
.94
AG∗ (
1-IS
H)
∗ −1.
220−2
.33
−0.4
86−0
.88
0.55
71.
05∗ −
1.58
3−2
.34
0.50
91.
54−0
.459−0
.57−2
.041−1
.21
LY∗∗
0.18
12.
620.
036
0.49
0.10
01.
100.
134
1.46−0
.007−0
.08
0.04
70.
540.
072
0.90
GR
AIN
∗∗23
.79
4.09
∗∗22
.16
3.32
∗∗21
.55
2.51
∗ 17.
022.
416.
830.
583.
840.
40−0
.39−0
.04
SO
EY
0.33
01.
890.
353
1.72
∗∗0.
588
3.09
0.33
81.
24∗ 0
.397
1.96
∗∗∗ 0
.887
2.58
∗∗0.
925
3.61
SO
EP∗
SO
EY−0
.739−1
.53∗∗−2
.019−4
.48
−0.8
08−1
.72∗∗−0
.688−2
.92∗∗−0
.934−2
.61
∗ −1.
166−2
.19∗ −
1.43
8−2
.19
BD
EP
∗ 0.6
902.
28∗∗
1.40
54.
45∗∗
1.30
53.
50∗∗
1.43
03.
12∗∗
1.37
03.
53∗ 0
.881
2.11
∗ 0.6
242.
02T
DE
P0.
445
1.73
−0.4
30−1
.81
−0.4
01−1
.65
−0.5
81−1
.88
−0.4
22−1
.68
−0.2
63−1
.06−0
.166−0
.78
C∗∗−0
.741−2
.74
−0.3
20−1
.19
−0.4
93−1
.35
−0.2
31−0
.66
0.28
20.
680.
370
1.02
0.61
31.
44
N22
2223
2425
2525
R-s
quar
ed0.
919
0.91
80.
874
0.90
30.
873
0.86
30.
894
No
te.1
.∗de
note
ssi
gnifi
cant
atth
e5%
sign
ifica
nce
leve
l,∗∗
deno
tes
sign
ifica
ntat
the
1%si
gnifi
canc
ele
vel.
2.E
ach
equa
tion
ises
timat
edjo
intly
with
thos
efo
rot
her
bank
s(t
heA
BC
/AD
BC
,RC
Cs,
OF
Is)
usin
gse
emin
gly
unre
late
dre
gres
sion
,exc
eptf
or19
97w
hich
ises
timat
edjo
intly
with
OF
Ison
ly.3
.Exc
lud
edpr
ovin
ces
are
mun
icip
aliti
es(B
eijin
g,T
ianj
in,
and
Sha
ngha
i)an
dth
ose
with
mis
sing
data
(Tib
etan
dG
uang
xi).
4.T
hede
pend
ent
varia
ble
islo
ans
byst
ate
bank
sdi
vide
dby
GD
P.In
depe
nden
tva
riabl
esar
ede
fined
asfo
llow
s:IS
H=
indu
stria
lsha
reof
GD
P(in
clud
ing
cons
truc
tion)
,IG=
grow
thra
teof
indu
stria
lG
DP,
AG=
grow
thra
teof
non-
indu
stria
lGD
P,LY=
log(
GD
Ppe
rca
pita
),GR
AIN=
grai
npr
oduc
tion/
GD
P,SO
EY=
SO
Eou
tput
valu
e/G
DP,
SO
EP=
SO
Epr
ofits
per
1000
yuan
fixed
asse
ts,B
DE
P=ba
nkde
posi
ts.5
.Sta
teba
nks
incl
ude
com
mer
cial
and
polic
yba
nks
and
excl
ude
coop
erat
ives
orno
nban
kfin
anci
alin
stitu
tions
.
FINANCIAL INTERMEDIATION IN CHINA 629
TAB
LE6
Det
erm
inan
tsof
AB
C/A
DB
CIn
term
edia
tion
Rat
es,A
nnua
lReg
ress
ions
1991
to19
96
1991
1992
1993
1994
1995
1996
Coe
f.t
Coe
f.t
Coe
f.t
Coe
f.t
Coe
f.t
Coe
f.t
ISH
−0.2
18−1
.70
0.12
90.
750.
032
0.27
∗∗−0
.299−2
.85
∗∗−0
.402−4
.08
∗∗−0
.428−3
.91
IG∗ I
SH
∗ −0.
709−2
.02
∗ −0.
466−2
.06
−0.0
91−1
.16
0.05
10.
600.
033
0.82
0.13
71.
99A
G∗ (
1-IS
H)
∗ −0.
579−2
.05
0.49
60.
900.
720
1.84
0.05
50.
290.
214
0.79
−0.8
02−1
.66
LY∗∗
0.14
25.
18∗∗
0.11
43.
79∗∗
0.08
03.
67∗∗
0.09
04.
83∗∗
0.09
66.
87∗∗
0.09
45.
73G
RA
IN∗∗
670.
204.
31∗∗
1067
.19
5.65
∗∗13
15.1
27.
53∗∗
1356
.64
6.65
∗∗15
34.9
47.
57∗∗
1833
.79
3.88
SO
EY
0.02
30.
38−0
.014−0
.28
−0.0
10−0
.28
0.01
40.
48∗ 0
.063
2.32
0.01
20.
16S
OE
P∗S
OE
Y∗∗−0
.363−2
.55
∗∗−0
.446−3
.04
0.00
80.
08−0
.066−1
.24
−0.0
96−1
.28
−0.0
62−0
.42
AD
EP
∗∗0.
840
3.84
∗∗1.
210
4.96
∗∗1.
275
7.11
∗∗0.
495
2.55
0.34
61.
30∗∗
0.73
12.
62T
DE
P−0
.082−1
.25
∗ −0.
086−1
.96
∗∗−0
.119−3
.12
0.03
10.
960.
048
1.62
0.01
30.
31C
∗ −0.
302−2
.41
∗∗−0
.468−4
.09
∗∗−0
.415−4
.26
∗∗−0
.234−2
.61
∗∗−0
.190−2
.50
−0.1
51−1
.61
N22
2223
2425
25R
-squ
ared
0.93
20.
945
0.96
90.
973
0.98
20.
975
No
te.
1.S
eeTa
ble
5,no
tes
1,2,
and
3.2.
The
depe
nden
tva
riabl
eis
loan
sby
the
AB
C/A
DB
Cdi
vide
dby
rura
lsoc
ialo
utpu
tva
lue
(RS
OV
).In
depe
nden
tva
riabl
esar
ede
fined
asfo
llow
s:ISH=
nona
gric
ultu
rals
hare
ofR
SO
V,IG=
grow
thra
teof
nona
gric
ultu
ralR
SO
V,AG=
grow
thra
teof
agric
ultu
ralR
SO
V,LY=
log(
RS
OV
per
capi
ta),G
RA
IN=
grai
npr
oduc
tion
/RS
OV,S
OE
Y=
SO
Eou
tput
valu
e/R
SO
V,SO
EP=
SO
Epr
ofits
per
1000
yuan
fixed
asse
ts,
AD
EP=
depo
sits
inA
BC
/AD
BC
,BD
EP=
bank
depo
sits
.
630 PARK AND SEHRT
TAB
LE7
Det
erm
inan
tsof
RC
CIn
term
edia
tion
Rat
es,A
nnua
lReg
ress
ions
1991
to19
96
1991
1992
1993
1994
1995
1996
Coe
f.t
Coe
f.t
Coe
f.t
Coe
f.t
Coe
f.t
Coe
f.t
ISH
−0.0
03−0
.10
0.01
00.
19−0
.047
−1.1
10.
013
0.33
0.01
70.
490.
050
1.25
IG∗ I
SH
∗ −0.
161−2
.01
−0.0
25−0
.38
0.00
10.
020.
003
0.11
−0.0
06−0
.43
−0.0
05−0
.32
AG∗ (
1-IS
H)
0.01
10.
170.
189
1.41
−0.0
52−0
.36
−0.0
53−0
.85
−0.1
08−1
.15
−0.1
38−1
.30
LY−0
.002
−0.3
20.
004
0.48
0.01
01.
190.
005
0.79
0.00
30.
540.
000
0.07
GR
AIN
−72.
98−1
.83
−32.
69−0
.63
−79.
88−1
.10
4.89
0.08
−36.
77−0
.52
106.
140.
83S
OE
Y0.
006
0.39
0.00
40.
260.
025
1.56
0.00
60.
580.
006
0.60−0
.018−0
.79
SO
EP∗
SO
EY
0.00
20.
040.
003
0.07
−0.0
39−0
.96
−0.0
16−0
.87
−0.0
23−0
.95
0.00
50.
17R
DE
P∗∗
0.71
512
.68
∗∗0.
763
10.1
1∗∗
0.98
715
.56
∗∗0.
821
10.5
9∗∗
0.81
59.
65∗∗
0.75
39.
97T
DE
P∗∗−0
.029
−2.0
4−0
.019
−1.8
6∗∗−0
.053
−3.6
7−0
.013
−1.0
3−0
.009
−0.6
90.
005
0.34
C0.
053
1.70
−0.0
08−0
.27
0.00
40.
09−0
.034
−1.2
2−0
.024
−0.9
4−0
.042−1
.78
N22
2223
2425
25R
-squ
ared
0.89
30.
837
0.88
70.
928
0.93
20.
959
No
te.1
.See
the
note
sto
Tabl
e6.
2.T
hede
pend
entv
aria
ble
islo
ans
byR
CC
sdi
vide
dby
rura
lsoc
ialo
utpu
tval
ue(R
SO
V).
FINANCIAL INTERMEDIATION IN CHINA 631
TAB
LE8
Det
erm
inan
tsof
Oth
erF
inan
cial
Inst
itutio
nIn
term
edia
tion
Rat
es,A
nnua
lReg
ress
ions
1991
to19
97
1991
1992
1993
1994
1995
1996
1997
Coe
f.t
Coe
f.t
Coe
f.t
Coe
f.t
Coe
f.t
Coe
f.t
Coe
f.t
ISH
∗ 0.3
332.
310.
162
1.47
∗ 0.1
352.
04−0
.063−0
.77
−0.1
47−1
.88
−0.1
46−1
.72
∗ −0.
247−2
.28
IG∗ I
SH
0.10
70.
27−0
.134−0
.82
0.06
20.
48−0
.194−1
.10
∗ 0.4
112.
290.
184
0.95
0.50
41.
24A
G∗ (
1-IS
H)
−0.0
41−0
.22
−0.0
79−0
.60∗∗−0
.258−3
.34
−0.0
13−0
.09
−0.0
30−0
.51
0.11
90.
760.
162
0.33
LY−0
.008−0
.33
∗∗0.
043
2.59
0.00
20.
170.
013
0.77
0.01
91.
260.
020
1.19
0.01
70.
74G
RA
IN0.
970.
47∗∗
5.18
3.46
0.40
0.30
1.92
1.38
0.71
0.32
0.29
0.15
2.62
0.89
SO
EY
0.06
20.
99−0
.068−1
.51
−0.0
03−0
.14
−0.0
33−0
.80
0.02
70.
730.
036
0.59
0.00
20.
03S
OE
P∗S
OE
Y−0
.302−1
.80
−0.0
02−0
.02
∗ −0.
159−2
.22
−0.0
50−1
.07
−0.0
56−0
.88
−0.0
37−0
.35
0.11
80.
65O
DE
P−0
.278
1.89
∗∗0.
608
6.26
∗∗0.
566
7.20
∗∗0.
849
6.95
∗∗0.
861
8.33
∗∗0.
963
9.97
∗∗0.
854
8.88
TD
EP
−0.0
64−1
.24
∗ 0.0
682.
210.
044
1.83−0
.026−0
.73
−0.0
32−0
.92
−0.0
53−1
.42
−0.0
27−0
.70
C−0
.028−0
.29∗∗−0
.229−3
.71
−0.0
38−0
.65
0.00
90.
14−0
.023−0
.30
−0.0
24−0
.33
−0.0
01−0
.01
N22
2223
2425
2525
R-s
quar
ed0.
607
0.92
00.
902
0.91
90.
933
0.95
20.
933
No
te.1
.See
the
note
sto
Tabl
e5.
2.T
hede
pend
entv
aria
ble
islo
ans
byot
her
finan
cial
inst
itutio
ns(O
FIs
)di
vide
dby
GD
P.
632 PARK AND SEHRT
negative over time and is statistically significant in 1996 and 1997. The otherfundamentals, industrial growth, agricultural growth, and log of GDP per capitado not affect lending in a consistent and significant way. For the ABC/ADBC,the results are mixed. The coefficient on output level per capita is significantlypositive but does not increase over time. As it does for state banks, industrial sharehas an increasingly negative and statistically significant effect on lending. Thecoefficients on agricultural and industrial growth have unstable signs and are notstatistically significant in most cases. The effects of economic fundamentals onRCC lending is uniformly statistically insignificant. For OFIs, there are also noconsistent statistically significant effects. The coefficients for the level of outputand for industrial growth do tend to be positive and higher in the reform period,but those for industrial share become negative.
Deposits are a key determinant of intermediation rates in almost all of the regres-sions. For state banks, very high coefficients on deposits are estimated from 1992to 1995, but there is a sharp reduction in 1996 and 1997, corresponding to the pe-riod when interbank market mechanisms were reintroduced. For the ABC/ADBC,there is a sharp drop in the deposit coefficient in 1994, the year in which theADBC was established. This may reflect a formal break in deposit financing ofpolicy lending, since ADBC loans are financed almost entirely by PBC relend-ing. For RCCs, annual regressions produce the highest coefficients, averaging0.81. For OFIs, high deposit coefficients begin after the closure of the interbankmarket in 1993 but do not return to lower levels after 1995 as they do in otherbanks. This suggests that OFIs have not had full access to the new national inter-bank market. In addition, they may have been scrutinized more closely by centralbank officials for adherence to the newly established minimum loan-to-depositratios.
The coefficient on total provincial deposits is significantly negative in the yearswhen deposit coefficients are large and positive, a pattern also exhibited by thecoefficients for the ABC/ADBC. Deposits in other institutions appear to result inmore loans from competing institutions that crowd out own lending. This providesadditional evidence of poor intermediation across institutions within provinces.
Coefficients from the annual regressions are subject to bias from unobservedprovincial characteristics. Cross-sectional regressions also cannot control ade-quately for the accumulation of nonperforming loans. A more stringent identifi-cation strategy is to examine the within-province variation in lending over time toexamine the extent to which changes can be explained by time-varying covariates.Tables 9 to 12 report coefficient estimates for each bank for two periods, 1991 to1994 and 1995 to 1997, from regressions that include provincial fixed effects aswell as year dummy variables and controls for past policy lending. Although thesize of coefficients tend to be smaller, the results largely confirm the main findingsfrom the cross-sectional regressions.
Policy variables do not fall in importance in the second period. A one yuanincrease in the value of SOE output increases state bank lending by 0.26 yuan inthe first period, 1991 to 1994, and 0.19 yuan in the second period, 1995 to 1997. The

FINANCIAL INTERMEDIATION IN CHINA 633
TABLE 9Determinants of State Bank Financial Intermediation Rates, Provincial Fixed Effects
1991–94 1995–97Diff.
Coef. t Coef. t p value
ISH −0.012 −0.09 −0.057 −0.36 0.672IG∗ISH −0.119 −1.30 −0.163 −1.19 0.781AG∗(1-ISH) ∗∗−0.198 −2.96 0.039 0.55 0.017LY −0.077 −1.37 ∗∗−0.155 −2.88 0.000GRAIN ∗∗15.1 6.08 4.6 1.25 0.000SOEY ∗∗0.262 3.36 ∗0.185 2.09 0.252SOEP∗SOEY −0.074 −0.73 −0.138 −0.89 0.522BDEP 0.009 0.09 ∗∗0.400 4.29 0.000TDEP 0.118 1.35 ∗−0.157 −2.16 0.000GRAINP ∗148.3 2.03 ∗148.3 2.03SOEYP 0.036 1.43 0.036 1.43SOEPSOEYP ∗0.083 1.99 ∗0.083 1.99
Note.1.∗denotes significant at the 5% significance level;∗∗denotes significant at the 1% significancelevel. 2. Equations for within estimates include province and year fixed effects and are estimated usingfeasible generalized least squares, which allows errors to have different variances by province and tobe correlated across provinces. 3. Variables, except those included to control for past bad loans, areinteracted with a period dummy for 1995 to 1997, with reported coefficients andt-values for that periodadjusted to reflect differences from zero. 4. Excluded provinces are municipalities (Beijing, Tianjin, andShanghai) and those with missing data (Tibet and Guangxi). The sample size is 166. 5. For state banksand other financial institutions, the intermediation rate is defined as loans/GDP and the independentvariables are as follows:NSH= industrial share of GDP (including construction),NG= growth rate ofindustrial GDP,AG= growth rate of non-industrial GDP,LY= log (GDP per capita),GRAIN= grainproduction/GDP,SOEY= SOE output value/GDP,SOEP= SOE profits per 1000 yan of fixedassets,BDEP = bank deposits/GDP,ODEP = OFI deposits/GDP,TDEP = total deposits/GDP,GRAINP= total previous grain production from 1991 to periodt-1/GDP,SOEYP= total previousSOE output value from 1991 to periodt-1/GDP, andSOEPSOEYP= sum of interactions from 1991to periodt-1/GDP.
difference in the estimates for the two periods is not statistically significant. As inthe annual regressions, the policy variables are insignificant for the ABC/ADBC,RCCs, and OFIs, except for a negative coefficient on SOE profitability in the firstperiod for OFIs that suggests the possibility of early government influence overOFI lending.
For the effect of grain production on ABC/ADBC lending, the fixed effectestimates are 193 and 70 for the two periods, which are both smaller than in thecross-sectional regressions. In the second period, the coefficient is not statisticallysignificant. In recent years, ADBC outstanding loans have increased rapidly, e.g.,33 and 38% in 1996 and 1997, despite modest increases in grain output, lowgrain prices, and reduced procurement quotas (ADBC, 1998). This may help toexplain the poor within-province correlation between lending and grain output inthe second period, when separation of policy and commercial lending may haveweakened the enforcement of policy loan repayment.
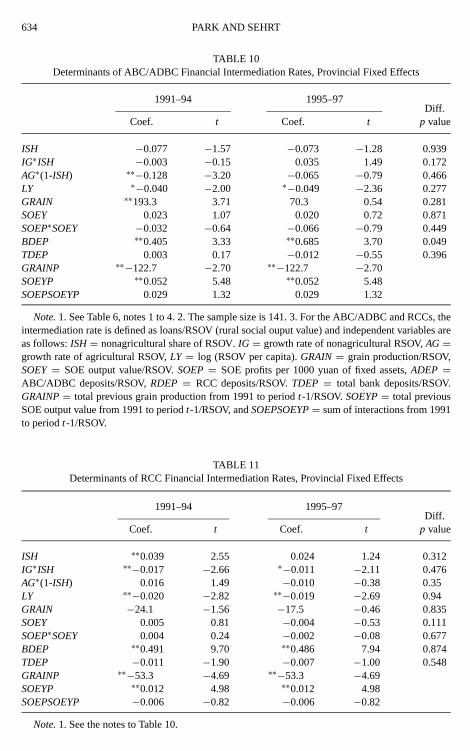
634 PARK AND SEHRT
TABLE 10Determinants of ABC/ADBC Financial Intermediation Rates, Provincial Fixed Effects
1991–94 1995–97Diff.
Coef. t Coef. t p value
ISH −0.077 −1.57 −0.073 −1.28 0.939IG∗ISH −0.003 −0.15 0.035 1.49 0.172AG∗(1-ISH) ∗∗−0.128 −3.20 −0.065 −0.79 0.466LY ∗−0.040 −2.00 ∗−0.049 −2.36 0.277GRAIN ∗∗193.3 3.71 70.3 0.54 0.281SOEY 0.023 1.07 0.020 0.72 0.871SOEP∗SOEY −0.032 −0.64 −0.066 −0.79 0.449BDEP ∗∗0.405 3.33 ∗∗0.685 3.70 0.049TDEP 0.003 0.17 −0.012 −0.55 0.396GRAINP ∗∗−122.7 −2.70 ∗∗−122.7 −2.70SOEYP ∗∗0.052 5.48 ∗∗0.052 5.48SOEPSOEYP 0.029 1.32 0.029 1.32
Note.1. See Table 6, notes 1 to 4. 2. The sample size is 141. 3. For the ABC/ADBC and RCCs, theintermediation rate is defined as loans/RSOV (rural social ouput value) and independent variables areas follows:ISH= nonagricultural share of RSOV.IG = growth rate of nonagricultural RSOV,AG=growth rate of agricultural RSOV,LY = log (RSOV per capita).GRAIN= grain production/RSOV,SOEY= SOE output value/RSOV.SOEP= SOE profits per 1000 yuan of fixed assets,ADEP =ABC/ADBC deposits/RSOV,RDEP = RCC deposits/RSOV.TDEP = total bank deposits/RSOV.GRAINP= total previous grain production from 1991 to periodt-1/RSOV.SOEYP= total previousSOE output value from 1991 to periodt-1/RSOV, andSOEPSOEYP= sum of interactions from 1991to periodt-1/RSOV.
TABLE 11Determinants of RCC Financial Intermediation Rates, Provincial Fixed Effects
1991–94 1995–97Diff.
Coef. t Coef. t p value
ISH ∗∗0.039 2.55 0.024 1.24 0.312IG∗ISH ∗∗−0.017 −2.66 ∗−0.011 −2.11 0.476AG∗(1-ISH) 0.016 1.49 −0.010 −0.38 0.35LY ∗∗−0.020 −2.82 ∗∗−0.019 −2.69 0.94GRAIN −24.1 −1.56 −17.5 −0.46 0.835SOEY 0.005 0.81 −0.004 −0.53 0.111SOEP∗SOEY 0.004 0.24 −0.002 −0.08 0.677BDEP ∗∗0.491 9.70 ∗∗0.486 7.94 0.874TDEP −0.011 −1.90 −0.007 −1.00 0.548GRAINP ∗∗−53.3 −4.69 ∗∗−53.3 −4.69SOEYP ∗∗0.012 4.98 ∗∗0.012 4.98SOEPSOEYP −0.006 −0.82 −0.006 −0.82
Note.1. See the notes to Table 10.

FINANCIAL INTERMEDIATION IN CHINA 635
TABLE 12Determinants of Other Financial Institution (OFI) Intermediation Rates Provincial Fixed Effects
1991–94 1995–97Diff.
Coef. t Coef. t p value
ISH −0.052 −0.61 ∗∗−0.276 −3.04 0.000IG∗ISH −0.005 −0.07 ∗0.186 1.98 0.084AG∗(1-ISH) ∗−0.097 −2.05 −0.022 −0.68 0.185LY −0.022 −0.84 −0.021 −0.92 0.935GRAIN −0.3 −0.23 −1.3 −0.90 0.402SOEY 0.023 0.67 0.076 1.80 0.091SOEP∗SOEY ∗∗−0.132 −2.62 −0.089 −1.10 0.391BDEP ∗∗0.281 3.69 ∗∗0.593 9.63 0.000TDEP ∗∗0.123 3.24 0.051 1.49 0.001GRAINP −52.3 −1.42 −52.3 −1.42SOEYP ∗∗−0.027 −2.52 ∗∗−0.027 −2.52SOEPSOEYP −0.016 −0.72 −0.016 −0.72
Note.1. See the notes to Table 9.
The effect of economic fundamentals on lending is the opposite of what wasexpected. For state banks, higher output is more negatively associated with levelsof intermediation during the second period than in the first period (Table 9). Thechange in magnitude is large and statistically significant. The only other statisti-cally significant coefficient is also of the wrong sign, i.e., a negative coefficienton agricultural growth in the first period. The coefficients on industrial growthare negative in both periods even though they are smaller in magnitude than inthe annual regressions. Overall, all indicators suggest that there is a worsening ofperformance in the post-reform period. The results are equally discouraging forthe ABC/ADBC, RCCs, and OFIs (Tables 10, 11, and 12). Beginning in 1994, itis possible to look separately at lending by ABC and ADBC branches (Table A3).Fixed effect estimates for the 1994 to 1996 period reveal that ABC branches re-sponded positively to industrial share and industrial growth, which is consistentwith the increasing proportion of loans going to township and village enterprisesat almost 20% in 1996. For OFIs, the importance of industrial growth increasessignificantly in the second period, but the effect of industrial share becomes in-creasingly negative.
As a robustness check for the possible endogeneity of economic fundamentals,we reestimate the fixed effects specification by instrumenting the economic fun-damentals by their lagged values and also by regressing directly on lagged valuesinstead of on contemporaneous values. The former assumes that lagged values donot belong in the intermediation equation, the latter that loans are based on pastrather than expected future performance or capture an arguably exogenous part ofexpected outcomes. For the most part, these alternative estimates do not alter the

636 PARK AND SEHRT
main results in terms of the signs of coefficients or the changes between the twoperiods.21
The importance of deposits to lending increases over time. The effect of statebank deposits on lending is near zero and insignificant in the prereform period but0.40 and significant in the postreform period. This result is the opposite of whatwould be expected if the intermediation of funds became more free over time.For the ABC, the coefficient on own deposits increases from 0.41 to 0.69 over thetwo periods; for RCCs, it stays at a relatively high level of 0.49 in both periods.For OFIs, the own deposit coefficient increases from 0.29 to 0.59. The increasedimportance of deposits to lending volume may reflect the new system of ratio loanmanagement being passed down to regional branches of state banks and reducedaccess of OFIs to the interbank market. While providing autonomy to local banks,such a trend reduces the effectiveness of interregional financial intermediation.
6. CONCLUSION
In this paper, we develop empirical tests of financial intermediation based on amodel of profit maximization by banks with restrictions on interbank lending. Thetests focus on the effect of policy variables, economic fundamentals, and depositson rates of financial intermediation using Chinese data. The results indicate thatfinancial intermediation in China is far from efficient and that financial reformsin the mid-1990s have not reversed the trend of worsening bank performance.The responsiveness of lending to policy concerns, such as SOE output and prof-itability and grain production, is significant and has increased in the recent period.Economic fundamentals have had little effect on total lending and the importanceof deposits in determining the volume of local lending has increased. There isevidence that the separation of policy and commercial lending with the creationof the ADBC has allowed the ABC to become more commercially oriented, eventhough it still responds to policy variables as well. Such separation does not nec-essarily improve overall performance, with the ADBC incurring increasing lossesfrom policy lending. RCCs, the other large rural financial institution, are poorlyintegrated into financial markets, suggesting potentially large gains from integrat-ing RCCs into the national banking system. The small but rapidly growing groupof OFIs, consisting of Urban Cooperatives and Cooperative Banks, national andregional commercial banks, and national TICs, also do not appear to be well-integrated into national financial markets, although there is some evidence thatunlike state banks they are increasingly lending in areas with better economicfundamentals.
21These are compared to seemingly unrelated regression (SUR) estimates with the heteroscedasticitycorrection dropped. Estimates reveal an upward bias on coefficients of many economic fundamentalsas expected. The coefficients that change from positive to negative in some cases are those for theindustrial share of income and log output per capita; agricultural growth for state banks changes fromnegative to positive in the first period.
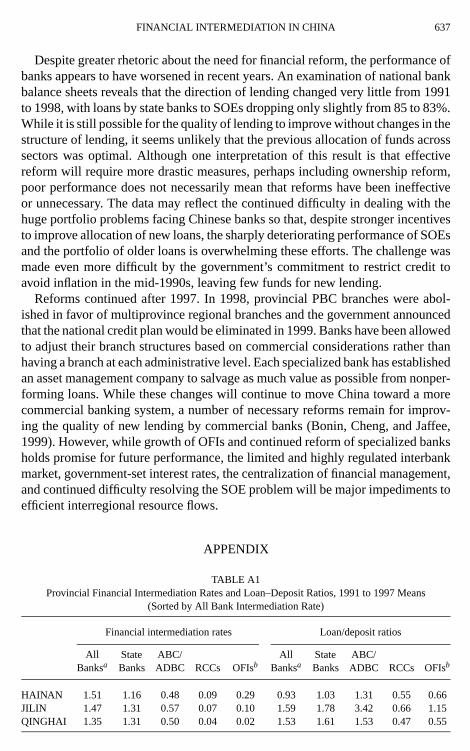
FINANCIAL INTERMEDIATION IN CHINA 637
Despite greater rhetoric about the need for financial reform, the performance ofbanks appears to have worsened in recent years. An examination of national bankbalance sheets reveals that the direction of lending changed very little from 1991to 1998, with loans by state banks to SOEs dropping only slightly from 85 to 83%.While it is still possible for the quality of lending to improve without changes in thestructure of lending, it seems unlikely that the previous allocation of funds acrosssectors was optimal. Although one interpretation of this result is that effectivereform will require more drastic measures, perhaps including ownership reform,poor performance does not necessarily mean that reforms have been ineffectiveor unnecessary. The data may reflect the continued difficulty in dealing with thehuge portfolio problems facing Chinese banks so that, despite stronger incentivesto improve allocation of new loans, the sharply deteriorating performance of SOEsand the portfolio of older loans is overwhelming these efforts. The challenge wasmade even more difficult by the government’s commitment to restrict credit toavoid inflation in the mid-1990s, leaving few funds for new lending.
Reforms continued after 1997. In 1998, provincial PBC branches were abol-ished in favor of multiprovince regional branches and the government announcedthat the national credit plan would be eliminated in 1999. Banks have been allowedto adjust their branch structures based on commercial considerations rather thanhaving a branch at each administrative level. Each specialized bank has establishedan asset management company to salvage as much value as possible from nonper-forming loans. While these changes will continue to move China toward a morecommercial banking system, a number of necessary reforms remain for improv-ing the quality of new lending by commercial banks (Bonin, Cheng, and Jaffee,1999). However, while growth of OFIs and continued reform of specialized banksholds promise for future performance, the limited and highly regulated interbankmarket, government-set interest rates, the centralization of financial management,and continued difficulty resolving the SOE problem will be major impediments toefficient interregional resource flows.
APPENDIX
TABLE A1Provincial Financial Intermediation Rates and Loan–Deposit Ratios, 1991 to 1997 Means
(Sorted by All Bank Intermediation Rate)
Financial intermediation rates Loan/deposit ratios
All State ABC/ All State ABC/Banksa Banks ADBC RCCs OFIsb Banksa Banks ADBC RCCs OFIsb
HAINAN 1.51 1.16 0.48 0.09 0.29 0.93 1.03 1.31 0.55 0.66JILIN 1.47 1.31 0.57 0.07 0.10 1.59 1.78 3.42 0.66 1.15QINGHAI 1.35 1.31 0.50 0.04 0.02 1.53 1.61 1.53 0.47 0.55
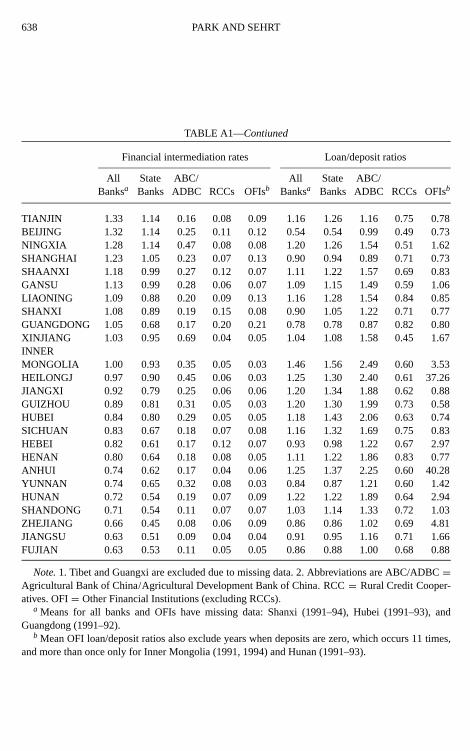
638 PARK AND SEHRT
TABLE A1—Contiuned
Financial intermediation rates Loan/deposit ratios
All State ABC/ All State ABC/Banksa Banks ADBC RCCs OFIsb Banksa Banks ADBC RCCs OFIsb
TIANJIN 1.33 1.14 0.16 0.08 0.09 1.16 1.26 1.16 0.75 0.78BEIJING 1.32 1.14 0.25 0.11 0.12 0.54 0.54 0.99 0.49 0.73NINGXIA 1.28 1.14 0.47 0.08 0.08 1.20 1.26 1.54 0.51 1.62SHANGHAI 1.23 1.05 0.23 0.07 0.13 0.90 0.94 0.89 0.71 0.73SHAANXI 1.18 0.99 0.27 0.12 0.07 1.11 1.22 1.57 0.69 0.83GANSU 1.13 0.99 0.28 0.06 0.07 1.09 1.15 1.49 0.59 1.06LIAONING 1.09 0.88 0.20 0.09 0.13 1.16 1.28 1.54 0.84 0.85SHANXI 1.08 0.89 0.19 0.15 0.08 0.90 1.05 1.22 0.71 0.77GUANGDONG 1.05 0.68 0.17 0.20 0.21 0.78 0.78 0.87 0.82 0.80XINJIANG 1.03 0.95 0.69 0.04 0.05 1.04 1.08 1.58 0.45 1.67INNERMONGOLIA 1.00 0.93 0.35 0.05 0.03 1.46 1.56 2.49 0.60 3.53HEILONGJ 0.97 0.90 0.45 0.06 0.03 1.25 1.30 2.40 0.61 37.26JIANGXI 0.92 0.79 0.25 0.06 0.06 1.20 1.34 1.88 0.62 0.88GUIZHOU 0.89 0.81 0.31 0.05 0.03 1.20 1.30 1.99 0.73 0.58HUBEI 0.84 0.80 0.29 0.05 0.05 1.18 1.43 2.06 0.63 0.74SICHUAN 0.83 0.67 0.18 0.07 0.08 1.16 1.32 1.69 0.75 0.83HEBEI 0.82 0.61 0.17 0.12 0.07 0.93 0.98 1.22 0.67 2.97HENAN 0.80 0.64 0.18 0.08 0.05 1.11 1.22 1.86 0.83 0.77ANHUI 0.74 0.62 0.17 0.04 0.06 1.25 1.37 2.25 0.60 40.28YUNNAN 0.74 0.65 0.32 0.08 0.03 0.84 0.87 1.21 0.60 1.42HUNAN 0.72 0.54 0.19 0.07 0.09 1.22 1.22 1.89 0.64 2.94SHANDONG 0.71 0.54 0.11 0.07 0.07 1.03 1.14 1.33 0.72 1.03ZHEJIANG 0.66 0.45 0.08 0.06 0.09 0.86 0.86 1.02 0.69 4.81JIANGSU 0.63 0.51 0.09 0.04 0.04 0.91 0.95 1.16 0.71 1.66FUJIAN 0.63 0.53 0.11 0.05 0.05 0.86 0.88 1.00 0.68 0.88
Note.1. Tibet and Guangxi are excluded due to missing data. 2. Abbreviations are ABC/ADBC=Agricultural Bank of China/Agricultural Development Bank of China. RCC= Rural Credit Cooper-atives. OFI= Other Financial Institutions (excluding RCCs).
a Means for all banks and OFIs have missing data: Shanxi (1991–94), Hubei (1991–93), andGuangdong (1991–92).
b Mean OFI loan/deposit ratios also exclude years when deposits are zero, which occurs 11 times,and more than once only for Inner Mongolia (1991, 1994) and Hunan (1991–93).
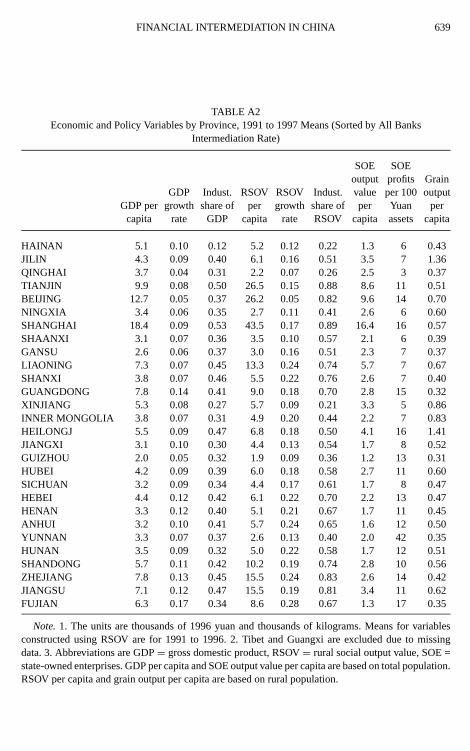
FINANCIAL INTERMEDIATION IN CHINA 639
TABLE A2Economic and Policy Variables by Province, 1991 to 1997 Means (Sorted by All Banks
Intermediation Rate)
SOE SOEoutput profits Grain
GDP Indust. RSOV RSOV Indust. value per 100 outputGDP per growth share of per growth share of per Yuan per
capita rate GDP capita rate RSOV capita assets capita
HAINAN 5.1 0.10 0.12 5.2 0.12 0.22 1.3 6 0.43JILIN 4.3 0.09 0.40 6.1 0.16 0.51 3.5 7 1.36QINGHAI 3.7 0.04 0.31 2.2 0.07 0.26 2.5 3 0.37TIANJIN 9.9 0.08 0.50 26.5 0.15 0.88 8.6 11 0.51BEIJING 12.7 0.05 0.37 26.2 0.05 0.82 9.6 14 0.70NINGXIA 3.4 0.06 0.35 2.7 0.11 0.41 2.6 6 0.60SHANGHAI 18.4 0.09 0.53 43.5 0.17 0.89 16.4 16 0.57SHAANXI 3.1 0.07 0.36 3.5 0.10 0.57 2.1 6 0.39GANSU 2.6 0.06 0.37 3.0 0.16 0.51 2.3 7 0.37LIAONING 7.3 0.07 0.45 13.3 0.24 0.74 5.7 7 0.67SHANXI 3.8 0.07 0.46 5.5 0.22 0.76 2.6 7 0.40GUANGDONG 7.8 0.14 0.41 9.0 0.18 0.70 2.8 15 0.32XINJIANG 5.3 0.08 0.27 5.7 0.09 0.21 3.3 5 0.86INNER MONGOLIA 3.8 0.07 0.31 4.9 0.20 0.44 2.2 7 0.83HEILONGJ 5.5 0.09 0.47 6.8 0.18 0.50 4.1 16 1.41JIANGXI 3.1 0.10 0.30 4.4 0.13 0.54 1.7 8 0.52GUIZHOU 2.0 0.05 0.32 1.9 0.09 0.36 1.2 13 0.31HUBEI 4.2 0.09 0.39 6.0 0.18 0.58 2.7 11 0.60SICHUAN 3.2 0.09 0.34 4.4 0.17 0.61 1.7 8 0.47HEBEI 4.4 0.12 0.42 6.1 0.22 0.70 2.2 13 0.47HENAN 3.3 0.12 0.40 5.1 0.21 0.67 1.7 11 0.45ANHUI 3.2 0.10 0.41 5.7 0.24 0.65 1.6 12 0.50YUNNAN 3.3 0.07 0.37 2.6 0.13 0.40 2.0 42 0.35HUNAN 3.5 0.09 0.32 5.0 0.22 0.58 1.7 12 0.51SHANDONG 5.7 0.11 0.42 10.2 0.19 0.74 2.8 10 0.56ZHEJIANG 7.8 0.13 0.45 15.5 0.24 0.83 2.6 14 0.42JIANGSU 7.1 0.12 0.47 15.5 0.19 0.81 3.4 11 0.62FUJIAN 6.3 0.17 0.34 8.6 0.28 0.67 1.3 17 0.35
Note.1. The units are thousands of 1996 yuan and thousands of kilograms. Means for variablesconstructed using RSOV are for 1991 to 1996. 2. Tibet and Guangxi are excluded due to missingdata. 3. Abbreviations are GDP= gross domestic product, RSOV= rural social output value, SOE =state-owned enterprises. GDP per capita and SOE output value per capita are based on total population.RSOV per capita and grain output per capita are based on rural population.
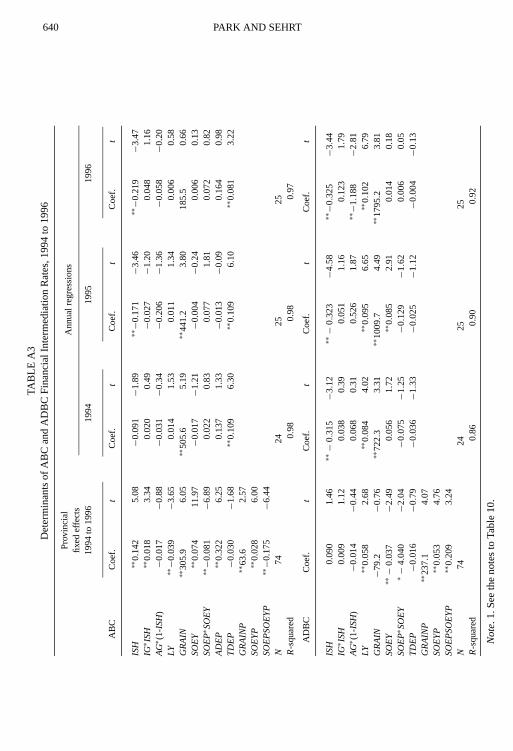
640 PARK AND SEHRTTA
BLE
A3
Det
erm
inan
tsof
AB
Can
dA
DB
CF
inan
cial
Inte
rmed
iatio
nR
ates
,199
4to
1996
Pro
vinc
ial
Ann
ualr
egre
ssio
nsfix
edef
fect
s19
94to
1996
1994
1995
1996
AB
CC
oef.
tC
oef.
tC
oef.
tC
oef.
t
ISH
∗∗0.
142
5.08
−0.0
91−1
.89
∗∗−0
.171
−3.4
6∗∗−0
.219
−3.4
7IG∗ I
SH
∗∗0.
018
3.34
0.02
00.
49−0
.027
−1.2
00.
048
1.16
AG∗ (
1-IS
H)
−0.0
17−0
.88
−0.0
31−0
.34
−0.2
06−1
.36
−0.0
58−0
.20
LY∗∗−0
.039
−3.6
50.
014
1.53
0.01
11.
340.
006
0.58
GR
AIN
∗∗30
5.9
6.05
∗∗50
5.6
5.19
∗∗44
1.2
3.80
185.
50.
66S
OE
Y∗∗
0.07
411
.97
−0.0
17−1
.21
−0.0
04−0
.24
0.00
60.
13S
OE
P∗S
OE
Y∗∗−0
.081
−6.8
90.
022
0.83
0.07
71.
810.
072
0.82
AD
EP
∗∗0.
322
6.25
0.13
71.
33−0
.013
−0.0
90.
164
0.98
TD
EP
−0.0
30−1
.68
∗∗0.
109
6.30
∗∗0.
109
6.10
∗∗0.
081
3.22
GR
AIN
P∗∗
63.6
2.57
SO
EY
P∗∗
0.02
86.
00S
OE
PS
OE
YP
∗∗−0
.175
−6.4
4N
7424
2525
R-s
quar
ed0.
980.
980.
97
AD
BC
Coe
f.t
Coe
f.t
Coe
f.t
Coe
f.t
ISH
0.09
01.
46∗∗−
0.31
5−3.1
2∗∗−
0.32
3−4.5
8∗∗−0.3
25−3.4
4IG∗ I
SH
0.00
91.
120.
038
0.39
0.05
11.
160.
123
1.79
AG∗ (
1-IS
H)
−0.0
14−0.4
40.
068
0.31
0.52
61.
87∗∗−1.1
88−2.8
1LY
∗∗0.
058
2.68
∗∗0.
084
4.02
∗∗0.
095
6.65
∗∗0.
102
6.79
GR
AIN
−79.
2−0.7
6∗∗
722.
33.
31∗∗
1009.7
4.49
∗∗17
95.2
3.81
SO
EY
∗∗−
0.03
7−2.4
90.
056
1.72
∗∗0.
085
2.91
0.01
40.
18S
OE
P∗S
OE
Y∗−
4.04
0−2.0
4−0.0
75−1.2
5−0.1
29−1.6
20.
006
0.05
TD
EP
−0.0
16−0.7
9−0.0
36−1.3
3−0.0
25−1.1
2−0.0
04−0.1
3G
RA
INP
∗∗23
7.1
4.07
SO
EY
P∗∗
0.05
34.
76S
OE
PS
OE
YP
∗∗0.
209
3.24
N74
2425
25R
-squ
ared
0.86
0.90
0.92
No
te.1
.See
the
note
sto
Tabl
e10
.

FINANCIAL INTERMEDIATION IN CHINA 641
Derivation of Equation (5)
Substituting (1), (3), and (4) into (2), dividing through by (l + r ), defininglrbi
as the sectoral intermediation rate equal toLrbi /qri yr , and solving the integral andthe first order conditions of the bank’s maximization problem with respect toLrbi
yields
l ∗rbi = −α2
i
α1i
l-rbi + α3i
α1i
qri + α4i
α1i
qri gri + α5i
α1i
ln
(yr
popr
)− (1+ rl )
α1i (1+ r )
. (A-1)
The maximization problem of other banks can be solved analogously. To simplify,we assume there is only one other bank. Optimal lending by each bank is a functionof lending by the other. The two response functions determine a Nash equilibriumthat yields a reduced form relationship betweenl rbi and the economic fundamentals.The responsiveness of lending will depend on the extent to which lending fromthe two banks is a substitute for each other, which is expressed by theα1
i s andα2i s
in each bank’s repayment function. Adding bank subscripts 1 and 2, the reducedform coefficients for bank 1’s lending are
αn1iα
12i − α2
1iαn2i
α11iα
12i − α2
1iα22i
,
wheren is thenth argument of the repayment function given by Eq. (4).Assuming that the repayment functions of the two banks have identical coef-
ficients, the reduced form coefficients on fundamentals will equal those in (A-1)multiplied byκi , where
κi =1− α2
i
α1i
1−(α2
i
α1i
)2 . (A-2)
At the extreme of no substitution,α2i = 0,κi = 1 andlrbi is the same as Eq. (A-1),
excluding the first term on the right-hand side. As substitutability increases,α2i
approachesα1i andκi approaches 0.5. The solution is indeterminate if there is
perfect substitutability, i.e., ifα1i = α2
i . More generally, forn> 2,κi will convergeto 1/n. The responsiveness of lending to economic fundamentals is reduced as thebank anticipates the lending behavior of the other bank and its effect on repaymentrates. Thus, measurable responsiveness to fundamentals presumes market power.However, the number of lenders will not affect the aggregate responsiveness oflending to fundamentals, since total lending must equalize expected return acrossregions in equilibrium.
We can also solve for the optimal amount of policy lending by solving the firstorder condition for the bank manager’s maximization problem with respect toLrbg.
642 PARK AND SEHRT
This yields
L∗rbg =λrb
(1+ rT )− (1+ r )Rrbg. (A-3)
The amount of policy lending depends on the importance placed on such loans,which can vary by bank and by region, and the losses from policy lending measuredin the denominator.
An equation for region-bank-sector specific lending is estimable, given sector-specific data, and under the assumption of efficient interbank markets. Unfortu-nately, we often have data only on total lending by the bank, with an unclearmapping between loan categories and economic sectors. Total loans of the bankare the sum of commercial sectoral loans and policy loans, an identity which canbe expressed in terms of intermediation rates:
l ∗rb =∑
i
qri l∗rbi + l ∗rbg. (A-4)
Here,lrbg is policy loans divided by provincial output, i.e.,Lrbg/yr . Substituting(A-1) and (A-3) into (A-4) yields
l ∗rb=∑
i
(κiα
3i
α1i
qri + κiα4i
α1i
qri gri
)+∑
i
κiα5i
α1i
ln
(yr
popr
)−∑
i
κi (1+ rT )
α1i (1+ r )
+ λrb
cyr,
(A-5)
wherec is the denominator in (A-3). Equation (A-5) is the same as Eq. (5) in thetext.
REFERENCES
Agricultural Bank of China (ABC), Nongyinfa [Agricultural Bank of China] no. 173 (1992). In Peo-ple’s Bank of China,1992 nian jinrong guizhang zhidu xuanbian. [Selected Financial Rules andRegulations 1992], Vol. 2, pp. 119–136. Beijing: Zhongguo jinrong chubanshe, 1992.
Agricultural Bank of China (ABC), Nongyinfa [Agricultural Bank of China] no. 80 (1996). In Peo-ple’s Bank of China,1996 nian jinrong guizhang zhidu xuanbian. [Selected Financial Rules andRegulations 1996], Vol. 2, pp. 38–49. Beijing: Zhongguo jinrong chubanshe, 1996.
Agricultural Development Bank of China (ADBC),Zhongguo nongye fazhan yinhang nianbao 1997[Agricultural Development Bank of China 1997 Annual Report]. Beijing: ADBC, 1998.
Bonin, John, Cheng, Hang-Sheng, and Jaffee, Dwight, “Bad Loans and Banking Reform in China.”Unpublished manuscript, Wesleyan University, CT, 1999.
Bonin, John, and Sz´ekely, Istvan, Eds.,The Development and Reform of Financial Systems in Centraland Eastern Europe. Aldershot, UK: Elgar, 1994.
Brandt, Loren, and Zhu, Xiaodong, “Redistribution in a Decentralizing Economy: Growth and Inflationin China under Reform.”J. Polit. Economy108,2:422–439, April 2000.
Cook, R. Dennis, and Weisberg, Sanford, “Diagnostics for Heteroscedasticity in Regression.”Biometrika70,1:1–10, April 1983.
FINANCIAL INTERMEDIATION IN CHINA 643
Fan, Gang, and Woo, Wing-Thye, “Decentralized Socialism and Macroeconomic Stability: Lessonsfrom China.” University of California at Davis, Economics Department, Working Paper 411,p. 27 September 1992.
Gertler, Mark, and Rose, Andrew, “Finance, Public Policy, and Growth.” In Gerard Caprio, Jr., IzakAtiyas, and James Hanson, Eds.,Financial Reform: Theory and Experience, pp. 115–128. NewYork: Cambridge University Press, 1996.
Goldsmith, Raymond,Financial Structure and Development. New Haven: Yale University Press, 1969.Haggard, Stephan, and Lee, Chung H.,Financial Systems and Economic Policy in Developing Coun-
tries. Ithaca: Cornell University Press, 1995.Heilongjiang People’s Bank of China (HJPBC),Heilongjiang jinrong nianjian 1996[Heilongjiang
Financial Yearbook 1996]. Beijing: Renmin zhongguo chubanshe, 1996.Huang, Yasheng,Inflation and Investment Controls in China: The Political Economy of Central-Local
Relations During the Reform Era. Cambridge: Cambridge University Press, 1996.King, Robert, and Levine, Ross, “Finance and Growth: Schumpeter Might Be Right.”Quart. J. Econ.
108,3:713–737, Aug. 1993.Lardy, Nicholas,China’s Unfinished Economic Revolution. Washington, DC: Brookings Institution
Press, 1998.Levine, Ross, “Financial Development and Economic Growth: Views and Agenda.”J. Econ. Lit. 35,
2:688–726, June 1997.Levine, Ross, and Zervos, Sara, “Stock Markets, Banks, and Economic Growth.”Amer. Econ. Rev. 88,
3:537–558, June 1998.Liu, Zhou Wei, “Grain System Loses 214 Billion Yuan in 6 Years.”Nanfang ribao[Southern China
Daily], Oct. 16, 1998.Luo, Huasu, Ed.,Renmin yinhang zaidaikuan guanli[Management of Re-lending by the People’s Bank
of China]. Beijing: Zhongguo jinrong chubanshe, 1991.Naughton, Barry, “China’s Macroeconomy in Transition.”China Quart. 0,144: 1083–1104, Dec. 1995.Nissanke, Machiko, and Aryeetey, Ernest,Financial Integration and Development—Liberalization and
Reform in Sub-Saharan Africa. London and New York: Routledge, 1998.Park, Albert, and Rozelle, Scott, “Reforming State-Market Relations in Rural China.”Econ. Transition
6, 2:461–480, 1998.Park, Albert, and Wang, Sangui, “Will Credit Access Help the Poor: Evidence from China.” Unpublished
Manuscript, University of Michigan, MI, 2000.People’s Bank of China (PBC),Zhongguo jinrong nianjian[China Financial Yearbook]. Beijing:
Zhongguo jinrong chubanshe, various years.People’s Bank of China (PBC), Yinfa [PBC regulation] no. 38 (1994). In PBC, Ed.,1994 nian jinrong
guizhang zhidu xuanbian[Selected Financial Rules and Regulations 1994], pp. 25–31. Beijing:Zhongguo jinrong chubanshe, 1994a.
People’s Bank of China (PBC), Yinfa [PBC regulation] no. 43 (1994). In PBC, Ed.,1994 nian xindaizijin guanli wenjian huibian[Compendium of Documents on Loan Fund Management], pp. 92–98.Beijing: Zhongguo jinrong chubanshe, 1994b.
People’s Bank of China Department for Monetary Policy,1996 Quanguo tongyi de yinhang jian tongyechaijie shichang nianbao[1996 Annual Report for the National Interbank Market]. Beijing:Zhongguo renmin yinhang huobi zhengcesi, 1997.
Rajan, Raghuram, and Zingales, Luigi, “Financial Dependence and Growth.”American EconomicReview88,3:559–86, June 1998.
Sehrt, Kaja, “Banks Versus Budgets: Credit Allocation in the People’s Republic of China, 1984–1997.”Ph.D. dissertation, Department of Political Science, University of Michigan, Ann Arbor, MI, 1999.
Wang, Guoguang, and Yang, Siqun, “Zhongguo tongyi tongye chaijie shichang de yixie wenti.” [SomeProblems Regarding China’s Unified Interbank Market].Gaige[Reform], 2:78–80, March 1996.
The World Bank,China: Macroeconomic Stability in a Decentralized Economy. Washington, DC:World Bank, 1995.

644 PARK AND SEHRT
Xie, Kangsheng, “Guanyu quxiao xindai guimo guanli de xianshi tiaojian yu shishi buzhou” [ActualRequirements and Implementation Steps for Abolishing the Administration of Credit Quotas].Jinrong yanjiu baogao[Financial Research Report], May, 1997.
Xie, Ping, Zhongguo jinrong zhidu de xuanze[Options for China’s Financial System]. Shanghai:Shanghai yuandong chubanshe, 1996.
Yusuf, Shahid, “China’s Macroeconomic Performance and Management During Transition.”J. Econ.Perspectives8, 2:71–92, Spring 1994.
Zhejiang People’s Bank of China (ZPBC),Zhejiang jinrong nianjian 1996[Zhejiang Financial Year-book 1996]. Hangzhou: Jiangsu renmin chubanshe, 1997.