testing waste water for fecal coliforms and/or e.coli ... · –15 tube mpn combination of + tubes...
TRANSCRIPT
1
1
Testing Waste Water for Fecal Coliforms and/or E.coli using Colilert® and Colilert®-18
& Quanti-Tray®
Gil Dichter
World Wide Technical Support Manager, Water
www.idexx.com/water
2
FOR ALL OF YOU WHO ARE HAVING A BAD DAY...
2
3
OBJECTIVESDefine total coliforms, fecal and E.coli
Colilert & Colilert-18 for WW– Theory
– How to test
– Reading results
– Understanding MPN theory and relationship to MF
– QC/QA
Q&A
4
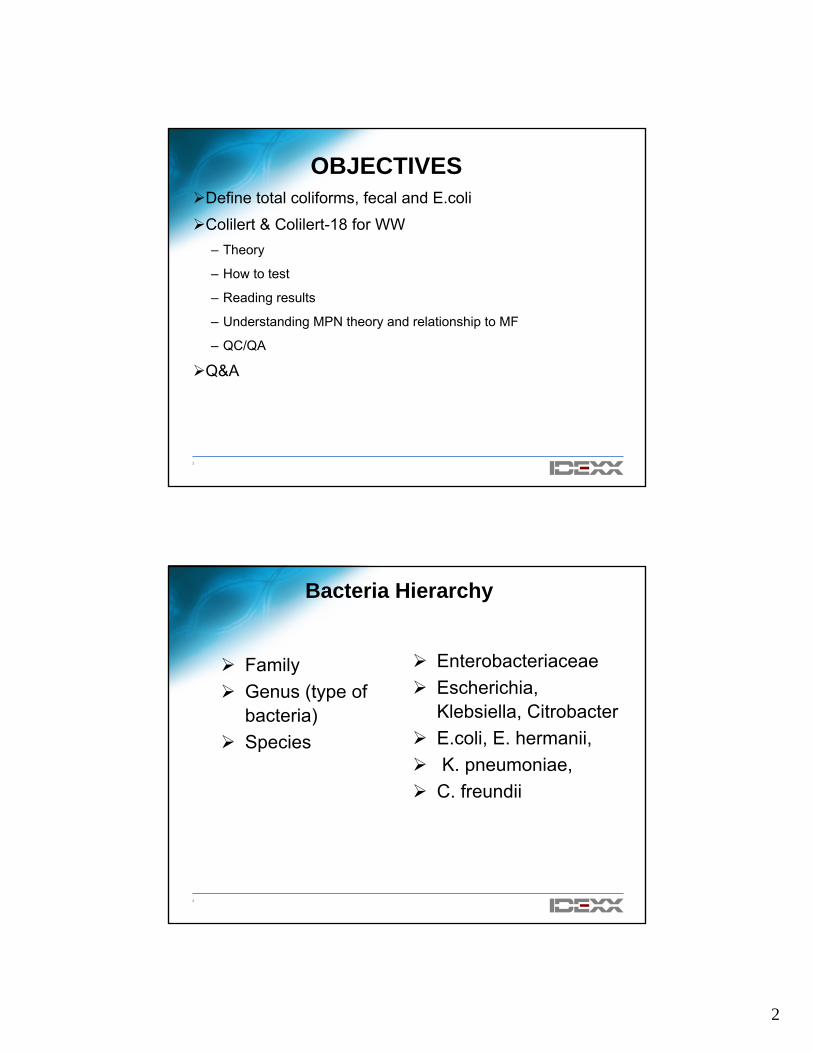
Bacteria Hierarchy
FamilyGenus (type of bacteria)Species
EnterobacteriaceaeEscherichia, Klebsiella, CitrobacterE.coli, E. hermanii,K. pneumoniae,
C. freundii
3
5
Coliform Genera
Escherichia- human and animal feces
Enterobacter- environment, feces
Klebsiella- environment, feces
Citrobacter- environment
Serratia- environment
6
Thermotolerant Coliforms [aka Fecal Coliforms]It is a subset of total coliformsDefined as coliform bacteria that can grow at
44.5°CConsists of the following coliforms:
– E. coli– K. pnuemoniae–Enterobacter spp.

4
7
Escherichia coli
Named after the German Scientist who found this bacteria-Dr. Escherich
A genus of Gram negative bacteria of the family Enterobacteriaceae
A type of thermotolerant coliform bacteria commonly found in the intestines of warm blooded animals including humans
Does not occur naturally in soil and vegetation
May occur in soil and water as a result of fecal contamination
8
E. coli (non-pathogenic)
Major inhabitant of gastrointestinal tract in warm-blooded animals, birds and humansShed in feces at high levelsThus, indicator of true fecal contaminationMost common E. coli detected in water
5
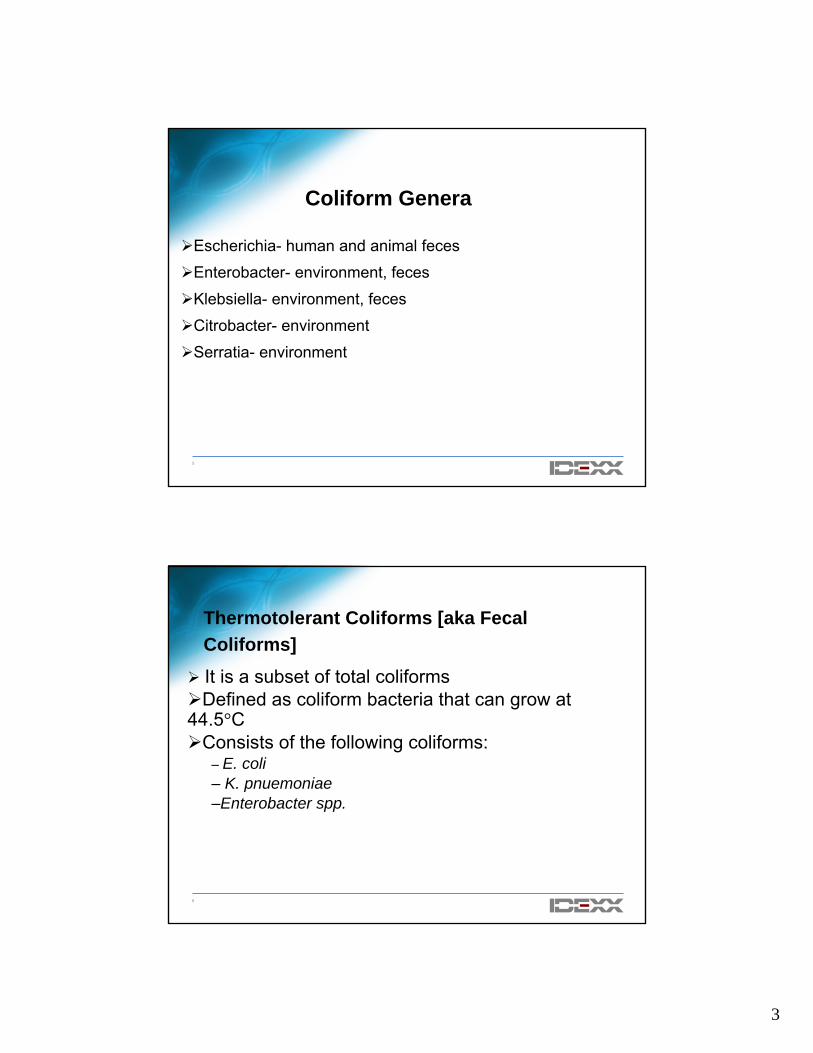
9
E. coli
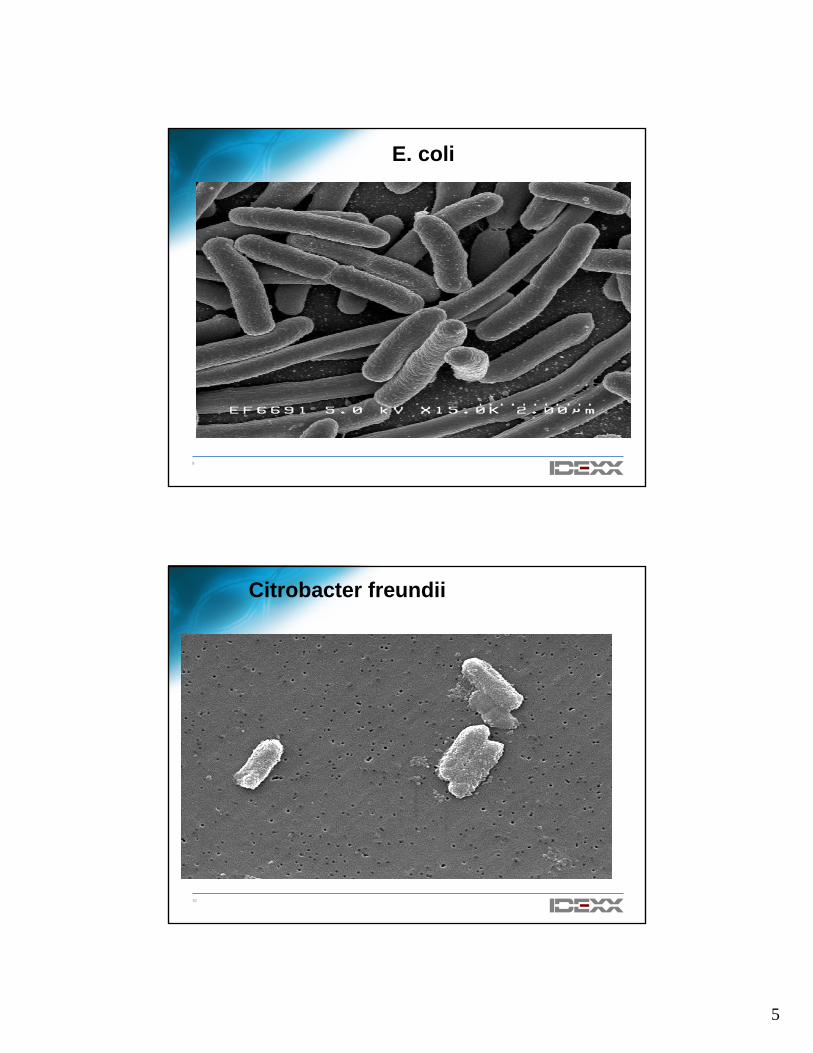
10
Citrobacter freundii
6
11
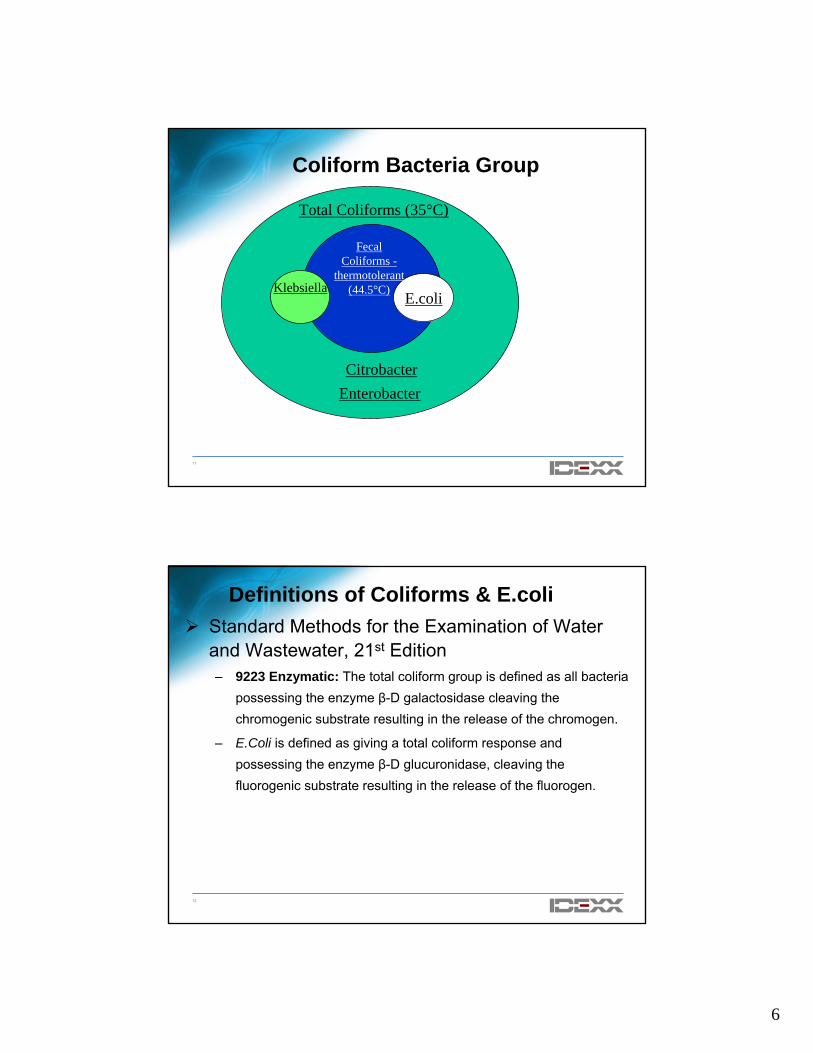
Coliform Bacteria Group
Total coliforms (35Klebsiella
E.coli
Fecal Coliforms -
thermotolerant (44.5°C)
CitrobacterEnterobacter
Total Coliforms (35°C)
12
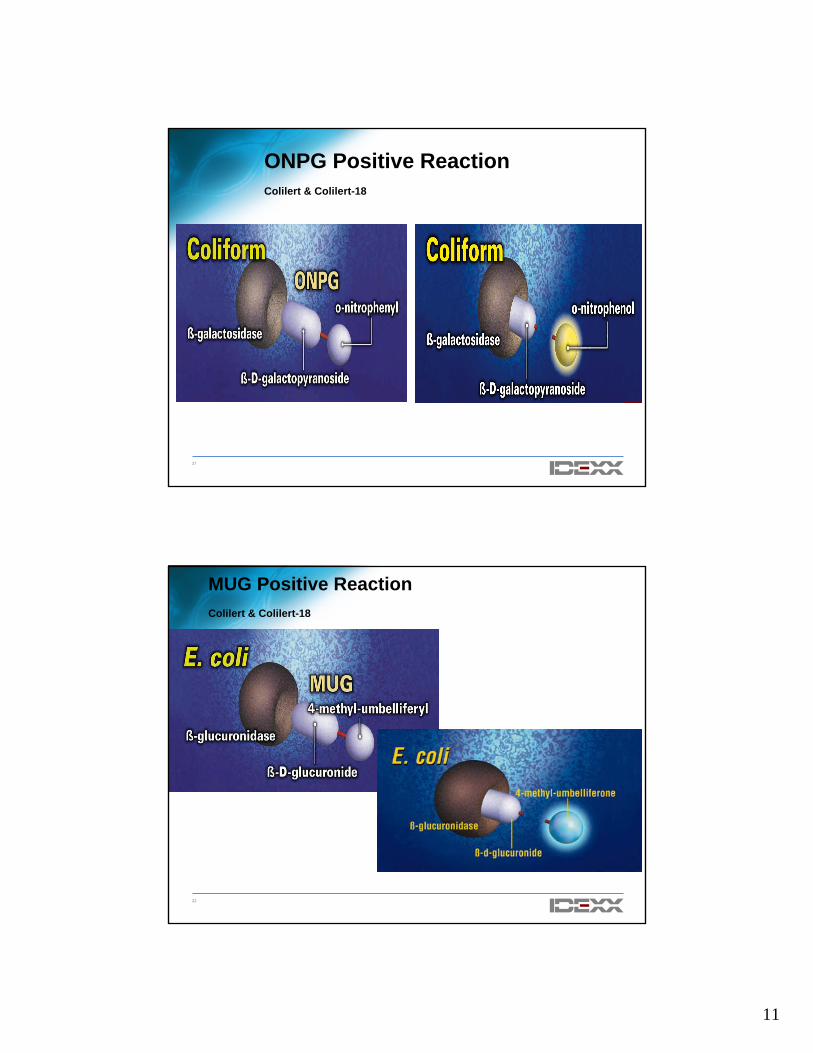
Definitions of Coliforms & E.coliStandard Methods for the Examination of Water and Wastewater, 21st Edition– 9223 Enzymatic: The total coliform group is defined as all bacteria
possessing the enzyme β-D galactosidase cleaving the chromogenic substrate resulting in the release of the chromogen.
– E.Coli is defined as giving a total coliform response and possessing the enzyme β-D glucuronidase, cleaving the fluorogenic substrate resulting in the release of the fluorogen.
7
13
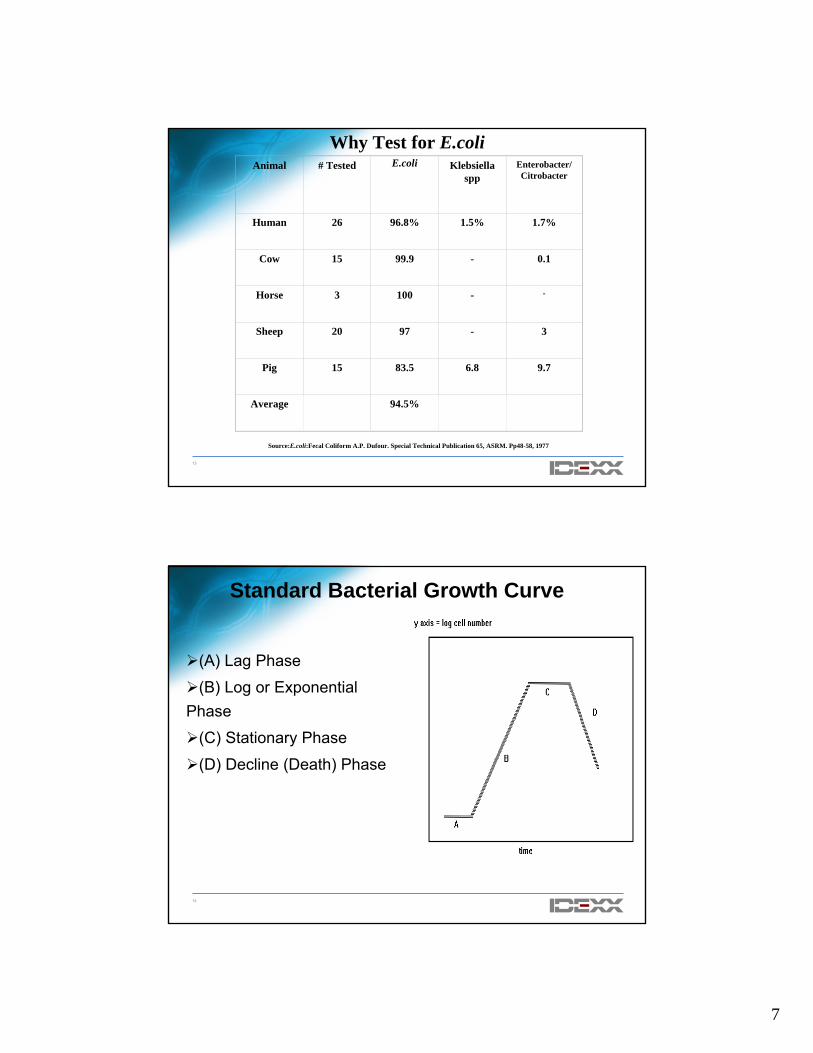
Why Test for E.coliAnimal # Tested E.coli Klebsiella
sppEnterobacter/ Citrobacter
Human 26 96.8% 1.5% 1.7%
Cow 15 99.9 - 0.1
Horse 3 100 - -
Sheep 20 97 - 3
Pig 15 83.5 6.8 9.7
Average 94.5%
Source:E.coli:Fecal Coliform A.P. Dufour. Special Technical Publication 65, ASRM. Pp48-58, 1977
14
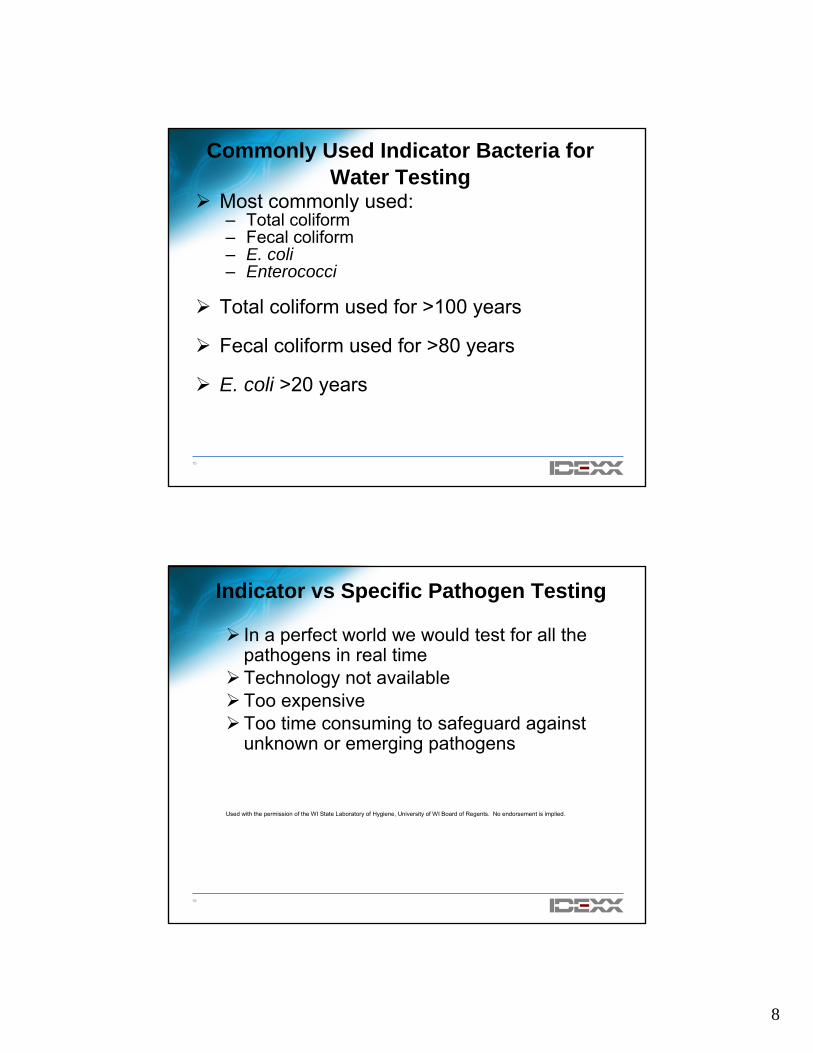
Standard Bacterial Growth Curve
(A) Lag Phase
(B) Log or Exponential Phase
(C) Stationary Phase
(D) Decline (Death) Phase
8
15
Commonly Used Indicator Bacteria for Water Testing
Most commonly used:– Total coliform– Fecal coliform– E. coli– Enterococci
Total coliform used for >100 years
Fecal coliform used for >80 years
E. coli >20 years
16
Indicator vs Specific Pathogen Testing
In a perfect world we would test for all the pathogens in real timeTechnology not availableToo expensiveToo time consuming to safeguard against unknown or emerging pathogens
Used with the permission of the WI State Laboratory of Hygiene, University of WI Board of Regents. No endorsement is implied.
9
17
Requirements for an Indicator Organism
Present when pathogens are present
Absent in uncontaminated waters
Present in higher numbers than pathogens in contaminated water
Better survival in water than pathogens
Easy and Safe to analyze
Rapid results
Inexpensive
Accurate
18
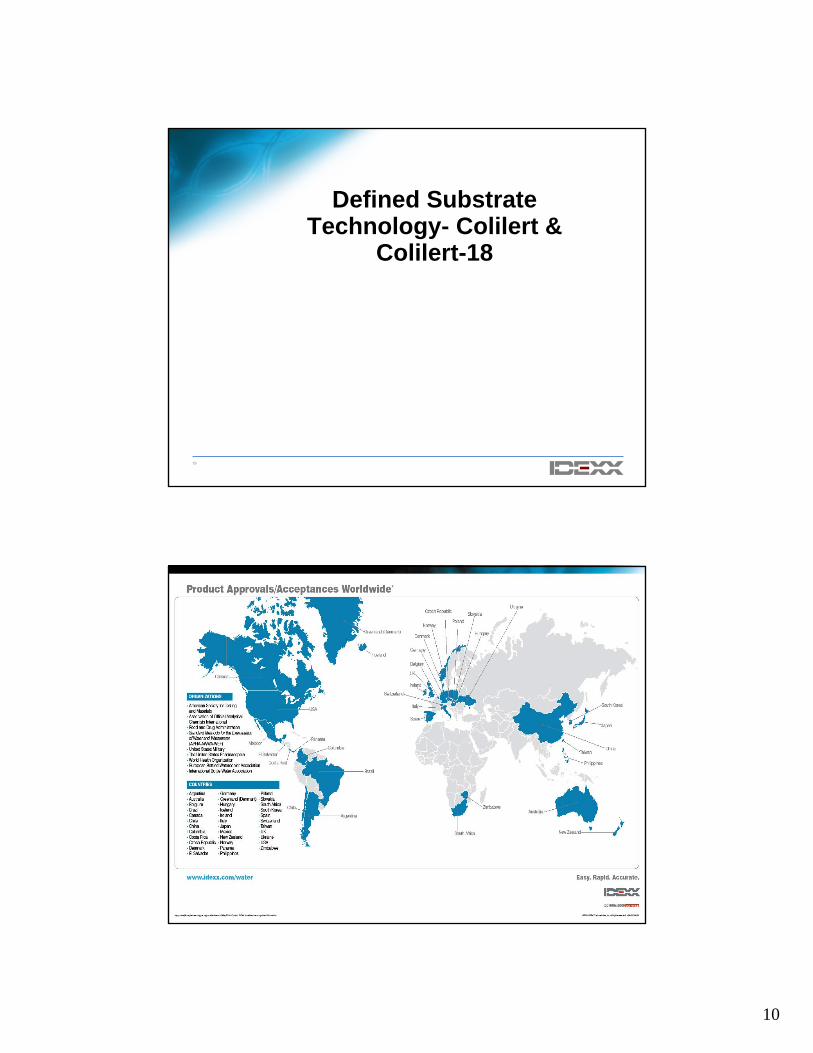
Guidelines for Analysis of Pollutants; Analytical Methods for Biological Waste Water
Federal Register Notice- August 16th, 2005– Comments on proposal ended on October 17th,
2005– Promulgated -March 26th,2007– Effective Date-April 25th, 2007
Testing for E.coli and Enterococci added– Approved methods include Colilert, Colilert-18
and Enterolert and several MF methods– E.coli for fresh surface waters and enterococci for
marine waters
10
19
Defined Substrate Technology- Colilert &
Colilert-18
20
11
21
ONPG Positive ReactionColilert & Colilert-18
22
MUG Positive ReactionColilert & Colilert-18
12
23
24
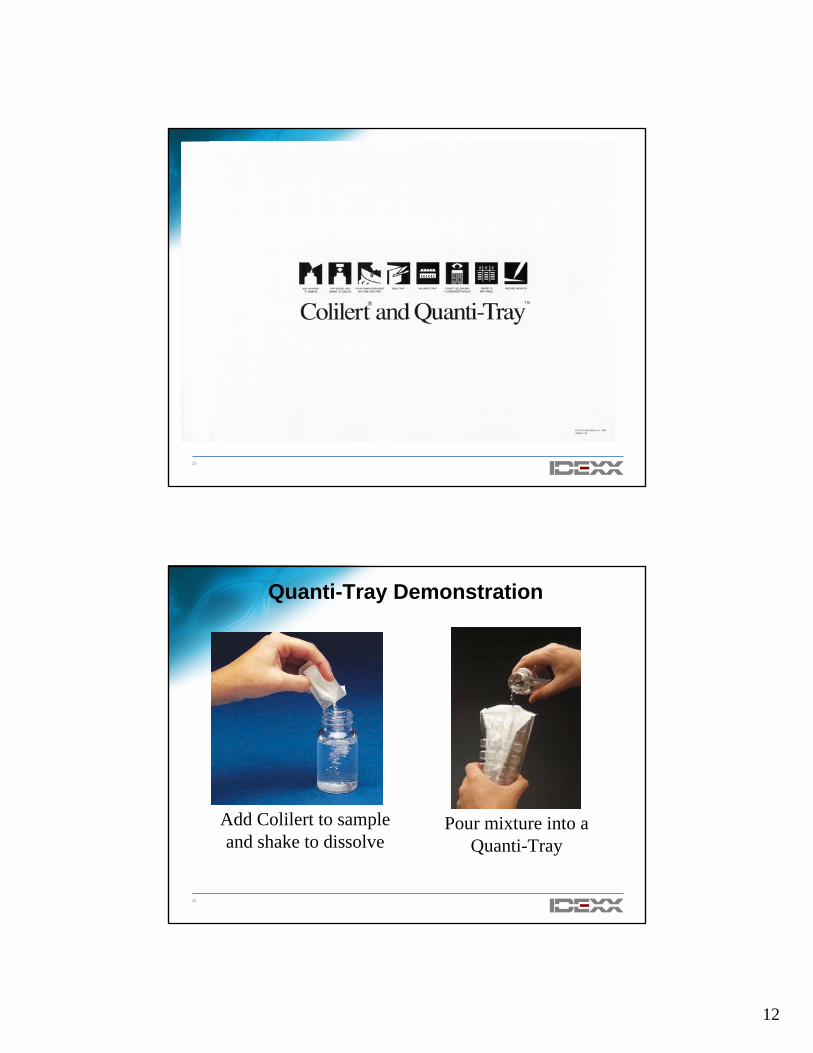
Quanti-Tray Demonstration
Add Colilert to sample and shake to dissolve
Pour mixture into a Quanti-Tray
13
25
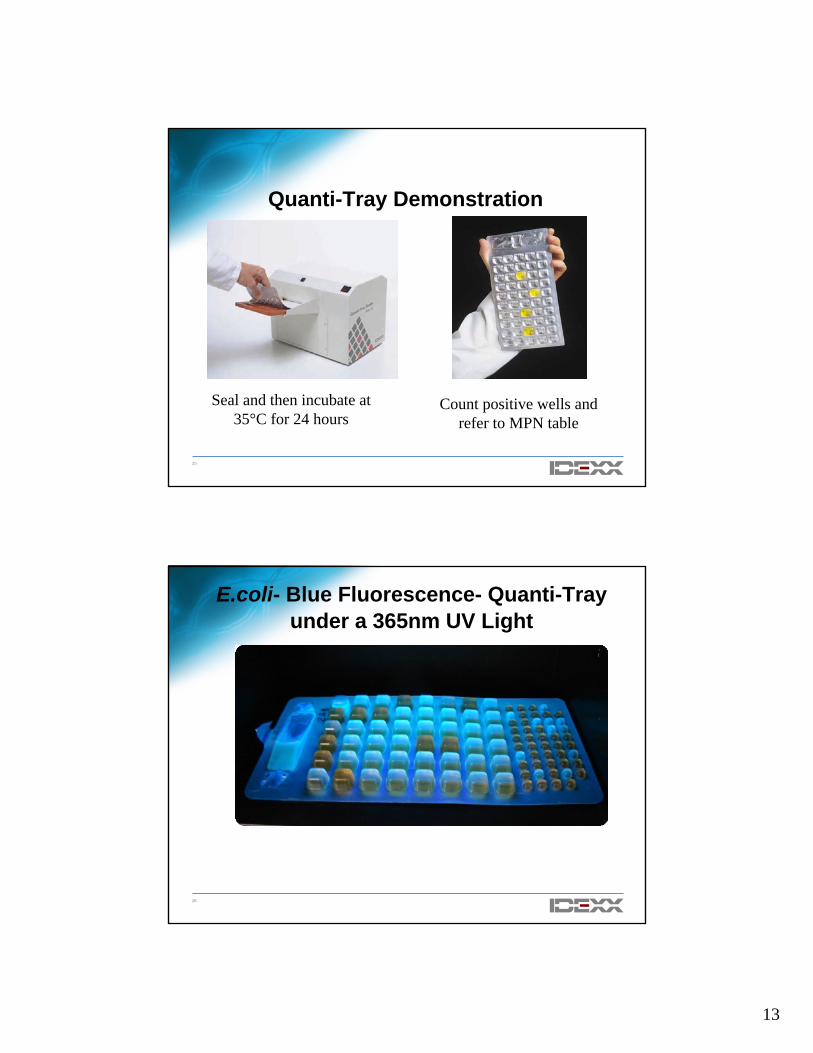
Quanti-Tray Demonstrationcont.
Seal and then incubate at 35°C for 24 hours
Count positive wells and refer to MPN table
26
E.coli- Blue Fluorescence- Quanti-Trayunder a 365nm UV Light
14
27
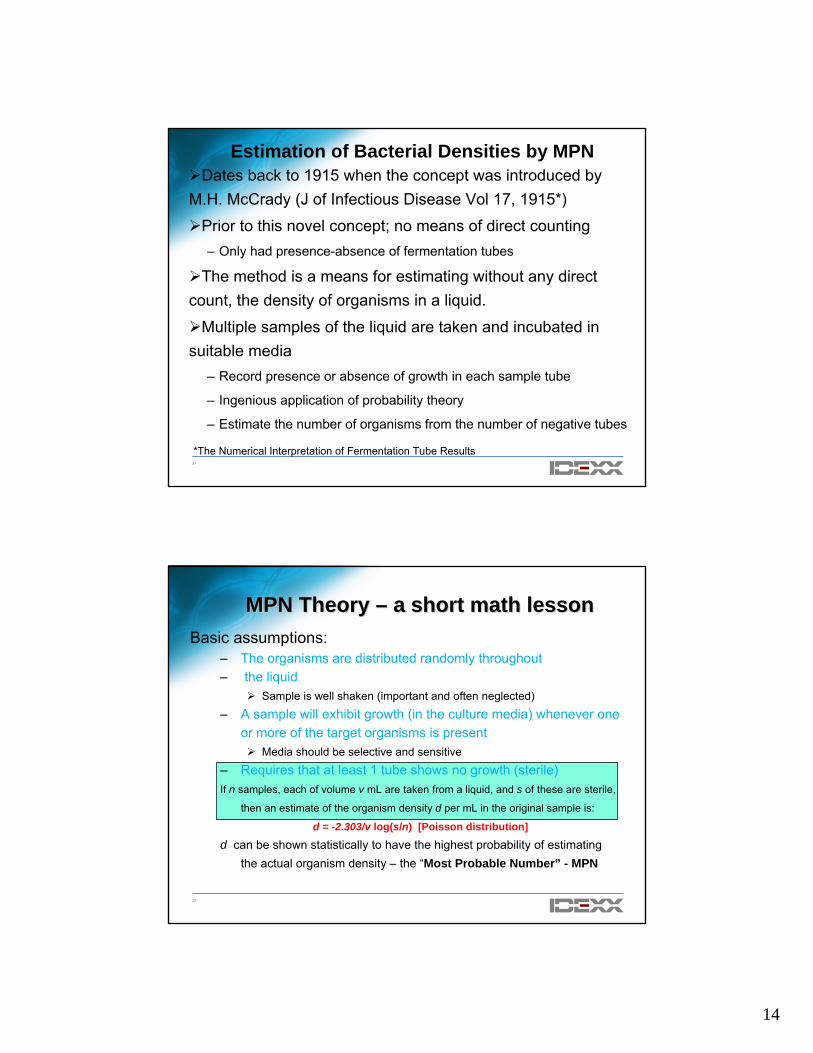
Estimation of Bacterial Densities by MPNDates back to 1915 when the concept was introduced by
M.H. McCrady (J of Infectious Disease Vol 17, 1915*)
Prior to this novel concept; no means of direct counting– Only had presence-absence of fermentation tubes
The method is a means for estimating without any direct count, the density of organisms in a liquid.
Multiple samples of the liquid are taken and incubated in suitable media
– Record presence or absence of growth in each sample tube
– Ingenious application of probability theory
– Estimate the number of organisms from the number of negative tubes
*The Numerical Interpretation of Fermentation Tube Results
28
MPN Theory MPN Theory –– a short math lessona short math lessonBasic assumptions:
– The organisms are distributed randomly throughout– the liquid
Sample is well shaken (important and often neglected)– A sample will exhibit growth (in the culture media) whenever one
or more of the target organisms is presentMedia should be selective and sensitive
– Requires that at least 1 tube shows no growth (sterile)If n samples, each of volume v mL are taken from a liquid, and s of these are sterile,
then an estimate of the organism density d per mL in the original sample is:
d = -2.303/v log(s/n) [Poisson distribution]
d can be shown statistically to have the highest probability of estimating the actual organism density – the “Most Probable Number” - MPN
15
29
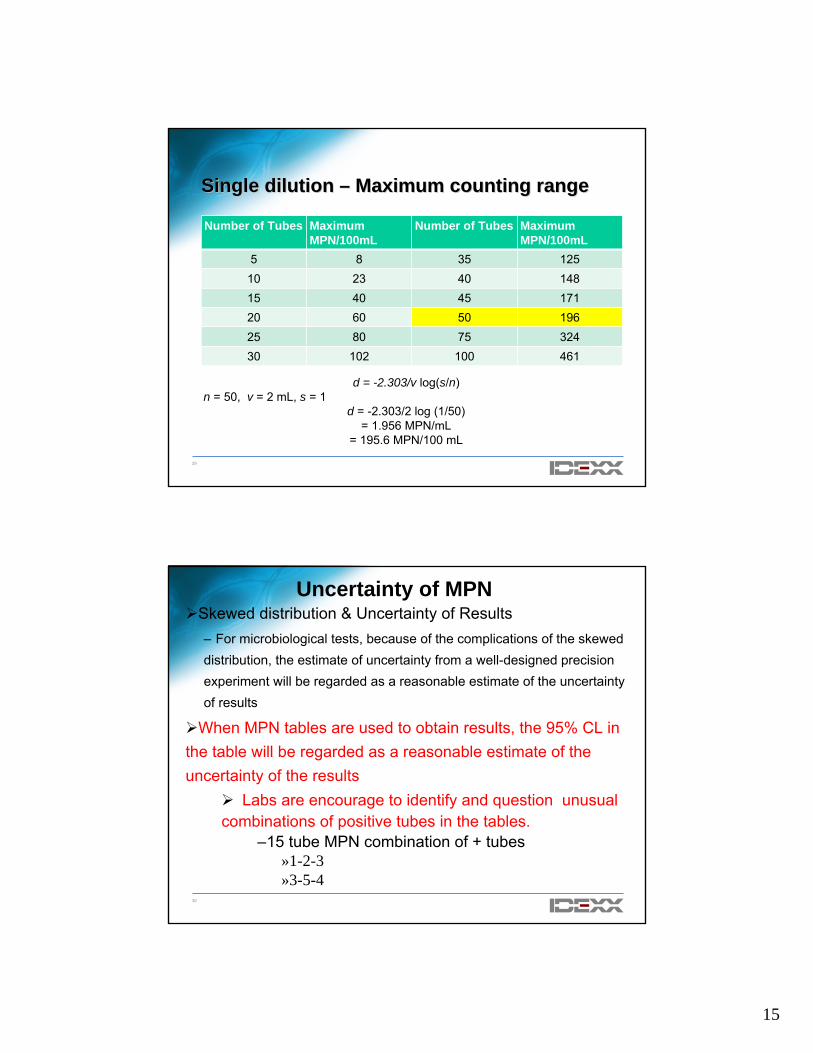
Single dilution Single dilution –– Maximum counting rangeMaximum counting range
d = -2.303/v log(s/n)n = 50, v = 2 mL, s = 1
d = -2.303/2 log (1/50)= 1.956 MPN/mL
= 195.6 MPN/100 mL
Number of Tubes Maximum MPN/100mL
Number of Tubes Maximum MPN/100mL
5 8 35 12510 23 40 14815 40 45 17120 60 50 19625 80 75 32430 102 100 461
30
Uncertainty of MPNSkewed distribution & Uncertainty of Results– For microbiological tests, because of the complications of the skewed distribution, the estimate of uncertainty from a well-designed precision experiment will be regarded as a reasonable estimate of the uncertainty of results
When MPN tables are used to obtain results, the 95% CL in the table will be regarded as a reasonable estimate of the uncertainty of the results
Labs are encourage to identify and question unusual combinations of positive tubes in the tables.
–15 tube MPN combination of + tubes»1-2-3»3-5-4
16
31
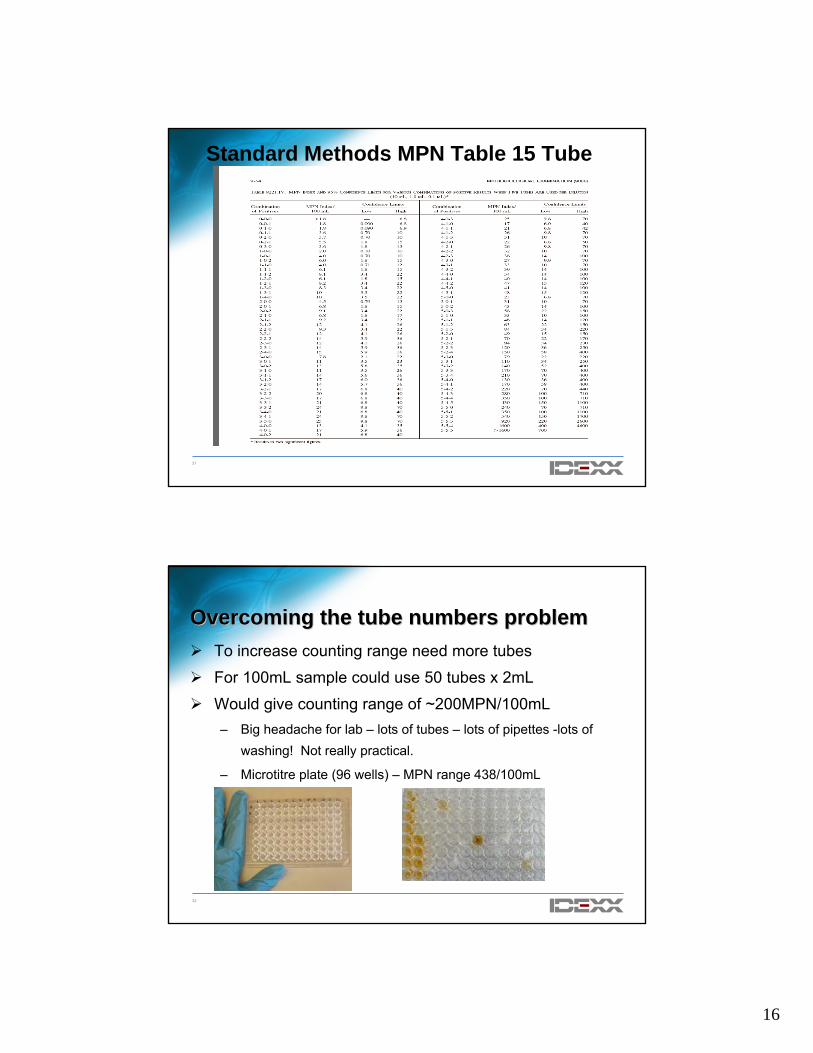
Standard Methods MPN Table 15 Tube
32
Overcoming the tube numbers problemOvercoming the tube numbers problemTo increase counting range need more tubes
For 100mL sample could use 50 tubes x 2mL
Would give counting range of ~200MPN/100mL– Big headache for lab – lots of tubes – lots of pipettes -lots of
washing! Not really practical.
– Microtitre plate (96 wells) – MPN range 438/100mL
17
33
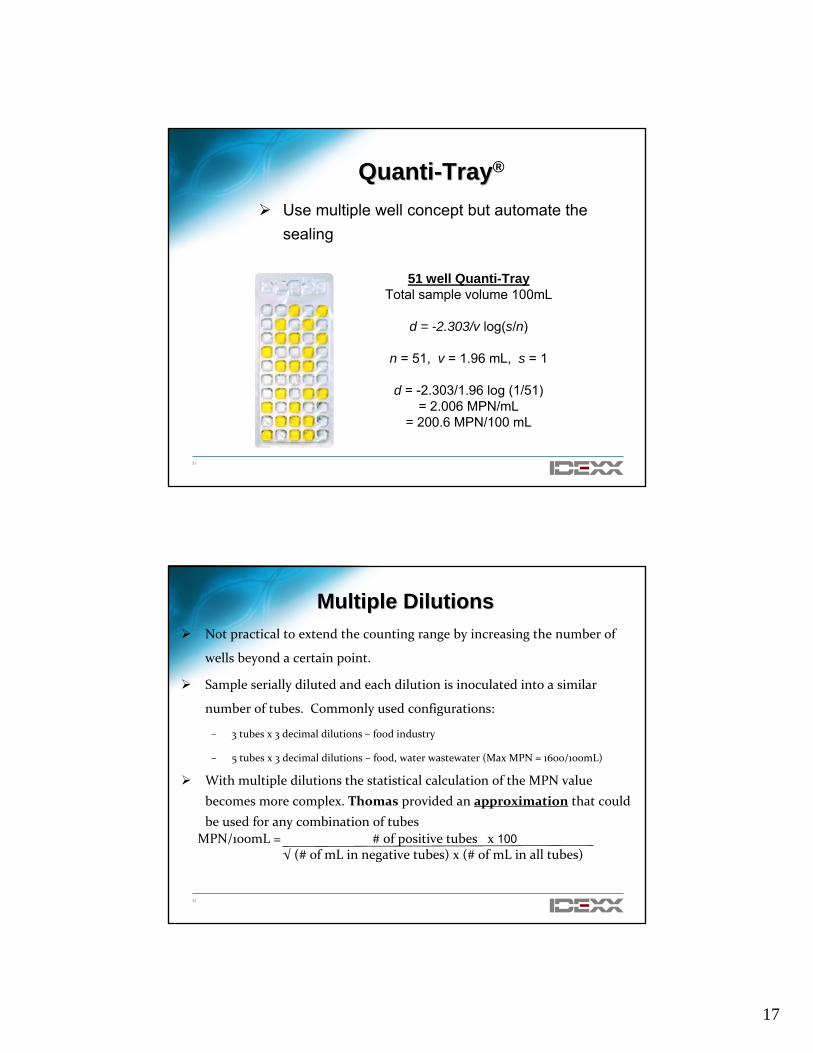
QuantiQuanti--TrayTray®
Use multiple well concept but automate the sealing
51 well Quanti-TrayTotal sample volume 100mL
d = -2.303/v log(s/n)
n = 51, v = 1.96 mL, s = 1
d = -2.303/1.96 log (1/51)= 2.006 MPN/mL
= 200.6 MPN/100 mL
34
Multiple DilutionsMultiple DilutionsNot practical to extend the counting range by increasing the number of
wells beyond a certain point.
Sample serially diluted and each dilution is inoculated into a similar
number of tubes. Commonly used configurations:
– 3 tubes x 3 decimal dilutions – food industry
– 5 tubes x 3 decimal dilutions – food, water wastewater (Max MPN = 1600/100mL)
With multiple dilutions the statistical calculation of the MPN value becomes more complex. Thomas provided an approximation that could be used for any combination of tubes
MPN/100mL = # of positive tubes x 100√ (# of mL in negative tubes) x (# of mL in all tubes)
18
35
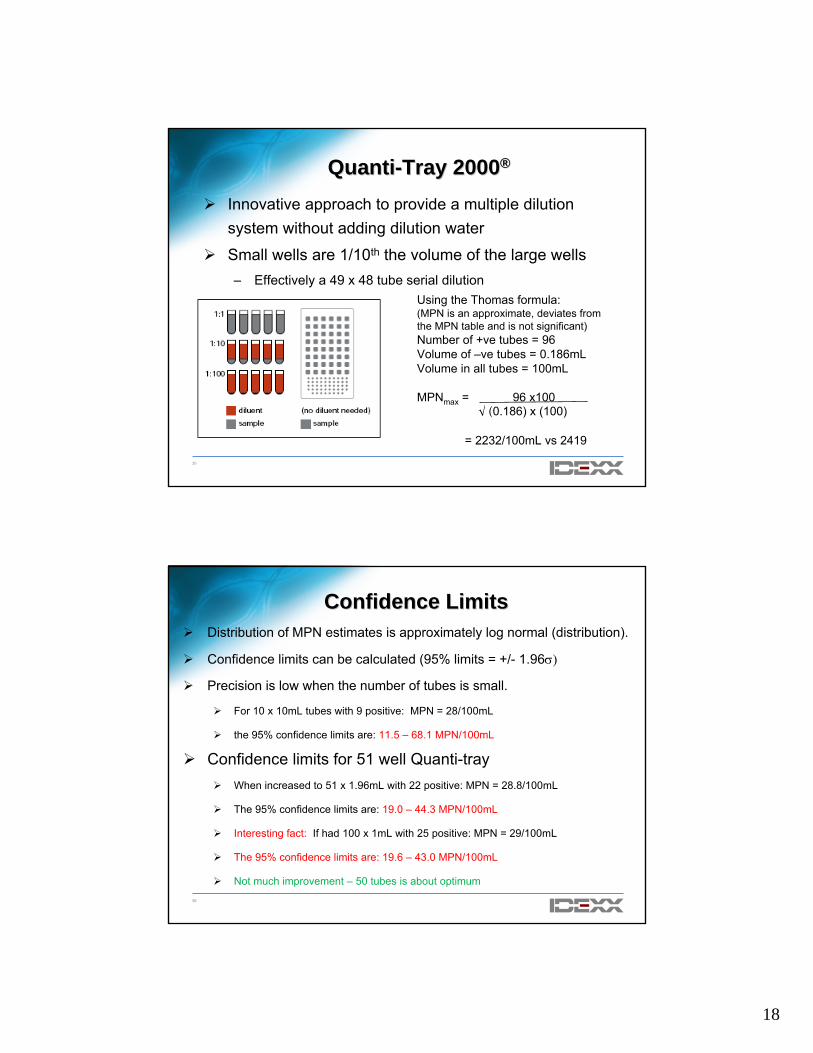
QuantiQuanti--Tray 2000Tray 2000®®
Innovative approach to provide a multiple dilution system without adding dilution water
Small wells are 1/10th the volume of the large wells– Effectively a 49 x 48 tube serial dilution
Using the Thomas formula:(MPN is an approximate, deviates from the MPN table and is not significant)Number of +ve tubes = 96Volume of –ve tubes = 0.186mLVolume in all tubes = 100mL
MPNmax = 96 x100√ (0.186) x (100)
= 2232/100mL vs 2419
36
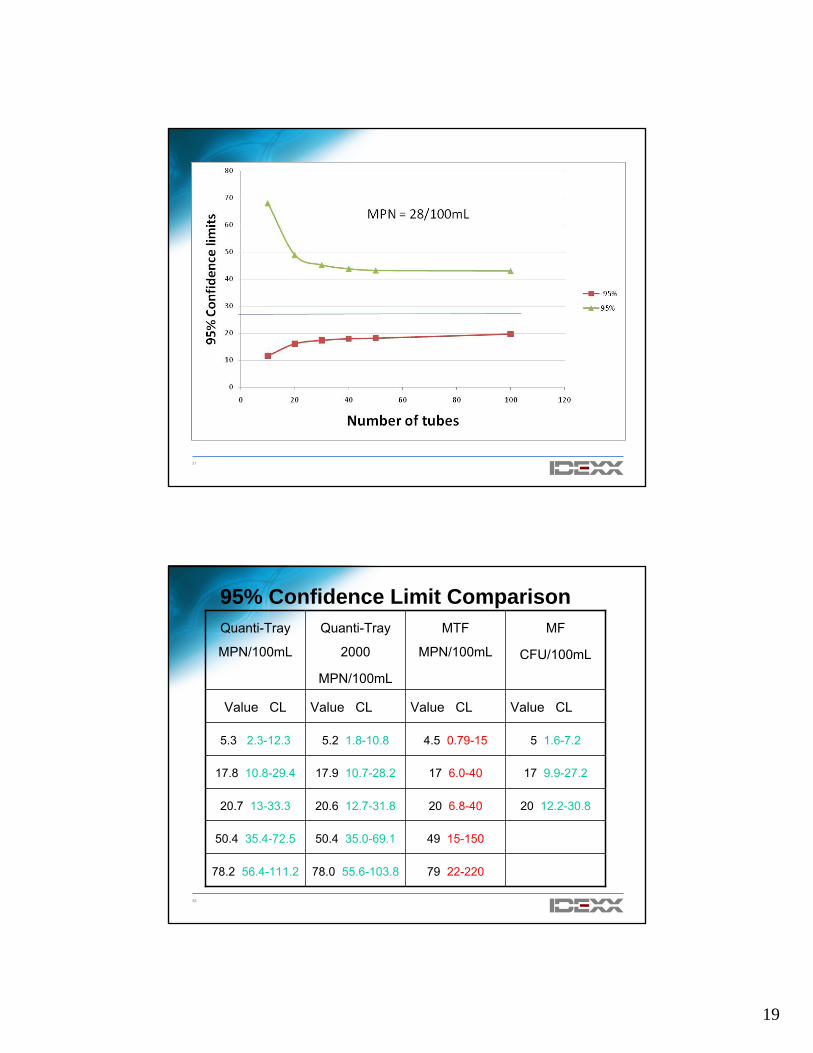
Confidence LimitsConfidence LimitsDistribution of MPN estimates is approximately log normal (distribution).
Confidence limits can be calculated (95% limits = +/- 1.96σ)
Precision is low when the number of tubes is small.
For 10 x 10mL tubes with 9 positive: MPN = 28/100mL
the 95% confidence limits are: 11.5 – 68.1 MPN/100mL
Confidence limits for 51 well Quanti-trayWhen increased to 51 x 1.96mL with 22 positive: MPN = 28.8/100mL
The 95% confidence limits are: 19.0 – 44.3 MPN/100mL
Interesting fact: If had 100 x 1mL with 25 positive: MPN = 29/100mL
The 95% confidence limits are: 19.6 – 43.0 MPN/100mL
Not much improvement – 50 tubes is about optimum
19
37
38
95% Confidence Limit Comparison
79 22-22078.0 55.6-103.878.2 56.4-111.2
49 15-15050.4 35.0-69.150.4 35.4-72.5
20 12.2-30.820 6.8-4020.6 12.7-31.820.7 13-33.3
17 9.9-27.217 6.0-4017.9 10.7-28.217.8 10.8-29.4
5 1.6-7.24.5 0.79-155.2 1.8-10.85.3 2.3-12.3
Value CLValue CLValue CLValue CL
MF
CFU/100mL
MTF
MPN/100mL
Quanti-Tray
2000
MPN/100mL
Quanti-Tray
MPN/100mL
20
39
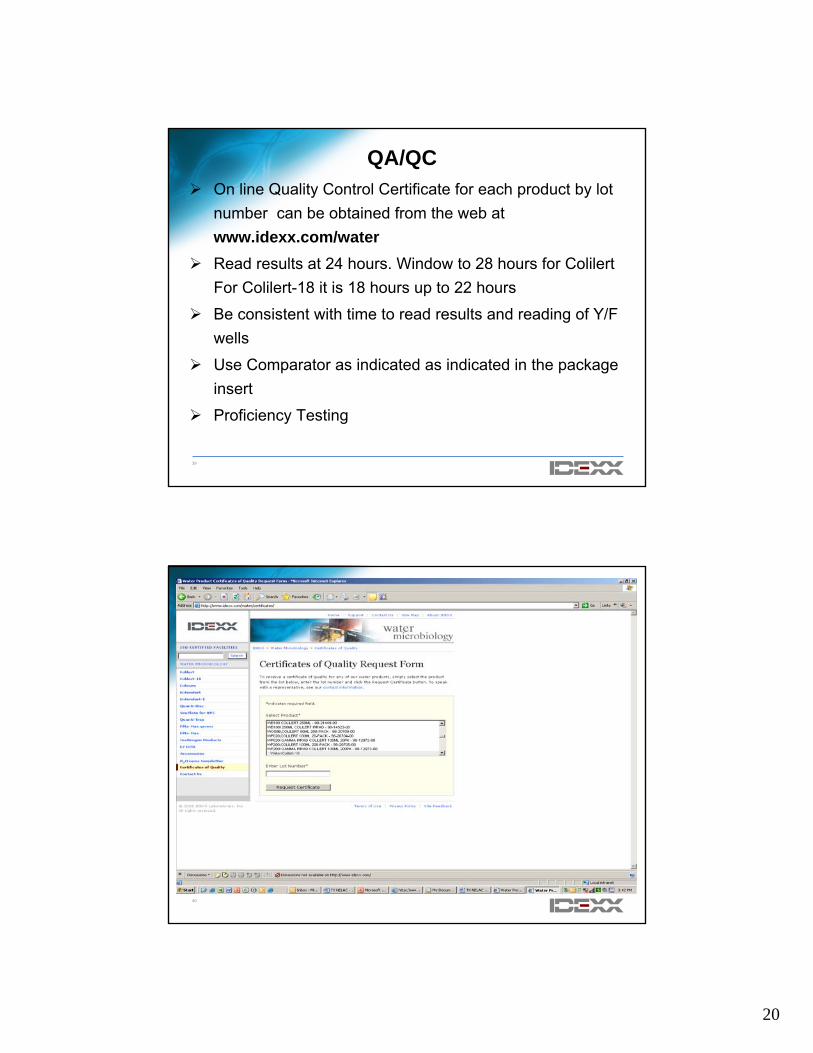
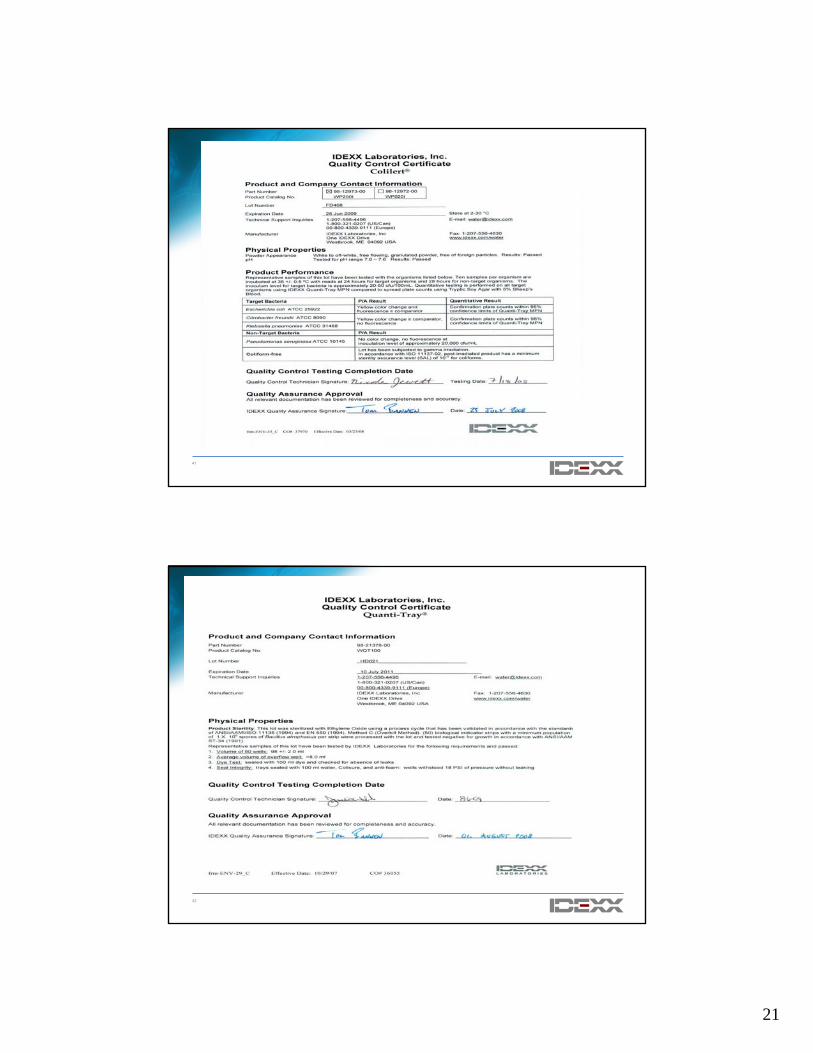
QA/QCOn line Quality Control Certificate for each product by lot number can be obtained from the web at www.idexx.com/waterRead results at 24 hours. Window to 28 hours for Colilert For Colilert-18 it is 18 hours up to 22 hours
Be consistent with time to read results and reading of Y/F wells
Use Comparator as indicated as indicated in the package insert
Proficiency Testing
40
21
41
42
22
43
44
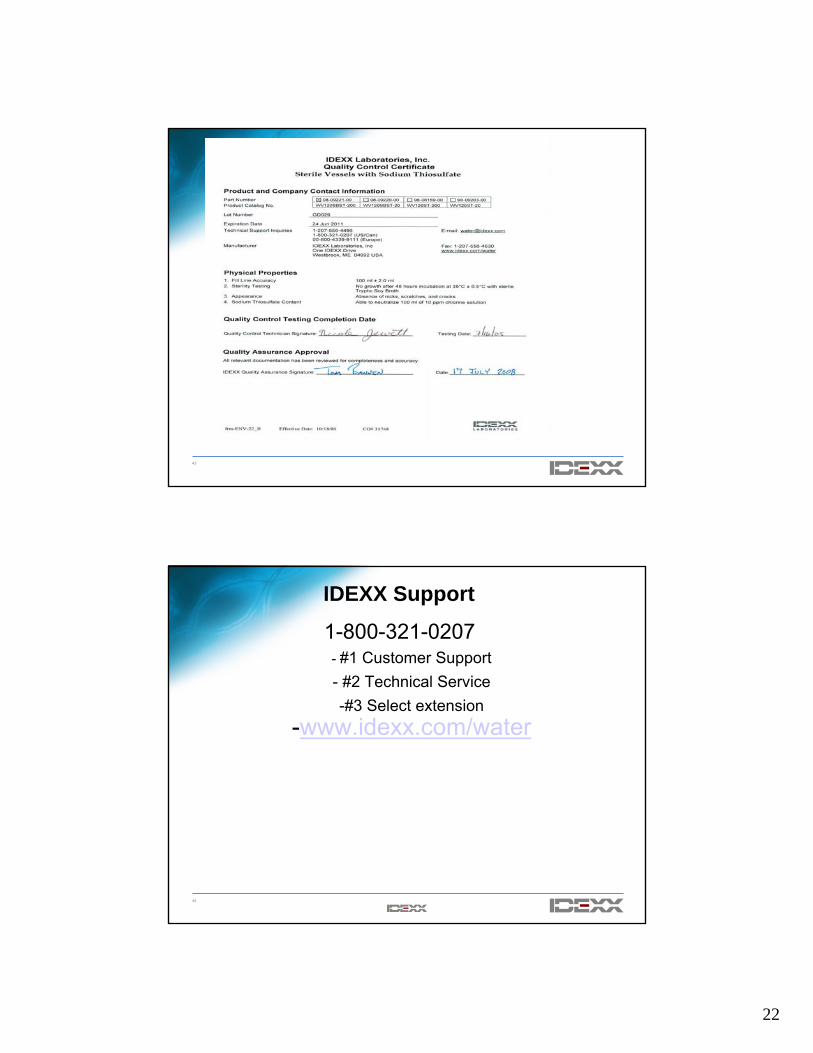
IDEXX Support
1-800-321-0207- #1 Customer Support- #2 Technical Service-#3 Select extension
-www.idexx.com/water

23
45
That’s all folks!
Thank You
Questions