testing the psychometric properties of the online student
TRANSCRIPT

TESTING THE PSYCHOMETRIC PROPERTIES OF THE ONLINE
STUDENT CONNECTEDNESS SURVEY
Tekeisha Zimmerman, B.S, M.B.A
Dissertation Prepared for the Degree of
DOCTOR OF PHILOSOPHY
UNIVERSITY OF NORTH TEXAS
August 2015
APPROVED:
Cathie Norris, Major Professor and Interim-Chair of the Department of Learning Technologies
Kim Nimon, Co-Major Professor Lynn Johnson, Minor Professor Jerry Wircenski, Program Coordinator Costas Tsatsoulis, Interim Dean of the
Toulouse Graduate School

Zimmerman, Tekeisha. Testing the psychometric properties of the Online Student
Connectedness Survey. Doctor of Philosophy (Applied Technology and Performance
Improvement), August 2015, 112 pp., 14 tables, 3 figures, references, 163 titles.
The Online Student Connectedness Survey (OSCS) was introduced to the academic
community in 2012 as an instrument designed to measure feelings of connectedness between
students participating in online degree and certification programs. The purpose of this study was
to examine data from the instrument for initial evidence of validity and reliability and to
establish a nomological network between the OSCS and similar instruments utilized in the field.
The study utilized sequential exploratory factor analysis- confirmatory factor analysis (EFA-
CFA) and correlational analysis to assess results of the data.
Students enrolled in online courses at higher education institutions located in the United
States served as the sample for this study. Three instruments were used during the study. The
OSCS was administered first so that the factor structure could be examined for factor validity.
Once confirmed, the Classroom Community Scale (CCS) and the Community of Inquiry Scale
(COI) served as the instruments to examine nomological validity through correlational analysis
of data.
This study provided evidence of factor validity and reliability for data from the OSCS.
After the initial EFA-CFA, the four-factor structure held, and 16 of the 25 original items
remained for nomological testing. Statistically significant correlations were demonstrated
between factors contained in the OSCS, CCS, and COI, providing further evidence of construct
validity. These results indicate that for the sample used in this study, the OSCS provides data
that are valid and reliable for assessing feelings of connection between participants in online
courses at institutions of higher learning.

Copyright 2015
by
Tekeisha Zimmerman
ii

ACKNOWLEDGEMENTS
Without God’s grace and mercy, I would have been unable to complete this journey. I
sincerely thank my committee for providing me with guidance and support during my doctoral
studies. I would like to thank Dr. Kim Nimon for helping me believe that I could conduct such a
deeply quantitative study, even after knowing that I did not completely understand what the term
alpha coefficient meant until I completed my first year in the program! Your mentorship and
encouragement gave me confidence in my ability to think critically and to develop my own
voice. You challenged me to push myself, and thanks to you, I now approach my career with a
motto derived from your words to me: “You’re smart, and you can figure this out.”
I would like to thank Dr. Jeff Allen for giving me opportunities to hone my writing skills
and publish as part of the Center for Knowledge Solutions’ research group. With your
encouragement, I reached a major milestone along my graduate path—my first submission to an
academic conference. You also taught me how to “land some planes” so that I could finally
complete my dissertation.
I would also like to thank Dr. Lynn Johnson for supporting me during my first
publication in the area of distance learning. This support helped to pique my curiosity on the
subject matter and ultimately led to the selection of this topic as my final dissertation choice.
Finally, to my family and friends, thank you all. To my work team, I say thank you for
being my sounding board for the past 2 years; and thank you, Heather, for reading and editing
my manuscript multiple times and always last minute. To Eric, Mali, and Zoe, thank you for
understanding when Mommy needed “time to think.” Most importantly, to my husband Jay, I
want to thank you for being my rock, my protector, my friend, and the voice of reason
throughout this process. I could not have been achieved this goal without having you by my side.
iii

TABLE OF CONTENTS
Page
ACKNOWLEDGEMENTS ........................................................................................................... iii
LIST OF TABLES AND FIGURES ............................................................................................. vi
CHAPTER 1. INTRODUCTION ................................................................................................... 1
Background .............................................................................................................................. 1
Need for the Study ................................................................................................................... 4
Theoretical Framework ............................................................................................................ 6
Purpose of the Study .............................................................................................................. 10
Research Hypotheses ............................................................................................................. 11
Delimitations ......................................................................................................................... 15
Limitations ............................................................................................................................. 16
Definition of Terms ............................................................................................................... 17
Summary ................................................................................................................................ 19
CHAPTER 2. LITERATURE REVIEW ...................................................................................... 20
Development of the OSCS .................................................................................................... 20
Student Connectedness Theories ........................................................................................... 22
Summary ................................................................................................................................ 32
CHAPTER 3. METHODOLOGY ................................................................................................ 34
Study 1 ................................................................................................................................... 34
Study 2 ................................................................................................................................... 45
Summary ................................................................................................................................ 51
CHAPTER 4. RESULTS .............................................................................................................. 52
Study 1 ................................................................................................................................... 52
Study 2 ................................................................................................................................... 58
CHAPTER 5. FINDINGS, RECOMMENDATION, AND IMPLICATIONS ............................ 69
Discussion of Findings .......................................................................................................... 69
Limitations and Delimitations and Recommendations for Future Research ......................... 75
Implications for Theory and Practice .................................................................................... 79
Conclusion ............................................................................................................................. 85
iv

APPENDIX A. IRB DOCUMENTATION .................................................................................. 87
APPENDIX B. PRE-SURVEY NOTIFICATION EMAILS ....................................................... 90
REFERENCES ............................................................................................................................. 93
v

LIST OF TABLES AND FIGURES
Tables
Page
Table 1.1. Research Papers Citing the OSCS Study ....................................................................... 5
Table 3.1. Fit Indices and Acceptable Thresholds ........................................................................ 43
Table 4.1. EFA Pattern/Structure Matrix and Reliabilities for Original and Revised OSCS ....... 54
Table 4.2. EFA Communalities .................................................................................................... 55
Table 4.3. CFA Factor Loadings for Measurement Model ........................................................... 56
Table 4.4. CFA Fit Indices for Measurement Model .................................................................... 57
Table 4.5. AVE and Discriminant Validity .................................................................................. 58
Table 4.6. Study 2 Data Screening................................................................................................ 60
Table 4.7. Study 2 CFA Factor Loadings for Measurement Model ............................................. 61
Table 4.8. Study 2 CFA Fit Indices for Measurement Model ...................................................... 62
Table 4.9. Study 2 AVE and Discriminant Validity ..................................................................... 62
Table 4.10. Alpha Coefficients, Means, and Standard Deviations for OSCS, COI, and CCS ..... 63
Table 4.11. Correlations between Factors in the OSCS, COI, and CCS ...................................... 64
Table 4.12. Results of Hypotheses Predicted for Study 2............................................................. 67
Figures
Page
Figure 1.1. Theoretical model to test OSCS nomological network. ............................................. 11
Figure 1.2. Hypothesized model for OSCS nomological network. .............................................. 14
Figure 4.1. Final model for OSCS nomological network. ............................................................ 68
vi

CHAPTER 1
INTRODUCTION
Background
The struggling economy and increased competition in the job market have helped
intensify enrollment in online classes at higher education institutions over the past 5 years
(Sheehy, 2012). This growth has led to an upsurge in research into factors that result in student
success in online classes, most notably online student connectedness (Garrison & Arbaugh,
2007; Dawson, 2006; Exter, Korkmaz, Harlin, & Bichelmeyer, 2009; Ouzts, 2006). Online
student connectedness refers to human interactions in computer-mediated learning environments
that allow individuals to participate comfortably in group communication while simultaneously
forming social relationships within the group (Galambos, Abelson, & Black, 1986; Nye &
Simonetta, 1996). The ability to understand how students interact and succeed in online courses
is critical because online learning is expected to be a vital part of long-term strategies for many
higher education institutions (Sheehy, 2012). The need to study factors related to online
connectedness has been addressed by several authors (Rovai, 2002a; Slagter van Tyron &
Bishop, 2006, 2009; Shin, 2003; Tu & McIsaac, 2002). However, a review of the contemporary
literature revealed limited initiatives to design and develop instruments to measure the concept of
online student connectedness (Bolliger & Inan, 2012).
Factors that impact online student connectedness have been debated in the literature for
several years (Bolliger, 2004; Ke, 2010; Kreijns, Kirschner, Jochems, & Van Buuren, 2004; So
& Brush, 2008). It is argued that feelings of connectedness for students in fully asynchronous
online courses affect satisfaction and learning outcomes (Arbaugh & Benbunan-Fich, 2007;
Bolliger, 2004; Gunawardena & Zittle, 1997; Kim, Kwon, & Cho, 2011; Zembylas, Theodorou,
1

& Pavlakis, 2008). While research has established the importance of connectedness among
online students (Bolliger, 2004; Drouin, 2008), few instruments have been developed to study
factors associated with online student connectedness. A critical review of the contemporary
literature yielded four instruments that attempt to measure student connectedness in online
settings: the Classroom Community Scale (CCS; Rovai, 2002a), the Community of Inquiry Scale
(COI; Arbaugh et al., 2008), the Social Perceptions in Learning Context Instrument (SPLCI;
Slagter van Tyron & Bishop, 2012) and the Online Student Connectedness Survey (OSCS;
Bolliger & Inan, 2012).
Rovai (2002a) developed the CCS to measure students’ sense of community in a learning
environment. Subscales were shown to measure social community and learning community, but
a test of the psychometric properties revealed that the CCS might be best suited for graduate
students (Barnard-Brak & Shiu, 2010). While the CCS measures the relationship between
students as it relates to sense of community and perceived learning, it ignores the importance of
relationships that students build with the course facilitator and their need for comfort with
technology. Evidence suggests that students' feelings toward the facilitator and their level of
comfort with technology are critical factors in developing feelings of social connectedness in
online educational settings (Akyol & Garrison, 2008; Bolliger, 2004; Bolliger & Inan, 2012;
Garrison & Arbaugh, 2007; Moore, 1989).
Arbaugh et al. (2008) developed the COI to measure the degree to which social presence,
cognitive presence, and teacher presence constitute a sense of community. Factor analysis for the
COI supported the idea of teaching presence as a construct, but it also suggested inconsistencies
about whether teaching presence measured one or two factors (Bangert, 2009). While the feeling
of community is one facet measured by the COI through its social presence factor, the
2

instrument’s purpose is to examine how features of written language promote critical thinking in
computer-mediated learning environments (Arbaugh & Benbunan-Fich, 2007). Therefore, it can
be argued that the COI is better suited to measure perceived learning than feelings of online
student connectedness.
Slagter van Tyron and Bishop (2012) introduced the SPLCI to measure students’
perception of social connectedness and group social structure in online courses. By design, the
instrument does not explore learner course satisfaction or evaluation of the instructor, both of
which have been identified as strong contributors in building feelings of online student
connectedness (Akyol & Garrison, 2008; Bolliger, 2004; Bolliger & Inan, 2012; Garrison &
Arbaugh, 2007; Moore, 1989). While the instrument examines aspects of social connectedness
among students enrolled in online courses, the wording of the items was applicable to social
connectedness among students participating in any learning context (Slagter van Tyron &
Bishop, 2012). Additionally, evidence of validity and reliability has not been established for data
from this instrument, which is critical for instruments included in nomological network studies
(Holton, Bates, Bookter, & Yamkovenko, 2007). For these reasons, the SPLCI will not be
utilized as part of this study.
In 2012, Bolliger and Inan introduced the OSCS, which purports to measure feelings of
connectedness between students in online degree and certification programs. The OSCS
examines multiple factors attributed to the development of online student connectedness.
Because the OSCS is a newly developed instrument, evidence of factorial validity is limited, and
a nomological network has not been established. Establishing a set of constructs related to online
student connectedness that are generalizable to a variety of audiences would facilitate discussion
3

in both the academic and practitioner communities and allow for studies of this phenomenon
across disciplines.
Need for the Study
The Babson Survey Research Group reported that, as of 2013, 7.1 million college
students in the United States were taking at least one fully online course (Allen & Seaman,
2014). This number represents nearly a third of the total enrollment at degree-granting
postsecondary institutions (NCES, 2012), and it is expected to continue to grow through 2021.
Online courses offer attractive benefits for students including flexibility and convenience.
Despite the benefits and projected growth of online course offerings, this learning format is not
without problems. Students enrolled in online courses are 10%–20% more likely to drop out
(Carr, 2000). One of the main reasons cited is the feeling of isolation from peers and instructors
during the course (Curless, 2004; Randolph & Crawford, 2013; Xu & Jaggers, 2011). Randolph
and Crawford (2013) noted that this attrition has a negative financial impact on the institution
and a devastating psychological effect on the students who do not complete the course.
A second element supporting the need for the study is the promise that it can hold for
online teaching above and beyond the CCS and COI. As discussed earlier, online connectedness
between students in online higher education environments includes multiple facets such as peer-
to-peer relationships, student-to-instructor relationships, comfort with technology, and perceived
learning (Akyol & Garrison, 2008; Arbaugh & Benbunan-Fich, 2007; Bolliger, 2004; Bolliger &
Inan, 2012; Gunawardena & Zittle, 1997; Zembylas, Theodorou, & Pavlakis, 2008). The OSCS
is the first known instrument designed to measure each of these areas as it relates to feelings of
connectedness in online higher education. Therefore, its use in research can provide insight into
4

the theoretical and practical applications of methods for the design and implementation of
effective online courses.
A final element supporting the need for this study is the fact that the OSCS is beginning
to gain notoriety, and it is being used to support research in the area of online student
connectedness. A search of Google Scholar, EBSCO Host, and ABI/Inform revealed that, since
its introduction to the academic community in 2012, the OSCS study has been cited in six known
research papers. Of these six papers, only one (Ford & Inan, 2013) used the instrument as part of
quantitative research. In that study, the author reported, but did not calculate, the OSCS data
reliability. Rather, reliability estimates from the original validation study (Bolliger & Inan, 2012)
were reported. The remainder of the papers referenced the underlying construct of online student
connectedness. For data from any instrument to be used to support research, empirical evidence
of its construct validity is highly recommended (Cronbach, 1971). Table 1.1 summarizes the
information related to the use of the OSCS study in research papers.
Table 1.1
Research Papers Citing the OSCS Study
Authors Year Type Purpose of OSCS Inclusion Ford & Inan 2013 Conference Proceeding Determine online student connectedness
for secondary math students; instrument used
Randolph & Crawford
2013 Journal Article Listed as an instrument that measures sense of community in online courses
Ozturk & Ozcinar 2013 Journal Article Discuss isolation as a problem in online learning
Grau-Valldosera & Minguillon
2014 Journal Article Discuss dropout reasons for students in online educational courses
Irani, Wilson, Slough, & Reiger
2014 Journal Article Discuss lack of connectedness among students as a problem in online learning
Salyers, Carter, Carter, Myers, & Barrett
2014 Journal Article Discuss lack of student familiarity with online technology
5

In summary, online course enrollment will continue to grow, and it can be deduced from
the literature that these course offerings will become an integral part of the financial strategy for
higher learning institutions (Allen & Seaman, 2014; Randolph & Crawford, 2013). Online
student connectedness has been linked to learning satisfaction outcomes (Arbaugh & Benbunan-
Fich, 2007) and course retention (Zembylas, Theodorou, & Pavlakis, 2008). Therefore, the
ability to measure feelings of online connectedness using a research-quality instrument is vital to
both researchers and practitioners. Based on a review of instruments designed to measure
feelings of connectedness, the OSCS may be the first one designed specifically for participants in
online educational settings. This study will examine OSCS data for evidence of validity and
reliability in measuring these feelings of connectedness exclusively in the online environment.
Specifically, convergent validity and discriminant validity of data from the OSCS have not been
tested and will be examined as part of this study. Assuming that the examination of validity and
reliability confirms the data from the OSCS, a nomological network will then be tested. This
research will add to the body of work related to factors that affect student performance in
distance learning courses (Garrison, 2000; Randolph & Crawford, 2013; Rodriguez, Ooms, &
Montanez, 2008).
Theoretical Framework
Five theories related to online student connectedness will inform the theoretical model
used to test the nomological network for the OSCS. The foundational theory driving this study is
e-mmediacy (Slagter van Tyron & Bishop, 2006) because it focuses on a wide scope of factors
that facilitate social connectedness in online settings. Walther’s social information processing
theory (1992) is the second theoretical viewpoint. Social information processing provides a
relevant theoretical lens because it offers insight into how people process information in a
6

computer-mediated environment. As with e-mmediacy, social information processing examines
multiple factors that impact social connection among learners. Contributing to the foundation of
the nomological network are McMillan and Chavis’ (1986) sense of community theory;
Garrison, Anderson, and Archer’s (2000) community of inquiry theory; and Short, Williams, and
Christie’s (1976) social presence theory. Both sense of community theory and community of
inquiry theory are supported by published instruments. These instruments will be used to
statistically examine the nomological network for data from the OSCS. Because this research is
concerned with establishing convergent and discriminant validity and constructing a nomological
network for the OSCS, the exploration of multiple theories is necessary.
Social Presence Theory
Short, Williams, and Christie (1976) defined social presence as “the degree of salience of
the other person in the interaction and the consequent salience of the interpersonal relationships”
(p. 65). In other words, social presence defines the extent to which a person is perceived as being
“real” in computer-mediated communication (CMC) settings (Gunawardena & Zittle, 1997).
Social presence theory asserts that the ability to transmit information used in face-to-face
communications (i.e., facial expression and tone) impacts the degree to which a person receiving
a message in a CMC environment is perceived to be involved in the communication. Social
presence theory also focuses on the communication medium and recognizes that communication
is only effective if the communication medium has the appropriate social presence required for
the level of interpersonal involvement required. As it relates to online student connectedness,
social presence has been positively correlated to learner satisfaction in online courses
(Gunawardena & Zittle, 1997).
7

Social Information Processing Theory
Social information processing theory explains how people get to know one another and
how they develop and manage relationships in CMC settings without nonverbal cues (Walther,
1992). The theory asserts that the amount of time it takes to observe and decode information
from textual cues impacts the feeling of connection among participants in CMC settings
(Walther, 1992). Social information processing theory contends that the medium itself is not the
reason that connection among participants is limited. Rather, the time it takes to transmit the
message and the way the message is interpreted by others determines if a connection will take
place. The passage of time and the inclusion of frequent interactions initiated by either
participants or a facilitator can overcome the fact that participants do not communicate face to
face (Walther, 1992; 1993). Further, forming a social connection can happen, but it will take
longer in CMC settings than in traditional face-to-face settings (Olaniran, Rodriguez, &
Williams, 2011).
E-mmediacy Theory
E-mmediacy is “the feeling of social connectedness one has with fellow online class
participants (classmates, instructor, and teaching assistant) through computer mediated
experiences” (Slagter van Tyron & Bishop, 2006, p. 293). Introduced in 2006, e-mmediacy
theory has been used to explain feelings of social connectedness that students and faculty acquire
through the technologically enhanced online learning environment. E-mmediacy theory draws
from Mehrabian’s (1969) theory of immediacy, which examined the verbal and nonverbal cues
people use to reduce the perception of physical distance between them in face-to-face
communication. Building on Mehrabian’s (1969) work, e-mmediacy asserts that the same
8

strategies used to reduce the perception of distance in face-to-face communication are even more
important in online environments because participants are actually separated by time and space
(Freitas, Meyers, & Avtgis, 1998). These strategies include frequent interactions, the
encouragement of participation, and the ability of the instructor to provide support for
technology. The inclusion of these strategies is linked to learners’ positive feelings about the
course, fellow students, and the instructor (Slagter van Tyron & Bishop, 2006).
Sense of Community Theory
Sense of community theory is defined as “a feeling that members have of belonging, a
feeling that members matter to one another and to the group, and a shared faith that members’
needs will be met through their commitment to be together” (McMillan & Chavis, 1986, p. 9).
The theory focuses on the experience of community as opposed to its structure, formation, and
setting. Sense of community was first applied to online education by Rovai (2002a), who
asserted that connectedness between students could occur in a virtual classroom setting. Similar
to both social information processing and e-mmediacy, sense of community theory minimizes
the limiting factors related to the electronic communication medium, such as isolation and the
inability to meet face to face, and focuses more on the factors such as frequent interactions and
group assignments, which lead to building a social connection between participants. Rovai
(2002a) recognized that the social presence of the instructor, which included frequent
interactions and the organization of small group activities, mitigated feelings of isolation among
students. Further, Rovai (2002a) claimed that the establishment of this connection would lead to
a decrease in attrition rates in online educational settings.
9

Community of Inquiry Theory
Community of inquiry theory is defined as “a process model of online learning which
views the online educational experiences as arising from the interactions of three presences—
social presence, cognitive presence, and teaching presence” (Swan, Garrison, & Richardson,
2009, p. 45). Dewey (1959) described the elements of inquiry and community as being at the
center of any worthwhile learning experience. He asserted that it was the elements of inquiry and
sense of community that led learners to take responsibility for their knowledge and to work
independently toward learning achievements. Garrison, Anderson, and Archer (2000) built upon
this initial theory by viewing inquiry and community within the framework of online learning. It
is this version that will be referenced throughout this study. Community of inquiry theory
investigates how written language used in computer conferencing activities promotes
critical/higher-order thinking (Garrison, Anderson, & Archer, 2000). The framework and theory
provide insight into the complexities of both online and blended learning environments and
center on collaboration between teachers and students, who are viewed as the key participants in
the educational process.
Pending the outcome of Study 1, data from the OSCS will be examined for validity
against existing theories related to online student connectedness. Figure 1.1 depicts the
theoretical model informing the proposed nomological network.
Purpose of the Study
The purpose of this study is twofold and will be conducted in two parts. Study 1 will examine
factorial validity for OSCS data, confirm the factor structure of the refined set of items, and test
and report reliability of the scale scores. Pending the outcome of Study 1, Study 2 will seek to
test the nomological network for the instrument using the proposed theoretical model.
10

Conducting this study in two parts will allow the final items to be to be tested using an
independent sample. Replicating the confirmatory factor analysis on an independent sample
demonstrates the stability of the model across independent samples and is common in
psychometric studies (Gillaspy & Campbell, 2006; MacCallum, Roznowski, & Necowitz, 1992;
Petrie, Tripp, & Harvey, 2002).
Figure 1.1. Theoretical model to test OSCS nomological network.
Research Hypotheses
Study 1 seeks to examine factorial validity for the OSCS. The following hypotheses will
be tested against the factor structure of the OSCS:
H1a: Pattern coefficient values for data from each of the four subscales will be > .70 (Hair
et al., 2010).
11

H1b: Reliability coefficient values for data between the overall instrument and data from
each subscale will be .80 or higher (Nunnally, 1978; Henson, 2001).
H1c: Factor structure scores for the OSCS will yield good fit indices: CMIN/df > .30,
Tucker-Lewis index (TLI) >.95, comparative fit index (CFI) > .95, root mean
square error of approximation (RMSEA) < .70, standardized root mean square
residual (SRMR) < .08 (Byrne, 2010; Hooper, Coughlan, & Mullen, 2008; Kline,
2005).
Study 2 seeks to replicate the confirmed factor structure from Study 1 and provide
evidence of a nomological structure for the OSCS. Fit indices will be evaluated using the same
guidelines from Study 1: CMIN/df > .30, TLI > .95, CFI > .95, relative fit index (RFI) > .09,
RMSEA < .70, SRMR < .08 (Byrne, 2010; Hooper, Coughlan, & Mullen, 2008; Kline, 2005).
To establish a nomological network, the strength of relationships for observed scale scores
between factors from the OSCS and factors from the identified related constructs (COI & CCS)
will be examined. Thresholds established in Ward, Fischer, Lam, and Hall (2009) will be used to
assess these relationships. Strong correlation will be indicated by .50 < | r |; moderate correlation
will be indicated by .30 < | r | < .50; and weak correlation will be indicated by .10 < | r | < .30. As
it relates to the OSCS, theory supports the following hypotheses:
H2: Data from the OSCS will be positively correlated with data from the CCS.
H2a: Data for comfort from the OSCS will demonstrate a strong correlation with data for
connectedness and data for learning from the CCS.
H2b: Data for community from the OSCS will demonstrate a strong correlation with data
for connectedness and data for learning from the CCS.
12

H2c: Data for facilitation from the OSCS will demonstrate a strong correlation with data
for learning and a moderate correlation with data for connectedness from the CCS.
H2d: Data for interaction and collaboration from the OSCS will demonstrate a strong
correlation with data for connectedness and data from learning from the CCS.
H3: Data from the OSCS will be both positively and negatively correlated with data from
the COI.
H3a: Data for comfort from the OSCS will demonstrate a strong positive correlation with
data from social presence and data for teaching presence from the COI.
H3b: Data for community from the OSCS will demonstrate a strong positive correlation
with data for social presence and a moderate positive correlation with data from
teaching presence from the COI.
H3c: Data for facilitation from the OSCS will demonstrate a strong positive correlation
with data from teaching presence and a moderate positive correlation with data for
social presence from the COI.
H3d: Data for interaction and collaboration from the OSCS will demonstrate a strong
positive correlation with data for teaching presence and a moderate positive
correlation with data for social presence from the COI.
H3e: Data for comfort and facilitation from the OSCS will demonstrate a strong positive
correlation with data for cognitive presence from the COI.
H3f: Data for community and interaction and collaboration from the OSCS will
demonstrate a weak positive correlation with data for cognitive presence from the
COI.
13

Figure 1.2. Hypothesized model for OSCS nomological network.
Key OSCS: Online Student Connectedness Survey COI: Community of Inquiry Scale CCS: Classroom Community Scale Directional Paths Strong Correlation: Moderate Correlation: Weak Correlation:
14

Delimitations
1. This study will use participants currently enrolled in at least one fully online course at a 4-
year, public higher learning institution located in the United States. Online courses are
defined as courses where all of the content is delivered using technology and there are no
required face-to-face meetings (Dickson & Osborn, 2011).
2. Data will be collected at one time for each study and, therefore, may suffer from common
method bias. Tests for common method bias will be conducted as described in the
methodology section of this manuscript.
3. A research panel company will be used to identify participants. The panel will be given
selection criteria as outlined in the sample section in the methodology section of this
manuscript (Rao, Kaminska, & McCutcheon, 2010).
4. Participants may be enrolled as undergraduate-level or graduate-level students.
5. Self-report data will be used in the study.
6. Demographic data will be gathered but will not be considered beyond ensuring that
participants meet the requirements of this study.
7. This study will be limited to self-report measures by students participating in fully online
courses. Although instructors are also participants in these courses, they will not be recruited
to complete the survey.
8. To increase generalizability of the results, this study will be open to students enrolled in
traditional, trimester, and quadmester semester formats. Traditional semester formats are
defined as academic terms lasting between 14–20 weeks (NCES, 2012). Trimester terms last
between 8–12 weeks, and quadmester formats are those that last between 4–12 weeks
(NCES, 2012). While early research suggested a difference in academic rigor and teaching
15

standards for courses with shorter semesters (Allen, Miller, Fisher, & Moriarty, 1982), more
recent studies have shown that no difference exists in learning outcomes and student
satisfaction based on the length of the term (Anastasi, 2007).
9. Theory suggests that the passage of time and the frequency of interactions increase the
connection between students in CMC environments (McMillan & Chavis, 1986). Therefore,
participants must be enrolled in courses that require student-to-student interaction (i.e., study
groups, group projects, and required discussion postings).
Limitations
1. Differences in teaching methods and style could affect how participants respond to the
survey (Bolliger, 2004).
2. Other factors, including the level of experience with technology used in online courses, could
influence participants’ responses to the survey questions and the results obtained
(Zimmerman, 2012).
3. Participants may be enrolled in more than one online course; therefore, they might
concentrate on more than a single course experience when responding to the surveys.
4. In some cases, students may prefer to enroll in a particular course in a face-to-face format,
but the college only offers the course in an online setting, thereby forcing students into the
online student population.
5. Self-report data may suffer from inaccuracy because of recall problems and social
desirability effects (Crockett, Schulenberg, & Petersen, 1987).
6. Research suggests that favorable responses for the online course format increase each time a
student completes an online course (Allen & Seaman, 2014; Xu & Jaggers, 2011). Although
16

information on the number of online courses completed by each participant will be gathered,
the researcher will not moderate for this phenomenon during the study.
7. Responses will only come from students who agree to complete the survey. This limitation
could result in non-response bias in the data (Lineback & Thompson, 2010).
Definition of Terms
This section contains a list of terms that will be introduced during this study. Each term
includes a citation to a full reference that can be accessed in the event that the reader needs more
clarification on the topic.
Common method bias: Variance that is attributable to the measurement method rather
than to the constructs the measures are assumed to represent (Podsakoff, MacKenzie, & Lee,
2003).
Community of inquiry theory (COI): Factors related to the sense of community a
participant develops in a learning environment (Garrison, Anderson, & Archer, 2000).
Computer-mediated communication (CMC): Synchronous or asynchronous electronic
mail and computer conferencing by which senders encode messages that are relayed from
senders’ computers to receivers’ computers (Walther, 1992).
Confirmatory factor analysis (CFA): A statistical technique used to verify the factor
structure of a set of observed variables (Suhr, 2006).
Convergent validity: Evidence to show that measures that should be related are in reality
related (Trochim, 2000).
Discriminant validity: Evidence to show that measures that should not be related are in
reality not related (Trochim, 2000).
17

E-mmediacy theory: Feelings of social connectedness that one has with fellow online
class participants (classmates, instructor, teaching assistant) through computer-mediated
experiences (Slagter van Tyron & Bishop, 2006).
Exploratory factor analysis (EFA): A statistical method of analysis used to explore the
possible underlying factor structure of a set of observed variables (Child, 1990).
Immediacy theory: Any of several nonverbal communications, such as eye contact,
gestures, smiles, and humor, which are associated with subjective evaluations about the presence
of the teacher (Melrose, 2009).
Internal consistency: Measures whether items that propose to measure the same general
construct produce similar scores (Cronbach, 1951).
Nomological network: A representation of constructs in a study and their linkages
(Cronbach & Meehl, 1955).
Online course: A course where all of the content is delivered using technology and there
are no required face-to-face meetings (Dickson & Osborn, 2011).
Online student connectedness: Human interactions in computer-mediated learning
environments that allow individuals to participate comfortably in group communication while
simultaneously forming social relationships within the group (Galambos, Abelson, & Black,
1986).
Social presence theory: The feeling that others are involved in communicative interaction
(Short, Williams, & Christie, 1976).
Social information processing theory: Explains how people get to know one another
online without verbal cues and how they develop and manage relationships in a computer-
mediated environment (Walther, 1992).
18

Sense of community theory: Factors related to how participants develop a sense of
connection in a virtual classroom setting (Rovai, 2002a).
Social desirability theory: Refers to the need of a respondent to obtain approval by
responding in a culturally and socially acceptable manner (Edwards, 1957).
Summary
The anticipated growth of online courses and the issue of attrition among students in
these courses are elements that could impact the strategy of higher learning institutions. A lack of
social connection between students enrolled in this course format is one reason that has been
attributed to this attrition (Curless, 2004; Randolph & Crawford, 2013; Xu & Jaggers, 2011). For
these reasons, a viable method to measure online student connectedness is necessary. This
chapter provided background on the instruments found in the literature that attempt to measure
factors that impact student connectedness. The need for the study was established, a theoretical
framework was presented, and the purpose of the study was explained. The chapter concluded
with research hypotheses, limitations and delimitations of the study, and the definitions of the
terms found in the manuscript.
19

CHAPTER 2
LITERATURE REVIEW
This review of the literature explores the phenomenon of online student connectedness
and ties it to relevant constructs. It starts with an examination of the development of the Online
Student Connectedness Survey (OSCS) and highlights the need to examine the validity and
reliability of data from the instrument. Next, student connectedness theories are discussed. From
these theories, two instruments that will be used to assess the nomological network for the OSCS
will be examined, and empirical studies that provide support for this study’s hypotheses and
research model are put forth.
Development of the OSCS
In 2012, Bolliger and Inan introduced the OSCS in The International Review of Research
in Open and Distance Learning. The OSCS is purported to measure feelings of connectedness
between participants in online educational settings (Bolliger & Inan, 2012). The instrument was
created using a three-step process. Step 1 included an in-depth review of the literature associated
with academic environments and sense of isolation. From this review, the authors identified four
elements associated with student connectedness: 1) comfort, 2) community, 3) facilitation, and 4)
interaction and collaboration. Once factors related to online student connectedness were
identified, the authors developed 78 Likert-scale items that were reviewed for reliability by a
panel of four experts in the educational field from the United States as part of step 2. From this
reliability review, 48 items were retained. The authors then conducted a validation study to
narrow the items from 48 to 25. Principal components analysis (PCA) with oblimin rotation was
the selected exploratory factor analysis (EFA) method. Factor retention methods included the
eigenvalues greater than one rule, scree test, total variance, and residuals. Internal reliability for
20

the entire survey was reported as α = .98, and the reliability measures for the four subscales were
as follows: comfort (α = .97), community (α = .96), facilitation (α = .94), and interaction and
collaboration (α = .97). It is important to note that these reliability estimates are considerably
higher than acceptable average scores as alphas during psychometric testing have been reported
to generally range between .75 to .90 (Henson & Roberts, 2006; Nunnally, 1978).
In step 3, a pilot study using the 25-item scale was conducted with 146 students enrolled
in an online information technologies certificate program at a Turkish university. The pilot
confirmed the four-factor structure and supported retaining all 25 items of the scale. However,
several limitations influenced generalizability of the results. First, the pilot study utilized a small
single institution sample (n = 146), which represents a 5:1 response ratio based on the number of
survey items. A 10:1 response ratio is the general recommendation for studies including factor
analysis (Arrindell & van der Ende, 1985; Everitt, 1975; Garson, 2008). Second, all participants
were enrolled as engineering majors, a predominately male subject area. This sample yielded
atypical demographic statistics, where 70% of the respondents were male. Because college
enrollment for women outranks enrollment for men by a ratio of 1.4:1 (Hausmann, Tyson, &
Zahidi, 2011), the sample used in the pilot study is not representative of the overall college
population. Next, the original study was conducted at a Turkish university. Although the original
survey underwent a test for semantic equivalence across languages (Bolliger & Inan, 2012), the
final version was only distributed to one person from the target audience for a pretest prior to
distribution. The suggested number of participants needed to pretest a translated instrument prior
to distribution is 4–40 people from the target audience (Beaton, Bombardier, Guillemin, &
Ferraz, 2002; Forsyth, Kudela, Levin, Lawrence, & Willis, 2006; Harkness, 2003). Finally, the
researchers for the pilot study only shared limited results of their factor analysis and excluded the
21

full pattern matrix, thereby affecting the ability of other researchers to make independent
interpretations of the data (Henson & Roberts, 2006). Empirical evidence to support validity and
reliability is essential for any testing instrument (Cronbach, 1971; Fishman & Galguera, 2003;
Urbina, 2004). Therefore, additional testing and full disclosure of the results are necessary to
operationalize data generated from the OSCS. These reasons support the first set of hypotheses
for this study:
H1a: Pattern coefficient values for data from each of the four subscales will be > .70 (Hair
et al., 2010).
H1b: Reliability coefficient values for data between the overall instrument and data from
each subscale will be .80 or higher (Nunnally, 1978; Henson, 2001).
H1c: Factor structure scores for the OSCS will yield good fit indices: CMIN/df > .30,
Tucker-Lewis index (TLI) > .95, comparative fit index (CFI) > .95, root mean
square error of approximation (RMSEA) < .70, standardized root mean square
residual (SRMR) < .08 (Byrne, 2010; Hooper, Coughlan, & Mullen, 2008; Kline,
2005).
Student Connectedness Theories
Garrison (2000) asserts that theoretical frameworks and models are the cornerstone of
credibility and viability for a field of practice. Without them, the field will become stagnant
because the opportunity for research to expand the field is limited. Theories related to distance
learning have undergone a focal shift as researchers have transitioned from examining the
financial implications of distance learning to analyzing its educational benefits (Feenberg, 1999).
This transition highlighted the importance of establishing feelings of connectedness between
participants enrolled in distance learning courses (Arbaugh & Benbunan-Fich, 2007; Bolliger,
22

2004; Bolliger & Inan, 2012; Drouin, 2008; Gunawardena & Zittle, 1997; Kim, Kwon, & Cho,
2011; Zembylas, Theodorou, & Pavlakis, 2008). For example, Drouin (2008) investigated the
relationship between perceived sense of community, satisfaction, and achievement for 71
students in an online course. Sense of community was defined as “the feeling of belonging or
connectedness that is established among learners who have common interests and goals and
participate in joint activities” (Drouin, 2008, p. 279). The study found that sense of community
was positively correlated with satisfaction and achievement in the course. Students who reported
a sense of community were those who communicated with fellow students, frequently
participated in asynchronous discussion, and formed a connection with their classmates and
instructor during the course. Still, the field of distance education lacks a coherent understanding
of interrelated constructs associated with achieving online student connectedness and a validated
quality instrument for measuring these constructs (Bolliger & Inan, 2012; Garrison, 2000). To
address these gaps, Study 2 will attempt to identify a nomological network of constructs related
to achieving online student connectedness.
To begin a discussion on interrelated constructs associated with achieving connectedness
in an online learning setting, it is essential to select and review the influential theories and
empirical studies related to this concept. To identify these theories, a search using the key terms
student connectedness, online course, and community was performed in Google Scholar, EBSCO
Host, and ABI/Inform. This search yielded 41 articles. A review of these articles resulted in the
discovery of the five theories noted in this study as being related to factors influencing online
student connectedness. They are social presence, social information processing, community of
inquiry, sense of community, and e-mmediacy. In addition to the OSCS, these theories have
influenced two prominent, widely used, empirically tested instruments that purport to measure
23

student connectedness in learning environments: the Classroom Community Scale (CCS) and the
Community of Inquiry (COI) Scale.
The Classroom Community Scale (CCS)
Developed by Rovai (2002a), the CCS is a 20-item self-report instrument purported to
measure sense of community in online educational settings. Participants respond using a 5-point
Likert scale ranging from 1 (strongly agree) to 5 (strongly disagree). A search of the academic
databases EBSCO Host, Google Scholar, and ProQuest revealed that the CCS has been cited in
308 studies since its development in 2002. The scale is composed of two factors: learning and
connectedness. Both factors have been cited as promoting student connectedness (Rovai, 2002a).
Rovai (2002a) defined sense of community in online environments in terms of spirit,
trust, interaction, and commonality of an expectation of learning. These dimensions are
developed through social presence in the course, social equality, group facilitation, and teaching
style. Randolph and Crawford (2013) related these subscales to Bolliger and Inan’s (2012)
factors of interaction and collaboration, facilitation, and community. This proposed connection
suggests that there is a strong relationship between the CCS and the OSCS. Therefore, it is
hypothesized that:
H2: Data from the OSCS will demonstrate convergent validity with data from the CCS.
Relationship between the CCS and OSCS
The first scale of the CCS, learning, is defined as “the feeling that knowledge and
meaning are actively constructed within the community, that the community enhances the
acquisition of knowledge and understanding, and that the learning needs of its members are
24

being satisfied” (Rovai, 2002b, p. 201). Within the framework of the CCS, learning and
community are strongly linked. When participants feel a sense of community, trust begins to
develop, participants are more open to asking questions of one another to help support their
learning, and meaningful relationships begin to form (Dawson, 2006; Ni & Aust, 2008; Sadera,
Robertson, Song, & Midon, 2009). Community as it relates to the OSCS describes the feeling of
belonging (Bolliger & Inan, 2012) and has been tied to factors such as trust and connection
(Bolliger, 2004; Kim, Kwon, & Cho, 2011; Rovai, 2002a, 2002b). Students who feel a sense of
community can negate feelings of isolation, thus decreasing dropout rates and improving
learning outcomes (Northrup, 2002).
The second scale of the CCS, connectedness, is defined as “the feeling of belonging and
acceptance and the creation of bonding relationships” (Rovai, 2002b, p. 201). This feeling
manifests in verbal and nonverbal behaviors that help to personalize interactions and is viewed as
a positive factor in affecting learning outcomes. The OSCS addresses these feelings within the
factor of interaction and collaboration. The element of interaction and collaboration is described
as a two-way communication process that requires students to work collaboratively with one
another. This type of interaction inspires critical thinking and furthers knowledge (Bolliger &
Inan, 2012).
Both learning and connectedness are prominent factors in the theory of e-mmediacy
(Slagter van Tyron & Bishop, 2006). E-mmediacy takes it roots from social learning theory,
which argues that people learn best in environments where they can construct ideas and form
meaningful, collaborative interactions (Bandura, 1971). While learning is viewed as a cognitive
function, the formation of communities and a person’s perception of his or her role in this
community, also known as status, are critical to satisfaction and learning success (Slagter van
25

Tyron & Bishop, 2006). Once status is established, acceptable behaviors (norms) for interaction
are developed. Finally, role differentiation takes place among members within the community,
and the group’s social structure is adopted. Role differentiation refers to members being assigned
in the hierarchy as leaders, followers, or information seekers (Slagter van Tyron & Bishop,
2006).
E-mmediacy also examines how technology can both enhance and impede social
connectedness in online learning settings. It asserts that relationship building within online
educational settings is a function of the interactions between participants and lack of interaction
cannot be solely attributed to the fact that face-to-face communication does not exist. The
success of the learning environment is dependent on behaviors that reduce the perception of
distance. Mehrabian (1969) first identified these behaviors using the theory of immediacy. Here,
verbal and nonverbal gestures, such as smiles, eye contact, and personal recognition, were found
to motivate students to learn and develop positive experiences about the course and the instructor
(Christophel, 1990; Wilson & Taylor, 2001). E-mmediacy asserts that this same strategy should
be employed in online environments to help students develop feelings of connectedness (Slagter
van Tyron & Bishop, 2006). The OSCS refers to the enhancement of technology in online
educational settings as comfort and the subsequent relationship building as facilitation.
Comfort is defined by the authors as “experiencing contentment and security and comfort
with either integrated technologies or the learning environment” (Bolliger & Inan, 2012, p. 45).
Students who do not experience a feeling of comfort in an online educational environment tend
to become isolated and miss critical learning opportunities, but these feelings can be negated by
instructor intervention through facilitation (Bolliger & Inan, 2012; Shin, 2003). Facilitation
relates to behaviors demonstrated by instructors in an online educational environment, including
26

frequent messages and feedback on progress throughout the duration of the course. Instructor
participation has been linked to success outcomes, and studies have shown that students who are
more engaged are more active in the learning process (Moore, 1989; Slagter van Tyron, 2006).
Although instructor participation has been positively linked to perceived learning, it has merely
been implied as a factor in helping students experience a sense of connection with each other in
online educational settings (Young, 2006). Therefore, I deduced that data from facilitation from
the OSCS will demonstrate only a moderate relationship with data from connectedness from the
CCS.
Slagter van Tyron and Bishop (2006) identified four strategies to enhance e-mmediacy in
online educational settings: 1) stimulate frequent interactions during the course, 2) include
activities that manage pace and encourage participation, 3) supply support for technologies used
in the course, and 4) understand what it means to be a student in an online environment.
Research suggests that these four strategies appear to be synonymous with facilitation, comfort,
collaboration, and community (the same factors purported to directly affect student
connectedness according to the OSCS instrument) (Randolph & Crawford, 2013). To investigate
the strength of this connection, the following hypotheses are put forth regarding the relationship
between data from factors of the OSCS and the CCS:
H2a: Data for comfort from the OSCS will demonstrate a strong correlation with data for
connectedness and data for learning from the CCS.
H2b: Data for community from the OSCS will demonstrate a strong correlation with data
for connectedness and data for learning from the CCS.
H2c: Data for facilitation from the OSCS will demonstrate a strong correlation with data
for learning and a moderate correlation with data for connectedness from the CCS.
27

H2d: Data for interaction and collaboration from the OSCS will demonstrate a strong
correlation with data for connectedness and data from learning from the CCS.
The Community of Inquiry Scale (COI)
The COI is a 34-item self-report instrument that measures the dimensions of social
presence, cognitive presence, and teaching presence in learning environments (Arbaugh et al.,
2008). The scale was created to operationalize Garrison, Anderson, and Archer’s COI
framework, which was designed to “investigate how features of written language used in
computer conferencing activities promote critical/higher-order thinking” (Garrison, Anderson, &
Archer, 2000, p. 73). In 2004, Garrison, Cleveland-Innes, and Fung developed the COI scale to
“to understand and explain the conditions under which students adopt the role identity of online
learners” (p. 61). Responses are reported on a 5-point Likert scale ranging from 0 (strongly
disagree) to 4 (strongly agree). A search of the academic databases EBSCO Host, Google
Scholar, and ProQuest revealed that the COI has been cited in 1,330 studies since its
development. Initial results for data from the COI yielded a four-factor structure (Garrison &
Arbaugh, 2007), but subsequent studies have confirmed it as having only three factors: social
presence, cognitive presence, and teaching presence (Arbaugh et al., 2008; Bangert, 2009).
The COI has been has been used in a wide variety of studies focusing on online higher
education (Akyol, Garrison, & Ozden, 2009). Both social presence and teaching presence have
been cited as factors promoting social connectedness in distance learning environments (Akyol
& Garrison, 2014; Arbaugh & Benbunan-Fich, 2007; Boston et al., 2013). However, cognitive
presence has been described as a constructivist viewpoint measuring perceived learning and not a
28

factor that directly influences feelings of connectedness between participants in online
educational settings (Pollard, Minor, & Swanson, 2014); therefore, it is hypothesized that:
H3: Data from the OSCS will be both positively and negatively correlated with data from
the COI.
Relationship between the COI and OSCS
The first factor of the COI, social presence, is defined in terms of how “real” a person
seems during computer-mediated communication (CMC) (Short, Williams, and Christie, 1976).
Garrison, Anderson, and Archer (2000) related this definition to online learning by defining
social presence within an online educational environment as “the ability for learners to project
themselves socially and emotionally, thereby representing themselves a ‘real people’ in mediated
communication” (p. 94). Social presence facilitates more frequent interactions, thereby forming
bonded relationships within the environment. This type of bonded relationship has been
correlated with course satisfaction outcomes (Akyol, Garrison, & Ozden, 2009; Northrup, 2002;
Ryle & Cumming, 2007).
Since its inception in 1976, social presence theory has appeared in a number of studies
examining communication in technology-based environments (Garrison, Anderson, & Archer,
2000; Gunawardena, 1995; Gunawardena & Zittle, 1997; Rovai, 2002a, 2002b; Slagter van
Tyron & Bishop, 2006; Walther, 1992). Early on, many social presence studies using CMC
asserted that social presence was low because of the lack of ability to establish relationships
within computer-mediated environments (Baym, 1995). However, the theory supported the
notion that it is interactions within the environment—and not the environment itself—that lead to
low perceptions of social presence. As technology began to evolve, social presence was viewed
29

as the foundation of collaborative learning, interaction, and group cohesion (Aragon, 2003;
Garrison & Arbaugh, 2007; Boston et al., 2013; Ke, 2010). Bolliger & Inan (2012) assert that
comfortable learners are able to participate in the learning environment without fear of
persecution. This comfort is facilitated by both a sense of ease with technology and facilitated
discourse, course design, and organization from the instructor, the latter of which is directly
related to the second factor of the COI, teaching presence (Pollard, Minor, & Swanson, 2014).
Teaching presence is described as instructional management that leads to building
understanding and personal meaning among students (Garrison, Anderson, & Archer, 2000).
Instructors are viewed as central figures in establishing a sense of community and teaching
presence, although they are often not viewed as central figures in the community of learning by
their students (Bolliger & Inan, 2012; Young, 2006). Formal titles are attributed to creating a
sense of distance between instructors and their students, despite the fact that heavy reliance is
placed on the role of the instructor for creating the very collaborative environment that allows for
interaction and connectedness between students (Aragon, 2003). For this reason, I deduced that
teaching presence will exhibit a strong relationship with factors related to establishing the
learning environment and only a moderate relationship with factors related to community and
collaboration between students.
H3a: Data for comfort from the OSCS will demonstrate a strong positive correlation with
data from social presence and data for teaching presence from the COI.
H3b: Data for community from the OSCS will demonstrate a strong positive correlation
with data for social presence and a moderate positive correlation with data from
teaching presence from the COI.
30

H3c: Data for facilitation from the OSCS will demonstrate a strong positive correlation
with data from teaching presence and a moderate positive correlation with data for
social presence from the COI.
H3d: Data for interaction and collaboration from the OSCS will demonstrate a strong
positive correlation with data for teaching presence and a moderate positive
correlation with data for social presence from the COI.
Cognitive presence is described as triggering events that illicit critical thinking among
learners (Garrison, Anderson, & Archer, 2000). Examples of events related to cognitive thinking
are the posting of welcome messages, discussion board interactions, and student reflection-type
activities (Ryle & Cumming, 2007). Several studies link teaching presence to cognitive presence
through learning outcomes, and it has been suggested that it is the instructor’s role to enhance
cognitive awareness among students (Bolliger, 2004; Bolliger & Inan, 2012, Arbaugh &
Benbunan-Fich, 2007; Garrison, Anderson, & Archer, 2000; Garrison & Arbaugh, 2007; Slagter
van Tyron & Bishop, 2006; 2009). The instructor's actions are also linked to developing a sense
of comfort with technology (Slagter van Tyron & Bishop, 2006). As such, I deduced that
facilitation, which is hypothesized to be strongly correlated with teaching presence, and comfort,
which is developed through actions of the course facilitator, will exhibit a strong correlation to
cognitive presence; therefore:
H3e: Data for comfort and facilitation from the OSCS will demonstrate a strong positive
correlation with data for cognitive presence from the COI.
Cognitive presence has not been directly correlated with connectedness in the literature;
rather it has been tied to the ability to construct and confirm meaning in higher education
settings. Of the three elements in the COI framework, cognitive presence is reportedly the most
31

difficult to measure (Garrison & Arbaugh, 2007). ). Rovai (2002a) links sense of community to
discovering meaning though learning, and Bolliger and Inan (2012) propose strong ties between
interaction and collaboration and discovering meaning through learning. When putting forth the
assertions of linkages between community, learning, and interaction and collaboration, positive
relationships were discovered (Bolliger & Inan, 2012; Rovai, 2002a). For these reasons, I have
deduced that there is a relationship between these three factors. However, because the literature
has not yet established a direct linkage between cognitive presence, sense of community, and
interaction and collaboration in online educational setting, it is hypothesized that:
H3f: Data for community and interaction and collaboration from the OSCS will
demonstrate a weak positive correlation with data for cognitive presence from the
COI.
Linking data from the OSCS to data from validated constructs in the field serves to
establish the nomological network and provides further validation of construct validity
(Cronbach and Meehl, 1955). In addition to proposing theoretical linkages, this research will also
help to operationalize the theoretical concepts by showing empirical support. Cronbach and
Meehl (1955) posited that the establishment of this chain of inference is critical to psychometric
measurement.
Summary
This chapter reviewed the literature related to online student connectedness and
established relationships between this phenomenon and related constructs in the field of distance
learning. The need for additional statistical analysis of the OSCS was put forth. Finally, student
connectedness theories were discussed, and support for the study’s hypotheses and research
32

model was put forth. The next chapter describes the methodology that was used to conduct
research for the proposed model and hypotheses.
33

CHAPTER 3
METHODOLOGY
This section describes the methodology that was used to conduct this two-part study.
Study 1 is described in detail first, followed by information related to Study 2.
Study 1
Research Design
Study 1 utilized a quantitative, cross-sectional, correlational research design to examine
factorial validity of Online Student Connectedness Survey (OSCS) data. Survey methodology
was used to gather information. Data were analyzed using sequential exploratory-confirmatory
procedures to examine, refine, and confirm the factor structure of the instrument’s subscales
(Durvasula, Netemeyer, Andrews, & Lysonski, 2006; Worthington and Whittaker, 2006).
Hypotheses were tested by examining pattern coefficients, structure coefficients, tests of
discriminant validity, average variance extracted (AVE), composite reliability (CR), and fit
indices.
Population
This study sought to examine the psychometric properties of data from the OSCS, which
purports to measure feelings of connection between students participating in online courses in
higher education. As such, the target population for this study included students enrolled in
online courses at 4-year, public higher education institutions located in the United States. The
Babson Institute reports that there are 7.1 million people in this population (Allen & Seaman,
2014). Of this number, about 4% complete their entire program online.
34

Within the population of students enrolled in online courses, women outrank men by a
ratio of 1.4:1 (Hausmann, Tyson, & Zahidi, 2011). According to the NCES (2012), 4.3 million
students who are enrolled in online classes in the United States are classified as undergraduates.
Of the number, 21.7% are White; 20.2% are Black; 16.4% are Hispanic; 18.2% are Asian; 17.7%
are Native American/Hawaiian/Pacific Islander; and 5.8% are categorized as Other. The average
age for an online student is 34, and 81% are employed.
Sample Size
Larger sample sizes are preferred in exploratory factor analysis (EFA) and confirmatory
factor analysis (CFA) studies because they tend to minimize the probability of errors and
increase the generalizability of the results (Osborne & Costello, 2004). Published sample size
guidelines for instrument validity studies involving EFA and CFA include subject-to-item ratios
ranging from 3:1 (Cattell, 1966) to 20:1 (Hair, Anderson, Tatham, & Black, 1995). Gorsuch
(1983) and Hatcher (1994) recommend a minimum subject-to-item ratio of at least 5:1 in EFA.
Broad consensus is that there should be at least 10 cases for each item in the instrument being
tested for CFA studies (Garson, 2008; Everitt, 1975; Nunnally, 1978). Based on these guidelines,
the minimum sample size needed to conduct Study 1 was 375 responses. Although the literature
supports a sample size of 375 participants to perform a sequential EFA-CFA study based on the
number of OSCS items, a larger sample size was collected (n = 477) to mitigate potential issues
with CFA fit indices known to be sensitive to sample size (Kenny & McCoach, 2003).
Participants
Participants for Study 1 were limited to students currently enrolled in at least one online
35

course. To further narrow the sample, participants were enrolled in an institution in the United
States to reduce errors related to cultural differences (Poortinga & Van De Vijver, 1987).
Participants were recruited from universities that offered the traditional semester format, which
is defined as a semester that usually lasts 14–20 weeks; trimester terms, which last 8–12 weeks;
and quarter or quadmester courses, which last 4–12 weeks (NCES, 2012). Finally, the final
sample included both undergraduate and graduate level students (i.e., they were not limited by
classification). Including participants enrolled in multiple semester formats and of different
classifications helps increase generalizability of the results.
Data Collection
Two Institutional Review Board (IRB) approvals were required for this study because the
faculty researcher changed following the completion of Study 1. The first IRB was approved
through the University of North Texas (UNT) in June 2014. The second was approved in
February 2015. Copies of both IRB approvals are contained in Appendix A. Data for this study
were collected using the Qualtrics research panel firm. A research panel firm pre-recruits and
pools together individuals who are representative of a particular population and have agreed to
take part in the survey for incentives (Rao, Kaminska, & McCutcheon, 2010). Pollard (2002)
noted the following benefits for using research panels: 1) response rates among panel
participants are higher than response rates using traditional probability sampling methods; 2)
customized samples can be easily constructed from data on hand; and 3) samples can be made
demographically representative on multiple variables from data on hand. In order to gather
respondents, Qualtrics was given information regarding the target sample criteria, the sample
size, the length of the survey, and the survey questions. In addition, Qualtrics was also provided
36

with this information for pre-screening of participants. The research panel firm recruited, pre-
screened, and selected survey participants that met the specified criteria.
Baruch and Holtom (2008) concluded that involvement and pre-notification to
participants are the most effective ways to increase response rates for online surveys. As such,
Qualtrics sent a pre-notification email to each participant 1 week prior to the actual survey being
distributed to explain the purpose of the study and logistical details. Even though the research
panel sent the email, it is important to note that the researcher created the content. A copy of the
pre-notification email is contained in Appendix B. A link to the actual survey was sent on a
Monday between 12:00 p.m. and 1:30 p.m. in the respondent’s local time zone because research
suggests that people are more apt to read email during this timeframe and response rates are
10%–20% higher for surveys administered on this day and time of the week (McCormick &
Zheng, 2013). Participants who were currently enrolled in more than one online course were
directed to focus on a single course of their choice when responding to the survey. The survey
remained open for 2 weeks to achieve the number of respondents needed for Study 1.
Instrumentation
The OSCS is a 25-item scale purported to measure feelings of connectedness for students
enrolled in online degree or certification programs (Bolliger & Ian, 2012). The self-report
instrument consists of four subscales that measure comfort, community, facilitation, and
interaction and collaboration. The OSCS contains statements such as I feel comfortable in the
online learning environment provided by my program; I have gotten to know some of the faculty
members and classmates well; my online instructors are responsive to my questions; and I work
with others in my online course. Items are rated using a 5-point Likert scale ranging from 1
37

(strongly disagree) to 5 (strongly agree). Data for reliability from the instrument was reported as
α = .98 during initial validation by its creators (Bolliger & Inan, 2012).
Survey Design
A potential concern of the sample for this study was nonresponse bias. Nonresponse bias
occurs when “respondents to a survey are different from those who did not respond in terms of
demographic or attitudinal variables” (Sax, Gilmartin, & Bryant, 2003, p. 411). This type of bias
can affect the validity and generalization of the results because the sample obtained might not be
representative of the population and responses from those who elected to participate may be
homogenous. Research suggests that the decision to refrain from survey participation is related to
concerns about confidentiality of the responses and the length of the survey (Eveslage, Wilson,
& Dye, 2007; Kizilcec, 2014; O’Neill, Wright, & Palmer, 2003; Sax, Gilmartin, & Bryant,
2003). Managing survey design has been cited as an effective method to counter nonresponse
bias (Arbaugh & Benbunan-Fich, 2007; Lai, 2008). As such, measures were taken to control for
nonresponse bias as part of survey design.
The survey for Study 1 contained 30 items organized into four blocks. Blocks are sets of
questions used to organize longer surveys (www.qualtrics.com). Block 1 included three
screening questions to ensure that respondents met the target criteria; block 2 was informed
consent; block 3 included the 25 OSCS items; and block 4 contained five demographic items.
Block 1 was used to determine if participants fit the criteria for the study, and it was
designed to control for nonresponse bias and a homogenous sample. Block 1 included four
questions: 1) Are you currently enrolled in at least one online course that is completely
asynchronous? 2) Is the course in which you are enrolled located at a four-year college/university
38
in the United States? 3) How strongly do you agree with the following statement: “I enjoy taking
courses that are completely asynchronous”? If respondents answered no to questions 1 or 2, they
were redirected to the end of the survey and thanked for their participation. Question 3 was
formatted using a 5-point Likert scale and was designed to ensure a balanced sample and combat
nonresponse bias. Based on best practices suggested by the Qualtrics research panel, a target of
no less than 10% but no greater than 30% was suggested for each point on the Likert scale to
ensure balance. Of the usable responses, 28% strongly agreed with the statement; 22% agreed;
14% were neutral; 20% disagreed; and 16% strongly disagreed. This breakdown provides
evidence that the sample was not homogenous and personal feelings about participating in online
courses varied evenly.
Block 2, informed consent, included information about the study, the researcher, and
confidentiality of the data. Participants were asked to provide electronic consent by selecting
“agree” or “disagree” prior to the survey questions being revealed. If a participant selected
“agree,” the first question of the survey was revealed. If a participant selected “disagree,” the
final page of the survey containing the “thank you” message was revealed, the participant was
exited from the survey, and the response was not considered usable. Block 3 contained the 25
items from the OSCS. Questions were numbered and sectioned by factor. To decrease the
amount of scrolling, page breaks were inserted to separate the questions representing each factor.
Further, factors were randomized to decrease common method bias. Podsakoff, MacKenzie, and
Lee (2003) attribute common method bias to several reasons, one of which is consistency motif,
the desire for respondents to appear consistent to their responses to survey items. When
consistency motif occurs, respondents unintentionally produce relationships in data that might
not truly exist, thus skewing the results (Johns, 1994; Podsakoff, MacKenzie, & Lee, 2003;
39

Schmitt, 1994). One method recommended to minimize common method bias is to counter-
balance question order (Podsakoff, MacKenzie, & Lee, 2003). To implement this
recommendation, the survey design included a random order by section feature, which is a
standard feature in the Qualtrics survey software. Block 4 contained five questions developed by
the researcher to collect demographic data from participants. Items appeared at the end of the
survey and were adapted from U.S. Census Bureau guidelines for collecting data on race, gender,
education, and age (Romano &Chen, 2000). Placing demographic data at the end of the survey
aligns with APA recommendations on survey design. The Next button and the Percent Complete
bar were presented on the bottom of each survey page (Romano & Chen, 2011). No Back button
was provided to limit the ability of respondents to return to previously answered items and
change responses because of the consistency motif. The Study 1 survey included five pages. A
copy of this survey is contained in Appendix C.
Data Analysis
The SPSS random selection feature was used to split the sample. EFA was conducted
using 1/3 of the responses (n1 = 159), with the remaining 2/3 responses (n2 = 318) saved for CFA
analysis. Coefficient alphas were then computed for data from each subscale and the full scale.
SPSS statistical software was used to perform the EFA, and SPSS AMOS was used to perform
the CFA.
Factor Retention and Interpretation
Henson and Roberts (2006) discussed the importance of the ability of factor analysis
studies to be independently evaluated by external researchers. For this reason, this study includes
40

all data related to extraction and retention. The OSCS is purported to contain four factors
(Bolliger & Inan, 2012, Ford & Inan, 2013; Ozturk & Ozcinar, 2013). Therefore, based on prior
theory, a four-factor solution was forced for EFA. Principal factor analysis (PFA) with oblique
rotation was employed because it focuses on the common variance among the items, and it was
assumed that the factors would be correlated (Henson & Roberts, 2006). This method of factor
analysis is consistent with the literature on EFA, factor extraction, and rotation methods (Brown,
2009; Conway & Huffcutt, 2003; Fabrigar, Wegener, MacCallum, & Strahan, 1999; Gorsuch,
1983).
For item retention, pattern coefficients, structure coefficients, and communalities were
examined. EFA was run until all pattern/structure coefficients and item communalities fell within
acceptable parameters. Pattern and structure coefficients above .50 were considered acceptable,
and those items with values below .50 were deleted (Ford, MacCallum, & Tait, 1986; Henson &
Roberts, 2006). Additionally, items that did not load on the correct factor were deleted. Data
were examined for factor multicollinearity, and items that cross-loaded at .32 or above on two or
more factors were also deleted (Costello & Osborne, 2005; Field, 2005). Factors were retained
only if they contained at least three items. Prior research states that factors with less than three
items are considered weak and unstable and may be deleted from an instrument during EFA
(Tabachnick & Fidell, 1996).
Communalities express the total amount of variance a measured variable has in common
with the construct upon which it loads (Paswan, 2009). Item communalities above .50 are most
common in social science research (Costello & Osborne, 2005). Therefore, items with
communalities above .50 were considered acceptable evidence to support retention of the item
for each factor.
41

Data Screening
Once EFA was complete, data for the remaining items were screened to determine if it
was suitable for additional analysis. The Kaiser-Meyer-Olkin (KMO) index and Bartlett’s test of
sphericity were used for data screening. Both the KMO index and Bartlett’s test of sphericity
indicate suitability of data for structure detection. KMO values between .50 and 1 indicate that
factor analysis is appropriate for data interpretation, while values below .50 indicate that data are
not suitable for a factor analysis study (Kaiser, 1974). Values between .50 and .70 are mediocre;
values between .70 and .80 are good; values higher than .80 and less than .90 are most preferable
and considered great; and values above .90 are considered superb (Hutcheson & Sofroniou,
1999; Norušis, 2006). Bartlett’s test of sphericity examines correlation between items. Statistical
significance (p < .05) indicates that the data are suited for factor analysis (Field, 2005).
Earlier in this section, methods to control for common method bias were discussed as it
related to the design of the survey. To statistically test for common method bias, the common
latent factor method was used. This approach involves adding a first-order latent method factor
to the AMOS model and connecting it to all observed items in the model. Comparison between
standardized regression weights from the original model and the common latent factor model
should yield differences less than .20. Podsakoff, MacKenzie, and Lee (2003) recommend this
method in cases where a researcher cannot identify the main source of potential method bias.
Confirmatory Factor Analysis
Once the factor structure was established and data screening complete, CFA was
conducted on data from the refined version of the OSCS to confirm the results and analyze
goodness of fit. Numerous fit indices are available for data analysis. This study used fit indices
42

and acceptable thresholds established in Byrne (2010); Hooper, Coughlan, and Mullen (2008);
and Kline (2005). These indices and thresholds include CMIN/degrees of freedom (CMIN/df),
comparative fit index (CFI), root means square of approximation (RMSEA), the Tucker-Lewis
index (TLI), and the standardized root mean square residual (SRMR). CMIN represents the
minimum value of the discrepancy between the model and the data. CMIN/df is the chi-square
divided by the df value and should be less than 3.0 (Kline, 2005). CFI compares the sample
covariance matrix with the null model. Values for this statistic should range between 0 and 1
with values greater than or equal to .95 indicating good fit (Hooper, Coughlan, & Mullen, 2008).
RMSEA tells how well the model would fit the population’s covariance matrix (Byrne, 1998).
Acceptable values for this statistic should be greater than .50 but less than .08 (Byrne, 2010). TLI
is designed to resolve some of the issues of negative bias. Values greater than or equal to .95 are
considered acceptable (Hooper, Coughlan, and Mullen, 2008). SRMR is the square root of the
discrepancy between the observed correlation and the predicted correlation (Hu & Bentler,
1999). Values range from 0 to 1, with a value of .08 or less indicating good model fit (Byrne,
2010). In addition to fit indices, factor loadings for each item were examined. Factor loadings
above .70 were considered acceptable for establishing model fit (Hair et al., 2010). Table 3.1
details acceptance thresholds for each of the fit indices that were used in this study.
Table 3.1
Fit Indices and Acceptable Thresholds
Goodness of Fit Measure Recommended Value References CMIN/df < 3.0 Kline, 2005 CFI ≥ .95 Hooper, Coughlan, and Mullen, 2008 RMSEA < .08 Byrne, 2010; Kline, 2005 TLI ≥ .90 Byrne, 2010; Hooper, Coughlan, and
Mullen, 2008 SRMR < .08 Byrne, 2010
Note. CMIN/df = chi-squared divided by degrees of freedom; CFI = comparative fit index; RMSEA = root mean square error of approximation; TLI = Tucker-Lewis index; SRMR = standardized root mean square residual.
43

Once model fit was established, convergent validity and discriminant validity for OSCS
data were examined. AVE and composite reliability (CR) provided evidence of convergent
validity. AVE measures the amount of variance that is captured by the construct in relation to the
amount of variance due to measurement error (Fornell & Larcker, 1981). AVE is computed as
the sum of the squared factor loadings divided by the number of items as shown in the following
formula (Paswan, 2009).
Composite reliability is based on proportions of variance and takes into account the
individual contribution of each latent factor to each item and its item’s error (Starkweather,
2012). It is considered to provide a less biased estimate of reliability than alpha (Raykov, 1997).
Composite reliability is calculated as the sum of standardized loadings squared divided by the
sum of standardized loading squared plus the sum of indicator measurement error as shown in
the following formula (Raykov, 1997).
AVE and CR combined were used to assess convergent validity. AVE of .50 or higher
(Paswan, 2009) and CR of .70 or higher are the recommended thresholds to indicate adequate
evidence of convergent validity (Hair et al., 2010). Paswan (2009) posits that CR of .60–.70 is
acceptable.
Discriminant validity measures the extent to which a factor is distinct from other factors
(Paswan, 2009). To calculate discriminant validity, squared interconstruct correlation (SIC)
estimates were calculated for each factor and compared to that factor’s AVE estimate. SIC was
calculated by squaring the standardized covariance estimates calculated by AMOS. Discriminant
44

validity is achieved when AVE estimates for a factor are larger than the SIC associated with a
factor. Therefore, AVE > SIC provided evidence of discriminant validity for each OSCS factor.
The final step in Study 1 was to examine reliability for OSCS data. SPSS and AMOS
were used to calculate data needed to support the final step. Reliability coefficients were
calculated for each factor of the OSCS and the full set of refined items. Reliability coefficients of
.80 or higher were considered acceptable evidence of reliability (Henson, 2001; Nunnally, 1978;
Paswan, 2009).
Study 2
Research Design
Study 2 utilized a quantitative, cross-sectional, correlational research design to confirm
factorial validity of data from the refined OSCS instrument and examine nomological validity
between data from the refined OSCS, the CCS, and the COI. Here again, survey methodology
was used to gather information. Correlation analysis was used to assess the strength of the
relationships for observed scale scores between factors from the OSCS and factors from the
identified related constructs (COI & CCS) in determining nomological validity. Demographic
data was collected for generalizability purposes.
Population
As in Study 1, the population for this study consisted of students enrolled in at least one
course at a higher education institution located in the United States. More than 7.1 million
students exist in this population according to data gathered by the NCES in 2012.
45

Sample Size
The purpose of Study 2 was to confirm reliability of the refined set of items and
determine if a nomological network exists between the OSCS, the CCS, and the COI scales.
Because Study 2 involved the use of CFA techniques to establish convergent and divergent
validity for hypothesized relationships between constructs, a minimum 10:1 ratio of responses
was needed (Garson, 2008; Everitt, 1975; Nunnally, 1978). Prior evidence of factorial validity
exists for data from the COI and the CCS (Arbaugh et al., 2008; Bangert, 2009; Rovai, 2002b).
Therefore, sample size for the 10:1 ratio was based on the OSCS items only. As in Study 1,
additional responses were collected to mitigate for CFA fit indices that are sensitive to sample
size (Kenny & McCoach, 2003). In total, 263 responses were collected.
Participants
Participants for Study 2 were again limited to students currently enrolled in at least one
online course. Here again, participants were recruited from universities that offered the
traditional semester formats, trimester terms, and quarter or quadmester courses. Participants
were classified as both graduate and undergraduate students.
Data Collection
An independent sample was needed for Study 2. The research panel was advised to
recruit different participants than the ones used in Study 1. As in Study 1, a pre-notification
email was sent to participants 1 week prior to distributing the survey (see Appendix B, Email 2).
Here again, the research panel administered the email, but the content was created by the
researcher. A link to the survey itself was emailed on a Monday between 12:00 p.m. and 1:30
46
p.m. It is important to note that data for Study 2 was collected once Study 1 was complete. This
delay was critical because the items used from the OSCS in Study 2 were dependent upon the
outcome of the EFA-CFA analysis performed in Study 1. The research panel was responsible for
sending the survey link to participants, screening and identifying appropriate respondents, and
collecting responses.
Instrumentation
Three instruments were utilized in this study: the revised OSCS from Study 1, the CCS,
and the COI. Data collected from the instruments were screened for suitability, and reliability
was calculated on all scales. Both convergent validity and discriminant validity were assessed by
comparing data from the subscales of the revised OSCS with data from subscales of both the
CCS and COI. The OSCS was described in Study 1, thus the information will not be repeated in
this section.
The Classroom Community Scale (CCS)
The CCS is a 20-item self-report scale that measures sense of community in a learning
environment. The self-report instrument contains two subscales, connectedness and learning, and
contains statements such as I feel that students in this course care about each other and I feel
that this course results in only modest learning. Each subscale contains 10 items and is
responded to using a 5-point Likert scale ranging from 1 (strongly agree) to 5 (strongly
disagree). Of the 20 items, 10 are negatively worded and will be reverse-scored during data
analysis. Reverse scoring ensures that all of the items are consistent with each other, in terms of
what an “agree” or “disagree” implies and is common in data analysis (Pintrich, Smith, Garcia,
47

& Mckeachie, 1991). A factor analysis study provided evidence of construct validity, where most
factor loadings were high (i.e., > .60) (Rovai, 2002b). Cronbach’s (1951) coefficient alpha for
the CCS was .93. Additionally, the internal consistency estimates for the connectedness and
learning subscales were reported as .92 and .87 respectively (Rovai, 2002b).
The Community of Inquiry Scale (COI)
The COI is a 34-item self-report instrument that measures the dimensions of social
presence, cognitive presence, and teaching presence in learning environments (Arbaugh et al.,
2008). The scale was created to operationalize Garrison, Anderson, and Archer’s Community of
Inquiry framework (2000) and contains items such as the instructor clearly communicated
course goals; I was able to form distinct impressions of some course participants; and combining
new information helped me answer questions raised in course activities. Originally, EFA results
for the COI yielded a four-factor structure (Arbaugh & Benbunan-Fich, 2007), but subsequent
studies have confirmed it as having only three factors (Arbaugh et al., 2008; Bangert, 2009). The
three subscales (social presence, cognitive presence, and teaching presence) include 9, 11, and 13
items respectively. Responses are reported on a 5-point Likert scale ranging from 0 (strongly
disagree) to 4 (strongly agree). Literature supports that data from the instrument are valid,
reliable, and efficient to measure the dimensions of social presence and cognitive presence, with
all factors having reliability alphas of .87 or higher (Arbaugh et al., 2008). Bangert (2009)
reported specific reliabilities for each subscale as follows: cognitive presence (α = .95), teaching
presence (α = .96), and social presence (α = .91).
48
Survey Design
Survey nonresponse and nonresponse bias have become an increasing problem for
researchers in the United States and internationally, with survey fatigue being cited as one of the
main decline reasons (Baruch, 1999; Porter, Whitcomb, & Weitzer, 2004). Survey fatigue is a
well-documented phenomenon and has been described as occurring when:
survey participants become tired of the survey task and the quality of the data they provide begins to deteriorate. It occurs when survey participants’ attention and motivation drop toward later sections of a questionnaire. Tired or bored respondents may more often answer “don't know,” engage in “straight-line” responding (i.e., choosing answers down the same column on a page), give more perfunctory answers, or give up answering the questionnaire altogether (Ben-Nun, 2008)
Time and length have been cited as the biggest contributors to survey fatigue and
nonresponse bias (Dillman, 2000; Porter & Whitcomb, 2003). The likelihood of survey fatigue
and non-response increases by almost 50% once the time to complete a survey reaches the 15-
minute mark (Cape, 2010). Fatigue has been tied to the inaccuracy of responses, especially in
questions located toward the latter portion of longer surveys (Apodaca, Lea, & Edwards, 1998;
Cape, 2010). Additionally, survey fatigue can increase measurement error, which can lead to
inaccurate answers (Dillman, Tortora, & Bowker, 1998).
Because Study 2 includes items from three instruments, it could take more than 15
minutes to complete, which could lead to survey fatigue. To minimize the effects of survey
fatigue and increase response rates, certain measures were implemented in the design of the
survey. First, the UNT banner appeared on each page of the survey because the inclusion of a
credible source may increase response rates (Cho & LaRose, 1999). Next, the four-block format
from Study 1 was reused for this study. Block 1 included the same three screening questions as
Study 1 to ensure that respondents met the target criteria and would not include a homogeneous
sample; block 2 was informed consent; block 3 contained items from the refined OSCS, the CCS
49

and the COI; and block 4 contained the five demographic items. To control for the consistency
motif, factors in block 2 were randomized using the Standard feature in Qualtrics. Minimizing
the number of pages has also been purported to reduce survey fatigue and increase response rates
(Dillman, 2000). For this reason, the matrix table style was used, and questions for each scale
were grouped by factor, which resulted in a total of 5 pages for the survey.
Based on best practices suggested by the research panel firm, one attention filter was
added to the survey. Attention filters are straightforward questions that help screen out
respondents who are moving through the survey without reading carefully. The following item
was inserted into the survey at the halfway mark: The purpose of this survey is to collect valid
information. If you are reading carefully, please select agree. Responses from participants who
failed to follow this command were not considered valid and were not included in the results.
Additional measures taken to reduce the effects of survey fatigue and common method
bias in the design of the survey included presenting the Next button and the Percent Complete
bar on the bottom of each screen (Romano & Chen, 2011). No Back button was provided to limit
the ability of respondents to return to previously answered items and change responses because
of the consistency motif.
Data Analysis
To begin, CFA was conducted to confirm the factor structure from Study 1. Study 2 also
used fit indices and acceptable thresholds established in Byrne (2010); Hooper, Coughlan, and
Mullen (2008); and Kline (2005) to establish model fit. These indices included CMIN/df, CFI,
RMSEA, TLI, and SRMR. Table 3.1 included earlier in this manuscript details acceptable
thresholds for each of the fit indices that were used in this study.
50
Once model fit was established, convergent validity and discriminant validity for OSCS
data were examined. Composite reliability and AVE provided evidence of convergent validity.
Shared variances between factors that were lower than the AVE of individual covariance
between factors indicated evidence of discriminant validity. Alpha coefficients were calculated
for each scale to test for acceptable levels of reliability. Alpha coefficients of .80 or higher were
considered acceptable evidence of reliability (Henson, 2001; Nunnally, 1978; Paswan, 2009).
Once the factor structure was confirmed, correlation coefficients between each of the
subscales were calculated and compared to examine the hypothesized nomological network. The
nomological network examines the extent to which a scale correlates in theoretically predicted
ways with other distinct but related constructs (Cronbach & Meehl, 1955). Strong correlation
was indicated by .50 < | r |; moderate correlation was indicated by .30 < | r | < .50; and weak
correlation was indicated by .10 < | r | < .30 (Ward, Fischer, Lam, & Hall, 2009). These
thresholds were used to determine constructs that contributed to the nomological network of the
OSCS.
Summary
This chapter discussed the methodology used to collect and analyze data for both studies
contained in this research. First, the population, sample, and data collection methods were
defined. Second, the instruments used in this research were described. Finally, statistical analysis
information for data interpretation was outlined. Chapter 4 provides results from the data
collected for both studies.
51

CHAPTER 4
RESULTS
The purpose of this study was to examine data from the Online Student Connectedness
Survey (OSCS) for validity and reliability and to establish a nomological network. The study
was broken into two parts. Study 1utilized sequential EFA-CFA analysis. EFA was used to
establish the factor structure, and CFA was used to replicate and test the modified structure.
Once the structure was confirmed, CFA was run another time, using an independent sample to
examine stability of the modified structure and to establish a nomological network between the
OSCS and two similar, widely utilized instruments related to the study of online student
connectedness. This chapter is organized into two main sections. Section 1 discusses results of
the sequential EFA-CFA analysis conducted in Study 1. Section 2 shares results of CFA analysis
run on an independent sample and tests of the nomological structure conducted in Study 2.
Study 1
Data Collection and Participants
A total of 1,176 surveys were sent, and 1,137 were attempted. Of the 1,137 attempted,
3% (n = 35) were abandoned before completion. Those participants who did not meet the criteria
of current enrollment in at least one online course were excluded (n = 418) along with those who
took less than one minute to complete the survey (n = 207). The one-minute exclusion was based
on best practices for data collection established by the research panel. After these exclusions, 477
usable responses remained, representing a 40.56% response rate. Of those, 35.2% were male;
88.8% were undergraduates; and 11.2% were at the graduate level. The predominant number of
participants were between the ages of 25–34 (40.8%), followed by the 18–24 age group (22.4%),
52
the 35–44 age group (21.6%), the 45–54 age group (8%), and the 55 and older age group (7.2%).
52.8% of the sample were employed for wages while attending college. This sample is
representative of the current population of students taking online courses in the United States,
where women outrank men by approximately 1.4:1, and the predominant age group is between
25–34 (Hausmann, Tyson, & Zahidi, 2011; NCES, 2012). The sample for Study 1 was split (n1 =
159, n2 = 318) to accommodate sequential EFA-CFA analysis.
Exploratory Factor Analysis (EFA)
In the initial EFA (n1 = 159), four factors were extracted based on a priori knowledge of
the instrument’s structure (Bolliger & Inan, 2012). The four factors accounted for 66.81% of the
total variance explained. Items 1, 3, and 5 were deleted because they did not load on the correct
factor; Items 2, 6, 17, and 21 were deleted because they had coefficients less than .50 (Ford,
MacCallum, & Tait, 1986; Henson & Roberts, 2006), and these items had substantial loadings on
more than one factor (Matsunaga, 2010). The analysis was rerun on the remaining 18 items. This
time, Item 16 was deleted because it did not meet the .50 cutoff, and the remaining 17 items were
re-extracted. In this iteration, Item 15 was deleted because it did not meet the .50 cutoff.
Omitting these items resulted in 16 remaining items with pattern coefficients above .50,
accounting for 77.17% of the total variance extracted. All structure coefficients had factor
loadings ranging from .663 to .892, .694 to .912, .675 to .918, and .670 to .905 (Factors 1, 2, 3,
and 4 respectively) and minimal cross-loadings. Table 4.1 shows the pattern and structure
matrices for the 16 retained items. Communalities above .50 are considered acceptable for EFA
studies of this type in social science research (Costello and Osborne, 2005).
53

Table 4.1
EFA Pattern/Structure Matrix and Reliabilities for Original and Revised OSCS
Note. CFT = comfort; COM = community; FAC = facilitation; INT = interaction and collaboration.
Initial
Pattern Matrix Initial
Structure Matrix Revised
Reliabilities
Revised Pattern Matrix
Revised Structure Matrix
Scale Item Initial Reliabilities 1 2 3 4 1 2 3 4 1 2 3 4 1 2 3 4
CFT .829 .836 CFT5 .068 .095 -.063 .628 .377 .497 .426 .789 - - - - - - - - CFT1 .018 .093 -.063 .626 .347 .473 .338 .687 - - - - - - - - CFT3 .438 -.057 -.105 .451 .795 .137 .580 .368 - - - - - - - - CFT4 .822 .121 -.107 .027 .788 .256 .499 .443 .663 .034 .043 .095 .743 .269 .528 .442 CFT8 .734 -.039 .120 -.022 .758 .131 .540 .377 .767 -.032 .074 -.019 .799 .162 .561 .345 CFT7 .696 -.060 .084 .037 .705 .143 .591 .528 .892 -.037 -.047 -.013 .846 .247 .522 .359 CFT2 .437 -.253 .213 .366 .574 .267 .392 .573 - - - - - - - - CFT6 .374 -.014 .137 .134 .526 .195 .447 .375 - - - - - - - - COM .915 .924 COM11 -.079 .806 -.035 .123 .115 .854 .290 .568 .003 .912 -.111 -.003 .217 .831 .275 .478 COM12 -.097 .802 .099 .074 .214 .841 .350 .542 -.034 .859 .048 -.009 .072 .839 .241 .487 COM14 .061 .832 -.016 .004 .160 .867 .384 .576 -.002 .829 .034 -.002 .174 .925 .356 .629 COM10 -.113 .766 .065 .074 .115 .815 .326 .528 -.071 .827 .021 .005 .244 .844 .418 .509 COM9 .054 .698 -.132 .166 .183 .761 .260 .559 .031 .747 -.068 .050 .214 .857 .329 .602 COM13 .118 .755 .057 -.045 .280 .771 .405 .508 .040 .694 .107 .030 .228 .764 .482 .520 FAC .816 .862 FAC17 -.125 .031 .468 .475 .361 .499 .460 .654 - - - - - - - - FAC20 -.045 -.040 .875 .019 .536 .303 .839 .416 -.080 -.062 .787 .178 .507 .322 .737 .399 FAC18 .220 .118 .770 -.271 .623 .292 .824 .299 .005 -.008 .918 -.045 .587 .293 .824 .303 FAC16 -.061 -.084 .632 .271 .634 .305 .742 .302 - - - - - - - - FAC19 .343 .179 .582 -.269 .472 .319 .697 .511 .208 .091 .675 -.116 .620 .305 .792 .300 FAC15 .049 -.058 .518 .239 .496 .302 .650 .490 - - - - - - - -
INT .909 .923 INT24 .014 .149 -.052 .851 .417 .659 .446 .923 .004 .100 -.049 .905 .417 .691 .336 .955 INT23 .052 .068 -.062 .839 .427 .575 .424 .875 .018 .021 -.023 .876 .416 .606 .332 .890 INT25 -.032 .001 .053 .777 .443 .612 .466 .789 -.054 -.052 .087 .824 .375 .521 .348 .797 INT22 .109 .217 .006 .600 .420 .484 .639 .672 .097 .155 .007 .670 .450 .631 .383 .823 INT21 -.012 .130 .167 .494 .296 .461 .303 .661 - - - - - - - -
54
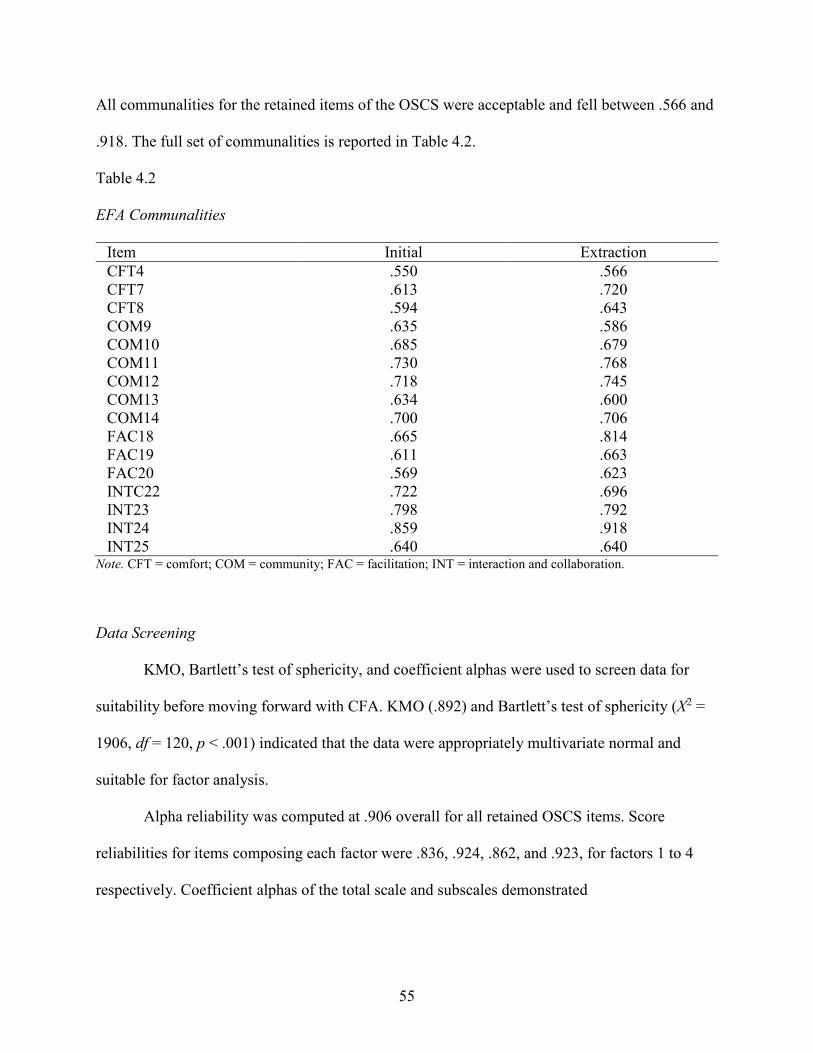
All communalities for the retained items of the OSCS were acceptable and fell between .566 and
.918. The full set of communalities is reported in Table 4.2.
Table 4.2
EFA Communalities
Item Initial Extraction CFT4 .550 .566 CFT7 .613 .720 CFT8 .594 .643 COM9 .635 .586 COM10 .685 .679 COM11 .730 .768 COM12 .718 .745 COM13 .634 .600 COM14 .700 .706 FAC18 .665 .814 FAC19 .611 .663 FAC20 .569 .623 INTC22 .722 .696 INT23 .798 .792 INT24 .859 .918 INT25 .640 .640
Note. CFT = comfort; COM = community; FAC = facilitation; INT = interaction and collaboration.
Data Screening
KMO, Bartlett’s test of sphericity, and coefficient alphas were used to screen data for
suitability before moving forward with CFA. KMO (.892) and Bartlett’s test of sphericity (X2 =
1906, df = 120, p < .001) indicated that the data were appropriately multivariate normal and
suitable for factor analysis.
Alpha reliability was computed at .906 overall for all retained OSCS items. Score
reliabilities for items composing each factor were .836, .924, .862, and .923, for factors 1 to 4
respectively. Coefficient alphas of the total scale and subscales demonstrated
55
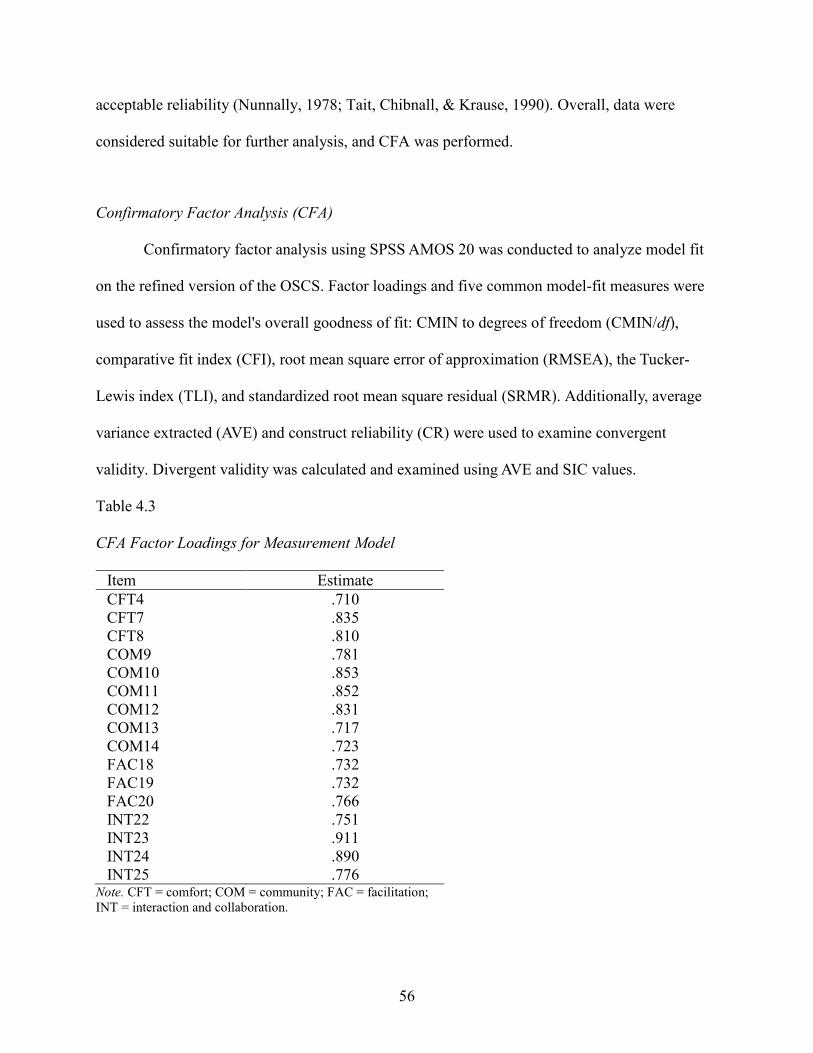
acceptable reliability (Nunnally, 1978; Tait, Chibnall, & Krause, 1990). Overall, data were
considered suitable for further analysis, and CFA was performed.
Confirmatory Factor Analysis (CFA)
Confirmatory factor analysis using SPSS AMOS 20 was conducted to analyze model fit
on the refined version of the OSCS. Factor loadings and five common model-fit measures were
used to assess the model's overall goodness of fit: CMIN to degrees of freedom (CMIN/df),
comparative fit index (CFI), root mean square error of approximation (RMSEA), the Tucker-
Lewis index (TLI), and standardized root mean square residual (SRMR). Additionally, average
variance extracted (AVE) and construct reliability (CR) were used to examine convergent
validity. Divergent validity was calculated and examined using AVE and SIC values.
Table 4.3
CFA Factor Loadings for Measurement Model
Item Estimate CFT4 .710 CFT7 .835 CFT8 .810 COM9 .781 COM10 .853 COM11 .852 COM12 .831 COM13 .717 COM14 .723 FAC18 .732 FAC19 .732 FAC20 .766 INT22 .751 INT23 .911 INT24 .890 INT25 .776
Note. CFT = comfort; COM = community; FAC = facilitation; INT = interaction and collaboration.
56

Hypothesis H1a predicted that pattern coefficient values for data from each of the four
subscales would be > .70 (Hair et al., 2010). This hypothesis was supported as all factor loadings
were above .70. Table 4.3 shows factor loadings for each item in the revised scale.
Hypothesis H1b predicted that reliability coefficient values for data from the overall
instrument and data from each subscale would be .80 or higher (Nunnally, 1978; Henson, 2001).
This hypothesis was also supported as alpha coefficients were calculated at .907 for the full scale
and .829, .915, .816, and .909 for subscales 1, 2, 3, and 4 respectively.
Finally, hypothesis H1c predicted that factor structure scores for OSCS data would yield
good fit indices (CMIN/df > .30, TLI > .95, CFI > .95, RMSEA < .70, SRMR < .08) (Byrne,
2010; Hooper, Coughlan, & Mullen, 2008; Kline, 2005) and all fit indices would meet their
recommended acceptance thresholds (Byrne, 2010; Hooper, Coughlan, & Mullen, 2008; Kline,
2005). This hypothesis was supported as all fit indices met acceptable thresholds. Model fit
indices are shown in Table 4.4.
Table 4.4
CFA Fit Indices for Measurement Model
Goodness of Fit Measure Recommended Value Default Model CMIN/df > 3.0 2.414 CFI ≥ .95 .955 RMSEA* ≤ .08 .067 TLI ≥ .95 .945 SRMR ≥ .08 .048
Note. CMIN/df = chi-squared divided by degrees of freedom; CFI = comparative fit index; RMSEA = root mean square error of approximation; TLI = Tucker-Lewis index; SRMR = standardized root mean square residual. *RMSEA Confidence Interval = 90%.
The range of composite reliability (CR: .62-.86) and average variance extracted (AVE:
.55-.70) provided evidence of adequate convergent validity. Shared variances between factors
were lower than the associated squared interconstruct correlation (SIC) of individual factors, thus
57

providing evidence of discriminant validity. Table 4.5 shows AVE and discriminant validity
values.
Table 4.5
AVE and Discriminant Validity
1 2 3 4 1. Comfort .619 — 2. Community .006 .631 — 3. Facilitation .690 .031 .552 — 4. Interaction and Collaboration .190 .229 .066 .697
Note. Diagonal elements are the AVE. Off diagonal elements are the SIC values.
Because the data for this study came from self-report instruments, it was tested for
common method bias through the common latent variable method (Podsakoff, MacKenzie, &
Lee, 2003). If, when adding a common variable to all of the items in the model, the difference
between the factor scores with the variable present and factor scores without the variable present
does not show a variance greater than 2.0, one can assume that method bias is not a significant
problem (Gaskin, 2012). Analysis of this type was run and the varimax rotation failed to
converge. These results indicate that common method bias is not a major concern for this study
(Siegall & McDonald, 1995).
Overall, the factor structure of the model resulting from EFA was replicated during CFA.
This indicated that data from the instrument were stable enough to move forward with Study 2,
where CFA on the refined set of OSCS items would be examined using an independent sample
and the proposed nomological network would be tested.
Study 2
Data Collection and Participants
A total of 580 surveys were sent and 563 were attempted. Of the 563 attempted, 2.9%
58

were abandoned before completion. Responses from participants who did not meet the target
criteria of online course enrollment in a U.S. college or university and those who did not
correctly respond to the attention marker in the survey were excluded from the final tally. After
these exclusions, 263 usable responses remained, which represented a 46.71% response rate. Of
those, 36.12% were male; 28.1% were undergraduates; and 10.6% were at the graduate level.
The majority of participants were between the ages of 25–34 (32.3%), followed by the 35–44 age
group (25.09%) and the 18–24 age group (24.71%). The 45–54 age group and the 55 and older
age group were tied, representing 8.36% each. 53.6% of the participants in the sample were
employed for wages while attending college. Again, demographic data for the sample aligns with
data retrieved regarding the current population of students taking online classes at a college or
university located in the United States with the number of women outranking men ~1.4:1 and the
predominant age group being between 25–34 (NCES, 2012).
Data Screening
Prior to conducting the CFA, data for the revised version of the OSCS were screened for
suitability. Because the CCS contains negatively worded items, data for these questions were
reverse scored using the TransformRecode into Same Variable feature in SPSS. Pattern and
structure coefficients were examined, and alpha reliabilities for each factor and the total scale
were calculated. All pattern/structure coefficients were above .50 and considered acceptable
based on prior factor validation studies (Ford, MacCallum, & Tait, 1986; Henson & Roberts,
2006). Based on the screening, data from the revised version of the scale were considered
suitable enough to perform the CFA. Table 4.6 shows data screening results.
59

Table 4.6
Study 2 Data Screening
Pattern Matrix Structure Matrix Scale Item Reliability (α) 1 2 3 4 1 2 3 4 OSC
S .926
CFT .873 CFT7 .894 -.022 -.186 .130 .846 .247 .522 .359 CFT8 .886 .016 -.067 -.037 .840 .162 .561 .345 CFT4 .783 -.021 .179 -.096 .832 .269 .528 .442
COM .935
COM11 -.046 .959 -.111 -.003 .217 .904 .275 .478
COM12 -.022 .930 .048 -.009 .072 .899 .241 .487
COM14 .028 .873 .034 -.002 .174 .893 .356 .629
COM10 .067 .808 .021 .005 .244 .837 .418 .509
COM9 .127 .681 -.068 .050 .214 .765 .329 .602
COM13 -.149 .660 .107 .030 .228 .754 .482 .520
FAC .746 FAC18 -.156 .026 .861 .004 .587 .293 .529 .303 FAC20 .109 -.164 .530 .323 .507 .322 .593 .399 FAC19 .186 .203 .509 .043 .620 .305 .500 .300
INT .915 INT24 .094 -.032 -.048 .838 .417 .691 .336 .873 INT23 .145 -.004 -.040 .801 .416 .606 .332 .862 INT25 -.019 .044 .093 .795 .375 .521 .348 .839 INT22 .007 -.015 .057 .790 .450 .631 .383 .838
Note. OSCS = Online Student Connectedness Survey; CFT = comfort; COM = community; FAC = facilitation; INT = interaction and collaboration.
Confirmatory Factor Analysis (CFA)
CFA using SPSS AMOS 20 was conducted to determine if the model from Study 1 could
be replicated using an independent sample. Factor loadings and the same five common model-fit
measures from Study 1 were used to assess the model's overall goodness of fit: CMIN to degrees
of freedom (CMIN/df), comparative fit index (CFI), root mean square error of approximation
60

(RMSEA), the Tucker Lewis index (TLI) and standardized root mean square residual (SRMR).
Additionally, average variance extracted (AVE) and construct reliability (CR) were used to
examine convergent validity. Divergent validity was calculated and examined using AVE and
squared interconstruct correlation (SIC) values.
Two items in factor 3 were below the desired value of .70 (Hair et al., 2010). However,
all factor loading values were .60 or greater, indicating that the model had a fair measurement
structure (Nimon & Zigarmi, 2014). Table 4.7 details CFA factor loadings for the model.
Table 4.7
Study 2 CFA Factor Loadings for Measurement Model
Item Estimate CFT4 .821 CFT7 .854 CFT8 .836 COM9 .840 COM10 .890 COM11 .764 COM12 .887 COM13 .908 COM14 .761 FAC18 .667 FAC19 .699 FAC20 .751 INT22 .839 INT23 .871 INT24 .872 INT25 .833
Note. CFT = comfort; COM = community; FAC = facilitation; INT = interaction and collaboration.
The model demonstrated acceptable fit and all fit indices met their recommended
thresholds (CMIN/df > .30, TLI > .95, CFI > .95, RMSEA < .70, SRMR < .08) (Byrne, 2010;
Hooper, Coughlan, & Mullen, 2008; Kline, 2005). Model fit indices are shown in Table 4.8.
61
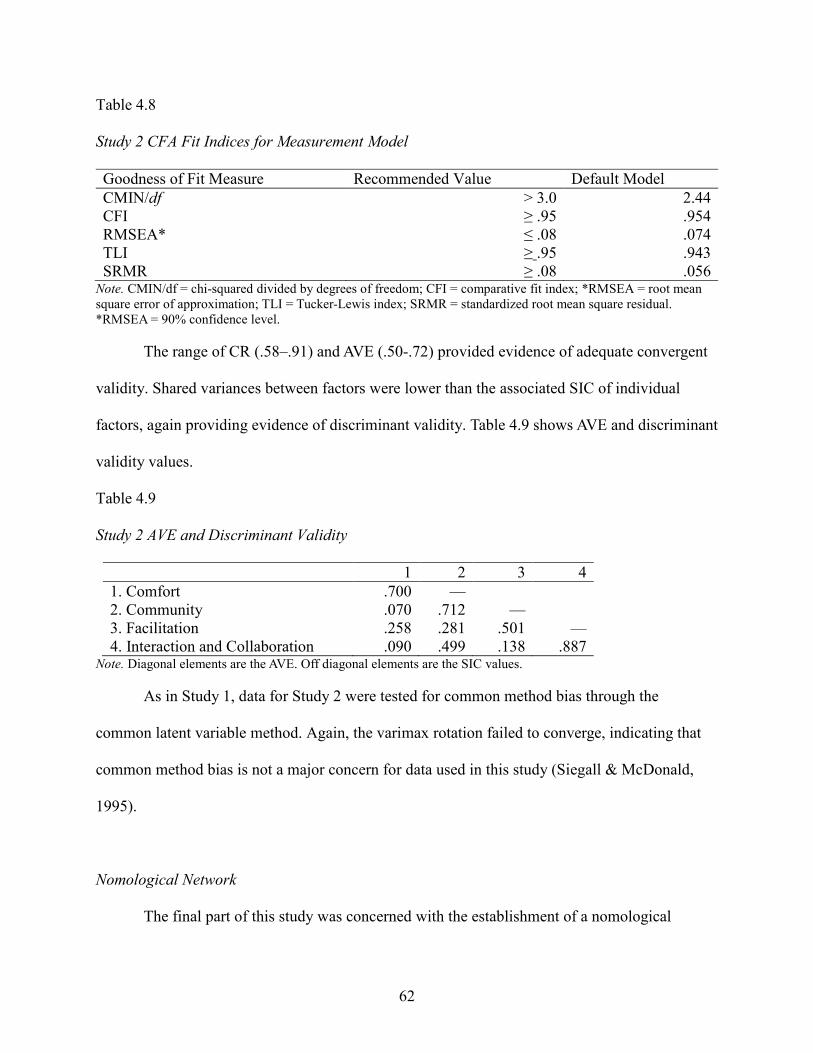
Table 4.8
Study 2 CFA Fit Indices for Measurement Model
Goodness of Fit Measure Recommended Value Default Model CMIN/df > 3.0 2.44 CFI ≥ .95 .954 RMSEA* ≤ .08 .074 TLI ≥ .95 .943 SRMR ≥ .08 .056
Note. CMIN/df = chi-squared divided by degrees of freedom; CFI = comparative fit index; *RMSEA = root mean square error of approximation; TLI = Tucker-Lewis index; SRMR = standardized root mean square residual. *RMSEA = 90% confidence level.
The range of CR (.58–.91) and AVE (.50-.72) provided evidence of adequate convergent
validity. Shared variances between factors were lower than the associated SIC of individual
factors, again providing evidence of discriminant validity. Table 4.9 shows AVE and discriminant
validity values.
Table 4.9
Study 2 AVE and Discriminant Validity
1 2 3 4 1. Comfort .700 — 2. Community .070 .712 — 3. Facilitation .258 .281 .501 — 4. Interaction and Collaboration .090 .499 .138 .887
Note. Diagonal elements are the AVE. Off diagonal elements are the SIC values.
As in Study 1, data for Study 2 were tested for common method bias through the
common latent variable method. Again, the varimax rotation failed to converge, indicating that
common method bias is not a major concern for data used in this study (Siegall & McDonald,
1995).
Nomological Network
The final part of this study was concerned with the establishment of a nomological
62

network between factors included in the OSCS, CCS, and COI. The establishment of a
nomological network is critical in psychometric studies because it examines linkages between
data from new instruments and one established by the literature and empirical studies and
provides further evidence of construct validity for newly established instruments (Cronbach &
Meehl, 1955). Figure 1.2 located in Chapter 1 represents the research model used to empirically
examine these hypotheses.
All analysis related to the examination of the nomological network was conducted using
SPSSv.20 and AMOS. To begin, alpha reliabilities and descriptive analyses were conducted to
assess the mean and standard deviation for the full scale and subscales in each instrument. Table
4.10 shows these outputs.
Table 4.10
Alpha Coefficients, Means, and Standard Deviations for Subscales of the OSCS, COI, and CCS
Instrument Scale No. of Items Α M SD
OSCS .926 Comfort 3 .873 4.226 .668 Community 6 .935 3.181 1.036 Facilitation 3 .746 3.989 .689 Interaction & Collaboration 4 .915 3.763 .874 COI .874 Social Presence 9 .876 3.878 .635 Teaching Presence 13 .920 4.020 .588 Cognitive Presence 12 .922 3.918 .619 CCS .872 Connectedness 10 .832 3.284 .659 Learning 10 .888 3.055 .735
Note. α = alpha coefficient; M = means; SD = standard deviation; OSCS = Online Student Connectedness Survey; COI = Community of Inquiry Scale; CCS = Classroom Community Scale.
Following the descriptive analysis, correlation coefficients were computed between
factors in the hypothesized network to assess the strength of the relationships. Because
directional strength was hypothesized, a one-tailed test of significance was calculated. All but
63

two of the correlational coefficient relationships between the OSCS and the CCS (FACLRN
and INTLRN) were statistically significant at (p < .001). FACLRN and INTLRN were
statistically significant at p < .05. Table 4.11 shows correlations between factors in the OSCS
(comfort, community, facilitation, interaction and collaboration), the COI (social presence,
teaching presence, cognitive presence), and the CCS (connectedness, learning).
Twelve hypotheses related to the nomological were put forth as part of this research. To
assess the strength of the relationships, strong correlation was indicated by .50 < | r |; moderate
correlation was indicated by .30 < | r | < .50; and weak correlation was indicated by .10 < | r | <
.30.
Table 4.11
Correlations between Factors in the OSCS, COI, and CCS
Cognitive Presence
Connectedness Learning Teaching Presence
Social Presence
Comfort .521** .378** .426** .458** .430** Community .502** .736** -.124** .436** .635** Facilitation .611** .602** .351 .752** .653** Interaction and Collaboration .544** .674** .021 .525** .727**
Note. **Correlations significant at p < .001; *Correlations significant at p < .005.
Results generally supported the theoretically based predictions and demonstrated that
factors established in support of online student connectedness were associated with factors of
cognitive presence, connectedness, learning, teaching presence, and social presence. This
suggests that online student connectedness as defined by data from the OSCS can be included
within the nomological network of the community of inquiry theory and factors related to the
classroom community scale. Hypothesis H2 predicted that data from the OSCS would positively
correlate to data from the CCS. This hypothesis was partially supported as an examination of
data from these two instruments revealed that all correlations between the OSCS and the CCS
64

were positive with the exception of community and learning (r = -.124, p = .001). Results for the
five remaining hypotheses for H2 varied. Hypothesis H2a predicted a strong positive relationship
between comfort from the OSCS and connectedness and learning from the CCS. This prediction
was partially supported as comfort demonstrated a moderate positive relationship with both
factors (r = .378, .426 respectively). Hypotheses H2b predicted that community from the OSCS
would demonstrate a strong positive relationship with connectedness and learning from the CCS.
Results revealed a strong positive relationship between community and connectedness (r = .726),
but a weak negative relationship between community and learning (r = -.124), meaning that
hypothesis H2b was also partially supported. Hypothesis H2c predicted a moderate positive
relationship between facilitation from the OSCS and connectedness from the CCS and a strong
positive relationship between facilitation from the OSC and learning from the CCS. Facilitation
demonstrated a strong positive relationship with connectedness (r = .602) and a moderate
positive relationship with learning (r = .351). Overall, this hypothesis was partially supported.
The final hypothesis between the OSCS and the CCS predicted that interaction and collaboration
would demonstrate a strong positive relationship with both connectedness and learning. This
prediction was partially supported. Interaction and collaboration was strongly correlated with
connectedness (r = .674), but no relationship was shown to learning (r = .021). In summary,
factors related to connectedness from the CCS generally correlated highly with factors from the
OSCS while factors related to learning from the CCS correlated moderately or not at all with
factors from the OSCS.
Hypotheses H3 predicted that data from factors of the OSCS would correlate both
positively and negatively with data from factors of the COI. This hypothesis was not supported
because an examination of the correlation coefficients reveals that all correlations computed for
65

data from these two scales was positive. Hypotheses H3a predicted a strong positive relationship
between comfort from the OSCS and social presence and teaching presence from the COI. This
prediction was partially supported as comfort demonstrated a moderate positive relationship with
both factors (r = .458, .430 respectively). Hypothesis H3b predicted a strong positive relationship
between community from the OSCS and social presence from the COI and a moderate positive
relationship between community from the OSCS and teaching presence from the COI. This
hypothesis was supported (r = .635, .436 respectively). Hypothesis H3c predicted a strong
positive relationship between facilitation from the OSCS and teaching presence from the COI
and a moderate positive relationship between facilitation and social presence. Results partially
supported this hypothesis as facilitation and teaching presence demonstrated a strong relationship
(r = .653), but also a strong positive correlation with social presence (r = . 752). Hypothesis H3d
was also partially supported. It was predicted that interaction and collaboration from the OSCS
would demonstrate a strong positive relationship with social presence from the COI and only a
moderate positive relationship with teaching presence from the COI. Instead, interaction and
collaboration demonstrated a strong positive relationship with both social presence (r = .727)
and teaching presence (r = .525).
Of note are the results of hypotheses H3e and H3f. Cognitive presence was not expected
to correlate strongly with factors from the OSCS that are related to student connectedness and
interaction based on prior literature (Garrison, Anderson, & Archer, 2000). Overall, it was
predicted to exhibit a strong correlation with comfort and facilitation from the OSCS (H3e) and a
weak correlation with community and interaction and collaboration (H3f). The predictions for
H3e were supported (r = .521, .621) for both factors respectively. However, both community and
interaction and collaboration also correlated strongly with cognitive presence (r = 502, .544),
66

meaning that H3f was partially supported. Details for individual hypotheses related to data from
the OSCS, CCS, and the COI; and their correlation outcomes are shown in Table 4.12.
Table 4.12
Results of Hypotheses Predicted for Study 2
Hypothesis Path Prediction
Strength Prediction
Strength Actual
Direction Prediction
Direction Actual
Hypothesis Supported?
H2a CFTCON Strong Moderate Positive Positive Partial CFTLRN Strong Moderate Positive Positive Partial H2b COMCON Strong Strong Positive Positive Yes COMLRN Strong Weak Positive Negative No H2c FACCON Moderate Strong Positive Positive Partial FAC LRN Strong Moderate Positive Positive Partial H2d INTCON Strong Strong Positive Positive Yes INTLRN Strong None Positive Positive No H3a CFT SP Strong Moderate Positive Positive Partial CFTTP Strong Moderate Positive Positive Partial H3b COM SP Strong Strong Positive Positive Yes COMTP Moderate Moderate Positive Positive Yes H3c FACSP Moderate Strong Positive Positive Partial FACTP Strong Strong Positive Positive Yes H3d INTSP Moderate Strong Positive Positive Partial INTTP Strong Strong Positive Positive Yes H3e CFT CP Strong Strong Positive Positive Yes FAC CP Strong Strong Positive Positive Yes H3f COM CP Weak Strong Positive Positive Partial INTCP Weak Strong Positive Positive Partial
Note. CFT = Comfort from the OSCS; COM = Community from the OSCS; FAC = Facilitation from the OSCS; INT = Interaction and Collaboration from the OSCS; LRN = Learning from the CCS; CON = Connectedness from the CCS; SP = Social Presence from the COI; TP = Teaching Presence from the COI; CP = Cognitive Presence from the COI.
Based on these results, the final nomological network model was altered. Figure 4.1
shows the final directional paths and strengths between factors form the OSCS, COI and CCS.
67

Figure 4.1. Final model for OSCS nomological network.
Key OSCS: Online Student Connectedness Survey COI: Community of Inquiry Scale CCS: Classroom Community Scale Directional Paths Strong Correlation: Moderate Correlation: Weak Correlation:
Summary
Chapter 4 included the results of this study. Data analysis and evaluation of hypotheses
put forth as part of this study were described in detail. Chapter 5 presents a discussion of
findings, recommendations for future research, and implications for practice.
68
CHAPTER 5
FINDINGS, RECOMMENDATIONS, AND IMPLICATIONS
The objective of this chapter is to discuss the findings from the present study and to
present recommendations and implications for future research and practice. This chapter is
organized into three sections. The first section summarizes and presents a discussion of the
findings. The next section discusses limitations and delimitations of this study and provides
recommendations for future research. The final section provides implications of this study’s
findings for theory and practice.
Discussion of Findings
The purpose of this study was to examine validity and reliability of data from the Online
Student Connectedness Survey (OSCS) and to establish its nomological network. The study was
broken into two parts. Study 1 examined factor validity for data from the OCSC using sequential
EFA-CFA. Study 2 sought to replicate the refined version of the OSCS using data from an
independent sample and empirically test the proposed nomological network. Three sets of
hypotheses guided this study. Findings for each are discussed below.
Factor Validity of the OSCS: Hypotheses H1a, H1b, and H1c
The first set of hypotheses sought to examine the factor structure of the OSCS using
sequential EFA-CFA and confirm the findings using an independent sample thorough CFA.
Using a split sample (n1 = 159; n2 = 318), the a priori four-factor structure of the OSCS held
during the initial EFA, but nine of the original items were deleted during the analysis because
they either loaded on the incorrect factor or they did not meet the required pattern coefficient
threshold of .50 or higher (Ford, MacCallum, & Tait, 1986; Henson & Roberts, 2006). This left
69

16 items in the revised version of the scale for use during the sequential CFA portion of this
study. Though lower than the results of the original Turkish study, factor coefficients for each
item were above .70 during CFA (Hair et al., 2010), and alpha reliabilities were consistent with
common results found in psychometric studies (Bangert, 2009; Henson & Roberts, 2006; Rovai,
2002a, 2002b). Further, the model demonstrated acceptable fit (CMIN/df = 2.41; CFI = .955;
RMSEA = .067; TLI = .945; SRMR = .048). These findings provided preliminary evidence of the
factor structure of the OSCS.
To further examine data from the instrument for validity and reliability, CFA was then
conducted on data from the OSCS using an independent sample. The goal of this analysis was to
replicate results of the first study and confirm the factor structure of the revised version of the
instrument. Again, the factor structure held. Factor coefficients for all items were above .60 and
considered acceptable (Nimon & Zigarmi, 2014). Additionally, the model exhibited acceptable
fit (CMIN/df = 2.44; CFI = .954; RMSEA = .074; TLI = .943; SRMR = .056). These results
confirmed factor validity for data from this study’s sample and provide further evidence of
reliability and validity of the OSCS. Findings of this portion of the study suggest that data from
the OSCS is valid and reliable for assessing the feelings of connectedness among students in
online courses.
H2: Data from the OSCS will demonstrate convergent validity with data from the CCS.
Hypotheses included in H2 evaluated relationships between the OSCS and the CCS.
Predictions made in H2 were partially supported, demonstrating a link between the OSCS and
the CCS. Of note were the results of correlations between the factor learning from the CCS and
each factor of the OSCS. First, community from the OSCS was predicted to have a strong
70

positive relationship with learning from the OSCS. Results indicated the exact opposite
(r = -.124). This correlation is considered weak according to established thresholds (Ward,
Fischer, & Lam, 2009). Additionally, the correlation was negative, indicating that as one factor
increased, the other decreased. At face value, this result seems to conflict with literature related
to social learning and the assertion that learning increases as meaningful relationships and the
group’s trust deepens (Bandura, 1971; Dawson, 2006; Sadera, Robertson, Song, & Midon,
2009). However, it is important to note that correlation does not equal causation, and it should
not be interpreted that in all cases as the sense of community increases, learning decreases or
vice-versa (Wright, 1921). Instead, a more thorough examination of the items in the learning
factor of the CCS is warranted.
Of the ten items listed in the learning factor of the CCS, three are centered on the ability
to have questions answered by others in the course, and two speak to the personal motivation to
learn. Within these items, the concept of learning is positioned as an external process that relies
solely on the course facilitator and the personal motivation of the learner. The remaining five
items are positioned to question learning as part of a community, but three are negatively
worded. Prior research suggests that negatively worded items may impact correlations in Likert-
scale instruments (Roszkowski & Soven, 2010). The structure of the learning factor of the CCS
vastly contrasts with the structure of the community factor of the OSCS. Here, all items are
positively worded, and each focuses on building relationships with others within the
environment. For this reason, the results of this correlation may have been affected by wording
and format. Before concluding that a negative relationship exists between the concept of learning
and community, further empirical evaluation is recommended between these two factors.
71

H3: Data from the OSCS will be both positively and negatively correlated with data from the COI.
The final set of hypotheses included in this study examined the relationship between the
OSCS and the COI. Here, predictions were generally supported with a few exceptions. First, the
interaction and collaboration factor from the OSCS was predicted to have a moderate positive
relationship with the factor of social presence from the COI. While the relationship was positive,
it was strong, not moderate as predicted. This may suggest the facilitator’s formal title is not a
hindrance to students viewing this role as a partner in the community of learning as was
previously suggested in the literature (Arbaugh & Benbunan-Fich, 2007).
Another significant finding was the strong correlation between factors from the OSCS
and the cognitive presence factor from the COI. Prior literature provided no support for a direct
correlation between cognitive presence, community, and interaction and collaboration; therefore,
a weak correlation was hypothesized. Contrary to this prediction, cognitive presence
demonstrated both a statistical significance and a strong correlation with community and
interaction and collaboration (p < .001; r = .502, .544 respectively). This finding is practically
significant because literature on the role that cognitive presence plays in the establishment of
student connection in online classes is in its infancy stages, and it has been suggested that
cognitive presence is not a factor that directly influences feelings of connectedness between
participants in online educational settings (Pollard, Minor, & Swanson, 2014). Additionally, it
was previously posited that students participating in this course modality seek higher meaning
through critical thinking as part of their learning process (Garrison, Anderson, & Archer, 2000).
Based on the findings in this study, it can be deduced that the ability to connect with peers
through facilitated interactions contributes to this critical thinking process. All other hypotheses
in H3 were supported and behaved as predicted.
72

OSCS Factor Examination
An additional finding of this study was developed from an analysis of the items
associated with each factor of the OSCS. As mentioned earlier, nine items were deleted during
the initial EFA, leaving only 16 of the original 25 items in the revised version. The most stable of
the OSCS factors during this portion of the study was community. During the initial EFA, this
factor was the only one that was able to retain all items because they met acceptable thresholds
with factor coefficients, structure coefficients, and communalities. Additionally, the community
factor demonstrated the highest alpha reliability (α = .924).
Items representing the factor of facilitation were weakest in terms of alpha reliability,
AVE, and CR during both parts of this study. A review of the survey reveals that of the six
original items in the factor, only three were retained during the initial EFA analysis. Of the
deleted items, two contained the word “collaboration” and inquired about facets of interaction
between students. In general, these items seemed to be synonymous with items in the interaction
and collaboration factor and may be the reason they correlated strongly here during EFA.
The final deleted item in the facilitation factor asked for opinions about the facilitator’s
role in promoting interaction between learners. Here again, wording of the questions could be
perceived as an inquiry about interaction between students as well. Because the wording of these
items was so closely linked, it is believed that this led to their failure to load on the predicted
factor and their low factor correlations. Of note is the fact that the facilitation factor
demonstrated a strong correlation with the interaction and collaboration factor during the initial
EFA (r = .642) even after item deletion. This again suggests that this factor could have some
overlap with the interaction and collaboration factor.
73

Conclusion of Findings
In summary, results of this study’s findings provide sufficient evidence of validity and
reliability for the OSCS. Results of the nomological network suggest that, while the OSCS has a
relationship with the CCS and COI, enough variance exists to establish the OSCS as a different
way to measure facets of feelings of connectedness between students participating in online
educational environments. Because data from the COI and CCS has been established empirically,
linkages between these scales and the OSCS provides further evidence of construct validity for
the OSCS instrument as a valuable tool to measure student connectedness in online settings.
Strong evidence of construct validity is important for scales used in social research (Cronbach,
1951).
The findings of this study add to the literature surrounding successful strategies for the
design and implementation of distance learning courses. Data suggests that perceived feelings of
connection is multi-faceted and involves equal participation from the students and the course
facilitator. It was previously assumed that the course facilitator provided the platform for student
connection, but that their title alienated them from being viewed as a participant in the course
(Garrison, Anderson, & Archer, 2000). However, data from this study demonstrated that
facilitation had strong relationships with factors in both the COI and CCS, suggesting that the
facilitator plays a major role in the level of connectedness perceived between students in online
settings. For this reason, distance courses should be designed with active participation from the
facilitator in mind. Teaching strategies in these courses should also be examined, and support for
additional professional development of distance learning facilitators may be warranted.
The findings of this study also provide the academic community with empirical evidence
for a viable instrument to measure feelings of connection exclusively in online educational
74
settings. As stated earlier, limited instruments exist in this area, and the OSCS is thought to be
the first instrument that examines the role that the facilitator, student, and comfort with
interaction and technology playing a role in developing feelings of connection between students
in distance learning settings. A major conclusion of this study is evidence that the OCSC holds
promise for the academic and practitioner community above the CCS and the COI.
Limitations, Delimitations, and Recommendations for Future Research
No matter how thorough, no study is without its limitations and delimitations. It is
important to discuss this information because it influences the interpretation and places
constraints on the generalizability of the study’s results. As such, major limitations and
delimitations affecting the generalizability of this study’s results will be discussed in this section.
One limitation of this study is the difference in teaching methods and styles of facilitators
in online courses. It is suspected that the level of interaction between the facilitator and students
might vary greatly depending on one’s teaching style and experience with teaching in a virtual
environment. Additionally, participants may have been participating in more than one online
course simultaneously, which could have magnified this dissimilarity. These differences could
have influenced participant responses to the questions, specifically those that were focused on
facilitation and learning. To mitigate for the dual enrollment issue, participants were instructed to
concentrate on just one course while completing the surveys, but the possibility that this
direction was not followed cannot be ignored. Mitigating for teaching style was outside of the
scope of this study. A recommendation for future research is to determine if teaching style has an
impact on the results of the data. To conduct a study of this type, course facilitator teaching
styles could be determined prior to submitting the OSCS to students in their respective courses. It
75

would be useful to examine the degree of teaching presence and immediate behaviors (e.g.,
timing of feedback and frequency of interaction) as well as how they might influence perceptions
of connection and success of students in the course. From here, a test of measurement invariance
could be conducted to determine the effect, if any, that teaching styles have on student responses.
A second limitation of this study was the risk of a homogeneous sample. Participation in
this study was voluntary. Because of the topic, it was plausible to believe that the sample for this
study would consist of those students with a preference for online courses versus the traditional
format. Measures to control for this anticipated preference were included in the data screening
and collections methods. A question was placed at the beginning of the survey asking
participants to share their overall preference for online courses. The research panel was given
thresholds to ensure that the sample was diverse. A recommendation for future studies would be
to collect data separately for students who prefer online courses versus those who do not to
examine whether or not these differences affect the findings put forth in this study. Additionally,
students who may have taken online courses at one point but who are no longer enrolled in an
online course could be included in the study. Data from this population could provide insight as
to whether or not feelings of connectedness, or lack thereof, influenced their decisions about
continued attendance in this course modality.
The next limitation of this study was related to student preference for course modality. In
some cases, students may be forced into an online class because the institution only offers
courses they need in that format. For these students, both preference and the level of experience
with technology used in the online course could be factors in their overall satisfaction with the
online learning experience (Rodriquez, Ooms, Montanez, & Yan, 2005). If any of the students in
the current study were in this situation, their feelings may have influenced the results. This study
76

gathered information about participants' feelings toward online courses through the initial
screening process, but these feelings were not factored into the analysis. Additionally, testing for
level of comfort with technology was beyond the scope of this study. A future study could
include examining the extent to which students utilize technology outside of the classroom, their
current level of comfort with technology, and their motivation to learn technology tools utilized
in the course. By combining these variables with results of students connectedness gauged from
their responses to the OSCS, insight on the impact that course modality preference and comfort
with technology have on overall course satisfaction could be explored.
A final limitation of this study is the fact that it relied on self-report data. Self-report data
may provide unreliable results because of recall problems and social desirability effects
(Crockett, Schulenberg, & Petersen, 1987). Tests of social desirability in scale items attempt to
measure the truthfulness of respondents during self-report studies (Crowne & Marlowe, 1960).
The effects of social desirability can introduce bias, which can become a source of error in
psychological and social science testing. Although safeguards to mitigate for these phenomena
were included in this study via the survey configuration, tests for social desirability impacts were
outside of the scope of this study. A future recommendation would be to include a test of social
desirability as part of the scale to mitigate this risk. Including a test of this kind could provide
more confidence in the results obtained in future studies.
A main delimitation of this study was the sample. The sample was purposely limited to
students located in and taking courses at four-year universities in the United States. For this
reason, results of this study are limited to the cultural aspects of those in the United States. In
future studies, the sample could be expanded to include students outside of the United States. In
doing so, the researcher would need to determine if cultural differences related to interaction and
77
collaboration in educational settings could be a factor in the results obtained. One way to
determine if cultural differences are a factor would be to assess manifest validity. Manifest
validity studies how language is selected and combined into questionnaire statements during the
creation of surveys (Larsen, Nevo, & Rich, 2008; Nimon, Shuck, & Zigarmi, 2015). Based on
the language used in a statement and the interpretation of the respondent, language bias could
occur and impact the overall results. Conducting a test of manifest validity for the OSCS could
help mitigate against potential cultural differences related to language when administering the
survey outside of the United States.
Finally, the sample was limited to those enrolled in online courses that were
asynchronous in nature, meaning there were no scheduled meetings in person or through the use
of technology. Adding the element of face-to-face classroom instruction makes a course blended
(Allen & Seaman, 2014) as opposed to fully online, which conflicts with the target audience that
the OSCS purports to measure. However, a recommendation would be to broaden the audience to
include participants enrolled in courses that do include the element of synchronous meetings
using technology to determine if that element would affect the results. Doing so could increase
generalizability if the structure of the instrument holds.
One finding not related to limitations and delimitations in this study that warrants further
research is the link between community and learning. In many online courses, the structure
includes required discussions between students via chat boards. This type of requirement may
have been instituted as a staple in online courses to somehow account for the absence of face-to-
face conversations that would take place in a traditional setting. It has been posited that
discussion between students can enhance the sense of community (Bolliger, 2004; Rovai,
2002a). However, findings from this study may suggest that community may not be a strong
78

factor influencing learning. An additional recommendation for research is to revisit the concept
of community as it relates to connection in online learning. As society’s comfort level with
technology grows, the way communities and communication take place has evolved.
Applications like Facebook, Instagram, and Vine provide a sense of connection and community
between people where direct conversation and words are not always necessary to build this sense
of community. Future research could explore connection between students in online courses
where forced discussion has been replaced with other forms of connection including the use of
social media tools. This research could strengthen the understanding of how different forms of
community building affect connection in online educational settings.
The addition of an empirically tested instrument designed to measure feelings of online
student connectedness holds promise for research related to success and retention of students in
this course type. Quantitative studies can be conducted across cultures and provide support for
strategic decisions related to the expansion of online courses at institutions of higher education
and to the format of these courses.
Implications for Theory and Practice
Findings of this study support the use of the OSCS as a viable instrument to measure
feelings of connection between students participating in online educational settings. As such,
implications for theory and practice are detailed below.
Implications for Theory
The concept of online learning has evolved in past decades, yet theories devoted to this
area are still in the infancy stages (Zimmerman, 2012). One of the strongest theoretical concepts
79
in the literature for online learning is the assertion that community and connection have strong
links to the performance and learning of students participating in this course modality (Akyol &
Garrison, 2008; Bolliger & Inan, 2012; Rovai, 2002a, 2002b). This study was able to add to the
body of research on social learning and provide evidence that community is a factor involved in
the study of feelings of connection in online classes through its presence in prior research.
The finding that cognitive presence is highly correlated to feelings of connection may
enhance future theories related to online learning. The opportunity to provide a framework that
explores the integration between student connectedness in online courses and their level of
cognitive presence will strengthen the research on the phenomena of how connectedness is
achieved and sustained in the online educational environment. New theories devoted to the
development of cognitive presence and the variables that influence this factor would also be
useful.
Another interesting theoretical implication related to online courses are preconceived
notions that students have toward online learning courses based on prior experience with this
course modality. A growing body of research explores why students drop out of online courses
(Carr, 2000); however, theories devoted to the decision to remain in this course modality are
absent from the literature. It can be assumed that major drivers influencing the choice to attend
an online class are the age of the student and current work status (e.g., full-time, part-time, and
unemployed); however, theories related to the exploration of these decisions do not appear to
exist. Using the OSCS to measure perceived feelings of comfort, community, facilitation, and
interaction and collaboration for students currently in these courses could lead to the
development of theories and frameworks that would examine variables affecting the cognitive
80

factors involved in the decision to continue along this path of education. Additional implications
for theory related to each factor of the OSCS are discussed below.
Implications for Practice
The OSCS is a tool that can be used to assess the current performance of online courses
at higher educational institutions and potentially determine the satisfaction level of students in
these courses. This type of assessment could lead to the creation of early intervention and
retention strategies designed to improve satisfaction for these students. Because online course
enrollment is expected to increase over the next decade (Allen & Seaman, 2014), this exploration
is critical for institutions with online learning courses already in place as well as those attempting
to implement programs of this type.
An additional implication for practice is the impact that student feelings of connectedness
in current courses could have on the design and development of future online courses.
Technological advances open the door for creativity in the way these courses are structured. In
addition, the findings of this study may raise awareness of how students view facilitation
strategies of the instructor, and it is quite possible that more time and effort could be placed on
professional development for those teaching online courses. The OSCS can be used as a vehicle
to recognize the need for change and implement new ideas based on a more thorough
understanding of student needs, expectations, and motivations regarding connectedness.
Additional implications are discussed for each factor of the OSCS below.
Comfort
Bolliger and Inan (2012) defined comfort as “experiencing contentment and security with
81

either integrated technologies or the learning environment” (p. 45). When designing and
implementing online courses, both the institution and the instructor have a duty to ensure that the
learning environment is a safe place for students to express thoughts and concerns and ask for
help if needed. From an institutional perspective, support for technology should be readily
available to students. This support can range from online helpdesk numbers, online chat support,
or courses designed to familiarize students with the technology courseware. Because online
learning can take place anywhere and includes students across time zones, appropriate staffing to
support learner needs must be determined. Additionally, institutions should consider including
questions from the comfort factor of the OSCS in their end-of-course survey to help unveil
student perceptions about the level of support they received. Satisfaction thresholds should be set
that will help the institution ensure that they are meeting goals. One of the most important
aspects of gathering this type of feedback would be to have a plan of action to act on the
feedback once received.
This study added to the body of knowledge concerning the importance that the instructor
plays in helping students develop feelings of connectedness in online courses. Instructors should
work to encourage active participation between students in their courses. Their role should not
simply be as spectator, but as an active participant in discussions and other activities designed to
help students connect. More importantly, responses between students should be monitored so
that corrective action can be taken if comments appear to belittle or stifle the appropriate sharing
of ideas.
As it relates to comfort with technology, instructors have a responsibility to have
functional knowledge of course that is being used to teach. Although instructors may not be able
to provide the same level of support as a technical helpdesk, there should be some ability to
82
assist with simple troubleshooting. It is also important that facilitators inform their students about
technical support options that are available to them.
Community
Community is described as the feeling of belonging and commitment that members have
with others in a group (Bolliger & Inan, 2012). In essence, it is the ability for learners to connect
with one another by building a bond of trust and emotional attachment. Forming a sense of
community may take time; therefore, the course should be designed in a way that helps this
bonding take place as quickly as possible. Immediate bonding can accomplished with course
introductions between students and the instructor (Slagter van Tyron & Bishop, 2006). These
introductions do not always need to take place on discussion boards. With the incorporation of
social media into educational settings, institutions and facilitators alike are encouraged to explore
how sites like Instagram and Vine might be used to help in this area.
Monitoring feelings of community is critical in online learning because it has been
posited that students who feel a sense of isolation are more likely to drop out of a course (Carr,
2000). Here again, instructors play a major role in mitigating these feelings. It is important that
instructors monitor the participation of students and reach out to connect with those who may not
be as active as others to determine if an issue exists. Additionally, the institution is encouraged to
have a feedback mechanism for these students in the event that the student is not comfortable
discussing these issues with the instructor.
Understanding perceived feelings of community begins with evaluation. Questions from
the OSCS can be used to examine the feedback and determine if action is necessary to help
enhance the feelings of community between students completing the course.
83
Facilitation
Facilitation, as defined by the OSCS, is the ability of the instructor to create learning
communities and establish teaching presence (Bolliger & Inan, 2012). Findings of this study
suggest that this role permeates all aspects of online course including learning, social presence,
connectedness, and cognitive thinking. Because this role is so critical to the success of the
course, it is important that the right instructors are placed in these positions and that continuous
professional development opportunities are made to these instructors. At the onset of online
teaching assignments, institutions are encouraged to arm their instructors with tools that help
them promote collaboration between students. The tools can range from the use of blogs
dedicated to the course content to tools designed to allow communication between multiple
people across time zones. Making these options available to facilitators provides avenues for
creativity.
Class size may be a factor in the ability to facilitate effectively in online courses.
Although data on the average class size for online courses is not readily available, personal
experience reveals that this number can range from 12 students to 50 students depending on the
nature and content of the course. In larger classes, it may be difficult for an instructor to make
contact on a regular basis with students. For this reason, institutions are strongly urged to make
thoughtful decisions about the number of students placed on a course roster and strike a balance
between meeting financial goals and ensuring student satisfaction.
The OSCS can be used to effectively gather feedback about perceptions of the
facilitator’s interactions throughout the course. Items within the facilitation factor monitor for the
timeliness of feedback, tools used to promote collaboration between others, and the actual level
of participation that the instructor demonstrates with others in the course. Collectively, these
84

areas provide the framework for instructor success; therefore, they should be monitored
frequently.
Interaction and Collaboration
Bolliger and Inan (2012) posit that students rely on the ability to interact and collaborate
as a means of transforming information into knowledge. Similar to community, the interaction
and collaboration factor is concerned with promoting teamwork and collaboration between
students in online courses. Admittedly, this aim can be a challenge when students are dispersed
geographically. One suggestion for promoting collaboration is the incorporation of group
projects into these courses (Carr, 2000). Group projects can promote conversation and the
sharing of ideas between students as they work towards a common goal. If this path is selected,
both the course designer and the instructor must be certain that work effort is evenly distributed
so that learner satisfaction is not negatively impacted. The OSCS is designed to monitor feelings
of interaction and collaboration as it relates to both the sharing of ideas and the collaboration of
work efforts. Therefore, its use may provide valuable insight into the aspect of online learning
courses.
In summary, the OSCS can be a viable tool for determining performance of online
courses in the areas of comfort, community, facilitation, and interaction and collaboration. Its
introduction to the practitioner community holds promise for the ability to effectively evaluate
these variables and make thoughtful, data-driven decisions.
Conclusion
This study was undertaken to determine if the OSCS could hold promise for the academic
85
and practitioner community as it relates to research for the design of online courses and the
success and retention of students participating in this course modality. Research findings
accomplished the task of providing evidence of factor validity, reliability, and construct validity
for data gathered using the OCSC. Additionally, it provides evidence that the tool may be useful
in further research designed to study this phenomenon. The introduction of a reliable and valid
scale to measure feelings of connection between students in online courses holds promise for a
fresh perspective on this course format. For these reasons, this study provides a significant
contribution to theory, research, and practice related to this phenomenon.
86

APPENDIX A
IRB DOCUMENTATION
87

UNT A green light to greatness.
THE OFFICE OF RESEARCH INTEGRITY AND COMPLIANCE
June 6, 2014
Dr. Kim Nimon Student Investigator: Tekeisha Zimmerman Department of Learning Technologies University of North Texas RE: Human Subjects Application No. 14-216
Dear Dr. Nimon: In accordance with 45 CFR Part 46 Section 46.10 I, your study titled “Testing the Psychometric Properties of the Online Student Connectedness Survey” has been determined to qualify for an exemption from further review by the UNT Institutional Review Board (IRB).
No changes may be made to your study’s procedures or forms without prior written approval from the UNT IRB. Please contact Jordan Harmon, Research Compliance Analyst, ext. 4643. if you wish to make any such changes. Any changes to your procedures or forms after 3 years will require completion of a new IRB application.
We wish you success with your study.
Sincerely,
Patricia L. Kaminski, Ph.D. Associate Professor Chair, Institutional Review Board
PK:jh
UNIVERSITY OF NORTH TEXAS 1155 Union Circle #310979 Denton, Texas 76203-5017
940.369.4643 ~ 940.369.7486 ~ www.rcscarch.unt.cdu
88

UNT. A green light to greatness.
THE OFFICE OF RESEARCH INTEGRITY AND COMPLIANCE
February 19, 2015
Dr. Jeff Allen Student Investigator: Tekeisha Zimmerman Department of Learning Technologies University of North Texas
Institutional Review Board for the Protection of Human Subjects in Research (IRB) RE: Human Subject Application #14-216
Dear Dr. Nimon:
The UNT IRB has received your request to modify your study titled “Testing the Psychometric Properties of the On-line Student Connectedness Survey” As required by federal law and regulations governing the use of human subjects in research projects, the UNT IRB has examined the request to modify the supervising investigator from Kim Nimon to Jeff Allen. The modification to this study is hereby approved for use with human subjects.
Please contact Jordan Harmon, Research Compliance Analyst II, at (940) 565-4258, if you wish to make changes or need additional information.
Chad Trulson, Ph.D. Professor Chair, Institutional Review Board
PKJ
UNIVERSITY OF NORTH TEXAS 1155 Union Circle #310979 Denton, Texas 76203-5017
940.369.4643 940.369.7486 fax www.research.unt.edu
89

APPENDIX B
PRE-SURVEY NOTIFICATION EMAILS
90

Study 1: Email sent to identified participants 1 week prior to survey distribution
Hello,
Thank you for your agreement to participate in our research study involving the validation of a
survey designed to measure student connectedness in online courses. The survey, entitled the
Online Student Connectedness Survey, is a 25-item survey purported to measure feelings of
connectedness for students enrolled in online courses.
In approximately 7 days, you will receive an email that will contain a link to an electronic
survey. The survey will take 15-20 minutes to complete and participation is voluntary. Your
decision to participate or not will have no impact on the grade you receive in your current course.
Your responses will be confidential and we will not collect identifying information such as your
name, email address or IP address.
If you have any questions about the study, please contact Kim Nimon at [email protected] or
Tekeisha Zimmerman at [email protected].
Thank You
91

Study 2: Email sent to identified participants 1 week prior to survey distribution
Hello,
Thank you for your agreement to participate in our research study involving the validation of a
survey designed to measure student connectedness in online courses. In approximately 7 days,
you will receive an email that will contain a link to an electronic survey. The survey contains XX
items and will take 25–30 minutes to complete. Your decision to participate or not will have no
impact on the grade you receive in your current course. Your responses will be confidential and
we will not collect identifying information such as your name, email address or IP address.
If you have any questions about the study, please contact Jeff Allen at [email protected] or
Tekeisha Zimmerman at [email protected].
Thank You
92

REFERENCES
Akyol, Z., & Garrison, D. R. (2008). The development of a community of inquiry over time in an
online course: Understanding the progression and integration of social, cognitive, and
teaching presence. Journal of Asynchronous Learning Networks, 12(3-4), 3–22.
Retrieved from http://sloanconsortium.org/publications/jaln_main
Akyol, Z., Garrison, D. R., & Ozden, M. Y. (2009). Development of a community of inquiry in
online and blended learning contexts. Procedia—Social and Behavioral Sciences, 1(1),
1834–1838. doi:10.1016/j.sbspro.2009.01.324
Allen, I. E., & Seaman, J. (2014). Grade change: Tracking online education in the United States.
Babson Park, MA: Babson Survey Research Group and Quahog Research Group.
Retrieved from http://www.onlinelearningsurvey.com/reports/gradechange.pdf
Allen, J. L., Miller, T. A., Fisher, B., & Moriarty, D. D., Jr. (1982). A Survey of January Interim
Psychology Courses, 9 (4), 230-231. doi:10.1207/s15328023top0904_14
Anastasi, J. S. (2007). Full semester and abbreviated summer courses: An evaluation of student
performance. Teaching of Psychology, 34(1), 19–22.
Apodaca, R., Lea, S., & Edwards, B. (1998). The effect of longitudinal burden on survey
participation. Paper presented at the Annual Conference of the American Association for
Public Opinion Research, St. Louis, MO. Retrieved from http://www.amstat.org/
sections/SRMS/Proceedings/papers/1998_156.pdf
Aragon, S. R. (2003). Creating social presence in online environments. New Directions for Adult
and Continuing Education, 100, 57–68.
Arbaugh, J. B., & Benbunan-Fich, R. (2007). The importance of participant interaction in online
environments. Decision Support Systems, 43(3), 853-865. doi:10.1016/j.dss.2006.12.013
93

Arbaugh, J. B., Cleveland-Innes, M., Diaz, S. R., Garrison, D. R., Ice, P., Richardson, J. C., &
Swan, K. P. (2008). Developing a Community of Inquiry instrument: Testing a measure
of the COI framework using a multi-institutional sample. Internet and Higher Education.
11(3-4), 133–136.
Arrindell, W. A., & van der Ende, J. (1985). An empirical test of the utility of the observations-
to-variables ratio in factor and components analysis. Applied Psychological
Measurement, 9(2), 165–178.
Bandura, A. (1971). Social learning theory. New York, NY: General Learning.
Bangert, A. W. (2009). Building a validity argument for the community of inquiry survey
instrument. Internet and Higher Education, 12(2), 104–111.
Barnard-Brak, L. & Shiu, W. (2010). Classroom Community Scale in the blended learning
environment: A psychometric review. International Journal on E-Learning, 9(3), 303-
311. Chesapeake, VA: Association for the Advancement of Computing in Education
(AACE). Retrieved from http://search.proquest.com/docview/62062456?accountid=7113
Baruch, Y. (1999). Response rates in academic studies: A Comparative Analysis. Human
Relations, 52, 421–438.
Baruch, Y., & Holtom, B. C. (2008). Survey response rate levels and trends in organizational
research. Human Relations, 61(8), 1139–1160. doi:10.1177/8726708094863
Baym, N.K. (1995). The emergence of community in computer-mediated communication. In
S.G. Jones (Ed.), CyberSociety: Computer-Mediated Communication and Community
(pp. 138–163). Thousand Oaks, CA.: Sage.
94

Beaton, D. E., Bombardier, C., Guillemin, F., & Ferraz, M. B. (2002). Recommendations for the
cross-cultural adaptation of health status measures. Rosemont, IL: American Academy of
Orthopedic Surgeons.
Ben-Nun, P. (2008). Respondent fatigue. In P. Lavrakas (Ed.), Encyclopedia of survey research
methods. (pp. 743–744). Thousand Oaks, CA: Sage. http://dx.doi.org/10.4135/
9781412963947.n480
Bolliger, D. U. (2004). Key factors for determining student satisfaction in online courses.
International Journal on E-Learning, 3(1), 61–67.
Bolliger, D. U., & Inan, F. A. (2012). Development and validation of the online student
connectedness survey (OSCS). International Review of Research in Open and Distance
Learning, 13(3), 41-65. Retrieved from http://www.irrodl.org/index.php/irrodl/index
Boston, W., Diaz, S. R., Gibson, A. M., Ice, P., Richardson, J., & Swan, K. (2004). An
exploration of the relationship between indicators of the community of inquiry
framework and retention in online programs. Journal of Asynchronous Learning
Networks, 13(3), 67–83.
Brown, J. D. (2009). Choosing the right type of rotation in PCA and EFA. JALT Testing and
Evaluation SIG Newsletter, 13(3), 20–25. Retrieved from http://jalt.org/test/bro_31.htm
Byrne, B.M. (1998). Structural equation modeling with LISREL, PRELIS, and SIMPLIS: Basic
concepts, applications and programming. Mahwah, N. J.: Erlbaum.
Byrne, B.M. (2001). Structural equation modeling with AMOS: Basic concepts, applications and
programming. (2nd ed.) Mahwah, N. J.: Erlbaum.
95
Cape, P. Questionnaire length, fatigue effects and response quality revisited. Paper presented at
ARF: Rethink, 2010. New York, NY. Retrieved October 7, 2012 from
http://www.surveysampling.com/ssi-media/Corporate/white_papers/
SSI_QuestionLength_WP.image
Carr, S. (2000, February 11). As distance education comes of age, the challenge is keeping the
students. Chronicle of Higher Education, 46(3), 39–42. Retrieved from
http://chronicle.com/article/As-Distance-Education-Comes-of/14334
Cattell, R. B. (1966). The scree test for the number of factors. Multivariate Behavioral Research,
1, 245–276.
Child, D. (1990). The essentials of factor analysis (2nd ed.). London: Cassel Educational
Limited.
Christophel, D. (1990). The relationship among teacher immediacy behaviors, student
motivation, and learning. Communication Education, 39(4), 323–340. doi:10.1080/
03634529009378813
Cho, H., & LaRose, R. (1999). Privacy issues in Internet surveys. Social Science Computer
Review, 17(4), 421–434.
Conway, J. M., & Huffcutt, A.I. (2003). A review and evaluation of exploratory factor analysis
practices in organizational research. Organizational Research Methods, 6(2),147–168.
Costello, A. B., & Osborne, J. W. (2005). Best practices in exploratory factor analysis: Four
recommendations for getting the most from your analysis. Practical Assessment,
Research, & Evaluation, 10(7), 1–9.
96

Crockett, L. J., Schulenberg, J. E., & Petersen, A. C. (1987). Congruence between objective and
self-report data in a sample of young adolescents. Journal of Adolescent Research, 2(4),
383–392.
Cronbach, L. J. (1951). Coefficient alpha and the internal structure of tests. Psychometrika,
16(3), 297–334.
Cronbach, L. J. (1971). Test validation. In R. L. Thorndike (Ed.), Educational measurement (2nd
ed., pp. 443–507). Washington, DC: American Council on Education.
Cronbach, L. J., & Meehl, P. E. (1955). Construct validity in psychological tests. Psychological
Bulletin, 52, 281–302.
Crowne, D. P., & Marlowe, D. (1960). A new scale of social desirability independent of
psychopathology. Journal of Consulting Psychology, 24(4) 349–354. doi:10.1037/
h0047358
Curless, T. A. (2004). Motivating students in distance education. Distance Learning, 1(5), 19–
22.
Dawson, S. (2006). A study of the relationship between student communication interaction and
sense of community. Internet and Higher Education, 9(3), 153–162. doi:10.1016/
j.iheduc.2006.06.007
Dewey, J. (1959). My pedagogic creed. In M. S. Dworkin (Ed.), Dewey on education (pp. 19–
32). New York: Teachers College Press. (Original work published 1897)
Dickson, D. & Osborn, P. (2011). RIT faculty focus group findings.
Dillman, D. A., (2000). Mail and internet surveys. The tailored design method (2nd ed.). New
York, NY: Wiley.
97

Dillman, D. A., Tortora, R. D., & Bowker, D. (1998). Principles for constructing web surveys.
SESRC Technical Report 98–50, Pullman, Washing Retrieved from http://survey.
sesrc.wsu.edu/dillman/papers/websurveyppr.pdfton.
Drouin, M. A. (2008). The relationship between students’ perceived sense of community and
satisfaction, achievement, and retention in an online course. The Quarterly Review of
Distance Education, 9(3), 267–284. Retrieved from http://www.aect.org/Intranet/
Publications/QRDE/subguides.html
Durvasula, S., Netemeyer, R. G., Andrews, J. C., & Lysonski, S. (2006). Examining the cross-
national applicability of multi-item, multi-dimensional measures using generalizability
theory. Journal of International Business Studies, 37(4), 469–483.
Edwards, A. L. (1957). The social desirability variable in personality assessment and research.
New York, NY: Dryden.
Everitt, B. S. (1975). Multivariate analysis: The need for data and other problems. British
Journal of Psychiatry. 126, 237–240.
Eveslage, S. A., Wilson, E. C., & Dye, G. H. (2007). Best practices: Good practices in end-of-
course surveys for online master’s programs. The Journal of Continuing Higher
Education, 55(3), 24–30. doi:10.1080/07377366.2007.10400127
Exter, M. E., Korkmaz, N., Harlin, N. M., & Bichelmeyer, B. A. (2009). Sense of community
within a fully online program. The Quarterly Review of Distance Education, 10(2), 177–
194. Retrieved from http://www.aect.org/Intranet/Publications/QRDE/subguides.html
Fabrigar, L. R., Wegener, D. T., MacCallum, R. C., Strahan, E. J. (1999). Evaluating the use of
exploratory factor analysis in psychological research. Psychological Methods, 4(3): 272–
299. doi:10.1037/1082-989X.4.3.272
98

Feenberg, A. (1999) Questioning technology. New York, NY: Routledge.
Field, A. P. (2005). Discovering statistics using SPSS (2nd ed.). London: Sage.
Fishman, J. A., & Galguera, T. (2003). Introduction to test construction in the social and
behavioral sciences: A practical guide. Lanham, MD: Rowman & Littlefield.
Ford, J. K., MacCallum, R. C., & Tait, M. (1986). The application of exploratory factor analysis
in applied psychology: A critical review and analysis. Personnel Psychology, 39, 291–
314.
Ford, S. & Inan, F. (2013). Students’ perceived feelings of connectedness in online community
college mathematics courses. In R. McBride & M. Searson (Eds.), Proceedings of Society
for Information Technology & Teacher Education International Conference 2013 (pp.
424-427). Chesapeake, VA: Association for the Advancement of Computing in Education
(AACE).
Fornell, C., and Larcker, D. F. (1981). Evaluating structural equation models with unobservable
variables and measurement error. Journal of Marketing Research, 18(1), 39–50.
Forsyth, B. H., Kudela, M. S., Levin K., Lawrence D., and Willis, G. B. Improving
Questionnaire Translations and Translation Processes. (2006, April 25). Paper presented
at the 2006 European Conference on Quality in Survey Statistics. Cardiff, Wales.
Freitas, F. A., Myers, S. A., & Avtgis, T. A. (1998). Student perceptions of instructor immediacy
in conventional and distributed learning classrooms. Communication Education, 47, 366–
372.
Galambos, J.A., Abelson, R.P., & Black, J. B. (Eds.). (1986). Knowledge structures. Hillsdale,
NJ: Erlbaum.
99

Garrison, D. R., Anderson, T., & Archer, W. (2000). Critical inquiry in a text-based
environment: Computer conferencing in higher education. The Internet and Higher
Education 2(2-3), 87–105. doi:10.1016/S1096-7516(00)00016-6
Garrison, D. R., & Arbaugh, J. B. (2007). Researching the community of inquiry framework:
Review, issues, and future directions. The Internet and Higher Learning. 10(3), 157–172.
Garrison, D. R., & Cleveland-Innes, M. & Fung, T. (2004). Student role adjustment in online
communities of inquiry: Model and instrument validation. Journal of Asynchronous
Learning Networks, 8(2), 61–74. Retrieved from
http://pdf.aminer.org/000/270/036/roles_of_modeling_in_inquiry_learning.pdf
Garrison, R. (2000). Theoretical challenges for distance education in the 21st century: A shift
from structural to transactional issues. International Review of Research in Open and
Distance Learning. (1)1, 1–17. Retrieved from http://www.irrodl.org/index.php/irrodl
Garson, D. G. (2008). Factor Analysis: Statnotes. Retrieved from North Carolina State
http://www2.chass.ncsu.edu/garson/pa765/factor.htm
Gaskin, J. (2012, July 6). Common method bias using common latent factor [Video file].
Retrieved from https://www.youtube.com/watch?v=Y7Le5Vb7_jg
Gillaspy, J. A., & Campbell, T. C. (2006). Reliability and validity of scores from the inventory of
drug use consequences. Journal of Addictions & Offender Counseling, 1(27), 17–27.
doi:10.1002/j.2161-1874.2006.tb00015.x
Gorsuch, R. L. (1983). Factor analysis (2nd ed.). Hillsdale, NJ: Erlbaum.
Grau-Valldosera, J., & Minguillon, J. (2014). Rethinking dropout in online higher education: The
case of the Universitat Oberta de Catalunya. International Review of Research in Open
and Distance Learning, 15(1), 291–308. http://www.irrodl.org/index.php/irrodl/article/
100

view/1628/2718
Gunawardena, C. N. (1995). Social Presence Theory and Implications for Interaction and
Collaborative Learning in Computer Conferences. International Journal of Educational
Telecommunications, 1(2/3), 147–166. Charlottesville, VA: AACE.
Gunawardena, C. N., & Zittle, F. J. (1997). Social presence as a predictor of satisfaction within a
computer-mediated conferencing environment. American Journal of Distance Education
11(3), 8–26. Retrieved from http://www.tandfonline.com/loi/hajd20
Hair, J. F., Jr., Anderson, R. E., Tatham, R. L., & Black, W. C. (1995). Multivariate data
analysis with readings. Englewood Cliffs, New Jersey: Prentice Hall.
Hair, J. F., Black, W. C., Babin, B. J., & Anderson, R. E. (2010). Multivariate data analysis (7th
ed.). Englewood Cliffs, NJ: Prentice Hall.
Harkness, J. (2003). Questionnaire translation. In J. Harkness, F. Van de Vijer, & P. Moher
(Eds.), Cross-cultural survey methods (pp. 35–56). Hoboken, NJ: Wiley.
Hatcher, L. (1994). A step-by-step approach to Using the SAS® System for factor analysis and
structural equation modeling. Cary, NC: SAS Institute.
Hausmann, R., Tyson, L. D., & Zahidi, S. (2011). The global gender gap report 2011. Geneva,
Switzerland: World Economic Forum.
Henson, R. K. (2001). Understanding internal consistency reliability estimates: A conceptual
primer on coefficient alpha. Measurement and Evaluation in Counseling and
Development, 34, 177–189.
Henson, R., K., & Roberts, J., K. (2006). Use of exploratory factor analysis in published
research: Common errors and some comment on improved practice. Educational and
Psychological Measurement, 66(3), 393–416. doi:10.1177/0013164405282485
101

Holton, E. F., Bates, R. A., Bookter, A. I., & Yamkovenko, V.B. (2007). Convergent and
divergent validity of the learning transfer system inventory. Human Resource
Development Quarterly, 18(3), 385–419. doi:10.1002/hrdq.1210
Hooper, D., Coughlan, J., & Mullen, M. R. (2008). Structural equation modeling: Guidelines for
determining fit. Journal of Business Research Methods, 6(1), 53–60.
Hu, L. T., and Bentler, P. M. (1999). Cutoff criteria for fit indexes in covariance structure
analysis: Conventional criteria versus new alternatives. Structural Equation Modeling,
6(1), 1–55.
Hutcheson, G., & Sofroniou, N. (1999). The multivariate social scientist: Introductory statistics
using generalized linear models. Thousand Oaks, CA: Sage.
Irani, T. A., Wilson, S. B., Slough, D. L., & Reiger, M. (2014). Graduate student experiences on-
and-off campus: Social connectedness and perceived isolation. International Journal of
E-Learning & Distance Education, 28(1). http://www.ijede.ca/index.php/jde/article/view/
856/1530
Johns, G. (1994). How often were you absent? A review of the use of self-reported absence data.
Journal of Applied Psychology, 79(4), 574–591.
Kaiser, H. F. (1974). An index of factorial simplicity. Psychometrika, 39, 31–36.
Ke, F. (2010). Examining online teaching, cognitive, and social presence for adult students.
Computers & Education, 55(2), 808–820. doi:10.1016/j.compedu.2010.03.013
Kenny, D. A., & McCoach, D. B. (2003). Effect of the number of variables on measures of fit in
structural equation modeling. Structural Equation Modeling, 10, 333–3511.
102

Kim, J., Kwon, Y., & Cho, D. (2011). Investigating factors that influence social presence and
learning outcomes in distance higher education. Computers & Education, 57(2), 1512–
1520. doi:10.1016/j.compedu.2011.02.005
Kizilcec, R. F. (2014). Reducing nonresponse bias with survey reweighting: Applications for
online learning researchers. Paper presented at the ACM Conference on Learning, New
York, NY. doi:10.1145/2556325.2567850
Kline, R. B. (2005). Principles and practices of structural equation modeling (2nd ed.). New
York, NY: Guilford.
Kreijns, K., Kirschner, P. A., Jochems, W., & Van Buuren, H. (2004). Determining sociability,
social space, and social presence in (a)synchronous collaborative groups.
CyberPsychology & Behavior, 7(2), 155–172. Retrieved from
http://www.liebertpub.com/overview/cyberpsychology-behavior-and- social-
networking/10/
Lai, M. L. (2008). Technology readiness, internet self-efficacy, and computing experience of
professional accounting students. Campus-wide Information Systems, 25(1), 18–29.
Larsen, K. R., Nevo, D., & Rich, E. (2008). Exploring the semantic validity of questionnaire
scales. Proceedings of the 41st Hawaii International Conference on System Sciences.
Waikoloa, HI: IEEE. doi:10.1109/HICSS.2008.165
Lineback, J. F, & Thompson, K. J. (2010). Conducting nonresponse bias analysis for business
surveys. Proceedings from the Section on Survey Research Methods, American Statistical
Association.
103

MacCallum, R., Roznowski, M., & Necowitz, L.B. (1992). Model modifications in covariance
structure analysis: The problem of capitalization on chance. Psychological Bulletin,
111(3), 490–504.
Matsunaga, M. (2010). How to factor-analyze your data right: Do’s, don’ts, and how-to’s.
International Journal of Psychological Research, 3(1), 97–110.
McCormick, T. H., & Zheng, T. (2013). Network-based methods for accessing hard-to-reach
populations using standard surveys. In K. Wolter and R. Tourangeau (Eds.). Hard-to-
Survey Populations. Cambridge, United Kingdom: Cambridge University Press.
http://dx.doi.org/10.1017/CBO9781139381635
McMillan, D. W., & Chavis, D. M. (1986). Sense of community: A definition and theory.
Journal of Community of Psychology, 14, 6–23. doi:10.1002/1520-
6629(198601)14:1<6::AID-JCOP2290140103>3.0.CO;2-I
Mehrabian, A. (1969). Methods & designs: Some referents and measures of nonverbal behavior.
Behavioral Research Methods and Instrumentation, 1, 203–207.
Melrose, S. (2009, January). Instructional immediacy online. In P. Rogers, G. Berg, J. Boettcher,
C. Howard, L. Justice, and K. Schenk (Eds.). Encyclopedia of Distance Learning. (2nd
ed.) (Vol. 3, pp. 1212–1215). Hershey, PA: Information Science Reference.
Moore, M. G. (1989). Three types of interaction. American Journal of Distance Education, 3(2),
1–7. Retrieved from http://www.ajde.com/Contents/vol3_2.htm#editorial
National Center for Education Statistics (2012). Distance education in higher education
(Indicator 43-2011). Retrieved from http://nces.ed.gov/programs/coe/indicator_dhe.asp
Ni, S. F., & Aust, R. (2008). Examining teacher verbal immediacy and sense of classroom
community in online classes. International Journal on E-Learning, 7(3), 477–498.
104

Nimon, K., Shuck, B., & Zigarmi, D. (2015). Construct overlap between employee engagement
and job satisfaction: A function of semantic equivalence? Journal of Happiness Studies,
doi:10.1007/s10902-015-9636-6
Nimon, K., & Zigarmi, D. (2014). The work cognition inventory: Initial evidence of construct
validity for the revised form. Journal of Career Assessment, 23(1), 117–136.
doi:10.1177/1069072714523241
Northrup, P. T. (2002). Online learners’ preferences for interaction. Quarterly Review of
Distance Education, 3(2), 219–226.
Norušis, M. J. (2006). Introduction. SPSS 14.0 guide to data analysis. Upper Saddle River, NJ:
Prentice Hall.
Nunnally, J.L. (1978). Psychometric theory. New York, NY: McGraw-Hill.
Nye, J. L., & Simonetta, L. G. (1996). Followers’ perceptions of group leaders: The impact of
recognition-based and inference-based processes. In J. L. Nye & A. M. Bower (Eds.),
What’s social about social cognition: Research on socially shared cognition in small
groups (pp. 124–153). Thousand Oaks, CA: Sage.
Olaniran, B. A., Rodriguez, N., & Williams, I.M. (2011). Social information processing theory
(SIPT): A cultural perspective for international online communication environments. In
K. St. Amant and S. Kelsey (Eds.). Computer-mediated communication across cultures:
International interactions in online environments. doi:10.4018/978-1-60960-833-0.ch004
O’Neill, M., Wright, C., & Palmer, A. (2003). Disconfirming user expectations of the online
service experience: Inferred versus direct disconfirmation modeling. Internet Research,
13(4), 281–296. doi:10.1108/10662240310488960
105
Osborne, J. W., & Costello, A. B. (2004). Sample size and subject to item ratio in principal
components analysis. Practical Assessment, Research, & Evaluation, 9(11). Retrieved
from http://pareonline.net/getvn.asp?v=9&n=11
Ouzts, K. (2006). Sense of community in online courses. Quarterly Review of Distance
Education, 7(3), 285–296. Retrieved from http://www.aect.org/Intranet/Publications/
QRDE/subguides.html
Ozturk, H. T., & Ozcinar, H. (2013). Learning in multiple communities from the perspective of
knowledge capital. International Review of Research in Open and Distance Learning,
14(1), 204–221. Retrieved from http://www.irrodl.org/index.php/irrodl/article/view/
1277/2438
Paswan, A. (2009, May). Confirmatory factor analysis and structural equations modeling: An
introduction [PowerPoint slides]. Retrieved from http://www.cob.unt.edu/slides/paswan/
BUSI6280/CFA-SEM -Intro-May 18 2009.ppt
Petrie, T. A., Tripp, M. M., & Harvey, P. (2002). Factorial and construct validity of the body
parts satisfaction scale-revised: An examination of minority and nonminority women.
Psychology of Women Quarterly, 26(3), 213–221. doi:10.1111/1471-6402.00060
Pintrich, P. R., Smith, D. A., Garcia, T., & Mckeachie, W. J. (1991). A manual for the use of the
motivated strategies for learning questionnaire (MSLQ). (Tech. Rep. No. 91-B-004). Ann
Arbor: University of Michigan, National Center for Research to Improve Postsecondary
Teaching and Learning.
Podsakoff, P. M., MacKenzie, S. B., & Lee, J. (2003). Common method biases in behavioral
research: A critical review of the literature and recommended remedies. Journal of
Applied Psychology, 88(5), 879–903. doi:10.1037/0021-9010.88.5.879
106
Pollard, H., Minor, M., & Swanson, A. (2014). Instructor social presence within the Community
of Inquiry framework and its impact on classroom community and the learning
environment. Online Journal of Distance Administration, 17(2). Retrieved from
http://www.westga.edu/~distance/ojdla/summer172/Pollard_Minor_Swanson172.html
Pollard, W. E. (2002). Use of consumer panel survey data for public health communication
planning: an evaluation of survey results. In Proceedings of the Section on Survey
Research Methods of the American Statistical Association: 2720–2724.
Poortinga, Y. H., & Van De Vijver, F. J. R. (1987). Explaining cross-cultural differences bias
analysis and beyond. Journal of Cross-Cultural Psychology, 18(3), 259–282.
doi:10.1177/0022002187018003001
Porter, S. R., & Whitcomb, M. E. (2003). The impact of contact type on web survey response
rates. Public Opinion Quarterly, 67(4), 579–588.
Porter, S. R., Whitcomb, M. E., & Weitzer, W. H. (2004). Multiple surveys of students and
survey fatigue. In S.R. Porter (Ed.), New directions for institutional research (pp. 63–73).
San Francisco, CA: Jossey-Bass.
Randolph, J. J., & Crawford, L. M. (2013). Factorial validity and reliability of the Sense of
Community in Online Courses Scale. Journal of Interactive Online Learning, 12(2), 53–
69. Retrieved from http://www.ncolr.org/jiol/issues/pdf/12.2.2.pdf
Rao, K., Kaminska, O., & McCutcheon, A. L (2010). Recruiting probability samples for a multi-
mode research panel with internet and mail components. Public Opinion Quarterly,
74(1), 68–84.
Raykov, T. (1997). Estimation of composite reliability for congeneric measures. Applied
Psychological Measurement, 21(2), 173–184.
107

Rodriguez, M. C., Ooms, A., & Montanez, M. (2008). Students’ perceptions of online-quality
learning given comfort, motivation, satisfaction, and experience. Journal of Interactive
Online Learning, 7(2), 105–125.
Rodriguez, M. C., Ooms, A., Montanez, M., & Yan, Y. L. (2005). Perceptions of online learning
quality given comfort with technology, motivation to learn technology skills, satisfaction,
and online learning experience. Paper presented at the Annual Meeting of the American
Educational Research Association, Montreal, Canada.
Romano, J. C., & Chen, J. M. (2011). A usability and eye-tracking evaluation of four versions of
the online National Survey for College Graduates (NSCG): Iteration 2 (Report No.
SSM2011-01). Washington, DC: U.S. Census Bureau. Retrieved from
http://www.census.gov/srd/papers/pdf/ssm2011-01.pdf
Roszkowski, M. J., & Soven, M. (2010). Shifting gears: Consequences of including two
negatively worded items in the middle of a positively worded questionnaire. Assessment
& Evaluation in Higher Education, 35(1), 117–134. doi:10.1080/02602930802618344
Rovai, A. P. (2002a). Building sense of community at a distance. The International Review of
Research in Open and Distance Learning, 3(1), 1–16. Retrieved from
http://www.irrodl.org/index.php/irrodl/index
Rovai, A. P. (2002b). Development of an instrument to measure classroom community. The
Internet and Higher Education, 5(3), 197–211. Retrieved from
http://www.journals.elsevier. com/the-internet-and-higher-education/
Ryle, A., & Cumming, K. (2007). Reflections on engagement in online learning communities.
International Journal of Pedagogies and Learning, 3(3), 34–46. doi:10.5172/ijpl.3.3.35
108

Sadera, W. A., Robertson, J., Song, L., & Midon, M. N. (2009). Role of Community in Online
Learning Success, MERLOT Journal of Online Learning and Teaching, 5(2), 277–284.
Salyers, V., Carter, L., Carter, A., Myers, S., & Barrett, P. (2014). The search for meaningful e-
Learning at Canadian universities: A multi-institutional research study. International
Review of Research in Open and Distance Learning, 15(6), 313–337.
http://www.irrodl.org/index.php/irrodl/article/view/1713/3188
Sax, L., Gilmartin, S., & Bryant, A. (2003). Assessing response rates and non-response bias in
web and paper surveys. Research in Higher Education, 44(4), 409–432.
doi:10.1023/A:1024232915870
Schmitt, N. (1994). Method bias: The importance of theory and measurement. Journal of
Organizational Behavior, 15(5), 393–398. doi:10.1002/job.4030150504
Sheehy, K. (2012, January 10). U.S. news ranks top online degree programs. U.S. News & World
Report. Retrieved from http://www.usnews.com/education/online-
education/articles/2012/01/10/us-news-ranks-top-online-degree-programs
Shin, N. (2003). Transactional presence as a critical predictor of success in distance learning.
Distance Education, 24(1), 69–86. doi:10.1080/0158791032000066534
Short, J. A., Williams, E., & Christie, B. (1976). The social psychology of telecommunications.
London, England: Wiley.
Siegall, M., & McDonald, T. (1995). Focus of attention and employee reactions to job change.
Journal of Applied Social Psychology, (25)13, 1121–1141. doi:10.1111/j.1559-
1816.1995.tb02610.x
109

Slagter van Tryon, P. J., & Bishop, M. (2006). Identifying “E-mmediacy” strategies for web-
based instruction: A Delphi study. Quarterly Review of Distance Education, 7(1), 49–62.
Retrieved from http://wwwaect.org/Intranet/Publications/QRDE/subguides. html
Slagter van Tryon, P. J., & Bishop, M. (2009). Theoretical foundations for enhancing social
connectedness in online learning environments. Distance Education, 30(3), 291–315.
doi:10.1080/01587910903236312
Slagter van Tyron, P. J., & Bishop, M. (2012). Evaluating social connectedness online: The
design and development of the social perceptions in learning contexts instrument.
Distance Education, 33(3), 347–364.
So, H., & Brush, T. A. (2008). Student perceptions of collaborative learning , social presence,
and satisfaction in a blended learning environment: Relationships and critical factors.
Computers & Education, 51, 318–336. doi:10.1016/j.compedu.2007.05.009
Starkweather, J. (2012). Step out of the past: Stop using coefficient alpha; there are better ways
to estimate reliability. Retrieved from http://web3.unt.edu/benchmarks/issues/2012/06
/rss-matters
Suhr, D. D. (2006). Exploratory or confirmatory factor analysis? In SUGI SAS Conference
Proceedings: Western Users of SAS Software. San Jose: CA.SAS Users Group. Retrieved
from http://www2.sas.com/proceedings/sugi31/200-31.pdf
Swan, K., Garrison, D. R. & Richardson, J. C. (2009). A constructivist approach to online
learning: the Community of Inquiry framework. In Payne, C. R. (Ed.) Information
technology and constructivism in higher education: Progressive learning frameworks
(pp. 43-57). Hershey, PA: IGI Global.
110
Tabachnick, B. G., & Fidell, L. S. (1996). Using multivariate statistics (3rd ed.). New York, NY:
HarperCollins.
Tait, R. C., Chibnall, J. T., & Krause, S. (1990). The pain disability index: Psychometric
properties. Pain, 40(2). 171–182.
Thompson, B. (1994). The concept of statistical significance testing. Practical Assessment,
Research & Evaluation, 4(5). Retrieved from http://PAREonline.net/getvn.asp?v=4&n=5
Trochim, W. (2000). The research methods knowledge base (2nd ed.). Cincinnati, OH: Atomic
Dog.
Tu, C. H., & McIsaac, M. (2002). The relationship of social presence and interaction in online
classes. American Journal of Distance Education, 16(3), 131–150. Retrieved from
http://www.tandfonline.com/loi/hajd20
Urbina, S. (2004). Essentials of psychological testing. Hoboken, NJ: Wiley.
Walther, J. B. (1992). Interpersonal effects in computer-mediated interaction: A relational
perspective. Communication Research, 19, 52–90.
Walther, J. B. (1993). Impression development in computer-mediated interaction. Western
Journal of Communication, 57, 381–398.
Ward, C., Fischer, R., Lam, F. S. Z, & Hall, L. (2009). The convergent, discriminant, and
incremental validity of scores on a self-report measure of cultural intelligence.
Educational and Psychological Measurement, 69, 85–105.
Wilson, J. H., and Taylor, K. W. (2001). Professor immediacy as behaviors associated with
liking students. Teaching of Psychology, 28, 136–138.
Worthington, R. L., & Whittaker, T. A. (2006). Scale development research: A content analysis
and recommendations for best practices. Counseling Psychologist, 34(6), 806–838.
111

Wright, S. (1921). Correlation and causation. Journal of Agricultural Research, 20(1), 557–585.
Xu, D. and Jaggers, S. (2011). The effectiveness of distance education across Virginia's
community colleges: Evidence from introductory college-level math and English courses.
Educational Evaluation and Policy Analysis, 33(3), 360–377. doi:10.3102/
0162373711413814
Young, S. (2006). Student views of effective online teaching in higher education. American
Journal of Distance Education, 20(2), 65–77. doi:10.1207/s15389286ajde2002_2
Zembylas, M., Theodorou, M., & Pavlakis, A. (2008). The role of emotions in the experience of
online learning: Challenges and opportunities. Educational Media International, 45(2),
107–117. doi:10.1080/09523980802107237
Zimmerman, T. D. (2012). Exploring learner to content interaction as a success factor in online
courses. International Review of Research in Open and Distance Learning, 13(4), 152–
165.
112