testing of hypothesis-agbs
TRANSCRIPT

8/8/2019 Testing of Hypothesis-AGBS
http://slidepdf.com/reader/full/testing-of-hypothesis-agbs 1/74
Testing of Hypothesis

8/8/2019 Testing of Hypothesis-AGBS
http://slidepdf.com/reader/full/testing-of-hypothesis-agbs 2/74
2
Statistics in Decision Making
Getting Observations
of the real world
Keeping Records
based on
observations
Organizing Data
according to records
Data
Analysis
Decision
-Making
© 1984-1994 T/Maker Co.

8/8/2019 Testing of Hypothesis-AGBS
http://slidepdf.com/reader/full/testing-of-hypothesis-agbs 3/74
3
Statistics
A collection of principles andmethods concerned with extractinguseful information from a set of data to help managers makedecisions.
The subject of statistics can besub-divided into two basic areas:
Descriptive statistics
Inferential statistics

8/8/2019 Testing of Hypothesis-AGBS
http://slidepdf.com/reader/full/testing-of-hypothesis-agbs 4/74
4
Descriptive Statistics
Collect data
e.g. Survey
Present data
e.g. Tables and graphs
Characterize datae.g. Sample mean =
i X
n
§
8/8/2019 Testing of Hypothesis-AGBS
http://slidepdf.com/reader/full/testing-of-hypothesis-agbs 5/74
5
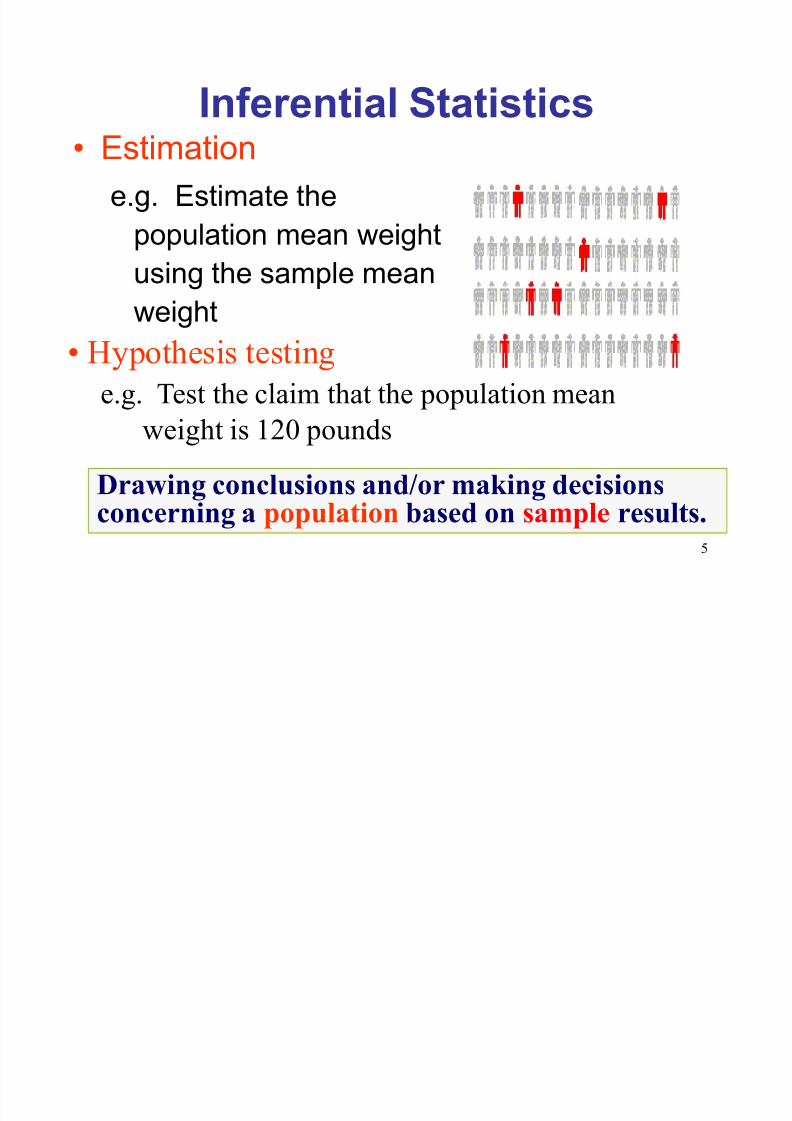
Inferential Statistics Estimation
e.g. Estimate the
population mean weight
using the sample meanweight
Drawing conclusions and/or making decisionsconcerning a population based on sample results.
Hypothesis testing
e.g. Test the claim that the population mean
weight is 120 pounds

8/8/2019 Testing of Hypothesis-AGBS
http://slidepdf.com/reader/full/testing-of-hypothesis-agbs 6/74
Problem Under Study
q
Data
Survey Experiment
Once sample data has been gathered, statistical
inference allows to assess evidence in favor or some
claim about the population from which the sample
has been drawn.
The method of inference used to support or reject
claims based on sample data is known as testing of
hypothesis.

8/8/2019 Testing of Hypothesis-AGBS
http://slidepdf.com/reader/full/testing-of-hypothesis-agbs 7/74
What is a Hypothesis?
A hypothesis is a claim(assumption) about apopulation parameter:
± population mean
± population proportion
Example: The mean monthly cell phone bill of
this city is = $42
Example: The proportion of adults in this city
with cell phones is = 0.68

8/8/2019 Testing of Hypothesis-AGBS
http://slidepdf.com/reader/full/testing-of-hypothesis-agbs 8/74
The Null Hypothesis, H0
States the claim or assertion to be tested
Example: The average number of TV sets in
U.S. Homes is equal to three ( )
Is always about a population parameter,
not about a sample statistic
3:H0 !
3:H0 ! 3X:H0 !

8/8/2019 Testing of Hypothesis-AGBS
http://slidepdf.com/reader/full/testing-of-hypothesis-agbs 9/74
The Null Hypothesis, H0
Begin with the assumption that the nullhypothesis is true
± Similar to the notion of innocent untilproven guilty
Refers to the status quo
Always contains ³=´ , ³´ or ³u´ sign May or may not be rejected
(continued)
8/8/2019 Testing of Hypothesis-AGBS
http://slidepdf.com/reader/full/testing-of-hypothesis-agbs 10/74
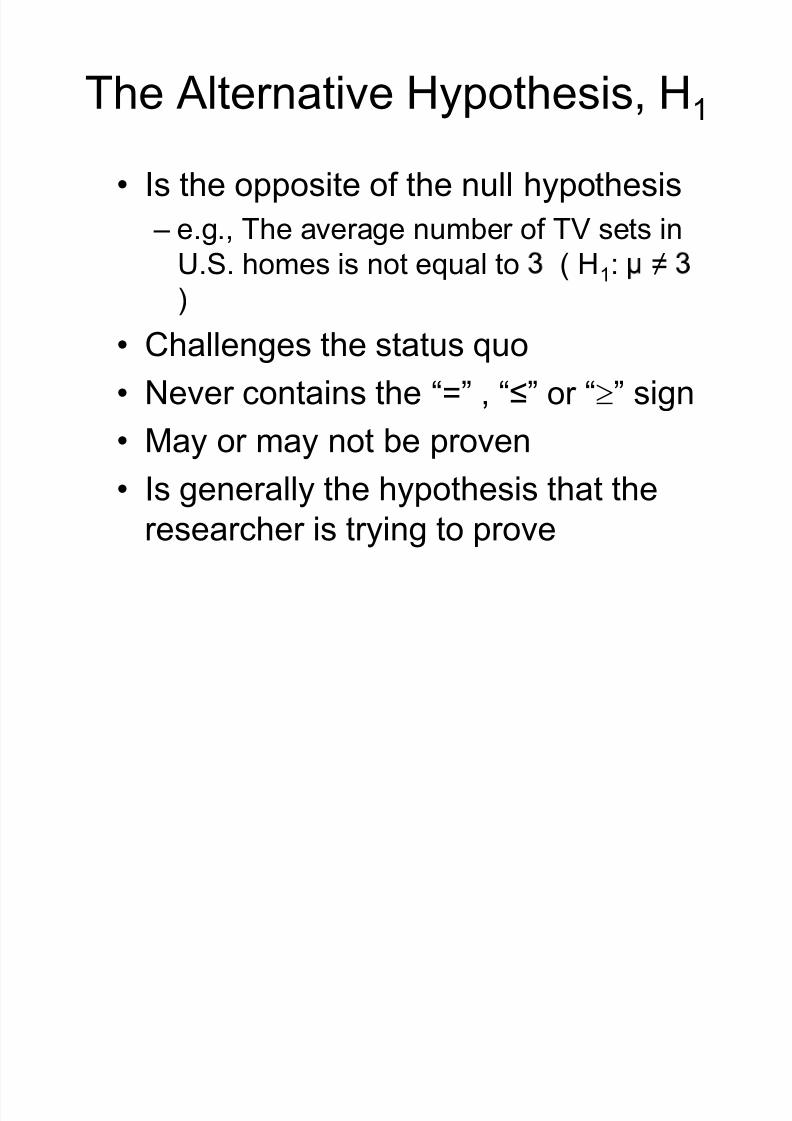
The Alternative Hypothesis, H1
Is the opposite of the null hypothesis
± e.g., The average number of TV sets in
U.S. homes is not equal to ( H1: )
Challenges the status quo
Never contains the ³=´ , ³´ or ³u´ sign
May or may not be proven
Is generally the hypothesis that theresearcher is trying to prove

8/8/2019 Testing of Hypothesis-AGBS
http://slidepdf.com/reader/full/testing-of-hypothesis-agbs 11/74
Population
Claim: the
population
mean age is 50.
(Null Hypothesis:
REJECT
Suppose
the samplemean age
is 20: X = 20
SampleNull Hypothesis
20 likely if = 50?!Is
Hypothesis Testing Process
If not likely,
Now select a
random sample
H0: = 50 )
X
8/8/2019 Testing of Hypothesis-AGBS
http://slidepdf.com/reader/full/testing-of-hypothesis-agbs 12/74
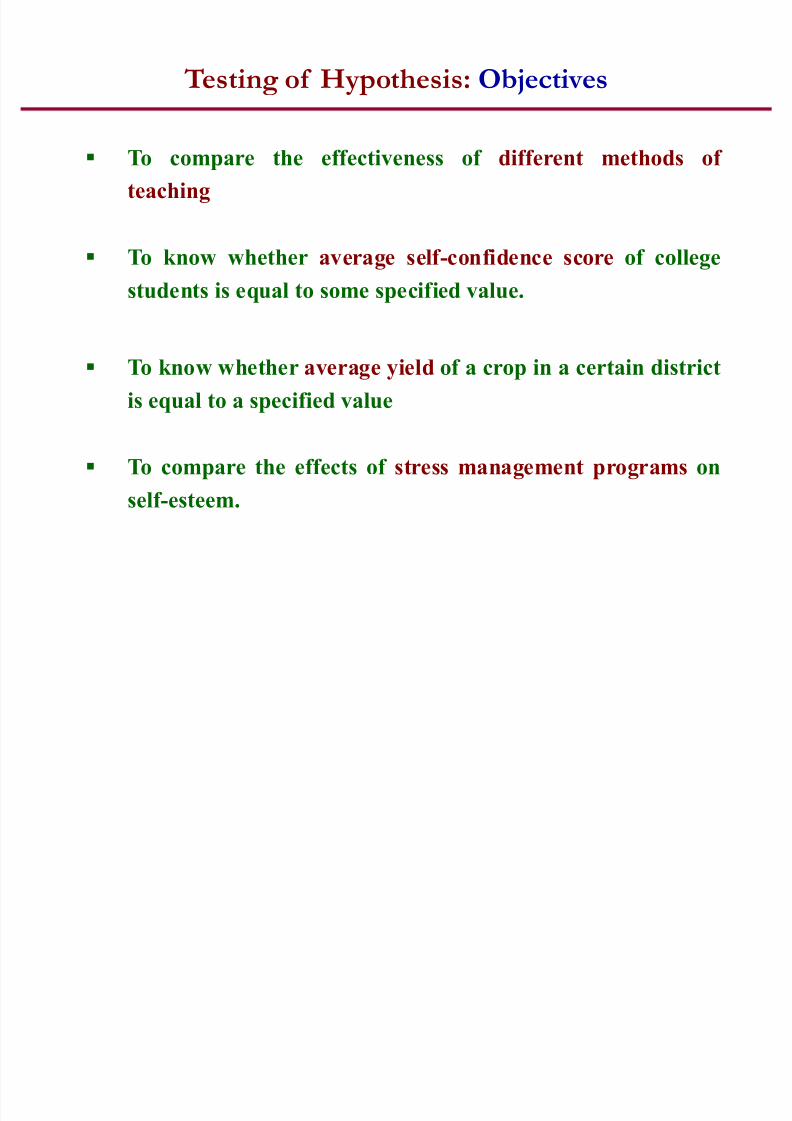
To compare the effectiveness of different methods of
teaching
To know whether average self-confidence score of college
students is equal to some specified value.
To know whether average yield of a crop in a certain district
is equal to a specified value
To compare the effects of stress management programs on
self-esteem.
Testing of Hypothesis: Objectives
8/8/2019 Testing of Hypothesis-AGBS
http://slidepdf.com/reader/full/testing-of-hypothesis-agbs 13/74
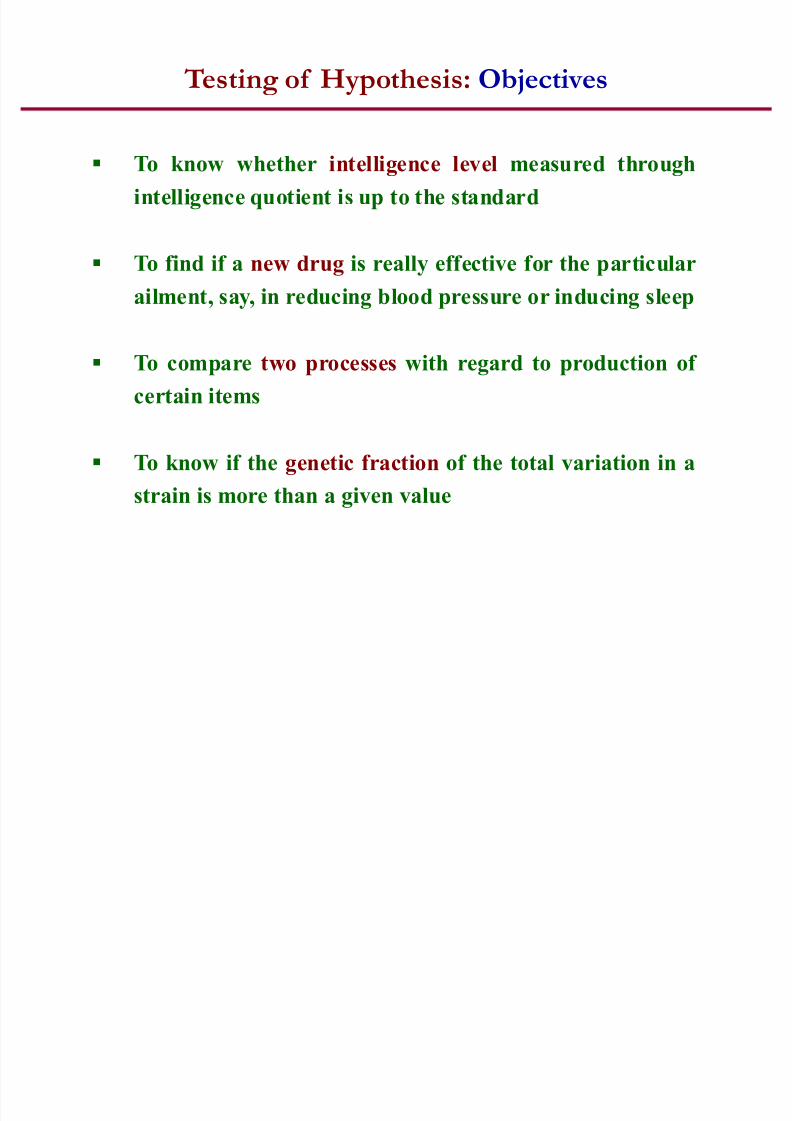
To know whether intelligence level measured through
intelligence quotient is up to the standard
To find if a new drug is really effective for the particular
ailment, say, in reducing blood pressure or inducing sleep
To compare two processes with regard to production of
certain items
To know if the genetic fraction of the total variation in a
strain is more than a given value
Testing of Hypothesis: Objectives

8/8/2019 Testing of Hypothesis-AGBS
http://slidepdf.com/reader/full/testing-of-hypothesis-agbs 14/74
Statistical test is a procedure governed by certain rules,
that leads to take a decision about the hypothesis for its
acceptance or rejection on the basis of the sample values
These tests have wide applications in agriculture,
medicine, industry, social sciences, psychology,
etc.
Tests of Significance

8/8/2019 Testing of Hypothesis-AGBS
http://slidepdf.com/reader/full/testing-of-hypothesis-agbs 15/74
Definitions
Statisticp Function of sample values, like sample mean,
sample variance
Parameterp Function of population values, like
population mean, population variance
Statistical Hypothesisp A definite statement about the
population parameters
If all the parameters are completely specified, the
hypothesis is called a simple hypothesis, otherwise it is
a composite hypothesis.

8/8/2019 Testing of Hypothesis-AGBS
http://slidepdf.com/reader/full/testing-of-hypothesis-agbs 16/74
Definitions...
H0p The hypothesis under test for a sample study
H1p The hypothesis tested against the null
hypothesis
H0: Q = Q
o
H1: Q { Qo (Two-Tailed Test)
Q < Qo (Left-Tailed Test)
Q > Qo (Right-Tailed Test)
Level of Significance (E) p The maximum size of the error
(rejecting H0 when it is true) which we are
prepared to risk. The higher the value of E, less
precise is the result.

8/8/2019 Testing of Hypothesis-AGBS
http://slidepdf.com/reader/full/testing-of-hypothesis-agbs 17/74
Definitions...
Test Statistic
A quantity calculated from sample of data.
Its value is used to decide whether or not the null
hypothesis should be rejected in the hypothesis test
Critical value(s)
The critical value(s) for a hypothesis test is a value to
which the value of the test statistic in a sample is compared
to determine whether or not the null hypothesis is rejected. The critical value for any hypothesis test depends on the
significance level at which the test is carried out, and
whether the test is one-sided or two-sided.

8/8/2019 Testing of Hypothesis-AGBS
http://slidepdf.com/reader/full/testing-of-hypothesis-agbs 18/74
6 Steps in
Hypothesis Testing1. State the null hypothesis, H0 and the
alternative hypothesis, H1
2. Choose the level of significance, E, andthe sample size, n
. Determine the appropriate test statistic
and sampling distribution
4. Determine the critical values that dividethe rejection and nonrejection regions
8/8/2019 Testing of Hypothesis-AGBS
http://slidepdf.com/reader/full/testing-of-hypothesis-agbs 19/74
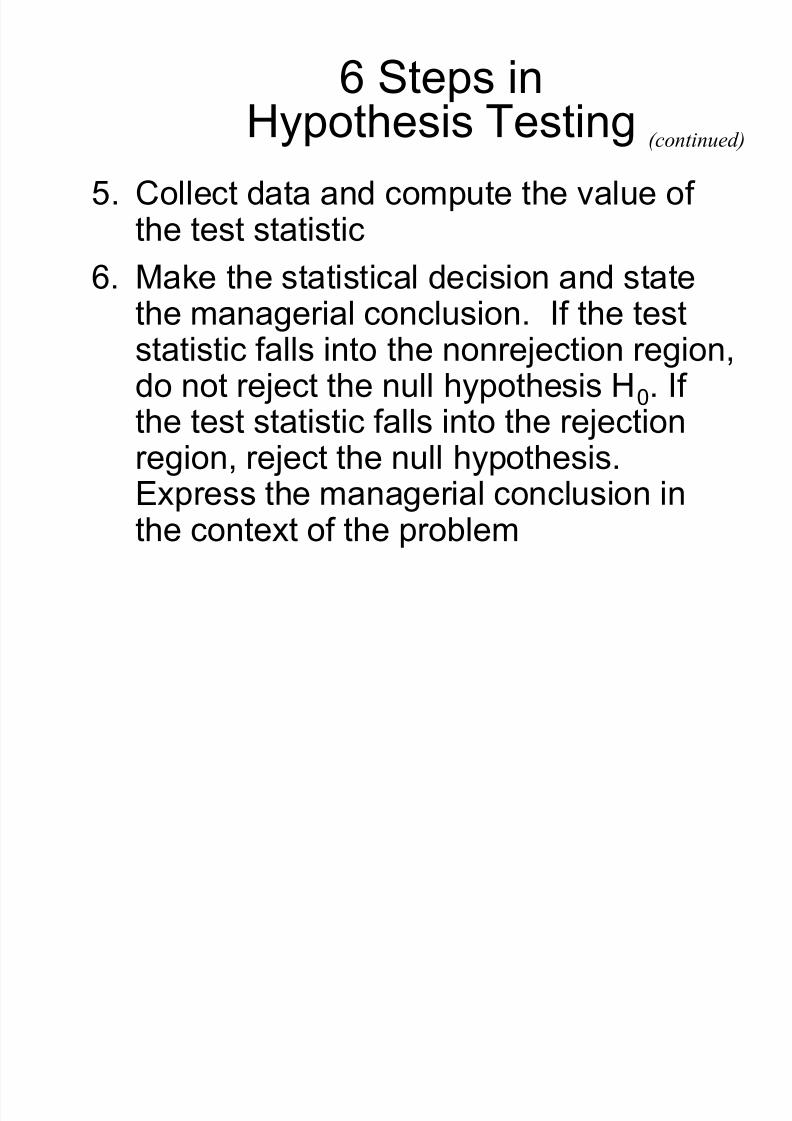
6 Steps in
Hypothesis Testing5. Collect data and compute the value of
the test statistic
6. Make the statistical decision and statethe managerial conclusion. If the teststatistic falls into the nonrejection region,do not reject the null hypothesis H0. If
the test statistic falls into the rejectionregion, reject the null hypothesis.Express the managerial conclusion inthe context of the problem
(continued)

8/8/2019 Testing of Hypothesis-AGBS
http://slidepdf.com/reader/full/testing-of-hypothesis-agbs 20/74
Tests of Significance
Normal Test
t - Test
Chi - Square Test
F - Test

8/8/2019 Testing of Hypothesis-AGBS
http://slidepdf.com/reader/full/testing-of-hypothesis-agbs 21/74
The Normal Distribution
X
f(X)
®
µ
Changing shift s the
distribution left or right.
Changing increasesor decreases the spread.

8/8/2019 Testing of Hypothesis-AGBS
http://slidepdf.com/reader/full/testing-of-hypothesis-agbs 22/74
8/8/2019 Testing of Hypothesis-AGBS
http://slidepdf.com/reader/full/testing-of-hypothesis-agbs 23/74
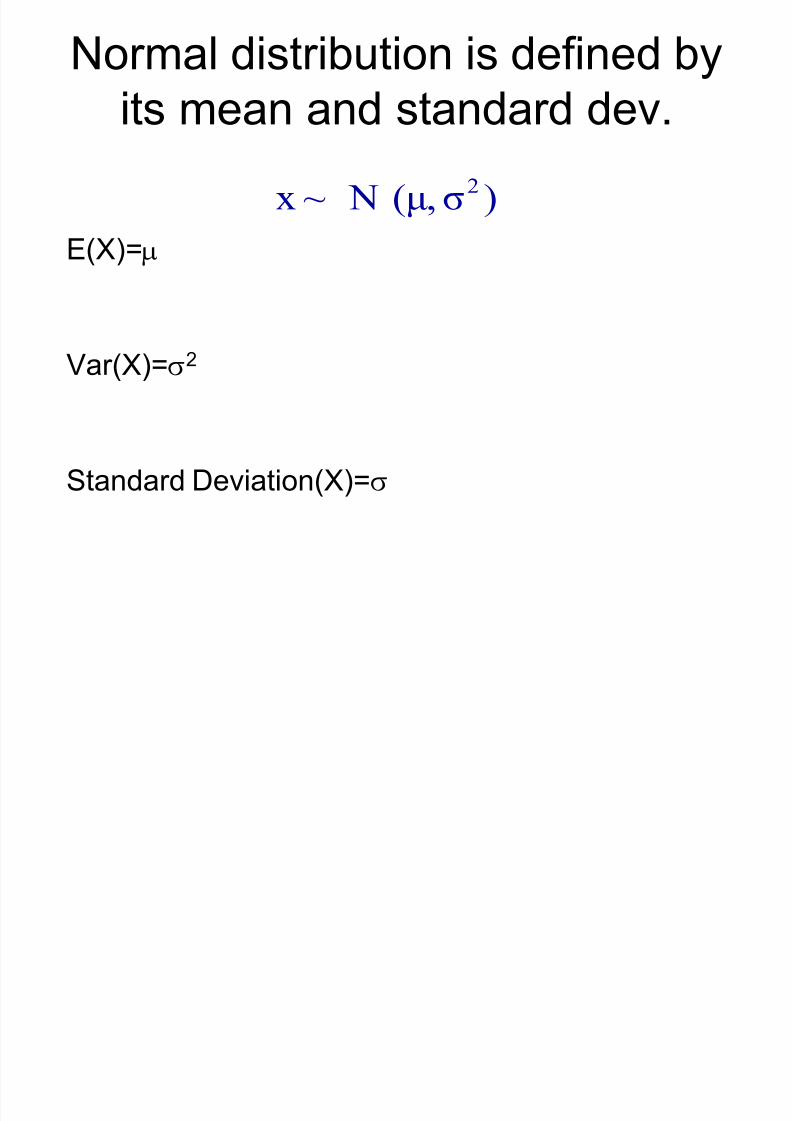
Normal distribution is defined byits mean and standard dev.
E(X)=Q
Var(X)=W2
Standard Deviation(X)=W
),( N~x 2

8/8/2019 Testing of Hypothesis-AGBS
http://slidepdf.com/reader/full/testing-of-hypothesis-agbs 24/74
68-95-99.7 Rule
68% of
the data
95% of the data
99.7% of the data

8/8/2019 Testing of Hypothesis-AGBS
http://slidepdf.com/reader/full/testing-of-hypothesis-agbs 25/74
**The beauty of the normal curve:
No matter what Q and W are, the area between Q-W and
Q+W is about 68%; the area between Q-2W and Q+2W isabout 95%; and the area between Q-3W and Q+3W is
about 99.7%. Almost all values fall within 3 standard
deviations.

8/8/2019 Testing of Hypothesis-AGBS
http://slidepdf.com/reader/full/testing-of-hypothesis-agbs 26/74
The Standard Normal Distribution
(Z)All normal distributions can be converted into
the standard normal curve by subtracting the
mean and dividing by the standard deviation:
W
Q!
X Z

8/8/2019 Testing of Hypothesis-AGBS
http://slidepdf.com/reader/full/testing-of-hypothesis-agbs 27/74
Normal test
Test for the Mean of a Normal Population
If xi ( i =1,~,n) is a r.s of size n from N(Q, W2), then
H0 : Q = Q0 or
H0 : the sample has been drawn from the population
with mean Q0
H1 : Q { Q0 (two-tailed) or Q > Q0 (right-tailed) or
Q < Q0 (left-tailed)
Test Statistic: )1(0,N~
n
xZ
!
)n
,( N~x
2
Population Variance is Known
8/8/2019 Testing of Hypothesis-AGBS
http://slidepdf.com/reader/full/testing-of-hypothesis-agbs 28/74
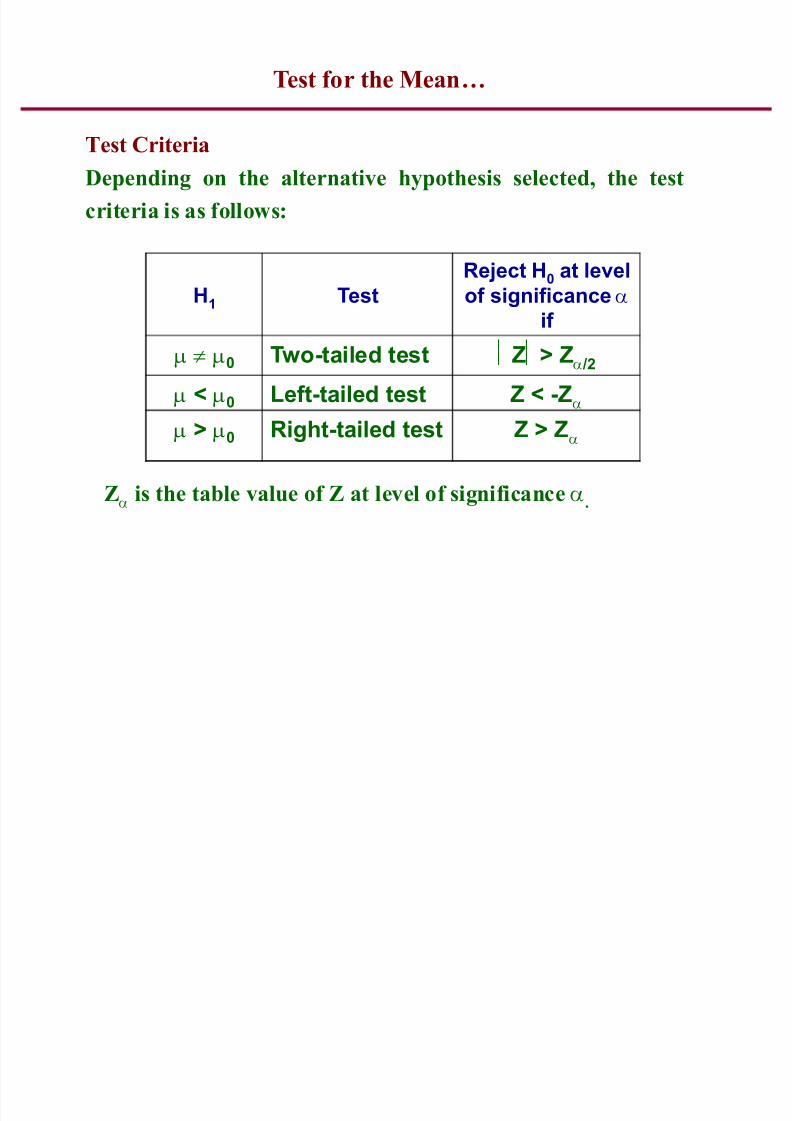
Test for the Mean«
Test Criteria
Depending on the alternative hypothesis selected, the test
criteria is as follows:
H1
Test RejectH
0 at levelof significance Eif
Q { Q0Two-tailed test Z> ZE /2
Q < Q0
Left-tailed test Z < -ZE
Q > Q0 Right-tailed test Z > ZE
ZE is the table value of Z at level of significance E.

8/8/2019 Testing of Hypothesis-AGBS
http://slidepdf.com/reader/full/testing-of-hypothesis-agbs 29/74
Some Critical Values of Z
Level of
Significance
Critical value of Z
Two-tailed
test ZE /2Single tailed test
(ZE)
10% 1.645 1.280
5% 1.960 1.645
1% 2.580 2.330
8/8/2019 Testing of Hypothesis-AGBS
http://slidepdf.com/reader/full/testing-of-hypothesis-agbs 30/74
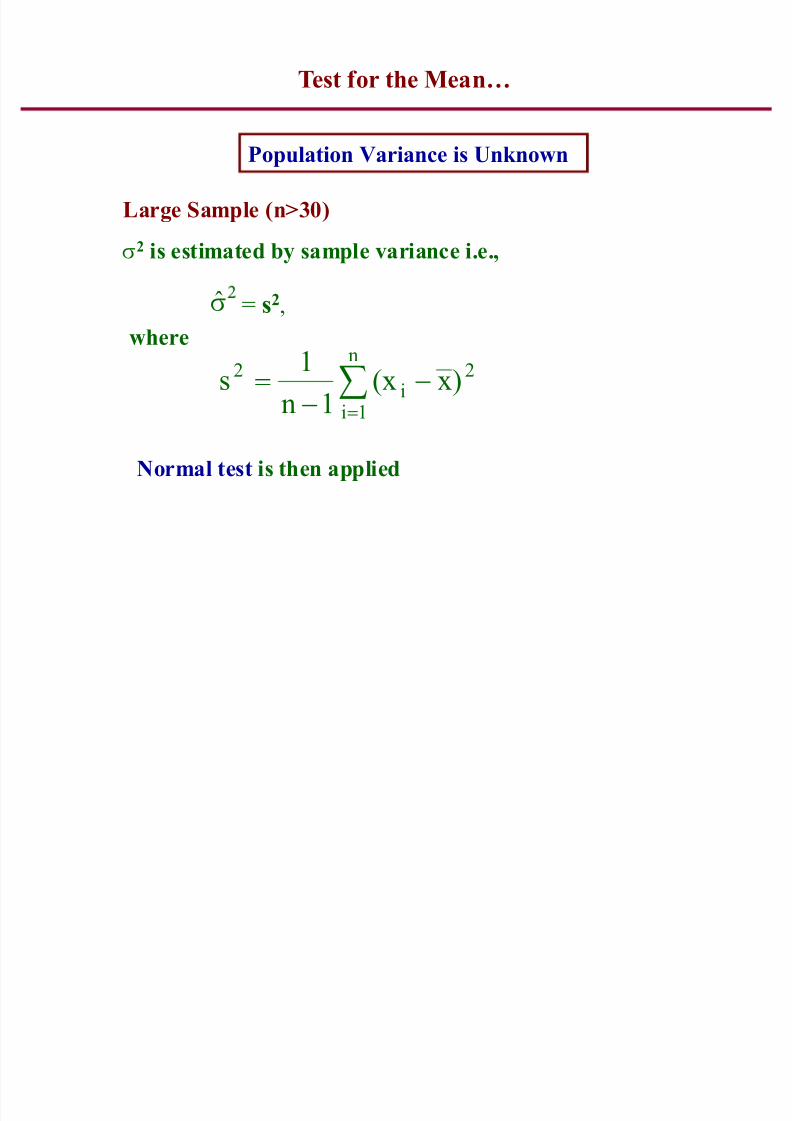
Test for the Mean«
Population Variance is Unknown
2n
1i
i2 )x(x
1n
1s
! §
!
Large Sample (n>30)
W2 is estimated by sample variance i.e.,
= s2,
Normal test is then applied
Ö W
where

8/8/2019 Testing of Hypothesis-AGBS
http://slidepdf.com/reader/full/testing-of-hypothesis-agbs 31/74
Hypothesis Testing Example
Test the claim that the true mean # of TV sets in
Indian homes is equal to 3.
(Assume = 0.8)
1. State the appropriate null and alternative
hypotheses
H0: = 3 H1: 3 (This is a two-tail test)
2. Specify the desired level of significance and the sample
size
Suppose that E = 0.05 and n = 100 are chosen for this
test

8/8/2019 Testing of Hypothesis-AGBS
http://slidepdf.com/reader/full/testing-of-hypothesis-agbs 32/74
2.0.08
.16
100
0.8
32.84
n
XZ !
!
!
!
Hypothesis Testing Example
3. Determine the appropriate technique
is known so this is a Z test.
4. Determine the critical values
For E = 0.05 the critical Z values are±1.965. Collect the data and compute the test statistic
Suppose the sample results are
n = 100, X = 2.84 ( = 0.8 is assumed known)
So the test statistic is:
(continued)

8/8/2019 Testing of Hypothesis-AGBS
http://slidepdf.com/reader/full/testing-of-hypothesis-agbs 33/74
Reject H0 Do not reject H0
6. Is the test statistic in the rejection region?
E = 0.05/2
-Z= -1.96 0
Reject H0 if
Z < -1.96 or
Z > 1.96;otherwise do
not reject H0
Hypothesis Testing Example(continued)
E = 0.05/2
Reject H0
+Z= +1.96
Here, Z = -2.0 < -1.96, so the test
statistic is in the rejection region

8/8/2019 Testing of Hypothesis-AGBS
http://slidepdf.com/reader/full/testing-of-hypothesis-agbs 34/74
6(continued). Reach a decision and interpret the result
-2.0
Since Z = -2.0 < -1.96, we reject the null hypothesis and
conclude that there is sufficient evidence that the mean
number of TVs in Indian homes is not equal to 3
Hypothesis Testing Example(continued)
Reject H0 Do not reject H0
E = 0.05/2
-Z= -1.96 0
E = 0.05/2
Reject H0
+Z= +1.96

8/8/2019 Testing of Hypothesis-AGBS
http://slidepdf.com/reader/full/testing-of-hypothesis-agbs 35/74
From a class, 36 students were selected at random and their marks
in a subject out of 20 were observed. The mean and standard
deviation are 18.7 and 1.25. Test whether the mean marks of
students is 19.
Solution:
H0: The sample of students has been drawn from thepopulation with mean marks Q = 19
H1: Q { 19
n = 36, Q = 19, W = 1.25
Under H0,
440.1
3625.1
0.197.18!
!Z
H0
is accepted at 5% level of significance.
.x !
Test for the Mean«ANOTHER Example
8/8/2019 Testing of Hypothesis-AGBS
http://slidepdf.com/reader/full/testing-of-hypothesis-agbs 36/74
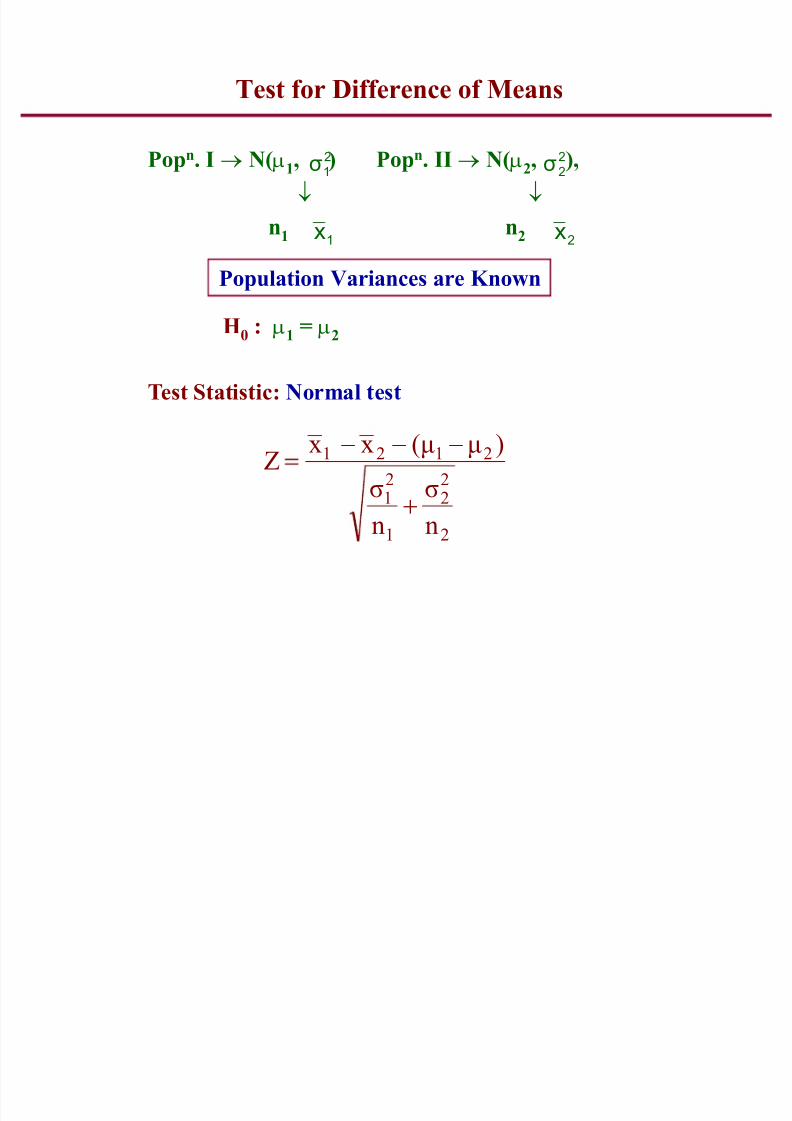
Test for Difference of Means
Popn. I p N(Q1, ) Popn. II p N(Q2, ),
q q
n1 n2
H0 : Q1 = Q2
Test Statistic: Normal test
n
n
)(xxZ
2
22
1
21
2121
1x
2
1
2
2
2x
Population Variances are Known

8/8/2019 Testing of Hypothesis-AGBS
http://slidepdf.com/reader/full/testing-of-hypothesis-agbs 37/74
Test for Difference of Means«Example
Information on two sets of samples regarding the expenditure
in Rs. per month per family
43.1581652
1!
61264132
2!
744!1x
78.516!2
x
n1= 42
n2= 32
Test whether the average expenditure per month per family is
equal.
H0 : Q1 = Q2 H1: Q1 { Q2
Z = 3.36
Z > 1.96, H0 is rejected. The average expenditure per month
per family in the two populations is not equal.

8/8/2019 Testing of Hypothesis-AGBS
http://slidepdf.com/reader/full/testing-of-hypothesis-agbs 38/74
Under H0
222
21
21
21
2
2
2
1
2
1
21 if
n
1
n
1
xx
n
n
xxZ !!
!
!
Test for Difference of Means«
Population Variances are known & Equal

8/8/2019 Testing of Hypothesis-AGBS
http://slidepdf.com/reader/full/testing-of-hypothesis-agbs 39/74
Test for Single Proportion
n p Sample size
x p Persons possessing the given attribute
p Observed proportion of successes
P p Population proportion, Q = 1- P
H0: P = P0
H1: P { P0 or P > P0 or P < P0
Test Statistic: Normal test
(0,1) N~ PQ/n
P- p Z !
pn
x!

8/8/2019 Testing of Hypothesis-AGBS
http://slidepdf.com/reader/full/testing-of-hypothesis-agbs 40/74
Test for Single Proportion«
Test Criteria:
H1
TestReject H
0at level of
significance E if P { P
0Two-tailed test Z> ZE /2
P < P0
Left-tailed test Z < -ZE
P > P0
Right-tailed
test
Z > ZE
8/8/2019 Testing of Hypothesis-AGBS
http://slidepdf.com/reader/full/testing-of-hypothesis-agbs 41/74
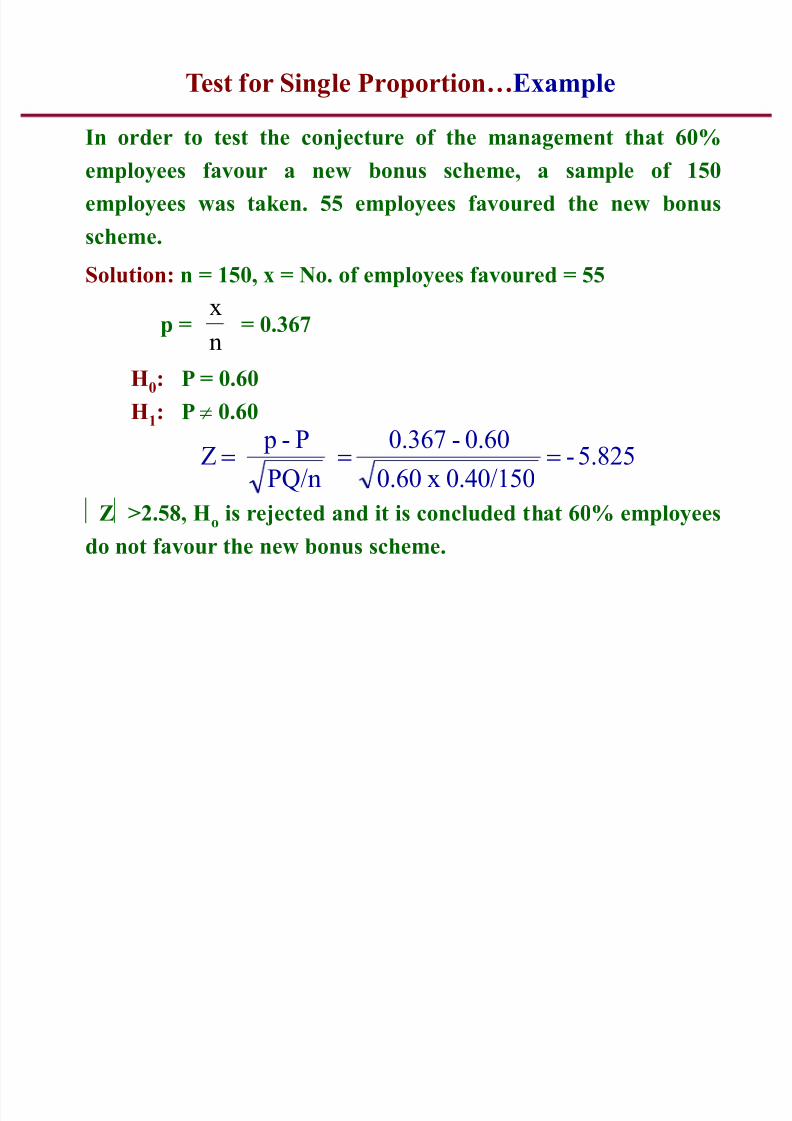
In order to test the conjecture of the management that 60%employees favour a new bonus scheme, a sample of 150
employees was taken. 55 employees favoured the new bonus
scheme.
Solution: n = 150, x = No. of employees favoured = 55
p = = 0.367
H0: P = 0.60
H1:P
{ 0.60
Z>2.58, Ho is rejected and it is concluded that 60% employees
do not favour the new bonus scheme.
n
x
5.825-0.40/150x0.60
0.60-0.367
PQ/n
P- p Z !!!
Test for Single Proportion«Example

8/8/2019 Testing of Hypothesis-AGBS
http://slidepdf.com/reader/full/testing-of-hypothesis-agbs 42/74
Test for Difference of Proportions
Let x1 (x2) be the number of persons possessing a givenattribute A in random sample of size n1 (n2) from 1st (2nd)
population. Then sample proportions will be
Let P1 and P2 be the population proportions
H0: P1 = P2
H1: P1 { P2 or P1 > P2 or P1 < P2
Test Statistic: Normal test
2
22
1
11
n
x p ,
n
x p !!
( ,1)
n
QP
n
QP
)PP( p pZ
2
22
1
11
2121
!

8/8/2019 Testing of Hypothesis-AGBS
http://slidepdf.com/reader/full/testing-of-hypothesis-agbs 43/74
Test for difference of proportions«
Test Statistic: Under H0: P1 = P2 = P (say)
Q =1-P
)n
1
n
1(PQ
p pZ
21
21
21
2211
nn
pn pnP

8/8/2019 Testing of Hypothesis-AGBS
http://slidepdf.com/reader/full/testing-of-hypothesis-agbs 44/74
In a district, 450 persons were regular consumers of tea out of asample of 1000 persons. In another district, 400 were regular
consumers of tea out of a sample of 800 persons. Is there a
significant difference between the two districts as far as tea
drinking habit is concerned?
Solution: H0: P1 = P2 =P
H1: P1 { P2
Significant at 5% as calculated value is more than table value
(1.96). Reject H0
08.2
)8001
10001(0.47x0.53
5.045.0Z !
!
Test for difference of proportions«Example
8/8/2019 Testing of Hypothesis-AGBS
http://slidepdf.com/reader/full/testing-of-hypothesis-agbs 45/74
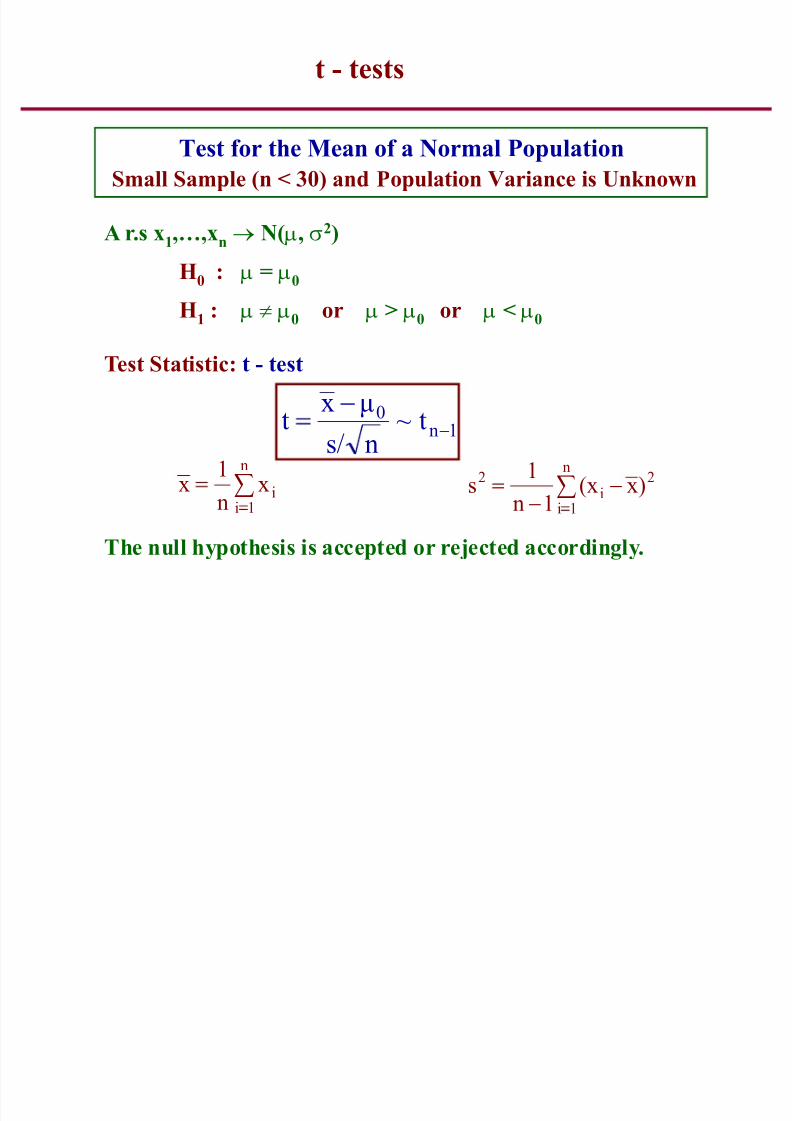
A r.s x1,«,xn p N(Q, W2)
H0 : Q = Q0
H1 : Q { Q0 or Q > Q0 or Q < Q0
Test Statistic: t - test
The null hypothesis is accepted or rejected accordingly.
1n0 t~ns/
xt
§
n
1iix
n
1x 2
n
1ii
2 )x(x1n
1s
§
¡
Test for the Mean of a Normal PopulationSmall Sample (n < 30) and Population Variance is Unknown
t - tests

8/8/2019 Testing of Hypothesis-AGBS
http://slidepdf.com/reader/full/testing-of-hypothesis-agbs 46/74
Test for the Mean«
Test Criteria:
H1
TestReject H
0at level
of significance E if
Q { Q0
Two-tailed test t> tn-1(E /2)
Q < Q0
Left-tailed test t < -tn-1(E)
Q > Q0
Right-tailed
test
t > tn-1(E)

8/8/2019 Testing of Hypothesis-AGBS
http://slidepdf.com/reader/full/testing-of-hypothesis-agbs 47/74
Suppose the claim has been made that the height of adult males in a
college is different from what it used to be and we wish to test this
hypothesis. A campus wide survey made 20 years ago found that the
mean height of males was 69.5 in. To study this, a random sample of
15 males of the same age from current students was taken and their
height recorded.Solution:
H0: The average height is 69.5 in.
H1: The average height is more than 69.5 in.
Since |t| < 2.14 (value of t at 5% and 14 d.f), the mean height is 69.5 in.
4.07x ! 71.0s !
14t~1.27150.71/
5.694.07!
!t
Test for the Mean«Example
65.0, 67.5, 68.0,
68.5, 69.0, 69.5,
69.5, 70.0, 71.0,
71.5, 71.5, 72.5,
72.5, 74.5, 75.5

8/8/2019 Testing of Hypothesis-AGBS
http://slidepdf.com/reader/full/testing-of-hypothesis-agbs 48/74
t-table
'

8/8/2019 Testing of Hypothesis-AGBS
http://slidepdf.com/reader/full/testing-of-hypothesis-agbs 49/74
Test for the Difference of Two Population Means
Let be the sample mean of a sample of size n1 (n2) from
a population with mean Q1 (Q2).
H0 : Q1 - Q2 = H0
Test Statistic: Under H0
W2 is estimated from the sample
)x(x 21
2nn
21
021
21t~
n
1
n
1
xxt
2nn
1)s(n1)s(ns
21
222
2112
Population Variances are Unknown but Equal

8/8/2019 Testing of Hypothesis-AGBS
http://slidepdf.com/reader/full/testing-of-hypothesis-agbs 50/74
In order to compare the reading ability of dyslexic children by
placing a blue plastic overlay on reading material with a clear
overlay, an experiment was conducted with 12 children in each
group and the scores are as follows:
Blue Overlay ± 70, 80, 90, 80, 50, 80, 70, 80, 70, 80, 80, 70
Clear Overlay ± 50, 40, 50, 50, 60, 60, 60, 40, 60, 70, 60, 80
Assess whether reading ability of dyslexic children improved by
placing a blue plastic overlay?
Test for the Difference«Example

8/8/2019 Testing of Hypothesis-AGBS
http://slidepdf.com/reader/full/testing-of-hypothesis-agbs 51/74
Solution:
H0 : Q1 = Q2 H1 : Q1 > Q2
Since t > 2.074 (value of t at 5% and 22 d.f), The null hypothesis
is significant and thus not accepted. This concludes that blue
plastic overlays on reading material improves visual processing
and provides immediate improvement in the reading ability of
dyslexic children.
,57x1! ,7.56x
2!
,100s2
1!
22t~4.15t !
Test for the Difference«Example
3.133s2
2!

8/8/2019 Testing of Hypothesis-AGBS
http://slidepdf.com/reader/full/testing-of-hypothesis-agbs 52/74
Paired t-test for Difference of Means
When n1 = n2 = n
Two samples are not independent (paired)
Let (xi, yi), i=1,..,n be a r.s from a B.N. population
Let di = xi - yi
H0 : Q1 - Q2 = Q0
Test Statistic: Under H0
1-n0 t~ ns/
dt
§¢
n
1iid
n
1 d §
¢
n
1i
2i
2 )dd1n
1s

8/8/2019 Testing of Hypothesis-AGBS
http://slidepdf.com/reader/full/testing-of-hypothesis-agbs 53/74
In a study to know the effect of training to 8 researchers on a
particular subject, following are the pre and post training
scores:
Before training: 49 53 51 52 47 50 52 53
After training: 52 55 52 53 50 54 54 53
Can we conclude that training has improved the performance
of the researchers?
Paired t-test«Example
8/8/2019 Testing of Hypothesis-AGBS
http://slidepdf.com/reader/full/testing-of-hypothesis-agbs 54/74
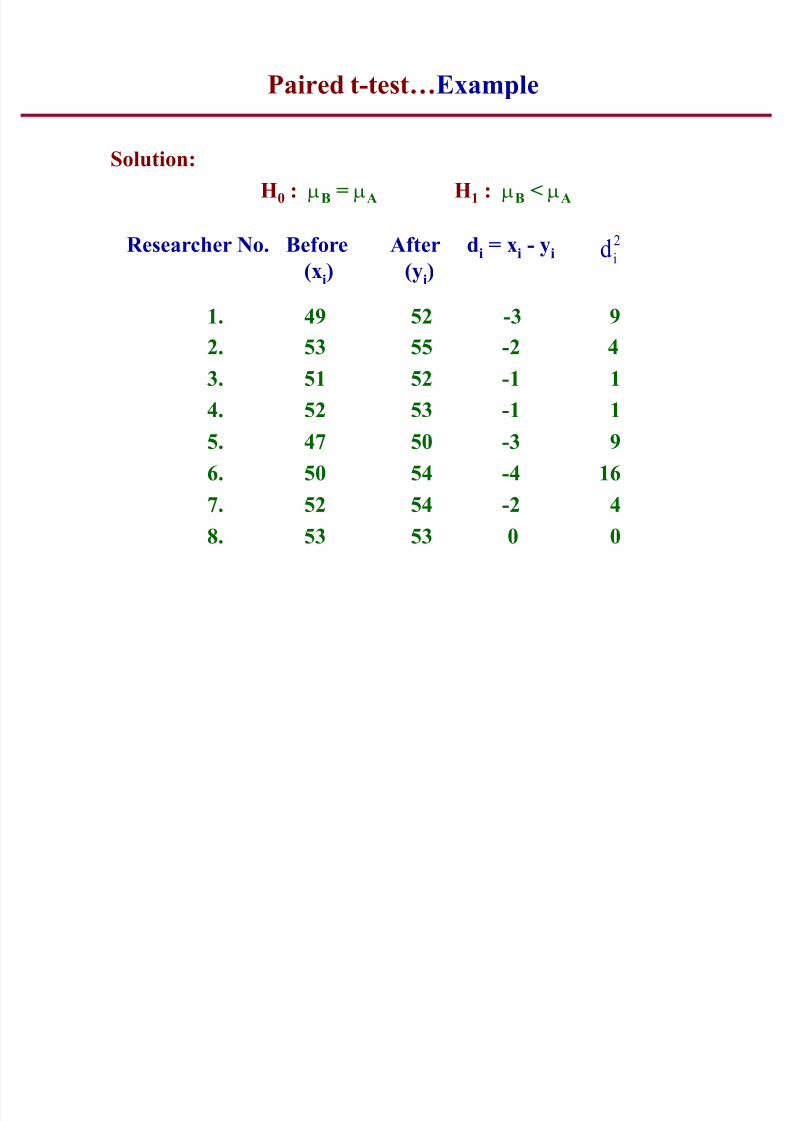
Solution:
H0 : QB = QA H1 : QB < QA
Researcher No. Before After di = xi - yi
(xi
) (yi
)
1. 49 52 -3 9
2. 53 55 -2 4
3. 51 52 -1 1
4. 52 53 -1 1
5. 47 50 -3 9
6. 50 54 -4 16
7. 52 54 -2 4
8. 53 53 0 0
2
id
Paired t-test«Example

8/8/2019 Testing of Hypothesis-AGBS
http://slidepdf.com/reader/full/testing-of-hypothesis-agbs 55/74
t (5%,7 d.f.) = 1.90
H0 is rejected, so it is concluded that training has improved
the performance of the researchers.
-28
16- n
1 n
1ii !!! §
!
714.1)d(d
7
1s
n
1i
2i
2!! §
!
7t~4. 21.714/
2
ns/
|d||t| !!!
Paired t-test«Example

8/8/2019 Testing of Hypothesis-AGBS
http://slidepdf.com/reader/full/testing-of-hypothesis-agbs 56/74
Let x1, x2,«,xn (nu2) be a r.s from N(Q, W2).
H0 :
Test Statistic: Under H0
when Q is known
when Q is unknown
20
2 !
2
n
2
0
in
1i
2
~
x
G¹¹ º
¸
©©ª
¨
!G §!
2
1-n
2
0
in
1i
2 ~
xxG¹¹
º
¸©©ª
¨ !G §
!
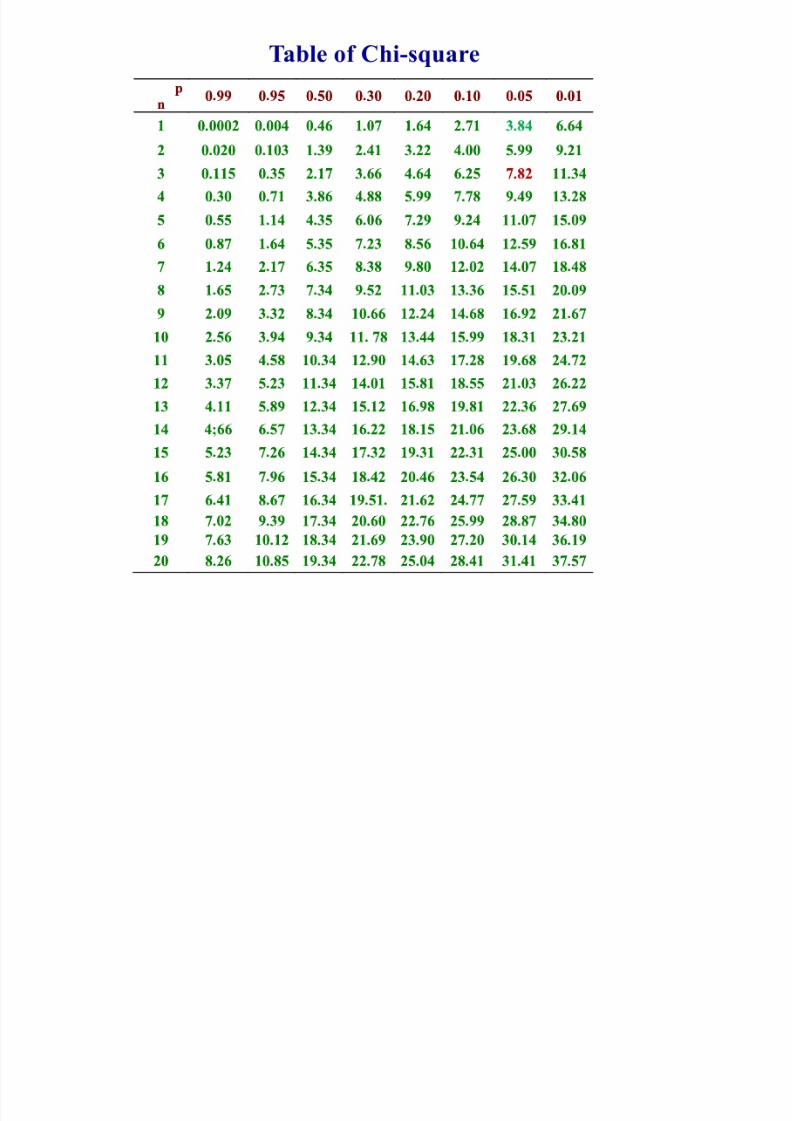
Chi-Square tests
Test for the variance of a normal population

8/8/2019 Testing of Hypothesis-AGBS
http://slidepdf.com/reader/full/testing-of-hypothesis-agbs 57/74
Chi-Square tests« Example
The precision of an instrument, measured in terms of variance, is not less than 0.16. Given the 11 measurements
(2.3, 2.5, 2.3, 2.4, 2.7, 2.5, 2.6, 2.5, 2.7, 2.6, 2.5) on the
instrument, test the claim:
16.02!
16.02"
51.2!
Solution: H0:
H1:
1.1 2
2
01
2
!¹¹ º
¸
©©ª
¨
!G §!Tabulated value of G2 with 10 d.f. at 1% level is 2.5. Since
calculated value < tabulated, H0 is not significant and hence the
precision of the instrument is 0.16.

8/8/2019 Testing of Hypothesis-AGBS
http://slidepdf.com/reader/full/testing-of-hypothesis-agbs 58/74
To test the discrepancy between the observed and the expected
frequency
H0 : the fitted distribution is a good fit
H1 : not a good fit
Test Statistic:
Oip Observed frequency of ith class
Ei p Expected frequency of ith class, i =1,«,n.
21-r -n
i
2
iin
1i
2 ~E
EOG
!G §!
Test of Goodness of Fit

8/8/2019 Testing of Hypothesis-AGBS
http://slidepdf.com/reader/full/testing-of-hypothesis-agbs 59/74
Suppose four brands of cola are equally preferred by consumers.
It is of interest to know whether in the population of consumers,
the proportion of individuals preferring each brand is ¼.
To test this null hypothesis, 100 individuals were randomly
selected.
They were asked to taste the four brands without disclosing the
brand name and then declare their preference.
H0 : PA =PB = PC = PD = 0.25
Test of Goodness of Fit«Example

8/8/2019 Testing of Hypothesis-AGBS
http://slidepdf.com/reader/full/testing-of-hypothesis-agbs 60/74
Since 3.44 < 7.82 (value of chi-square at 5% and 3 d.f), the result is
not significant and hence the proportion is same which is 1/4.
Frequenc
O served (Oi) pected ( i) Oi - i
2 25 -5
31 25
28 25 3
21 25 -4
3.44E
)E(O2
1i i
2
ii2
!
!G §!
Test of Goodness of Fit«Example
8/8/2019 Testing of Hypothesis-AGBS
http://slidepdf.com/reader/full/testing-of-hypothesis-agbs 61/74

8/8/2019 Testing of Hypothesis-AGBS
http://slidepdf.com/reader/full/testing-of-hypothesis-agbs 62/74
Contingency Table
Class A1 A2 A3
B1
n11
n21
n31
B2 n12 n22 n32
B3 n13 n23 n33
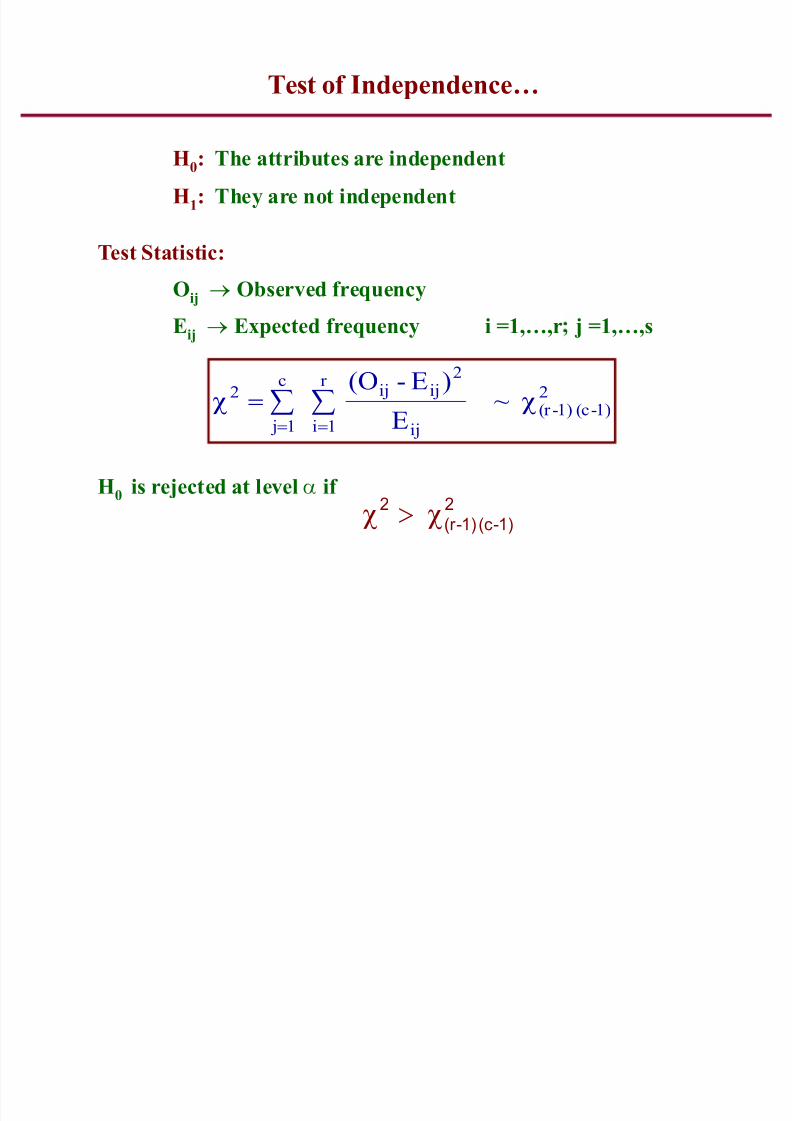
Test of Independence
8/8/2019 Testing of Hypothesis-AGBS
http://slidepdf.com/reader/full/testing-of-hypothesis-agbs 63/74
H0: The attributes are independent
H1: They are not independent
Test Statistic:
Oij p Observed frequency
Eij p Expected frequency i =1,«,r j =1,«,s
H0 is rejected at level E if
21)-(c1)-(r
c
1 j
r
1i ij
2ijij2 ~
E
)E-(O G!G § §
! !
21)-(c1)-(r
2 G"G
Test of Independence«

8/8/2019 Testing of Hypothesis-AGBS
http://slidepdf.com/reader/full/testing-of-hypothesis-agbs 64/74
From the following table, test the hypothesis that the test
result is related to the sex of the student:
Sex Pass Fail Total
Male 99 36 135
Female 20 5 25
Total 119 41 160
Test of Independence«Example 1

8/8/2019 Testing of Hypothesis-AGBS
http://slidepdf.com/reader/full/testing-of-hypothesis-agbs 65/74
84.3%( 2 !
22 .492 !
Test of Independence«Example 1
Sex Pass Fail Total
Male 99
(100.4)
36
(34.6)
135
Female 20
(18.6)
5
(6.4)
25
Total 119 41 160
H0: Test result is independent of the sex of the student

8/8/2019 Testing of Hypothesis-AGBS
http://slidepdf.com/reader/full/testing-of-hypothesis-agbs 66/74
The educational standard of adoptability of new innovationsamong 500 farmers are given below. Test whether the educational
standard has any impact on their adoptability of innovation.
H0: Adoptability is independent of the educational standard
Educational Standard
Illiterate Matric Graduat
e
Post
Graduate
Adopted 60
(110.2)
70
(38.0)
35
(20.9)
25
(20.9)
Not
Adopted
230
(179.8)
30
(62.0)
20
(34.1)
30
(34.1)
34.11%)1( 23 !82.7%)5( 23 !23
2 ~96.99 !
Test of Independence«Example 2
8/8/2019 Testing of Hypothesis-AGBS
http://slidepdf.com/reader/full/testing-of-hypothesis-agbs 67/74
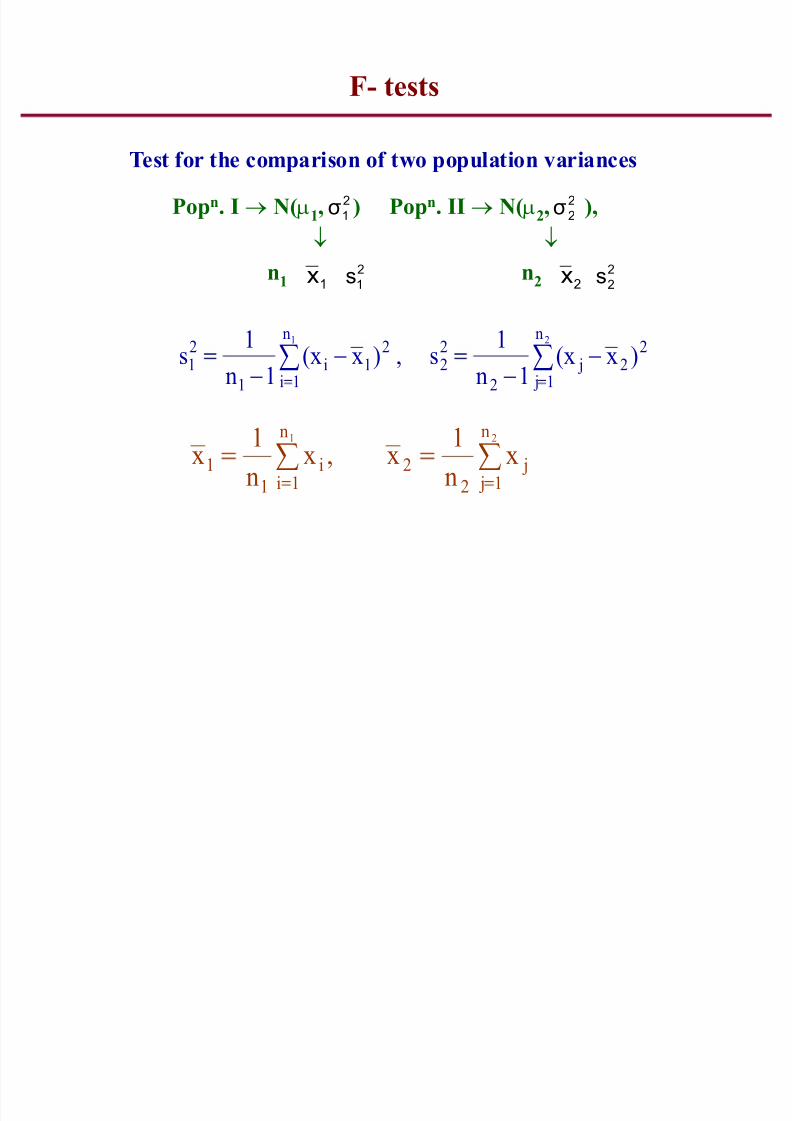
F- tests
Test for the comparison of two population variances
Popn. I p N(Q1, ) Popn. II p N(Q2, ),
q q
n1
n2
2
1
2
2
1
x2
1
s2
x2
2
s
§§
21 n
1 j
22 j
2
22
n
1i
21i
1
21 )x(x
1n
1s ,)x(x
1n
1s
§§21 n
1 j j
2
2
n
1ii
1
1 xn
1x ,x
n
1x

8/8/2019 Testing of Hypothesis-AGBS
http://slidepdf.com/reader/full/testing-of-hypothesis-agbs 68/74
H0 :
Test Statistic:
The computed value of F is compared with the tabulated
value and the inference is drawn accordingly.
22
21 !
1n,1n1
1F ~
s
sF !
F- test«

8/8/2019 Testing of Hypothesis-AGBS
http://slidepdf.com/reader/full/testing-of-hypothesis-agbs 69/74
The nicotine contents in mgm in two samples of tobacco
were found to be as follows:
Sample A: 24 27 26 21 25
Sample B: 27 30 28 31 22 36
Test whether the two samples have been taken from thepopulation with the same variability.
Solution: n1 = 6 , n2 = 5
H0
: , H1
:
Since F < 5.19 (value of F at 5% and 5, 4 d.f), the two
samples have the same variability
2
2
2
1
!2
2
2
1
W{W
4,1 F ~ 4.08s
sF !!
Example

8/8/2019 Testing of Hypothesis-AGBS
http://slidepdf.com/reader/full/testing-of-hypothesis-agbs 70/74
Example: Z Test for
8/8/2019 Testing of Hypothesis-AGBS
http://slidepdf.com/reader/full/testing-of-hypothesis-agbs 71/74
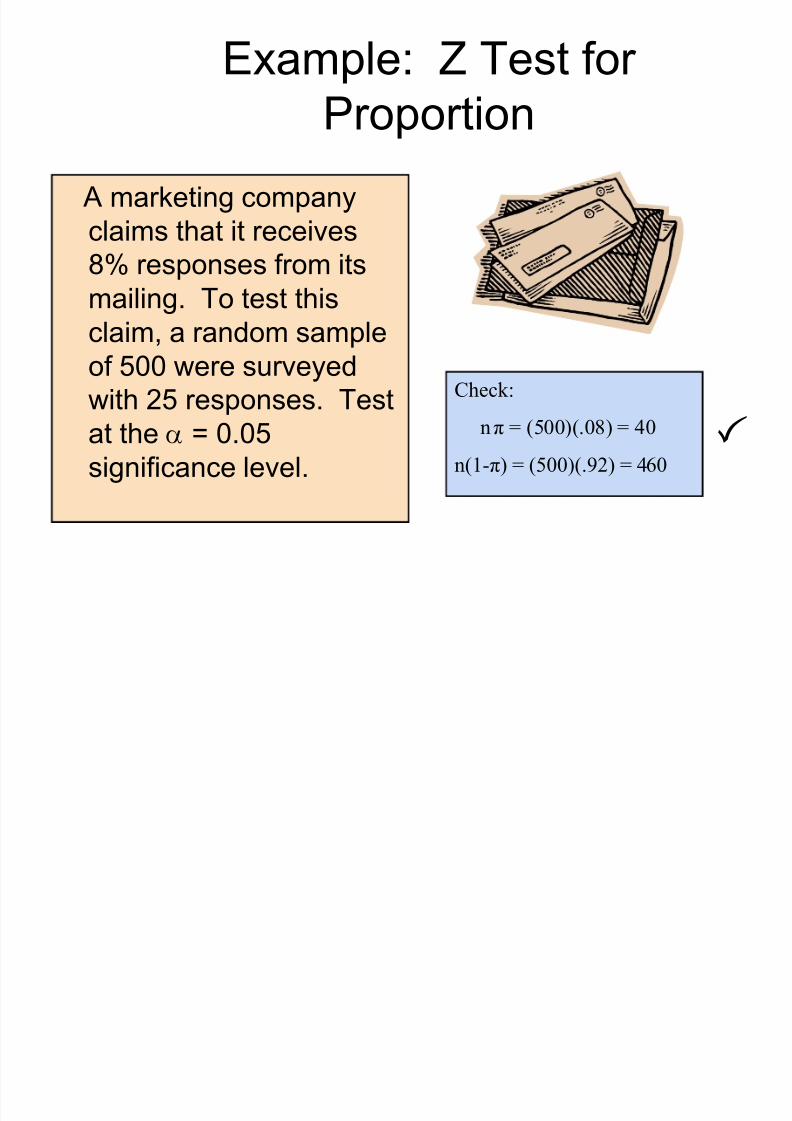
Example: Z Test for Proportion
A marketing companyclaims that it receives8% responses from its
mailing. To test thisclaim, a random sampleof 500 were surveyedwith 25 responses. Test
at the E = 0.05significance level.
Check:
n = (500)(.08) = 40
n(1-) = (500)(.92) = 460

8/8/2019 Testing of Hypothesis-AGBS
http://slidepdf.com/reader/full/testing-of-hypothesis-agbs 72/74
Z Test for Proportion: Solution
E = 0.05
n = 500, p = 0.05
Reject H0 at E = 0.05
H0: = 0.08
H1: { 0.08
Critical Values:± 1.96
Test Statistic:
Decision:
Conclusion:
z 0
Reject Reject
.025.025
1.96
-2.47
There is sufficient
evidence to reject the
company¶s claim of 8%
response rate.
2.47
500
.08).08(1
.08.05
n
)(1
pZ !
!
!
T T
T
-1.96
Example: Two Tail Test

8/8/2019 Testing of Hypothesis-AGBS
http://slidepdf.com/reader/full/testing-of-hypothesis-agbs 73/74
Example: Two-Tail Test(W Unknown)
The average cost of ahotel room in New Yorkis said to be $168 per
night. A random sampleof 25 hotels resulted inX = $172.50 and
S = $15.40. Test at theE = 0.05 level.( Assume the population distribution is normal)
H0: = 168
H1: { 168
E l S l ti

8/8/2019 Testing of Hypothesis-AGBS
http://slidepdf.com/reader/full/testing-of-hypothesis-agbs 74/74
E= 0.05
n = 25
W is unknown, so
use a t statistic Critical Value:
t24 = ± 2.0639
Example Solution:Two-Tail Test
Do not reject H0: not sufficient evidence that true
mean cost is different than $168
Reject H0Reject H0
E/2=.025
-t n-1,/2
Do not reject H0
0
E/2=.025
-2.0639 2.0639
1.46
2515.40
168172.50
nS
Xt 1n !
!
!
1.46
H0: = 168
H1: { 168
t n-1,/2