testing munk's hypothesis for submesoscale eddy generation...
TRANSCRIPT

RESEARCH ARTICLE10.1002/2017JC012910
Testing Munk’s hypothesis for submesoscale eddy generationusing observations in the North AtlanticChristian E. Buckingham1,2 , Zammath Khaleel1,3, Ayah Lazar4,5, Adrian P. Martin6 ,John T. Allen7,8, Alberto C. Naveira Garabato1, Andrew F. Thompson4 , and Cl�ement Vic1
1National Oceanography Centre, University of Southampton, Southampton, UK, 2Now at British Antarctic Survey,Cambridge, UK, 3Now at Ministry of Environment and Energy, Mal�e, Maldives, 4California Institute of Technology,Pasadena, California, USA, 5Now at Israel Oceanographic and Limnological Research, Haifa, Israel, 6National OceanographyCentre, Southampton, UK, 7University of Portsmouth, Portsmouth, UK, 8VECTis Environmental Consultants, LLP,Portsmouth, UK
Abstract A high-resolution satellite image that reveals a train of coherent, submesoscale (6 km) vorticesalong the edge of an ocean front is examined in concert with hydrographic measurements in an effort tounderstand formation mechanisms of the submesoscale eddies. The infrared satellite image consists ofocean surface temperatures at �390 m resolution over the midlatitude North Atlantic (48.698N, 16.198W).Concomitant altimetric observations coupled with regular spacing of the eddies suggest the eddies resultfrom mesoscale stirring, filamentation, and subsequent frontal instability. While horizontal shear orbarotropic instability (BTI) is one mechanism for generating such eddies (Munk’s hypothesis), we concludefrom linear theory coupled with the in situ data that mixed layer or submesoscale baroclinic instability (BCI)is a more plausible explanation for the observed submesoscale vortices. Here we assume that the frontaldisturbance remains in its linear growth stage and is accurately described by linear dynamics. This resultlikely has greater applicability to the open ocean, i.e., regions where the gradient Rossby number is reducedrelative to its value along coasts and within strong current systems. Given that such waters comprise anappreciable percentage of the ocean surface and that energy and buoyancy fluxes differ under BTI and BCI,this result has wider implications for open-ocean energy/buoyancy budgets and parameterizations withinocean general circulation models. In summary, this work provides rare observational evidence ofsubmesoscale eddy generation by BCI in the open ocean.
Plain Language Summary Here, we test Munk’s theory for small-scale eddy generation using aunique set of satellite- and ship-based observations. We find that for one particular set of observations inthe North Atlantic, the mechanism for eddy generation is not pure horizontal shear, as proposed by Munket al. (2000) and Munk (2001), but is instead vertical shear, or baroclinic instability. While by itself, this is nota globally important result, taken in the context of mesoscale eddies which are ubiquitous in the WorldOcean, this suggests energy exchanges in the more ambient, open ocean are the result of the latter mecha-nism. In conclusion, submesoscale eddy generation is poorly understood in the ocean and we need to bet-ter constrain our geographical and temporal understanding of these processes for representation in coarse-resolution models.
1. Background
Submesoscale processes are believed to play important roles in ocean turbulence, stratification, and primaryproductivity [Boccaletti et al., 2007; Fox-Kemper et al., 2008a, 2008b; Thomas et al., 2008; Klein and Lapeyre,2009; Fox-Kemper et al., 2011; L�evy et al., 2012; Mahadevan et al., 2012; Omand et al., 2015; Br€uggemann andEden, 2015; Gula et al., 2016]. Despite this fact, observations of submesoscale phenomena are scarce. Tradi-tional sampling strategies often fail to resolve these phenomena owing to their small-to-moderate lateralscale (0.1–10 km) and quickly evolving nature (hours to days). While expensive field campaigns have beendesigned to overcome this challenge—examples include the Scalable Lateral Mixing and Coherent Turbu-lence (i.e., LatMix) [Shcherbina et al., 2015], Ocean Surface Mixing, Ocean Submesoscale Interaction Study(OSMOSIS) [Buckingham et al., 2016; Thompson et al., 2016; Pearson et al., 2015], and Surface Mixed Layer
Key Points:� A high-resolution satellite image
reveals an ocean front populated bysubmesoscale vortices� Linear theory applied to coincident
hydrography suggests vortices resultnot from barotropic but baroclinicinstability� This study documents rare
observational evidence ofsubmesoscale baroclinic instability inthe open ocean
Supporting Information:� Supporting Information S1
Correspondence to:C. E. Buckingham,[email protected]
Citation:Buckingham, C. E., Z. Khaleel, A. Lazar,A. P. Martin, J. T. Allen, A. C. NaveiraGarabato, A. F. Thompson, and C. Vic(2017), Testing Munk’s hypothesis forsubmesoscale eddy generation usingobservations in the North Atlantic,J. Geophys. Res. Oceans, 122, 6725–6745, doi:10.1002/2017JC012910.
Received 24 MAR 2017
Accepted 18 JUL 2017
Accepted article online 24 JUL 2017
Published online 28 AUG 2017
VC 2017. The Authors.
This is an open access article under
the terms of the Creative Commons
Attribution License, which permits use,
distribution and reproduction in any
medium, provided the original work is
properly cited.
BUCKINGHAM ET AL. TESTING MUNK’S HYPOTHESIS 6725
Journal of Geophysical Research: Oceans
PUBLICATIONS

Evolution at Submesoscales (SMILES) experiments—additional observations are needed to validate thesemodel-driven hypotheses.
One approach to overcoming the sampling problem is to use remotely sensed data. Such data offer asolution to this problem by yielding two-dimensional (2-D)—and in the case of repeated measurementsin time, three-dimensional (3D)—snapshots of the ocean surface at considerably high resolution. Anexcellent example of this analysis was provided by the study of an upwelling front in the California Cur-rent System [Flament et al., 1985]. Examining repeated satellite infrared (IR) images of an ocean front offthe Californian coast, Flament et al. [1985] found evidence of submesoscale eddy generation resultingfrom horizontal shear instability. Another useful example is the analysis of optical imagery collected fromthe Apollo shuttle missions [Scully-Power, 1986; Munk et al., 2000; Munk, 2001]. These images were col-lected at high spatial resolution from a hand-held fixed-focal length camera during the 1980s andrevealed the existence of submesoscale ‘‘spiral eddies’’—so-called because of their spiral-like appearance.As postulated by Munk et al. [2000], these features result from horizontal shear and the subsequent roll-up of vortices. Moreover, they are visible on the ocean surface as a result of glitter patterns interactingwith ocean surfactants. While repeat snapshots were not available from the space shuttle within therequired time scale (i.e., hours to several days), the ubiquity of such oceanographic features in the globalocean were not known prior to these observations. McWilliams [1985] provides a nice summary of whatwas known up until that time. See, also, McWilliams [2016] for a modern-day review of oceanic submeso-scale currents.
One question that remains outstanding in the oceanographic community is, ‘‘What are the relative rolesof horizontal and vertical shear in generating submesoscale vortices in the global ocean?’’ While we knowfrom analytical and numerical modeling solutions that submesoscale vortices can be generated by both(1) horizontal shear instability (barotropic instability, BTI) [D’Asaro, 1988; Munk et al., 2000; Munk, 2001]and (2) vertical shear (baroclinic instability, BCI) [Samelson, 1993; Haine and Marshall, 1998; Eldevik andDysthe, 1999, 2002], their relative importance may differ with geographic location and time of year. Fur-thermore, because the energy sources for these disturbances differ and because BTI has a negligibleeffect upon upper ocean stratification whereas BCI restratifies the surface ocean [Haine and Marshall,1998; Boccaletti et al., 2007], the answer to this question has important consequences for energy andbuoyancy budgets in the upper ocean. This, in turn, may moderate climate as a result of changes inocean-atmosphere heat and gas exchange. While such effects might be parameterized on the basis ofmesoscale velocity and buoyancy fields and, thus, validated to some degree using satellite altimetry inconcert with high-resolution observations, at the moment we have scant high-resolution observations tosubstantiate such parameterizations.
Recognizing that submesoscale-resolving observations are limited and motivated by the unaddressed ques-tion posed above, we proceed to identify satellite imagery coincident with preexisting in situ measurementsand search for evidence of submesoscale eddy generation. The study begins over the open ocean in theNorth Atlantic where in situ data were collected as part of the OSMOSIS field campaign. By systematicallyidentifying cloud-free periods and cross-referencing these with high-resolution IR imagery, we identify a sin-gle satellite image revealing coherent, submesoscale vortices on the edge of an ocean front. The image iscoincident with a high-resolution hydrographic survey (i.e., from SeaSoar) conducted over the front, fromwhich we can calculate relevant dynamical parameters. We then proceed to examine whether BTI or BCI aremost responsible for the observed submesoscale vortices. In light of the submesoscale eddy generationmechanism proposed by Munk et al. [2000] and a comment made by Munk in discussing this eddy genera-tion mechanism [Munk, 2001, last paragraph on p. 197], we refer to this as ‘‘testing Munk’s hypothesis’’ thatsubmesoscale eddies are generated by BTI [Munk et al., 2000; Munk, 2001]. We acknowledge we do nothave concomitant optical imagery. This also seems fitting as this year marks Dr. Walter Munk’s 100thbirthday.
The outline of this study is as follows. In section 2, we describe the methods and data sets used in this study.In section 3, we document the ultra-high-resolution satellite image in which the ocean front is observed. Insection 4, we conduct a linear instability analysis of the front and test the hypothesis that pure BTI is respon-sible for the observed eddies. Noting that horizontal shear does not accurately explain the observed scaleof the instability (section 4.3.1), we turn our attention to BCI as an alternative mechanism. The constraints ofthe BCI model used in this study limit conclusions to some degree. Nevertheless, we demonstrate that BCI
Journal of Geophysical Research: Oceans 10.1002/2017JC012910
BUCKINGHAM ET AL. TESTING MUNK’S HYPOTHESIS 6726

is a more plausible solutionthan BTI in explaining the dis-turbance and the observedsubmesoscale eddies (section4.3.2). We summarize conclu-sions in section 5 and discussthese findings in section 6.
2. Methods
OSMOSIS was a research con-sortium formed to betterunderstand competing turbu-lent processes within theocean surface boundary layer(SBL), including Langmuir tur-bulence and submesoscaleprocesses. The observationalcomponent of the studyincluded two process study
cruises, year-long mooring and year-long glider observations, September 2012 to September 2013, all ofwhich took place in the eastern North Atlantic (48.698N, 16.198W, Figure 1) [Allen et al., 2013; Buckingham et al.,2016; Thompson et al., 2016; Damerell et al., 2016]. In order to help with interpretation of these observations,we sought high-resolution satellite imagery throughout the entire year. Remote sensing platforms equippedwith optical and synthetic aperture radar (SAR) provide images with sufficient resolution. However, measure-ments from these platforms were not scheduled prior to the experiment. IR instruments, which yield images atO(1) km pixel resolution, were identified as a possible resource, despite signal attenuation due to atmosphericwater vapor.
2.1. Obtaining High-Resolution Satellite Infrared ImageryIt is common for weeks to pass in the North Atlantic before a cloud-free image is obtained, particularlyduring winter. This was true during the OSMOSIS year-long experiment and necessitates a systematicapproach to obtaining IR imagery. While data distribution systems that subset data files at user-specified times and locations can help, not all satellite data are served in this manner. Our approach toovercoming this hurdle was to develop a time series of cloud cover at the OSMOSIS site from geosyn-chronous (GS) data and cross-reference periods of low cloud cover with available high-resolution imag-ery from a polar-orbiting (PO) spacecraft. In this study, we made use of thermal imagery from theVisible and Infrared Imaging Radiometer Suite (VIIRS) located on Suomi National Polar-orbiting Partner-ship (NPP) owing to its ability to resolve fine-scale ocean structure [Khaleel, 2015; Schloesser et al.,2016].2.1.1. Geosynchronous or Geostationary Satellite MeasurementsThe Spinning Enhanced Visible and InfraRed Imager (SEVIRI) sensor onboard the Meteosat Second Gener-ation (MSG) spacecraft provides considerable coverage at our location. This spacecraft orbits the Earth atgeostationary altitude (i.e., �36,000 km), yielding images of the Earth every 15 min. Measurements withindifferent spectral bands are then combined to yield estimates of sea surface temperature (SST) every 30min at 6 km resolution (8 km at our location) [Maturi et al., 2008]. While the use of model output (e.g.,from the European Centre for Medium-Range Weather Forecasting, ECMWF, or National Center for Envi-ronmental Prediction, NCEP) was considered, these data have much coarser temporal and spatial resolu-tion when compared with those from GS spacecraft. Additionally, models assimilate measurements froma variety of sources, including those from the microwave portion of the spectrum [Bauer et al., 2010].These factors provide an argument for the use of observations rather than model data to estimate cover-age by clouds.
Fractional cloud cover, cðR; tÞ, is defined as the average number of poor-quality pixels within a circle ofradius R centered on the mooring site at time t (i.e., 48.698N, 16.198W):
Figure 1. The location of the OSMOSIS mooring site (48.698N, 16.198W, September 2012 toSeptember 2013) overlain on mean eddy kinetic energy (EKE). Signatures of the Gulf Stream’sextension into the Atlantic is seen to the west while a more latent eastern boundary current isand continental shelf waters are found to the east. Mean EKE was computed from satellitealtimetry (1993–2013).
Journal of Geophysical Research: Oceans 10.1002/2017JC012910
BUCKINGHAM ET AL. TESTING MUNK’S HYPOTHESIS 6727

cðR; tÞ5
Xm
i51ðpoor quality pixelsÞXn
j51ðtotal pixelsÞ
: (1)
Here m is the number of pixels flagged as cloudy using a Bayesian algorithm and included in the data prod-uct described below [Maturi et al., 2008; Saunders and Kriebel, 1988; Merchant et al., 2005] and n is the totalnumber of pixels enclosed by the circle. To provide greater understanding of cloud coverage, we computedc for four small circles (Figure 2a). Our interpretation was that cloud coverage is (a) homogeneous when allfour estimates of c illustrate similar trends and (b) present but inhomogeneous when c records for one ortwo records fall to low values while others remain at elevated values. We did not attempt to classify cloudtypes based estimates of c. We then defined a threshold and identified periods during which all c values fellbelow this value. The threshold was determined iteratively by examining PO images at various c levels andidentifying the level that yielded the best likelihood of clear-sky conditions at the OSMOSIS mooring site.
Figure 2. Identification of clear-sky occurrences over the OSMOSIS site (48.698N, 16.198W): (a) SST from SEVIRI on MSG-3 valid at the timeof the unstable front. Fractional cloud cover, c, was computed as the fraction of cloud-contaminated pixels within circles of increasing dis-tance from the observation center. (b) Clear-sky occurrences and c at the OSMOSIS mooring site (2012–2013). (c) Same as Figure 2b butmagnified on 1 September to 5 October 2012; clear-sky occurrences are shown in gray and the red arrow highlights the period duringwhich an unstable front was observed (the focus of this study). Colors correspond to radii of small circles, R1 to R4.
Journal of Geophysical Research: Oceans 10.1002/2017JC012910
BUCKINGHAM ET AL. TESTING MUNK’S HYPOTHESIS 6728

We selected 0.6 as our threshold. Having identified instances of low c, we then cross-referenced theseoccurrences with available VIIRS data.
We computed c from near real-time (NRT) data from MSG-3 provided by CERSAT/IFREMER. While we initiallyused SST generated by the Group for High-Resolution Sea Surface Temperature (GHRSST) and distributedby the NOAA National Oceanographic Data Center (NODC), this data record was incomplete. To reducenoise in our estimates of c from the NRT data, we computed c over 1 h intervals. These data were obtainedvia file transfer protocol from CERSAT/IFREMER.2.1.2. Polar-Orbiting Satellite MeasurementsThe VIIRS sensor provides ocean surface measurements approximately once or twice per day at high spatialresolution [Petrenko et al., 2014]. Brightness temperatures (BTs) are estimated at 390 m resolution, while SSTis computed by combining four neighboring BT pixels, resulting in a resolution of 780 m. While we madeuse of both sensor data, we used VIIRS SST measurements when exploring image quality and, once animage of interest was identified, we subsequently obtained BTs corresponding to these times. The SST andBT data files were obtained from the NOAA Comprehensive Large Array-Data Stewardship System (CLASS,https://www.class.ngdc.noaa.gov/saa/products/welcome) and had file sizes of 500 MB and 2 GB. Thesemeasurements are contained in the environmental data record (EDR) and scientific data record (SDR),respectively. Note, all data are in swath coordinates.
2.2. In Situ MeasurementsIn the work that follows, we examine one of the VIIRS BT images in concert with in situ measurements. Thisparticular BT image was taken at a time when the ocean surface mixed layer is relatively shallow (<40 m).Since the moorings resided subsurface and ocean gliders were not functioning properly at this time, wemade use of ship-based hydrography in our analysis. By chance, a high-resolution hydrographic survey wasconducted at the OSMOSIS site at this time: 19–21 September 2012 [Allen et al., 2013]. This survey made useof a towed, profiling conductivity-temperature-depth (CTD) package known as SeaSoar II [Pollard, 1986] andwas conducted to provide context to the moorings. A second survey was conducted but was cut shortowing to a passing storm. We focus on the first of these surveys in this study. In conjunction with a ship-mounted acoustic Doppler current profiler (ADCP), these data provide 3-D fields of density and velocitywithin the top 500 m of the ocean.
We objectively mapped the data [Barnes, 1964, 1994] using an isotropic 10 km smoothing scale to elimi-nate discontinuities across separate legs of the survey. Note this is approximately 3 times the deformationradius within the mixed layer, kd5Nh=f . (Here f is the Coriolis parameter and N and h are the stratificationand effective depth of the surface layer, respectively [Thomas et al., 2008].) We subsequently smoothedvertically using a 5 dbar smoothing scale. This smoothing determines the minimal resolvable scale withinour data set and has an adverse effect on our estimates of shear and buoyancy gradients, tending to biasthese low. We account for this in our results (also, see supporting information). Absolute velocity was esti-mated using the geostrophic method [Pond and Pickard, 1983]. We computed dynamic height from thedensity field, estimated geostrophic velocities and referenced these to velocities measured by a Tele-dyne/RDI 75-kHz ship-mounted ADCP [Pollard and Regier, 1992]. By comparing ADCP absolute velocityprofiles with geostrophic shear estimated from the SeaSoar survey, the best match in shape was obtainedat 329 m and deeper. Hence, we used a reference depth of 330 m when calculating absolute geostrophicvelocities from the combination of SeaSoar II and ADCP measurements. While this approach approxi-mates the true velocity field under geostrophic balance and, thus, ignores nonlinearities, we estimatemoderate values of the gradient Rossby number (0.1–0.5, supporting information). While not small, it pro-vides some justification for this approach. Pressure contours of the interpolated SeaSoar data displayedminimal curvature.
The ADCP measures absolute velocity in the ocean, including both geostrophic and ageostrophic compo-nents. As pointed out by one reviewer, this would normally enable quantification of the ageostrophic com-ponent of flow by subtracting that component computed above. Within the SBL, vertical motion due tohorizontal convergence/divergence is expected to be at its greatest value so we anticipate elevated ageo-strophic flow within the SBL. However, while the 75 kHz ADCP is a good-quality instrument, it makes a com-promise between vertical resolution in favor of greater vertical extent. The 75 kHz signal sees to depths of500–800 m. But given a blanking-distance of 25 m and bin-sizes of 16 m, there is approximately only one
Journal of Geophysical Research: Oceans 10.1002/2017JC012910
BUCKINGHAM ET AL. TESTING MUNK’S HYPOTHESIS 6729

independent and good measurement within the SBL. This is unfortunate and we acknowledge thislimitation.
3. Results
3.1. Cloud CoverFigure 2b depicts clear-sky occurrences and c at the OSMOSIS observation site. To help illustrate how clear-sky occurrences relate to c computed within different small circles, we magnify a portion of this graphic forSeptember 2012 (Figure 2c). To help with future analysis with the OSMOSIS record, we list in supportinginformation all periods classified as clear-sky according to our definition and which exceed 2 h in duration.
3.2. Sea Surface TemperatureWe manually cross-referenced these periods with the availability of VIIRS imagery, a subset of which we pro-vide as supporting information. A more extensive suite of images is available upon request from theauthors. Note that several of the images are degraded by striping, examples of which are found on 21 Octo-ber 2012 and 8 July 2013. This is a known instrument problem and efforts to reduce its effect on imagequality are ongoing [Liu et al., 2013; Bouali and Ignatov, 2014]. Despite these and cloud-related artifacts, theimages reveal a complex suite of oceanographic features, one of which is highlighted below.
3.3. Brightness Temperature: The Unstable FrontTo help illustrate submesoscale structures within these data, we display in Figure 3 (a) VIIRS SST valid on 19September 2012 at 03:34 UTC, (b) corresponding BT image but magnified in the vicinity of a thermal front,and (c) altimeter-derived sea surface height (SSH) in the form of sea level anomaly (with respect to a 20year mean) and associated surface geostrophic velocities. We note that the mean dynamic height is small inthis region. The latter gives a sense of scale to those familiar with satellite altimetry. Within the SST image inFigure 3a, vortices of scale 1210 km are observed on the edge of the thermal front with several swirlingvortices to the east that have cyclonic vorticity. An objective estimate of the disturbance scale is providedbelow. These perturbations in the front are regularly spaced and suggest the front is at the onset of a hydro-dynamic instability. To be clear, in the absence of concomitant optics, we cannot say for certain that theunderlying phenomena giving rise to these features is the same as spiral eddies [Scully-Power, 1986; Munket al., 2000; Munk, 2001; Eldevik and Dysthe, 2002]. Nevertheless, objectively identified tracer contours (sup-porting information) and modelled Lagrangian particle trajectories [Munk et al., 2000; Eldevik and Dysthe,2002] yield similar structures. So as to distinguish the presently observed eddies from ‘‘spiral eddies’’ seen inoptical imagery and make the point that we are using Munk’s work as a springboard for exploring mecha-nisms giving rise to submesoscale eddies, hereafter we will refer to the observed vortices within the thermalimage simply as submesoscale vortices or submesoscale eddies.
3.4. In Situ Hydrographic ObservationsIn addition to the BT image, we have available coincident in situ measurements. In particular, a hydro-graphic survey was conducted in this region on 19–21 September 2012 using a towed, profiling CTD pack-age. A portion of the ship track during this survey is overlaid in Figure 3b and the full survey is illustratedschematically in Figure 4a. Here we use these data to provide additional insight into dynamics at the front.The natural reference frame consists of along-front (x) and cross-front (y) coordinates (cf. Figure 3b), withpositive values of u and v oriented in these directions, respectively. Cross sections of potential density, qh,and composite cross sections of potential density and along-front geostrophic velocity, qh and u , are illus-trated in Figures 4b–4d. Note composite cross sections were obtained by averaging variables in the along-front direction. This helps to reduce along-front variability and obtain relevant horizontal and vertical viewsof the front.
The existence of a lateral density gradient in Figures 4b and 4c demonstrates that sharp changes in temper-ature evident from the satellite image are not compensated by changes in salinity [Rudnick and Ferrari,1999], in contrast to the front observed by Flament et al. [1985]. Additionally, the figure depicts a peak instratification near 40 m depth and a shallow mixed layer of approximately 25 m. Finally, Figure 4d revealsthat the magnitude of horizontal flow is 30 cm s21, with a considerable fraction of this horizontal flowattributed to the deeper-penetrating mesoscale eddies; the maximum flow u associated with the submeso-scale front is approximately 5 cm s21 (not shown).
Journal of Geophysical Research: Oceans 10.1002/2017JC012910
BUCKINGHAM ET AL. TESTING MUNK’S HYPOTHESIS 6730

4. Testing Munk’s Hypothesis
This provides an ideal case in which we can explore whether barotropic instability (BTI) or baroclinic instabil-ity (BCI) gives rise to submesoscale eddies observed on the frontal boundary. The best depiction we haveseen of submesoscale eddy generation by a frontal instability is found in Munk [2001, Figure 6]. The graphicdepicts shear and roll-up of buoyancy contours at subsequent stages of the instability, with cold and warmwater located to the north and south of the front, respectively. The onset of the instability occurs at s52:5days and is principally governed by increased horizontal shear at the northern side of the front. A somewhatanalogous graphic based on model simulations of BCI is provided by Eldevik and Dysthe [2002, Figure 2].They show that the onset of instability occurs between s 5 2 days and s 5 3 days, suggesting BCI occurs ona similar time scale. Both illustrations are similar to the observed front examined in this study. In particular,we appear to be seeing the onset of instability immediately before the roll-up of vorticity sheets. This sug-gests that either BTI or BCI might be giving rise to the vortices.
In speaking of submesocale eddy formation by BTI, Munk states, ‘‘Our hypothesis is based on observationalmaterial which consists almost entirely of unrelated glimpses in x, y-space on the sea surface . . .What isrequired here are prolonged stares or frequent repeat visits coordinated with shipboard observations. Wecannot think of any x; y; z; t ocean processes that had been properly identified from measurements in half
Figure 3. An unstable front in the open ocean: (a) VIIRS sea surface temperature (SST), (b) VIIRS brightness temperature (BT) magnified inthe region of the unstable front (valid: 19 September 2012, 03:34 UTC) and (c) sea surface height (SSH) estimated from satellite altimetryand associated surface geostrophic velocities (valid: 19 September 2012). In Figures 3a and 3b, white and neighboring blue (i.e., cool) pix-els indicate cloud contamination. In Figure 3b, we indicate the ship track during a high-resolution hydrographic (SeaSoar 1 ADCP) survey(19–21 September 2012). Asterisks denote profile measurements used in this study. In Figure 3c, the white box indicates the boundingbox of the BT image and the black line indicates the frontal edge identified in section 4.2 (cf. Figure A1).
Journal of Geophysical Research: Oceans 10.1002/2017JC012910
BUCKINGHAM ET AL. TESTING MUNK’S HYPOTHESIS 6731

the coordinate space’’ [Munk, 2001]. While the coupled observations presented above do not cover theentire coordinate space—they lack evolution in time t—they nevertheless allow us to determine the under-lying formation mechanism giving rise to the submesoscale eddies seen in the satellite image. In particular,the image reveals submesoscale eddies along the edge of the front and we have coincident hydrographicobservations describing the horizontal and vertical structure of this front and from which we can estimaterelevant oceanographic parameters. We proceed by constructing a hypothesis test, with BTI serving as thenull hypothesis and BCI as the alternative. Centrifugal instability [D’Asaro, 1988; Shen and Evans, 2002] isunlikely as gradient Rossby numbers, f=f , estimated from the SeaSoar II data are less than unity. We esti-mate gradient Rossby numbers of 0.1–0.5 (supporting information), with the upper bound being a conser-vative estimate.
4.1. Overview of the Instability ProcessBTI occurs when lateral shear is large. In contrast, BCI occurs when the lateral density gradient or, equiva-lently, when vertical shear is large [Eliassen, 1983]. While the energy sources for the disturbance differ (i.e.,kinetic energy under BTI and potential energy under BCI), in both cases small perturbations to the underly-ing mean state result in disturbances that grow in time. In special circumstances, the equations can be line-arized and simple solutions obtained. Under this approach, one neglects products of perturbations,assumes disturbances of the form �eiðkx2xtÞ, and solves for the relationship between the complex wave
Figure 4. Vertical and horizontal cross sections of potential density and velocity obtained from optimally interpolated SeaSoar II 1 ADCP hydrography. Figures 4a–4d are as follows: (a)geographic location of SeaSoar measurements (asterisks), cross sections (lines oriented in north-south), and composite cross sections (red line) in the vicinity of the front, (b) potentialdensity, qh , (c) composite of potential density, qh , and (d) composite of along-front velocity, u , centered on the front. In Figure 4b, X and Y are distances in East and North directions,respectively, while in Figures 4c and 4d y is the cross-front distance on which optimally interpolated data are projected (averaged).
Journal of Geophysical Research: Oceans 10.1002/2017JC012910
BUCKINGHAM ET AL. TESTING MUNK’S HYPOTHESIS 6732

speed, c and wavenumber k. Here x is the growth rate of the disturbance. In many cases, the flow can bedemonstrated to be most unstable to perturbations characterized by a single wavelength, 2p=k [Chandrase-khar, 1961; Thorpe, 1971; Drazin and Reid, 1981; Kundu and Cohen, 2008]. See, also, the original work of LordRayleigh, Lord Kelvin, and Sir G. I. Taylor. Below, we use these methods in conjunction with the aforemen-tioned observations to investigate what gives rise to the observed submesoscale vortices. As is typical, weassume the observed disturbance remains in its linear growth stage and that the wavelength of the mostunstable mode corresponds to twice the diameter of the observed eddies. The hypothesis test is thereforeframed in terms of a comparison between observed and theoretically predicted eddy scales. Growth ratescannot be estimated due to considerable cloud cover before and after the event.
A slight inconsistency exists by assuming that the flow is within its linear growth stage and describing thedisturbance as consisting of several coherent vortices. That is, on the one hand, we are describing the dis-turbance as wave-like and on the other, we are describing eddies whose existence necessarily involves non-linearity. This is a fair criticism. However, in the present case we would argue that the satellite image revealsboth regular undulations of the frontal boundary and ‘‘wispy’’ vortices, and therefore the linear analysis ismerited.
4.2. Observed Eddy SizesObserved eddy sizes (i.e., diameters) were estimated from the satellite image in three ways. The rationalefor computing these in different ways is that we have little knowledge of the best method for estimatingeddy sizes and spread in our estimates provides a measure of observation uncertainty. Methods aredescribed in Appendix A, illustrated in Figure A1 and results are summarized in Table 1. Results of the threemethods are consistent and suggest an appropriate eddy diameter is approximately 6 km, with slightlysmaller sizes estimated from the radius of curvature method.
4.3. Theoretically Predicted Eddy Sizes4.3.1. Barotropic InstabilityWe take as our starting point the Orr-Sommerfeld equation. This equation describes linearized dynamics ofparallel shear flow and its derivation from first principles can been found in a number of fluid dynamic texts[e.g., Kundu and Cohen, 2008]. It assumes perturbations of the form w5/ðyÞeikðx2ctÞ, where k is the real-valued horizontal wavenumber, c5cr1ici is the complex phase speed of the disturbance, and x5kci is thegrowth rate of the disturbance (i.e., growing if ci > 0). In the limit of infinite Reynolds number (i.e., inviscidflow), the equation governing perturbations to the mean state reduces to the Rayleigh equation:ðu2cÞð/yy2k2/Þ2uyy/50, where subscripts denote differentiation. Note, the scale of the front is small sothat meridional variations in f are negligible when compared with changes in horizontal shear: jbj � uyy .Otherwise, we would concern ourselves with the Rayleigh-Kuo equation [Cushman-Roisin, 1994]. For exam-ple, for the observed front, we note a velocity change of Uo over a distance a 5 20 km. This gives Uyy � Uo=
a256310210 m21 s21, whereas b52Xcos h=RE51:5310211 m21 s21. Here h548:5�N is latitude, X57:2923
1025 s21 is Earth’s angular rotation rate and RE 5 6371 km is the mean radius of Earth.
The Rayleigh equation must be solved numerically for arbitrary flows. In special circumstances, however, itcan be solved analytically by approximating the observed flow as a linear, piecewise flow [Rayleigh, 1879].Here we follow this latter approach. The derivation of the analytical solution is detailed in Appendix B. Note:the relevant parameters for this model are the (1) widths of the constant-sheared flow, a and b, on northernand southern sides, respectively, and (2) magnitude of the jet, Uo, above the background velocity.
Table 1. Predicted and Observed Eddy Scalesa
Type Method Wavelength (km) Radius (km) Diameter (km)
Predicted Linear BTI 34.2–113.5 17.1–56.7Predicted Linear BCI (Eady) 1.4–12.7 0.7–6.3Predicted Linear BCI (Stone) 1.5–12.9 0.8–6.5Observed Spectra of temperature 11.6, 13.0 5.8, 6.5Observed Spectra of frontal boundary 12.0, 13.5 6.0, 6.8Observed Radius of curvature 2.3–3.0, 2.6 5.2
aPredicted scales follow from the BTI and BCI models, while observed scales were estimated using several methods (cf. Figure A1).Eddy diameters are defined as one half the wavelength or twice the radius of curvature. Numbers in bold font correspond to those esti-mates believed to be more accurate owing to improved wavenumber resolution in spectra.
Journal of Geophysical Research: Oceans 10.1002/2017JC012910
BUCKINGHAM ET AL. TESTING MUNK’S HYPOTHESIS 6733

We estimated relevant oceanographic parameters, a, b, and Uo, from the hydrographic data in the follow-ing manner. We averaged the observed along-front velocity u(y) in the top 40 m to obtain a representa-tive along-front current, uðyÞ (Figure 5b). We then estimated the width and magnitude of thesheared flow by performing linear regression to northern and southern sides of the front over the inter-vals y56½5; 20� km (Figure 5b). The maximum current was found to be 0:34 m s21, and subtracting abackground value of 0.10 m s21 yielded Uo50:24 m s21. Given these fits, we specified a 5 20 km andb 5 25 km. The ensuing growth rates corresponding to this model are shown in Figure 5c. Finally, wecomputed growth rates for a56:7 and b 5 8.3 km, arguing that the interpolation applied to the SeaSoarmeasurements smooths the sheared widths by a factor no greater than 3.0 (supporting information). Forreference, we also display growth rates when a 5 b in order to illustrate that results are not very sensitiveto slight deviations in a and b.
The growth rates as a function of disturbance wavelength are displayed in Figure 5c. Even using our conser-vative estimates of a and b, the observed eddy scales are smaller than that predicted by linear BTI; they areoutside the gray shaded region in Figure 5c. Formally speaking, we therefore reject the null hypothesis andconsider the alternative hypothesis, BCI.4.3.2. Baroclinic InstabilityThe frontal model employed here is that of Eady [1949]. The model consists of a front in thermal windbalance (i.e., geostrophic and hydrostatic) with mean flow, U, directed in the positive x direction. Super-imposed on this mean flow are perturbations with infinitesimal amplitude, u0 � U. While the small scaleof the front generally prohibits use of the geostrophic approximation, as mentioned before, the moder-ate Rossby numbers found here make the approximation somewhat reasonable in our case. We qualifyresults in the Discussion section. As this model can be found in numerous fluid dynamics texts[Pedlosky, 1987; Cushman-Roisin, 1994; Kundu and Cohen, 2008], we summarize main points in AppendixC but encourage the reader to find the derivation of the most unstable mode in the aforementionedtexts.
Applying this model to the observed front is challenging owing to three constraints on the flow. These are(1) dU/dz is constant over a depth H within the upper ocean, (2) N2 is constant over this same depth, and (3)w 5 0 at the bottom of this boundary layer. While the first two conditions can be met within the wind- andwave-forced mixed layer and therefore is the most relevant vertical scale for this problem (J. Callies, per-sonal communication, 2016), the latter condition is surely not met owing to low stratification at the base of
Figure 5. Investigating BTI (null hypothesis) as the governing mechanism: (a) model flow u(y), (b) observed flow uðyÞ derived from the Sea-Soar data, and (c) growth rates as a function of horizontal scale for the BTI problem. Here x and u point in the along-front direction and y isthe cross-front direction. From Figure 5b, we estimate a 5 20 km, b 5 25 km, and Uo50:24 cm s21. Given smoothing inherent in the Sea-Soar data, we conservatively estimate lower bounds on a and b as 6.7 and 8.3 km, respectively (supporting information). These becomeupper and lower bounds for the instability calculation. For reference, we display growth rate curves corresponding to a 5 b. As theobserved eddy diameters (blue arrows, cf. Table 1) fall below our prediction for the most unstable mode (gray region), even when usingconservative values for a and b (red lines in Figure 5c), we reject the null hypothesis.
Journal of Geophysical Research: Oceans 10.1002/2017JC012910
BUCKINGHAM ET AL. TESTING MUNK’S HYPOTHESIS 6734
the mixed layer and resulting vertical motion. To handle this case, Stone [1966] derived an approximation forthe growth rate under conditions of low Ri with the main result being that the solution for the most unstablemode moves to larger wavelengths. Using a different approach, Boccaletti et al. [2007] modified the Eadymodel by allowing a nonzero w for the bottom boundary condition. However, this resulted in a somewhatintractable analytical problem and was solved only numerically. Our approach is instead as follows.
We first note that the baroclinic model presented above with H equal to the mixed layer depth and w 5 0 atthe bottom boundary tends to underestimate the wavelength of the fastest growing disturbance [Boccalettiet al., 2007]. This conveniently provides a lower bound for the wavelength of the most unstable mode. Next,we specify the vertical scale H as the average depth of peak stratification and approximate relevant modelparameters by average values within this layer. The argument is that we expect w to be approximatelyzero at the base of this layer (hereafter, the SBL). This can be rationalized as follows. At the depth of peakstratification, N2 is large and @q=@y is generally small since it is here that isopycnals converge.Also, thermal wind balance and du=dz � 0 implies @q=@y � 0. Assuming density is conserved,w5gðqoN2Þ21 @q=@t1v@q=@yð Þ � gðqoN2Þ21ð@q=@tÞ. Thus, either w � 0 or else @q=@t is extremely large,which is unrealistic. (Localized vertical excursions of the pycnocline, or internal waves, can modify this balancethrough @q=@t and @q=@y. However, we argue that BCI essentially is less sensitive to these rapid changes inthe pycnocline, being more affected by lower-frequency internal waves but which are associated with smallerw.) Thus, choosing H as depth of peak stratification leads to a more realistic boundary condition and yields anupper bound for the wavelength of the most unstable mode since N and H are overestimated in this manner.In summary, H is chosen as H15 mixed layer depth (lower bound) and H25 depth of peak stratification (upperbound). Note: we defined the mixed layer depth as the depth at which density is increased an amount0.01 kg m23 from its value at 8 m depth. This is motivated by work of de Boyer Mont�egut et al. [2004]. Verticaland lateral stratifications are then estimated from average values, hN=f i5No=f and hM=f i5Mo=f , within eachlayer. Here brackets denote averaging in depth and within 5 km of the front. Note from the imaginary partof equation (C3) that lateral buoyancy gradients modify the rate of growing disturbances but do not modifythe most unstable mode. We can therefore ignore uncertainty in lateral buoyancy gradients. Also, uncer-tainty in vertical stratification is dominated by changes in H. The effect of vertical smoothing of the SeaSoardata (i.e., 5 dbar) is negligible when compared with these variations. Thus, uncertainty in our solution iswell-captured by the above two bounds. For added information, we also compute the most unstable modeusing a depth scale, Hb, defined as the depth scale over which du/dz is constant. Finally we include esti-mates of the most unstable mode using the approximation of Stone [1966], as well (Appendix C).
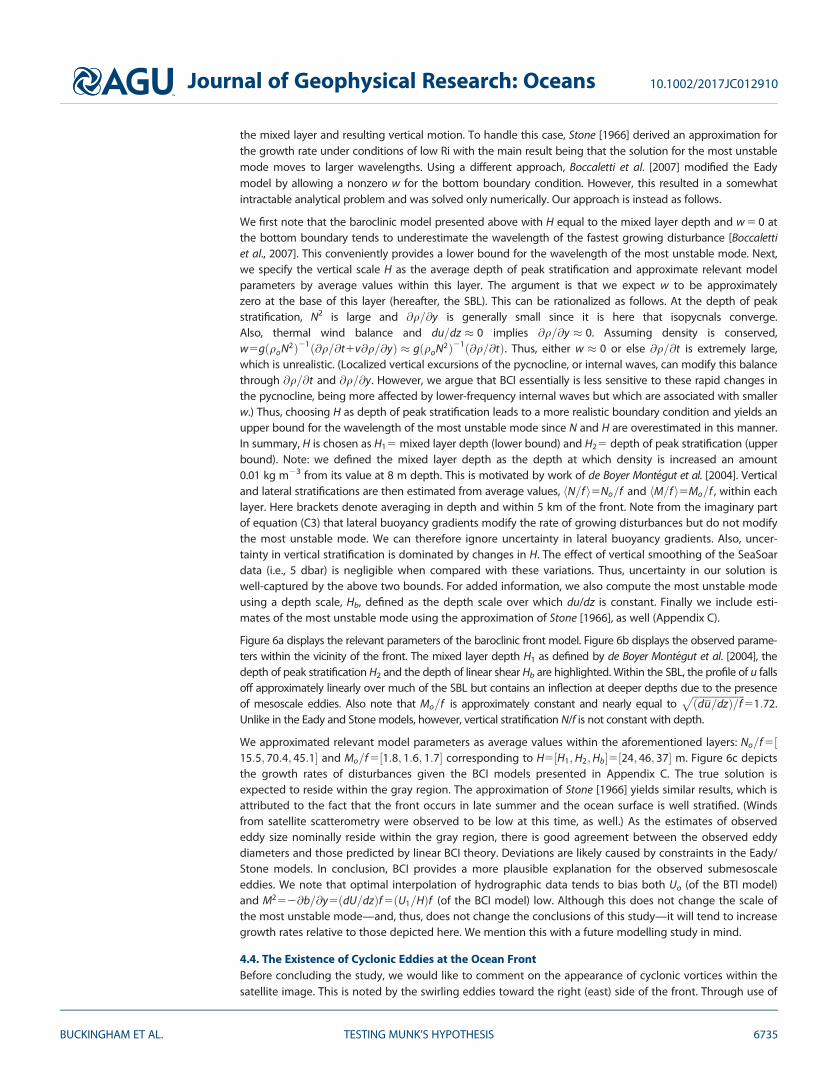
Figure 6a displays the relevant parameters of the baroclinic front model. Figure 6b displays the observed parame-ters within the vicinity of the front. The mixed layer depth H1 as defined by de Boyer Mont�egut et al. [2004], thedepth of peak stratification H2 and the depth of linear shear Hb are highlighted. Within the SBL, the profile of u fallsoff approximately linearly over much of the SBL but contains an inflection at deeper depths due to the presenceof mesoscale eddies. Also note that Mo=f is approximately constant and nearly equal to
ffiffiffiffiffiffiffiffiffiffiffiffiffiffiffiffiffiffiffiffiffiðdu=dzÞ=f
p51:72.
Unlike in the Eady and Stone models, however, vertical stratification N/f is not constant with depth.
We approximated relevant model parameters as average values within the aforementioned layers: No=f 5½15:5; 70:4; 45:1� and Mo=f 5½1:8; 1:6; 1:7� corresponding to H5½H1;H2;Hb�5½24; 46; 37� m. Figure 6c depictsthe growth rates of disturbances given the BCI models presented in Appendix C. The true solution isexpected to reside within the gray region. The approximation of Stone [1966] yields similar results, which isattributed to the fact that the front occurs in late summer and the ocean surface is well stratified. (Windsfrom satellite scatterometry were observed to be low at this time, as well.) As the estimates of observededdy size nominally reside within the gray region, there is good agreement between the observed eddydiameters and those predicted by linear BCI theory. Deviations are likely caused by constraints in the Eady/Stone models. In conclusion, BCI provides a more plausible explanation for the observed submesoscaleeddies. We note that optimal interpolation of hydrographic data tends to bias both Uo (of the BTI model)and M252@b=@y5ðdU=dzÞf 5ðU1=HÞf (of the BCI model) low. Although this does not change the scale ofthe most unstable mode—and, thus, does not change the conclusions of this study—it will tend to increasegrowth rates relative to those depicted here. We mention this with a future modelling study in mind.
4.4. The Existence of Cyclonic Eddies at the Ocean FrontBefore concluding the study, we would like to comment on the appearance of cyclonic vortices within thesatellite image. This is noted by the swirling eddies toward the right (east) side of the front. Through use of
Journal of Geophysical Research: Oceans 10.1002/2017JC012910
BUCKINGHAM ET AL. TESTING MUNK’S HYPOTHESIS 6735

fully nonlinear numerical simulations, Eldevik and Dysthe [2002] showed that mixed layer BCI does result ina near-surface portion of the surface mixed layer that is strongly cyclonic, whereas the layer below this isanticyclonic but weakly so. Such asymmetry in the distribution of relative vorticity during BCI can be attrib-uted to conservation of potential vorticity (PV). This is summarized nicely by Eldevik and Dysthe [2002] but isexplained more fully in Appendix D for the interested reader.
5. Conclusions
Several conclusions can be drawn from the foregoing analysis. First, we conclude that horizontal shear(i.e., BTI) is not the sole mechanism giving rise to the observed eddies within the satellite image. This isevident from a discrepancy between observed and theoretically predicted eddy sizes under linear BTI.This conclusion remains valid even when considering the conservative estimates of a and b, i.e., thewidths of the horizontally sheared regions. Second, while we cannot say for certain that mixed layer orsubmesoscale BCI is the predominant cause owing to large confidence intervals in our calculation of themost unstable mode, the contextual information provided by satellite altimetry, moderate agreementbetween observed and theoretically predicted eddy sizes, and upper bound on the gradient Rossby num-ber (0.55) all point to BCI as the cause with horizontal shear playing a smaller but influential role. Aspointed out by Eliassen [1983], all realistic fronts are associated with both mechanisms and it is likely theyboth play a role at this front.
Figure 6. Investigating BCI (alternative hypothesis) as the governing mechanism: (a) model flow and density structure (i.e., constant vertical shear dU=dz5U1=H52M2=f and constantvertical buoyancy gradient N2), (b) observed flow and density structure, and (c) growth rates as a function of horizontal scale for the Eady (solid) and Stone (dashed) BCI problem. FromFigure 6b, we estimate H1524 m (mixed-layer depth) and H2543 m (depth of peak stratification). From these we obtain corresponding uncertainty in our estimate of the wavelength ofthe most unstable mode. We also include our best guess of this wavelength determined from Hb537 m (depth of constant vertical shear). As at least one of the observed eddy diameters(blue arrows, cf. Table 1) fall within our prediction for the most unstable mode (gray region), we ‘‘fail to reject’’ or accept this hypothesis. More generally, the observed instability isthought to be the result of both vertical and horizontal shear.
Journal of Geophysical Research: Oceans 10.1002/2017JC012910
BUCKINGHAM ET AL. TESTING MUNK’S HYPOTHESIS 6736

Assumptions in this study include the following: (i) the frontal instability remains in its linear growth stageand is accurately described by linear dynamics; (ii) hydrographic measurements from SeaSoar II capture suf-ficiently the relevant gradients at the front; (iiia) the analytical models of Rayleigh, Eady, and Stone areapplicable; and, relatedly, (iiib) u and b are functions of only one dimension.
The first assumption is reasonable given that the underlying disturbance remains visible and the vorticeshave not yet separated from the front. Admittedly, nonlinear terms in the horizontal momentum equationsare not negligible. We estimate gradient Rossby numbers of magnitude jRoj5jf 21@u=@yj � jfj=f 50:1–0.5(supporting information), with latter values resulting from a conservative estimate of the frontal shearwidth. Thus, while the geostrophic approximation has been made, we expect frontal intensification and theinstability itself [Eldevik and Dysthe, 2002] sharpens buoyancy gradients to the point that this approximationbecomes invalid. Such nonlinearities may help explain why observed eddy scales lie nearer the upperbound on the most unstable mode (blue arrows relative to gray region in Figure 6c). Another possibility isthat both instability types contribute to the instability, with BTI pushing it to larger scales. With respect tothe second assumption, aside from the relaxing of lateral velocity and buoyancy gradients by optimal inter-polation, the composite cross sections of velocity u and buoyancy b from the SeaSoar are expected to berepresentative of the frontal structure. Averaging in the along-front direction smooths out perturbationsthat may exist in the along-front direction while preserving cross-frontal structure. Nevertheless, the factthat hydrographic measurements are located slightly west of the swirling vortices may introduce inaccura-cies in this representation. The third assumption is a challenging one for us. The simple jet-like model of BTImay not be suitable since inflections in the horizontal velocity field may perturb the dynamics of the insta-bility. A similar situation exists in the vertical for the baroclinic case, where inflections in the deeper flow(i.e., 60–70 m depths) due to the mesoscale eddy field might perturb the instability. Furthermore, in contrastto Eady and Stone models, N2 is not constant below the mixed layer and w � 0 is questionable at the baseof this layer. An exception exists at the depth of peak stratification, H2, where we expect w � 0 except inthe presence of internal waves, as discussed earlier. Finally, in contrast to the fourth assumption above, wefind that u and b are actually functions of two dimensions, y and z. This results in a more complicated PVstructure that must be solved numerically (S. Smith, personal communication, 2017). In summary, the com-bination of elevated Rossby numbers, slight westward position of the SeaSoar survey with respect to theinstability, and limits of validity of these simple models motivate numerical solutions—topics of a futurestudy.
6. Discussion
The frontal instability documented here provides an illustrative example of a forward energy cascade gener-ated by mesoscale frontogenesis. Mesoscale stirring, filamentation, and the onset of BCI leads to a loss ofenergy that would otherwise proceed up-scale [Batchelor, 1969; Charney, 1971; Rhines, 1979; M€uller et al.,2005]. Indeed, this may be one of the reasons why zonal jets predicted from geostrophic turbulence theoryare latent in the World Ocean [Maximenko et al., 2008; Berloff et al., 2011; Buckingham and Cornillon, 2013].One follow-up question, however, is to what extent are these observations representative of observeddynamics in this region? To answer this question, we examined the distribution of lateral buoyancy gra-dients, M/f, estimated from closely spaced moorings at the OSMOSIS site, September 2012 to September2013 (Figure 7). As the observed cross-frontal buoyancy gradient, Mo=f , is found within the peak in theprobability density function (PDF), we conclude that the observed front is characteristic of fine-scale gra-dients in this region.
This study suggests BTI and BCI may vary geographically since we expect BTI to vary with the gradientRossby number. Their relative importance likely varies seasonally, as well. Given the distinction between BTIand BCI in terms of energy pathways and resulting buoyancy fluxes, this has implications for energy andbuoyancy budgets in the open ocean. Furthermore, it suggests that circulation patterns and near-surfacestratification within ocean models might be improved by incorporating these spatial and seasonal differ-ences. Considerable improvements in ocean stratification have been made by parameterizing mixed layerBCI in climate models [e.g., Fox-Kemper et al., 2011]. However, considerably less attention has been given toenergy fluxes. A notable effort to properly represent energy fluxes in a regional model can be found here:https://www.trr-energytransfers.de/research/area-t/t2/.
Journal of Geophysical Research: Oceans 10.1002/2017JC012910
BUCKINGHAM ET AL. TESTING MUNK’S HYPOTHESIS 6737

One of the outcomes of this study is thefinding that lateral buoyancy gradients areat least as important as horizontal shear ingenerating small-scale features such assubmesoscale eddies in the open ocean.While this conclusion has been known forsome time within the modelling commu-nity [e.g., Samelson, 1993; Haine and Mar-shall, 1998; Eldevik and Dysthe, 2002;Boccaletti et al., 2007; Fox-Kemper et al.,2008a,2008b; Grooms, 2015], corroboratingobservations in the open ocean are rare. Infact, we believe this is one of the firstdocumented case of submesoscale BCI inthe open ocean. A second outcome of thiswork is that it identifies a set of in situobservations useful for future studies. Giventhe paucity of submesoscale observationsand expense associated with large-scale fieldcampaigns such as LatMix, OSMOSIS, andSMILES, this is an important result. However,we eagerly await results from the SMILEScampaign, particularly as it resides within a
region known for strong turbulent air-sea fluxes and enhanced communication with the deep ocean, i.e.,the Southern Ocean.
‘‘Why has the problem received so little attention?’’ asks Munk in reference to spiral eddy generation. ‘‘We assertthat the fashion during these years has been statistical rather than phenomenological descriptions of ocean fea-tures, and here we are concerned with a truly phenomenological problem’’ [Munk, 2001]. While not specific to spiraleddies, we believe we provided a platform for further discussion about the relative importance of horizontal andvertical shear in submesoscale eddy generation, a discussion well framed by the work of Munk et al. [2000] and Eld-evik and Dysthe [2002]. Moreover, we have demonstrated a method in which observed eddy sizes might be com-pared with those predicted from various instability mechanisms.
A cautionary note seems appropriate for future readers seeking to apply this method to theirobserved eddies. The method shown here is fairly unique in that it is applied immediately at theonset of the instability. With increasing time, one must more generally consider the evolution of theeddy in time. In particular, for eddies interacting with each other or other flows, nonlinear triad inter-actions cause eddies to grow laterally in time owing to inverse energy cascades encountered in 2-Dturbulence [Batchelor, 1969; Charney, 1971; Rhines, 1979; Qiu et al., 2008]. This is perhaps more rele-vant for larger eddies than small, high-Rossby number vortices, as here dissipative effects maybecome important and counteract such an inverse cascade [Capet et al., 2008; McWilliams, 2016]. Inany case, some estimate of the time-since-generation would be an important component of a similaranalysis.
Appendix A: Estimating Observed Eddy Sizes
Observed eddy sizes were estimated from the satellite image in three ways. In the first two methods, weestimate this scale from the wavelength of peak power, while in the third method we estimate this scalefrom the curvature in the front. Each of these methods is described below, illustrated in Figure A1 andresulting eddy scales summarized in Table 1.
A1. Method 1: Spectra of TemperatureIn the first method, we identified the peak in the power spectral density (PSD) of temperatureobtained along transects of the front. The PSD was computed using both traditional and parametricspectral estimation approaches. The former uses the method of averaged, modified periodograms
Figure 7. The PDF of lateral buoyancy gradients, jM=f j, at the OSMOSISsite, September 2012 to September 2013. Estimates of jM=f j were com-puted from gradients between moorings spaced approximately 2 kmapart. The solid line illustrates a fit to the histogram under an assumptionthat the PDF follows a Rayleigh distribution. The vertical dashed linedenotes the lateral buoyancy gradient, jMo=f j, used in the BCI instabilityanalysis (section 4.3.2). We expect the true value of jMo=f j is larger by afactor of
ffiffiffi2p
.
Journal of Geophysical Research: Oceans 10.1002/2017JC012910
BUCKINGHAM ET AL. TESTING MUNK’S HYPOTHESIS 6738

[Welch, 1967; Harris, 1978], while the latter models observations as the result of an autoregressive(AR) discrete-time process with n 5 25 degrees of freedom [Yule, 1927; Walker, 1931]. The advantageof the AR approach is that wavenumber resolution does not depend upon the length of therecord [Kay and Marple, 1981]. Eddy diameters are estimated as half the wavelength of peak power(Figure A1a).
A2. Method 2: Spectra of the Frontal BoundaryIn the second method, we identified the peak in the PSD of displacements of the frontal boundary, again,using both spectral approaches. In order to isolate the frontal boundary, we used a population-based frontdetection algorithm described in both Cayula and Cornillon [1992] and Buckingham et al. [2014]. The histo-gram portion of this algorithm operates by identifying two populations from a distribution of temperatures.Surface temperatures categorized as falling within ‘‘cool’’ and ‘‘warm’’ populations were identified. Theresulting binary image was then processed using morphological operations [Gonzalez et al., 2004] and theboundary separating the two temperature populations was identified. Again, eddy diameters are estimatedas half the wavelength of peak power (Figure A1b).
Figure A1. Methods used to estimate observed eddy diameters. In Figures A1a and A1b, we illustrate spectra computed using bothtraditional (solid) and parametric (dashed) spectral approaches. Asterisks highlight wavelengths corresponding to peaks in the spectralenergy. In Figure A1c, we estimated the radius of curvature, R5j1=jj, of the frontal boundary, where the boundary was smoothedslightly to improve estimates of curvature. Asterisks highlight the (red) most frequently occurring and (blue) probable radii given aWeibull fit to the data. Eddy diameters were estimated as (a, b) half the peak wavelength and (c) twice the most probable radius ofcurvature.
Journal of Geophysical Research: Oceans 10.1002/2017JC012910
BUCKINGHAM ET AL. TESTING MUNK’S HYPOTHESIS 6739

A3. Method 3: Radius of CurvatureIn the third method, we estimated the radius of curvature of the frontal boundary and identified its mostfrequently occurring value. The radius of curvature is given by R5j1=jj, where
j5_x€y2 _y€x
_x 21 _y 2� �3=2(A1)
is the curvature, and _x ; _y ; €x , and €y denote first and second derivatives of zonal and meridional displace-ments with respect to distance along the boundary, s (e.g., _x5dx=ds). This expression was evaluated in itsdiscrete form using first and second differences. We then identified the most probable value of R. While thiswas done using both a histogram and a PDF-fit to the observed radii. The fit reduces the dependence onbin size when estimating this value from a histogram. (The radius, R 5 (x2 1 y2)1/2, follows a Rayleigh distri-bution if zonal and meridional boundary displacements of the frontal boundary, x and y, are normally dis-tributed random variables. We used the Weibull distribution, which is a generalization of the Rayleighdistribution that handles nonnormally distributed random variables.) The eddy diameter was estimated astwice the most probable radius of curvature (Figure A1c).
Appendix B: Linear Barotropic Front Model (Piecewise-Continuousor Rayleigh Model)
B1. Basic StateWe model the horizontal shear on the northern side of the front as constant over a distance a and zero asnorth of this. Similarly, the shear on the southern side is constant over a distance b and zero south of this. Asimple expression for the mean flow is therefore u5ðu; v;wÞ5ðuðyÞ; 0; 0Þ, where
uðyÞ5
0; if y � a
2ðUo=aÞðy2aÞ; if 0 y < a
ðUo=bÞðy1bÞ; if 2b y < 0
0; if y < 2b:
:
8>>>>><>>>>>:
(B1)
The idealized and observed flows are illustrated in Figures 5a and 5b, respectively.
B2. Dispersion RelationNeglecting perturbations in the vertical (Squires’ theorem states that for every 3-D disturbance there existsa 2-D disturbance that is more unstable, such that we need only consider u0 and v0.), we then introduce aperturbation streamfunction w, where u05@w=@y and v052@w=@x. Again, assuming disturbances of theform, w5/ðyÞeikðx2ctÞ, the Rayleigh equation applies and has solutions of the form /ðyÞ5Aeky1Be2ky , whereA and B are arbitrary constants. We additionally require that disturbances are negligible with distance fromthe front (i.e., /! 0 as y ! 61) such that the general solution is
/ðyÞ5
Ae2kðy2aÞ; if y > a
Be2kðy2aÞ1Ceky ; if 0 < y < a
De2ky1Eekðy1bÞ; if 2b < y < 0
Fekðy1bÞ; if y < 2b:
:
8>>>>><>>>>>:
(B2)
There are interfacial conditions that must be satisfied at each interface in order for the Rayleigh equation tohold. These so-called ‘‘jump conditions’’ include (1) continuity of pressure and (2) continuity of normal veloc-ity across each interface, and can be expressed as follows:
ðu2cÞ/y2/uy
h iy5y1o
y5y2o
50; (B3)
/u2c
� �y5y1o
y5y2o
50: (B4)
Journal of Geophysical Research: Oceans 10.1002/2017JC012910
BUCKINGHAM ET AL. TESTING MUNK’S HYPOTHESIS 6740

Here the superscript notation denotes taking the limit as y approaches yo5ða; 0;2bÞ from either side of yo.In other words, the expression in brackets is evaluated at either side of the interface and the differencemust be zero.
For each interface or discontinuity, jump conditions (5) and (6) provide two equations. As we have threeinterfaces and as the Rayleigh equation is linear, we have a linear system of six equations and six unknowns(coefficients A through F). This is expressed in vector form as Ax50, where
A5
kc 2ðkc1Uo=aÞ ðkc2Uo=aÞeka 0 0 0
2c21 c21 ðc21Þeka 0 0 0
0 ð2Uok1kc1Uo=aÞ ðUok2kc1Uo=aÞ ðUok2kc1Uo=bÞ ð2Uok1kc1Uo=bÞekb 0
0 ðUo2cÞ21eka ðUo2cÞ212ðUo2cÞ21 ðUo2cÞ21ð2ekbÞ 0
0 0 0 ðkc2Uo=bÞekb ð2kc2Uo=bÞ kc
0 0 0 ðc21Þð2ekbÞ 2c21 c21
2666666666664
3777777777775
;
and x5½A; B;C;D; E; F�T . For nontrivial solutions, the determinant of A must be zero. Thus, we set the deter-minant of A equal to zero and solve for c. The resulting expression, or dispersion relationship, is a compli-cated polynomial in c,
ð8a2b2k3e2ak12bkÞc32ð8Uoa2b2k3e2ak12bkÞc212U2oða2ke2ak1b2ke2bk2abk2a2ke2ak12bk2b2ke2ak12bk1
abke2ak1abke2bk12ab2k2e2ak12bk12a2bk2e2ak12bk2abke2ak12bkÞc1
ðU3oa1U3
ob2U3oae2ak2U3
oae2bk2U3obe2ak2U3
obe2bk1U3oae2ak12bk1U3
obe2ak12bk12U3oabk22U3
oabke2ak12bkÞ50:
(B5)
For the case of b 5 a, the expression simplifies to
ð8a3k3e4akÞc31ð28Uoa3k3e4akÞc21ð8U2oa2k2e4ak22U2
oak18U2oake2ak26U2
oake4akÞc1
ð2U3oe4ak24U3
oe2ak12U3o12U3
oak22U3oake4akÞ50;
(B6)
and as it is a cubic, it has three roots. The first is real; the second has a negative imaginary part; and the thirdhas a positive imaginary part and is therefore our solution,
c5Uo
4ak2ak2ð12e22akÞ1e22ak 9e4ak210e2ak14a2k2e4ak24ake2ak212ake4ak11
� �1=2h i
: (B7)
The imaginary part provides the growth rate of the disturbance, kci, as a function of horizontal wavenumberk for specific Uo and a. Note that Uo affects the rate of the growing disturbance but does not determine themost unstable wavelength, as it is outside the square root in equation (B7). More generally, however, wesolve the full polynomial expression with arbitrary a and b using a symbolic mathematics software package.We find that the two solutions yield similar growth rates but report both answers for completeness.
Appendix C: Linear Baroclinic Front Model (Eady and Stone Models)
C1. Basic StateThe model consists of a front in thermal wind balance (i.e., geostrophic and hydrostatic) with mean flow,u 5 U, directed in the positive x direction. Superimposed on this mean flow are perturbations with infinitesi-mal amplitude, u0 � U, where the total flow is u5u01U. In addition, we make the following simplifications:
1. The flow is inviscid.2. The boundary layer thickness, H, is constant.3. The vertical stratification, N25@b=@z, is constant.4. The lateral stratification, M252@b=@y5f@U=@z, is constant.5. The vertical velocity, w, is much smaller than the horizontal velocity at all times.6. w 5 0 at the bottom and top of the layer (z50;H).
Journal of Geophysical Research: Oceans 10.1002/2017JC012910
BUCKINGHAM ET AL. TESTING MUNK’S HYPOTHESIS 6741

As in the BTI case, we neglect meridional variations in Coriolis. In the above expressions, b52gqh=qo is thebuoyancy of the fluid, g is gravity, and qo is a reference density. The assumption of constant M2 implies avertical shear independent of depth: @U=@z5U1=H. Also, note that Uðx; y; zÞ5UðzÞ. Finally, the statementthat w � u; v allows us to neglect vertical velocity in the mean but it is essential in the perturbation (i.e.,w5w0). That is, in order for BCI to occur, we must have nonzero w0 between the two boundaries.
C2. Dispersion RelationThe equation governing perturbations from the mean state can be found in a number of fluid dynamicstexts [e.g., Pedlosky, 1987; Cushman-Roisin, 1994; Kundu and Cohen, 2008]. For this reason, we simply presentthe end result. Starting with the linearized quasi-geostrophic (QG) potential vorticity (PV) equation, makingthe above assumptions and introducing a streamfunction (or pressure) perturbation of the formw5WðzÞeikðx2ctÞ, one obtains the following differential equation: Wzz2a2W50, where a25N2k2=f 2 repre-sents a stretched horizontal wavenumber squared. Together with boundary conditions, this Sturm-Liouvilleequation represents an eigenvalue problem. Again, k is the real-valued horizontal wavenumber, c5cr1ici isthe complex phase speed of the disturbance. This second-order differential equation has the general solu-tion W5Aeaz1Be2az , where coefficients A and B are determined from boundary conditions, w 5 0 at z50;H.Expressed in terms of the perturbation w, this gives
@
@t1U
@
@x
� �@w@z
2dUdz@w@x
50; (C1)
or, substituting in our expression for w,
c2U1
Hz
� �@W@z
1U1
HW50: (C2)
For nontrivial solutions, this—in combination with boundary conditions w050 at z50;H but expressed interms of W—yields an expression for the wave speed as a function of horizontal wavenumber,
c5U1
26ðf=kÞ 1
RiaH2
2tanhaH2
� �aH2
2cothaH2
� �� �1=2
; (C3)
where Ri5N2H2=U215f 2N2=M4 is the gradient Richardson number under thermal wind balance (often
referred to as the balanced Richardson number). Disturbances will grow unbounded only if ci > 0. It isstraightforward to show that the fastest growing disturbance has wavelength � 3:9NH=f 53:9kd . Strictlyspeaking, equation (C3) is valid only for Ri 1. Stone [1966, 1970] derived an expression for the growthrate under conditions of low Ri. In terms of wave speed, this expression becomes [Fox-Kemper et al.,2011]
ci5U1
2ffiffiffi3p 12
215
k2U21
f 2ð11RiÞ
� �: (C4)
We compared Stone’s approximation with the imaginary part of equation (C3) and find they yield only slightchanges in growth rates and wavelengths for the most unstable mode. These effects on wavelength aresummarized in Table 1.
Appendix D: On the Prevalence of Cyclonic Eddies at Baroclinic Fronts
A hallmark of submesoscale flows is the prevalence of cyclonic versus anticyclonic eddying flows. Whileexplained elsewhere [e.g., Eldevik and Dysthe, 2002], this skewness in the distribution of relative vorticity canbe understood as follows. In this discussion, note the importance of the lateral buoyancy gradient in skew-ing the distribution of f=f .
A fluid parcel with initially zero relative vorticity is generally characterized by positive and negative potentialvorticity (PV) in northern and southern hemispheres, respectively. This occurs because of Earth’s rotation.For example, for a fluid parcel in the northern hemisphere, (i) in the absence of lateral buoyancy gradientsand (ii) for stable stratification, one can show that the Ertel PV is positive: q5ðf 1fÞN21xh � rb5fN2 > 0.Furthermore, in the absence of diabatic and frictional forces, conservation of PV (i.e., Dq=Dt50) requires q
Journal of Geophysical Research: Oceans 10.1002/2017JC012910
BUCKINGHAM ET AL. TESTING MUNK’S HYPOTHESIS 6742

remain positive or negative in each hemisphere, respectively. These constraints are conveniently summa-rized in a single constraint by multiplying by the Coriolis parameter: fq> 0. For fluid at a baroclinic front, thelateral buoyancy gradient must be considered. Here we use thermal wind balance, as it provides a usefulpedagogical tool for understanding the impact of lateral buoyancy gradients on Ro.
For a fluid parcel in thermal wind balance, i.e., @uh=@z5ð2@b=@y; @b=@xÞ=f , the above constraint simplifiesas follows: fq > 0) f ½ðf 1fÞN21xh � rb� > 0) f 2ð11RoÞN22f 2jj@u=@zjj2 > 0) 11Ro2Ri21 > 0)Ro > 211Ri21, where Ro5f=f is the gradient Rossby number and Ri215jj@uh=@zjj2=N25jjrbjj2=ðf 2N2Þ isthe inverse gradient Richardson number for balanced flow. In other words, relative vorticity is constrainedboth by its value in relation to f and the ratio of vertical and lateral buoyancy gradients.
Physically, what is taking place is that stretching/compression of fluid parcels induces relative vorticitywhich is unbounded in one direction but which is bounded by Earth’s rotation in the other. Lateral and ver-tical gradients in buoyancy modify the lower bound on Ro by tilting the vortex vector from a vertical direc-tion to one which is slightly horizontal. Buckingham et al. [2016] discusses the seasonality of this lowerbound on Ro. They found that vorticity was positively skewed within the SBL during winter, but less so out-side of this season owing to seasonal changes in the gradient Richardson number. It is also notable thatalmost all of the observations depicting vorticity skewness have been made during winter [Rudnick, 2001;Shcherbina et al., 2013]. At any rate, because Ro is larger at the submesoscale and Ri is smaller in the upperocean relative to QG flows, a greater number of cyclonic than anticyclonic eddies are observed at the sub-mesoscale. Applied to the case of BCI, the stretching and compression of fluid columns that occurs duringbaroclinic instability preferentially selects cyclonic vortices as a result of PV-conservation. We refer thereader to Eldevik and Dysthe [2002, Figure 7].
ReferencesAllen, J. T., et al. (2013), Cruise report: RSS Discovery Cruise 381, 14 Sep.203 Oct. 2012: Ocean surface mixing, ocean sub-mesoscale interac-
tion study (OSMOSIS), technical report, Natl. Oceanogr. Cent., Southampton, Natl. Oceanogr. Cent., Eur. Way, Southampton, U. K.Barnes, S. L. (1964), A technique for maximizing details in numerical weather map analysis, J. Appl. Meteorol., 3(4), 396–409, doi:10.1175/
1520-0450(1964)003h0396:ATFMDIi2.0.CO;2.Barnes, S. L. (1994), Applications of the Barnes objective analysis scheme: Part II: Improving derivative estimates, J. Atmos. Oceanic Technol.,
11(6), 1449–1458.Batchelor, G. K. (1969), Computation of the energy spectrum in homogeneous two-dimensional turbulence, Phys. Fluids, 12, 233–239.Bauer, P., et al. (2010), Status of cloud and precipitation assimilation at ECMWF, in JCSDA-ECMWF Workshop Cloud/Precipitation Assimilation,
European Centre for Medium-Range Weather Forecasting (ECMWF), Reading, U. K.Berloff, P., S. Karabasov, J. T. Farrar, and I. Kamenkovich (2011), On latency of multiple zonal jets in the oceans, J. Fluid Mech., 686, 534–567,
doi:10.1017/jfm.2011.345.Boccaletti, G., R. Ferrari, and B. Fox-Kemper (2007), Mixed layer instabilities and restratification, J. Phys. Oceanogr., 37(9), 2228–2250.Bouali, M., and A. Ignatov (2014), Adaptive reduction of striping for improved sea surface temperature imagery from Suomi National Polar-Orbiting
Partnership (S-NPP) Visible Infrared Imaging Radiometer Suite (VIIRS), J. Atmos. Oceanic Technol., 31(1), 150–163, doi:10.1175/JTECH-D-13-00035.1.Br€uggemann, N., and C. Eden (2015), Routes to dissipation under different dynamical conditions, J. Phys. Oceanogr., 45(8), 2149–2168, doi:
10.1175/JPO-D-14-0205.1.Buckingham, C. E., and P. C. Cornillon (2013), The contribution of eddies to striations in absolute dynamic topography, J. Geophys. Res.
Oceans, 118, 448–461, doi:10.1029/2012JC008231.Buckingham, C. E., P. C. Cornillon, F. Schloesser, and K. M. Obenour (2014), Global observations of quasi-zonal bands in microwave sea sur-
face temperature, J. Geophys. Res. Oceans, 119, 4840–4866, doi:10.1002/2014JC010088.Buckingham, C. E., A. C. Naveira Garabato, A. F. Thompson, L. Brannigan, A. Lazar, D. P. Marshall, A. J. George Nurser, G. Damerell,
K. J. Heywood, and S. E. Belcher (2016), Seasonality of submesoscale flows in the ocean surface boundary layer, Geophys. Res. Lett., 43,2118–2126, doi:10.1002/2016GL068009.
Capet, X., J. C. McWilliams, M. J. Molemaker, and A. F. Shchepetkin (2008), Mesoscale to submesoscale transition in the California CurrentSystem. Part III: Energy balance and flux, J. Phys. Oceanogr., 38(10), 2256–2269, doi:10.1175/2008JPO3810.1.
Cayula, J.-F., and P. Cornillon (1992), Edge detection algorithm for SST images, J. Atmos. Oceanic Technol., 9(1), 67–80.Chandrasekhar, S. (1961), Hydrodynamic and Hydromagnetic Stability, Dover, New York.Charney, J. G. (1971), Geostrophic turbulence, J. Atmos. Sci., 28(6), 1087–1095, doi:10.1175/1520-0469(1971)028h1087:GTi2.0.CO;2.Cushman-Roisin, B. (1994), Introduction to Geophysical Fluid Dynamics, Prentice Hall, Englewood Cliffs, N. J.Damerell, G. M., K. J. Heywood, A. F. Thompson, U. Binetti, and J. Kaiser (2016), The vertical structure of upper ocean variability at the Porcu-
pine Abyssal Plain during 2012–2013, J. Geophys. Res. Oceans, 121, 3075–3089, doi:10.1002/2015JC011423.D’Asaro, E. A. (1988), Generation of submesoscale vortices: A new mechanism, J. Geophys. Res., 93(C6), 6685–6693, doi:10.1029/JC093iC06p06685.de Boyer Mont�egut, C., G. Madec, A. S. Fischer, A. Lazar, and D. Iudicone (2004), Mixed layer depth over the global ocean: An examination
of profile data and a profile-based climatology, J. Geophys. Res., 109, C12003, doi:10.1029/2004JC002378.Drazin, P., and W. Reid (1981), Hydrodynamic Stability, Cambridge Univ. Press, Cambridge, U. K.Eady, E. T. (1949), Long waves and cyclone waves, Tellus, Ser. A, 1(3), 33–52.Eldevik, T., and K. B. Dysthe (1999), Short frontal waves: Can frontal instabilities generate small scale eddies?, in Selected Papers of the
ISOFRP, edited by A. Zatsepin and A. Ostrovskii, UNESCO, Pushkin, Russia.Eldevik, T., and K. B. Dysthe (2002), Spiral eddies, J. Phys. Oceanogr., 32(3), 851–869, doi:10.1175/1520-0485(2002)032h0851:SEi2.0.CO;2.
AcknowledgmentsWe wish to thank the Editor and tworeviewers for superb feedback. We aregrateful to P. Cornillon, S. Saux Picart,and H. Roquet for help locating NRTMSG-3 SST measurements. We alsothank J. Vasquez, T. McKnight, and E.Maturi for discussions regarding datadropouts in MSG-2 data. We thank L.Brannigan and N. Lucas for access toprocessed ADCP measurements. Wethank D. Mountfield of NMF fordiscussions regarding SeaSoar. Finally,the following individuals providedhelpful feedback: S. Henson, Y. Firing,J. Callies, M. Bell, K. Nicholls, S. Griffies,S. Smith, J. Taylor, and D. Whitt. C.B.would also like to thank G. Roullet andcolleagues for conversations in Brest,France (November 2015) and S.Belcher for encouragement to work onthis project. We would like tospecifically acknowledge thecontributions of Z.K. His efforts toobtain the satellite imagery and initialanalysis during his MSc paved the wayfor this and subsequent studies. C.B.and Z.K. conducted the linearinstability analysis and wrote much ofthe manuscript. A.M. and J.A. collected,processed, and analyzed the SeaSoar IIdata. All other authors contributed toideas central to the manuscript andhelped frame the study. Lastly, wecongratulate Walter Munk on 100years. Amazing. VIIRS data wereobtained from NOAA ComprehensiveLarge Array-Data Stewardship System(CLASS), MSG-03 SST were obtainedfrom CERSAT/IFREMER, and SSHmeasurements were obtained fromAVISO/CNES. SeaSoar II specificationsare available from ChelseaTechnologies Group (http://www.chelsea.co.uk). This research was madepossible by grants from the NaturalEnvironmental Research Council (NE/I019999/1, NE/I019905/1) and NationalScience Foundation (NSF-OCE1155676), support for ZK from theMinistry of Environment and Energy,Maldives, and a small computing grantfrom the University of Southampton.
Journal of Geophysical Research: Oceans 10.1002/2017JC012910
BUCKINGHAM ET AL. TESTING MUNK’S HYPOTHESIS 6743

Eliassen, A. (1983), The Charney-Stern theorem on barotropic-baroclinic instability, Pure Appl. Geophys., 121(3), 563–572, doi:10.1007/BF02590155.Flament, P., L. Armi, and L. Washburn (1985), The evolving structure of an upwelling filament, J. Geophys. Res., 90(C6), 11,765–11,778, doi:
10.1029/JC090iC06p11765.Fox-Kemper, B., G. Danabasoglu, R. Ferrari, and R. W. Hallberg (2008a), Parameterizing submesoscale physics in global climate models, CLI-
VAR Exchanges, 13(1), 3–5.Fox-Kemper, B., R. Ferrari, and R. Hallberg (2008b), Parameterization of mixed layer eddies. Part I: Theory and diagnosis, J. Phys. Oceanogr.,
38(6), 1145–1165.Fox-Kemper, B., G. Danabasoglu, R. Ferrari, S. Griffies, R. Hallberg, M. Holland, M. Maltrud, S. Peacock, and B. Samuels (2011), Parameteriza-
tion of mixed layer eddies. iii: Implementation and impact in global ocean climate simulations, Ocean Modell., 39(1–2), 61–78, doi:10.1016/j.ocemod.2010.09.002.
Gonzalez, R. C., R. E. Woods, and S. L. Eddins (2004), Digital Image Processing Using MATLAB, Pearson, Prentice Hall, Upper Saddle River, N. J.Grooms, I. (2015), Submesoscale baroclinic instability in the balance equations, J. Fluid Mech., 762, 256–272.Gula, J., M. J. Molemaker, and J. C. McWilliams (2016), Topographic generation of submesoscale centrifugal instability and energy dissipa-
tion, Nat. Commun., 7, Article 12811, doi:10.1038/ncomms12811.Haine, T. W., and J. Marshall (1998), Gravitational, symmetric, and baroclinic instability of the ocean mixed layer, J. Phys. Oceanogr., 28(4), 634–658.Harris, F. J. (1978), On the use of windows for harmonic analysis with the discrete Fourier transform, Proc. IEEE, 66(1), 51–83.Kay, S., and J. Marple (1981), Spectrum analysis: A modern perspective, Proc. IEEE, 69(11), 1380–1419, doi:10.1109/PROC.1981.12184.Khaleel, Z. (2015), Observing the oceanic submesoscale from space: A case study of mixed layer baroclinic instability, Master’s thesis, Univ.
of Southampton, European Way, Natl. Oceanogr. Cent., Southampton, U. K.Klein, P., and G. Lapeyre (2009), The oceanic vertical pump induced by mesoscale and submesoscale turbulence, Annu. Rev. Mar. Sci., 1(1),
351–375, doi:10.1146/annurev.marine.010908.163704.Kundu, P. K., and I. M. Cohen (2008), Fluid Mechanics, 4th ed., Elsevier, Oxford, U. K.L�evy, M., R. Ferrari, P. J. S. Franks, A. P. Martin, and P. Riviere (2012), Bringing physics to life at the submesoscale, Geophys. Res. Lett., 39,
L14602, doi:10.1029/2012GL052756.Liu, Q., C. Cao, and F. Weng (2013), Striping in the Suomi NPP VIIRS thermal bands through anisotropic surface reflection, J. Atmos. Oceanic
Technol., 30(10), 2478–2487, doi:10.1175/JTECH-D-13-00054.1.Mahadevan, A., E. D’Asaro, C. Lee, and M. J. Perry (2012), Eddy-driven stratification initiates North Atlantic spring phytoplankton blooms,
Science, 337(6090), 54–58.Maturi, E., A. Harris, J. Mittaz, C. Merchant, B. Potash, W. Meng, and J. Sapper (2008), NOAA’s sea surface temperature products from opera-
tional geostationary satellites, Bull. Am. Meteorol. Soc., 89(12), 1877–1888.Maximenko, N. A., O. V. Melnichenko, P. P. Niiler, and H. Sasaki (2008), Stationary mesoscale jet-like features in the ocean, Geophys. Res.
Lett., 35, L08603, doi:10.1029/2008GL033267.McWilliams, J. C. (1985), Submesoscale, coherent vortices in the ocean, Rev. Geophys., 23(2), 165–182, doi:10.1029/RG023i002p00165.McWilliams, J. C. (2016), Submesoscale currents in the ocean, Proc. R. Soc. London A, 472(2189), 1–32, doi:10.1098/rspa.2016.0117.Merchant, C. J., A. R. Harris, E. Maturi, and S. Maccallum (2005), Probabilistic physically based cloud screening of satellite infrared imagery
for operational sea surface temperature retrieval, Q. J. R. Meteorol. Soc., 131(611), 2735–2755, doi:10.1256/qj.05.15.M€uller, P., J. McWilliams, and M. Molemaker (2005), Routes to dissipation in the ocean: The 2D/3D turbulence conundrum, in Marine Turbu-
lence: Theories, Observations and Models, edited by H. Baumert, J. Simpson, and J. Sundermann, pp. 397–405, Cambridge UniversityPress, Cambridge, U. K.
Munk, W. (2001), Spirals on the sea, Sci. Mar., 65(S2), 193–198.Munk, W., L. Armi, K. Fischer, and F. Zachariasen (2000), Spirals on the sea, Proc. R. Soc. London A, 456, 1217–1280.Omand, M. M., E. A. D’Asaro, C. M. Lee, M. J. Perry, N. Briggs, I. Cetinic, and A. Mahadevan (2015), Eddy-driven subduction exports particu-
late organic carbon from the spring bloom, Science, 348, 222–225, doi:10.1126/science.1260062.Pearson, B. C., A. L. M. Grant, J. A. Polton, and S. E. Belcher (2015), Langmuir turbulence and surface heating in the ocean surface boundary
layer, J. Phys. Oceanogr., 45(12), 2897–2911, doi:10.1175/JPO-D-15-0018.1.Pedlosky, J. (1987), Geophysical Fluid Dynamics, 2nd ed., 1–710 pp., Springer, New York.Petrenko, B., A. Ignatov, Y. Kihai, J. Stroup, and P. Dash (2014), Evaluation and selection of SST regression algorithms for JPSS VIIRS, J. Geo-
phys. Res. Atmos., 119, 4580–4599, doi:10.1002/2013JD020637.Pollard, R. (1986), Frontal surveys with a towed profiling conductivity/temperature/depth measurement package (SeaSoar), Nature,
323(6087), 433–435.Pollard, R. T., and L. A. Regier (1992), Vorticity and vertical circulation at an ocean front, J. Phys. Oceanogr., 22(6), 609–625, doi:10.1175/
1520-0485(1992)022h0609:VAVCAAi2.0.CO;2.Pond, S., and G. L. Pickard (1983), Introductory Dynamical Oceanography, 2nd ed., 1–329 pp., Butterworth-Heinemann, Oxford, U. K.Qiu, B., R. B. Scott, and S. Chen (2008), Length-scales of generation and nonlinear evolution of the seasonally-modulated South Pacific Sub-
tropic Countercurrent, J. Phys. Oceanogr., 38, 1515–1528.Rayleigh, L. (1879), On the stability and instability of certain fluid motions, Proc. London Math. Soc., s1–11(1), 57–72, doi:10.1112/plms/s1-11.1.57.Rhines, P. (1979), Geostrophic turbulence, Annu. Rev. Fluid Mech., 11, 401–441, doi:10.1146/annurev.fl.11.010179.002153.Rudnick, D. L. (2001), On the skewness of vorticity in the upper ocean, Geophys. Res. Lett., 28(10), 2045–2048, doi:10.1029/2000GL012265.Rudnick, D. L., and R. Ferrari (1999), Compensation of horizontal temperature and salinity gradients in the ocean mixed layer, Science,
283(5401), 526–529, doi:10.1126/science.283.5401. 526.Samelson, R. M. (1993), Linear instability of a mixed-layer front, J. Geophys. Res., 98(C6), 10,195–10,204, doi:10.1029/93JC00457.Saunders, R. W., and K. T. Kriebel (1988), An improved method for detecting clear sky and cloudy radiances from AVHRR data, Int. J. Remote
Sens., 9(1), 123–150, doi:10.1080/01431168808954841.Schloesser, F., P. Cornillon, K. Donohue, B. Boussidi, and E. Iskin (2016), Evaluation of thermosalinograph and VIIRS data for the characteriza-
tion of near-surface temperature fields, J. Atmos. Oceanic Technol., 33(9), 1843–1858, doi:10.1175/JTECH-D-15-0180.1.Scully-Power, P. (1986), Navy oceanographer shuttle observations, STS 41-G mission report, technical report, DTIC Doc., Naval Underwater
Systems Center (NUSC), Newport, Rhode Island.Shcherbina, A. Y., E. A. D’Asaro, C. M. Lee, J. M. Klymak, M. J. Molemaker, and J. C. McWilliams (2013), Statistics of vertical vorticity, diver-
gence, and strain in a developed submesoscale turbulence field, Geophys. Res. Lett., 40, 4706–4711, doi:10.1002/grl.50919.Shcherbina, A. Y., et al. (2015), The latmix summer campaign: Submesoscale stirring in the upper ocean, Bull. Am. Meteorol. Soc., 96(8),
1257–1279, doi:10.1175/BAMS-D-14-00015.1.Shen, C. Y., and T. E. Evans (2002), Inertial instability and sea spirals, Geophys. Res. Lett., 29, 2124, doi:10.1029/2002GL015701.
Journal of Geophysical Research: Oceans 10.1002/2017JC012910
BUCKINGHAM ET AL. TESTING MUNK’S HYPOTHESIS 6744

Stone, P. H. (1966), On non-geostrophic baroclinic stability, J. Atmos. Sci., 23(4), 390–400.Stone, P. H. (1970), On non-geostrophic baroclinic stability: Part II, J. Atmos. Sci., 27(5), 721–726, doi:10.1175/1520-0469(1970)027h0721:
ONGBSPi2.0.CO;2.Thomas, L. N., A. Tandon, and A. Mahadevan (2008), Submesoscale processes and dynamics, in Ocean Modeling in an Eddying Regime, Geo-
phys. Monogr. Ser., vol. 177, edited M. W. Hecht and H. Hasumi, pp. 17–38, AGU, Washington, D. C.Thompson, A. F., A. Lazar, C. E. Buckingham, A. C. Naveira Garabato, G. M. Damerell, and K. J. Heywood (2016), Open-ocean submesoscale
motions: A full seasonal cycle of mixed layer instabilities from gliders, J. Phys. Oceanogr., 46, 1285–1307, doi:10.1175/JPO-D-15-0170.1.Thorpe, S. (1971), Experiments on the instability of stratified shear flows: Miscible fluids, J. Fluid Mech., 46(02), 299–319.Walker, G. (1931), On periodicity in series of related terms, Proc. R. Soc. London Ser. A, 131, 818, 518–532.Welch, P. D. (1967), The use of fast Fourier transform for the estimation of power spectra: A method based on time averaging over short,
modified periodograms, IEEE Trans. Audio Electroacoust., 15(2), 70–73.Yule, G. U. (1927), On a method of investigating periodicities in disturbed series, with special reference to Wolfer’s sunspot numbers, Philos.
Trans. R. Soc. London Ser. A, 226, 267–298.
Journal of Geophysical Research: Oceans 10.1002/2017JC012910
BUCKINGHAM ET AL. TESTING MUNK’S HYPOTHESIS 6745