testing for water borne pathogens at an aquaponic farm · testing for water borne pathogens at an...
TRANSCRIPT

Testing for Water Borne Pathogens at an Aquaponic
Farm
Prepared By:
Clyde S. Tamaru, Bradley Fox, Jim Hollyer, Luisa Castro, and Todd Low
College of Tropical Agriculture and
Human Resources
Department of Molecular Biosciences and Bioengineering
1995 East West Road AgSci 218 Honolulu, Hi 96822
February 1, 2012
AKNOWLEDGMENTS The authors wish to extend their sincere thanks to Fred Lau, Brendon Lau and Ryan Tsutsui of Mari’s Garden for their support during the entire project. In addition to allowing the project team to conduct the surveys of the farm, funding for some of the analyses was a contribution in kind by Mari’s Garden. Partial funding was also provided by the Agribusiness Development Corporation of the Hawaii Department of Agriculture and from a grant from the National Oceanographic and Atmospheric Association (NOAA) entitled “Sustainable Aquaculture for Food Security in Hawaii: Survey and Improvement of Farm Production and Post Harvest Practices for Biosecurity and Food Safety” that was conducted in partnership with Hawaii Department of Agriculture’s Aquaculture and Livestock Support Services. Last but not least support was also obtained from the USDA through the Smith Lever Formula Funds awarded to the College of Tropical Agriculture and Human Resources.
EXECUTIVE SUMMARY Between January 2011 through January 2012, a total of nine sampling activities (4 tissue and 5 water) took place on Mari’s Gardens, a commercial aquaponic producer located in Mililani, on the island of Oahu. All samples were obtained in a fashion that would allow establishment of protocol(s) for future water and tissue sampling on aquaponic operations. The collected samples were submitted to an on-land accredited testing laboratory for analyses. All water samples were found to be compliant with the Environmental Protection Agency’s (EPA) recommended recreational water quality standards for E. coli which are used by the produce industry in absence of other irrigation water quality standards. These standards are: 1) < geometric mean of 126 organisms/100 ml based or; 2) < 235 organisms/100 ml for any single water sample (EPA 1986). Of the four tissue sampling activities no detection of E. coli O157:H7 or Salmonella were found amongst all of the produce being grown on the farm site. The values obtained fall well within the matrix of the 20071California Leafy Green Products Handler Marketing Agreement (LGMA), a standard that gives specific and science-based guidance to be used for growing and harvesting leafy greens. INTRODUCTION Currently, large buyers of aquaponics-grown leafy greens are not accepting those greens because there is not enough science-based information about the potential human pathogens (generic E. coli, E. coli O157:H7 and Salmonella) in this emerging water-based production environment. The College of Tropical Agriculture and Human Resources (CTAHR) Farm Food Safety and Aquaculture Extension Projects solicited funding and leveraged resources in collaboration with the State of Hawaii Department of Agriculture’s Aquaculture and Livestock Support Services to conduct onsite product and water sampling for obtaining real data in a real world setting. A private sector collaborator, Mari’s Gardens, provided the CTAHR team with a working environment where sampling protocols could be established and be based on multiple samples obtained during both a single site visit as well as repeated visits over several months. The desired outcome of the activities undertaken is a sampling protocol that can be used in future “third party” testing of aquaponic operations. The data obtained should be of sufficient rigor to be used in a farm safety audit for pathogen requirements and forms the basis of this report. MATERIAL AND METHODS Step 1. Prior to taking samples from a farm there are several activities that will greatly aid in sampling as well as keeping records of the samples. These are:
Working collaboratively with the farm owner, make a sketch of the farm’s layout and where the surveying will take place. An example of the tank and growbed layout for Mari’s Gardens is summarized in Figure 1 in the Appendix. The layout
1 http://www.caleafygreens.ca.gov/about-us
greatly aids in the sampling and recording of where the samples are obtained. This is particularly true for a large farm with multiple tanks and growbeds. Bring a hard copy of the sketch each time you sample so that you can mark directly on the sketch where the samples were taken as well as any other notes. In this way you will also have a hard copy available for future reference. If preparing a sketch is not possible prior to the first farm visit then a draft should be made at the time of the sampling and a schematic prepared when time permits.
Step 2: It is highly recommended that a visit to the accredited laboratory take place prior to sampling at the farm. In this way the necessary supplies for mixing the water samples and chain of custody forms can be obtained. Collection material is usually supplied with a cooler that contains freeze packs in the event the samples need to be kept for longer than four hours before being submitted to the laboratory. Place the freeze packs in a freezer overnight so they will be available for use the following day or when sampling is to take place. In addition, the laboratory used in the current investigation uses the Colilert SM 9223 method for assessing Total coliform and E. coli and requires the use of sterile bottles containing the chemical reagents already sealed in the bottle. Other methods can be used if they meet FDA standards. The water is collected by breaking the cover/seal before filling with the water to be tested. To insure proper results, no substitute sampling vials are allowed. This is also a good time to check with the laboratory personnel that there are adequate supplies to carry out the specified tests and also that the timing of the samples and conducting of the tests are suitable from the perspective of the laboratory being able to complete the testing. Note whether there is a holiday coming up and always consider that your samples are not the only samples the laboratory will be processing. Likewise, while the E. coli test can be accomplished within 24 hours the Salmonella testing can take as long as 72 hours and bringing a sample on a Thursday would result in laboratory personnel coming on the weekend. If this takes place additional costs may be incurred. Step 3: Additional materials and supplies needed:
chain of custody form supplied by lab
one gallon re-sealable zipper storage bags for tissue samples
disposable gloves
alcohol swabs for disinfecting tools
scissors or knife for harvesting crops
soap
pencil, permanent marking pens
clipboard
sterile one liter bottles
sterile 60 ml syringes
pH meter
thermometer
DO (dissolved oxygen) meter (optional)
Lab coat
Step 4: Two methods were used to obtain water samples during the current investigation. The first was to randomly select sites on the farm and sampling each location in individual bottles. A sample bottle was first labeled using the permanent marking pen and then the seal broken to open the sample bottle. It was then filled with the water above the 100 ml mark, the cap replaced and tightened and mixed by swirling the contents gently back and forth. A note on the location of the water sample is made on the sketch as well as on the chain of custody form. Note that the form also has columns to indicate the time when the sample was taken, as well as the temperature and pH of the sample site. The process is repeated for separate aquaponic systems and usually five samples were taken for this particular aquaponic farm taking into consideration cost of analyses and the number of systems actively being used. A second method was also explored during the latter part of the current study. It involved taking composite samples of the various systems, thus allowing for sampling of the entire farm at a substantially reduced cost. The composite sampling was accomplished using the following protocol:
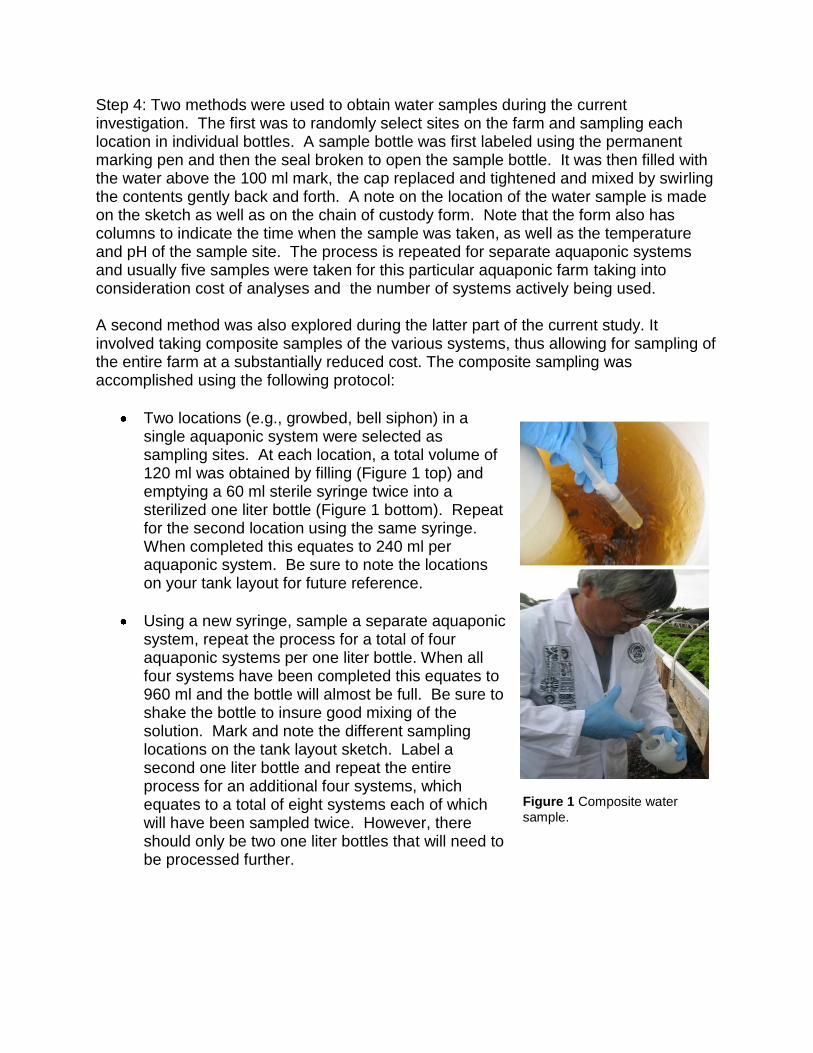
Two locations (e.g., growbed, bell siphon) in a single aquaponic system were selected as sampling sites. At each location, a total volume of 120 ml was obtained by filling (Figure 1 top) and emptying a 60 ml sterile syringe twice into a sterilized one liter bottle (Figure 1 bottom). Repeat for the second location using the same syringe. When completed this equates to 240 ml per aquaponic system. Be sure to note the locations on your tank layout for future reference.
Using a new syringe, sample a separate aquaponic system, repeat the process for a total of four aquaponic systems per one liter bottle. When all four systems have been completed this equates to 960 ml and the bottle will almost be full. Be sure to shake the bottle to insure good mixing of the solution. Mark and note the different sampling locations on the tank layout sketch. Label a second one liter bottle and repeat the entire process for an additional four systems, which equates to a total of eight systems each of which will have been sampled twice. However, there should only be two one liter bottles that will need to be processed further.
Figure 1 Composite water
sample.
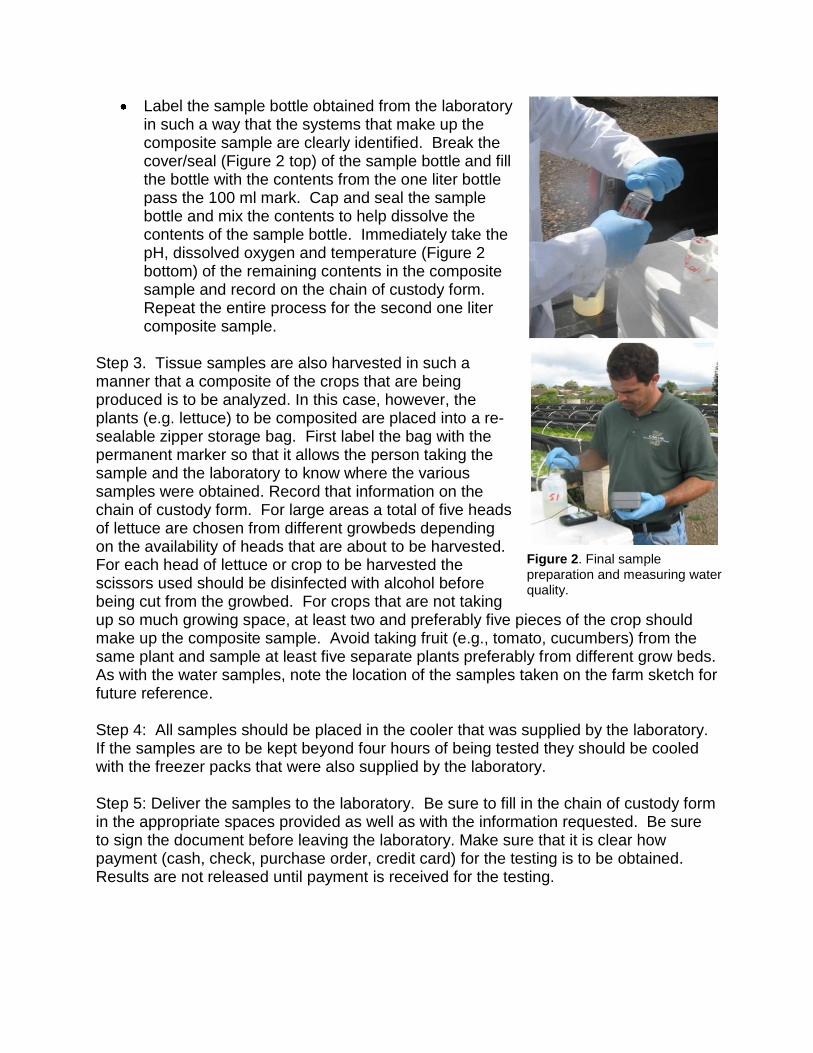
Label the sample bottle obtained from the laboratory in such a way that the systems that make up the composite sample are clearly identified. Break the cover/seal (Figure 2 top) of the sample bottle and fill the bottle with the contents from the one liter bottle pass the 100 ml mark. Cap and seal the sample bottle and mix the contents to help dissolve the contents of the sample bottle. Immediately take the pH, dissolved oxygen and temperature (Figure 2 bottom) of the remaining contents in the composite sample and record on the chain of custody form. Repeat the entire process for the second one liter composite sample.
Step 3. Tissue samples are also harvested in such a manner that a composite of the crops that are being produced is to be analyzed. In this case, however, the plants (e.g. lettuce) to be composited are placed into a re-sealable zipper storage bag. First label the bag with the permanent marker so that it allows the person taking the sample and the laboratory to know where the various samples were obtained. Record that information on the chain of custody form. For large areas a total of five heads of lettuce are chosen from different growbeds depending on the availability of heads that are about to be harvested. For each head of lettuce or crop to be harvested the scissors used should be disinfected with alcohol before being cut from the growbed. For crops that are not taking up so much growing space, at least two and preferably five pieces of the crop should make up the composite sample. Avoid taking fruit (e.g., tomato, cucumbers) from the same plant and sample at least five separate plants preferably from different grow beds. As with the water samples, note the location of the samples taken on the farm sketch for future reference. Step 4: All samples should be placed in the cooler that was supplied by the laboratory. If the samples are to be kept beyond four hours of being tested they should be cooled with the freezer packs that were also supplied by the laboratory. Step 5: Deliver the samples to the laboratory. Be sure to fill in the chain of custody form in the appropriate spaces provided as well as with the information requested. Be sure to sign the document before leaving the laboratory. Make sure that it is clear how payment (cash, check, purchase order, credit card) for the testing is to be obtained. Results are not released until payment is received for the testing.
Figure 2. Final sample preparation and measuring water quality.
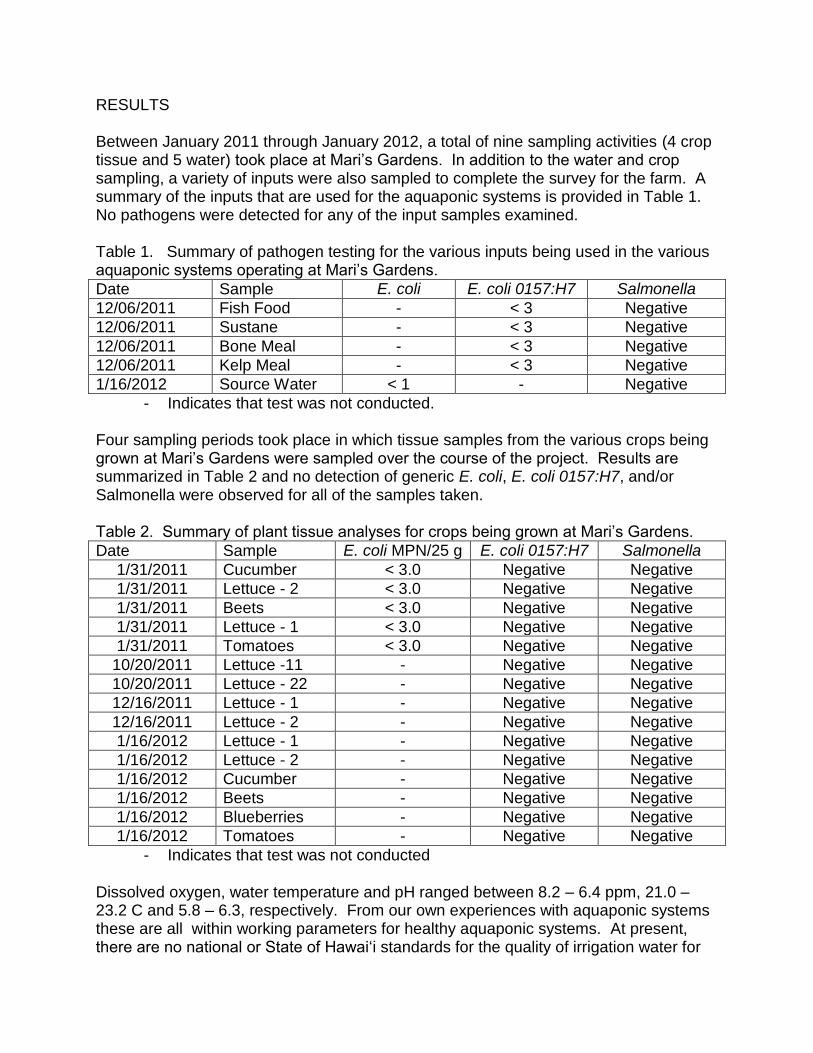
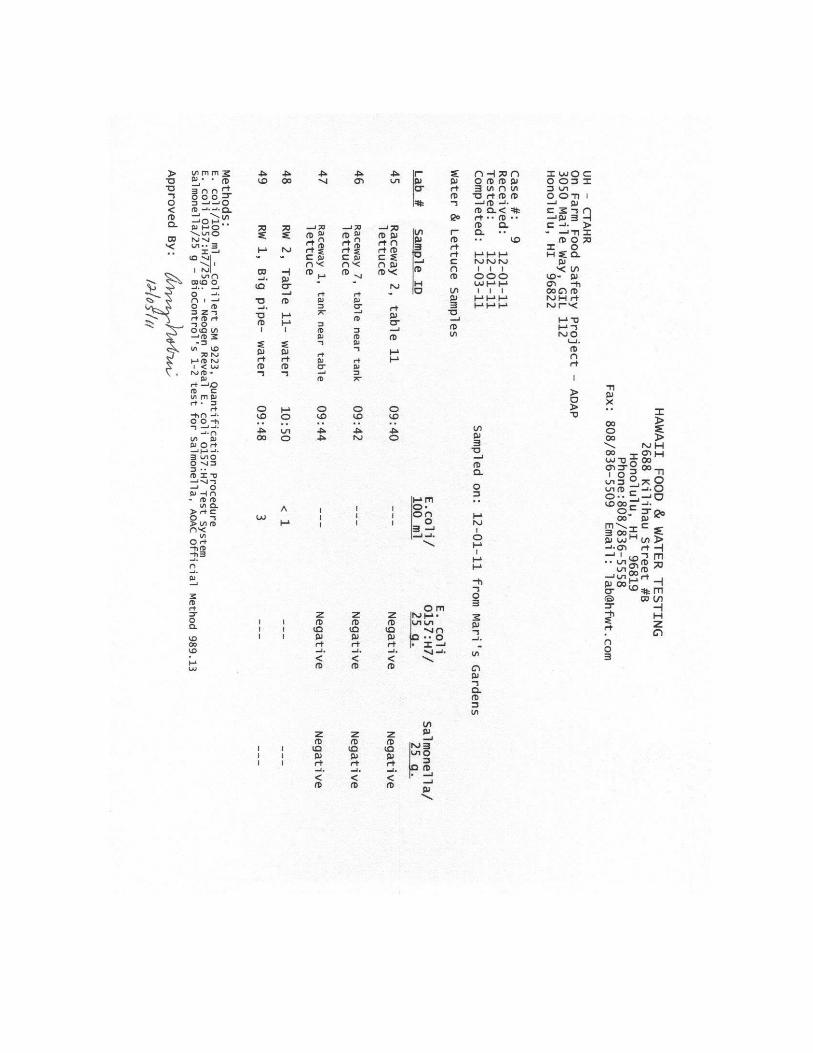
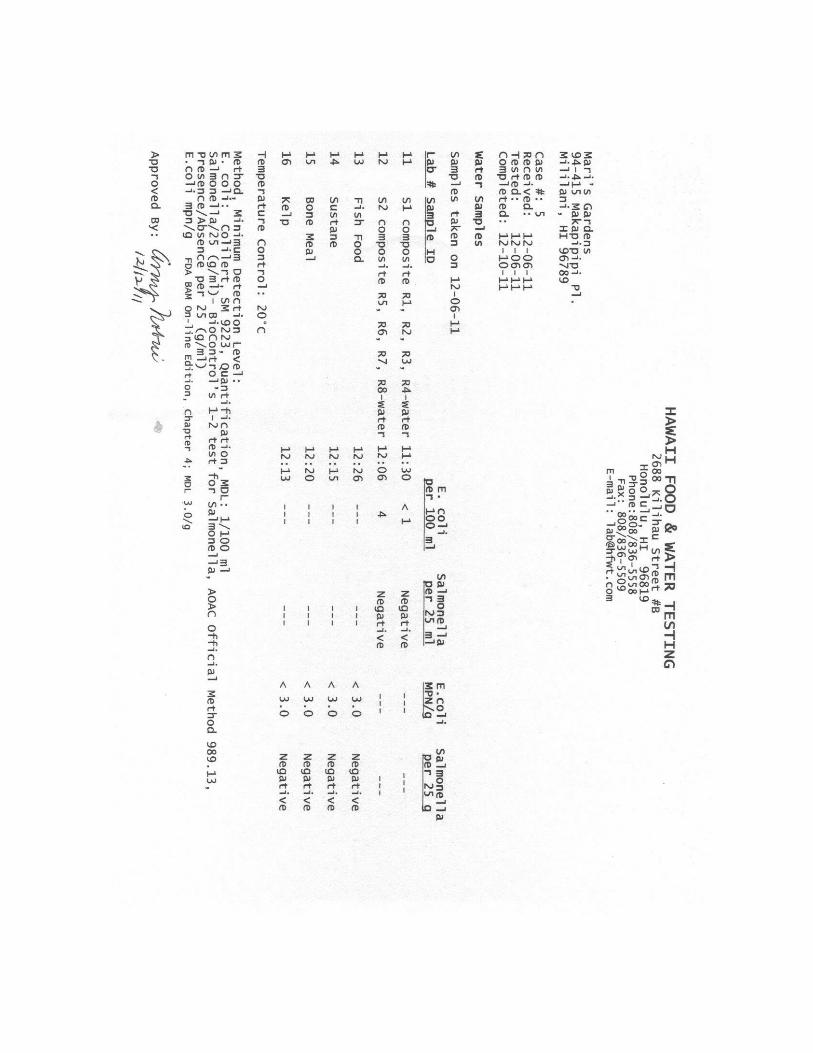
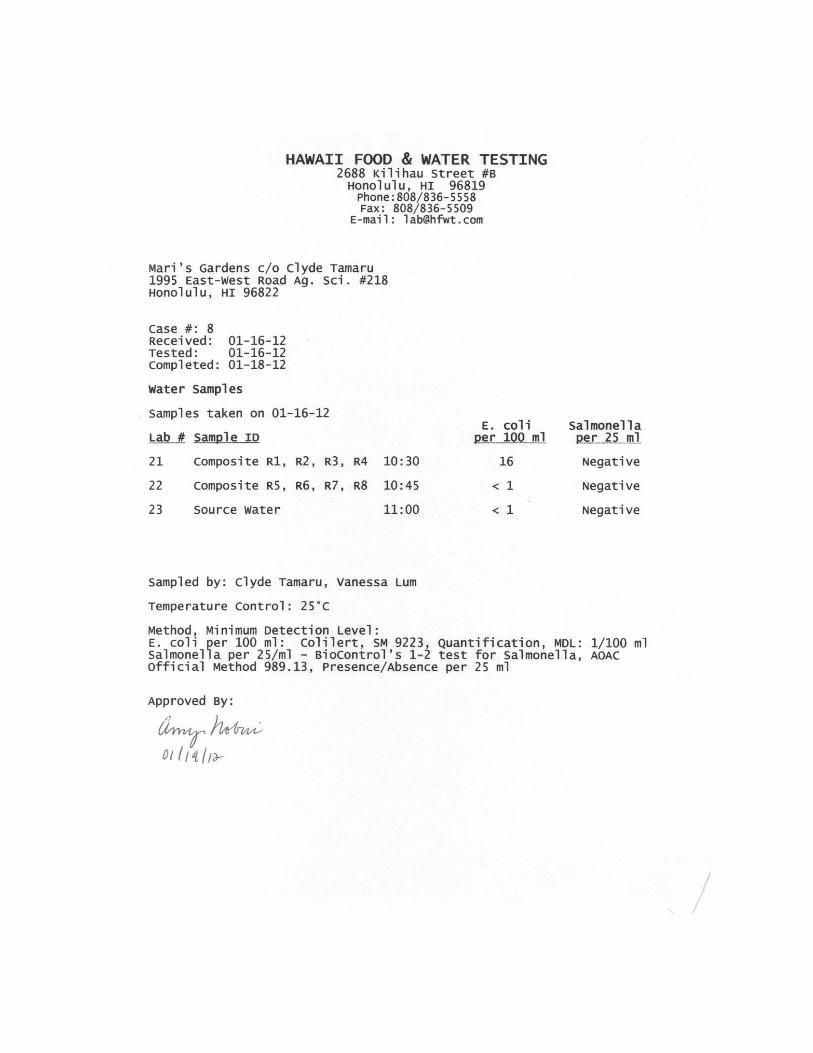
RESULTS Between January 2011 through January 2012, a total of nine sampling activities (4 crop tissue and 5 water) took place at Mari’s Gardens. In addition to the water and crop sampling, a variety of inputs were also sampled to complete the survey for the farm. A summary of the inputs that are used for the aquaponic systems is provided in Table 1. No pathogens were detected for any of the input samples examined. Table 1. Summary of pathogen testing for the various inputs being used in the various aquaponic systems operating at Mari’s Gardens.
Date Sample E. coli E. coli 0157:H7 Salmonella
12/06/2011 Fish Food - < 3 Negative
12/06/2011 Sustane - < 3 Negative
12/06/2011 Bone Meal - < 3 Negative
12/06/2011 Kelp Meal - < 3 Negative
1/16/2012 Source Water < 1 - Negative
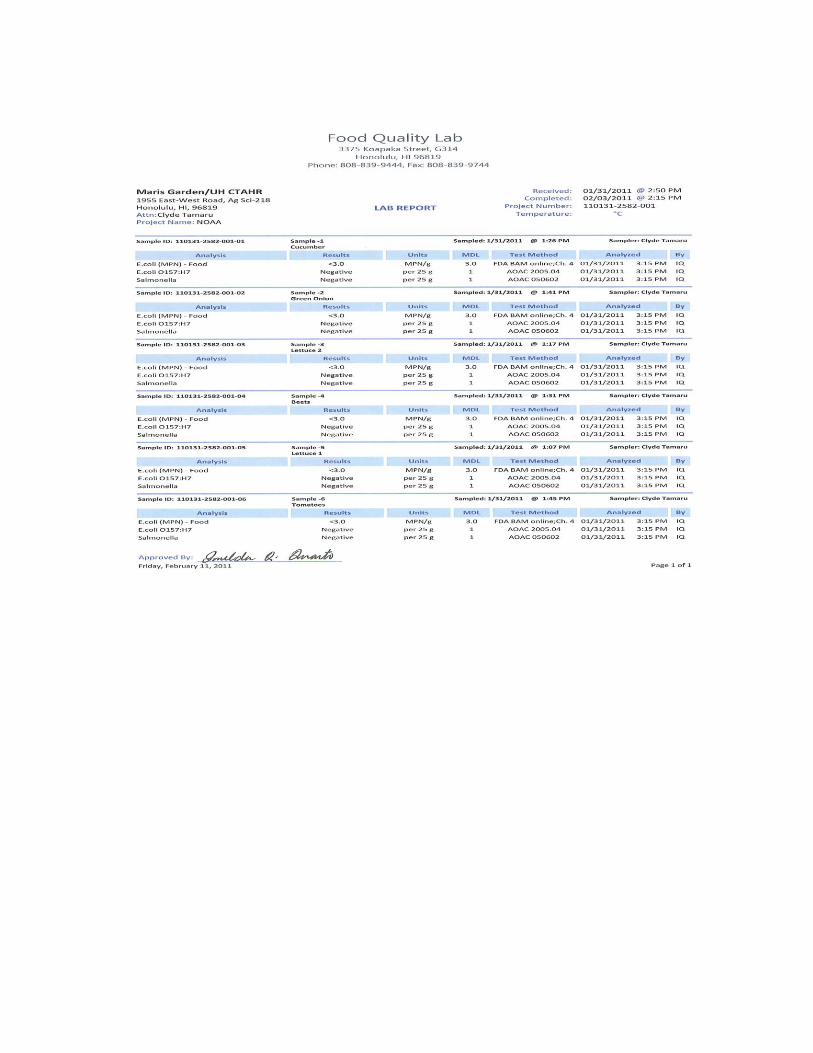
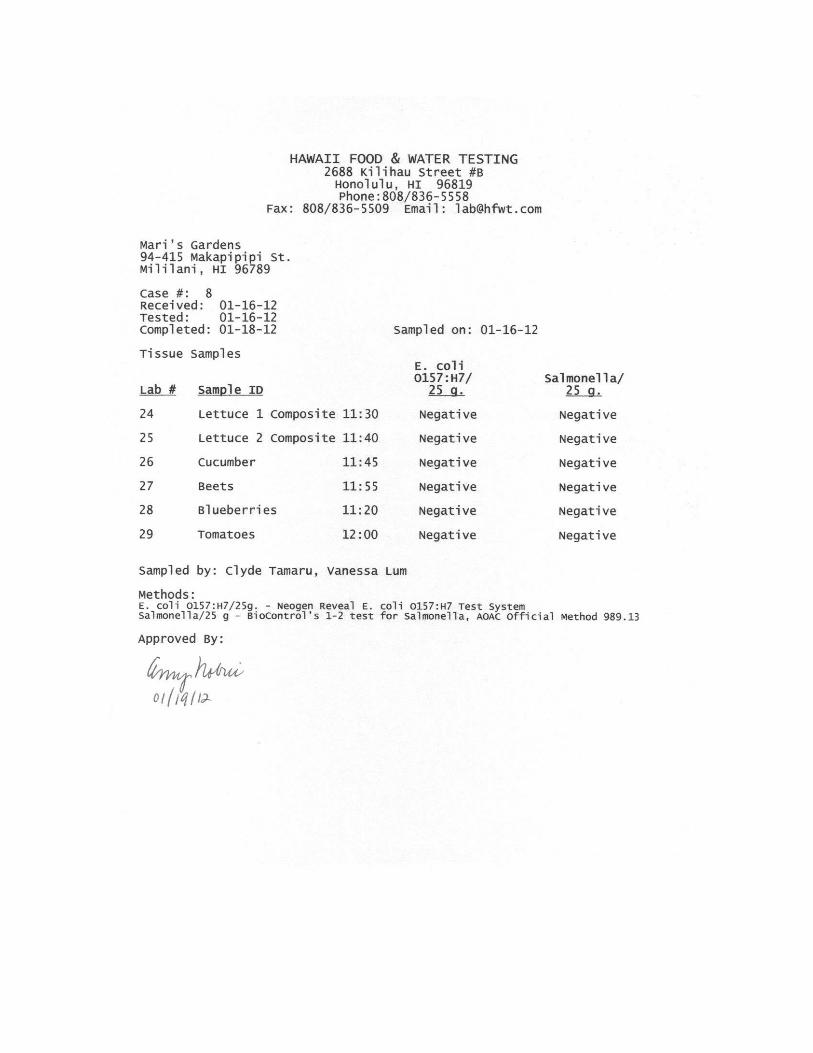
- Indicates that test was not conducted. Four sampling periods took place in which tissue samples from the various crops being grown at Mari’s Gardens were sampled over the course of the project. Results are summarized in Table 2 and no detection of generic E. coli, E. coli 0157:H7, and/or Salmonella were observed for all of the samples taken. Table 2. Summary of plant tissue analyses for crops being grown at Mari’s Gardens.
Date Sample E. coli MPN/25 g E. coli 0157:H7 Salmonella
1/31/2011 Cucumber < 3.0 Negative Negative
1/31/2011 Lettuce - 2 < 3.0 Negative Negative
1/31/2011 Beets < 3.0 Negative Negative
1/31/2011 Lettuce - 1 < 3.0 Negative Negative
1/31/2011 Tomatoes < 3.0 Negative Negative
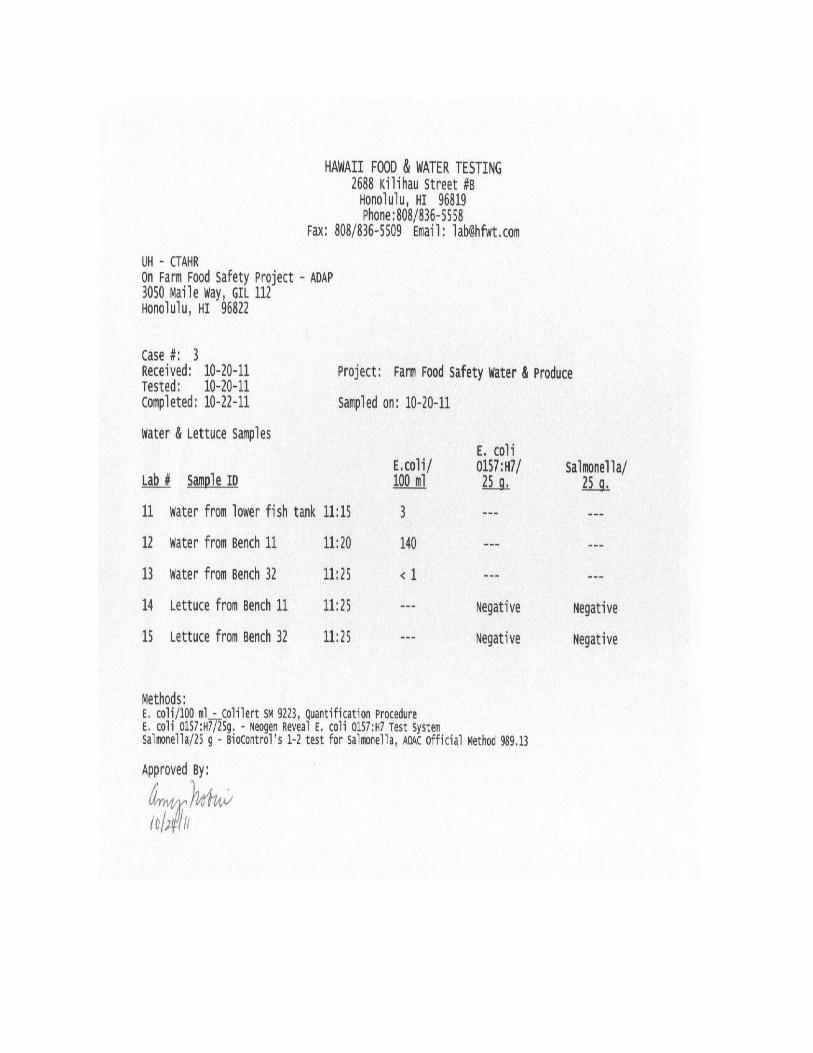
10/20/2011 Lettuce -11 - Negative Negative
10/20/2011 Lettuce - 22 - Negative Negative
12/16/2011 Lettuce - 1 - Negative Negative
12/16/2011 Lettuce - 2 - Negative Negative
1/16/2012 Lettuce - 1 - Negative Negative
1/16/2012 Lettuce - 2 - Negative Negative
1/16/2012 Cucumber - Negative Negative
1/16/2012 Beets - Negative Negative
1/16/2012 Blueberries - Negative Negative
1/16/2012 Tomatoes - Negative Negative
- Indicates that test was not conducted
Dissolved oxygen, water temperature and pH ranged between 8.2 – 6.4 ppm, 21.0 – 23.2 C and 5.8 – 6.3, respectively. From our own experiences with aquaponic systems these are all within working parameters for healthy aquaponic systems. At present, there are no national or State of Hawai‘i standards for the quality of irrigation water for
land based produce. Water quality standards for agriculture at this time are based on those set by the US EPA for recreational uses (any body of water where human activity occurs). E. coli is the most reliable indicator of fecal bacterial contamination of surface waters in the U.S. according to water quality standards set by the EPA. The same water quality standard is being applied for aquaponic systems. Although E. coli bacteria are not typically pathogenic in and of themselves, an extensive epidemiological study (Dufour 1984) demonstrated that E. coli concentrations are the best predictor of swimming-associated gastrointestinal illness. EPA bacterial water quality standards are thus based on a threshold concentration of E. coli in water above which the health risk from waterborne illness is unacceptably high.
The EPA recommended recreational water quality standard for E. coli is based on two criteria: 1) a geometric mean of 126 organisms/100 ml based on several samples collected, generally not less than five samples equally spaced over a 30-day period or; 2) 235 organisms/100 ml for any single water sample (EPA 1986). The geometric mean is calculated by the equation: geometric mean of y = nth root of y1 * y2 * y3...yn. If either criterion is exceeded, the site is not in compliance with water quality standards and not recommended for swimming. The current EPA water quality standard for E. coli corresponds to approximately 8 gastrointestinal illnesses per 1000 swimmers (Dufour 1984).
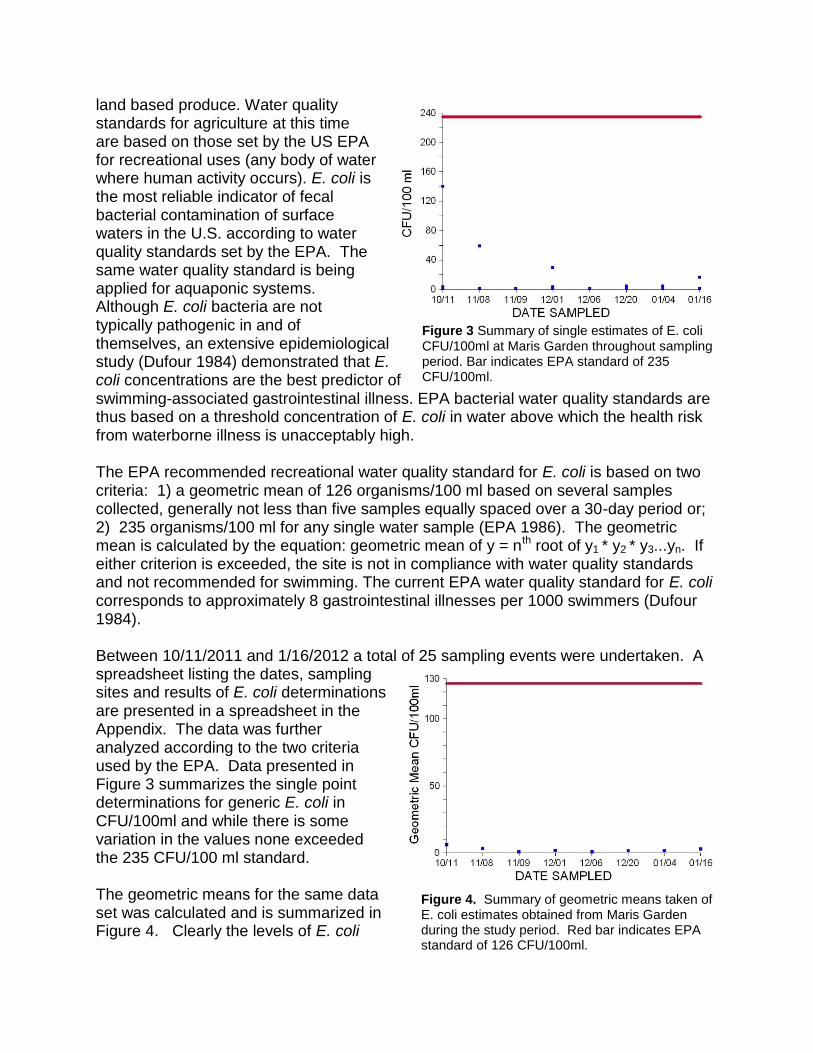
Between 10/11/2011 and 1/16/2012 a total of 25 sampling events were undertaken. A spreadsheet listing the dates, sampling sites and results of E. coli determinations are presented in a spreadsheet in the Appendix. The data was further analyzed according to the two criteria used by the EPA. Data presented in Figure 3 summarizes the single point determinations for generic E. coli in CFU/100ml and while there is some variation in the values none exceeded the 235 CFU/100 ml standard. The geometric means for the same data set was calculated and is summarized in Figure 4. Clearly the levels of E. coli
Figure 3 Summary of single estimates of E. coli CFU/100ml at Maris Garden throughout sampling period. Bar indicates EPA standard of 235 CFU/100ml.
Figure 4. Summary of geometric means taken of E. coli estimates obtained from Maris Garden during the study period. Red bar indicates EPA standard of 126 CFU/100ml.
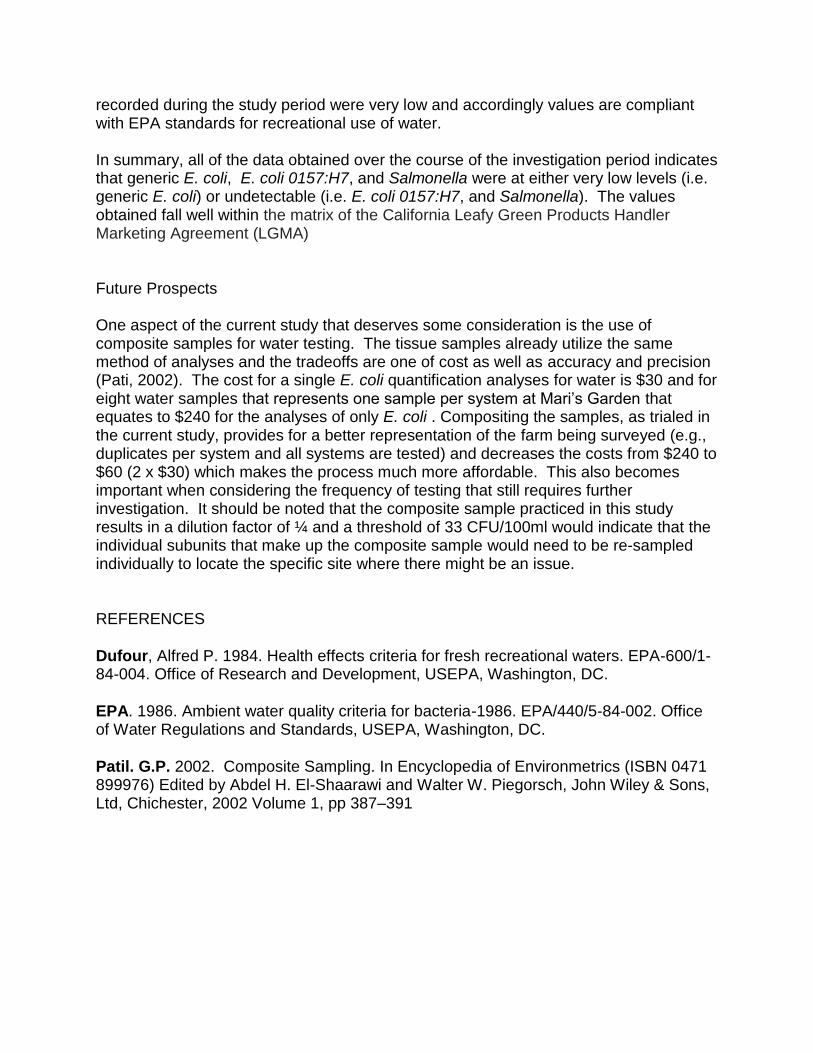
recorded during the study period were very low and accordingly values are compliant with EPA standards for recreational use of water. In summary, all of the data obtained over the course of the investigation period indicates that generic E. coli, E. coli 0157:H7, and Salmonella were at either very low levels (i.e. generic E. coli) or undetectable (i.e. E. coli 0157:H7, and Salmonella). The values obtained fall well within the matrix of the California Leafy Green Products Handler Marketing Agreement (LGMA) Future Prospects One aspect of the current study that deserves some consideration is the use of composite samples for water testing. The tissue samples already utilize the same method of analyses and the tradeoffs are one of cost as well as accuracy and precision (Pati, 2002). The cost for a single E. coli quantification analyses for water is $30 and for eight water samples that represents one sample per system at Mari’s Garden that equates to $240 for the analyses of only E. coli . Compositing the samples, as trialed in the current study, provides for a better representation of the farm being surveyed (e.g., duplicates per system and all systems are tested) and decreases the costs from $240 to $60 (2 x $30) which makes the process much more affordable. This also becomes important when considering the frequency of testing that still requires further investigation. It should be noted that the composite sample practiced in this study results in a dilution factor of ¼ and a threshold of 33 CFU/100ml would indicate that the individual subunits that make up the composite sample would need to be re-sampled individually to locate the specific site where there might be an issue. REFERENCES
Dufour, Alfred P. 1984. Health effects criteria for fresh recreational waters. EPA-600/1-84-004. Office of Research and Development, USEPA, Washington, DC.
EPA. 1986. Ambient water quality criteria for bacteria-1986. EPA/440/5-84-002. Office of Water Regulations and Standards, USEPA, Washington, DC.
Patil. G.P. 2002. Composite Sampling. In Encyclopedia of Environmetrics (ISBN 0471 899976) Edited by Abdel H. El-Shaarawi and Walter W. Piegorsch, John Wiley & Sons, Ltd, Chichester, 2002 Volume 1, pp 387–391

APPENDICES
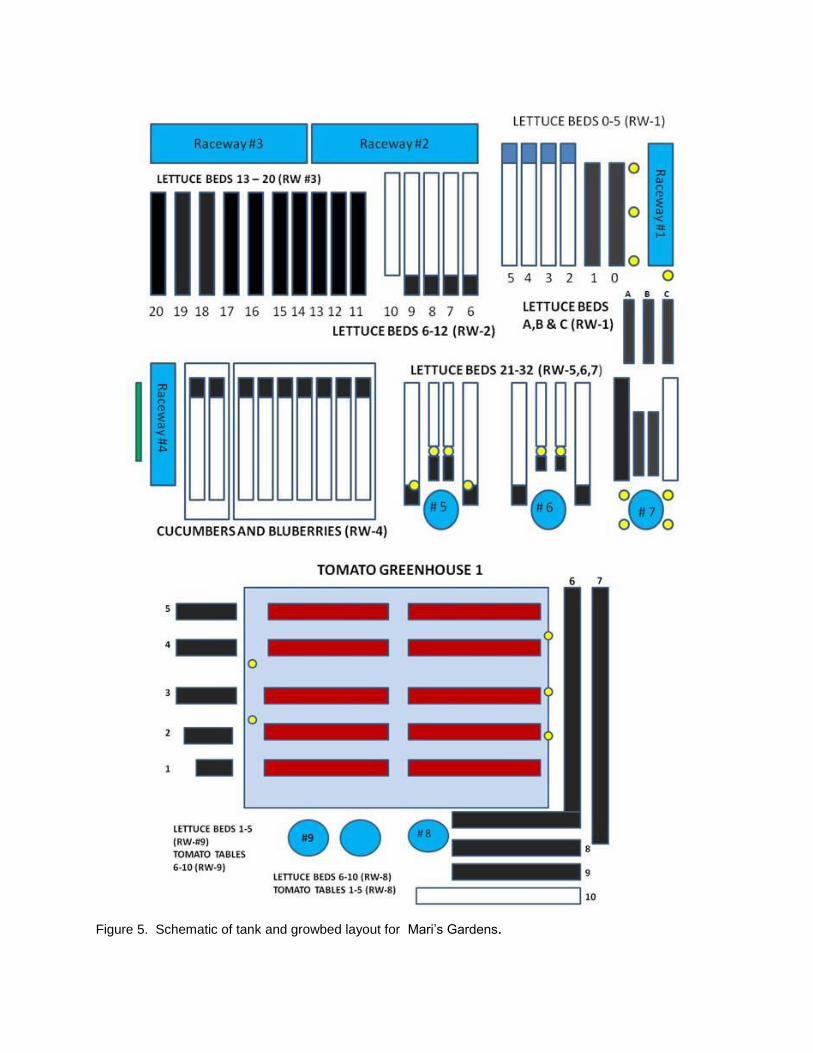
Figure 5. Schematic of tank and growbed layout for Mari’s Gardens.
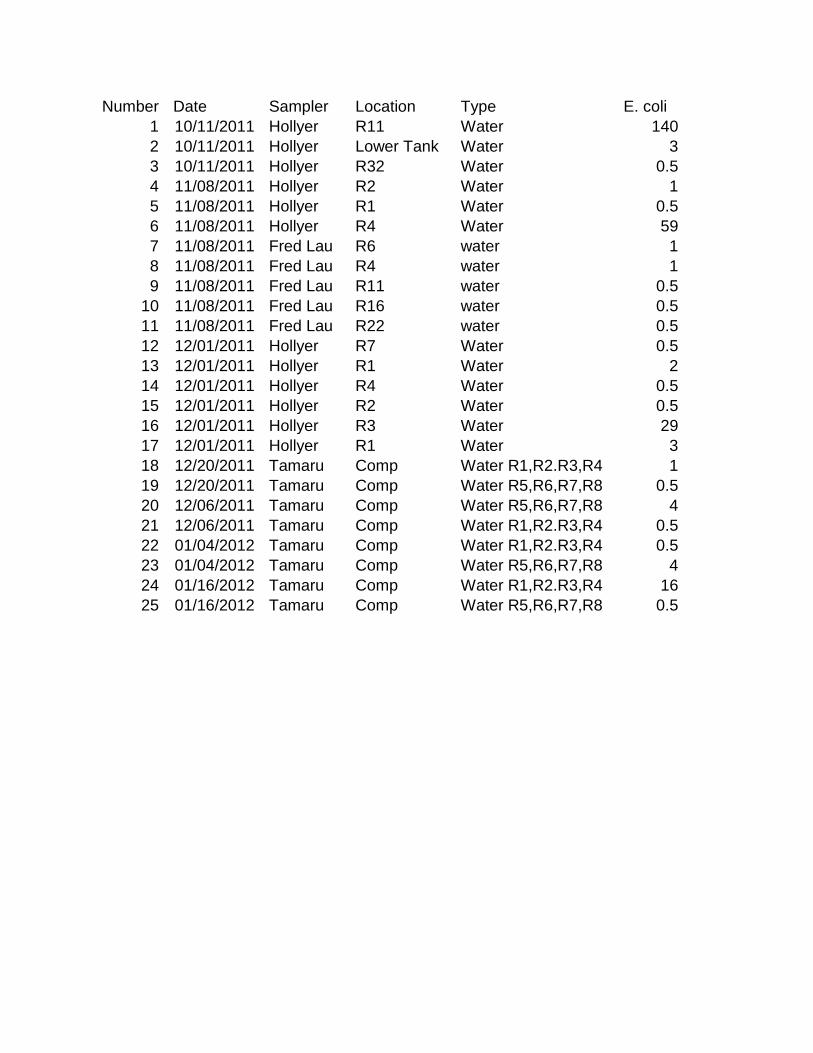
Number Date Sampler Location Type E. coli
1 10/11/2011 Hollyer R11 Water 140
2 10/11/2011 Hollyer Lower Tank Water 3
3 10/11/2011 Hollyer R32 Water 0.5
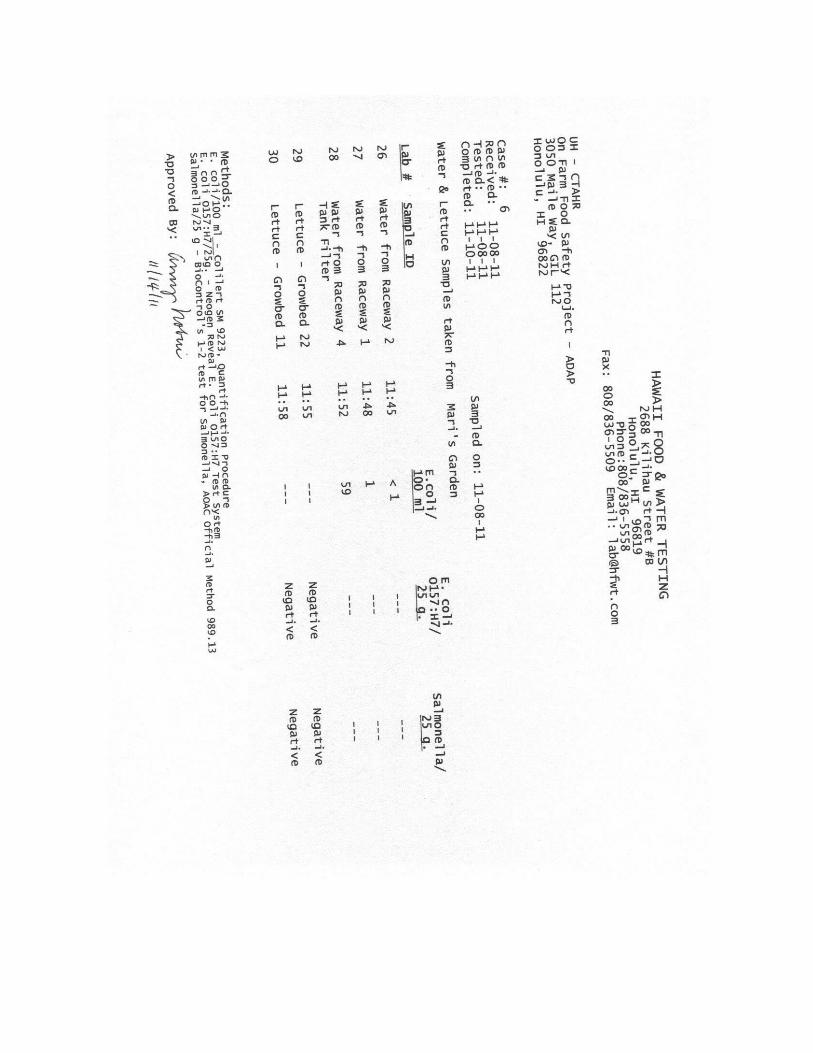
4 11/08/2011 Hollyer R2 Water 1
5 11/08/2011 Hollyer R1 Water 0.5
6 11/08/2011 Hollyer R4 Water 59
7 11/08/2011 Fred Lau R6 water 1
8 11/08/2011 Fred Lau R4 water 1
9 11/08/2011 Fred Lau R11 water 0.5
10 11/08/2011 Fred Lau R16 water 0.5
11 11/08/2011 Fred Lau R22 water 0.5
12 12/01/2011 Hollyer R7 Water 0.5
13 12/01/2011 Hollyer R1 Water 2
14 12/01/2011 Hollyer R4 Water 0.5
15 12/01/2011 Hollyer R2 Water 0.5
16 12/01/2011 Hollyer R3 Water 29
17 12/01/2011 Hollyer R1 Water 3
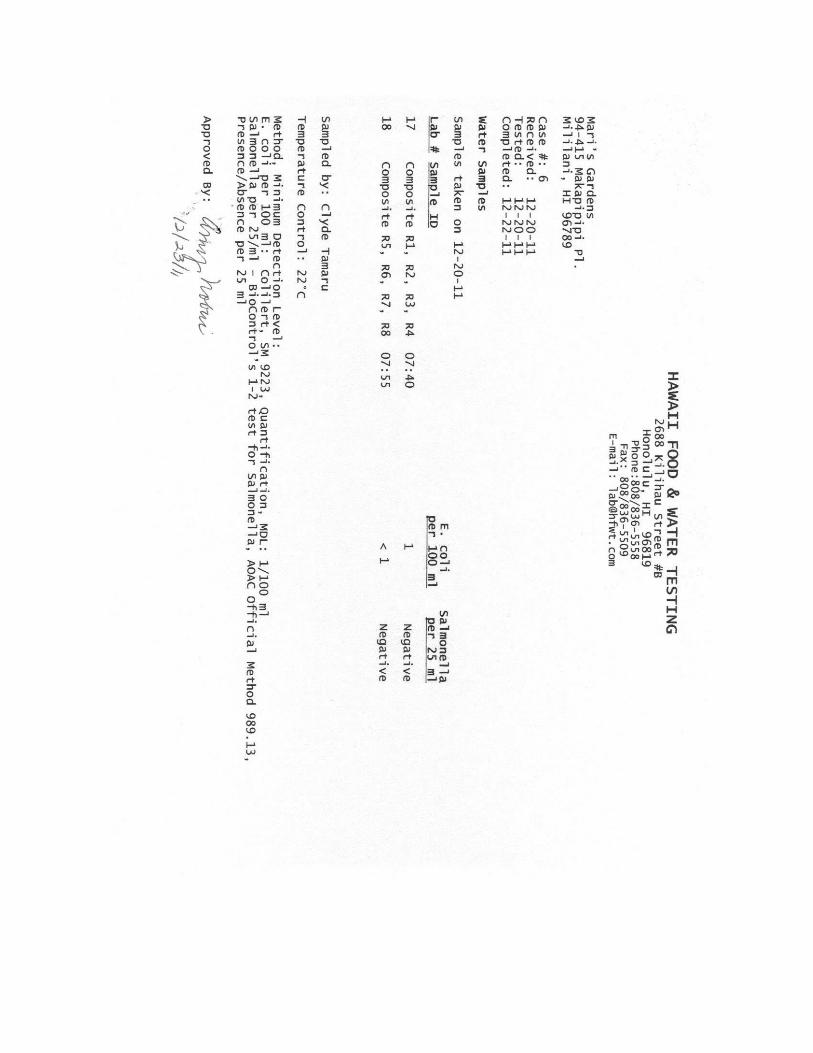
18 12/20/2011 Tamaru Comp Water R1,R2.R3,R4 1
19 12/20/2011 Tamaru Comp Water R5,R6,R7,R8 0.5
20 12/06/2011 Tamaru Comp Water R5,R6,R7,R8 4
21 12/06/2011 Tamaru Comp Water R1,R2.R3,R4 0.5
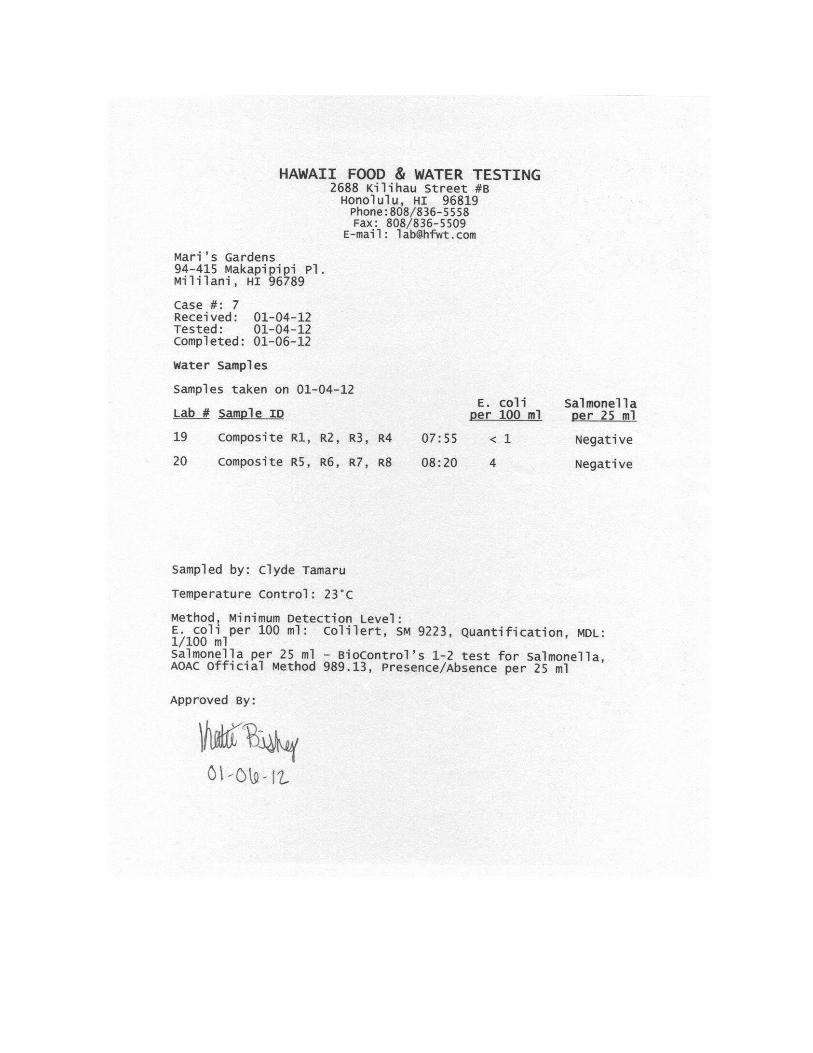
22 01/04/2012 Tamaru Comp Water R1,R2.R3,R4 0.5
23 01/04/2012 Tamaru Comp Water R5,R6,R7,R8 4
24 01/16/2012 Tamaru Comp Water R1,R2.R3,R4 16
25 01/16/2012 Tamaru Comp Water R5,R6,R7,R8 0.5