testing for cytochrome p450 polymorphisms in adults with … · 2007-01-04 · evidence...
TRANSCRIPT

Evidence Report/Technology Assessment Number 146
Testing for Cytochrome P450 Polymorphisms in Adults With Non-Psychotic Depression Treated With Selective Serotonin Reuptake Inhibitors (SSRIs) Prepared for: Agency for Healthcare Research and Quality U.S. Department of Health and Human Services 540 Gaither Road Rockville, MD 20850 www.ahrq.gov Contract No. 290-02-0025 Prepared by: Duke Evidence-based Practice Center, Durham, NC Investigators David B. Matchar, M.D., Principal Investigator Mugdha E. Thakur, M.D., Co-Principal Investigator Iris Grossman, Ph.D. Douglas C. McCrory, M.D., M.H.S. Lori A. Orlando, M.D., M.H.S. David C. Steffens, M.D., M.H.S. David B. Goldstein, Ph.D. Kathryn E. Cline, M.H.S., Project Manager Rebecca N. Gray, D.Phil., Editor AHRQ Publication No. 07-E002January 2007

This report is based on research conducted by the Duke Evidence-based Practice Center (EPC) under contract to the Agency for Healthcare Research and Quality (AHRQ), Rockville, MD (Contract No. 290-02-0025). The findings and conclusions in this document are those of the author(s), who are responsible for its contents, and do not necessarily represent the views of AHRQ. No statement in this report should be construed as an official position of AHRQ or of the U.S. Department of Health and Human Services.
The information in this report is intended to help clinicians, employers, policymakers, and others make informed decisions about the provision of health care services. This report is intended as a reference and not as a substitute for clinical judgment.
This report may be used, in whole or in part, as the basis for development of clinical practice guidelines and other quality enhancement tools, or as a basis for reimbursement and coverage policies. AHRQ or U.S. Department of Health and Human Services endorsement of such derivative products may not be stated or implied.

ii
This document is in the public domain and may be used and reprinted without permission except those copyrighted materials noted for which further reproduction is prohibited without the specific permission of copyright holders. Suggested Citation: Matchar DB, Thakur ME, Grossman I, McCrory DC, Orlando LA, Steffens DC, Goldstein DB, Cline KE, Gray RN. Testing for Cytochrome P450 Polymorphisms in Adults With Non-Psychotic Depression Treated With Selective Serotonin Reuptake Inhibitors (SSRIs). Evidence Report/Technology Assessment No. 146. (Prepared by the Duke Evidence-based Practice Center under Contract No. 290-02-0025.) AHRQ Publication No. 07-E002. Rockville, MD: Agency for Healthcare Research and Quality. January 2007.
None of the investigators has any affiliations or financial involvement that conflicts with the material presented in this report.

iii
Preface The Agency for Healthcare Research and Quality (AHRQ), through its Evidence-Based Practice Centers (EPCs), sponsors the development of evidence reports and technology assessments to assist public- and private-sector organizations in their efforts to improve the quality of health care in the United States. The Centers for Disease Control and Prevention (CDC) requested and provided funding for this report. The reports and assessments provide organizations with comprehensive, science-based information on common, costly medical conditions and new health care technologies. The EPCs systematically review the relevant scientific literature on topics assigned to them by AHRQ and conduct additional analyses when appropriate prior to developing their reports and assessments. To bring the broadest range of experts into the development of evidence reports and health technology assessments, AHRQ encourages the EPCs to form partnerships and enter into collaborations with other medical and research organizations. The EPCs work with these partner organizations to ensure that the evidence reports and technology assessments they produce will become building blocks for health care quality improvement projects throughout the Nation. The reports undergo peer review prior to their release. AHRQ expects that the EPC evidence reports and technology assessments will inform individual health plans, providers, and purchasers as well as the health care system as a whole by providing important information to help improve health care quality. We welcome comments on this evidence report. They may be sent by mail to the Task Order Officer named below at: Agency for Healthcare Research and Quality, 540 Gaither Road, Rockville, MD 20850, or by e-mail to [email protected]. Carolyn M. Clancy, M.D. Director Agency for Healthcare Research and Quality Julie Louise Gerberding, M.D., M.P.H. Director Centers for Disease Control and Prevention
Jean Slutsky, P.A., M.S.P.H. Director, Center for Outcomes and Evidence Agency for Healthcare Research and Quality Beth A. Collins Sharp, Ph.D., R.N. Director, EPC Program Agency for Healthcare Research and Quality Gurvaneet Randhawa, M.D., M.P.H. EPC Program Task Order Officer Agency for Healthcare Research and Quality

iv
Acknowledgments The authors gratefully acknowledge Jennifer Farmer and Cara O’Brien for assistance with abstract screening; Georgette De Jesus for help with abstract screening and for over-reading of data abstractions; Udita Patel and R. Julian Irvine for assistance with project management; Greg Samsa for reading and commenting on portions of the draft report; Linda Bradley and Glenn Palomaki for assistance with the material on analytic validity, and Gurvaneet Randhawa, AHRQ Task Order Officer, for overall support.

v
Structured Abstract Objectives: To determine if testing for cytochrome P450 (CYP450) polymorphisms in adults entering selective serotonin reuptake inhibitor (SSRI) treatment for non-psychotic depression leads to improvement in outcomes, or if testing results are useful in medical, personal, or public health decisionmaking. Data Sources: We searched MEDLINE®, the Cochrane Database of Abstracts of Reviews of Effects, PsychInfo, HealthSTAR, and CINAHL, and reviewed the reference lists of included articles and relevant review articles and meta-analyses for eligible studies. We also included documents from the U.S. Food and Drug Administration (FDA) that could be publicly accessed. Review Methods: We developed an analytic framework and identified key questions to guide the review process. Project-specific inclusion/exclusion criteria were also developed and were used by paired researchers independently to review both abstracts and full-text articles; both researchers were required to agree on inclusion status at the full-text stage. Abstractors evaluated each included article for factors affecting internal and external validity. Results: A review of 1,200 abstracts led to the final inclusion of 37 articles. The evidence indicates the existence of tests with high sensitivity and specificity for detecting only a few of the more common known polymorphisms of 2D6, 2C19, 2C8, 2C9, and 1A1. There is mixed evidence regarding the association between CYP450 genotypes and SSRI metabolism, efficacy, and tolerability in the treatment of depression, mainly from a series of heterogeneous studies in small samples. There are no data regarding: (a) if testing for CYP450 polymorphisms in adults entering SSRI treatment for non-psychotic depression leads to improvement in outcomes versus not testing, or if testing results are useful in medical, personal, or public health decisionmaking; (b) if CYP450 testing influences depression management decisions by patients and providers in ways that could improve or worsen outcomes; or (c) if there are direct or indirect harms associated with testing for CYP450 polymorphisms or with subsequent management options. Conclusions: There is a paucity of good-quality data addressing the questions of whether testing for CYP450 polymorphisms in adults entering SSRI treatment for non-psychotic depression leads to improvement in outcomes, or whether testing results are useful in medical, personal, or public health decisionmaking.


vii
Contents Executive Summary .........................................................................................................................1 Evidence Report .............................................................................................................................9 Chapter 1. Introduction .................................................................................................................11 Major Depressive Disorder ......................................................................................................11 Selective Serotonin Reuptake Inhibitors (SSRIs) in the Treatment of MDD..........................11 Therapeutic Drug Monitoring in SSRI Treatment .............................................................12 Cytochrome P450 Enzyme System..........................................................................................13 Genetic Testing for Key CYP450 Polymorphisms..................................................................15 Utility of CYP Genotyping in Treatment of MDD With SSRIs..............................................15 Chapter 2. Methods.......................................................................................................................17 Topic Assessment and Refinement..........................................................................................17 Analytic Framework ................................................................................................................18 Literature Search and Review..................................................................................................20 Sources...............................................................................................................................20 Search Strategies................................................................................................................20 Abstract and Full-Text Screening ......................................................................................20 Full-Text Screening Criteria ..............................................................................................21 Data Abstraction and Development of Evidence Tables .........................................................22 Quality Assessment Criteria ....................................................................................................23 Model of Treatment for Major Depression..............................................................................23 Peer Review Process ................................................................................................................23 Chapter 3. Results .........................................................................................................................25 Question 1: Overarching Question..........................................................................................25 Question 2: Analytic Validity of Tests That Identify Key CYP450 Polymorphisms.............25 Approach............................................................................................................................25 Results................................................................................................................................27 Discussion..........................................................................................................................35 Conclusions........................................................................................................................36 Question 3a: CYP450 Genotypes and Metabolism of SSRIs .................................................36 Approach............................................................................................................................36 Results................................................................................................................................37 Discussion..........................................................................................................................41 Conclusions........................................................................................................................42 Question 3b: CYP450 Testing and Efficacy of SSRIs............................................................42 Approach............................................................................................................................42 Results................................................................................................................................43 Discussion..........................................................................................................................45 Conclusions........................................................................................................................46

viii
Question 3c: CYP450 Testing and Adverse Drug Reactions .................................................46 Approach............................................................................................................................46 Results................................................................................................................................47 Discussion..........................................................................................................................48 Conclusions........................................................................................................................49 Question 4: Management Decisions, Clinical Outcomes, and Decisionmaking ....................49 Question 5: Harms Associated With CYP450 Testing and Subsequent Management Options .........................................................................................................50 Model of Treatment for Major Depression..............................................................................50 Background........................................................................................................................50 Methods..............................................................................................................................51 Results................................................................................................................................55 Discussion..........................................................................................................................57 Chapter 4. Discussion ...................................................................................................................59 Context of the Report...............................................................................................................59 Limitations of the Literature Reviewed ...................................................................................59 Main Findings by Key Question..............................................................................................61 Question 1 ..........................................................................................................................61 Question 2 ..........................................................................................................................61 Question 3a ........................................................................................................................61 Question 3b ........................................................................................................................61 Question 3c ........................................................................................................................61 Questions 4a, 4b, 4c ...........................................................................................................61 Question 5 ..........................................................................................................................62 Model of Treatment for Major Depression........................................................................62 Limitations of the Report .........................................................................................................62 Chapter 5. Future Research...........................................................................................................63 Chapter 6. Conclusions .................................................................................................................67 References and Included Studies ...................................................................................................69 List of Acronyms/Abbreviations....................................................................................................77
Figures Figure 1. Analytic framework for evidence report .......................................................................18 Figure 2. Model structure..............................................................................................................52 Figure 3. Model results at 6 weeks for response rate....................................................................55 Figure 4. Model results at 6 weeks for quality adjusted life.........................................................56

ix
Tables Table 1. Effects of genetic polymorphisms of CYP enzyme genes on drug metabolism...........13 Table 2. Allele frequencies of CYP2D6 variants in selected populations..................................14 Table 3. SSRI inhibition of CYP enzymes .................................................................................15 Table 4. Results of abstract screening and full-text review........................................................22 Table 5. Included full-text articles by key question....................................................................22 Table 6. Analytic sensitivity and specificity for tests of CYP2D6 polymorphisms – by variant ......................................................................................................................28 Table 7. Analytic sensitivity and specificity for tests of CYP2D6 polymorphisms – by gene copy number ....................................................................................................32 Table 8. Analytic sensitivity and specificity of tests for CYP2C19 polymorphisms .................34 Table 9. Analytic sensitivity and specificity of tests for CYP2C8 polymorphisms ...................35 Table 10. Analytic sensitivity and specificity of tests for CYP1A1 polymorphisms ...................35 Table 11. CYP450 genotypes and metabolism of SSRIs in healthy volunteers ...........................37 Table 12. CYP450 predicted phenotypes and metabolism of various SSRIs in clinical populations .......................................................................................................39 Table 13. Confidence intervals for differences in mean SSRI levels between extensive metabolizers (EMs) and comparison groups.................................................................40 Table 14. CYP450 predicted phenotypes and efficacy of SSRIs..................................................44 Table 15. Prevalence of CYP2D6 predicted phenotypes in non-responders to antidepressant treatment………....................................................................................45 Table 16. CYP450 predicted phenotypes and adverse effects associated with SSRIs .................47 Table 17. Basic model parameter estimates..................................................................................53 Table 18. Model parameters for the relationship between testing and predicted clinical response.........................................................................................................................53 Appendixes Appendix A: Exact Search String Appendix B: List of Excluded Studies Appendix C: Sample Data Abstraction Forms Appendix D: Evidence Tables Appendix E: Quality Assessment Tools Appendix F: Peer Reviewers Appendixes (including Evidence Tables) for this report are provided electronically at www.ahrq.gov/clinic/tp/cyp450tp.htm.


1
Executive Summary
Introduction
Major depressive disorder (MDD) is widely distributed in the population and is associated
with substantial symptom severity and role impairment. It is the fourth leading cause of disease burden, accounting for 4.4 percent of total disability-adjusted life years in the year 2000, and it causes the largest amount of non-fatal burden, accounting for almost 12 percent of all total years lived with disability worldwide. In naturalistic studies of followup of depression, almost 60 percent of patients show either residual symptoms or no response to treatment at the end of 1 year.
Selective serotonin reuptake inhibitors (SSRIs) have become first-line drugs in the treatment of depression partly because of their better tolerability and relative safety in overdose compared with older tricyclic antidepressants. The response rate to SSRIs in short-term trials is approximately 50 to 60 percent. As with other antidepressants, a primary limitation of SSRIs is time to response, with most SSRIs showing a benefit only after 2 to 4 weeks of adequate dosing. In addition, even this class of drugs is associated with intolerable adverse effects necessitating discontinuation of medication in 12 to 15 percent of patients in short-term studies. Because of variable efficacy and tolerability among patients, SSRIs are usually titrated through a process of trial and error, potentially further lengthening the time to response.
The cytochrome P450 (CYP450) enzymes are an isoenzyme superfamily that catalyze the oxidation of many drugs and chemicals. The CYP450 enzymes – primarily CYP2D6, CYP2C19, and CYP2C9 – are involved in the metabolism of all of the SSRIs. Genetic polymorphisms have been identified for some of the CYP450 enzyme genes, with inactivating alleles that may decrease or eliminate enzyme activity, or multiple copies of functional genes that may increase enzyme activity. There has been increasing interest in the role of genetic polymorphisms of CYP450 enzymes in metabolism of SSRIs, and several tests are now available to test for CYP450 polymorphisms. A significant recent development was the approval by the U.S. Food and Drug Administration (FDA) of the Roche AmpliChip® CYP450 Test for this purpose. This product delivers the results of testing for CYP2D6 and CYP2C19 polymorphisms in the form of “predicted phenotypes” – poor metabolizers (PMs), intermediate metabolizers (IMs), extensive metabolizers (EMs), and ultra-rapid metabolizers (UMs). The availability of these tests has brought the field of pharmacogenetics to the threshold of influencing clinical practice.
The Agency for Healthcare Research and Quality (AHRQ), on behalf of the Centers for Disease Control and Prevention (CDC) Evaluation of Genomic Applications in Practice and Prevention (EGAPP) Project, requested the development of the present evidence report, which will be used to inform the EGAPP Working Group’s formulation of evidence-based recommendations.
A team of investigators at the Duke Evidence-based Practice Center comprised of experienced investigators in health policy, psychiatry, and pharmacogenetics, developed the report, which provides a clear view of the current state of the science in CYP450 polymorphism testing in depression, and – where research is now insufficient for policy decisionmaking – proposes a list of rational research priorities.

2
Methods
Working with AHRQ, the CDC, and members of the project’s technical expert panel, we developed the following key research questions:
• Question 1: Does testing for CYP450 polymorphisms in adults entering SSRI treatment
for non-psychotic depression lead to improvement in outcomes, or are testing results useful in medical, personal, or public health decisionmaking? (overarching question)
• Question 2: What is the analytic validity of tests that identify key CYP450
polymorphisms?
• Question 3a: How well do particular CYP450 genotypes predict metabolism of particular SSRIs? Do factors such as race/ethnicity, diet, or other medications, affect this association?
• Question 3b: How well does CYP450 testing predict drug efficacy? Do factors such as
race/ethnicity, diet, or other medications, affect this association?
• Question 3c: How well does CYP450 testing predict adverse drug reactions? Do factors such as race/ethnicity, diet, or other medications, affect this association?
• Question 4a: Does CYP450 testing influence depression management decisions by
patients and providers in ways that could improve or worsen outcomes?
• Question 4b: Does the identification of the CYP450 genotypes in adults entering SSRI treatment for non-psychotic depression lead to improved clinical outcomes compared to not testing?
• Question 4c: Are the testing results useful in medical, personal or public health
decisionmaking?
• Question 5: What are the harms associated with testing for CYP450 polymorphisms and subsequent management options?
We also developed a project-specific analytic framework that provides an explicit link
between CYP450 testing and various health outcomes of importance to decisionmakers. We searched MEDLINE® (1966-May 2006), the Cochrane Database of Abstracts of Reviews
of Effects (DARE), PsychInfo, HealthSTAR, and CINAHL. Searches of these databases were supplemented by reviews of the reference lists contained in all included articles and in relevant review articles. Documents from the FDA that could be publicly accessed were also included. The searches yielded a total of 1,200 citations. Pairs of researchers independently reviewed each abstract and selected 140 for full-text review. Project-specific inclusion/exclusion criteria were developed, and both researchers were required to agree on inclusion status at the full-text stage. A total of 37 articles were included for data abstraction.

3
Evidence tables were developed, and data abstraction was carried out by one investigator and checked for accuracy and completeness by another. At the data abstraction stage, researchers were asked to evaluate each included article for factors affecting internal and external validity using guidelines from ACCE criteria for analytic validity (for Question 2) and by the Oxford Centre for Evidence-based Medicine (for all other key questions).
The draft version of this report was reviewed by a panel of experts vetted by AHRQ, and reviewer comments and suggestions have been incorporated into the final report.
Results
Results are summarized below by key question.
Question 1 (Overarching Question)
No studies were identified that directly addressed any aspect of Question 1. Question 2 (CYP450 Test Analytic Validity)
We identified 12 published articles and two documents from the FDA website (on performance of the Roche AmpliChip®) that described methods for genotyping various CYP450 enzymes (nine pertaining to CYP2D6, three to CYP2C19, two to CYP2C8, and one each to CYP2C9 and CYP1A1). Of the studies of CYP450 enzymes most relevant to SSRI metabolism (CYP 2D6, 2C19, and 2C9), only four used the gold standard comparison (DNA sequencing), while others were methods comparisons. Notably, very few of the known polymorphisms of the CYP enzymes were tested. Sensitivity and specificity were high (in the range of 94 to 100 percent) for these studies, but confidence intervals for analytic sensitivity for most genotypes were very wide because of the relatively few samples tested. Gene deletion and duplication studies had lower sensitivity and specificity, further compounded by the limitation that there is no accepted gold standard for such tests. Question 3a (CYP450 Genotypes and Metabolism of SSRIs)
Sixteen studies met our inclusion criteria, of which five were conducted in healthy adults after a single dose of an SSRI. Of these, three showed that CYP2C19 PMs have significantly higher area under the curve (AUC), longer half-life, and reduced oral clearance of the parent drug, and significantly lower AUC, and lower maximum plasma concentration (Cmax) of the metabolite of each drug than EMs (drugs studied were sertraline, fluoxetine, and citalopram). Similar results were found in a study of CYP2D6*10 (associated with PM status) in healthy volunteers after a single dose of paroxetine, while another study of CYP2D6 using multiple doses of paroxetine found no significant difference between PMs and EMs. The remaining 11 studies were in clinical patients in treatment with SSRIs, were heterogeneous, had small sample sizes, and showed mixed results with respect to the association between CYP2D6/CYP2C9/ CYP2C19 polymorphisms and SSRI blood levels.

4
Question 3b (CYP450 Testing and Efficacy of SSRIs)
We identified only five studies, three of which involved cohorts of depressed patients in antidepressant treatment. Of these, one found no differences in the proportion of responders among CYP2D6 EMs, IMs, and PMs treated with fluvoxamine. The second found that although plasma concentrations varied significantly between groups (with respect to 2D6 and 2C9 metabolizer status), levels above or below the lower limit of presumed therapeutic levels did not predict response. The third found no differences in depression scores between two groups, CYP2D6 UMs + EMs versus PMs + IMs, treated with paroxetine. The other two studies found significantly higher proportions of CYP2D6 PMs in non-responders to CYP2D6 metabolized SSRIs compared to the general population. The studies had several limitations including non-randomized designs, inadequate power, studying several SSRIs together as a group, and not accounting for other genetic factors that may influence SSRI efficacy (e.g., genetic variations in serotonin transporter proteins or serotonin receptor proteins). Question 3c (CYP450 Testing and Adverse Drug Reactions)
We identified nine studies, three of which reported adverse effects in CYP PMs only as a secondary finding. Of the other six, three reported no differences in rates of adverse effects between CYP2D6 PMs and EMs, while a fourth reported no differences in adverse effects between the combined PM + IM and EM + UM groups. One study found a greater prevalence of gastrointestinal adverse effects in PMs compared to EMs. This study also found that the combination of CYP2D6 polymorphism and serotonin receptor 5HT2A polymorphism predicted gastrointestinal adverse effects. Two studies found a significantly higher prevalence of PMs in depressed patients with adverse effects than in the general population. The studies had several limitations including non-randomized design, inadequate power, and not accounting for other genetic factors that may influence SSRI tolerability (e.g., genetic variations in serotonin receptor proteins). Questions 4 and 5 (Management Decisions, Clinical Outcomes, Decisionmaking, and Harms)
No studies were identified that directly addressed any aspect of these questions. Model of Treatment for Major Depression As a complement to the evidence review, we constructed a basic decision model to consider the circumstances under which testing for CYP polymorphisms could improve clinical outcomes, or favorably impact costs. We examined four strategies: (1) use a non-CYP metabolized SSRI without testing; (2) test and choose a non-CYP or CYP metabolized SSRI based on the result; (3) test and choose the dose of a CYP metabolized SSRI based on the result; and (4) use a CYP metabolized SSRI without testing. In no plausible scenario was a testing strategy predicted to improve expected outcomes of treatment at 6 weeks. The efficacy of a test strategy could approach the efficacy of use of a non-CYP metabolized drug, although this required the condition that a high correlation exist between genotype and phenotype (metabolizer status), as

5
well as between phenotype and clinical outcomes. Current evidence does not support the conclusion that such high correlations apply. Moreover, the cost of testing is not offset by treatment savings if treatment duration is less than approximately 9 months.
Discussion
Our literature review revealed a paucity of high-quality clinical studies addressing the key
questions. We did not find a single prospective study of CYP450 genotyping and its relationship to clinical outcomes. General limitations of the available evidence include:
• Most studies were small, poor-quality studies examining prevalence rates of certain
genotypes in a sample or examining the correlation between various genotypes and limited clinical outcomes, such as response or adverse effects.
• There were no randomized studies of alternative testing strategies.
• Many reports did not take into account concurrent medications. No studies examining
interactions between CYP polymorphisms and CYP inhibiting or CYP inducing drugs were identified.
• Several studies looked at limited genotypes and did not account for the fact that more
than one CYP enzyme may be involved in the metabolism of a specific SSRI.
• Several studies grouped together multiple SSRIs, or SSRIs with other antidepressants such as tricyclics.
• Genetic factors affecting serotonin receptor proteins, membrane transporters, and signal
transduction molecules have important pharmacodynamic effects that could affect SSRI efficacy or tolerability. These were not taken into account in any of the studies.
The rated quality of data did not improve even when we were generous in our inclusion
criteria and included studies examining SSRI treatment of conditions other than depression, or when we included studies including other antidepressants in addition to SSRIs. The available data indicate good analytic validity for testing for CYP2D6 and CYP2C19 polymorphisms, but for a limited number of variants, with rare variants being tested infrequently. The data fail to support a clear correlation between CYP polymorphisms and SSRI levels, SSRI efficacy, or tolerability. There are no data regarding whether testing leads to improved outcomes versus not testing in the treatment of depression; whether testing influences medical, personal, or public health decisionmaking; or whether any harms are associated with testing itself or with subsequent management options.

6
Future Research
We propose the following conceptual model to guide future research in cytochrome P450 (CYP450) polymorphism testing for depression management. Broadly speaking, the rationale behind CYP450 testing in patients with non-psychotic depression is as follows:
(a) Major depressive disorder is a significant public health problem. (b) While SSRIs are the first-line treatment for depression, they are associated with a high
rate of non-response to treatment, harboring a potential opportunity to improve public health by improving response rates to SSRI treatment.
(c) One factor that makes identification of the optimal SSRI treatment difficult in a specific
clinical situation is the CYP polymorphism-associated differences between patients in the rate of metabolism of SSRIs.
(d) CYP450 testing can be used to predict the rate of SSRI metabolism (i.e., to classify
patients as PMs, IMs, EMs, or UMs) and, thus, potentially can reduce the amount of trial and error required to select the optimal SSRI in a specific clinical situation.
(e) The better CYP450 testing predicts metabolizer status, the greater the potential of
CYP450 testing to improve the process of identifying the optimal SSRI treatment.
(f) However, the more that factors other than CYP450 enzymes affect the metabolism of SSRIs, the less useful CYP450 testing will be.
(g) Because depression is not often acutely life-threatening and SSRIs are rarely associated
with life-threatening adverse effects, the main impact of CYP450 testing is likely to be in reducing the time to find the optimal SSRI, and in reducing the likelihood of adverse effects that would have been expected to occur with a suboptimal SSRI that might have been prescribed in the absence of CYP450 testing, thereby potentially reducing disease-management costs.
(h) Finally, the impact of reducing the time to find the optimal SSRI and reducing the
likelihood of SSRI-related adverse effects during the initial dosing period is strong enough to be important to patients.
Although some information regarding the above rationale exists, as a whole it is not
sufficient to draw firm conclusions about whether this rationale, while intuitively reasonable, is in fact true. Based on this model, two types of studies are proposed. The first type would better elucidate individual points in the rationale. For example, regarding points (e), (f), and (g), the suggested study design would be a properly sized (likely to be large) randomized trial of CYP genotyping-guided treatment versus treatment as usual. The second type of study would encompass multiple steps in the above rationale. Examples include a study that would involve linking a specific genotype to SSRI type and dose, or a “practical clinical trial,” which would involve randomizing clusters (e.g., clinicians, practices, or regions) rather than patients to have

7
genotyping available or not available. This would provide a test of the overarching question, “What difference does having genotyping available make in clinical practice?”
Conclusions
The short list of papers addressing the key questions clearly demonstrates the lack of
sufficient evidence for incorporation of any of these tests into guidelines for clinical practice in depression management. There is a critical need to carry out research to answer the key questions in this report. If shown to be useful, CYP450 genotyping will make the most impact by reducing the trial and error currently inherent in SSRI treatment, thereby decreasing morbidity and improving quality of life in patients with non-psychotic depression.


EVIDENCE REPORT


11
Chapter 1. Introduction
Major Depressive Disorder
Major depressive disorder (MDD) is widely distributed in the population and is usually associated with substantial symptom severity and role impairment. The lifetime prevalence of MDD by recent population study estimates is as high as 16 percent, with an annual prevalence rate of approximately six percent.1 The condition is twice as common in females as in males. MDD is the leading cause of disability in the United States and is predicted to become the second leading cause of disability worldwide in the next 15 years.2 Depression is the fourth leading cause of disease burden, accounting for 4.4 percent of total disability-adjusted life years in the year 2000, and it causes the largest amount of non-fatal burden, accounting for almost 12 percent of all total years lived with disability worldwide.3 The suicide rate associated with MDD is approximately four percent.4
The course of MDD differs a great deal among affected individuals. The average age of onset of major depression is in the mid-20s, but the first episode may occur at any age. The disease course is highly variable, and generally the number of previous episodes predicts the likelihood of having another episode. For example, 50 to 60 percent of patients with a first episode of depression will have a second episode, and those with two episodes have a 70 percent chance of having a third. After the third episode, the chance of having a fourth is 90 percent.5 Data for over 15,000 employees of a major U.S. corporation showed that depressive illness was associated with a mean of 9.86 annual sick days, significantly more than any of the other medical conditions examined.6 In a naturalistic study of followup of depression (in which treatment was not controlled by the investigators), 20 percent of patients continued to show no evidence of achieving remission, 40 percent showed partial remission, and 40 percent had no evidence of mood disorder at the end of 1 year.7 In the recently completed STAR*D trial, the response rate (rate of improvement in symptoms) was 47 percent and the remission rate (rate of substantial improvement, with only minimal residual symptoms) only 33 percent after 14 weeks of treatment with a selective serotonin reuptake inhibitor (SSRI).8 The high rate of non-response in MDD is one of the biggest challenges in psychiatry as it impacts disease burden.
Selective Serotonin Reuptake Inhibitors (SSRIs)
in the Treatment of MDD
The advent of the SSRI class of drugs has dramatically changed the landscape of depression treatment. SSRIs have quickly superseded the older tricyclic antidepressants to become first-line drugs in the treatment of depression. The SSRIs currently available on the market include fluoxetine, paroxetine, fluvoxamine, sertraline, citalopram, and escitalopram. Of the top 25 prescription drugs in the U.S. in 2004, two were SSRIs: Zoloft® (sertraline), with over 29 million prescriptions, and Lexapro® (escitalopram), with over 22 million prescriptions.9 Of the SSRIs, fluoxetine and (more recently) citalopram are available in generic forms. Fluoxetine is the only SSRI with an active metabolite (in the form of norfluoxetine) that is more potent in serotonin reuptake inhibition than the parent compound and which is thought to play a significant role in therapeutic effect.10 Moreover, fluoxetine is a racemic mixture of S- and R-fluoxetine,

12
with both enantiomers being approximately equipotent in serotonin reuptake inhibition. However, of the enantiomers of their respective metabolites, S-norfluoxetine has significant serotonin reuptake inhibition and is 20 times more potent than R-norfluoxetine.11
The popularity of SSRI drugs has been attributed to their better tolerability and relative safety in overdose, which is an important consideration when treating depressed patients who may become suicidal. However, SSRIs are not without drawbacks. In addition to the high rates of non-response described above, another limitation of SSRI treatment of depression is the time to response, with most SSRIs starting to show benefit only after 2 to 4 weeks of adequate dosing. In the STAR*D trial, the majority of patients who achieved response or remission did so after 8 weeks of SSRI treatment.8 In addition, even this class of drugs is associated with intolerable adverse effects (such as nausea, diarrhea, or headaches) necessitating discontinuation of treatment in 12 to 15 percent of patients in short-term studies.12,13 Because of variable efficacy and tolerability among patients, the SSRIs are generally titrated by trial and error, potentially further lengthening the time to response. Additionally, when a drug is discontinued as a result of intolerability, it can result in a “lost opportunity” to treat a condition such as depression that is associated with stigma. Therapeutic Drug Monitoring in SSRI Treatment
In general, no clear relationship has been found between blood concentration and clinical response with SSRIs at usual doses, nor has any threshold been identified that defines toxic concentrations. Citalopram showed no significant correlation between steady-state plasma concentration and final Montgomery-Åsberg Depression Rating Scale (MADRS) scores (measure of response) in two studies, with numbers of patients ranging from 13 to 16, and doses ranging from 5 to 60 mg/d.14,15 Paroxetine studies have found no statistically significant differences in plasma levels of paroxetine between responders and non-responders.16 No correlation has been found between Hamilton Rating Scale for Depression (HAM-D) scores (measure of response) and plasma levels of paroxetine. Studies had numbers of subjects ranging from 16 to 44, and doses from 20 to 60 mg/day.17-19 Similarly, studies of fluoxetine with small numbers of patients have suggested either no relationship between plasma concentration of the drug and clinical response,20,21 or have suggested a curvilinear relationship between clinical response and plasma concentrations.22-24 The limitation of most of these studies is that they may not have been adequately powered. Perhaps the biggest study of plasma concentration and response has been of fluoxetine,25 a multicenter study in which plasma concentrations were available for 615 patients receiving 20 mg/day of fluoxetine. No apparent relationship was observed between plasma concentration and drug response, and plasma concentrations of fluoxetine, norfluoxetine, active moiety, or fluoxetine/norfluoxetine ratio did not differ between responders and non-responders. This is probably the only study with adequate power to be meaningful. However, one limitation of this study was the fact that it was a fixed dose study of fluoxetine at 20 mg/day, raising the possibility that a dose-response relationship could exist at higher doses, or a threshold effect may be possible at lower doses.
Adverse effects of SSRIs, although not generally life-threatening, are typically dose-related. Therapeutic drug monitoring is not routinely recommended for SSRI treatment, but is thought to be of value for ascertaining compliance, for patients who do not respond to multiple SSRIs, or have poor tolerability.26

13
Cytochrome P450 Enzyme System
The cytochrome P450 (CYP450) enzymes are members of an isoenzyme superfamily that catalyzes the oxidation of many drugs and chemicals. These enzymes are variably distributed in tissues, but are mainly present in the liver, which is the site of first phase metabolism for many drugs. Genetic polymorphisms have been identified for some of the CYP450 enzyme genes that alter enzyme activity, with inactivating alleles that markedly decrease or eliminate enzyme activity (the latter also called deficient activity). Individuals carrying combinations of decreased activity alleles are referred to as intermediate metabolizers (IMs), while individuals homozygous or compound heterozygous for the deficiency alleles are defined as poor metabolizers (PMs), reflecting the extent of decrease in activity. Alleles carrying multiple copies of functional genes, on the other hand, lead to increased enzyme activity, with individuals expressing these alleles termed ultra-rapid metabolizers (UMs). Phenotypically, this may translate into differing rates of metabolism of drugs with potential for toxicity or lack of efficacy. Table 1 outlines how function-altering genetic polymorphisms in CYP450 enzymes may affect drug metabolism. Note that for a “prodrug,” which is converted into its active form only after metabolism by CYP2D6, the drug effects will be in the opposite direction, e.g., PMs will show lower than expected efficacy due to lower than expected levels of active metabolite. Thus, Table 1 assumes that the metabolite resulting from the CYP metabolism is less active or inactive in comparison with the parent drug. Additionally, Table 1 applies only to those drugs where the CYP enzyme is the primary route by which the drug is metabolized.
Table 1. Effects of genetic polymorphisms of CYP enzyme genes on drug metabolism
Metabolizer status Genotype Expected drug effects
UM (ultra-rapid) More than two copies of active enzyme gene alleles
Usual doses may not lead to therapeutic drug concentration, possible non-response
EM (extensive) Two copies of active enzyme gene alleles Usual doses lead to expected drug concentrations and response
IM (intermediate) Homozygous for two reduced activity enzyme gene alleles or are heterozygous for an inactive allele and a reduced activity allele
Drug effects between those of EMs and PMs
PM (poor) Homozygous or compound heterozygous for deficiency alleles
Usual doses may lead to higher than expected drug concentrations and possibly adverse reactions
Abbreviations: EM(s) = extensive metabolizer(s); IM = intermediate metabolizer; PM(s) = poor metabolizer(s); UM = ultra-rapid metabolizer
There are racial differences in function-altering polymorphisms. For example, approximately seven percent of Caucasians are CYP2D6 PMs, whereas only one to two percent of Asians and two to four percent of African-Americans are PMs.27 In contrast, 10 percent of southern Europeans have duplication of the CYP2D6 gene, which is associated with the ultra-rapid phenotype. There are sizeable data regarding specific CYP variants and their predicted enzymatic function. Much of these data are based on how a particular variant affects metabolism of a “probe drug.” A probe drug for a given CYP enzyme is a drug that is exclusively metabolized by that CYP enzyme (e.g., dextromethorphan by CYP2D6), is non-toxic, and can be

14
easily measured in serum or urine. Metabolism of the probe drug is used for phenotyping CYP enzymes, but the process is time-consuming and can be influenced by concurrent medications or diet. Table 2 provides examples of allele frequencies of CYP enzyme variants in different ethnic groups.
Table 2. Allele frequencies of CYP2D6 variants in selected populations
CYP2D6 variant
Predicted enzymatic function
Caucasian (Europe)27
Caucasian (U.S.)27
African- American27
Swedish28
*1 Normal 33-36% 27-40% 29-35% 36.7%
*2 (35%) Normal 22-33% 26-34% 18-27% 32.4%
*3 Deficient 1-4% 1-1.4% < 1% 1.4%
*4 Deficient 12-23% 18-23% 6-9% 24.4%
*5 Deficient 2-7% 2-4% 6-7% 4.3%
*6 Deficient 1-1.4% 1% < 1% 0.9%
*9 Decreased activity 0-2.6% 2-3% < 1% -
*10 Decreased activity 1.4-2% 2-8% 3-8% -
*17 Decreased activity < 1% < 1% 15-26% -
*41 Decreased activity 20% - - -
*1xN Increased activity < 1% < 1% 1.3% -
*2xN Increased activity 1.5% < 1% 1.3% -
*4xN Deficient < 1% < 1% 2.3% -
The CYP450 enzymes – primarily CYP2D6, CYP2C19, and CYP2C9 – are involved in the
metabolism of all of the SSRIs.29 It is important to note that enzymes other than CYP are also involved in SSRI metabolism,30,31 and for a given SSRI, more than one CYP enzyme may be involved in its metabolism.32,33 Additionally, it is noteworthy that CYP2D6 with identical pharmacologic and molecular properties has been identified in microsomal fractions in the brain. Hence, CYP2D6 may potentially contribute to local clearance of psychotropics at the site of action. Differences in personality traits between extensive metabolizers (EMs) and PMs were noted in both Swedish and Spanish healthy white subjects, also suggesting that there may be an endogenous substrate for CYP2D6 in the brain.34
Another key issue in terms of clinical practice is the incidence of drug interactions. Several SSRIs are potent inhibitors of some CYP450 enzymes; for example, 2D6 is substantially inhibited by fluoxetine and paroxetine. Not all SSRIs inhibit all CYP enzymes equally. Table 3 provides information about extent of inhibition of CYP enzymes by individual SSRIs.

15
Table 3. SSRI inhibition of CYP enzymes*
CYP enzyme Citalopram Fluoxetine Fluvoxamine Paroxetine Sertraline
CYP1A2 +/- + +++ + +/-
CYP2C9/10 ? ? ? ? +
CYP2C19 ? ++ +++ +
CYP2D6 + +++ + +++ +
CYP3A4 ? ++ ++ +/- +/- * Table 3 adapted with permission from Harvey and Preskorn, 1996.35 Additional information derived from Gram et al., 1993;36 Skjelbo and Brosen, 1992;37 and Rasmussen et al., 1995.38 Key to symbols: +/- = unlikely; ? = unknown; + = mild; ++ = moderate; +++ = substantial
SSRI inhibition of a CYP enzyme can raise serum concentrations of drugs metabolized by
that enzyme. Because SSRIs are commonly prescribed to patients with medical comorbidities who may be on multiple other medications, CYP polymorphisms may increase the likelihood or severity of such drug-drug interactions.
Currently there are no well-defined strategies regarding SSRI selection in individual patients, and this may contribute to low efficacy and an increased risk of side effects. Knowledge about CYP polymorphisms could potentially aid the selection of a specific SSRI and/or guide decisions about appropriate dosing to optimize efficacy and tolerability for individual patients.
Genetic Testing for Key CYP450 Polymorphisms
Several companies offer genetic testing for CYP450 polymorphisms using different test
formats. These have mainly supported clinical trials and to a smaller extent patient management. The Blue Cross and Blue Shield Association Technology Evaluation Center report on CYP450 genotyping39 offers the most current compilation of such tests. Additionally, laboratories may develop and validate their own tests for CYP450 genotyping that are required to meet Clinical Laboratory Improvement Amendment (CLIA) standards. A significant recent development was the approval by the U.S. Food and Drug Administration (FDA) of the Roche AmpliChip® CYP450 Test for this purpose.40,41 The AmpliChip® delivers the results of testing for CYP2D6 and CYP2C19 polymorphisms in the form of “predicted phenotypes,” classifying test subjects as PMs, IMs, EMs, or UMs. There are currently no guidelines regarding how testing for polymorphisms, and the knowledge such testing yields about predicted phenotypes, can be incorporated into clinical practice, and little information about whether such testing produces any real benefits at all.
Utility of CYP Genotyping in Treatment of MDD With SSRIs
There has been increasing interest in the role of genetic polymorphisms of CYP450 enzymes
and metabolism of SSRIs in relation to clinical practice.29,42,43 The availability of an FDA-approved test for identifying CYP450 polymorphisms has brought the field of pharmacogenetics to the threshold of influencing clinical practice, as advertising in leading journals exposes physicians to the availability of tests. Given the prevalence of MDD and the prevalence of SSRI

16
treatment of MDD, there is an urgent need to critically review the available literature using standard methods of evidence-based medicine to inform the future use of genetic testing in the treatment of MDD with SSRIs, as well as to guide research priorities in service to optimal patient care.
The Agency for Healthcare Research and Quality (AHRQ), on behalf of the Centers for Disease Control and Prevention (CDC) Evaluation of Genomic Applications in Practice and Prevention (EGAPP) Project, requested the development of the present evidence report on “Testing for Cytochrome P450 Polymorphisms in Adults with Non-Psychotic Depression Treated with Selective Serotonin Reuptake Inhibitors (SSRIs).” The report will be used to inform the EGAPP Working Group’s deliberations in a process similar to that used by the U.S. Preventive Services Task Force (USPSTF) to formulate evidence-based recommendations.
A team of investigators at the Duke Evidence-based Practice Center, comprised of experienced investigators in health policy, psychiatry, and pharmacogenetics, have developed the report. The approach included developing an analytic framework concerning testing for CYP450 polymorphisms and treatment related to depression and performing a comprehensive literature review linked to this framework. The report provides a clear view of the current state of the science in CYP450 polymorphism testing in depression, and – where research is now insufficient for policy decisionmaking – proposes a list of rational research priorities. Further, the report provides a framework for evaluating the general issue of genetic testing for decisionmaking in depression treatment.

17
Chapter 2. Methods
This section of the report describes the basic methodology used to develop the evidence report, including topic assessment and refinement, analytic framework, literature search strategies and results, literature screening, quality assessment, data abstraction methods, and quality control procedures.
Topic Assessment and Refinement
The two study sponsors, the Agency for Healthcare Research and Quality (AHRQ) and the
Centers for Disease Control and Prevention (CDC), originally identified five key questions to be addressed by the report. The Duke research team clarified and refined the overall research objectives and key questions by first consulting with these sponsors and then by convening a national panel of technical experts to serve as advisors to the project. These experts were selected to represent relevant specialties, including genomics and neuropsychiatry. Members of the technical expert panel were:
Kathryn A. Phillips, Ph.D., University of California, San Francisco, CA (member of the CDC Evaluation of Genomic Applications in Practice and Prevention [EGAPP] Working Group) Margaret Piper, Ph.D., M.P.H., B.C.B.S.A., Atlanta, GA (EGAPP Working Group member) Ora Strickland, Ph.D., Emory University, Atlanta, GA (EGAPP Working Group member) Dan G. Blazer, M.D., Ph.D., Duke University Medical Center, Durham, NC Stephen Stahl, M.D., Ph.D., Neuroscience Education Institute, Carlsbad, CA The Duke research team refined the key questions as follows: Question 1 (overarching question): Does testing for cytochrome P450 (CYP450) polymorphisms in adults entering selective serotonin reuptake inhibitor (SSRI) treatment for non-psychotic depression lead to improvement in outcomes, or are testing results useful in medical, personal, or public health decisionmaking? Question 2: What is the analytic validity of tests that identify key CYP450 polymorphisms? Question 3a: How well do particular CYP450 genotypes predict metabolism of particular SSRIs? Do factors such as race/ethnicity, diet, or other medications, affect this association? Question 3b: How well does CYP450 testing predict drug efficacy? Do factors such as race/ethnicity, diet, or other medications, affect this association? Question 3c: How well does CYP450 testing predict adverse drug reactions? Do factors such as race/ethnicity, diet, or other medications, affect this association?

18
Question 4a: Does CYP450 testing influence depression management decisions by patients and providers in ways that could improve or worsen outcomes? Question 4b: Does the identification of the CYP450 genotypes in adults entering SSRI treatment for non-psychotic depression lead to improved clinical outcomes compared to not testing? Question 4c: Are the testing results useful in medical, personal or public health decisionmaking? Question 5: What are the harms associated with testing for CYP450 polymorphisms and subsequent management options?
Analytic Framework
The methodological approach to this review was designed to inform the EGAPP Working
Group’s deliberations in formulating evidence-based recommendations for the use of genetic testing in depression treatment decisionmaking. With input from the EGAPP Working Group, we developed a project-specific analytic framework (Figure 1) to address the key questions within the context of a standardized evidence report. Figure 1. Analytic framework for evidence report
Adults with non-psychotic depression entering therapy with SSRI
CYP450genotypeTesting
Metabolizerstatus
(phenotype)
Improved in:•Depression•Quality of life•Other (e.g., work absenteeism)
Harms of subsequent
management options
5
Incorrect genotype
assignment
2 3a
1
Predicted risk for
adverse drug
reactions
Predicted drug
efficacy
3c
3bTreatmentdecisions
4a,b,c
Note to Figure 1: Numbers refer to key questions.

19
Within the domain of testing and depression management, the analytic framework depicted in Figure 1 provides an explicit link between the use of the test and the various health outcomes of importance to decisionmakers. Such a framework also serves to clarify the relevant key questions (numbers in the figure refer to key questions):
• Question 1 poses the overarching question of whether testing for CYP450
polymorphisms before SSRI treatment in non-psychotic depressed adults improves outcomes. Any evidence relating to this question would be “direct” evidence for the purpose of decisionmaking. In the absence of compelling direct evidence of this type, it is relevant to consider the component questions (Questions 2 through 5).
• Question 2 examines the ability of clinically available tests for CYP450 polymorphisms
to detect genetic variations in the CYP450 genes. This is a question of analytic validity that compares available tests to the gold standard of DNA sequencing. Issues related to harms due to misclassification are addressed in Question 5, below.
• Questions 3a, 3b, and 3c concern the relationship between CYP genotypes or their
predicted phenotypes and metabolism of individual SSRIs, efficacy of SSRIs in depression treatment, and adverse effects associated with SSRIs, respectively. These questions relate to clinical validity. Additionally, they address surrogate outcomes in depression management. Efficacy of SSRIs is a surrogate outcome measured by change in depression scores on depression rating scales such as the Hamilton Rating Scale for Depression (HAM-D)44 or the Montgomery-Åsberg Depression Rating Scale (MADRS).45
• Questions 4a and 4c examine the influence of CYP genotyping on management decisions
by patients or providers, and on medical, personal, or public health decisionmaking, respectively. Both of these are surrogate outcomes. Question 4b addresses whether such testing improves outcomes in depression management versus not testing. Examples of health outcomes of depression include health associated quality of life measured by the Medical Outcomes Study 36-Item Short Form Health Survey (SF-36),46 the Sheehan Disability Scale,47 or the Quality of Life Enjoyment and Satisfaction Questionnaire (QLESQ).48 Economic outcomes may include healthcare utilization or absenteeism related to depression. These questions concern decisionmaking at both individual and societal levels. These questions relate to clinical utility and raise the most important aspects of Question 1.
• Question 5 addresses the potential harms associated with CYP testing itself and with
subsequent management options. Potential harms could include labeling of patients as “treatment resistant” if they are found to be ultra-rapid metabolizers of relevant drugs, or harms could result from basing treatment decisions on inaccurate test results. As such, this question relates to both surrogate and health outcomes.

20
Literature Search and Review
Sources
The primary source of literature was MEDLINE® (1966-May 2006). Additional databases searched included the Cochrane Database of Abstracts of Reviews of Effects (DARE), PsychInfo, HealthSTAR, and CINAHL. Searches of these databases were supplemented by reviews of the reference lists contained in all included articles and in relevant review articles. We also included data from the U.S. Food and Drug Administration (FDA) website describing the operating characteristics of the Roche AmpliChip® CYP450 Test.40,41 On the advice of our technical expert panel, we did not undertake a comprehensive search of the grey literature.
Search Strategies
The basic search strategy used the National Library of Medicine’s Medical Subject Headings (MeSH) key word nomenclature developed for MEDLINE.® Searches were limited to articles published in English. The exact search string used is given in Appendix A.∗ The searches yielded a total of 1,200 citations, whose records are maintained in a ProCite (Thompson ISI ResearchSoft, Berkeley, CA) database. Abstract and Full-Text Screening
Paired researchers from the Duke research team independently reviewed all abstracts and classified each as “included” or “excluded” according to project-specific criteria, which they developed. The exclusion criteria were:
• Single case. • SSRI inhibition of CYP enzymes (unless the study examines how this is related to
genotype).
• Outside the scope of the report. An abstract was included for further review if at least one of the paired reviewers
recommended that it be included. A total of 140 abstracts were included for review at the full-text stage. Inter-rater reliability for include/exclude decisions at the abstract stage was tested by having five pairs of readers review 862 abstracts. Agreement (kappa statistic) ranged from -0.037 to 0.613.49
At the full-text review stage, paired researchers independently reviewed the articles and indicated a decision to “include” or “exclude” the article for data abstraction. When two reviewers returned different decisions about whether to include or exclude an article, they were asked to reconcile the difference. Detailed full-text exclusion criteria are listed immediately below. ∗ Appendixes cited in this report are provided electronically at www.ahrq.gov/clinic/tp/cyp450tp.htm.

21
Full-Text Screening Criteria
Studies were excluded at the full-text screening stage if any of the following applied: • Single case. • Patient age < 18 years.
• No gold standard comparison or methods comparison (for articles on analytic validity).
• Study falls outside study scope (e.g., there were several good reviews, including one
that made pharmacogenetics-based therapeutic recommendations,50 that did not answer any of the key questions directly).
At the full-text stage, studies were further identified as addressing one or more of the
following criteria: A. Clinical tests for polymorphisms. These include studies of commercial (e.g.,
AmpliChip®) and other tests that may be used for determining genetic polymorphisms in a clinical setting.
B. Gold standard. DNA sequencing is the accepted gold standard for genotyping. Because
very few studies used a gold standard comparison, a decision was made also to include studies that used methods comparisons (e.g., polymerase chain reaction and restriction fragment length polymorphism [PCR-RFLP]). In keeping with the clinical diagnostic test literature, these methods are referred to here as a reference standard, acknowledging that they provide a lower level of evidence than gold standard comparisons.
C. Predicted metabolism of SSRIs. This includes metabolizer status of an individual with
respect to a particular SSRI, e.g., “poor metabolizer” (PM) or “ultra-rapid metabolizer” (UM), and is distinct from PM or UM of a probe drug for a given CYP enzyme. Because an SSRI may not be exclusively metabolized by a certain CYP enzyme, its metabolism may vary from that of the probe drug for that enzyme in a person carrying a function-altering mutation of that CYP enzyme.
D. Decisionmaking. This includes decisionmaking by patients and providers; medical,
personal, and public health decisionmaking. E. Health outcomes of interest. Heath outcomes included: drug efficacy, adverse drug
reactions, and other outcomes such as improved prognosis and quality of life.
F. Harms. Harms associated with testing or with subsequent management decisions.

22
Studies were then classified as addressing one or more of the key questions. For example: Question 2 (analytic validity): A + B Question 3a (metabolism of SSRIs): (A or B) + C Question 4b (improved outcomes versus not testing): (A or B) + E Please note that although (A or B) + E would apply to all health outcomes questions, we did
not expect to find many studies addressing these, and therefore we did not break down E further. Summaries of the results of the abstract screening and full-text review are provided in Tables
4 and 5. A list of excluded articles, with reasons for exclusion, is provided in Appendix B.∗
Table 4. Results of abstract screening and full-text review
Articles identified 1,200 Abstracts reviewed 1,200 Included 140 Excluded 1,060 Full-text articles reviewed 140 Included 37 Excluded 103
Table 5. Included full-text articles by key question
Question 1 (overarching question) 0 Question 2 (analytic validity) 14 Question 3a (effects on metabolism) 16 Question 3b (effects on drug efficacy) 5 Question 3c (adverse drug reactions) 9 Question 4a (effects on disease management) 0 Question 4b (effects on outcomes) 0 Question 4c (testing usefulness) 0 Question 5 (testing and management harms) 0 Total 37*
*The sum across questions exceeds total because some articles were included for more than one question.
Data Abstraction and Development of Evidence Tables
The Duke research team developed data abstraction forms/evidence table templates for abstracting data for the various key questions (Appendix C*). Based on clinical expertise, a pair of researchers was assigned to the research questions to abstract data from the eligible articles. One of the pair abstracted the data, and the second researcher over-read the article and the accompanying abstraction to check for accuracy and completeness. The completed evidence tables are provided in Appendix D.*
∗ Appendixes cited in this report are provided electronically at www.ahrq.gov/clinic/tp/cyp450tp.htm.

23
Quality Assessment Criteria
At the data abstraction stage, the abstracting researcher was asked to evaluate each included article for methodological quality. For Question 2 regarding analytic validity, we assessed quality of studies based on questions in the Analytic validity, Clinical validity, Clinical utility and associated Ethical, legal and social implications (ACCE) model for evaluation of genetic testing (Appendix E*). For all other questions for which we could identify data, we intended to use the quality assessment criteria developed by the Tufts-New England Medical Center Evidence-based Practice Center for an evidence report on “Effects of Omega-3 Fatty Acids on Cardiovascular Disease.”51 However, these criteria require the study to be either a randomized controlled trial, longitudinal cohort study, or case-control study, and none of the studies identified for our report had these study designs. Therefore, we elected to use criteria developed by the Oxford Centre for Evidence-based Medicine52 (Appendix E*) to evaluate individual studies based on type of the study (therapy vs. prognosis vs. prevalence) and strength of study design, with numerical scores ranging between 1 and 5 (including 1a, 1b, 1c, 2a, 2b, 2c, 3a, 3b, 4, 5). The overall strength of recommendation for each question was then graded for each question as A, B, C, or D according to criteria that take into account the quality of individual studies identified for each question. The quality assessment scores for individual studies are reported in the relevant evidence tables. Because numerical value may not convey details about quality assessment, methodological issues pertaining to studies relevant to individual questions are addressed in the discussion of results for each question.
Model of Treatment for Major Depression
In addition to conducting the literature review described above, we also developed a decision
model of the decision to test for genotype or not, with the primary outcome of interest being success of initial treatment (resolution of depression without adverse effects). The goal of this exercise was to examine the relationships between the intermediate steps described above and outcomes of importance to patients and physicians. Results are discussed in Chapter 3.
Peer Review Process
We employed internal and external quality-monitoring checks through every phase of the
project to reduce bias, enhance consistency, and verify accuracy. Examples of internal monitoring procedures include: three progressively stricter screening opportunities for each article (abstract screening, full-text article review, data abstraction review); involvement of three individuals (two investigators and a copy-editor) in each data abstraction; and agreement of at least two investigators on all included studies.
Our principal external quality-monitoring device is the peer-review process. Nominations for peer reviewers were solicited from several sources, including the technical expert panel and interested federal agencies. The list of nominees was forwarded to AHRQ for vetting and approval. A list of peer reviewers submitting comments is provided in Appendix F.∗
∗ Appendixes cited in this report are provided electronically at www.ahrq.gov/clinic/tp/cyp450tp.htm.


25
Chapter 3. Results
Question 1: Overarching Question
Question 1 is: Does testing for cytochrome P450 (CYP450) polymorphisms in adults entering selective serotonin reuptake inhibitor (SSRI) treatment for non-psychotic depression lead to improvement in outcomes, or are testing results useful in medical, personal, or public health decisionmaking?
To address this question, we sought to identify studies in which patients treated with SSRIs were tested for CYP450 genetic polymorphisms, and in which investigators reported on the impact of such testing on outcomes or on medical, personal, or public health decisionmaking. Even after relaxing our inclusion criteria to include all methods used for genotyping and all indications for SSRI treatment, we were unable to identify any studies that directly addressed this question.
Question 2: Analytic Validity of Tests That Identify Key CYP450 Polymorphisms
Question 2 is: What is the analytic validity of tests that identify key CYP450
polymorphisms?
Approach
For purposes of this report, we adopted the definition of analytic validity and its components from the Analytic validity, Clinical validity, Clinical utility and associated Ethical, legal and social implications (ACCE) model (Appendix E∗), which reads:
The analytic validity of a genetic test defines its ability to accurately and reliably measure the genotype of interest. This aspect of evaluation focuses on the laboratory component. The four specific elements of analytic validity include analytic sensitivity (or the analytic detection rate), analytic specificity, laboratory quality control, and assay robustness. Analytic sensitivity defines how effectively the test identifies specific mutations that are present in a sample. Analytic specificity defines how effectively the test correctly classifies samples that do not have specific mutations (although the term “mutation” is used here, the terms “polymorphism” or “variant” may be more appropriate for certain situations). Quality control assesses the procedures for ensuring that results fall within specified limits. Robustness measures how resistant the assay is to changes in pre-analytic and analytic variables. It is notable that the definitions of sensitivity and specificity above are most directly
applicable to tests with dichotomous results (mutation present or absent). Because there are multiple CYP450 polymorphisms that can be assessed, and each study may provide information ∗ Appendixes cited in this report are provided electronically at www.ahrq.gov/clinic/tp/cyp450tp.htm.

26
on only a subset of polymorphisms, we defined analytic sensitivity operationally as the proportion of known genotype challenge samples that are correctly identified by the test under evaluation. Similarly, analytic specificity was defined operationally as the proportion of known wild-type challenge samples that are correctly identified by the test under evaluation.
Our assessment of analytic validity focuses on tests that are actually used, or are likely to be used, in clinical settings. The gold standard method for CYP450 genotyping is unequivocally the bidirectional sequencing of the specific genetic region of the gene of interest. However, many reference methods exist due to the complexity and high costs involved with sequencing of large populations. To date, there is only one technology approved by the U.S. Food and Drug Administration (FDA) specifically for CYP450 genotype testing (the Roche AmpliChip®), and one technology approved for genetic testing of a different gene target (Invader Assay for UGT1A1 genotyping) which has been employed in one of the studies for CYP2D6 genotyping.53 Other laboratories currently performing CYP450 tests in clinical settings generally employ traditional methods, including polymerase chain reaction and restriction fragment length polymorphism (PCR-RFLP) or allele-specific polymerase chain reaction (AS-PCR, also referred to as allele-specific amplification, or ASA).
In the absence of a substantial number of studies comparing the test under evaluation to the gold standard (bidirectional DNA sequencing), we decided to include studies that used a traditionally accepted methods comparison, typically PCR-RFLP or AS-PCR, acknowledging that a methods comparison would be a lower level of evidence regarding analytic sensitivity and specificity than a gold standard comparison. Consequently, we refer to the comparator tests as a “reference standard.” It should be noted that in most cases even DNA sequencing for the purpose of assay validation may not have been done bidirectionally (not reported), but is referred to as a gold standard nonetheless.
Few studies reported the ethnic makeup of the tested sample populations, and even when details were provided there was no standard format followed, or description provided of the source of ethnicity data (e.g., based on self-reported or medical or other documentation). We therefore summarize all studies by the common denominator of general ethnic group (e.g., Caucasian).
Some studies provided information about test performance in assessing individual alleles rather than genotypes. Although these are less clinically relevant, they are included to complement the information about genotypes.
Several studies addressed the issue of gene duplication and deletion. While these are clinically important, there is a lack of an accepted gold standard; in this case, comparisons were based on any reported comparator. Current methods commonly used for assessment of CYP2D6 gene copy number are based on two different approaches, both of which are sensitive to the location of primers used in assay design and are prone to produce erroneous results in rare cases of rearrangement variants or occurrence of mutations in the positions targeted by these primers. The first approach compares CYP2D6 copy number to a gene that is known to have no variation in gene copy number, computing the ratio between them. Most of the analytic validity studies employing these methods do not discriminate further to see which allele is duplicated (hence these are referred to in Table 7, below, as “duplication” and “deletion”). Alternatively, others amplify a duplication-specific fragment, but may miss duplications, depending on the particular primers utilized. These traditionally used fragments also allow limited or no genotyping, since they carry little or no coding regions (intergenic region amplified).

27
On the advice of the technical expert panel, we reviewed studies for polymorphisms in all CYP450 enzymes. Results for those most relevant to SSRI metabolism (CYP2D6, 2C19, and 2C9) are presented in this section; results for the remaining enzymes are provided in Evidence Table 1 (Appendix D∗). Results
Results for analytic sensitivity and specificity for genotype polymorphisms are presented below by CYP450 enzyme. All calculations were performed using FastPro version 1.8 (Academic Press, 1992). Summaries of evidence regarding sensitivity and specificity for individual alleles, gene deletion and duplication, laboratory quality control, and robustness issues are also provided. Detailed results relating to these latter issues are included in Evidence Table 1 (Appendix D*).
CYP2D6. We identified nine reports that compared clinical methods for genotyping CYP2D6 enzyme polymorphisms to a reference standard (Tables 6 and 7). Of these, eight were published studies53-60 and one was reported on the FDA website.40 Only two studies40,55 provided a comparison to the gold standard, DNA sequencing. One study60 provided results in allele counts only and thus is not considered further here (for details see Evidence Table 1, Appendix D*). Five of the studies tested different 2D6 variants (Table 6), while five reported results on gene copy number (Table 7); two studies40,59 reported both.
∗ Appendixes cited in this report are provided electronically at www.ahrq.gov/clinic/tp/cyp450tp.htm.

28
Table 6. Analytic sensitivity and specificity of tests for CYP2D6 polymorphisms – by variant*
Study Roche Molecular Systems,
Inc., 200440
Hersberger et al., 200055
Eriksson et al., 200254
Muller et al., 200356
Stamer et al., 200259
Test evaluated AmpliChip® ASA Pyro-sequencing
RT-PCR RT-PCR
Reference standard† Sequencing, ASA and
PCR-RFLP#
Sequencing PCR-RFLP PCR-RFLP ASA
Genotype-specific analytic
sensitivity
95% CI Test for homo-geneity
*2/*1 31/31 NR NR NR NR 100% 90.6 – 100 NA *2/*2 16/16 NR NR NR NR 100% 82.43 – 100 NA *2/*3 1/1 NR NR NR NR 100% 0.25 – 100 NA *2/*4 20/20 NR NR NR NR 100% 85.76 – 100 NA *2/*5 4/4 NR NR NR NR 100% 42.49 – 100 NA *2/*6 2/2 NR NR NR NR 100% 13.57 – 100 NA *2/*7 4/4 NR NR NR NR 100% 42.49 – 100 NA *2/*8 4/4 NR NR NR NR 100% 42.49 – 100 NA *2/*9 2/2 NR NR NR NR 100% 13.57 – 100 NA
*2/*10 2/2 NR NR NR NR 100% 13.57 – 100 NA *2/*11 4/4 NR NR NR NR 100% 42.49 – 100 NA
Analytic sensitivity
*2/*19 4/4 NR NR NR NR 100% 42.49 – 100 NA Notes to Table 6: * Methods combining both gene deletion assays (*5 variant) and identification of other variants are included in both Tables 6 and 7, as evaluation of analytic validity addresses different parameters of the test in each table. † To avoid double counting, for studies reporting both sequencing and PCR-RFLP as reference standards,40,55 only sequencing data are included here. Full details of genotype and allele results are provided in Evidence Table 1 (Appendix D∗). # Results of genotype calls for the AmpliChip® method comparison are pooled for all method validation tests performed, as the report does not specify genotype calls by each method specifically. Abbreviations: ASA = allele-specific amplification; CI = confidence interval; NA = not applicable; NR = not reported; PCR-RFLP = polymerase chain reaction and restriction fragment length polymorphism; RT-PCR = real-time polymerase chain reaction
∗ Appendixes cited in this report are provided electronically at www.ahrq.gov/clinic/tp/cyp450tp.htm.
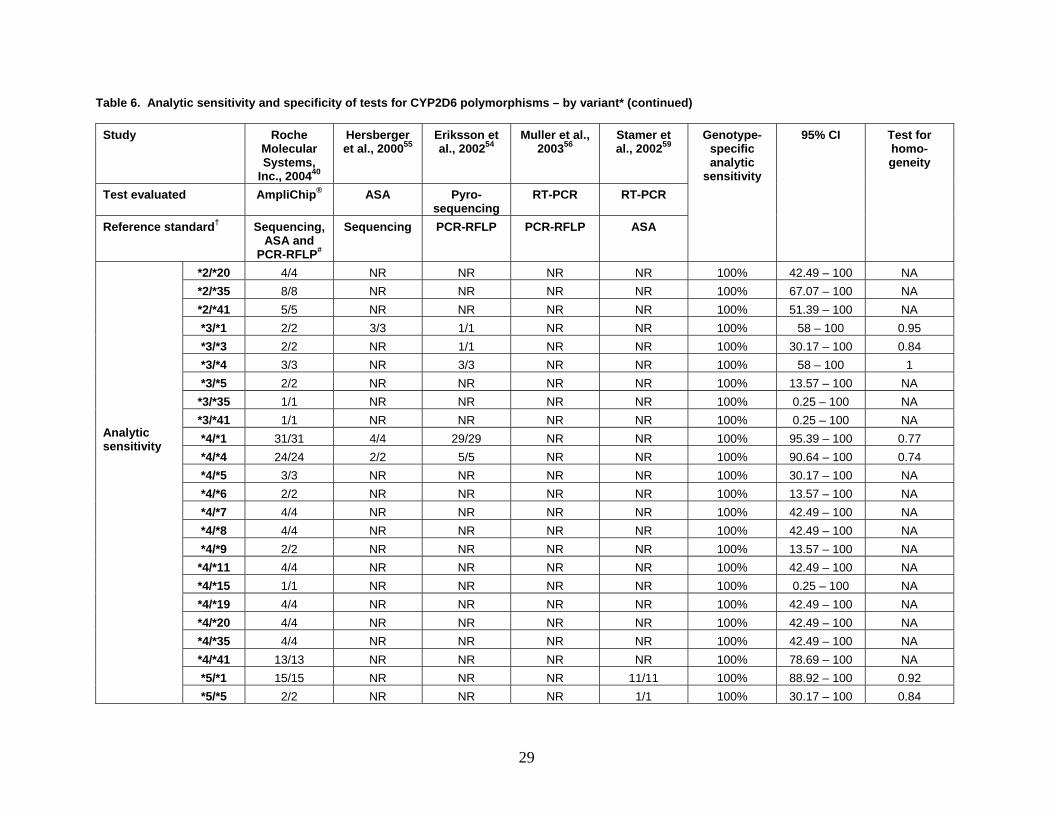
29
Table 6. Analytic sensitivity and specificity of tests for CYP2D6 polymorphisms – by variant* (continued)
Study Roche Molecular Systems,
Inc., 200440
Hersberger et al., 200055
Eriksson et al., 200254
Muller et al., 200356
Stamer et al., 200259
Test evaluated AmpliChip® ASA Pyro-sequencing
RT-PCR RT-PCR
Reference standard† Sequencing, ASA and
PCR-RFLP#
Sequencing PCR-RFLP PCR-RFLP ASA
Genotype-specific analytic
sensitivity
95% CI Test for homo-geneity
*2/*20 4/4 NR NR NR NR 100% 42.49 – 100 NA *2/*35 8/8 NR NR NR NR 100% 67.07 – 100 NA *2/*41 5/5 NR NR NR NR 100% 51.39 – 100 NA *3/*1 2/2 3/3 1/1 NR NR 100% 58 – 100 0.95 *3/*3 2/2 NR 1/1 NR NR 100% 30.17 – 100 0.84 *3/*4 3/3 NR 3/3 NR NR 100% 58 – 100 1 *3/*5 2/2 NR NR NR NR 100% 13.57 – 100 NA
*3/*35 1/1 NR NR NR NR 100% 0.25 – 100 NA *3/*41 1/1 NR NR NR NR 100% 0.25 – 100 NA *4/*1 31/31 4/4 29/29 NR NR 100% 95.39 – 100 0.77 *4/*4 24/24 2/2 5/5 NR NR 100% 90.64 – 100 0.74 *4/*5 3/3 NR NR NR NR 100% 30.17 – 100 NA *4/*6 2/2 NR NR NR NR 100% 13.57 – 100 NA *4/*7 4/4 NR NR NR NR 100% 42.49 – 100 NA *4/*8 4/4 NR NR NR NR 100% 42.49 – 100 NA *4/*9 2/2 NR NR NR NR 100% 13.57 – 100 NA
*4/*11 4/4 NR NR NR NR 100% 42.49 – 100 NA *4/*15 1/1 NR NR NR NR 100% 0.25 – 100 NA *4/*19 4/4 NR NR NR NR 100% 42.49 – 100 NA *4/*20 4/4 NR NR NR NR 100% 42.49 – 100 NA *4/*35 4/4 NR NR NR NR 100% 42.49 – 100 NA *4/*41 13/13 NR NR NR NR 100% 78.69 – 100 NA *5/*1 15/15 NR NR NR 11/11 100% 88.92 – 100 0.92
Analytic sensitivity
*5/*5 2/2 NR NR NR 1/1 100% 30.17 – 100 0.84

30
Table 6. Analytic sensitivity and specificity of tests for CYP2D6 polymorphisms – by variant* (continued)
Study Roche Molecular Systems,
Inc., 200440
Hersberger et al., 200055
Eriksson et al., 200254
Muller et al., 200356
Stamer et al., 200259
Test evaluated AmpliChip® ASA Pyro-sequencing
RT-PCR RT-PCR
Reference standard† Sequencing, ASA and
PCR-RFLP#
Sequencing PCR-RFLP PCR-RFLP ASA
Genotype-specific analytic
sensitivity
95% CI Test for homo-geneity
*5/*6 1/1 NR NR NR NR 100% 0.25 – 100 NA *5/*9 2/2 NR NR NR NR 100% 13.57 – 100 NA
*5/*10 1/1 NR NR NR NR 100% 0.25 – 100 NA *5/*17 4/4 NR NR NR NR 100% 42.49 – 100 NA *5/*29 1/1 NR NR NR NR 100% 0.25 – 100 NA *5/*35 2/2 NR NR NR NR 100% 13.57 – 100 NA *5/*41 7/7 NR NR NR NR 100% 63.07 – 100 NA *6/*1 3/3 3/3 NR NR NR 100% 58 – 100 1
*6/*41 1/1 NR NR NR NR 100% 0.25 – 100 NA *7/*1 4/4 NR NR NR NR 100% 42.49 – 100 NA *7/*7 4/4 NR NR NR NR 100% 42.49 – 100 NA
*7/*41 4/4 NR NR NR NR 100% 42.49 – 100 NA *8/*1 4/4 NR NR NR NR 100% 42.49 – 100 NA *8/*8 4/4 NR NR NR NR 100% 42.49 – 100 NA
*8/*41 4/4 NR NR NR NR 100% 42.49 – 100 NA *9/*1 2/2 NR NR NR NR 100% 13.57 – 100 NA
*9/*17 1/1 NR NR NR NR 100% 0.25 – 100 NA *9/*41 1/1 NR NR NR NR 100% 0.25 – 100 NA *10/*1 16/16 NR NR NR NR 100% 82.43 – 100 NA *10/*10 16/17 NR NR NR NR 94.12% 74.31 – 100 NA *10/*17 2/2 NR NR NR NR 100% 13.57 – 100 NA *10/*35 1/1 NR NR NR NR 100% 0.25 – 100 NA *10/*36 1/1 NR NR NR NR 100% 0.25 – 100 NA
Analytic sensitivity
*10/*40 1/1 NR NR NR NR 100% 0.25 – 100 NA

31
Table 6. Analytic sensitivity and specificity of tests for CYP2D6 polymorphisms – by variant* (continued)
Study Roche Molecular Systems,
Inc., 200440
Hersberger et al., 200055
Eriksson et al., 200254
Muller et al., 200356
Stamer et al., 200259
Test evaluated AmpliChip® ASA Pyro-sequencing
RT-PCR RT-PCR
Reference standard† Sequencing, ASA and
PCR-RFLP#
Sequencing PCR-RFLP PCR-RFLP ASA
Genotype-specific analytic
sensitivity
95% CI Test for homo-geneity
*10/*41 2/2 NR NR NR NR 100% 13.57 – 100 NA *11/*1 4/4 NR NR NR NR 100% 42.49 – 100 NA *11/*11 4/4 NR NR NR NR 100% 42.49 – 100 NA *11/*41 4/4 NR NR NR NR 100% 42.49 – 100 NA *17/*1 13/13 NR NR NR NR 100% 78.69 – 100 NA *17/*17 4/4 NR NR NR NR 100% 42.49 – 100 NA *17/*29 2/2 NR NR NR NR 100% 13.57 – 100 NA *17/*41 3/3 NR NR NR NR 100% 30.17 – 100 NA *19/*1 4/4 NR NR NR NR 100% 42.49 – 100 NA *19/*19 4/4 NR NR NR NR 100% 42.49 – 100 NA *19/*41 4/4 NR NR NR NR 100% 42.49 – 100 NA *20/*1 4/4 NR NR NR NR 100% 42.49 – 100 NA *20/*20 4/4 NR NR NR NR 100% 42.49 – 100 NA *20/*41 4/4 NR NR NR NR 100% 42.49 – 100 NA *29/*1 2/2 NR NR NR NR 100% 13.57 – 100 NA *29/*29 1/1 NR NR NR NR 100% 0.25 – 100 NA *29/*36 1/1 NR NR NR NR 100% 0.25 – 100 NA *29/*41 4/4 NR NR NR NR 100% 42.49 – 100 NA *35/*1 13/13 NR NR 14/14 NR 100% 89.31 – 100 0.98 *35/*35 1/1 NR NR 3/3 NR 100% 42.49 – 100 0.75 *35/*41 4/4 NR NR NR NR 100% 42.49 – 100 NA *40/*1 1/1 NR NR NR NR 100% 0.25 – 100 NA *41/*1 14/14 NR NR 14/14 NR 100% 89.68 – 100 1
Analytic sensitivity
*41/*41 9/9 NR NR 3/3 NR 100% 77.07 – 100 0.73 Analytic specificity
*1/*1 31/31 8/8 24/24 101/101 NR 100% 98.18 – 100 0.89

32
Table 7. Analytic sensitivity and specificity of tests for CYP2D6 polymorphisms – by gene copy number*
Study Roche Molecular Systems,
Inc., 200440
Schaeffeler et al., 200357
Neville et al., 200253
Soderback et al., 200558
Stamer et al., 200259
Test evaluated AmpliChip® RT-PCR Long-range PCR and
ASA
Pyro-sequencing
RT-PCR
Reference standard Sequencing and ASA#
Long range PCR
Long range PCR
Long range PCR
Long range PCR and
ASA
Genotype-specific analytic
sensitivity
95% CI Test for homo-geneity
Del/Del 2/2 1/1 0/0 0/0 1/1 100% 42.5 – 100 0.97 Del/SC 41/41 13/13 16/16 24/24 11/11 100% 97.2 – 100 0.99
Dup/Del 3/3 5/5 0/0 0/0 NR 100% 67.1 – 100 0.87
Analytic sensitivity
Dup/SC 31/33 0/3‡ 11/11 13/13 NR 91.67% 82.4 – 97.7 0.06 Analytic specificity
SC/SC 425/426 43/43 NR 3/3 NR 99.79% 99.0 - 100 0.46
Notes to Table 7: * Methods combining both gene deletion assays (*5 variant) and identification of other variants are included in both Tables 6 and 7, as evaluation of analytic validity addresses different parameters of the test in each table. ‡ Real-time polymerase chain reaction (RT-PCR) detects gene copy number and uses an algorithm for genotype assignment based on the single nucleotide polymorphism-genotype analysis. When 2 alleles are detected, the most likely genotype is wild type (2 active alleles), with a less likely result of a combination between duplication and deletion. # Results of genotype calls for the AmpliChip® method comparison are pooled for all method validation tests performed, as the report does not specify genotype calls by each method specifically. Abbreviations: ASA = allele-specific amplification; CI = confidence interval; Del = deletion (*5 allele); Dup = duplication (more than a single gene copy); NR = not reported; PCR = real-time polymerase chain reaction; RT-PCR = real-time polymerase chain reaction; SC = single gene copy

33
In all studies analytic sensitivity and specificity for each tested genotype ranged from 94.12 to 100 percent, with the exception of Schaeffeler et al.,57 which reported sensitivity of 91.67 percent to detect the duplication/(single copy) genotype and specificity of 99.79 percent. However, only 26 of approximately 100 known CYP2D6 polymorphisms (www.cypalleles.ki.se) were evaluated in the included studies, with most studies focusing on only a handful of these variants.
Analytic sensitivity and specificity based on combined allele counts (as opposed to genotype calls presented in Table 6) ranged from 98 to 100 percent in all studies, again with the exception of Schaeffeler et al.,57 which reported sensitivity of 73.1 percent and specificity of 98 percent. However, correct allele counts do not necessarily reflect correct genotype calls (which are assumed to predict treatment outcomes) and are therefore less relevant in the clinical context (details on allele counts, sensitivity, and specificity are presented in Evidence Table 1, Appendix D∗).
CYP2D6 gene copy number methods exhibit relatively high sensitivity and specificity, although two of the four studies reporting results on duplication variants reported failures, resulting in sensitivity of 91.67 percent to identify duplication/(single copy) genotypes, and a homogeneity p-value of 0.06. It should be noted that traditional assays designed to identify the deletion variant *5 fail to depict some rearrangement-deletion alleles (the most common of which in Caucasians are *13 and *16 [0.5 to 1 percent], not tested in any of the studies above). These are non-functional alleles and result in the same metabolic phenotype as *5 (i.e., poor metabolizer [PM]).
Quality control procedures include the integration of negative and positive controls into the genotyping process in most studies40,53,57-59 to ensure that results fall within the specified assay limits. Robustness was not measured and reported in all studies. The effect of pre-analytic variables (such as blood sample collection and DNA extraction method) was reported only by Chou et al.,60 but they did not perform a comprehensive comparison between the two DNA extraction methods employed. The effect of analytic variables was measured in three of the studies, each reporting a different measurement: Schaeffeler et al.57 reported inter- and intra-assay variability in a subset of the tested samples separately; Soderback et al.58 reported the reproducibility of linear regression coefficients; and Roche investigators40 reported reproducibility scores by combining the effects of sites, replicates, dates, and reagent lots. All three studies reported high rates of robustness, but these were not comparable and could not be summarized together (details are presented in Evidence Table 1, Appendix D*).
CYP2C19. We identified three reports that compared clinical methods for genotyping CYP2C19 enzyme polymorphisms to a reference standard (Table 8). Of these, two were published studies54,61 and one was reported on the FDA website.41 Only one study41 provided a comparison to the gold standard, DNA sequencing.
∗ Appendixes cited in this report are provided electronically at www.ahrq.gov/clinic/tp/cyp450tp.htm.

34
Table 8. Analytic sensitivity and specificity of tests for CYP2C19 polymorphisms
Study Roche Molecular Systems,
Inc., 200541
Eriksson et al., 200254
Mizugaki et al., 200361
Test evaluated AmpliChip® Pyro-sequencing
ASA and TaqMan
Reference standard Sequencing PCR-RFLP PCR-RFLP
Genotype-specific analytic
sensitivity
95% CI Test for homo-geneity
*2/*1 101/101 24/24 45/45 100% 98.25 – 100 0.9 *2/*2 14/15 5/5 8/8 96.43% 83.96 – 100 0.78 *2/*3 6/6 NR 9/9 100% 81.33 – 100 0.9 *3/*1 6/6 NR 29/29 100% 91.68 – 100 0.62 *3/*3 1/1 NR 2/2 100% 30.17 – 100 0.84
Analytic sensitivity
*4/*1 NR 1/1 NR 100% 0.25 – 100 NA Analytic specificity
*1/*1 270/270 108/108 51/51 100% 99.3 – 100 0.87
Abbreviations: ASA = allele-specific amplification; CI = confidence interval; NA = not applicable; NR = not reported; PCR-RFLP = polymerase chain reaction and restriction fragment length polymorphism
All three studies reported a high sensitivity and specificity (96.43 to 100 percent). However, each study focused on detection of two out of the three common CYP2C19 alleles (*2, *3, and *4). Similar results were obtained when performing calculations based on allele calls (Evidence Table 1, Appendix D∗). Quality control procedures employed by the above studies included the incorporation of polymorphism surrounding sequence in assay design as an internal control,54 and testing positive and negative control samples routinely.41 Only Roche Molecular Systems, Inc.,41 reported the robustness of their technology for CYP2C19 allele detection by means of reproducibility of correct genotype calls (99.6 percent; for details see Evidence Table 1, Appendix D*).
CYP2C9. We identified one report that compared clinical methods for genotyping CYP2C9 enzyme polymorphisms to a reference standard.54 This study did not use the gold standard, DNA sequencing. Investigators reported lack of detection of homozygotes for the *2 and/or the *3 alleles. They also stated that compound heterozygotes (*2/*3 genotype) were identified, but they provided no genotype counts, preventing calculation of genotype analytic sensitivity and specificity.
Calculation of analytic sensitivity based on allele counts was 100 percent. Due to an unreported number of compound heterozygotes, it is impossible to calculate confidence intervals of assay specificity, but it is implied that mean specificity is 100 percent.
No measures of robustness were reported. Quality control featured interrogation of the surrounding sequence, along with the variable positions tested and providing internal controls.
Other CYPs. We identified two studies that compared clinical methods for genotyping CYP2C8 enzyme polymorphisms to a reference standard (Table 9), and one that did the same for CYP1A1 polymorphisms (Table 10). Only one study (of CYP2C8) provided a comparison to the gold standard, DNA sequencing.62
∗ Appendixes cited in this report are provided electronically at www.ahrq.gov/clinic/tp/cyp450tp.htm.

35
Table 9. Analytic sensitivity and specificity of tests for CYP2C8 polymorphisms
Study Muthiah et al., 200462
Weise et al., 200463
Test evaluated Multiplex PCR
RT-PCR
Reference standard Sequencing PCR-RFLP
Genotype-specific analytic
sensitivity
95% CI Test for homo-geneity
*2/*1 2/2 2/2 100% 42.49 – 100 1 *3/*1 3/3 16/16 100% 85.05 – 100 0.6 *3/*4 NR 1/1 100% 0.25 - 100 NA
Analytic sensitivity
*4/*1 NR 8/8 100% 67.07 - 100 NA Analytic specificity *1/*1 52/52 95/95 100% 97.98 - 100 0.85
Abbreviations: CI = confidence interval; NA = not applicable; NR = not reported; PCR = polymerase chain reaction; PCR-RFLP = polymerase chain reaction and restriction fragment length polymorphism; RT-PCR = real-time polymerase chain reaction Table 10. Analytic sensitivity and specificity of tests for CYP1A1 polymorphisms
Study Wu et al., 200264 Test evaluated Mismatch
hybridization Reference standard PCR-RFLP
Genotype-specific analytic sensitivity
95% CI
m1/*1 8/8 100% 67.07 - 100 Analytic sensitivity m1/m1 20/20 100% 85.76 – 100
Analytic specificity *1/*1 22/22 100% 86.94 - 100 m2/*1 5/5 100% 51.39 – 100 Analytic sensitivity m2/m2 21/21 100% 86.4 – 100
Analytic specificity *1/*1 24/24 100% 86.4 – 100 Abbreviations: CI = confidence interval; PCR-RFLP = polymerase chain reaction and restriction fragment length polymorphism
All studies reporting assay performance for the detection of CYP2C8 and CYP1A1 exhibit 100 percent analytic sensitivity and specificity. Calculations based on allele calls reflect the same findings. Quality control procedures employed include the incorporation of positive and negative controls into the genotyping process.62 Robustness was assessed only by Wu et al.,64 by means of inter- and intra-assay variability. The intra-assay coefficients of variance were reported to be lower than 11.2 percent for both CYP1A1 assays, and the inter-assay coefficients of variance were lower than 14.3 percent. Weise et al.63 implied 100 percent inter-assay reproducibility of results obtained by four different investigators.
Discussion
Based on emerging standards, analytic validity of genetic tests includes not only the ability of the test to accurately identify challenge genotypes (as assessed by a gold standard test), but also quality control and robustness. We identified only a few studies of test performance relative to the gold standard of DNA sequencing (bidirectionally or unidirectionally), applied to a limited number of samples (as reflected by the wide confidence intervals calculated for analytic

36
sensitivity and specificity), and covering but a small set of possible genetic variants. Many studies appear to be in the realm of preclinical evaluations and are not clearly relevant to the domain of clinical practice.
These data do suggest that the analytic sensitivity and specificity of available tests are generally high. One concern may be that in the evaluation of gene deletions and duplications, assessing the magnitude of the potential problem is limited by the lack of an established gold standard for gene copy number. Another concern is that few CYP450 variants are included in the studies we identified, which focused particularly on the more common variants in Caucasians and African-Americans. However, variants that are rare in these populations may be more frequent, and thus more clinically relevant, in other populations. In the same context, it should be noted that most studies focus on developing reliable methods for the genotyping of CYP2D6 variants known to be non-functional (PM). Of these, the most common in Caucasians and African-Americans are *3, *4, *5, and *6, and the majority of studies target their assays at capturing these variants. Even the AmpliChip®, which targets the largest set of CYP2D6 variants (n = 26), fails to capture a large set of rare variants leading to deficient enzyme activity. Many analytic validity studies, particularly those published less recently, tend to report results by stating allele counts and frequencies, without direct comparison to a reference standard. While this format allows comparison to published allele frequencies in populations similar to the ones employed in their studies, it is not helpful in estimating genotype-specific performance. For completeness, however, data summarizing allele frequencies are provided in Evidence Table 1 (Appendix D∗). Conclusions
Although these results suggest that analytic validity for detecting some of the CYP450 genotypes more frequently encountered in the Caucasian population is good, overall the data are limited, with relatively small numbers of samples and a relatively narrow range of polymorphisms tested. In addition to studies addressing these limitations, research should include closer examination of the issue of deletions and duplications. Furthermore, practical concerns of quality control and robustness deserve greater investigation based on emerging standards for such studies.
Question 3a: CYP450 Genotypes and Metabolism of SSRIs
Question 3a is: How well do particular CYP450 genotypes predict metabolism of particular
SSRIs? Do factors such as race/ethnicity, diet, or other medications affect this association? Approach
There is definitive literature supporting the association between certain CYP450 genotypes and their predicted phenotypes (i.e., how they would metabolize probe drugs specific for that CYP enzyme). Our question sought to address how well a certain genotype (or its corresponding predicted phenotype) predict metabolism of particular SSRIs. For example, does a CYP2D6
∗ Appendixes cited in this report are provided electronically at www.ahrq.gov/clinic/tp/cyp450tp.htm.

37
*5*5 or predicted poor metabolizer (PM) of the probe drug dextromethorphan also metabolize fluoxetine poorly? To address this question, we sought to identify all studies in which patients on SSRIs were tested for CYP450 genetic polymorphisms. Studies were included irrespective of the method used for genotyping. Because of the overall paucity of data, we included studies that had diagnoses other than non-psychotic depression as an indication for SSRI treatment, as clinical outcomes in such scenarios may be indicative of genotype effects. We also included studies in which only a subgroup of patients was treated with SSRIs, while others were treated with other antidepressants, including tricyclics. Results
Note: Here, as throughout Chapter 3, the terms “poor metabolizer (PM),” “extensive metabolizer (EM),” etc., refer to general phenotypes (for a probe drug) as predicted by genotyping.
We identified 16 studies that met the inclusion criteria for this question (see Evidence Table 2, Appendix D∗). Five studies examined SSRI metabolism in healthy adults,43,65-68 while the other 11 looked at SSRI metabolism in patients who had achieved a steady state after multiple doses.69-79
The first group of five studies examined the effect of different genotypes of CYP2C19 and CYP2D6 on SSRI metabolism in healthy volunteers. Results are summarized in Table 11. Table 11. CYP450 genotypes and metabolism of SSRIs in healthy volunteers
Study
Subjects (n, ethnicity)
SSRI Genotypes Results
Liu et al., 200165
14 Chinese Fluoxetine 2C19 *1, *2, *3 Increased AUC, t1/2, and Cmax, decreased oral clearance in PMs vs. EMs
Wang et al., 200143
12 Chinese Sertraline 2C19 *1, *2, *3 Increased AUC, t1/2, and Cmax, decreased oral clearance in PMs vs. EMs
Yu et al., 200367
13 Chinese Citalopram 2C19 *1, *2, *3 Increased AUC, t1/2,and Cmax, decreased oral clearance in PMs vs. EMs
Yoon et al., 200068
16 Koreans Paroxetine CYP2D6 *1, *2, *10B
Heterozygotes/homozygotes for *10B showed lower volume of distribution, oral clearance, and higher AUC vs. homozygous for wild type. No difference in Cmax, t1/2, or renal clearance between groups
Ozdemir et al., 199966
17 Caucasians Paroxetine 2D6*1, *3, *4, *5
Heterozygous EMs had twofold higher median steady-state concentration than homozygous EMs, but difference not statistically significant
Abbreviations: AUC = area under the curve; Cmax = maximum plasma concentration; EMs = extensive metabolizers; PMs = poor metabolizers; t1/2 = terminal elimination half-life ∗ Appendixes cited in this report are provided electronically at www.ahrq.gov/clinic/tp/cyp450tp.htm.

38
All these studies used standard measures such as area under the curve (AUC, which is an assessment of bioavailability of the drug), half-life (time taken to eliminate half the total ingested quantity of the drug from the body), and oral clearance (pertains to distribution and elimination of drug) as measures of rate of metabolism. Three of the five studies43,65,67 included young, healthy, male, non-smoking, Chinese subjects who were free of medications and alcohol for at least 2 weeks prior to the study. These studies looked at the effect of CYP2C19 genotypes and predicted phenotypes (EM vs. PM) on the metabolism of three different SSRIs, namely, fluoxetine, sertraline, and citalopram. All three studies found significantly higher AUC, longer half-life, and reduced oral clearance of the parent drug, and significantly lower AUC and lower maximum plasma concentration (Cmax) of the metabolite of each drug, in PMs as compared to EMs. The fluoxetine and citalopram studies also found a gene dose effect such that heterozygous EMs showed values between homozygous EMs and PMs.
Of the remaining two studies, the first68 was carried out in 16 healthy, young, Korean subjects and examined the effect of the CYP2D6*10 allele (predictive of poor metabolism) on paroxetine metabolism. Investigators found that homozygotes and heterozygotes for *10 alleles showed significantly greater volume of distribution, greater AUC, and lower oral clearance of paroxetine than wild type homozygotes.
Thus, all studies in healthy adults using a single dose of an SSRI found that PMs, as predicted by genotyping, metabolized the SSRI more slowly than EMs, irrespective of particular SSRI.
The other study66 was a multiple-dose study that looked at paroxetine pharmacokinetics in 17 healthy, young, non-smoking Caucasian subjects who received paroxetine 20 mg/day for at least 5 days (range, 5 to 15 days). It found that heterozygous EMs had twofold higher median paroxetine steady-state concentrations than homozygous wild type EMs (n = 10); the difference was not statistically significant (p = 0.2).
The 11 studies conducted in clinical populations (with sample sizes ranging from 11 to 146) examined the effects of genotypes of 2D6, 2C9, and 2C19 on the pharmacokinetics of various SSRIs. Results are summarized by SSRI in Table 12 for all studies of individual SSRIs.

39
Table 12. CYP450 predicted phenotypes and metabolism of various SSRIs in clinical populations
SSRI CYP enzyme
Drug concentration findings
Paroxetine69,70,74,76,77,79 n = 14 to 124
2D6 PM mother had highest concentration; her infant had undetectable level; a UM infant had undetectable level69 PM > EM70 (PM + IM) = (EM + UM)74 PM > EM only at 10-mg dose, not at higher doses76 Trough concentration in lower half of reference range for PM (n = 1) and EM77 IM > PM and EM in 30 mg/d dose group only79
SSRI CYP enzyme
Drug concentration findings
Fluoxetine70,71,73,78 n = 11 to 78
2D6 2C19 2C9
PM > EM70 PM > EM (S isomer only)71 PM = EM (active moiety)73 PM = EM (active moiety)78 PM = EM (active moiety)78 Heterozygous EM > homozygous EM (active moiety)73 Heterozygous EM > homozygous EM (active moeity)78 Heterozygous EM > homozygous EM (R isomer only)78
Fluvoxamine75 n = 46
2D6 PM = EM75
Citalopram69 n = 14
2C19 PM mother had highest citalopram concentration, five *1*2 infants had higher concentration than five *1*1 infants (3 vs. 0.8 nmol/L). 3 of 4 infants with undetectable level were *1*169
Note to Table 12: “Active moiety” = fluoxetine + norfluoxetine (active metabolite) Abbreviations: EM = extensive metabolizer; IM = intermediate metabolizer; PM = poor metabolizer; UM = ultra-rapid metabolizer
Table 13 reports confidence intervals for differences in mean SSRI levels between extensive
metabolizers and comparison groups for those studies reporting the necessary data.

40
Table 13. Confidence intervals for differences in mean SSRI levels between extensive metabolizers (EMs) and comparison groups
SSRI/CYP enzyme
Study Mean drug concentration, EM group
Mean drug concentration, comparator group (PM, heterozygous EM, etc.)
P-value Confidence interval80 for difference in mean drug concentration
Dose Comments
Charlier et al., 200370
20.97 ± 21.17 microg/L (n = 30)
72.50 ± 29.65 microg/L (n = 6)
0.00001 31.40 to 71.66 20 mg/d -
Sawamura et al., 200476
2.99 ± 3.52 ng/mL (n = 16)
7.30 ± 6.11 ng/ mL (*1*10 or *10*10) (n = 35)
0.019 1.04 to 7.58 10 mg/d No difference at higher doses, data not provided
Murphy et al., 200374
71.65 ± 52.55 ng/mL (n = 105) (EM + UM)
99.51 ± 37.35 ng/mL (IM + PM) (n = 15)
NR -0.15 to 55.87 Mean 30.21 (EM), 26.67 (PM)
(EM + UM), (IM +PM) groups combined to increase power
Paroxetine/ 2D6
Ueda et al., 200679
150.9 ± 20.6 ng/mL/mg/kg (n = 17)
76.7 ± 6.1 ng/mL/mg/kg (n = 12)
NR -86.45 to 61.95
30 mg/d IM level greater than EM or PM, no difference at other doses
Charlier et al., 200370
49.4 ± 40.7 microg/L (n = 10)
178.5 ± 68.6 microg/L (n = 2)
0.004 60.83 to 197.37 20 mg/d Reported fluoxetine only
Eap et al., 200171
55 ± 30 ng/mL (n = 6)
104 ± 8 ng/mL (n = 3)
NR 12.82 to 85.18 20 mg/d Reported fluoxetine only
Fluoxetine/ 2D6
LLerena et al., 200473
13.0 ± 7.6 nmol/L/mg (n = 41)
16.7 nmol/L/mg (n = 1)
NR -11.61 to 19.01 Dose-corrected
Reported fluoxetine only. “No significant correlation found between plasma concentration of active moiety and number of active genes”
Fluoxetine/ 2C9
LLerena et al., 200473
25.1± 10.1 nmol/L/mg (n = 19)
35.5 ± 18.5 nmol/L/mg (*1*2) (n = 11) 38.6 ± 22.1 nmol/L/mg (*1*3) (n = 8)
< 0.05 < 0.01
0.07 to 20.73 1.34 to 25.66
Dose-corrected
Active moiety (all subjects were 2D6 EM)
Fluvoxamine/ 2D6
Ohara et al., 200375
312.7± 195.3 ng/mL/mg/kg (n = 13)
321± 422.1 ng/mL/mg/kg n = 15)
0.984 -245.79 to 262.39
Dose-corrected
PM defined as 2D6 *10*10; EM defined as no *10 (any allele which was not *3, *4, *5 or *10 was defined as wild-type)
Abbreviations: EM = extensive metabolizer; IM = intermediate metabolizer; NR = not reported; PM = poor metabolizer; UM = ultra-rapid metabolizer

41
All 11 studies examined some or all genotypes of CYP2D6, while CYP2C9 and 2C19 were considered in three studies each. The studies were heterogeneous with respect to patient population, some with psychiatric outpatients, some with major depression defined either by Diagnostic and Statistical Manual for Mental Disorders, 4th edition (DSM-IV) criteria or using other definitions; one with patients in treatment with an antipsychotic (risperidone) to which fluoxetine was added;71 one with breast-feeding mothers on antidepressants and their infants;69 and one with patients who developed hyponatremia while on antidepressants.77 All studies were cross-sectional in design. The studies were carried out in different ethnic groups. One study72 not included in Table 12 or 13 studied several antidepressants, including SSRIs and tricyclics, and the results could not be broken down by particular antidepressant type for different CYP polymorphisms.
The studies for individual SSRIs are summarized in Table 12. Paroxetine was the most studied SSRI, with six studies examining the effect of CYP2D6 polymorphism on paroxetine steady state plasma concentration. Fluoxetine was studied in four studies with respect to CYP2D6, 2C9, and 2C19 polymorphisms. Fluvoxamine and CYP2D6 polymorphism were studied in one study, and citalopram was studied with respect to CYP2C19 polymorphism in one study.
Data for calculating confidence intervals for differences in mean SSRI levels between EM and comparator groups (PM, heterozygous EM, etc.) were available for four studies of paroxetine, four of fluoxetine, and one of fluvoxamine (Table 13). The results for both paroxetine and fluoxetine were mixed, with some studies showing significant differences, and others not showing differences. The studies typically had small numbers of subjects, and hence the confidence intervals for differences in means were very wide, as shown in Table 13. For fluoxetine, two studies73,78 showed a significant difference in active moiety between CYP2C9 EMs and PMs, but failed to show differences in active moiety levels between EMs and PMs of CYP2D6 (data for Scordo et al., 200578 are not shown in Table 13, as results were reported as median and range rather than means ± standard deviation). Discussion
The 16 included studies provide mixed evidence regarding the first part of Question 3a (on possible correspondences between CYP450 genotypes and metabolism of particular SSRIs). In multiple dose studies of SSRIs, inconsistent results were obtained for individual SSRIs, and also for individual CYP enzymes.
Methodological issues in studies addressing this question include: (1) Single-dose studies in healthy volunteers:43,65,67,68 Clinical situations may be very
different from single-dose studies, because of the possible effects of the medication on CYP enzymes over time. Data from single-dose experiments cannot be extrapolated to long-term drug therapy, as saturation pharmacokinetics, irreversible enzyme blockade, or enzyme up- or down-regulation might change the outcome with multiple dosing.3,81,82
(2) Small sample sizes: All the studies had very small samples of the PM or ultra-rapid
metabolizer (UM) groups, and thus may not have been powered adequately to detect significant differences, as shown by wide confidence intervals.

42
(3) Heterogeneity: The studies were quite variable in terms of the population of interest, specific SSRIs considered, and specific CYP450 polymorphisms.
(4) Not accounting for multiple CYP enzymes that may be involved in metabolism of a
certain SSRI: Only one study73 took into account the possibility that more than one CYP enzyme might be involved in the metabolism of a certain SSRI and therefore controlled for polymorphisms in another enzyme.
(5) Not accounting for active metabolites of certain SSRIs like fluoxetine: Two studies
measured active moiety rather than parent drug alone,73,78 whereas two others did not.70,71 (6) Most studies for accounted for co-medications that may be inhibitors or substrates for the
enzyme being studied; one did not.69 Benzodiazepines were typically allowed in these psychiatric cohorts, as these drugs are metabolized mainly by CYP3A4 and have no influence on the enzymes studied.
(7) Diet was not taken into account in any study. (8) One study72 combined SSRIs and other antidepressants and examined effects of
polymorphisms of various CYP enzymes. Combining various SSRIs, and moreover SSRIs with other antidepressant medications, may have confounded results because of variability in the contribution of different CYP enzymes to metabolism of different SSRIs and other antidepressants, and variability in CYP inhibition by different SSRIs.
The quality assessment criteria we applied to individual studies in this report52 (Appendix E∗)
yielded a range of scores between “3b” and “4.” For the suggestion that the genotypes affect metabolism of SSRIs, the grade of recommendation based on available data would be “C.” Conclusions
In depressed patients treated with SSRIs, the existing data (a series of heterogeneous studies in small samples) do not support a clear correlation between CYP metabolizer status as predicted by genotyping and SSRI concentrations.
Question 3b: CYP450 Testing and Efficacy of SSRIs
Question 3b is: How well does CYP450 testing predict drug efficacy? Do factors such as race/ethnicity, diet, or other medications, affect this association? Approach
To address this question, we sought to identify all studies in which patients treated with SSRIs were tested for CYP450 genetic polymorphisms. Studies were included irrespective of
∗ Appendixes cited in this report are provided electronically at www.ahrq.gov/clinic/tp/cyp450tp.htm.

43
the method used for genotyping. Because of the overall paucity of data, we included studies that had diagnoses other than non-psychotic depression as an indication for SSRI treatment, as clinical outcomes in such scenarios may be indicative of genotype effects. We also included studies in which only a subgroup of patients was treated with SSRIs, while others were treated with other antidepressants, including tricyclics. Results
Note: Here, as throughout Chapter 3, the terms “poor metabolizer (PM),” “extensive metabolizer (EM),” etc., refer to general phenotypes (for a probe drug) as predicted by genotyping.
We identified only five studies that examined the association between CYP450 genotypes and SSRI efficacy (see Evidence Table 3, Appendix D∗). All studies were cross-sectional in design. All five studied CYP2D6 polymorphisms. One additionally studied 2C9 and 2C19 polymorphisms. Three studies examined depressed patients on antidepressant treatment (Table 14). Gerstenberg et al.83 found no differences in the proportion of responders among CYP2D6 EMs, intermediate metabolizers (IMs), and PMs treated with fluvoxamine. There were also no differences between the three groups on final Montgomery-Åsberg Depression Rating Scale (MADRS) scores, percent improvement, or amelioration score. Fluvoxamine steady-state concentrations were found to be significantly higher in responders than in non-responders, but were not reported by genotype. Grasmader et al.72 found that although plasma concentrations varied significantly between groups (with respect to 2D6 and 2C9 metabolizer status), levels above or below the lower limit of presumed therapeutic levels did not predict response. Murphy et al.74 found no differences in depression scores between two groups, CYP2D6 UMs + EMs versus PMs + IMs, treated with paroxetine. The groups were combined because of low numbers of UM and PM phenotypes.
∗ Appendixes cited in this report are provided electronically at www.ahrq.gov/clinic/tp/cyp450tp.htm.

44
Table 14. CYP450 predicted phenotypes and efficacy of SSRIs
Study/ design
Patient characteristics
SSRI(s) Alleles of interest
Predicted phenotypes
Results
Gerstenberg et al., 200383 Cross-sectional study
49 Japanese patients with depression
Fluvoxamine (50 mg 1st week, 100 mg 2nd week, and 200 mg in remaining 4 weeks)
2D6 *1, *3, *4, *5, *10
EMs = 25%; IMs = 55%; PMs = 20%
Final MADRS score, % improvement, amelioration score, and proportion of responders not significantly different in the 3 groups (EMs, IMs, PMs). Raw data and p-values NR
Grasmader et al., 200472 Cross-sectional study
136 depressed patients (70 on SSRIs), ethnicity NR (refers to Caucasians in conclusion)
Fluvoxamine, paroxetine, sertraline, citalopram
CYP2C9 *1 to *3, CYP2C19*1 and *2, 2D6 *1 to *9 and gene duplication
NR Plasma concentration above or below lower limit of presumed therapeutic levels did not predict response (p = 0.082 for CGI, p = 0.982 for HAM-D)
Murphy et al., 200374 Cross-sectional study
246 with depression, ethnicity NR
Paroxetine (n = 120) (and mirtazapine)
2D6: 16 alleles, deletion, duplication, and *41 allele
PMs = 6.5%; IMs = 10.5%; UMs = 4%; EMs = 79% For paroxetine, PM + IM (n = 15, 12.5% ) vs. EM + UM (n = 105, 87.5%)
No differences between PM + IM vs. EM + UM groups in depression measures (p-values NR)
Abbreviations: CGI = Clinical Global Impressions Scale; EM(s) = extensive metabolizer(s); HAM-D = Hamilton Rating Scale for Depression; IM(s) = intermediate metabolizer(s); MADRS = Montgomery-Åsberg Depression Rating Scale; NR = not reported; PMs = poor metabolizer(s); SSRI(s) = selective serotonin reuptake inhibitor(s); UM(s) = ultra-rapid metabolizer(s)
The remaining two studies examined the prevalence of different CYP2D6 genotypes in non-responders to adequate antidepressant treatment, including SSRIs (Table 15). Rau et al.84 found a three-fold increase in the frequency of CYP2D6 UMs in a group of 16 German depressed patients non-responsive to antidepressants (only five treated with SSRIs) in comparison to the general population. Kawanishi et al.85 found a significantly greater prevalence of 2D6 UM phenotypes in non-responders (subgroup of 81 Nordic Caucasian patients treated with 2D6 metabolized drugs) compared to the general population. “Worst week” Hamilton Rating Scale for Depression (HAM-D) scores were found to be higher in UMs than in EMs.

45
Table 15. Prevalence of CYP2D6 predicted phenotypes in non-responders to antidepressant treatment
Study/ design
Patient characteristics
SSRI(s) Alleles of interest
Results
Rau et al., 200484 Cross-sectional prevalence study
16 patients with non-response to SSRIs (n = 5), SNRIs, ethnicity NR (alludes to white)
Various SSRIs
2D6 *3, *4, *6, *2, *8, *10, *14, *41, *5
18% were UMs (3/16), compared to 2.5 to 3% in the general German population (5-fold increase; p = 0.0013)
Kawanishi et al., 200485 Cross-sectional prevalence study
108 Nordic Caucasians with depression and non-response to > 2 treatments
Various SSRIs, plus other classes of antidepressants
2D6 gene duplication, and *2, *3, *4, *5
Frequency of PM genotype was 0.028 (95% CI 0 to 0.058), less than in general population (0.068). Frequency of UMs in the subgroup of 81 subjects treated with CYP2D6 substrates was 9.9% (95%CI 3.4 to 16.4%), significantly greater than in the general Swedish (1%)/Danish (0.8%) populations (95% CI 0.2 to 1.4%)
Abbreviations: CI = confidence interval; EM(s) = extensive metabolizer(s); HAM-D = Hamilton Rating Scale for Depression; NR = not reported; PMs = poor metabolizer(s); SNRI(s) = serotonin/norepinephrine reuptake inhibitors; SSRI(s) = selective serotonin reuptake inhibitor(s); UM(s) = ultra-rapid metabolizer(s) Discussion
Based on the available evidence, a definitive association of CYP450 (2D6, 2C9, 2C19) genotypes and efficacy of SSRIs cannot be inferred.
Methodological issues in studies addressing this question include: (1) Study-design and power: None of the studies was a prospective randomized trial.
Three72,74,83 were observational or correlational studies, and two84,85 were pilot studies of prevalence of CYP polymorphisms in non-responders to antidepressant treatment. All the studies had very small numbers of patients in the UM groups.
(2) Only two studies74,83 studied individual SSRIs (fluvoxamine and paroxetine respectively),
while the others grouped the SSRIs together or with groups of other antidepressants. Combining various SSRIs, and moreover SSRIs with other antidepressant medications, may have confounded results because of variability in contribution of different CYP enzymes to metabolism of different SSRIs and other antidepressants, and variability in CYP inhibition by different SSRIs.
(3) The two prevalence studies considered84,85 have the obvious shortcoming of comparing
CYP2D6 UM prevalence in depressed non-responder patients to the UM prevalence in the general population. It is possible that CYP2D6 UM phenotype itself is associated with presence of severe depression that is treatment-resistant, which may have accounted for high prevalence of this phenotype in non-responders to antidepressant treatment. It would be more meaningful to compare prevalence rates between responders and non-

46
responders to a given SSRI, which would require a very large sample. In addition, neither of these studies specified exclusion criteria.
(4) The data considered do not lead to any conclusions about the possible impact of
race/ethnicity, diet, or other medications on the association between CYP450 genotypes and SSRI efficacy.
(5) Genetic factors affecting serotonin receptor proteins, membrane transporters, and signal
transduction molecules could also have important pharmacodynamic effects that could affect SSRI efficacy.86 Thus, examining the impact of pharmacokinetic variability resulting from CYP enzyme polymorphisms on SSRI efficacy in isolation may not be optimal.
The quality assessment criteria we applied to individual studies in this report52 (Appendix E∗)
yielded a range of scores between “3b” and “4.” For the suggestion that CYP450 genotypes do not affect SSRI efficacy, the grade of recommendation based on available data would be “C.” Conclusions
Because of the poor quality of relevant data that could be identified to address the question, no firm conclusions can be drawn about the relationship between CYP450 genotypes and efficacy of SSRI treatment in patients with non-psychotic depression.
Question 3c: CYP450 Testing and Adverse Drug Reactions
Question 3c is: How well does CYP450 testing predict adverse drug reactions? Do factors such as race/ethnicity, diet, or other medications, affect this association? Approach
To address this question, we sought to identify all studies in which patients treated with SSRIs were tested for CYP450 genetic polymorphisms. Studies were included irrespective of the method used for genotyping. Because of the overall paucity of data, we included studies that had diagnoses other than non-psychotic depression as an indication for SSRI treatment, as clinical outcomes in such scenarios may be indicative of genotype effects. We also included studies in which only a subgroup of patients was treated with SSRIs, while others were treated with other antidepressants, including tricyclics. Studies that specifically examined adverse effects were particularly sought.
∗ Appendixes cited in this report are provided electronically at www.ahrq.gov/clinic/tp/cyp450tp.htm.

47
Results
Note: Here, as throughout Chapter 3, the terms “poor metabolizer (PM),” “extensive metabolizer (EM),” etc., refer to general phenotypes (for a probe drug) as predicted by genotyping.
We identified nine studies that met our inclusion criteria (see Evidence Table 4, Appendix D∗). Of these, three reported the incidence of adverse effects in PMs, but this outcome was not central to the aims of the study.43,72,87 These studies do not add any information of value to the discussion and are not considered further here. The remaining six studies are summarized in Table 16.
Table 16. CYP450 predicted phenotypes and adverse effects associated with SSRIs
Study/design Patient characteristics
SSRI(s) Alleles of interest
Predicted phenotypes
Results
Chen et al., 199688 Cross-sectional prevalence study
74 patients, ethnicity NR
Various, including paroxetine, fluoxetine, sertraline, fluvoxamine, (also TCAs)
2D6 – A, B, D, E, and T alleles
NR PM phenotype was significantly more frequent in depressed patients (n = 18; 44%) reporting adverse effects to substrate of 2D6 compared to a random group (n = 56; 21%) of depressed patients (p < 0.05), or compared to the general population
Rau et al., 200484 Cross-sectional prevalence study
28 patients with adverse effects to SSRIs (9 patients), SNRIs, ethnicity NR (alludes to white)
Various SSRIs
2D6 *3, *4, *6, *2, *8, *10, *14, *41, *5
PM: 29% IM: 7% EM: 64% UM: 0
29% PMs compared to 7% in the German population (p < 0.0001). There were no differences between PM, IM, and EM groups in frequency of dose reduction (p = 0.14), stopping treatment (p = 0.51), reducing or terminating antidepressant (p = 0.39), or number of adverse effects (p = 0.12)
Gerstenberg et al., 200383 Cross-sectional study
49 Japanese Fluvoxamine (50 mg 1st week, 100 mg 2nd week, and 200 mg in remaining 4 weeks)
2D6 *1, *3, *4, *5, *10
PM: 20% EM: 25% IM: 55%
Incidence of adverse effects (nausea) was not significantly different between the 3 groups (raw data and p-value NR)
Abbreviations: CI = confidence interval; DSM-IV = Diagnostic and Statistical Manual for Mental Disorders, 4th edition; EM(s) = extensive metabolizer(s); GI = gastrointestinal; HAM-D = Hamilton Rating Scale for Depression; IM(s) = intermediate metabolizer(s); MADRS = Montgomery-Åsberg Depression Rating Scale; NR = not reported; PMs = poor metabolizer(s); SNRI(s) = serotonin/norepinephrine reuptake inhibitors; SSRI(s) = selective serotonin reuptake inhibitor(s); TCAs = tricyclic antidepressants; UM(s) = ultra-rapid metabolizer(s)
∗ Appendixes cited in this report are provided electronically at www.ahrq.gov/clinic/tp/cyp450tp.htm.

48
Table 16. CYP450 predicted phenotypes and adverse effects associated with SSRIs (continued)
Study/design Patient characteristics
SSRI(s) Alleles of interest
Predicted phenotypes
Results
Murphy et al., 200374 Cross-sectional study
246 patients, ethnicity NR
Paroxetine (and mirtazapine, not reported here)
2D6: 16 alleles, deletion, duplication, and *41 allele
PM: 6.5% IM: 10.5% UM: 4% EM: 79%
No differences between PM + IM vs. EM + UM groups in severity of adverse effects or frequency of discontinuation (p-values NR)
Roberts et al., 200489 Cross-sectional study
125 patients, ethnicity NR
Fluoxetine n = 65 (randomized to fluoxetine or nortriptyline)
2D6 alleles *1 to * 16, *19, *20
PM: 9% EM: 91%
PMs were no more likely to experience adverse effects than EMs (17% of PMs vs 41% of EMs) and were no more likely to drop out of the study than EMs (PMs 33% vs. EMs 14%) (p-values NR)
Suzuki et al., 200690 Cross-sectional study
97 Japanese Fluvoxamine (25-200 mg)
2D6 alleles *5, *10
PM: 22.7% EM: 77.3%
Greater prevalence of GI side effects in PMs compared to EMs (p = 0.043; CI 1.019 to 3.254). Discontinuation rates similar between PMs and EMs (p = 0.310)
All six studies examined CYP2D6 polymorphisms only. Three of the six studies reported no differences in rates of adverse effects between PMs and EMs,83,84,89 while a fourth74 reported no differences in adverse effects between the combined PM + IM and EM + UM groups. One study found a greater prevalence of gastrointestinal (GI) adverse effects in PMs compared to EMs.90 This study also found that the combination of CYP2D6 polymorphism and serotonin receptor 5HT2A polymorphism predicted GI adverse effects, such that PM + GG and PM +AG had a significantly greater risk of developing GI side effects compared to EM + AA.
Two studies84,88 found a significantly higher prevalence of PMs in depressed patients with adverse effects than in the general population. One of these88 also found the PM phenotype to be more frequent in depressed patients with adverse effects than in a random group of depressed patients. Studies that reported types of adverse effects reported a range of typical SSRI adverse effects including but not limited to anxiety, agitation, restlessness, nausea, GI upset, headache, sleep disturbance, and sexual dysfunction.83,84,89 The most common adverse effect reported in studies was nausea. Discussion
Although four studies did not find any differences in adverse effects in PMs versus EMs, these studies are heterogeneous, with major methodological problems, including:
(1) Study design and power: None of the studies was a prospective randomized trial.
Four74,83,89,90 were observational or correlational studies, and two84,88 were pilot studies of the prevalence of CYP polymorphisms in patients who had adverse effects with antidepressant treatment. All the studies had very small numbers of patients in the PM groups.

49
(2) Three studies examined individual SSRIs74,83,89 (paroxetine, fluvoxamine, and fluoxetine, respectively), whereas the other two grouped the SSRIs together or with groups of other antidepressants. Combining various SSRIs, and moreover SSRIs with other antidepressant medications, may have confounded results because of variability in contribution of different CYP enzymes to metabolism of different SSRIs and other antidepressants, and variability in CYP inhibition by different SSRIs.
(3) The two prevalence studies considered84,88 did not specify exclusion criteria. Moreover,
comparing a group of patients with adverse effects to a particular SSRI to a group of patients with no adverse effects to that SSRI may have been more meaningful, but will require a large number of patients.
(4) The data considered do not lead to any conclusions about the possible impact of
race/ethnicity, diet, or other medications, on the association between CYP450 genotypes and adverse effects to SSRIs.
(5) Genetic factors affecting serotonin receptor proteins, membrane transporters, and signal
transduction molecules could also have important pharmacodynamic effects that could affect SSRI tolerability.86 Thus, examining impact of pharmacokinetic variability resulting from CYP enzyme polymorphisms on SSRI tolerability in isolation may not be optimal. Only one study90 addressed this issue and did in fact show combined effects of CYP2D6 and 5HT2A polymorphisms on GI adverse effects, further supporting this point.
The quality assessment criteria we applied to individual studies in this report52 (Appendix E∗)
yielded a range of scores between “2b” and “4.” For the suggestion that CYP450 genotypes do not affect SSRI tolerability, the grade of recommendation based on available data would be “C.”
Conclusions
Because of the poor quality of relevant data that could be identified to address the question, no firm conclusions can be drawn about the relationship between CYP450 genotypes and tolerability of SSRI treatment in patients with non-psychotic depression.
Question 4: Management Decisions, Clinical
Outcomes, and Decisionmaking
Question 4 is: (a) Does CYP450 testing influence depression management decisions by patients and
providers in ways that could improve or worsen outcomes? (b) Does the identification of the CYP450 genotypes in adults entering SSRI treatment for
non-psychotic depression lead to improved clinical outcomes compared to not testing?
∗ Appendixes cited in this report are provided electronically at www.ahrq.gov/clinic/tp/cyp450tp.htm.

50
(c) Are the testing results useful in medical, personal, or public health decisionmaking? To address this question, we sought to identify studies in which patients treated with SSRIs
were tested for CYP450 genetic polymorphisms, and in which investigators reported on the impact of such testing on outcomes or on medical, personal, or public health decisionmaking. Even after relaxing our inclusion criteria to include all methods used for genotyping and all indications for SSRI treatment, we were unable to identify any studies that directly addressed any aspect of this question. In addition, we did not find any studies examining the effect of CYP genotypes on SSRI inhibition of CYP enzymes, leading to adverse effects associated with concurrent medications.
Question 5: Harms Associated With CYP450 Testing and
Subsequent Management Options
Question 5 is: What are the harms associated with testing for CYP450 polymorphisms and subsequent management options?
To address this question, we sought to identify studies in which patients treated with SSRIs were tested for CYP450 genetic polymorphisms, and in which investigators reported on harms or negative outcomes associated with testing or with subsequent management options. It may be hypothesized that, like other genetic tests, CYP genotyping could raise issues of labeling (“treatment-resistant” in the case of UMs) in the minds of providers, patients, or third-party payers that may negatively impact outcomes. This question of harm therefore is very relevant as we consider feasibility of CYP genotyping in practice.
Even after relaxing our inclusion criteria to include all methods used for genotyping and all indications for SSRI treatment, we were unable to identify any studies that directly addressed any aspect of this question.
Model of Treatment for Major Depression
This section explores the potential clinical impact of CYP450 genotype testing as a guide to therapy of patients newly diagnosed with depression.
Background
In deciding whether to use CYP450 genotype testing to guide depression therapy, it would be ideal to have direct scientific studies demonstrating that use of genotype testing leads to improved clinical outcomes. In the absence of such direct evidence, decision modeling can be used to provide indirect evidence based, for example, on the relationship between genotype and specific serotonin selective reuptake inhibitor (SSRI) metabolism (phenotype), and the relationship between phenotype and responsiveness to therapy. Examining these clinical relationships is of paramount importance. Genetic testing, like all forms of diagnostic tests, should only be promoted if the potential benefits (such as improved response to treatment for depression) outweigh the potential harms (such as increased adverse effects).

51
Decision analysis is a tool that provides a mechanism for inferring the likely outcomes of competing options by modeling the relationship between each option and the outcome of interest. Such decision models provide a framework for linking information from multiple sources (e.g., epidemiological studies, test performance studies, treatment efficacy studies, and surveys of patient preferences and quality of life). In addition to providing a “best guess” about the impact of a particular decision, decision models can offer insight into the dynamic relationship between various clinical inputs and decision relevant outcomes – under what circumstances is one decision preferred over others? This use of a decision model is especially valuable when the input data are not particularly strong, as is the case here.
We constructed and evaluated a decision model to address the question: Under what circumstances would genetic testing for CYP isoenzymes during the initial evaluation of an individual with non-psychotic major depression lead to a better clinical outcome, when compared to empiric SSRI therapy? Methods
Population. The population of interest for the model was treatment-naïve adults who met the DSM-IV criteria for major depression. They were otherwise generally healthy and not taking medications that could interact with SSRIs.
Model structure. The model is a simple tree structure (Figure 2) with four options: (1) do not test and treat empirically with an SSRI not affected by genotype; (2) test and use the results to select an SSRI that is or is not affected by genotype; (3) test and use the results to select the dose of an SSRI affected by genotype; or (3) do not test and treat empirically with an SSRI affected by genotype. In this analysis, we were not focusing on any particular SSRI; however, the issue is illustrated by the examples of fluoxetine and sertraline. Fluoxetine is a generic and inexpensive medication that is primarily metabolized by the 2D6 enzyme, and sertraline is a more expensive medication that is not.87 Although the overall response rate for standard dosing of fluoxetine (40 mg) is similar to that for sertraline, the adverse event rate is likely to be higher in those with poor metabolism (due to higher than normal serum concentrations), and the response rate lower in those with ultra-rapid metabolism (due to lower than normal serum concentrations). In this setting, empiric therapy with the non-CYP metabolized medication will always be the most effective strategy since it eliminates the potential for complications related to enzyme metabolism; however, the higher cost limits its widespread availability.
For each strategy, an individual could have one of three phenotypes: ultra-rapid metabolizer, extensive metabolizer/intermediate metabolizer, or poor metabolizer, with a probability based on the distribution of phenotypes in the population. We combined the extensive and intermediate metabolizers into a single phenotype to simplify the model since there was little data to support a difference in response to therapy for these two groups. For the first model strategy (use of a non-CYP metabolized SSRI without testing), the likelihood of treatment success is assumed to be the same for all phenotypes. For the second option (use of genetic testing to select SSRI), patients with genotypes that correspond to phenotypes with a high probability of treatment failure (ultra-rapid and poor metabolizers) would receive the more expensive non-CYP metabolized medication, while those not at high risk (extensive and intermediate metabolizers) would receive the less expensive CYP metabolized one. For the third option (use of genetic testing to select dose of SSRI), results of the genetic test are used to adjust the dose of the CYP metabolized medication. A low dose would be used for poor metabolizers, a standard dose for extensive and

52
Figure 2. Model structure early response
early failurephenotype ultra-rapid
early response
early failurephenotype extensive or intermediate
early response
early failurephenotype poor
treat cyp metabolized medicationTest none: Cyp All
early response
early failuretx high dose-cyp medgenotype ultra-rapid
early response
early failuretx mod dose-cyp medgenotype extensive or intermediate
early response
early failuretx low dose-cyp medgenotype poor
phenotype ultra-rapid
early response
early failuretx high dose-cyp medgenotype ultra-rapid
early response
early failuretx mod dose-cyp medgenotype extensive or intermediate
early response
early failuretx low dose-cyp medgenotype poor
phenotype extensive or intermediate
early response
early failuretx high dose-cyp medgenotype ultra-rapid
early response
early failuretx mod dose-cyp medgenotype extensive or intermediate
early response
early failuretx low dose-cyp medgenotype poor
phenotype poor
Test All: Cyp Dose adjust
early response
early failuretx non-cyp medgenotype ultra-rapid
early response
early failuretx cyp medgenotype extensive or intermediate
early response
early failuretx non-cyp medgenotype poor
phenotype ultra-rapid
early response
early failuretx non-cyp medgenotype ultra-rapid
early response
early failuretx cyp medgenotype extensive or intermediate
early response
early failuretx non-cyp medgenotype poor
phenotype extensive or intermediate
early response
early failuretx non-cyp medgenotype ultra-rapid
early response
early failuretx cyp medgenotype extensive or intermediate
early response
early failuretx non-cyp medgenotype poor
phenotype poor
Test All: Cyp and Non-Cyp
early response
early failurephenotype ultra-rapid
early response
early failurephenotype extensive or intermediate
early response
early failurephenotype poor
treat non-cyp metabolized medicationTest none: Non-Cyp All
Is CYP testing useful in depression?
Key to Figure 2: Figure represents the possible results of four clinical strategies: (1) Test none: Non-CYP All – no testing and treat empirically with a non-CYP metabolized SSRI; (2) Test All: CYP Dose Adjust – select dose based on genotype; (3) Test All: CYP and non-CYP – use genotype to select either a CYP or non-CYP metabolized SSRI or (4) Test none: CYP – no testing and treat with a CYP metabolized SSRI.

53
intermediate metabolizers, and a high dose for ultra-rapid metabolizers. For the fourth option (use of a CYP metabolized SSRI without testing), the likelihood of treatment success depends upon phenotype.
The model was created as a decision tree using TreeAge ProSuite 2006 (TreeAge Software Inc, Williamstown, MA)
Model parameters. The estimate and source for each model parameter are shown in Tables 15 and 16. For the purposes of this model our estimates for efficacy of therapy were based upon fluoxetine for the CYP metabolized SSRI and sertraline for the non-CYP metabolized SSRI.
Table 17. Basic model parameter estimates
Description Value Source
Prevalence ultra-rapid metabolizers in general depressed population 0.03 Grasmader et al., 2004;68 Charlier et al., 200366
Prevalence of extensive metabolizers in general depressed population 0.86 Grasmader et al., 2004;68 Charlier et al., 200366
Prevalence of poor metabolizers in general depressed population 0.11 Grasmader et al., 2004;68 Charlier et al., 200366
Utility of untreated depression 0.32 Bennett et al., 200088
Utility of treated depression 0.99 Expert opinion
Probability of responding to sertraline 0.56 Rossini et al., 200589
Cost of medication primarily metabolized by CYP450 (fluoxetine) 12 Anonymous90
Cost of medication not primarily metabolized by CYP450 (sertraline) 130 Anonymous90
Cost of genetic testing 1000 Palylyk-Colwell, 200691
Table 18. Model parameters for the relationship between testing and predicted clinical response
Description High correlation
Low correlation
Probability phenotype poor will have genotype poor 0.58 0.35
Probability phenotype poor will have genotype extensive 0.37 0.39
Probability phenotype poor will have genotype ultra-rapid 0.05 0.26
Probability phenotype extensive will have genotype poor 0.2 0.23
Probability phenotype extensive will have genotype extensive 0.45 0.35
Probability phenotype extensive will have genotype ultra-rapid 0.35 0.42
Probability phenotype ultra-rapid have genotype poor 0.14 0.13
Probability phenotype ultra-rapid will have genotype extensive 0.49 0.36
Probability phenotype ultra-rapid will have genotype ultra-rapid 0.5 0.38
Probability of responding to high dose fluoxetine if phenotype ultra-rapid 0.61 0.56
Probability of responding to high dose fluoxetine if phenotype extensive 0.5 0.45
Probability of responding to high dose fluoxetine if phenotype poor 0.4 0.21
Probability of responding to medium dose fluoxetine if phenotype ultra-rapid 0.5 0.45
Probability of responding to medium dose fluoxetine if phenotype extensive 0.61 0.56

54
Table 18. Model parameters for the relationship between testing and predicted clinical response (continued)
Probability of responding to medium dose fluoxetine if phenotype poor 0.5 0.45
Probability of responding to low dose fluoxetine if phenotype ultra-rapid 0.4 0.21
Probability of responding to low dose fluoxetine if phenotype extensive 0.5 0.45
Probability of responding to low dose fluoxetine if phenotype poor 0.61 0.56
In clinical decisionmaking, a key question is the probability that any particular genotype will
correspond to a particular level of drug metabolism (phenotype). This question is paramount since the phenotype is purported to effect the likelihood of treatment success, both effectiveness and adverse effects. However, the available literature presents limited data on these essential probability estimates. In the absence of data, we used the technique of bootstrapping to backwards calculate probabilities which were consistent with the two correlation coefficients (0.2 and 0.8). Specifically, we created a series of tables (genotype x phenotype) in which synthetic patient samples were assigned to cells with the target correlation coefficient; the cells were divided by the row totals, and the resulting elements were the estimated probabilities that a specific genotype would be associated with a specific phenotype. We repeated this exercise for both levels of correlation on each genotype to phenotype pair. For example, when the correlation between genotype and phenotype is 0.8 (high), the estimated probability that an ultra-rapid phenotype will have an ultra-rapid genotype is 0.5; if the correlation is 0.2 (low), the estimated probability is only 0.38.
The clinical predictive value of phenotype is reflected in the model as the probability that an individual with a specific phenotype will respond to a specific SSRI. These estimates were based upon expert opinion; however, their clinical plausibility was verified by comparing calculated overall population response rates (using the estimates and known prevalence rates) to published response rates.
As a practical strategy for examining the impact of variations in the relationship between genotype and phenotype, and between phenotype and clinical response, we created four scenarios for levels of linkage between genotype and clinical outcome. These four scenarios corresponded to the four possible combinations of level of correlation between genotype and phenotype (high or low), and correlation between phenotype and clinical response (high or low).
Response rates for the non-CYP metabolized medication were assumed to be the same for all three genotypes since metabolism is not affected significantly by any one of the polymorphisms. For the purposes of this model we assumed that the analytic sensitivity and specificity of the genetic testing used in the field compared to a gold standard genetic testing was 100 percent.
In order to understand the impact of each strategy on quality of life, patient outcomes were adjusted by a quality of life multiplier. This multiplier intended to represent patient preferences for a given health state as a utility. We used the utility of moderate depression to represent those individuals who did not respond to medication by 6 weeks, and a utility very close to that of non-depressed healthy individuals for those who did.88
Outcomes. We estimated two different clinical outcomes at 6 weeks: percent response to medical therapy and cumulative quality-adjusted survival at 6 weeks (in years). Response to medical therapy was defined as a 50 percent or greater improvement as measured by the HAM-D scale. We chose to measure these outcomes at 6 weeks, since response to an initial 6-week trial predicts both ultimate success with a medication and adherence to it. Longer time frames do not improve the response to initial therapy, and since adverse effects are rarely serious, the greatest

55
potential benefit of genetic testing will be to improve initial response rates. In addition, we calculated the average cost for each strategy over a single trial of therapy (6 weeks).
Analyses. In decision modeling it is typical to create a best-guess or “base case” estimate of outcomes. Given the lack of high quality data permitting a credible point estimate for model inputs, we chose to provide results for each of the four levels of linkage, described above. For each of these levels, we also performed one-way sensitivity analysis on all other model inputs (that is, other than probabilities related to the levels of linkage.) Results
The outcomes for each of the four analyses are presented in Figures 3 and 4.
Figure 3. Model results at 6 weeks for response rate
Response Rate for Each Strategy at 6 Weeks
44%
46%
48%
50%
52%
54%
56%
58%
Low ModeratelyLow
ModeratelyHigh
High
Linkage Level
Res
pons
e R
ate
Test All- Cyp dose adjTest All-Cyp and Non-CypTest None-CypTest None-nonCyp
Key to Figure 3: Low – low correlation between genotype and phenotype and low correlation between phenotype and clinical outcome; Moderately Low – low correlation between genotype and phenotype and high correlation between phenotype and clinical outcome; Moderately High – high correlation between genotype and phenotype and low correlation between phenotype and clinical outcome; High - high correlation between genotype and phenotype and phenotype and clinical outcome.

56
Figure 4. Model results at 6 weeks for quality adjusted life
Quality Adjusted Life at 6 Weeks for Each Strategy
0.610.620.630.640.650.660.670.680.690.70
Low ModeratelyLow
ModeratelyHigh
High
Linkage Level
Qua
lity
Adj
uste
d Li
fe 6
Wee
ks
Test All- Cyp dose adjTest All-Cyp and Non-CypTest None-CypTest None-nonCyp
Key to Figure 4: Low – low correlation between genotype and phenotype and low correlation between phenotype and clinical outcome; Moderately Low – low correlation between genotype and phenotype and high correlation between phenotype and clinical outcome; Moderately High – high correlation between genotype and phenotype and low correlation between phenotype and clinical outcome; High – high correlation between genotype and phenotype and phenotype and clinical outcome.
For each of the four scenarios, treating with a non-CYP metabolized SSRI without testing was the most effective strategy, while treating with a CYP metabolized SSRI was the least effective. Of the two testing strategies examined, using testing to guide use of a CYP- versus a non-CYP metabolized SSRI was superior to using testing to guide the dose of a non-CYP SSRI, both in terms of response rates and quality-adjusted life. However, as the level of linkage between genotype and phenotype increased, the difference in efficacy between the two testing strategies and between the testing strategies and the dominant strategy narrowed, such that at the high linkage level both testing strategies approached the efficacy of the optimal strategy of using a non-CYP metabolized SSRI. For example, in the low linkage scenario, the difference between the two testing strategies was 7.92 % in response rate and 0.04 years for cumulative quality-adjusted survival, while in the high linkage scenario the difference was only 0.78% in response rate and 0.005 years for cumulative quality-adjusted survival at 6 weeks.
One-way sensitivity analyses were performed for the following variables: prevalence of each phenotype, utility of depression, probability of responding to sertraline, cost of fluoxetine, cost of sertraline, and cost of genetic testing. The results of these analyses (not shown) were robust, with the relationship between the various options remaining similar at all levels of linkage between genotype and clinical response.
Because of the non-trivial cost of testing, 6-week costs are always greater for the testing strategy (results not shown), even when compared to the strategy of using a non-CYP metabolized drug without testing. For example, using genetic testing to guide medication choice cost $909 more than empiric therapy with a non-CYP medication, while using genetic testing to guide CYP dosing cost $882 more. The least effective strategy was also the least expensive- empiric treatment with a CYP metabolized medication cost $118 less than the empiric treatment

57
with a non-CYP medication. However, if the length of treatment is expected to exceed approximately 9 months, the cost of the test strategies break even.
Discussion
In this analysis of the potential impact of CYP450 genotype testing on treatment outcomes in a trial of SSRI therapy, use of a non-CYP metabolized SSRI without testing was always the most effective strategy, and use of a CYP metabolized SSRI was always least effective. The two genetic testing strategies considered (testing as a guide to use of a CYP or non-CYP metabolized SSRI) had intermediate efficacy. The degree of efficacy depended primarily on the linkage between genotype and clinical outcome. At relatively low levels of linkage testing provides little benefit over use of a CYP metabolized SSRI without testing. Testing approached the optimal efficacy only at the highest levels of linkage between genotype and clinical outcome. Further, the modeling exercise suggests that the most important element of the link is the ability of genotype to predict phenotype. It is notable that these results apply even though it was assumed that the analytic validity of the test used (ability of the test to discern true genotype) was perfect.
Given the lack of evidence regarding many of the model inputs, it is important not to overstate the specific numerical results. However, the analysis does provide insight into the reasons why various strategies may or may not be clinically desirable. What is easiest to explain is the superiority of the strategy using a non-CYP drug without testing. The reason is that we assume that non-CYP medications do not have increased adverse event rates or reduced response rates in the poor and ultra-rapid metabolizers, respectively, and the CYP drug was assumed to never be superior for any phenotype. What may be less evident is why neither testing strategy was optimal for any combination of plausible model inputs. The explanation is that an imperfect genetic test (i.e., one that provides less than perfect guidance to metabolism, efficacy, or adverse effects) can lead to worse outcomes for misclassified individuals. When ultra-rapid or poor metabolizers are misclassified as extensive metabolizers, they are mistakenly managed with higher risk treatments. In the strategy in which testing is used to guide use of a CYP or non-CYP metabolized SSRI, misclassified individuals are given a CYP metabolized SSRI at standard doses, increasing their risk for adverse effects or lowering the probability of responding. In a strategy in which genetic testing is used to adjust the dose of a CYP metabolized SSRI, misclassified individuals are offered either very high or very low doses of the CYP metabolized SSRI, effectively doubling their risk of a poor outcome.
This basic analysis suggests that when non-CYP metabolized SSRIs are available, they should be used. When this approach is not feasible, CYP genotyping may provide similar patient outcomes if the test results can be shown to be highly predictive of clinical response. A difficulty in supporting the use of CYP450 genotype testing is the lack of evidence regarding the ability of CYP genotyping to guide treatment; if the correlation between genotype and outcomes is only modest, testing strategies are unlikely to be much more effective than treating with a CYP metabolized SSRI without testing. Also, since testing has its own cost, testing strategies do not save costs, even for the optimistic “high correlation” scenario, unless expected treatment duration exceeds approximately 9 months.
Clearly, studies of the relationship between genotype and clinical outcomes present a high value target for future research. Additional modeling which includes variable lengths of treatment, the possibility of treatment changes would help clarify the likely impact of CYP 450 genotype testing on long-term benefits, risks, and costs.


59
Chapter 4. Discussion
Context of the Report
The cytochrome P450 (CYP450) enzyme system is prominently involved in the metabolism of each of the currently available selective serotonin reuptake inhibitors (SSRIs). Pharmacokinetic variability resulting from CYP polymorphisms can potentially impact metabolism of SSRIs. It has been proposed that genotyping may provide information to guide selection and dosing of SSRI therapy, leading to improved efficacy and reduced adverse effects.
In this report we identified and evaluated published research and publicly available U.S. Food and Drug Administration (FDA) reports related to the use of CYP genotyping as it relates to the clinical care of individuals with severe non-psychotic depression, focusing on five key questions: (1) the impact of CYP450 genotyping on outcomes in the treatment of depression, and on medical, personal, and public health decisionmaking (overarching question); (2) the analytic validity of tests available for CYP450 genotyping; (3) the impact of CYP genotypes on SSRI metabolism, efficacy, and tolerability (i.e., clinical validity); (4) the impact of CYP testing on management decisions, clinical outcomes (vs. not testing), and decisionmaking (i.e., clinical utility); and (5) the potential harms associated with testing and with subsequent management options.
Limitations of the Literature Reviewed
We identified moderately good-quality evidence regarding the operating characteristics of clinical tests used for CYP genotyping (Question 2). However, there was a paucity of high-quality clinical studies addressing the other key questions. In particular, there was no evidence for Questions 1, 4a, 4b, 4c, and 5, and evidence for questions 3a, 3b, and 3c was of limited quality.
Methodological issues identified include the following: • We did not find a single prospective study of CYP450 genotyping and its relationship to
clinical outcomes. Most studies were small, poor-quality cross-sectional studies examining prevalence rates of certain genotypes in the sample, or examining the differences between various genotypes and limited clinical outcomes, such as response or adverse effects.
• There were no randomized studies of alternative testing strategies.
• Almost all of the studies identified as reporting on a novel technique for CYP genotyping failed to report key measurements attesting to the robustness, repeatability and quality control of their proposed methods. Rarely was it possible to calculate the positive and negative predictive value of the tests and fully evaluate all aspects relevant to analytical validity. Additionally, often researchers tended to report allele frequencies, rather than genotype frequencies, preventing assessment of specificity and sensitivity in the clinically relevant level. Moreover, the small sample sizes which were utilized in most of

60
these studies severely diminish the reliability of the proposed tests, reflected in large confidence intervals.
• Many reports did not take into account concurrent medications. Medications that inhibit
or induce certain CYP enzymes, including SSRIs themselves, can affect metabolism of CYP metabolized drugs. Additionally, we did not identify any studies that examined effects of CYP inhibition/induction together with genetic polymorphisms of CYP enzymes (e.g., is there an additive effect of a CYP2D6 inhibitor medication in a CYP2D6 poor metabolizer [PM] subject such that SSRI levels are higher than the levels without such an inhibitor medication in a CYP2D6 PM subject?)
• Several studies looked at limited genotypes and did not account for the fact that more than one CYP enzyme may be involved in the metabolism of a specific SSRI.
• Many studies examining the clinical outcomes of efficacy or adverse effects did not comment on blinding between treating clinicians and those responsible for interpreting results of genetic testing, or patient blinding.
• Many studies grouped together multiple SSRIs, or SSRIs and other antidepressants. This
approach can potentially confound results because of variability in contribution of different CYP enzymes to metabolism of different SSRIs and other antidepressants, and variability in CYP inhibition by different SSRIs.
• We found only one study that examined combined effect of CYP 450 polymorphism and
polymorphism in serotonin 2A receptor.90 Genetic factors affecting serotonin receptor proteins, membrane transporters, and signal transduction molecules have important pharmacodynamic effects that could affect SSRI efficacy or tolerability.50,86,97-108 Thus, genetic factors other than pharmacokinetic factors can impact SSRI outcomes, and it may be suboptimal to examine effects of CYP polymorphisms on SSRI outcomes in isolation. Multivariable pathway analysis studies are now starting to emerge; any may provide more information regarding proportion of risk for poor outcomes in SSRI treatment of depression that may be attributable to a certain factor, such as CYP polymorphisms. A recent study109 searched for genetic predictors of treatment outcome in 1953 patients with non-psychotic major depression treated with the SSRI citalopram. Sixty-eight chosen candidate genes were genotypes, with 768 single-nucleotide polymorphism markers chosen to detect common genetic variation. A significant association was found between treatment outcome and HTR2A gene, which encodes the serotonin 2A receptor. Genes primarily involved in drug metabolism were excluded from this study, but are under study by another group using the same DNA samples. These forthcoming results may be particularly relevant to some of the questions posed in this report.
The rated quality of data did not improve even when we were generous in our inclusion
criteria and included studies examining SSRI treatment of conditions other than depression, or when we included other antidepressants in addition to SSRIs.

61
Main Findings by Key Question Question 1
We did not find any data to address directly the overarching question of whether testing for CYP450 polymorphisms in adults entering SSRI treatment for non-psychotic depression leads to improvement in outcomes, or whether testing results are useful in medical, personal, or public health decisionmaking. Question 2
We identified only a few studies of test performance relative to the gold standard of DNA sequencing, applied to a limited number of genetic variants. Many studies appear to be in the realm of preclinical evaluations and are not clearly relevant to the domain of clinical practice.
These data do suggest that the analytic sensitivity and specificity of available tests are generally high. One concern may be that in the evaluation of gene deletions and duplications, assessing the magnitude of the potential problem is limited by the lack of an established gold standard for gene copy number. Another concern is that few CYP450 variants are included in the studies we identified, particularly less common variants. Question 3a
In healthy CYP2C19 PMs, there is evidence of slower metabolism of SSRIs after a single dose, whereas in CYP2D6 PMs, the evidence is weaker. In depressed patients who have reached a steady-state concentration of an SSRI, the existing data (a series of heterogeneous studies in small samples) do not support a clear correlation between CYP metabolizer status and SSRI concentrations. Question 3b
In depressed patients, the existing data (a series of heterogeneous studies in small samples) do not support a clear correlation between CYP metabolizer status and the efficacy of SSRIs. Question 3c
In depressed patients, the existing data (a series of heterogeneous studies in small samples) do not support a clear correlation between CYP metabolizer status and the tolerability of SSRIs. Questions 4a, 4b, 4c
We did not identify any studies that addressed whether CYP450 testing influences depression management decisions by patients and providers in ways that could improve or worsen outcomes, or whether testing for CYP450 polymorphisms in adults entering SSRI treatment for non-psychotic depression leads to improved clinical outcomes compared to not testing. Also, there

62
were no data examining whether testing results are useful in medical, personal, or public health decisionmaking. Question 5
There were no data on possible direct or indirect harms associated with testing for CYP450 polymorphisms and subsequent management options. Model of Treatment for Major Depression As a complement to the evidence review, we constructed a basic decision model to consider the circumstances under which testing for CYP polymorphisms could improve clinical outcomes, or favorably impact costs. We examined four strategies: (1) use a non-CYP metabolized SSRI without testing; (2) test and choose a non-CYP or CYP metabolized SSRI based on the result; (3) test and choose the dose of a CYP metabolized SSRI based on the result; and (4) use a CYP metabolized SSRI without testing. In no plausible scenario was a testing strategy predicted to improve expected outcomes of treatment at 6 weeks. The efficacy of a test strategy could approach the efficacy of use of a non-CYP metabolized drug, although this required the condition that a high correlation exist between genotype and phenotype (metabolizer status), as well as between phenotype and clinical outcomes. Current evidence does not support the conclusion that such high correlations apply. Moreover, the cost of testing is not offset by treatment savings if treatment duration is less than approximately 9 months.
Limitations of the Report
This report has two potentially significant limitations: • First, we included only articles published in English. While this could lead to missing
important studies, we suspect the likelihood of such exclusion is low, as we identified only one study that met the inclusion criteria at the abstract screening stage that was excluded at the full-text screening stage because the full report was in another language.110
• A second potential limitation is that we only included peer-reviewed publications and data publicly available from the FDA. This inclusion criterion was based on the judgment of the technical expert panel that it would be difficult to assess the quality of information from other sources (for example, data from manufacturer websites may be biased in favor of the product, or data from scientific meetings may be subject to change when published in peer-reviewed journals).
63
Chapter 5. Future Research
We propose the following conceptual model to guide future research in cytochrome P450 (CYP450) polymorphism testing for depression management. Broadly speaking, the rationale behind CYP450 testing in patients with non-psychotic depression is as follows:
(a) Major depressive disorder is a significant public health problem. (b) While selective serotonin reuptake inhibitors (SSRIs) are the first-line treatment for
depression, they are associated with a high rate of non-response to treatment, harboring a potential opportunity to improve public health by improving response rates to SSRI treatment.
(c) SSRI treatment efficacy involves modulation of brain levels of neurotransmitters and
consequent adjustments of related pathways, processes that require several weeks to achieve a new steady state. One factor that possibly makes identification of the optimal SSRI treatment (i.e., specific SSRI and/or optimal dose) difficult in a specific clinical situation is the CYP polymorphism-associated differences between patients in the rate of metabolism of SSRIs.
(d) CYP450 testing can potentially be used to predict the rate of SSRI metabolism (i.e., to
classify patients as poor, intermediate, extensive, or ultra-rapid metabolizers) and, thus, potentially can reduce the amount of trial and error required to select the optimal SSRI in a specific clinical situation.
(e) The better the operating characteristics of CYP450 testing in predicting metabolizer
status, the greater the potential of CYP450 testing to improve the process of identifying the optimal SSRI treatment.
(f) However, the more that factors other than CYP450 enzymes affect the metabolism of
SSRIs (e.g., environmental effects, concomitant medications) or SSRI-associated outcomes (e.g., genetic factors associated with the pharmacodynamics of SSRIs, including genetic variability in serotonin receptor proteins, or transporter proteins), the less useful CYP450 testing will be.
(g) Because depression is not often acutely life-threatening (except in severe cases with
suicidal ideation) and SSRIs are rarely associated with life-threatening adverse effects, the main impact of CYP450 testing is likely to be in reducing the time to find the optimal SSRI, and in reducing the likelihood of adverse effects that would have been expected to occur with a suboptimal SSRI that might have been prescribed in the absence of CYP450 testing, thereby potentially reducing disease-management costs.
(h) Finally, the impact of reducing the time to find the optimal SSRI and reducing the
likelihood of SSRI-related adverse effects during the initial dosing period is strong

64
enough to be important to patients (e.g., by improving their quality of life or decreasing absenteeism from work).
The eight elements described above can be specifically matched to our key questions as
follows:
Question 1: Points (a) through (h). Question 2: Point (e). Question 3a, 3b, 3c: Points (c), (d), (e), and (f). Question 4a, 4b, 4c: Points (g) and (h). Question 5: Points (c) through (h).
This report reviewed the literature pertaining to the above rationale and found that, although some information exists, as a whole it is not sufficient to draw firm conclusions about whether this rationale, while intuitively reasonable, is in fact true. Nevertheless, this rationale can be used to help classify the future research that we recommend would be helpful. In particular, two types of studies can be envisioned.
The first type of study would better elucidate individual steps in the above rationale. For example, although we do not recommend that any additional studies are needed for points (a) and (b), the other points need additional studies that could be designed as follows:
• Regarding point (c), studies that better describe the CYP polymorphism-associated
differences in the rate of metabolism of individual SSRIs between patients could be designed. These should overcome the limitations of current literature addressing this issue, such that they are adequately powered, address individual SSRIs, account for diet, and co-medications, particularly CYP inhibiting or inducing drugs.
• Regarding point (d), there is a need to perform studies of CYP genotyping in a large
variety of populations to ascertain sensitivity and specificity of genotyping as applicable in real-world settings. It is essential that such studies explore a large range of the known possible polymorphisms functionally affecting each enzyme, refraining from focusing solely on the detection of the major alleles relevant to Caucasians and African-Americans. In order to reliably assess the performance of these tests the sample sizes employed must bear power to report results within narrow margins of confidence interval, repeatedly and consistently concluding identical genotype calls.
• Regarding points (e) and (f), multivariable pathway analysis studies underway may
provide guidance regarding extent of variation in depression treatment response attributable to CYP enzymes, albeit this may reflect only a subset of patients treated with citalopram.109
• Regarding points (e), (f), and (g), studies that could better ascertain the predictive value
of CYP genotyping in depression treatment outcomes, and its impact on medical or personal decisionmaking, could be designed. The suggested study design would be a properly sized (likely to be large) randomized trial of CYP genotyping-guided treatment versus treatment as usual. Such a trial should be in keeping with design standards aimed

65
at minimizing bias (e.g., using intent-to-treat analysis, blinding of physicians and patients), maximizing generalizability (e.g., representative of individuals with severe non-psychotic depression), and including meaningful outcomes (e.g., short-term treatment success, satisfaction, resource utilization). Such a study would provide answers about rates of dropouts/non-response in individuals who were genotyped versus those who were not. It would also provide data about treatment decisions by providers and patients, based on genotyping, and the outcome of such genotyping-guided treatment (e.g., higher starting doses in ultra-rapid metabolizers or lower doses in poor metabolizers) in comparison to the current practice of “trial and error.” It may also provide valuable information about harms.
• Regarding point (h), studies that could better examine the importance to patients of
potential outcomes, such as time to response or quality of life during the early treatment of depression, could be designed. A suggested study would be a utility or a “willingness-to-pay” model to determine value of these outcomes to patients.
The second type of study would encompass multiple steps in the above rationale. In
particular, recognizing that having evidence in favor of all of the steps in the rationale only supports, but does not prove, the thesis that adopting CYP450 testing will improve patient outcomes, various randomized trials could be considered that would test this linkage directly. The simplest study would involve linking a specific genotype to SSRI type and dose. This would provide a direct test of the rationale provided by the foundational studies described above (i.e., when clinicians a treat in a way indicated by evidence, does it make a difference?). However, such a study would not be a direct test of the utility of genotyping in clinical practice if the utility of testing is highly patient-specific and not suitable to being described by an algorithm. In an alternative design, patients would be randomized to being genotyped, without mandating that treatment be based on the results. The most pragmatic, but also the most difficult type of study would be a “practical clinical trial.”111 Rather than randomizing by patient, such a study would involve randomizing clusters (e.g., clinicians, practices, or regions) to have genotyping available (or perhaps reimbursed) or not. This would provide a test of the overarching question, “What difference does having genotyping available make in clinical practice?”


67
Chapter 6. Conclusions
With pharmacogenetics and personalized medicine becoming everyday terms used in medicine, answering questions about the utility of genotyping as it relates to clinical practice has become vital. The practice of medicine in general and psychiatry in particular, involves many challenges, and as knowledge about the biological basis of diseases evolves, those diseases have to be redefined in the light of this new understanding; this redefinition, in turn, guides drug development for conditions such as depression. As we struggle to understand the different variables that influence response to antidepressant treatment, we need every answer that will take us closer to our goal of optimizing treatment for individual patients.
The evidence reviewed in this report demonstrates the high analytic sensitivity and specificity of tests for cytochrome P (CYP) genotyping, but for few of the known variants. The short list of papers addressing the key questions clearly demonstrates the lack of sufficient evidence for incorporation of any of these tests into guidelines for clinical practice. Moreover, the nature of most pharmacogenetic evidence is of rather low positive and negative predictive values, given the functional relevance of each variant and the genetic and biological context in which it is examined for each disease and drug scenario. As outlined in Chapter 5, there is a critical need to carry out research in ways that would help us answer as many questions as we can. We anticipate that the issue will not be one of safety, but rather one of decreasing morbidity and thereby improving quality of life in patients with non-psychotic depression. Considering the high prevalence of depressive disorders and the length of time required to determine whether a given antidepressant is successful or not, there may be a perceivable impact at the population level if even a small benefit can be demonstrated at the individual level.
Another reason for studying this question further is that as newer treatments for depression become available, the resolution of the question of CYP genotyping may help us apply the information to emerging treatments.
In conclusion, we recommend prospective studies of CYP450 genotyping in the treatment of non-psychotic depression with selective serotonin reuptake inhibitors (SSRIs) to examine the utility of such genotyping in clinical practice.


69
References Cited in the Evidence Report
1. Kessler RC, Berglund P, Demler O, et al. The epidemiology of major depressive disorder: results from the National Comorbidity Survey Replication (NCS-R). JAMA 2003;289(23):3095-105.
2. World Health Organization (WHO). Depression. Available at: www.who.int/mental_health/management/depression/definition/en. Accessed 26 April 2006.
3. Ustun TB, Ayuso-Mateos JL, Chatterji S, et al. Global burden of depressive disorders in the year 2000. Br J Psychiatry 2004;184:386-92.
4. Coryell W, Young EA. Clinical predictors of suicide in primary major depressive disorder. J Clin Psychiatry 2005;66(4):412-7.
5. Solomon DA, Keller MB, Leon AC, et al. Multiple recurrences of major depressive disorder. Am J Psychiatry 2000;157(2):229-33.
6. Druss BG, Rosenheck RA, Sledge WH. Health and disability costs of depressive illness in a major U.S. corporation. Am J Psychiatry 2000;157(8):1274-8.
7. Keller MB, Shapiro RW, Lavori PW, et al. Recovery in major depressive disorder: analysis with the life table and regression models. Arch Gen Psychiatry 1982;39(8):905-10.
8. Trivedi MH, Rush AJ, Wisniewski SR, et al. Evaluation of outcomes with citalopram for depression using measurement-based care in STAR*D: implications for clinical practice. Am J Psychiatry 2006;163(1):28-40.
9. Per-Sé Technologies. NDC Pharmaceutical Audit Suite (PHAST), 2005. Available at: www.ndchealth.com. Accessed 26 April 2006.
10. Sanchez C, Hyttel J. Comparison of the effects of antidepressants and their metabolites on reuptake of biogenic amines and on receptor binding. Cell Mol Neurobiol 1999;19(4):467-89.
11. Wong DT, Bymaster FP, Reid LR, et al. Norfluoxetine enantiomers as inhibitors of serotonin uptake in rat brain. Neuropsychopharmacology 1993;8(4):337-44.
12. MacGillivray S, Arroll B, Hatcher S, et al. Efficacy and tolerability of selective serotonin reuptake inhibitors compared with tricyclic antidepressants in depression treated in primary care: systematic review and meta-analysis. BMJ 2003;326(7397):1014.
13. Song F, Freemantle N, Sheldon TA, et al. Selective serotonin reuptake inhibitors: meta-analysis of efficacy and acceptability. BMJ 1993;306(6879):683-7.
14. Dufour H, Bouchacourt M, Thermoz P, et al. Citalopram--a highly selective 5-HT uptake inhibitor--in the treatment of depressed patients. Int Clin Psychopharmacol 1987;2(3):225-37.
15. Bjerkenstedt L, Flyckt L, Overo KF, et al. Relationship between clinical effects, serum drug concentration and serotonin uptake inhibition in depressed patients treated with citalopram. A double-blind comparison of three dose levels. Eur J Clin Pharmacol 1985;28(5):553-7.
16. Tasker TC, Kaye CM, Zussman BD, et al. Paroxetine plasma levels: lack of correlation with efficacy or adverse events. Acta Psychiatr Scand Suppl 1989;350:152-5.
17. Laursen AL, Mikkelsen PL, Rasmussen S, et al. Paroxetine in the treatment of depression--a randomized comparison with amitriptyline. Acta Psychiatr Scand 1985;71(3):249-55.
18. Danish University Antidepressant Group. Paroxetine: a selective serotonin reuptake inhibitor showing better tolerance, but weaker antidepressant effect than clomipramine in a controlled multicenter study. J Affect Disord 1990;18(4):289-99.
19. Kuhs H, Schlake HP, Rolf LH, et al. Relationship between parameters of serotonin transport and antidepressant plasma levels or therapeutic response in depressive patients treated with paroxetine and amitriptyline. Acta Psychiatr Scand 1992;85(5):364-9.
20. Kelly MW, Perry PJ, Holstad SG, et al. Serum fluoxetine and norfluoxetine concentrations and antidepressant response. Ther Drug Monit 1989;11(2):165-70.

70
21. Beasley CM Jr, Bosomworth JC, Wernicke JF. Fluoxetine: relationships among dose, response, adverse events, and plasma concentrations in the treatment of depression. Psychopharmacol Bull 1990;26(1):18-24.
22. Montgomery SA, Baldwin D, Shah A, et al. Plasma-level response relationships with fluoxetine and zimelidine. Clin Neuropharmacol 1990;13 Suppl 1:S71-5.
23. Fichtner CG, Jobe TH, Braun BG. Possible therapeutic window for serotonin reuptake inhibitors. J Clin Psychiatry 1994;55(1):36-8.
24. Cain JW. Poor response to fluoxetine: underlying depression, serotonergic overstimulation, or a "therapeutic window"? J Clin Psychiatry 1992;53(8):272-7.
25. Amsterdam JD, Fawcett J, Quitkin FM, et al. Fluoxetine and norfluoxetine plasma concentrations in major depression: a multicenter study. Am J Psychiatry 1997;154(7):963-9.
26. Rasmussen BB, Brosen K. Is therapeutic drug monitoring a case for optimizing clinical outcome and avoiding interactions of the selective serotonin reuptake inhibitors? Ther Drug Monit 2000;22(2):143-54.
27. Bradford LD. CYP2D6 allele frequency in European Caucasians, Asians, Africans and their descendants. Pharmacogenomics 2002;3(2):229-43.
28. Zackrisson AL, Holmgren P, Gladh AB, et al. Fatal intoxication cases: cytochrome P450 2D6 and 2C19 genotype distributions. Eur J Clin Pharmacol 2004;60(8):547-52.
29. Brosen K. Some aspects of genetic polymorphism in the biotransformation of antidepressants. Therapie 2004;59(1):5-12.
30. Obach RS, Cox LM, Tremaine LM. Sertraline is metabolized by multiple cytochrome P450 enzymes, monoamine oxidases, and glucuronyl transferases in human: an in vitro study. Drug Metab Dispos 2005;33(2):262-70.
31. Mandrioli R, Forti GC, Raggi MA. Fluoxetine metabolism and pharmacological interactions: the role of cytochrome p450. Curr Drug Metab 2006;7(2):127-33.
32. Olesen OV, Linnet K. Studies on the stereoselective metabolism of citalopram by human liver microsomes and cDNA-expressed cytochrome P450 enzymes. Pharmacology 1999;59(6):298-309.
33. Margolis JM, O'Donnell JP, Mankowski DC, et al. (R)-, (S)-, and racemic fluoxetine N-demethylation by human cytochrome P450 enzymes. Drug Metab Dispos 2000;28(10):1187-91.
34. Llerena A, Edman G, Cobaleda J, et al. Relationship between personality and debrisoquine hydroxylation capacity. Suggestion of an endogenous neuroactive substrate or product of the cytochrome P4502D6. Acta Psychiatr Scand 1993;87(1):23-8.
35. Harvey AT, Preskorn SH. Cytochrome P450 enzymes: interpretation of their interactions with selective serotonin reuptake inhibitors. Part II. J Clin Psychopharmacol 1996;16(5):345-55.
36. Gram LF, Hansen MG, Sindrup SH, et al. Citalopram: interaction studies with levomepromazine, imipramine, and lithium. Ther Drug Monit 1993;15(1):18-24.
37. Skjelbo E, Brosen K. Inhibitors of imipramine metabolism by human liver microsomes. Br J Clin Pharmacol 1992;34(3):256-61.
38. Rasmussen BB, Maenpaa J, Pelkonen O, et al. Selective serotonin reuptake inhibitors and theophylline metabolism in human liver microsomes: potent inhibition by fluvoxamine. Br J Clin Pharmacol 1995;39(2):151-9.
39. Piper MA. Special report: genotyping for cytochrome P450 polymorphisms to determine drug-metabolizer status. Blue Cross and Blue Shield Association Technology Evaluation Center Assessment Program. Volume 19, No. 9, December 2004. Available at: www.bcbs.com/tec/Vol19/19_09.pdf. Accessed 5 July 2006.
40. Roche Molecular Systems, Inc. U.S. Food and Drug Administration 510(k) Substantial Equivalence Determination Decision Summary for Roche AmpliChip CYP450 microarray for identifying CYP2D6 genotype (510(k) Number k042259). December 2004. Available at: www.fda.gov/cdrh/reviews/k042259.pdf. Accessed 19 April 2006.

71
41. Roche Molecular Systems, Inc. U.S. Food and Drug Administration 510(k) Substantial Equivalence Determination Decision Summary for Roche AmpliChip CYP450 microarray for identifying CYP2C19 genotype (510(k) Number k043576). January 2005. Available at: www.fda.gov/cdrh/reviews/k043576.pdf. Accessed 19 April 2006.
42. Ingelman-Sundberg M, Oscarson M, McLellan RA. Polymorphic human cytochrome P450 enzymes: an opportunity for individualized drug treatment. Trends Pharmacol Sci 1999;20(8):342-9.
43. Wang JH, Liu ZQ, Wang W, et al. Pharmacokinetics of sertraline in relation to genetic polymorphism of CYP2C19. Clin Pharmacol Ther 2001;70(1):42-7.
44. Hamilton M. A rating scale for depression. Journal of Neurology, Neurosurgery & Psychiatry 1960;23:56-62.
45. Montgomery SA, Asberg M. A new depression scale designed to be sensitive to change. Br J Psychiatry 1979;134:382-9.
46. Ware JE Jr, Sherbourne CD. The MOS 36-item short-form health survey (SF-36). I. Conceptual framework and item selection. Med Care 1992;30(6):473-83.
47. Sheehan DV. Sheehan Disability Scale (1983). In: American Psychiatric Association Task Force for the Handbook of Psychiatric Measures. Handbook of psychiatric measures. Washington, DC: American Psychiatric Association; 2000. p. 113-5.
48. Endicott J, Nee J, Harrison W, et al. Quality of Life Enjoyment and Satisfaction Questionnaire: a new measure. Psychopharmacol Bull 1993;29(2):321-6.
49. Kotz S, Johnson NL, Read C, et al. Encyclopedia of statistical sciences. Vol. 4, Icing the tails-limit theorems. New York: John Wiley and Sons; 1983. p. 352-4.
50. Kirchheiner J, Nickchen K, Bauer M, et al. Pharmacogenetics of antidepressants and antipsychotics: the contribution of allelic variations to the phenotype of drug response. Mol Psychiatry 2004;9(5):442-73.
51. Wang C, Chung M, Lichtenstein A, et al. Effects of Omega-3 Fatty Acids on Cardiovascular Disease. Evidence Report/Technology Assessment No. 94 (Prepared by Tufts-New England Medical Center Evidence-based Practice Center, under Contract No. 290-02-0022). AHRQ Publication No. 04-E009-2. Rockville, MD: Agency for Healthcare Research and Quality. March 2004. Available at: www.ahcpr.gov/clinic/tp/o3cardtp.htm. Accessed 5 July 2006.
52. Phillips B, Ball C, Sackett D, et al. Oxford Centre for Evidence-based Medicine Levels of Evidence (May 2001). Available at: www.cebm.net/levels_of_evidence.asp#levels. Accessed 21 April 2006.
53. Neville M, Selzer R, Aizenstein B, et al. Characterization of cytochrome P450 2D6 alleles using the Invader system. Biotechniques 2002;Suppl:34-8, 40-3.
54. Eriksson S, Berg LM, Wadelius M, et al. Cytochrome p450 genotyping by multiplexed real-time DNA sequencing with pyrosequencing technology. Assay Drug Dev Technol 2002;1(1 Pt 1):49-59.
55. Hersberger M, Marti-Jaun J, Rentsch K, et al. Rapid detection of the CYP2D6*3, CYP2D6*4, and CYP2D6*6 alleles by tetra-primer PCR and of the CYP2D6*5 allele by multiplex long PCR. Clin Chem 2000;46(8 Pt 1):1072-7.
56. Muller B, Zopf K, Bachofer J, et al. Optimized strategy for rapid cytochrome P450 2D6 genotyping by real-time long PCR. Clin Chem 2003;49(10):1624-31.
57. Schaeffeler E, Schwab M, Eichelbaum M, et al. CYP2D6 genotyping strategy based on gene copy number determination by TaqMan real-time PCR. Hum Mutat 2003;22(6):476-85.
58. Soderback E, Zackrisson AL, Lindblom B, et al. Determination of CYP2D6 gene copy number by pyrosequencing. Clin Chem 2005;51(3):522-31.
59. Stamer UM, Bayerer B, Wolf S, et al. Rapid and reliable method for cytochrome P450 2D6 genotyping. Clin Chem 2002;48(9):1412-7.
60. Chou WH, Yan FX, Robbins-Weilert DK, et al. Comparison of two CYP2D6 genotyping methods and assessment of genotype-phenotype relationships. Clin Chem 2003;49(4):542-51.

72
61. Mizugaki M, Hiratsuka M, Agatsuma Y, et al. Rapid detection of CYP2C18 genotypes by real-time fluorescence polymerase chain reaction. J Pharm Pharmacol 2000;52(2):199-205.
62. Muthiah YD, Lee WL, Teh LK, et al. A simple multiplex PCR method for the concurrent detection of three CYP2C8 variants. Clin Chim Acta 2004;349(1-2):191-8.
63. Weise A, Grundler S, Zaumsegel D, et al. Development and evaluation of a rapid and reliable method for cytochrome P450 2C8 genotyping. Clin Lab 2004;50(3-4):141-8.
64. Wu X, Zhou Y, Xu S. Detection of CYP I A1 polymorphisms with a colorimetric method based on mismatch hybridization. Clin Chim Acta 2002;323(1-2):103-9.
65. Liu ZQ, Cheng ZN, Huang SL, et al. Effect of the CYP2C19 oxidation polymorphism on fluoxetine metabolism in Chinese healthy subjects. Br J Clin Pharmacol 2001;52(1):96-9.
66. Ozdemir V, Tyndale RF, Reed K, et al. Paroxetine steady-state plasma concentration in relation to CYP2D6 genotype in extensive metabolizers. J Clin Psychopharmacol 1999;19(5):472-5.
67. Yu BN, Chen GL, He N, et al. Pharmacokinetics of citalopram in relation to genetic polymorphism of CYP2C19. Drug Metab Dispos 2003;31(10):1255-9.
68. Yoon YR, Cha IJ, Shon JH, et al. Relationship of paroxetine disposition to metoprolol metabolic ratio and CYP2D6*10 genotype of Korean subjects. Clin Pharmacol Ther 2000;67(5):567-76.
69. Berle JO, Steen VM, Aamo TO, et al. Breastfeeding during maternal antidepressant treatment with serotonin reuptake inhibitors: infant exposure, clinical symptoms, and cytochrome p450 genotypes. J Clin Psychiatry 2004;65(9):1228-34.
70. Charlier C, Broly F, Lhermitte M, et al. Polymorphisms in the CYP 2D6 gene: association with plasma concentrations of fluoxetine and paroxetine. Ther Drug Monit 2003;25(6):738-42.
71. Eap CB, Bondolfi G, Zullino D, et al. Concentrations of the enantiomers of fluoxetine and norfluoxetine after multiple doses of fluoxetine in cytochrome P4502D6 poor and extensive metabolizers. J Clin Psychopharmacol 2001;21(3):330-4.
72. Grasmader K, Verwohlt PL, Rietschel M, et al. Impact of polymorphisms of cytochrome-P450 isoenzymes 2C9, 2C19 and 2D6 on plasma concentrations and clinical effects of antidepressants in a naturalistic clinical setting. Eur J Clin Pharmacol 2004;60(5):329-36.
73. LLerena A, Dorado P, Berecz R, et al. Effect of CYP2D6 and CYP2C9 genotypes on fluoxetine and norfluoxetine plasma concentrations during steady-state conditions. Eur J Clin Pharmacol 2004;59(12):869-73.
74. Murphy GM Jr, Kremer C, Rodrigues HE, et al. Pharmacogenetics of antidepressant medication intolerance. Am J Psychiatry 2003;160(10):1830-5.
75. Ohara K, Tanabu S, Ishibashi K, et al. CYP2D6*10 alleles do not determine plasma fluvoxamine concentration/dose ratio in Japanese subjects. Eur J Clin Pharmacol 2003;58(10):659-61.
76. Sawamura K, Suzuki Y, Someya T. Effects of dosage and CYP2D6-mutated allele on plasma concentration of paroxetine. Eur J Clin Pharmacol 2004;60(8):553-7.
77. Stedman CA, Begg EJ, Kennedy MA, et al. Cytochrome P450 2D6 genotype does not predict SSRI (fluoxetine or paroxetine) induced hyponatraemia. Hum Psychopharmacol 2002;17(4):187-90.
78. Scordo MG, Spina E, Dahl ML, et al. Influence of CYP2C9, 2C19 and 2D6 genetic polymorphisms on the steady-state plasma concentrations of the enantiomers of fluoxetine and norfluoxetine. Basic Clin Pharmacol Toxicol 2005;97(5):296-301.
79. Ueda M, Hirokane G, Morita S, et al. The impact of CYP2D6 genotypes on the plasma concentration of paroxetine in Japanese psychiatric patients. Prog Neuropsychopharmacol Biol Psychiatry 2006;30(3):486-91.
80. Sackett D, Richardson WS, Rosenberg W, et al. Evidence-based medicine: how to practice and teach EBM. New York: Churchill Livingstone; 1997. p. 232.
81. Venkatakrishnan K, Greenblatt DJ, von Moltke LL, et al. Five distinct human cytochromes mediate amitriptyline N-demethylation in vitro: dominance of CYP 2C19 and 3A4. J Clin Pharmacol 1998;38(2):112-21.

73
82. Sindrup SH, Brosen K, Gram LF, et al. The relationship between paroxetine and the sparteine oxidation polymorphism. Clin Pharmacol Ther 1992;51(3):278-87.
83. Gerstenberg G, Aoshima T, Fukasawa T, et al. Relationship between clinical effects of fluvoxamine and the steady-state plasma concentrations of fluvoxamine and its major metabolite fluvoxamino acid in Japanese depressed patients. Psychopharmacology (Berl) 2003;167(4):443-8.
84. Rau T, Wohlleben G, Wuttke H, et al. CYP2D6 genotype: impact on adverse effects and nonresponse during treatment with antidepressants-a pilot study. Clin Pharmacol Ther 2004;75(5):386-93.
85. Kawanishi C, Lundgren S, Agren H, et al. Increased incidence of CYP2D6 gene duplication in patients with persistent mood disorders: ultrarapid metabolism of antidepressants as a cause of nonresponse. A pilot study. Eur J Clin Pharmacol 2004;59(11):803-7.
86. Cravchik A, Goldman D. Neurochemical individuality: genetic diversity among human dopamine and serotonin receptors and transporters. Arch Gen Psychiatry 2000;57(12):1105-14.
87. Allgulander C, Nilsson B. A prospective study of 86 new patients with social anxiety disorder. Acta Psychiatr Scand 2001;103(6):447-52.
88. Chen S, Chou WH, Blouin RA, et al. The cytochrome P450 2D6 (CYP2D6) enzyme polymorphism: screening costs and influence on clinical outcomes in psychiatry. Clin Pharmacol Ther 1996;60(5):522-34.
89. Roberts RL, Mulder RT, Joyce PR, et al. No evidence of increased adverse drug reactions in cytochrome P450 CYP2D6 poor metabolizers treated with fluoxetine or nortriptyline. Hum Psychopharmacol 2004;19(1):17-23.
90. Suzuki Y, Sawamura K, Someya T. Polymorphisms in the 5-hydroxytryptamine 2A receptor and cytochromeP4502d6 genes synergistically predict fluvoxamine-induced side effects in Japanese depressed patients. Neuropsychopharmacology 2006;31(4):825-31.
91. Kobayashi K, Ishizuka T, Shimada N, et al. Sertraline N-demethylation is catalyzed by multiple isoforms of human cytochrome P-450 in vitro. Drug Metab Dispos 1999;27(7):763-6.
92. Bennett K, Torrance G, Boyle M, et al. Development and testing of a utility measure for major, unipolar depression. Qual Life Res 2000;9(1):109-20.
93. Rossini D, Serretti A, Franchini L, et al. Sertraline versus fluvoxamine in the treatment of elderly patients with major depression: a double-blind, randomized trial. J Clin Psychopharmacol 2005;25(5):471-5.
94. Anonymous. Pricing information on Prozac/fluoxetine. Available at: www.costco.com/Pharmacy. 2006. Accessed September 11, 2006.
95. Anonymous. Pricing information on Zoloft/sertraline. 2006. Available at: www.costco.com/Pharmacy. Accessed September 11, 2006.
96. Palylyk-Colwell E. CYP450 genotyping for determining drug metabolizer status. [Issues in emerging health technologies issue 81]. Ottawa: Candadian Coordinating Office for Health Technology Assessment; 2006. Available at: www.cadth.ca/media/pdf/375_armplichip_cetap_e.pdf. Accessed September 9, 2006.
97. Serretti A, Artioli P, Quartesan R. Pharmacogenetics in the treatment of depression: pharmacodynamic studies. Pharmacogenetics & Genomics 2005;15(2):61-7.
98. Serretti A, Cusin C, Rossini D, et al. Further evidence of a combined effect of SERTPR and TPH on SSRIs response in mood disorders. Am J Med Genet B Neuropsychiatr Genet 2004;129(1):36-40.
99. Smits KM, Smits LJ, Schouten JS, et al. Influence of SERTPR and STin2 in the serotonin transporter gene on the effect of selective serotonin reuptake inhibitors in depression: a systematic review. Mol Psychiatry 2004;9(5):433-41.
100. Pollock BG, Ferrell RE, Mulsant BH, et al. Allelic variation in the serotonin transporter promoter affects onset of paroxetine treatment response in late-life depression. Neuropsychopharmacology 2000;23(5):587-90.
101. Smeraldi E, Zanardi R, Benedetti F, et al. Polymorphism within the promoter of the serotonin transporter gene and antidepressant efficacy of fluvoxamine. Mol Psychiatry 1998;3(6):508-11.
74
102. Kim DK, Lim SW, Lee S, et al. Serotonin transporter gene polymorphism and antidepressant response. Neuroreport 2000;11(1):215-9.
103. Kato M, Ikenaga Y, Wakeno M, et al. Controlled clinical comparison of paroxetine and fluvoxamine considering the serotonin transporter promoter polymorphism. Int Clin Psychopharmacol 2005;20(3):151-6.
104. Yoshida K, Takahashi H, Higuchi H, et al. Prediction of antidepressant response to milnacipran by norepinephrine transporter gene polymorphisms. Am J Psychiatry 2004;161(9):1575-80.
105. Serretti A, Zanardi R, Rossini D, et al. Influence of tryptophan hydroxylase and serotonin transporter genes on fluvoxamine antidepressant activity. Mol Psychiatry 2001;6(5):586-92.
106. Ham BJ, Lee MS, Lee HJ, et al. No association between the tryptophan hydroxylase gene polymorphism and major depressive disorders and antidepressant response in a Korean population. Psychiatr Genet 2005;15(4):299-301.
107. Peters EJ, Slager SL, McGrath PJ, et al. Investigation of serotonin-related genes in antidepressant response. Mol Psychiatry 2004;9(9):879-89.
108. Serretti A, Artioli P. The pharmacogenomics of selective serotonin reuptake inhibitors. Pharmacogenomics J 2004;4(4):233-44.
109. McMahon FJ, Buervenich S, Charney D, et al. Variation in the gene encoding the serotonin 2A receptor is associated with outcome of antidepressant treatment. Am J Hum Genet 2006;78(5):804-14.
110. Zourkova A. Clinical significance of CYP 2D6 during treatment with recent antidepressants [Czech]. Ceska a Slovenska Psychiatrie 2002;98(5):273-7.
111. Tunis SR, Stryer DB, Clancy CM. Practical clinical trials: increasing the value of clinical research for decision making in clinical and health policy. JAMA 2003;290(12):1624-32.

75
Listing of Included Studies (alphabetical)
Allgulander C, Nilsson B. A prospective study of 86 new patients with social anxiety disorder. Acta Psychiatr Scand 2001;103(6):447-52.
Berle JO, Steen VM, Aamo TO, et al. Breastfeeding during maternal antidepressant treatment with serotonin reuptake inhibitors: infant exposure, clinical symptoms, and cytochrome p450 genotypes. J Clin Psychiatry 2004;65(9):1228-34.
Charlier C, Broly F, Lhermitte M, et al. Polymorphisms in the CYP 2D6 gene: association with plasma concentrations of fluoxetine and paroxetine. Ther Drug Monit 2003;25(6):738-42.
Chen S, Chou WH, Blouin RA, et al. The cytochrome P450 2D6 (CYP2D6) enzyme polymorphism: screening costs and influence on clinical outcomes in psychiatry. Clin Pharmacol Ther 1996;60(5):522-34.
Chou WH, Yan FX, Robbins-Weilert DK, et al. Comparison of two CYP2D6 genotyping methods and assessment of genotype-phenotype relationships. Clin Chem 2003;49(4):542-51.
Eap CB, Bondolfi G, Zullino D, et al. Concentrations of the enantiomers of fluoxetine and norfluoxetine after multiple doses of fluoxetine in cytochrome P4502D6 poor and extensive metabolizers. J Clin Psychopharmacol 2001;21(3):330-4.
Eriksson S, Berg LM, Wadelius M, et al. Cytochrome p450 genotyping by multiplexed real-time DNA sequencing with pyrosequencing technology. Assay Drug Dev Technol 2002;1(1 Pt 1):49-59.
Gerstenberg G, Aoshima T, Fukasawa T, et al. Relationship between clinical effects of fluvoxamine and the steady-state plasma concentrations of fluvoxamine and its major metabolite fluvoxamino acid in Japanese depressed patients. Psychopharmacology (Berl) 2003;167(4):443-8.
Grasmader K, Verwohlt PL, Rietschel M, et al. Impact of polymorphisms of cytochrome-P450 isoenzymes 2C9, 2C19 and 2D6 on plasma concentrations and clinical effects of antidepressants in a naturalistic clinical setting. Eur J Clin Pharmacol 2004;60(5):329-36.
Hersberger M, Marti-Jaun J, Rentsch K, et al. Rapid detection of the CYP2D6*3, CYP2D6*4, and CYP2D6*6 alleles by tetra-primer PCR and of the CYP2D6*5 allele by multiplex long PCR. Clin Chem 2000;46(8 Pt 1):1072-7.
Kawanishi C, Lundgren S, Agren H, et al. Increased incidence of CYP2D6 gene duplication in patients with persistent mood disorders: ultrarapid metabolism of antidepressants as a cause of nonresponse. A pilot study. Eur J Clin Pharmacol 2004;59(11):803-7.
Liu ZQ, Cheng ZN, Huang SL, et al. Effect of the CYP2C19 oxidation polymorphism on fluoxetine metabolism in Chinese healthy subjects. Br J Clin Pharmacol 2001;52(1):96-9.
LLerena A, Dorado P, Berecz R, et al. Effect of CYP2D6 and CYP2C9 genotypes on fluoxetine and norfluoxetine plasma concentrations during steady-state conditions. Eur J Clin Pharmacol 2004;59(12):869-73.
Mizugaki M, Hiratsuka M, Agatsuma Y, et al. Rapid detection of CYP2C18 genotypes by real-time fluorescence polymerase chain reaction. J Pharm Pharmacol 2000;52(2):199-205.
Muller B, Zopf K, Bachofer J, et al. Optimized strategy for rapid cytochrome P450 2D6 genotyping by real-time long PCR. Clin Chem 2003;49(10):1624-31.
Murphy GM Jr, Kremer C, Rodrigues HE, et al. Pharmacogenetics of antidepressant medication intolerance. Am J Psychiatry 2003;160(10):1830-5.
Muthiah YD, Lee WL, Teh LK, et al. A simple multiplex PCR method for the concurrent detection of three CYP2C8 variants. Clin Chim Acta 2004;349(1-2):191-8.
Neville M, Selzer R, Aizenstein B, et al. Characterization of cytochrome P450 2D6 alleles using the Invader system. Biotechniques 2002;Suppl:34-8, 40-3.
Ohara K, Tanabu S, Ishibashi K, et al. CYP2D6*10 alleles do not determine plasma fluvoxamine concentration/dose ratio in Japanese subjects. Eur J Clin Pharmacol 2003;58(10):659-61.
Ozdemir V, Tyndale RF, Reed K, et al. Paroxetine steady-state plasma concentration in relation to CYP2D6 genotype in extensive metabolizers. J Clin Psychopharmacol 1999;19(5):472-5.
Rau T, Wohlleben G, Wuttke H, et al. CYP2D6 genotype: impact on adverse effects and nonresponse during treatment with antidepressants-a pilot study. Clin Pharmacol Ther 2004;75(5):386-93.

76
Roberts RL, Mulder RT, Joyce PR, et al. No evidence of increased adverse drug reactions in cytochrome P450 CYP2D6 poor metabolizers treated with fluoxetine or nortriptyline. Hum Psychopharmacol 2004;19(1):17-23.
Roche Molecular Systems, Inc. U.S. Food and Drug Administration 510(k) Substantial Equivalence Determination Decision Summary for Roche AmpliChip CYP450 microarray for identifying CYP2D6 genotype (510(k) Number k042259). December 2004. Available at: www.fda.gov/cdrh/reviews/k042259.pdf. Accessed 19 April 2006.
Roche Molecular Systems, Inc. U.S. Food and Drug Administration 510(k) Substantial Equivalence Determination Decision Summary for Roche AmpliChip CYP450 microarray for identifying CYP2C19 genotype (510(k) Number k043576). January 2005. Available at: www.fda.gov/cdrh/reviews/k043576.pdf. Accessed 19 April 2006.
Sawamura K, Suzuki Y, Someya T. Effects of dosage and CYP2D6-mutated allele on plasma concentration of paroxetine. Eur J Clin Pharmacol 2004;60(8):553-7.
Schaeffeler E, Schwab M, Eichelbaum M, et al. CYP2D6 genotyping strategy based on gene copy number determination by TaqMan real-time PCR. Hum Mutat 2003;22(6):476-85.
Scordo MG, Spina E, Dahl ML, et al. Influence of CYP2C9, 2C19 and 2D6 genetic polymorphisms on the steady-state plasma concentrations of the enantiomers of fluoxetine and norfluoxetine. Basic Clin Pharmacol Toxicol 2005;97(5):296-301.
Soderback E, Zackrisson AL, Lindblom B, et al. Determination of CYP2D6 gene copy number by pyrosequencing. Clin Chem 2005;51(3):522-31.
Stamer UM, Bayerer B, Wolf S, et al. Rapid and reliable method for cytochrome P450 2D6 genotyping. Clin Chem 2002;48(9):1412-7.
Stedman CA, Begg EJ, Kennedy MA, et al. Cytochrome P450 2D6 genotype does not predict SSRI (fluoxetine or paroxetine) induced hyponatraemia. Hum Psychopharmacol 2002;17(4):187-90.
Suzuki Y, Sawamura K, Someya T. Polymorphisms in the 5-hydroxytryptamine 2A receptor and cytochromeP4502d6 genes synergistically predict fluvoxamine-induced side effects in Japanese depressed patients. Neuropsychopharmacology 2006;31(4):825-31.
Ueda M, Hirokane G, Morita S, et al. The impact of CYP2D6 genotypes on the plasma concentration of paroxetine in Japanese psychiatric patients. Prog Neuropsychopharmacol Biol Psychiatry 2006;30(3):486-91.
Wang JH, Liu ZQ, Wang W, et al. Pharmacokinetics of sertraline in relation to genetic polymorphism of CYP2C19. Clin Pharmacol Ther 2001;70(1):42-7.
Weise A, Grundler S, Zaumsegel D, et al. Development and evaluation of a rapid and reliable method for cytochrome P450 2C8 genotyping. Clin Lab 2004;50(3-4):141-8.
Wu X, Zhou Y, Xu S. Detection of CYP I A1 polymorphisms with a colorimetric method based on mismatch hybridization. Clin Chim Acta 2002;323(1-2):103-9.
Yoon YR, Cha IJ, Shon JH, et al. Relationship of paroxetine disposition to metoprolol metabolic ratio and CYP2D6*10 genotype of Korean subjects. Clin Pharmacol Ther 2000;67(5):567-76.
Yu BN, Chen GL, He N, et al. Pharmacokinetics of citalopram in relation to genetic polymorphism of CYP2C19. Drug Metab Dispos 2003;31(10):1255-9.

77
List of Acronyms/Abbreviations
ACCE Analytic validity, Clinical validity, Clinical utility and associated Ethical, legal and social implications
AHRQ Agency for Healthcare Research and Quality ASA Allele-specific amplification AS-PCR Allele-specific polymerase chain reaction AUC Area under the curve CDC Centers for Disease Control and Prevention CGI Clinical Global Impressions Scale CI Confidence interval CLIA Clinical Laboratory Improvement Amendment Cmax Maximum plasma concentration CYP Cytochrome P DARE Cochrane Database of Abstracts of Reviews of Effects Del Deletion (*5 allele) DSM-IV Diagnostic and Statistical Manual for Mental Disorders, 4th edition Dup Duplication (more than a single gene copy) EGAPP Evaluation of Genomic Applications in Practice and Prevention EM(s) Extensive metabolizer(s) FDA U.S. Food and Drug Administration GI Gastrointestinal HAM-D Hamilton Rating Scale for Depression IM(s) Intermediate metabolizer(s) MADRS Montgomery-Åsberg Depression Rating Scale MDD Major depressive disorder MeSH Medical Subject Headings NA Not applicable NR Not reported PCR Polymerase chain reaction PCR-RFLP Polymerase chain reaction and restriction fragment length polymorphism PM (s) Poor metabolizer(s) QLESQ Quality of Life Enjoyment and Satisfaction Questionnaire RT-PCR Real-time polymerase chain reaction SC Single gene copy SF-36 Medical Outcomes Study 36-Item Short Form Health Survey SNRI(s) Serotonin/norepinephrine reuptake inhibitors SSRI(s) Selective serotonin reuptake inhibitor(s) t1/2 Terminal elimination half-life TCA(s) Tricyclic antidepressant(s) UM(s) Ultra-rapid metabolizer(s) USPSTF U.S. Preventive Services Task Force

APPENDIXES
to
“Testing for Cytochrome P450 Polymorphisms in Adults with Non-Psychotic Depression Treated with
Selective Serotonin Reuptake Inhibitors (SSRIs)”
Prepared by the Duke Evidence-based Practice Center (Contract #290-02-0025)

A-1
Appendix A. Exact Search String Database: Ovid MEDLINE(R) <1966 to November Week 3 2005> [last updated May Week 2 2006] Search Strategy: -------------------------------------------------------------------------------- 1 cytochrome p-450 enzyme system/ or aryl hydrocarbon hydroxylases/ or cytochrome p-450
cyp2d6/ 2 (cyp2c19 or cyp2c9 or cyp2cd6 or cyp 2c19 or cyp 2c9 or cyp 2d6).mp. 3 amplichip.mp. 4 microarray analysis/ or oligonucleotide array sequence analysis/ 5 or/1-4 6 serotonin uptake inhibitors/ or citalopram/ or fluoxetine/ or fluvoxamine/ or paroxetine/ or
sertraline/ 7 (escitalopram or citalopram or fluoxetine or fluvoxamine or paroxetine or sertraline).mp. 8 (celexa or lexapro or prozac or luvox or paxil or zoloft).mp. 9 or/6-8 10 5 and 9 11 limit 10 to humans 12 limit 11 to english language 13 "Sensitivity and Specificity"/ 14 "REPRODUCIBILITY OF RESULTS"/ 15 13 or 14 16 5 and 15 17 limit 16 to humans 18 limit 17 to english language 19 18 not 12 20 (3 or 4) and 15 21 limit 20 to humans 22 limit 21 to english language 23 (1 or 2) and (3 or 4) 24 1 or (2 and 4) or 3 25 24 and 15 26 limit 25 to humans 27 limit 26 to english language 28 22 not 27 29 from 27 keep 1-219 30 cyp2d6.mp. 31 30 and 9 32 31 not 10 33 limit 32 to (humans and english language) 34 30 and 15 35 34 not 16 36 limit 35 to (humans and english language) 37 Reference Standards/

A-2
38 Quality Control/ 39 Reference Values/ 40 30 or 5 41 or/37-39 42 40 and 41 43 limit 42 to (humans and english language) 44 33 or 36 45 from 44 keep 1-42 46 from 43 keep 1-481

B-1
Appendix B. List of Excluded Studies
All excluded studies listed below were reviewed in their full-text version. Following each reference, in italics, is the reason for exclusion. Reasons for exclusion signify only the usefulness of the articles for this study and are not intended as criticisms of the articles.
Alderman J, Preskorn SH, Greenblatt DJ, et al. Desipramine pharmacokinetics when coadministered with paroxetine or sertraline in extensive metabolizers. J Clin Psychopharmacol 1997;17(4):284-91. Exclude: falls outside study scope.
Arias B, Catalan R, Gasto C, et al. Evidence for a combined genetic effect of the 5-HT(1A) receptor and serotonin transporter genes in the clinical outcome of major depressive patients treated with citalopram. J Psychopharmacol 2005;19(2):166-72. Exclude: falls outside study scope.
Baker SC, Bauer SR, Beyer RP, et al. The external RNA controls consortium: a progress report. Nat Methods 2005;2(10):731-4. Exclude: falls outside study scope.
Ball C, Brazma A, Causton H, et al. Standards for microarray data: an open letter. Environ Health Perspect 2004;112(12):A666-7. Exclude: falls outside study scope.
Ball SE, Scatina J, Kao J, et al. Population distribution and effects on drug metabolism of a genetic variant in the 5' promoter region of CYP3A4. Clin Pharmacol Ther 1999;66(3):288-94. Exclude: falls outside study scope.
Bartoletti RA, Belpaire FM, Rosseel MT. High performance liquid chromatography determination of dextromethorphan and its metabolites in urine using solid-phase extraction. J Pharm Biomed Anal 1996;14(8-10):1281-86. Exclude: falls outside study scope.
Bertilsson L, Dahl ML, Tybring G. Pharmacogenetics of antidepressants: clinical aspects. Acta Psychiatr Scand Suppl 1997;391:14-21. Exclude: falls outside study scope.
Bramness JG, Skurtveit S, Fauske L, et al. Association between blood carisoprodol:meprobamate concentration ratios and CYP2C19 genotype in carisoprodol-drugged drivers: decreased metabolic capacity in heterozygous CYP2C19*1/CYP2C19*2 subjects? Pharmacogenetics 2003;13(7):383-8. Exclude: falls outside study scope.
Britzi M, Bialer M, Arcavi L, et al. Genetic polymorphism of CYP2D6 and CYP2C19 metabolism determined by phenotyping Israeli ethnic groups. Ther Drug Monit 2000;22(5):510-6. Exclude: falls outside study scope.
Brosen K, Hansen JG, Nielsen KK, et al. Inhibition by paroxetine of desipramine metabolism in extensive but not in poor metabolizers of sparteine. Eur J Clin Pharmacol 1993;44(4):349-55. Exclude: falls outside study scope.
Brosen K, Nielsen PN, Brusgaard K, et al. CYP2D6 genotype determination in the Danish population. Eur J Clin Pharmacol 1994;47(3):221-5. Exclude: falls outside study scope.
Butcher LM, Meaburn E, Dale PS, et al. Association analysis of mild mental impairment using DNA pooling to screen 432 brain-expressed single-nucleotide polymorphisms. Mol Psychiatry 2005;10(4):384-92. Exclude: falls outside study scope.
Cardoso J, Molenaar L, de Menezes RX, et al. Genomic profiling by DNA amplification of laser capture microdissected tissues and array CGH. Nucleic Acids Res 2004;32(19):e146. Exclude: falls outside study scope.
Carter DE, Robinson JF, Allister EM, et al. Quality assessment of microarray experiments. Clin Biochem 2005;38(7):639-42. Exclude: falls outside study scope.
Chen DT. A graphical approach for quality control of oligonucleotide array data. J Biopharm Stat 2004;14(3):591-606. Exclude: falls outside study scope.
Chrimes D. How can data quality and automation enhance confidence in microarray data? Drug Discov Today 2005;10(10):675-7. Exclude: falls outside study scope.
Cronin M, Ghosh K, Sistare F, et al. Universal RNA reference materials for gene expression.[see comment]. Clin Chem 2004;50(8):1464-71. Exclude: falls outside study scope.
Daly TM, Dumaual CM, Dotson CA, et al. Precision profiling and components of variability analysis for Affymetrix microarray assays run in a clinical context. J Mol Diagn 2005;7(3):404-12. Exclude: falls outside study scope.
Datta S, Satten GA, Benos DJ, et al. An empirical Bayes adjustment to increase the sensitivity of detecting differentially expressed genes in microarray experiments. Bioinformatics 2004;20(2):235-42. Exclude: falls outside study scope.
DeVane CL. Pharmacogenetics and drug metabolism of newer antidepressant agents.[see comment]. J Clin Psychiatry 1994;55 Suppl:38-45; discussion 46-7. Exclude: falls outside study scope.

B-2
Dombkowski AA, Thibodeau BJ, Starcevic SL, et al. Gene-specific dye bias in microarray reference designs. FEBS Lett 2004;560(1-3):120-4. Exclude: falls outside study scope.
Dorne JL. Impact of inter-individual differences in drug metabolism and pharmacokinetics on safety evaluation. Fundam Clin Pharmacol 2004;18(6):609-20. Exclude: falls outside study scope.
Dozmorov I, Knowlton N, Tang Y, et al. Statistical monitoring of weak spots for improvement of normalization and ratio estimates in microarrays. BMC Bioinformatics 2004;5(1):53. Exclude: falls outside study scope.
Futschik M, Crompton T. Model selection and efficiency testing for normalization of cDNA microarray data. Genome Biol 2004;5(8):R60. Exclude: falls outside study scope.
Gautier L, Moller M, Friis-Hansen L, et al. Alternative mapping of probes to genes for Affymetrix chips. BMC Bioinformatics 2004;5(1):111. Exclude: falls outside study scope.
Gillman PK. Re: no evidence of increased adverse drug reactions in cytochrome P450 CYP2D6 poor metabolizers treated with fluoxetine or nortriptyline.[comment]. Hum Psychopharmacol 2005;20(1):61-2; author reply 63-4. Exclude: falls outside study scope.
Gingeras TR. RNA reference materials for gene expression studies. Difficult first steps.[see comment][comment]. Clin Chem 2004;50(8):1289-90. Exclude: falls outside study scope.
Ginsberg DL. Pharmacogenomics: genetic markers predict intolerance to paroxetine. Prim Psychiatry 2003;10(12):17-8. Exclude: review.
Griese EU, Lapple F, Eichelbaum M. Detection of CYP2C19 alleles *1, *2 and *3 by multiplex polymerase chain reaction. Pharmacogenetics 1999;9(3):389-91. Exclude: falls outside study scope.
Hesse LM, Venkatakrishnan K, Court MH, et al. CYP2B6 mediates the in vitro hydroxylation of bupropion: potential drug interactions with other antidepressants. Drug Metab Dispos 2000;28(10):1176-83. Exclude: falls outside study scope.
Hoerndli FJ, Toigo M, Schild A, et al. Reference genes identified in SH-SY5Y cells using custom-made gene arrays with validation by quantitative polymerase chain reaction. Anal Biochem 2004;335(1):30-41. Exclude: falls outside study scope.
Ishiguro A, Kubota T, Soya Y, et al. High-throughput detection of multiple genetic polymorphisms influencing drug metabolism with mismatch primers in allele-specific polymerase chain reaction.[erratum appears in Anal Biochem. 2005 Aug 15;343(2):359]. Anal Biochem 2005;337(2):256-61. Exclude: no reference standard.
Jan MW, ZumBrunnen TL, Kazmi YR, et al. Pharmacokinetics of fluvoxamine in relation to CYP2C19 phenotype and genotype. Drug Metabol Drug Interact 2002;19(1):1-11. Exclude: probe drug metabolism defined CYP status.
Jarvinen AK, Hautaniemi S, Edgren H, et al. Are data from different gene expression microarray platforms comparable? Genomics 2004;83(6):1164-8. Exclude: falls outside study scope.
Jeppesen U, Gram LF, Vistisen K, et al. Dose-dependent inhibition of CYP1A2, CYP2C19 and CYP2D6 by citalopram, fluoxetine, fluvoxamine and paroxetine. Eur J Clin Pharmacol 1996;51(1):73-8. Exclude: falls outside study scope.
Jin P, Zhao Y, Ngalame Y, et al. Selection and validation of endogenous reference genes using a high throughput approach. BMC Genomics 2004;5(1):55. Exclude: falls outside study scope.
Joseph LJ. RNA reference materials for gene expression studies. RNA metrology: forecast calls for partial clearing.[comment]. Clin Chem 2004;50(8):1290-2. Exclude: falls outside study scope.
Kaneda Y, Kawamura I, Fujii A, et al. Serotonin syndrome - 'potential' role of the CYP2D6 genetic polymorphism in Asians. Int J Neuropsychopharmacol 2002;5(1):105-6. Exclude: single case.
Kawanishi C, Hanihara T, Maruyama Y, et al. Neuroleptic malignant syndrome and hydroxylase gene mutations: no association with CYP2D6A or CYP2D6B. Psychiatr Genet 1997;7(3):127-9. Exclude: falls outside study scope.
Kirchheiner J, Bertilsson L, Bruus H, et al. Individualized medicine - implementation of pharmacogenetic diagnostics in antidepressant drug treatment of major depressive disorders. Pharmacopsychiatry 2003;36 Suppl 3:S235-43. Exclude: falls outside study scope.
Kirchheiner J, Brosen K, Dahl ML, et al. CYP2D6 and CYP2C19 genotype-based dose recommendations for antidepressants: a first step towards subpopulation-specific dosages.[erratum appears in Acta Psychiatr Scand 2001 Dec;104(6):475]. Acta Psychiatr Scand 2001;104(3):173-92. Exclude: falls outside study scope.

B-3
Kirchheiner J, Meineke I, Muller G, et al. Contributions of CYP2D6, CYP2C9 and CYP2C19 to the biotransformation of E- and Z-doxepin in healthy volunteers. Pharmacogenetics 2002;12(7):571-80. Exclude: falls outside study scope.
Kitagawa K, Kunugita N, Katoh T, et al. The significance of the homozygous CYP2A6 deletion on nicotine metabolism: a new genotyping method of CYP2A6 using a single PCR-RFLP. Biochem Biophys Res Commun 1999;262(1):146-51. Exclude: falls outside study scope.
Kohler D, Hartter S, Fuchs K, et al. CYP2D6 genotype and phenotyping by determination of dextromethorphan and metabolites in serum of healthy controls and of patients under psychotropic medication. Pharmacogenetics 1997;7(6):453-61. Exclude: drug interaction between SSRIs and CYP genotypes.
Kraus RP, Diaz P, McEachran A. Managing rapid metabolizers of antidepressants. Depress Anxiety 1996-1997;4(6):320-7. Exclude: probe drug metabolism defined CYP status.
Kuhn K, Baker SC, Chudin E, et al. A novel, high-performance random array platform for quantitative gene expression profiling. Genome Res 2004;14(11):2347-56. Exclude: falls outside study scope.
Lam YW, Gaedigk A, Ereshefsky L, et al. CYP2D6 inhibition by selective serotonin reuptake inhibitors: analysis of achievable steady-state plasma concentrations and the effect of ultrarapid metabolism at CYP2D6. Pharmacotherapy 2002;22(8):1001-6. Exclude: probe drug metabolism defined CYP status.
Le Meur N, Lamirault G, Bihouee A, et al. A dynamic, web-accessible resource to process raw microarray scan data into consolidated gene expression values: importance of replication. Nucleic Acids Res 2004;32(18):5349-58. Exclude: falls outside study scope.
Lee AJ, Chan WK, Harralson AF, et al. The effects of grapefruit juice on sertraline metabolism: an in vitro and in vivo study. Clin Ther 1999;21(11):1890-9. Exclude: falls outside study scope.
Lessard E, Yessine MA, Hamelin BA, et al. Influence of CYP2D6 activity on the disposition and cardiovascular toxicity of the antidepressant agent venlafaxine in humans. Pharmacogenetics 1999;9(4):435-43. Exclude: falls outside study scope.
Liston HL, DeVane CL, Boulton DW, et al. Differential time course of cytochrome P450 2D6 enzyme inhibition by fluoxetine, sertraline, and paroxetine in healthy volunteers. J Clin Psychopharmacol 2002;22(2):169-73. Exclude: falls outside study scope.
Liu ZQ, Shu Y, Huang SL, et al. Effects of CYP2C19 genotype and CYP2C9 on fluoxetine N-demethylation in human liver microsomes. Acta Pharmacol Sin 2001;22(1):85-90. Exclude: falls outside study scope.
Malhotra AK, Murphy GM Jr, Kennedy JL. Pharmacogenetics of psychotropic drug response. Am J Psychiatry 2004;161(5):780-96. Exclude: falls outside study scope.
McConnachie L, Bodor M, Kowdley K, et al. Human liver cytochrome P450 2D6 genotype, full-length messenger ribonucleic acid, and activity assessed with a novel cytochrome P450 2D6 substrate. Clin Pharmacol Ther 2004;75(4):282-97. Exclude: falls outside study scope.
McGall GH, Christians FC. High-density genechip oligonucleotide probe arrays. Adv Biochem Eng Biotechnol 2002;77:21-42. Exclude: falls outside study scope.
Meyer UA, Amrein R, Balant LP, et al. Antidepressants and drug-metabolizing enzymes--expert group report. Acta Psychiatr Scand 1996;93(2):71-9. Exclude: falls outside study scope.
Mihara K, Otani K, Suzuki A, et al. Relationship between the CYP2D6 genotype and the steady-state plasma concentrations of trazodone and its active metabolite m-chlorophenylpiperazine. Psychopharmacology (Berl) 1997;133(1):95-8. Exclude: falls outside study scope.
Nannya Y, Sanada M, Nakazaki K, et al. A robust algorithm for copy number detection using high-density oligonucleotide single nucleotide polymorphism genotyping arrays. Cancer Res 2005;65(14):6071-9. Exclude: falls outside study scope.
Neuhaus T, Geisen G, Bolt HM, et al. Reliability of non-invasively acquired human genomic DNA as a substrate for real-time PCR-assisted analysis of genetic polymorphisms. Arch Toxicol 2004;78(7):390-6. Exclude: falls outside study scope.
Nguyen LT, Ramanathan M, Weinstock-Guttman B, et al. Detection of cytochrome P450 and other drug-metabolizing enzyme mRNAs in peripheral blood mononuclear cells using DNA arrays. Drug Metab Dispos 2000; 28(8):987-93. Exclude: falls outside study scope.
Nishimura M, Yaguti H, Yoshitsugu H, et al. Tissue distribution of mRNA expression of human cytochrome P450 isoforms assessed by high-sensitivity real-time reverse transcription PCR. Yakugaku Zasshi 2003;123(5):369-75. Exclude: falls outside study scope.

B-4
Nishimura M, Yoshitsugu H, Naito S, et al. Evaluation of gene induction of drug-metabolizing enzymes and transporters in primary culture of human hepatocytes using high-sensitivity real-time reverse transcription PCR. Yakugaku Zasshi 2002;122(5):339-61. Exclude: falls outside study scope.
Novoradovskaya N, Whitfield ML, Basehore LS, et al. Universal reference RNA as a standard for microarray experiments. BMC Genomics 2004;5(1):20. Exclude: falls outside study scope.
Oba S, Sato MA, Takemasa I, et al. A Bayesian missing value estimation method for gene expression profile data. Bioinformatics 2003;19(16):2088-96. Exclude: falls outside study scope.
Obach RS, Cox LM, Tremaine LM. Sertraline is metabolized by multiple cytochrome P450 enzymes, monoamine oxidases, and glucuronyl transferases in human: an in vitro study. Drug Metab Dispos 2005;33(2):262-70. Exclude: falls outside study scope.
Olesen OV, Linnet K. Studies on the stereoselective metabolism of citalopram by human liver microsomes and cDNA-expressed cytochrome P450 enzymes. Pharmacology 1999;59(6):298-309. Exclude: falls outside study scope.
Olesen OV, Linnet K. Fluvoxamine-clozapine drug interaction: inhibition in vitro of five cytochrome P450 isoforms involved in clozapine metabolism.[see comment]. J Clin Psychopharmacol 2000;20(1):35-42. Exclude: falls outside study scope.
Ozdemir V, Naranjo CA, Herrmann N, et al. The extent and determinants of changes in CYP2D6 and CYP1A2 activities with therapeutic doses of sertraline. J Clin Psychopharmacol 1998;18(1):55-61. Exclude: falls outside study scope.
Ozminkowski RJ, Hylan TR, Melfi CA, et al. Economic consequences of selective serotonin reuptake inhibitor use with drugs also metabolized by the cytochrome P-450 system. Clin Ther 1998;20(4):780-96. Exclude: falls outside study scope.
Pavlidis P, Li Q, Noble WS. The effect of replication on gene expression microarray experiments. Bioinformatics 2003;19(13):1620-7. Exclude: falls outside study scope.
Perucca E, Marchioni E, Soragna D, et al. Fluoxetine-induced movement disorders and deficient CYP2D6 enzyme activity.[comment]. Mov Disord 1997;12(4):624-5. Exclude: falls outside study scope.
Preskorn SH. Effects of antidepressants on the cytochrome P450 system.[comment]. Am J Psychiatry 1996;153(12):1655-7. Exclude: falls outside study scope.
Rai AJ, Gelfand CA, Haywood BC, et al. HUPO Plasma Proteome Project specimen collection and handling: towards the standardization of parameters for plasma proteome samples. Proteomics 2005;5(13):3262-77. Exclude: falls outside study scope.
Raimundo S, Toscano C, Klein K, et al. A novel intronic mutation, 2988G>A, with high predictivity for impaired function of cytochrome P450 2D6 in white subjects.[see comment]. Clin Pharmacol Ther 2004;76(2):128-38. Exclude: falls outside study scope.
Ramamoorthy Y, Tyndale RF, Sellers EM. Cytochrome P450 2D6.1 and cytochrome P450 2D6.10 differ in catalytic activity for multiple substrates. Pharmacogenetics 2001;11(6):477-87. Exclude: falls outside study scope.
Rodriguez-Antona C, Jover R, Gomez-Lechon MJ, et al. Quantitative RT-PCR measurement of human cytochrome P-450s: application to drug induction studies. Arch Biochem Biophys 2000;376(1):109-16. Exclude: falls outside study scope.
Sallee FR, DeVane CL, Ferrell RE. Fluoxetine-related death in a child with cytochrome P-450 2D6 genetic deficiency. J Child Adolesc Psychopharmacol 2000;10(1):27-34. Exclude: review.
Sato A, Okura Y, Minagawa S, et al. Life-threatening serotonin syndrome in a patient with chronic heart failure and CYP2D6*1/*5. Mayo Clin Proc 2004;79(11):1444-8. Exclude: single case.
Saviozzi S, Iazzetti G, Caserta E, et al. Microarray data analysis and mining. Methods Mol Med 2004;94:67-90. Exclude: falls outside study scope.
Schur BC, Bjerke J, Nuwayhid N, et al. Genotyping of cytochrome P450 2D6*3 and *4 mutations using conventional PCR. Clin Chim Acta 2001;308(1-2):25-31. Exclude: no reference standard.
Sindrup SH, Brosen K, Gram LF. Pharmacokinetics of the selective serotonin reuptake inhibitor paroxetine: nonlinearity and relation to the sparteine oxidation polymorphism. Clin Pharmacol Ther 1992;51(3):288-95. Exclude: probe drug metabolism defined CYP status.
Sindrup SH, Brosen K, Gram LF, et al. The relationship between paroxetine and the sparteine oxidation polymorphism. Clin Pharmacol Ther 1992;51(3):278-87. Exclude: probe drug metabolism defined CYP status.
Sindrup SH, Brosen K, Hansen MG, et al. Pharmacokinetics of citalopram in relation to the sparteine and the mephenytoin oxidation polymorphisms. Ther Drug Monit 1993;15(1):11-7. Exclude: probe drug metabolism defined CYP status.

B-5
Spigset O, Hedenmalm K, Dahl ML, et al. Seizures and myoclonus associated with antidepressant treatment: assessment of potential risk factors, including CYP2D6 and CYP2C19 polymorphisms, and treatment with CYP2D6 inhibitors. Acta Psychiatr Scand 1997; 96(5):379-84. Exclude: drug interaction between SSRIs and CYP genotypes.
Sproule BA, Otton SV, Cheung SW, et al. CYP2D6 inhibition in patients treated with sertraline. J Clin Psychopharmacol 1997; 17(2):102-6. Exclude: falls outside study scope.
Stahl SM. Not so selective serotonin reuptake inhibitors. J Clin Psychiatry 1998;59(7):343-4. Exclude: falls outside study scope.
Stahl SM. Using secondary binding properties to select a not so selective serotonin reuptake inhibitor. J Clin Psychiatry 1998;59(12):642-3. Exclude: falls outside study scope.
Steimer W, Zopf K, von Amelunxen S, et al. Allele-specific change of concentration and functional gene dose for the prediction of steady-state serum concentrations of amitriptyline and nortriptyline in CYP2C19 and CYP2D6 extensive and intermediate metabolizers.[see comment]. Clin Chem 2004;50(9):1623-33. Exclude: falls outside study scope.
Tenneze L, Tarral E, Ducloux N, et al. Pharmacokinetics and electrocardiographic effects of a new controlled-release form of flecainide acetate: comparison with the standard form and influence of the CYP2D6 polymorphism. Clin Pharmacol Ther 2002;72(2):112-22. Exclude: falls outside study scope.
Tong W, Cao X, Harris S, et al. ArrayTrack--supporting toxicogenomic research at the U.S. Food and Drug Administration National Center for Toxicological Research. Environ Health Perspect 2003;111(15):1819-26. Exclude: falls outside study scope.
Topic E, Stefanovic M, Ivanisevic AM, et al. CYP2D6 genotyping in patients on psychoactive drug therapy. Clin Chem Lab Med 2000;38(9):921-7. Exclude: falls outside study scope.
Tuominen R, Warholm M, Moller L, et al. Constitutive CYP1B1 mRNA expression in human blood mononuclear cells in relation to gender, genotype, and environmental factors. Environ Res 2003;93(2):138-48. Exclude: falls outside study scope.
Vermeesch JR, Melotte C, Froyen G, et al. Molecular karyotyping: array CGH quality criteria for constitutional genetic diagnosis. J Histochem Cytochem 2005;53(3):413-22. Exclude: falls outside study scope.
Wandel C, Witte JS, Hall JM, et al. CYP3A activity in African American and European American men: population differences and functional effect of the CYP3A4*1B5'-promoter region polymorphism. Clin Pharmacol Ther 2000;68(1):82-91. Exclude: falls outside study scope.
Wang J, Hu L, Hamilton SR, et al. RNA amplification strategies for cDNA microarray experiments. Biotechniques 2003;34(2):394-400. Exclude: falls outside study scope.
Wanwimolruk S, Bhawan S, Coville PF, et al. Genetic polymorphism of debrisoquine (CYP2D6) and proguanil (CYP2C19) in South Pacific Polynesian populations. Eur J Clin Pharmacol 1998;54(5):431-5. Exclude: falls outside study scope.
Yamakawa H, Yokoyama S, Hirano T, et al. A simple and robust method for preparation of cDNA nylon microarrays. DNA Res 2004;11(5):353-60. Exclude: falls outside study scope.
Yang M, Kunugita N, Kitagawa K, et al. Individual differences in urinary cotinine levels in Japanese smokers: relation to genetic polymorphism of drug-metabolizing enzymes. Cancer Epidemiol Biomarkers Prev 2001;10(6):589-93. Exclude: falls outside study scope.
Yao TW, Zeng S, Wang TW, et al. Phenotype analysis of cytochrome P450 2C19 in Chinese subjects with mephenytoin S/R enantiomeric ratio in urine measured by chiral GC. Biomed Chromatogr 2001;15(1):9-13. Exclude: falls outside study scope.
Zourkova A. Effect of mirtazapine and paroxetine on residual symptoms of depressive disorders and their effect on P450 CYP 2D6 activity. Homeost Health Dis 2001;41(6):242-8. Exclude: probe drug metabolism defined CYP status.
Zourkova A. Clinical significance of CYP 2D6 during treatment with recent antidepressants [Czech]. Ceska a Slovenska Psychiatrie 2002;98(5):273-7. Exclude: foreign language.
Zourkova A, Hadasova E. Relationship between CYP 2D6 metabolic status and sexual dysfunction in paroxetine treatment. J Sex Marital Ther 2002;28(5):451-61. Exclude: probe drug metabolism defined CYP status.
Zourkova A, Hadasova E. Paroxetine-induced conversion of cytochrome P450 2D6 phenotype and occurence of adverse effects. Gen Physiol Biophys 2003;22(1):103-13. Exclude: probe drug metabolism defined CYP status.

C-1
Appendix C. Sample Data Abstraction Forms
CYP450 – Data Abstraction Form/Evidence Table Template for Question 2 Study Study Design
Patient Characteristics
Results Comments/Quality Scoring
First author, date, and ProCite#
Geographical location: Size of population: Method of CYP testing or product used: Cytochromes (and specific mutations) tested for: Reference standard test:
Race/ethnicity (n [%]):
1) Summary of test performance:
CYP No. tested
No. with poly-morph-isms
No. of errors
Error rate (%)
Upper CI of error rate (%)
CYP2D6 CYP2C9 CYP2C19 etc. TOTALS:
2) How often is the test positive when a mutation is present? 3) How often is the test negative when a mutation is not present? 4) Is an internal QC program defined and externally monitored? 5) Have repeated measurements been made on specimens? 6) What is the within- and between-laboratory precision? 7) If appropriate, how is confirmatory testing performed to resolve false positive results in a timely manner? 8) What range of patient specimens have been tested? 9) How often does the test fail to give a useable result? 10) How similar are results obtained in multiple laboratories using the same or different technology?
[IF ARTICLE SHOULD BE EXCLUDED, PLEASE EXPLAIN WHY HERE] [COMMENT ON BIASES, ETC. AFFECTING CLINICAL INTERPRETATION]

C-2
CYP450 – Data Abstraction Form/Evidence Table Template for Questions 3-5 Study Study Design
Patient Characteristics
Results Comments/Quality Scoring
First author, date, and ProCite#
Geographical location: Dates: Size of population: Method of CYP testing or product used: Cytochromes (and specific mutations) tested for:
Age: Mean (SD): Median: Range: Weight: Mean (SD): Median: Range: Race/ethnicity (n [%]): Inclusion criteria: Exclusion criteria:
1) Drug concentrations (including effect of race/ethnicity, diet, and other medications): 2) Efficacy (including effect of race/ethnicity, diet, and other medications): 3) Adverse drug reactions (including effect of race/ethnicity, diet, and other medications): 4) Clinical outcomes (testing vs. not testing): 5) Depression management decisions: 6) Medical, personal, and public health decisionmaking: 7) Other harms:
[IF ARTICLE SHOULD BE EXCLUDED, PLEASE EXPLAIN WHY HERE] [COMMENT ON BIASES, ETC. AFFECTING CLINICAL INTERPRETATION] Quality assessment:

D-1
Appendix D. Evidence Tables
Evidence Table 1. Question 2: What is the analytic validity of tests that identify key CYP450 polymorphisms?1 Study Study Design
Patient Characteristics
Results Quality Assessment/Comments
Roche Molecular Systems, Inc., 2004 #11890 and Roche Molecular Systems, Inc., 2005 #13610
Geographical location: Not reported Size of population: 246 (compared with sequencing) and 403 (compared with PCR-RFLP) for CYP2D6 analysis; 123 (compared with sequencing) and 798 (compared with PCR-RFLP) for CYP2C19 genotyping Method of CYP testing or product used: AmpliChip CYP450 microarray Cytochromes (and specific mutations) tested for: CYP2D6 *1, *2, *3, *4, *5, *6, *9, *10, *15, *17, *29, *35, *36, *40, *41, *1xN, *2xN, *4xN, *10xN, *17xN, *35xN, *41xN CYP2C19 *1, *2, *3
Race/ethnicity: Not reported
Summary of test performance: Note: Comparisons of genotype calls as compared to the gold standard of sequencing are presented in Tables 6 and 7 of the report.
Amplichip CYP450 test results 2D6
allele
Number of alleles sequen-
ced Correct calls
Mis-calls
No calls
Percent agree-ment
*1 103 102 0 1 99 *2 64 63 0 1 98.4 *3 14 14 0 0 100 *4 73 73 0 0 100 *5 26 26 0 0 100 *6 8 8 0 0 100 *9 9 9 0 0 100 *10 40 40 0 0 100 *15 1 1 0 0 100 *17 28 28 0 0 100 *29 12 12 0 0 100 *35 32 32 0 0 100 *36 2 2 0 0 100 *40 2 2 0 0 100
Quality assessment: 1) How often is the test positive when a polymorphism is present? CYP2D6 = 99.22%; CYP2C19 = 100% 2) How often is the test negative when a polymorphism is not present? CYP2D6 = 99.02%; CYP2C19 = 99.6% *2/*10 was identified as *2/*2 by both PCR-RFLP and AmpliChip (both alleles predict poor metabolizer status) 3) Is an internal QC program defined and externally monitored? - A 7-member panel for CYP2D6 testing ang 6-member panel for CYP2C19 testing was constructed from cell lines representing all known alleles were repeatedly tested at multiple sites - Comparison to PCR-RFLP and
1 Studies in this evidence table are ordered by significance: first CYP2D6, then others, primarily CYP2C9 and CYP2C19. Within each of these categories, reference to sequencing is regarded as a higher level of evidence than other methods. Also, within the CYP2D6 category, we first group all the CYP2D6-variant studies and then the CYP2D6 gene copy number studies.

D-2
Evidence Table 1 (continued) Study Study Design
Patient Characteristics
Results Quality Assessment/Comments
Reference standard test: Bidirectional DNA sequencing, allele specific amplification (ASA) and PCR-RFLP
*41 71 71 0 0 100 *1xN 1 0 0 1 0 *2xN 1 0 0 1 0 *4xN 1 1 0 0 100 *10x
N 1 1 0 0 100
*17xN 1 1 0 0 100
*35xN 1 1 0 0 100
*41xN 1 1 0 0 100
Total 492 488 0 4 99.2
Amplichip CYP450 test results 2C19
allele
Number of alleles seque-nced Correct
calls Mis-calls
No calls
Percent agree-ment
*1 153 153 0 0 100 *2 79 78 1 0 98.7 *3 14 0 0 0 100
Total 246 245 1 0 99.6 (continued on next page)
sequencing - Some alleles (CYP2D6 *7, *8, *11, *19, *20) were analytically validated using imitation samples - Some alleles were tested only on one or few samples (CYP2D6 *15, *36, *40, *17xN, *35xN, *41xN) 4) Have repeated measurements been made on specimens? Yes, in triplicates for 5 runs at each site 5) What is the within- and between-laboratory precision? CYP2D6 = 941/944 correctly called = 99.7%; CYP2C19 = 806/809 correctly called = 99.6% 6) How often does the test fail to give a useable result? Never 7) How similar are results obtained in multiple laboratories using the same or different technology? Inter-laboratory variability was assessed as part of a reproducibility score by comparing genotype calls between three sites. Comments: - Allele frequency data cannot be compared to published findings due to lack of ethnicity information on tested samples - Commercial laboratory

D-3
Evidence Table 1 (continued) Study Study Design
Patient Characteristics
Results Quality Assessment/Comments
Comparison between methods
Alleles and total counts
Sensitivity & specificity [confidence interval]
Robustness
AmpliChip vs. sequencing
CYP2D6 *2,*3,*4,*5,* 6,*9,*10, *15,*17,*29,* 35,*36,*40, *41,*1xN, *2xN, *4xN, *10xN, *17xN, *35xN, *41xN 291/293
*1 102/103
99.3% [97.5- 99.8] 99% [94.7- 99.8]
AmpliChip vs. PCR-RFLP/ASA/PCR size^
CYP2D6 *2,*3,*4,*5, *6,*9,*10,*15 ,*17,*29,*35, *36,*40,*41, *1xN, *2xN, *4xN, *10xN, *17xN, *35xN, *41xN 583/588
99.2% [98-
Reproduci-bility 7 samples (7 genotypes) x 3 sites x triplicates x 5 runs x 3 lots of reagents, correct genotype calls = 940/944 (99.6%; 98.9-99.8)

D-4
Evidence Table 1 (continued) Study Study Design
Patient Characteristics
Results Quality Assessment/Comments
*1 217/218
99.6] 99.5% [97.4-99.9]
AmpliChip vs. sequencing
CYP2C19 *2,*3 92/93
*1 153/153
98.9% [94.2- 99.8] 100% [97.6- 100]
AmpliChip vs. PCR-RFLP/ASA/PCR size^
CYP2C19 *2,*3 57/58
*1 494/494
100% [97.5- 100] 100% [99.4- 100]
Reproduci-bility 6 samples (3 genotypes) x 3 sites x triplicates x 5 runs x 3 lots of reagents, correct genotype calls = 806/809 (99.6%; 98.9-99.9)

D-5
Evidence Table 1 (continued) Study Study Design
Patient Characteristics
Results Quality Assessment/Comments
Chou, Yan, Robbins-Weilert, et al., 2003 #15370
Geographical location: USA Size of population: 232 Method of CYP testing or product used: CYP450 GeneChip® (previous version of AmpliChip®) Cytochromes (and specific mutations) tested for: CYP2D6 *3, *4, *6, *7 and *9 Reference standard test: Allele-specific amplification (ASA)
Race/ethnicity: Caucasian 87.3% African-American 5.5% Hispanic 1.7% Asian 1.2% Multiracial 2.5%
Summary of test performance:
Method comparison Number of individuals
genotyped
CYP 2D6
geno-type
No. of indivi-duals
sequen-ced Ampli-
Chip ASA
Total allele counts
NR* *3 4/4 *4 94/94 *6 4/4 *7 0/0 *9 10/10
* Results of genotype counts validated and compared to the ASA method reference are not provided.
Comparison between methods
Alleles and total counts
Sensitivity & specificity
[confidence interval]
Robustness
GeneChip vs. ASA
CYP2D6 *3,*4,*6, *7,*9 112/112 *1 NR
100% [96.7– 100] NR
Pre-analytic robustness: genotyping success sensitive to DNA quality ~20% of cases Inter-assay reproduci-bility (2 samples x 2) = 100% [34.2-100]
1) How often is the test positive when a polymorphism is present? 100%. 2) How often is the test negative when a polymorphism is not present? 100%. 3) Is an internal QC program defined and externally monitored? - Each genotyping method was performed in a different laboratory. - Insufficient yields of the longer PCR products in the GeneChip multiplex PCR reaction were routinely used in smaller volumes of DNA or re-extracted using Qiagen Blood Amp Kit. - All discrepancies between the two genotyping methods were addressed by 2 additional repeats of AS-PCR tests. 4) Have repeated measurements been made on specimens? Only when discrepancies between the two methods were discovered. 5) What is the within- and between-laboratory precision? The intra-assay precision was tested only for 2 samples with *41/*1 genotype, which showed 100% precision. 6) How often does the test fail to give a useable result?

D-6
Evidence Table 1 (continued) Study Study Design
Patient Characteristics
Results Quality Assessment/Comments
- 4/236 (1.7%) samples did not achieve desirable quality/quantity of DNA or could not give unambiguous genotype - The method is very sensitive to DNA quality and ~20% of samples failed to yield sufficient amounts of the longer PCR products in the first attempt. 7) How similar are results obtained in multiple laboratories using the same or different technology? Allele frequencies obtained by both methods (n = 464) are not reported by ethnicity, although the study population was heterogeneous. Allele frequencies are reported for Caucasians only (n = 412), but this report is based on a total of 472 alleles (including 4 additional individuals genotyped only by the GeneChip, and of unknown ethnicity). Comments: This version of the AmpliChip includes a smaller set of alleles tested, a less developed software for distinguishing between signals of duplicated alleles and single copy alleles and better controlled sensitivity to the different length of PCR products multiplexed in the reaction. The current version of the kit incorporates positive and negative controls, which were not reported in this article

D-7
Evidence Table 1 (continued) Study Study Design
Patient Characteristics
Results Quality Assessment/Comments
Hers-berger, Marti-Jaun, Rentsch, et al., 2000 #5290
Geographical location: Switzerland Size of population: 57 Method of CYP testing or product used: 3 single tube tetraprimer PCR assays for allele specific amplification (ASA) Cytochromes (and specific mutations) tested for: CYP2D6 *3, *4, *6 Reference standard test: PCR-RFLP
Race/ethnicity: Caucasian 100%
Summary of test performance:
Method comparison Number of individuals
genotyped CYP 2D6
geno-type
No. of indivi-duals
sequen-ced
ASA (repeated
tests) PCR-RFLP
Total allele counts
*3/*1 3 3 (x 7)
*1/*1
2 2 (x 7)
57
57
Sequencing: *3 3/3 *1 7/7 PCR-RFLP: *1 114/114
*4/*1 4 4 (x 11) 26
26
*4/*4 2 2 (x 11) 3 3
*1/*1 2 2 (x 11) 28 28
Sequencing: *4 8/8 *1 8/8 PCR-RFLP: *4 32/32 *1 82/82
*6/*1 2 1
2 (x 9) 1
*1/*1 4 4 (x 9) 56
56
Sequencing: *6 3/3 *1 11/11 PCR-RFLP: *1 112/112
(continued on next page)
Quality assessment: 1) How often is the test positive when a polymorphism is present? 100%. 2) How often is the test negative when a polymorphism is not present? 100%. 3) Is an internal QC program defined and externally monitored? Known *3, *4, *6 genotypes by sequencing were reanalyzed multiple times as controls for the samples analyzed. 4) Have repeated measurements been made on specimens? 7-11 repeats of control DNAs were made to ensure reproducibility of results in comparison to sequencing results. 5) What is the within- and between-laboratory precision? Not reported. 6) How often does the test fail to give a useable result? Never. 7) How similar are results obtained in multiple laboratories using the same or different technology? Allele frequencies are comparable

D-8
Evidence Table 1 (continued) Study Study Design
Patient Characteristics
Results Quality Assessment/Comments
Comparison between methods
Alleles and total counts
Sensitivity & specificity
[confidence interval]
Robustness
ASA vs. sequencing
CYP2D6 *4,*6 14/14 *1 26/26
100% [78.5– 100] 100% [87.1– 100]
ASA vs. PCR-RFLP
CYP2D6 *4 32/32 *1 308/308
100% [89.3– 100] 100% [98.8– 100]
Inter-assay reproduci-bility: *3 (3 samples x 7) = 100% (implied) *4 (4 samples x 11) = 100% (implied) *6 (2 samples x 9) = 100% (implied)
to published data in Caucasian populations Comments: - The 4 mutations tested predict 93-94.5% of poor metabolizers in Caucasians

D-9
Evidence Table 1 (continued) Study Study Design
Patient Characteristics
Results Quality Assessment/Comments
Muller, Zopf, Bachofer, et al., 2003 #11710
Geographical location: Germany Size of population: 105 – deletion, duplication 116 – preamplification Method of CYP testing or product used: Real-Time (RT) long PCR Cytochromes (and specific mutations) tested for: CYP2D6 *2, *41%, *4, *5, *2, *35, *1xN Reference standard test: Long range and multiplex PCR, as well as PCR-RFLP
Race/ethnicity: Caucasian 100% Population included volunteers and patients (59 of whom were depressive inpatients)
Summary of test performance:
Method comparison Number of individuals
genotyped CYP 2D6
geno-type
No. of indivi-duals
sequen-ced
RT-PCR (repeated
tests) PCR-RFLP
Total allele counts
*35/*1 14 14 *35/ *35
3 3
*1/*1 101 101
PCR-RFLP: *35 20/20 *1 206/206 Multiplex PCR*: *2G% 14/14 *2C% 30/30 *4 19/19 *5 1/1 *1xN 1/1 *1 53/53
Notes: Genotype counts for method comparison to multiplex PCR are not reported. % *2G refers to *41, while *2C is common to both the EM *2 allele and the IM *41 allele (continued on next page)
Quality assessment: 1) How often is the test positive when a polymorphism is present? 100%. 2) How often is the test negative when a polymorphism is not present? 100%. 3) Is an internal QC program defined and externally monitored? Not reported. 4) Have repeated measurements been made on specimens? Yes, different investigators repeatedly analyzed the same samples. 5) What is the within- and between-laboratory precision? Not reported. 6) How often does the test fail to give a useable result? Never. 7) How similar are results obtained in multiple laboratories using the same or different technology? Allele frequencies are reported for depressive patients only (not comparable to healthy individual know frequencies).

D-10
Evidence Table 1 (continued) Study Study Design
Patient Characteristics
Results Quality Assessment/Comments
Comparison between methods
Alleles and total counts
Sensitivity & specificity
[confidence interval]
Robustness
RT-PCR vs. PCR-RFLP
CYP2D6 *35 20/20 *1 206/206
100% [83.9– 100] 100% [98.2– 100]
RT-PCR vs. multiplex PCR
CYP2D6 *2G%, *2C%, *4,*5,*1xN 65/65 *1 53/53
100% [94.43– 100] 100% [93.2– 100]
Comments: - Actual numbers with polymorphisms not reported

D-11
Evidence Table 1 (continued) Study Study Design
Patient Characteristics
Results Quality Assessment/Comments
Eriksson, Berg, Wadelius, et al., 2002 #4820
Geographical location: Sweden Size of population: 2D6: 117 2C9: 28 2C19: 138 Method of CYP testing or product used: Multiplex pyrosequencing assay Cytochromes (and specific mutations) tested for: CYP2D6 *3, *4 CYP2C9 *2, *3 2C19 *2, *4 Reference standard test: PCR- RFLP
Race/ethnicity: Caucasian 100%
Summary of test performance:
Method comparison Number of individuals
genotyped CYP 2D6
geno-type
No. of indivi-duals
sequen-ced
Pyro-sequen-
cing (repeated
tests)
PCR-RFLP
Total allele counts
*3/*1 1 1 *3/*3
1 1
*3/*4 3 3 *4/*1 29 29 *4/*4 5 5 *1/*1 24 24
*3 6/6 *4 42/42 *1 78/78
Method comparison Number of individuals
genotyped CYP 2C9
geno-type
No. of indivi-duals
sequen-ced
Pyro-sequen-
cing (repeated
tests)
PCR-RFLP
Total allele counts
*2/x% 14 14 *3/x% 10 10 *1/*1 9 9
*2 14/14 *3 10/10 *1 NR%
(continued on next page)
Quality assessment: 1) How often is the test positive when a polymorphism is present? Genotypes tested by PCR-RFLP showed 100% sensitivity (CYP2D6 *3, *4, CYP2C9 *2, *3, CYP2C19 *2, *3 and *4). 2) How often is the test negative when a polymorphism is not present? Genotypes tested by PCR-RFLP showed 100% specificity (CYP2D6 *3, *4, CYP2C9 *2, *3, CYP2C19 *2, *3, and *4). 3) Is an internal QC program defined and externally monitored? Confirmatory data obtained from surrounding sequence as internal control. 4) Have repeated measurements been made on specimens? Not reported. 5) What is the within- and between-laboratory precision? Not reported. 6) How often does the test fail to give a useable result? Not reported. 7) How similar are results obtained in multiple laboratories using the same or different
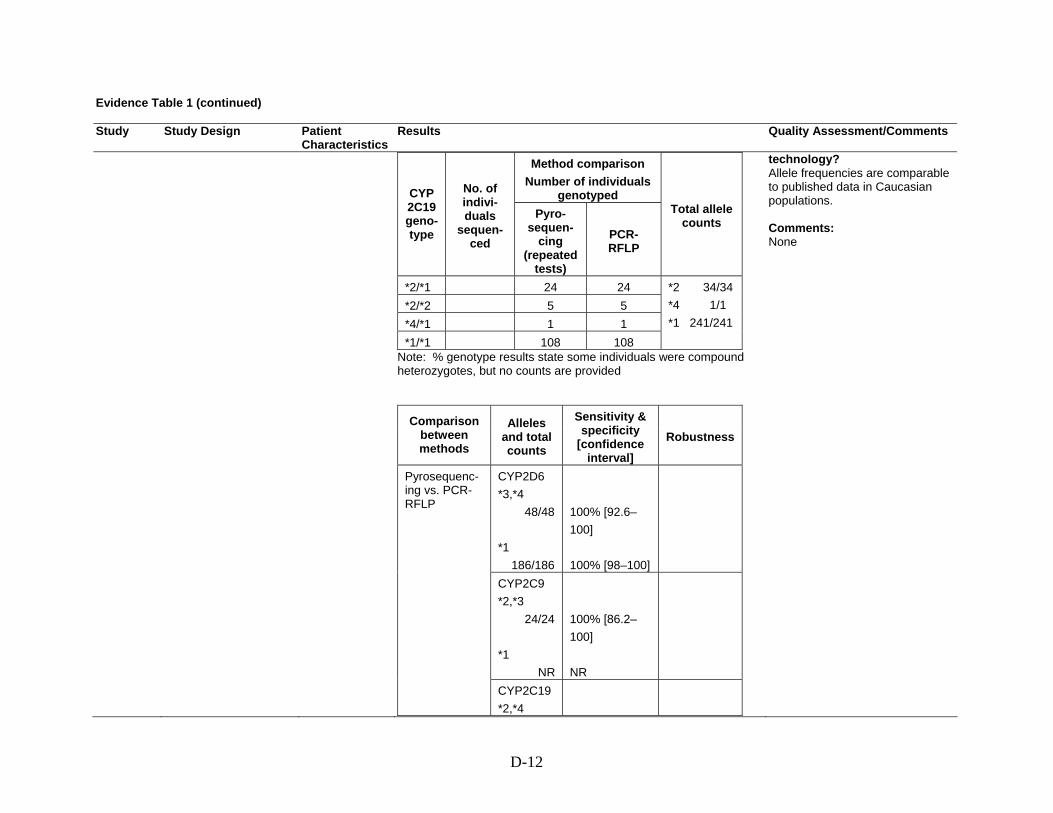
D-12
Evidence Table 1 (continued) Study Study Design
Patient Characteristics
Results Quality Assessment/Comments
Method comparison Number of individuals
genotyped CYP 2C19 geno-type
No. of indivi-duals
sequen-ced
Pyro-sequen-
cing (repeated
tests)
PCR-RFLP
Total allele counts
*2/*1 24 24 *2/*2 5 5 *4/*1 1 1 *1/*1 108 108
*2 34/34 *4 1/1 *1 241/241
Note: % genotype results state some individuals were compound heterozygotes, but no counts are provided
Comparison between methods
Alleles and total counts
Sensitivity & specificity
[confidence interval]
Robustness
CYP2D6 *3,*4 48/48 *1 186/186
100% [92.6– 100] 100% [98–100]
CYP2C9 *2,*3 24/24 *1 NR
100% [86.2– 100] NR
Pyrosequenc-ing vs. PCR-RFLP
CYP2C19 *2,*4
technology? Allele frequencies are comparable to published data in Caucasian populations. Comments: None

D-13
Evidence Table 1 (continued) Study Study Design
Patient Characteristics
Results Quality Assessment/Comments
35/35 *1 241/241
100% [90.1– 100] 100% [98.4– 100]
Stamer, Bayerer, Wolf, et al., 2002 #4890
Geographical location: Germany Size of population: 323 Method of CYP testing or product used: Real Time (RT) PCR, melting profiles Cytochromes (and specific mutations) tested for: CYP2D6 *3, *4, *5, *6, *7, *8 Reference standard test: Allele-specific multiplex PCR (ASA), sequencing
Race/ethnicity: Caucasian 100%
Summary of test performance:
Method comparison Number of individuals
genotyped CYP 2D6
geno-type
No. of indivi-duals
sequen-ced
RT-PCR (repeated
tests) ASA
Total allele counts
*5/*1 1 1 *5/*5 11 11 *5/*6 1 1
*3 6/6 *4 120/120 *5 17/17 *6 20/20 *7 0/0 *8 1/1 *1 478/478
Comparison between methods
Alleles and total counts
Sensitivity & specificity
[confidence interval]
Robustness
RT-PCR vs. ASA
CYP2D6 *3,*4,*5, *6,*8 164/164
100% [97.8– 100]
Deviation from expected sequence = 4/323 (1.2%; 0.5-3.1)
Quality assessment: 1) How often is the test positive when a polymorphism is present (sensitivity)? 100%. 2) How often is the test negative when a polymorphism is not present (specificity)? 100%. 3) Is an internal QC program defined and externally monitored? - Positive controls for each genotype were integrated into the genotyping process. - Uncertain results obtained with allele-specific multiplex PCR and positive controls were sequenced bidirectionally to confirm real-time PCR findings. 4) Have repeated measurements been made on specimens? Yes (3 times). 5) What is the within- and between-laboratory precision? Same results with 3 different investigators in the same lab.

D-14
Evidence Table 1 (continued) Study Study Design
Patient Characteristics
Results Quality Assessment/Comments
*1 478/478
100% [99.2– 100]
Inter-assay reproduci-bility (3 investiga-tors): 100%
6) How often does the test fail to give a useable result? Never. 7) How similar are results obtained in multiple laboratories using the same or different technology? Frequencies comparable to expected results in Caucasians Comments: - 4 samples showed abnormal melting profiles indicating the presence of a mutation other than the expected ones. These findings were confirmed by sequencing, as *28, C1776T and G3027A

D-15
Evidence Table 1 (continued) Study Study Design
Patient Characteristics
Results Quality Assessment/Comments
Schaef-feler, Schwab, Eichel- baum, et al., 2003 #4590
Geographical location: Germany Size of population: 64 Method of CYP testing or product used: Real-time (RT) PCR Quantification of 2D6 gene copies in relation to albumin as internal reference gene Cytochromes (and specific mutations) tested for: 2D6 gene copy number Reference standard test: Long-range PCR
Race/ethnicity: Caucasian 100%
Summary of test performance:
Method comparison Number of individuals genotyped
CYP 2D6 genotype
No. of indivi-duals
sequen-ced RT-PCR
(repeated tests)
Long range PCR
Total allele counts
Del/Del 1 (x 2) 1 Del/SC 13 13 Dup/SC 5 5 Dup/Del 0 1 SC/SC 43 43
Deletion (Del) 14/18 Duplication (Dup) 5/8 Single copy (SC)100/102
Comparison between methods
Alleles and total counts
Sensitivity & specificity
[confidence interval]
Robustness
RT-PCR vs. Long range PCR
CYP2D6 Del,Dup 19/26 SC 100/102
73.1% [54– 86.3] 98% [93.1– 99.4]
Intra-assay coefficient of variance (12 samples x 2) = 7-13% Inter-assay coefficient of variance (8 samples x 3) = 9-26%
Quality assessment: 1) How often is the test positive when a polymorphism is present? 100%. 2) How often is the test negative when a polymorphism is not present? 73.1%. TaqMan gene quantification gives unambiguous results for homozygotes with a gene count of 1. If 2 genes are present, 2 constellations are possible: one with two single-gene alleles on 2 chromosomes, and one in which a duplicated allele is combined with a deletion allele on the other chromosome. Functionally, both alternatives yieldsimilar activity profiles, thus clinically this specificity issue should not be of relevance. 3) Is an internal QC program defined and externally monitored? - CYP2D6*5/*5 DNA was used as an authentic genomic control. - 5 known *1, *2, *3 copies analyzed in duplicates. 4) Have repeated measurements been made on specimens? 12 measurements, coefficient of variation reported to be between 7% and 13%. 5) What is the within- and

D-16
Evidence Table 1 (continued) Study Study Design
Patient Characteristics
Results Quality Assessment/Comments
between-laboratory precision? Inter-assay variability of 8 samples on 3 different days: coefficient of variation 9% to 26%. 6) How often does the test fail to give a useable result? Never. 7) How similar are results obtained in multiple laboratories using the same or different technology? The sample was not random, population-based, but rather it was enriched with individuals with low sparteine metabolic ratios. Allele frequencies thus do not necessarily reflect findings in comparable healthy populations. Comments: None
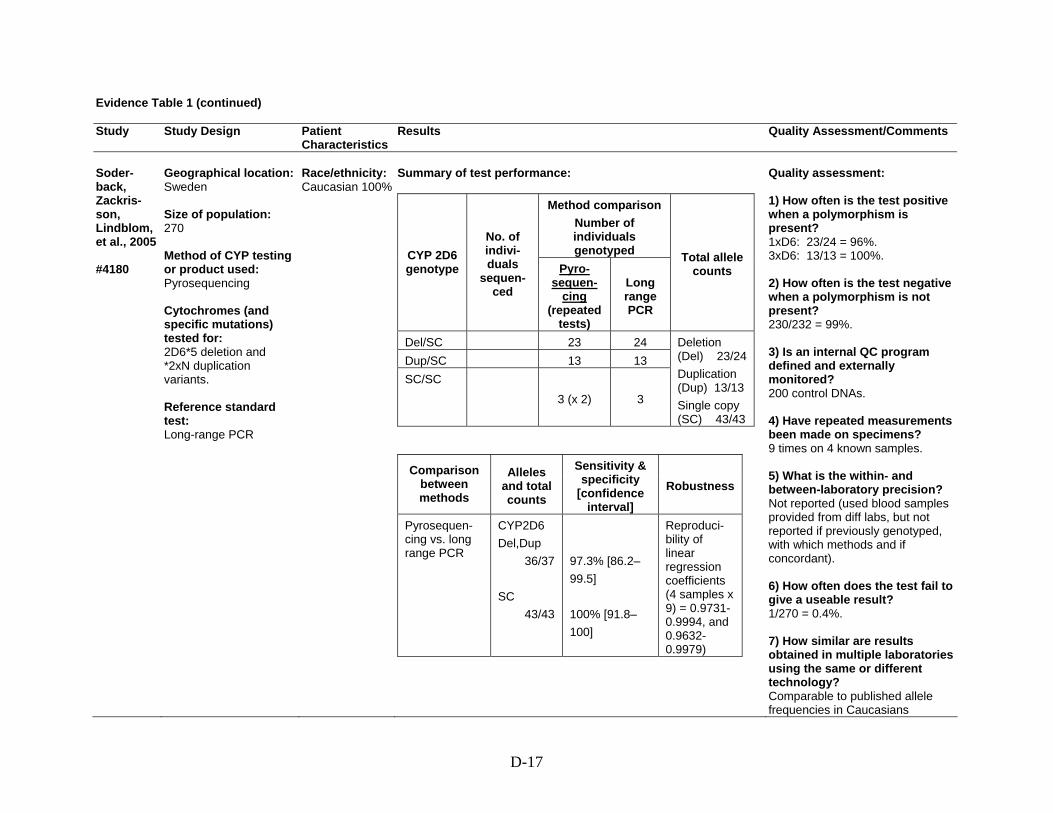
D-17
Evidence Table 1 (continued) Study Study Design
Patient Characteristics
Results Quality Assessment/Comments
Soder-back, Zackris-son, Lindblom, et al., 2005 #4180
Geographical location: Sweden Size of population: 270 Method of CYP testing or product used: Pyrosequencing Cytochromes (and specific mutations) tested for: 2D6*5 deletion and *2xN duplication variants. Reference standard test: Long-range PCR
Race/ethnicity: Caucasian 100%
Summary of test performance:
Method comparison Number of individuals genotyped CYP 2D6
genotype
No. of indivi-duals
sequen-ced
Pyro-sequen-
cing (repeated
tests)
Long range PCR
Total allele counts
Del/SC 23 24 Dup/SC 13 13 SC/SC
3 (x 2) 3
Deletion (Del) 23/24 Duplication (Dup) 13/13 Single copy (SC) 43/43
Comparison between methods
Alleles and total counts
Sensitivity & specificity
[confidence interval]
Robustness
Pyrosequen-cing vs. long range PCR
CYP2D6 Del,Dup 36/37 SC 43/43
97.3% [86.2– 99.5] 100% [91.8– 100]
Reproduci-bility of linear regression coefficients (4 samples x 9) = 0.9731-0.9994, and 0.9632-0.9979)
Quality assessment: 1) How often is the test positive when a polymorphism is present? 1xD6: 23/24 = 96%. 3xD6: 13/13 = 100%. 2) How often is the test negative when a polymorphism is not present? 230/232 = 99%. 3) Is an internal QC program defined and externally monitored? 200 control DNAs. 4) Have repeated measurements been made on specimens? 9 times on 4 known samples. 5) What is the within- and between-laboratory precision? Not reported (used blood samples provided from diff labs, but not reported if previously genotyped, with which methods and if concordant). 6) How often does the test fail to give a useable result? 1/270 = 0.4%. 7) How similar are results obtained in multiple laboratories using the same or different technology? Comparable to published allele frequencies in Caucasians

D-18
Evidence Table 1 (continued) Study Study Design
Patient Characteristics
Results Quality Assessment/Comments
Comments: None
Neville, Selzer, Aizenstein, et al., 2002 #4910
Geographical location: Not reported Size of population: 181 Method of CYP testing or product used: Long range PCR and allele specific amplification (ASA) Cytochromes (and specific mutations) tested for: 2D6 gene copy number Reference standard test: Long-range PCR
Race/ethnicity: Not reported
Summary of test performance:
Method comparison Number of individuals genotyped
CYP 2D6 genotype
No. of indivi-duals
sequen-ced
Long range
PCR and ASA
(repeated tests)
Long range PCR
Total allele counts
NR
Deletion (Del) 16/16 Duplication (Dup) 11/11
Comparison between methods
Alleles and total counts
Sensitivity & specificity
[confidence interval]
Robustness
Long range PCR and ASA vs. long range PCR
CYP2D6 Del,Dup 27/27 SC NR
100% [87.6– 100] NR
Quality assessment: 1) How often is the test positive when a polymorphism is present? 100%. 2) How often is the test negative when a polymorphism is not present? 100%. 3) Is an internal QC program defined and externally monitored? - Each PCR product was detected by at least two Invader assays. - Negative and positive controls were integrated into genotyping process. - CYP2D6 copy number assay was performed in duplicates. 4) Have repeated measurements been made on specimens? Yes (twice). 5) What is the within- and between-laboratory precision? Within-lab duplicated, 100% agreement. 6) How often does the test fail to give a useable result? - 7/181 DNA samples were too degraded to generate PCR

D-19
Evidence Table 1 (continued) Study Study Design
Patient Characteristics
Results Quality Assessment/Comments
products. - 10/1914 alleles (ambiguous low signals) – 0.5% (missing data rate). 7) How similar are results obtained in multiple laboratories using the same or different technology? Ethnicity of population not reported and cannot be compared to published data Comments: None
Weise, Grundler, Zaum-segel, et al., 2004 #4520
Geographical location: Germany Size of population: 122 Method of CYP testing or product used: Real-time (RT) PCR Cytochromes (and specific mutations) tested for: CYP2C8 *2, *3, *4 Reference standard test: PCR- RFLP
Race/ethnicity: Caucasian 100%
Summary of test performance:
Method comparison Number of individuals
genotyped CYP 2C8
geno-type
No. of indivi-duals
sequen-ced
RT-PCR (repeated
tests) PCR-RFLP
Total allele counts
*2/*1 2 (x 2) 2 *3/*1 16 (x 2) 16 *4/*1 8 (x 2) 8 *3/*4 1 (x 2) 1 *1/*1 95 (x 2) 95
*2 2/2 *3 17/17 *4 9/9 *1 216/216
(continued on next page)
Quality assessment: 1) How often is the test positive when a polymorphism is present? 100%. 2) How often is the test negative when a polymorphism is not present? 100%. 3) Is an internal QC program defined and externally monitored? Not reported. 4) Have repeated measurements been made on specimens? Repeated analyses of all analyzed samples were performed by four different investigators with 100% concordance.

D-20
Evidence Table 1 (continued) Study Study Design
Patient Characteristics
Results Quality Assessment/Comments
Comparison between methods
Alleles and total counts
Sensitivity & specificity
[confidence interval]
Robustness
RT PCR vs. PCR-RFLP
CYP2C8 *2,*3,*4 28/28 *1 216/216
100% [88–100] 100% [98.3–100]
Inter-assay reproduci-bility (all samples x 4 investiga-tors) = 100%
5) What is the within- and between-laboratory precision? Not reported. 6) How often does the test fail to give a useable result? Never. 7) How similar are results obtained in multiple laboratories using the same or different technology? Allele frequencies are comparable to published data in Caucasians Comments: None
Wu, Zhou, and Xu, 2002 #4900
Geographical location: China Size of population: 50 Method of CYP testing or product used: Mismatch hybridization Cytochromes (and specific mutations) tested for: CYP1A1 m1 and m2 Reference standard test: PCR-RFLP
Race/ethnicity: Not reported (presumably Chinese)
Summary of test performance:
Method comparison Number of individuals
genotyped CYP 1A1
genotype
No. of indivi-duals
sequen-ced
Mismatch hybridi-zation
(repeated tests)
PCR-RFLP
Total allele
counts
m1/*1 20 20 m1/m1 8 8 *1/*1 22 22
m1 36/36 *1 64/64
m2/*1 21 21 m2/m2 5 5 *1/*1 24 24
m2 31/31 *1 69/69
Quality assessment: 1) How often is the test positive when a polymorphism is present? 100%. 2) How often is the test negative when a polymorphism is not present? 98%. 3) Is an internal QC program defined and externally monitored? In design phase, 5 samples of each genotype were randomly tested by reference method. 4) Have repeated measurements been made on specimens?

D-21
Evidence Table 1 (continued) Study Study Design
Patient Characteristics
Results Quality Assessment/Comments
Comparison between methods
Alleles and total counts
Sensitivity & specificity
[confidence interval]
Robustness
Mismatch hybridization vs. PCR-RFLP
CYP1A1 m1 36/36 *1 64/64
100% [90.4– 100] 100% [94.3– 100]
Inter-assay coefficient of variance = 3.3-9.5% Intra-assay coefficient of variance = 5-12.9%
Mismatch hybridization vs. PCR-RFLP
CYP1A1 m2 31/31 *1 69/69
100% [89–100] 100% [94.7–100]
Inter-assay coefficient of variance = 5.1-11.2% Intra-assay coefficient of variance = 8.9-14.3%
Single DNA sample was split into 5 aliquots and stored at -20 degree C. On 5 different days, a single split was removed, subjected to PCR, split into 2 aliquots, then hybridized and measured. 5) What is the within- and between-laboratory precision? Not reported. 6) How often does the test fail to give a useable result? Never. 7) How similar are results obtained in multiple laboratories using the same or different technology? Allele frequencies reported match Asian published data Comments: None
Mizugaki, Hiratsuka, Agatsuma, et al., 2000 #5380
Geographical location: Japan Size of population: 144 Method of CYP testing or product used: Allele-specific amplification (ASA) and TaqMan PCR for 2C18 m1 and m2 Cytochromes (and
Race/ethnicity: Japanese 100%
Summary of test performance:
Method comparison Number of individuals
genotyped CYP 2C18 geno-type
No. of indivi-duals
sequen-ced
ASA (repeated
tests) PCR-RFLP
Total allele
counts
m1/*1 29 (x 3) 29 m1 42/42
Quality assessment: 1) How often is the test positive when a polymorphism is present? 100%. 2) How often is the test negative when a polymorphism is not present? 100%. 3) Is an internal QC program defined and externally

D-22
Evidence Table 1 (continued) Study Study Design
Patient Characteristics
Results Quality Assessment/Comments
specific mutations) tested for: CYP2C19 *2, *3 CYP2C18 m1, m2 used as surrogates Reference standard test: PCR-RFLP
m2/m2 8 (x 2) 8 *1/*1 51 (x 3) 51
176/176
Comparison between methods
Alleles and total counts
Sensitivity & specificity
[confidence interval]
Robustness
ASA vs. PCR-RFLP
CYP2C18 m1,m2 112/112 *1 176/176
100% [96.7– 100] 100% [97.9– 100]
Inter-assay variability implied as 100%
monitored? Not reported. 4) Have repeated measurements been made on specimens? Yes (3 times). 5) What is the within- and between-laboratory precision? Not reported. 6) How often does the test fail to give a useable result? Not reported. 7) How similar are results obtained in multiple laboratories using the same or different technology? Allele frequencies for the CYP2C18 and CYP2C19 match published data in Japanese Comments: - In Japanese populations there is complete linkage disequilibrium between the tested polymorphisms in CYP2C18 and 19: CYP2C18 m1 = CYP2C19*3 CYP2C18 m2 = CYP2C19*2 - Similar linkage is reported also for Caucasians (Inoue et al, 1998)

D-23
Evidence Table 1 (continued) Study Study Design
Patient Characteristics
Results Quality Assessment/Comments
Muthiah, Lee, The, et al., 2004 #4240
Geographical location: Malaysia Size of population: 57 Method of CYP testing or product used: Two step multiplex PCR Cytochromes (and specific mutations) tested for: CYP2C8 *2, *3, *4 Reference standard test: Sequencing
Race/ethnicity: Malaysian Indians 100%
Summary of test performance:
Method comparison Number of individuals
genotyped CYP 2C8
geno-type
No. of indivi-duals
sequen-ced
Multiplex PCR
(repeated tests)
Total allele counts
*2/*1 2 2 *3/*1 3 3 *1/*1 52 52
*2 2/2 *3 3/3 *1 109/109
Comparison between methods
Alleles and total counts
Sensitivity & specificity
[confidence interval]
Robustness
Multiplex PCR vs. sequencing
CYP2C8 *2,*3 5/5 *1 109/109
100% [56.6– 100] 100% [88–100]
Quality assessment: 1) How often is the test positive when a polymorphism is present? 100%. 2) How often is the test negative when a polymorphism is not present? 100%. 3) Is an internal QC program defined and externally monitored? - 3 heterozygous mutations (*2, *3) sequenced and used as positive controls - *4 mutagenesis-generated positive control used - Negative controls with no DNA also used 4) Have repeated measurements been made on specimens? Not reported (only to determine optimal annealing temperatures). 5) What is the within- and between-laboratory precision? Not reported. 6) How often does the test fail to give a useable result? Never. 7) How similar are results obtained in multiple laboratories using the same or different technology?

D-24
Evidence Table 1 (continued) Study Study Design
Patient Characteristics
Results Quality Assessment/Comments
Little is published about expected allele frequencies in this population Comments: None

D-25
Evidence Table 2. Question 3a: How well do particular CYP450 genotypes correspond with metabolism of particular SSRIs? Do factors such as race/ethnicity, diet, or other medications affect this association? Study Study Design
Patient Characteristics
Results Comments/Quality Scoring
Berle, Steen, Aamo, et al., 2004 #440
Geographical location: Norway Dates: NR Size of population: 24 mothers and 25 infants (one pair of dizygotic twins; 14 mothers and 15 infants on citalopram and paroxetine) Method of CYP testing or product used: - Restriction enzyme digestion assays of CYP2C19-specific PCR-products - For CYP2D6, multiplex PCR with modification, long PCR assays - Blinded to demographic/ pharmacologic data Cytochromes (and specific mutations) tested for: 2C19 *2, *3, *4, *1 2D6 *3, *4, *6, *7, *8, *5, *1 SSRI(s): Citalopram, fluoxetine, paroxetine, sertraline (or venlafaxine)
Age: Mean: 31 Range: 20-42 Weight: NR Race/ethnicity: White Inclusion criteria: DSMIV Major depression Anti-depressant therapy Exclusion criteria: NR
1) Genotypes/phenotypes in patient population: Overview of genotypes in mothers tested:
CYPD6 *1/*1 (EM)
*1/*3 (EM)
*1/*4 (EM)
*2x2/*4
(EM)
*4/*4 (PM)
*1/*2x2
(UM) 12 2 8 1 1 1
CYP2C19
*1/*1 (EM)
*1/*2 (EM)
*2/*2 (PM)
14 9 1 2) Drug concentrations (including effect of race/ethnicity, diet, and other medications): One 2D6 PM mother-infant pair (SSRI-paroxetine): Mother had highest paroxetine level (210 nmol/L), but infant had undetectable level. One 2D6 UM infant did not have detectable paroxetine level (total 5 infants had undetectable paroxetine levels). One 2C19 PM mother treated with citalopram had highest citalopram level of all (394 nmol/L) at dose of 20 mg/day. Her heterozygous twin infants were EMs and had detectable but low concentration of citalopram. 5 infants with 2C19 *1*2 genotype had higher mean citalopram levels than the 5 infants with *1*1 genotype (p-value NR), and 3 of 4 infants with undetectable citalopram levels had *1*1 genotype.
Comments: - Exclusion criteria not described- No comment on concurrent medications - Infant blood level not drawn in a consistent manner, which may affect level Quality assessment: 3b

D-26
Evidence Table 2 (continued) Study Study Design
Patient Characteristics
Results Comments/Quality Scoring
For other drugs, such comparisons could not be performed because of undetectable levels of drug or skewed distribution of various genotypes
Charlier, Broly, Lhermitte, et al., 2003 #650
Geographical location: Belgium Dates: NR Size of population: 49 Method of CYP testing or product used: Genomic RFLP analysis PCR-SSCP analysis Cytochromes (and specific mutations) tested for: 2D6 “gene copy number” SSRI(s): Fluoxetine 20 mg/d (n = 12), paroxetine 20 mg/d (n = 37)
Age: Mean (SD): 48.2 (12.7) Range: 21-81 Weight: NR Race/ethnicity: North European White origin Inclusion criteria: DSM IV major depressive episode, MADRS ≥ 21 Exclusion criteria: Meds other than occasional benzodiazepines
1) Genotypes/phenotypes in patient population: Fluoxetine: 10 EMs, 2 PMs Paroxetine: 30 EMs, 6 PMs, 1 UM 2) Drug concentrations (including effect of race/ethnicity, diet, and other medications): Fluoxetine: 2 PMs had significantly higher steady state plasma concentration than the 10 EMs (p = 0.004). Paroxetine: 6 PMs had significantly higher plasma concentration compared to 30 EMs (p = 0.00001). One UM had undetectable plasma concentration
Comments: - 2D6*41 not investigated - No comment on diet, role of other CYP enzymes - Rate of deficiency of 2D6 expression found in this study is 16.3% compared to general population (also supported by a previous study of a psychiatric population showing 14%) - Ultrarapid genotype only 2% in this study, compared to 4.59 reported elsewhere (referenced). Quality assessment: 3b
Eap, Bondolfi, Zullino, et al., 2001 #1510
Geographical location: Switzerland Dates: NR Size of population: 11 Method of CYP testing or product used: Allele-specific PCR
Age: Mean (SD): 41(15) Range: 18-63 Weight: Mean (SD): 83 kg (15) Range: 53-104 kg Race/ethnicity: NR
1) Genotypes/phenotypes in patient population: 4 patients received co-medications (clorazepate, fluorazepam, procyclidine, acetaminophen, lormetazepam, lactulose, fenofibrate, lorazepam). Number of PMs = 3 (*4/*4) Number of heterozygous EMs = 2 (*1/*4) Number of homozygous EMs = 6 (*1/*1) 2) Drug concentrations (including effect of race/ethnicity,
Comments: - Small sample size - Risperidone for varying duration before study - Steady state not achieved of (S) isomer of fluoxetine Quality assessment: 3b

D-27
Evidence Table 2 (continued) Study Study Design
Patient Characteristics
Results Comments/Quality Scoring
Cytochromes (and specific mutations) tested for: 2D6 *3, *4, *6 , SSRI(s): Fluoxetine 20 mg from day 6 to 30 of 30-day study
Inclusion criteria: Subjects taking risperidone before the study who might benefit from combination therapy with risperidone (2 mg bid x 30 days) and fluoxetine Exclusion criteria: Abnormal labs, inducers/inhibitors of hepatic enzymes for 2 weeks before study
diet, and other medications): Mean concentration of S-fluoxetine and S-norfluoxetine significantly increased between days 14 and 23, indicating steady state had not been reached on day 14 (p < 0.01 for both). No significant differences in the concentrations of R- fluoxetine and R-norfluoxetine between days 14 and 23, suggesting steady state had been reached at day 14. For days 7, 14, and 23, no significant differences between concentrations of R-fluoxetine and R-norfluoxetine between PMs and EMs (p-values NR). Mean S-fluoxetine concentration was significantly higher and mean S-norfluoxetine concentration was significantly lower on day 7 (p = 0.037) and day 14 (p = 0.014) in PMs compared to EMs, and similar trend observed for day 23 (p = 0.068) where one sample for PM was missing. Heterozygous EMs had levels between homozygous and PMs (but not significantly different from homozygous EMs)
Gras-mader, Verwohlt, Rietschel, et al., 2004 #450
Geographical location: Germany Dates: 2000-2003 Size of population: 136 total 70 (SSRIs) (68 blood concentrations?) Method of CYP testing or product used: - RFLP-PCR - Positive and negative control samples
Age: Mean (SD): 49 (14) Weight: Mean (SD): 76.3 kg (17.5) Race/ethnicity: NR (refers to Caucasians in conclusion) Inclusion criteria: ICD-10 diagnosis F3, CGI > 4,
1) Genotypes/phenotypes in patient population: Testing for CYP2C9 and 2C19 showed no significant differences with respect to allele frequencies and number of carriers of none, one, or two functional alleles (p = 0.445, p = 0.847, respectively) when compared with other Caucasian control groups. 2D6 PMs were underrepresented in the sample (p = 0.05) compared to 195 healthy volunteers (in literature). 2) Drug concentrations (including effect of race/ethnicity, diet, and other medications): The relative deviation of mean dose-corrected plasma
Comments: - Accounted for co-meds that are substrates/inhibitors/inducers of 5 major CYP enzymes - HAMD and CGI used - Cut-off for therapeutic plasma concentration (weekly trough levels measured) - UKU side effect rating scale used - SSRIs and other meds (including TCAs, venlafaxine, mirtazapine); most results reported for entire group, not just for SSRIs

D-28
Evidence Table 2 (continued) Study Study Design
Patient Characteristics
Results Comments/Quality Scoring
Cytochromes (and specific mutations) tested for: CYP2C9 *1 to *3, CYP2C19*1 and *2, 2D6 *1 to *9 and gene duplication SSRI(s): Fluvoxamine, paroxetine, sertraline, citalopram
antidepressant therapy (including SSRIs) Exclusion criteria: Substance abuse/dependency, prior treatment with fluoxetine, acute suicidality, pregnancy, admission by legal commitment or for crisis intervention
concentrations from drug-specific median was significantly higher in CYP2D6 PMs (p < 0.001) and in persons with 2D6-inhibiting co-meds (p < 0.001). This parameter was lower in 2C19 EMs (p = 0.005) and in smokers (p = 0.033). Two PMs showed dose-corrected plasma concentrations > 2 times higher than median
- Other treatments allowed (e.g., psychotherapy), some patients on multiple antidepressants. Numbers reported in analyses don’t add up. - Therapeutic levels not well-established for SSRIs. Quality assessment: 4
Liu, Cheng, Huang, et al., 2001 #1440
Geographical location: China Dates: NR Size of population: 14 healthy Method of CYP testing or product used: NR (“previously determined”) Cytochromes (and specific mutations) tested for: 2C19 *1, *2, *3 SSRI(s): Fluoxetine (40 mg after overnight fast. AUC calculated for F and NorF.)
Age: Mean (SD): 20.1 (1.1) Range: 18-22 Weight: Mean (SD): 63 kg (6.4)Range: 55-80 kg Race/ethnicity: Chinese - 100% Inclusion criteria: Healthy (history, PE, no lab abnormalities indicating renal or hepatic disease) Exclusion criteria: Medication, alcohol, smoking in preceding 2 weeks
1) Genotypes/phenotypes in patient population: No of EMs: 8 (4 *1/*1, and 4 *1/*2) No of PMs: 6 (4 *2/*2, and 2 *2/*3) 2) Drug concentrations (including effect of race/ethnicity, diet, and other medications): PMs showed 46% increase in fluoxetine Cmax (p < 0.001), 128% increase in AUC (p < 0.001), 113% increase in half-life (p < 0.001), and 55% decrease in oral clearance (p < 0.001) compared with EMs. Mean norfluoxetine AUC significantly lower in PMs than in EMs (p < 0.001). Mean fluoxetine oral clearance was significantly higher in wild type homozygotes compared to heterozygotes (p < 0.01) and in PMs (p < 0.001). Mean norfluoxetine AUC in PMs was significantly smaller than that in wild type homozygotes (p < 0.05) and in heterozygotes (p < 0.001)
Comments: - Single dose - Don’t know status of other CYP gene polymorphisms, e.g., 2D6, that are involved in fluoxetine metabolism - Method for CYP testing not reported in this study, references provided Quality assessment: 3b

D-29
Evidence Table 2 (continued) Study Study Design
Patient Characteristics
Results Comments/Quality Scoring
LLerena, Dorado, Berecz, et al., 2004 #580
Geographical location: Spain Dates: NR Size of population: 64 Method of CYP testing or product used: PCR based AmpliTaq Gold System (2D6*3, *4, *6), Expand Long Template PCR system (2D6*5), RFLP-PCR (2C9*1, *2, *3) Cytochromes (and specific mutations) tested for: 2D6: *3, *4, *5, *6 2C9: *1, *2, *3 SSRI (s): Fluoxetine
Age: Mean (SD): 51 (15) Range: 18-77 Weight: NR Race/ethnicity: White European – 100% Inclusion criteria: Psychiatric outpatients, same fluoxetine dose for at least 45 days (range10 to 60 mg/d); no inhibitors or substrates of 2D6/2C9 Exclusion criteria: NR
1) Genotypes/phenotypes in patient population:
2D6 genotype
Proposed phenotype
Number of patients
*1/*1 Homozygous EM 41 *1/*4 Heterozygous
EM 17
*1/ *6 Heterozygous EM
2
*4/*4 PM 1 *1/*1xN or *1/ *2xN
UM 3
2) Drug concentrations (including effect of race/ethnicity, diet, and other medications): Dose-corrected plasma concentration of fluoxetine significantly related to number of active 2D6 genes (p < 0.01). No such correlation between norfluoxetine or active moiety (fluoxetine + norfluoxetine) and 2D6 gene copies. Fluoxetine/norfluoxetine ratio was overall significantly correlated with number of active CYP2D6 genes (p < 0.01). In homozygous EMs of 2D6 (*1/*1), influence of 2C9 was evaluated (n = 38 total for *1/*1, *1/*2 and *1/*3). Dose-corrected plasma concentration of fluoxetine and active moiety were significantly higher in CYP2C9 *1/*2 and *1/*3 (p < 0.05) compared to *1/ *1 (wild). Norfluoxetine concentration higher in CYP2C9 *1/*3 (p < 0.05) compared to *1/*1. Fluoxetin/norfluoxetine ratios not significantly different. 3 patients with *2/*2, *2/*3, *3/*3 reported to be “not highly
Comments: - Overall great inter-individual variability in fluoxetine, norfluoxetine, and fluoxetine/norfluoxetine ratio was found in this study - Enantiomers of fluoxetine not studied Quality assessment: 3b

D-30
Evidence Table 2 (continued) Study Study Design
Patient Characteristics
Results Comments/Quality Scoring
different” compared to those heterozygous for *2 or *3, but analysis not shown, p-value not reported
Murphy, Kremer, Rodrigues, et al., 2003 #680
Geographical location: Multicenter, USA Dates: NR Size of population: 124 paroxetine 122 mirtazapine Method of CYP testing or product used: - Oligonucleotide microarrays - Scored by 2 observers blind to clinical data Cytochromes (and specific mutations) tested for: 2D6: 16 alleles, deletion, duplication, and *41 allele SSRI(s): Paroxetine (and mirtazapine)
Age: NR (reported for subgroups) Weight: NR (reported for subgroups) Race/ethnicity: NR Inclusion criteria: DSM-IV major depressive episode; 17-item HAMD score ≥ 18 Exclusion criteria: < 65 yrs, major medical problems, MMSE < 25% percentile for age, clinically significant lab abnormalities, unstable medical conditions, drug or alcohol abuse, psychosis, recent suicide attempt, other psychiatric problems, antidepressant treatment within 7 days of starting study
1) Genotypes/phenotypes in patient population: Frequency of common 2D6 alleles did not differ significantly from that reported in Caucasian populations. *10B was over-represented in the sample (possibly because 15 ethnic minority patients in the sample). PM n = 16, IM n = 26, UM n = 10, EM n = 94. Because of small number of PMs and UMs, groups combined as follows for analyses: PM + IM vs. EM + UM. For paroxetine: PM + IM n = 15, EM + UM, n = 105 2) Drug concentrations (including effect of race/ethnicity, diet, and other medications): For both meds, no differences between PM + IM vs. EM + UM groups in final daily dose achieved, dosing compliance, or plasma drug levels obtained after 4 weeks (exact p-values not reported). Same results for Caucasian patients when analyzed alone. ANOVA showed no effect of concurrent medication that was a 2D6 inhibitor or substrate
Comments: - Numbers do not add up for paroxetine or mirtazapine total N- Patients grouped to improve strength, IMs may not be very different from EMs Quality assessment: 3b
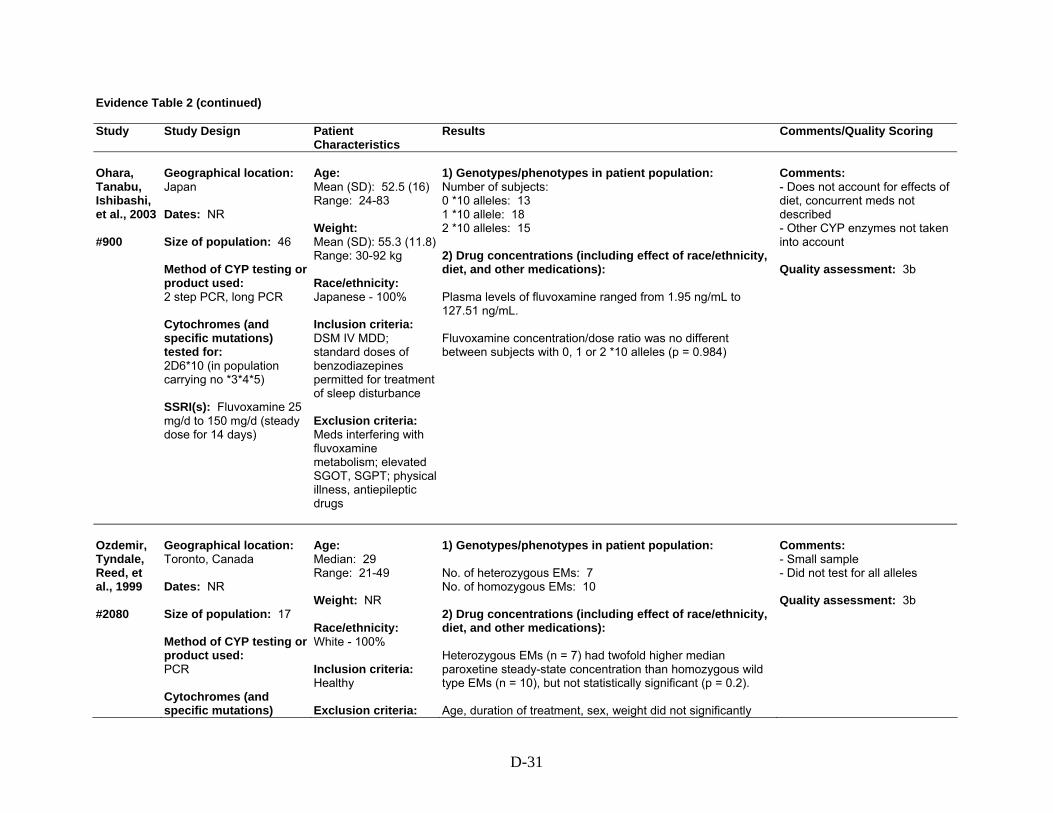
D-31
Evidence Table 2 (continued) Study Study Design
Patient Characteristics
Results Comments/Quality Scoring
Ohara, Tanabu, Ishibashi, et al., 2003 #900
Geographical location: Japan Dates: NR Size of population: 46 Method of CYP testing or product used: 2 step PCR, long PCR Cytochromes (and specific mutations) tested for: 2D6*10 (in population carrying no *3*4*5) SSRI(s): Fluvoxamine 25 mg/d to 150 mg/d (steady dose for 14 days)
Age: Mean (SD): 52.5 (16) Range: 24-83 Weight: Mean (SD): 55.3 (11.8)Range: 30-92 kg Race/ethnicity: Japanese - 100% Inclusion criteria: DSM IV MDD; standard doses of benzodiazepines permitted for treatment of sleep disturbance Exclusion criteria: Meds interfering with fluvoxamine metabolism; elevated SGOT, SGPT; physical illness, antiepileptic drugs
1) Genotypes/phenotypes in patient population: Number of subjects: 0 *10 alleles: 13 1 *10 allele: 18 2 *10 alleles: 15 2) Drug concentrations (including effect of race/ethnicity, diet, and other medications): Plasma levels of fluvoxamine ranged from 1.95 ng/mL to 127.51 ng/mL. Fluvoxamine concentration/dose ratio was no different between subjects with 0, 1 or 2 *10 alleles (p = 0.984)
Comments: - Does not account for effects of diet, concurrent meds not described - Other CYP enzymes not taken into account Quality assessment: 3b
Ozdemir, Tyndale, Reed, et al., 1999 #2080
Geographical location: Toronto, Canada Dates: NR Size of population: 17 Method of CYP testing or product used: PCR Cytochromes (and specific mutations)
Age: Median: 29 Range: 21-49 Weight: NR Race/ethnicity: White - 100% Inclusion criteria: Healthy Exclusion criteria:
1) Genotypes/phenotypes in patient population: No. of heterozygous EMs: 7 No. of homozygous EMs: 10 2) Drug concentrations (including effect of race/ethnicity, diet, and other medications): Heterozygous EMs (n = 7) had twofold higher median paroxetine steady-state concentration than homozygous wild type EMs (n = 10), but not statistically significant (p = 0.2). Age, duration of treatment, sex, weight did not significantly
Comments: - Small sample - Did not test for all alleles Quality assessment: 3b

D-32
Evidence Table 2 (continued) Study Study Design
Patient Characteristics
Results Comments/Quality Scoring
tested for: 2D6*1, *3, *4, *5 SSRI(s): Paroxetine 20mg/d for at least 5 days (5-15 days)
Smokers, “long-term medications that can interfere with 2D6 activity”
contribute to variability in paroxetine concentration (p > 0.05, n = 17)
Sawamura, Suzuki, and Someya, 2004 #320
Geographical location: Japan Dates: NR Size of population: 73 Method of CYP testing or product used: PCR (*1, *2, *10, *3, *4) Long PCR (*5) Cytochromes (and specific mutations) tested for: 2D6 *1, *2, *3, *4, *5 *10 SSRI(s): Paroxetine, 2 weeks of steady dose
Age: Mean (SD): 39.9 (15.4) Range: 13-73 Weight: NR Race/ethnicity: Japanese – 100% Inclusion criteria: Psychiatric patients Exclusion criteria: Drugs except benzodiazepines, physical illness (no subjects were taking SJW or OTC meds)
1) Genotypes/phenotypes in patient population: 9 different genotypes identified. Comparison carried out between *1/*1, *1/*10, *10/*10, and those with one or two *5 mutated alleles at each dose. 2) Drug concentrations (including effect of race/ethnicity, diet, and other medications): Exponential regression curve between paroxetine dose and mean plasma paroxetine concentration. Mean plasma paroxetine level in older subjects was higher than in younger subjects at each dose, statistically significant only at 40 mg dose (p = 0.013). Of note there was one *1/*1 elderly and 20 *1/*1 non-elderly (total numbers in each group NR). Plasma paroxetine concentrations in patients with *10 alleles were significantly higher than those without *10 allele at 10 mg/day dose (p = 0.019), but not at other doses
Comments: - Reasons for non-linearity: possible saturation of 2D6, possible self-inhibition of paroxetine metabolism at higher dose - Skewing of distribution of mutant alleles was not taken into account in comparing the paroxetine concentrations in the older and younger age groups - Asians CYP2D6*10 ~ 51% - CYP3A4 (potentially a secondary pathway) not taken into account Quality assessment: 3b
Scordo, Spina, Dahl, et al., 2005 #12770
Geographical location: Italy Dates: NR Size of population: 78 Method of CYP testing or product used:
Age: Mean (SD): 45 (4) Weight: NR Race/ethnicity: Caucasian, Italian Inclusion criteria:
1) Genotypes/phenotypes in patient population: CYP2D6: UM 8%, EM 63%, hetero EM 28.2%, PM 1.3% 2) Drug concentrations (including effect of race/ethnicity, diet, and other medications): Dose normalized plasma concentrations of S-fluoxetine, R-fluoxetine, S-norfluoxetine, and R-norfluoxetine did not differ
Comments: - Accounted for co-medications - Only one CYP2D6 PM patient Quality assessment: 3b

D-33
Evidence Table 2 (continued) Study Study Design
Patient Characteristics
Results Comments/Quality Scoring
2D6: allele-specific PCR, Long PCR 2C9, 2C19: PCR-RFLP Cytochromes (and specific mutations) tested for: CYP2D6 *3, *4, *5, *6 CYP2C9 *2, *3 CYP2C19 *2 SSRI(s): Fluoxetine (10-60 mg/d) for at least 5 weeks
On maintenance treatment with fluoxetine for major depression or other depressive disorders, no drugs interfering with CYP2D6/2C9/2C19 Exclusion criteria: None specified
significantly between different predicted phenotype groups of CYP2D6 or CYP2C19. Median S-norfluoxetine/S-fluoxetine ratios were higher in homozygous vs. heterozygous EMs. Among 2D6 EMs, 2C9 *1,*1 had lower concentration of R-fluoxetine, and active moiety than heterozygotes or PMs
Stedman, Begg, Kennedy, et al., 2002 #1050
Geographical location: New Zealand Dates: NR Size of population: 20 Method of CYP testing or product used: RFLP-PCR Cytochromes (and specific mutations) tested for: 2D6 *1, *2, *3, *4, *5, *6, *7, *8, *9, *10, *11, *12, *13, *14, *15, *16 SSRI(s): Fluoxetine, paroxetine
Age: Mean: 74.5 Range: 51-94 Weight: NR Race/ethnicity: NR Inclusion criteria: Taking fluoxetine or paroxetine, with adverse effect of hyponatremia, Na < 130 mmol/L Exclusion criteria: None specified
1) Genotypes/phenotypes in patient population: Fluoxetine n = 11, paroxetine n = 9 ; 16 were taking 20 mg/day, others were taking 10 mg qod to 40 mg/day.
2D6 allele
Study subjects (n = 20)
Sachse et al. (general population) (n = 589)
Significance (p-value)
*1 0.45 0.36 NS (p = 0.46)
*2 0.3 0.32 NS (p = 0.87)
*9 0.1 0.02 P = 0.0007
*4 0.15 0.21 NS (p = 0.46) 2D6 *9 (intermediate allele) more common in patient population. All patients were EM except one paroxetine patient was IM/PM genotype. 2) Drug concentrations (including effect of race/ethnicity,
Comments: - *9 finding is unlikely to be of significance - intermediate activity - Small number - Race not specified - Exclusion criteria not specified - Concurrent medications not specified Quality assessment: 4

D-34
Evidence Table 2 (continued) Study Study Design
Patient Characteristics
Results Comments/Quality Scoring
diet, and other medications): All trough concentrations of fluoxetine, norfluoxetine and paroxetine were in lower half of reference range
Ueda, Hirokane, Morita, et al., 2006 #13750
Geographical location: Shinga, Japan Dates: NR Size of population: 55 Method of CYP testing or product used: PCR, long-PCR, RFLP Cytochromes (and specific mutations) tested for: CYP2D6 *2, *10, *5, *41 SSRI(s): Paroxetine 10-40 mg/d (same daily dose for at least 2 weeks)
Age: Mean (SD): 45 (14) Range: 20-71 yrs Weight: Mean (SD): 57 kg (12)Range: 36-117 kg Race/ethnicity (n [%]): Japanese (55 [100%]) Inclusion criteria: Inpatients and outpatients Exclusion criteria: Physical illness, use of “any drugs that have been reported to substantially interfere with CYP2D6 activity”
1) Genotypes/phenotypes in patient population: No functional allele: 12 (22%) One functional allele: 26 (47%) Two functional alleles: 17 (31%) 2) Drug concentrations (including effect of race/ethnicity, diet, and other medications): At 30 mg/d dose, significantly higher concentrations of paroxetine were observed in subjects with one functional allele (243.6 ± 25.2 ng/mL/mg/kg) (n = 26), compared with two functional alleles (150.9 ± 20.6 ng/mL/mg/kg) (n = 17) or no functional alleles (76.7 ± 6.1 ng/mL/mg/kg) (n = 12); p < 0.05 for both comparisons
Comments: None Quality assessment: 3b
Wang, Liu, Wang, et al., 2001 #1450
Geographical location: China Dates: NR Size of population: 12 unrelated healthy males Method of CYP testing or product used:
Age: Mean (SD): 20 (1) Range: 19-22 Weight: Mean (SD): 65 kg (7) Range: 54-80 kg Race/ethnicity: Chinese Han – 100%
1) Genotypes/phenotypes in patient population: Of 77 young, healthy Chinese Han subjects tested, 14.3% were PMs and 85.7% EMs. Of these, 6 PMs and 6 EMs were selected by stratified random sampling. 2) Drug concentrations (including effect of race/ethnicity, diet, and other medications): The 6 PMs showed a 41% increase in sertraline AUC (p <
Comments: - CYP2C19 PMs more common in Asians (13-23%) compared to Caucasians (2-5%) - Did not take into account the role of other CYPs in sertraline metabolism - Possibly same overall patient population (n = 77) as Yu et al., 2003 (#710), below (uncertain)

D-35
Evidence Table 2 (continued) Study Study Design
Patient Characteristics
Results Comments/Quality Scoring
RFLP-PCR Cytochromes (and specific mutations) tested for: 2C19 *1, *2, *3 SSRI(s): Sertraline 100 mg
Inclusion criteria: Healthy (by history, physical exam, and labs), male, non-smokers Exclusion criteria: Medication, ethanol 2 weeks before study
0.05), a 51% increase in sertraline terminal elimination half-life (p < 0.01), and significantly lower oral clearance (p < 0.05) compared to EMs. PMs also showed significantly lower AUC (p < 0.05) and Cmax (p < 0.01) of desmethylsertraline and markedly higher time to reach Cmax for desmethylsertraline (p < 0.01) compared to EMs
Quality assessment: 4
Yoon, Cha, Shon, et al., 2000 #1900
Geographical location: Korea Dates: NR Size of population: 224 screened 15 EM and 1 PM of metoprolol selected by stratified random sampling Method of CYP testing or product used: Restriction endonuclease testing (PCR based) for *10B allele, oligonucleotide microarray GeneChip system for 17 known alleles Cytochromes (and specific mutations) tested for: CYP2D6 *1, *2, *10B (Re-assayed for *1A, *2, *3, *4A-E, *5, *6A-B, *7-*9, *10A-B, *11) SSRI(s): Paroxetine 40
Age (screened population): Mean (SD): 22.4 (1.4) Weight: Mean (SD): 61.1 kg (10.3) Race/ethnicity: Korean – 100% Inclusion criteria: Healthy (PE and labs) Exclusion criteria: No drugs or alcohol 1 week before study entry or during the study
1) Genotypes/phenotypes in patient population: 15 EMs and 1 PMs. Comparison of 4 sub-groups of EMs, based on metoprolol metabolic ratio. No consistent correlation between metoprolol metabolic ratio value and genotype was found. The genotype of one PM subject could not be identified either by allele-specific PCR or by the GeneChip system. (*1/*1 and *1/*2 ) n = 6 (*1/*10B and *2/*10B) n = 6 (*10B/*10B) n = 3 2) Drug concentrations (including effect of race/ethnicity, diet, and other medications): Heterozygotes and homozygotes for *10B showed significantly lower volume of distribution (p < 0.01) and oral clearance (p < 0.01) of paroxetine compared to *1/*1. *10B/*10B showed significantly greater total AUC of paroxetine (p < 0.05) compared to *1/*1. No significant differences were found between heterozygotes and homozygotes for *10B in pharmacokinetic parameters.
Comments: - Race/ethnicity not generalizable - Sample selected from EMs (2D6 *10 is common in east Asians, Korea population studies show 28% homozygous, and 45% heterozygous for *10 allele)- No gene dose effect found in the study - 2 subjects with highest metoprolol metabolic ratio values were heterozygous, and two with less enzyme activity were homozygous - *10B alone is limited in its ability to differentiate paroxetine clearances between Korean EMs Quality assessment: 3b

D-36
Evidence Table 2 (continued) Study Study Design
Patient Characteristics
Results Comments/Quality Scoring
mg
Peak plasma concentration, half-life, and renal clearance did not differ significantly between the groups
Yu, Chen, He, et al., 2003 #710
Geographical location: China Dates: NR Size of population: 13 (8 EMs, 5 PMs) of 77 screened Method of CYP testing or product used: RFLP-PCR Cytochromes (and specific mutations) tested for: CYP2C19 *1, *2, *3 SSRI(s): Citalopram 40 mg
Age: Mean (SD): 21 (1) Range: 20-22 Weight: Mean (SD): 64 kg (8) Range: 56-81 kg Race/ethnicity: Chinese - 100% Inclusion criteria: Male, non-smokers, healthy Exclusion criteria: Meds/alcohol 2 weeks before and thru study
1) Genotypes/phenotypes in patient population: 77 healthy Chinese: EMs 85.7%, PMs 14.3%. From these 13 chosen by stratified random selection. 2) Drug concentrations (including effect of race/ethnicity, diet, and other medications): PMs had significantly higher citalopram AUC (p < 0.01), longer half-life (p < 0.01), and lower oral clearance (p-value NR). AUC and Cmax of desmethycitalopram was lower (p < 0.01 and p < 0.05, respectively) than in EMs. DCIT/CIT ratio of EMs was 3 times that of PMs (p < 0.01). Half-life, oral clearance of citalopram, and AUC, Cmax, and Tmax of desmethylcitalopram were significantly different in PMs compared to homozygous EMs and heterozygous EMs (p< 0.05). Dose effect: homozygotes > heterozygotes > PMs. In the same subjects, under similar conditions, administration of troleandomycin (TAO, to block CYP 3A4) showed that there was no difference in citalopram pharmacokinetics in EMs, with or without TAO. In PMs, TAO did have a significant effect on citalopram and desmethylcitalopram AUC (p < 0.05)
Comments: - Possibly same overall patient population (n = 77) as Wang et al., 2001 (#1450), above (uncertain) Quality assessment: 3b

D-37
Evidence Table 3. Question 3b: How well does CYP450 testing predict drug efficacy? Do factors such as race/ethnicity, diet, or other medications, affect this association? Study Study Design
Patient Characteristics
Results Comments/Quality Scoring
Gersten-berg, Aoshima, Fukasawa, et al., 2003 #790
Geographical location: Japan Dates: NR Size of population: 49 Method of CYP testing or product used: - Allele-specific PCR - Long PCR, 2-step PCR - Blinded to clinical ratings Cytochromes (and specific mutations) tested for: 2D6 *1, *3, *4, *5, *10 SSRI(s): Fluvoxamine (50 mg 1st week, 100 mg 2nd week, and 200 mg in remaining 4 weeks)
Age: Median: 45 Range: 24-69 Weight: Median: 55 kg Range: 40-84 kg Race/ethnicity (n [%]): Japanese Inclusion criteria: DSM-IV major depressive episode, no psychotic/atypical features; no other psychiatric disorders; MADRS ≥ 21; benzodiazepines permitted Exclusion criteria: Current antidepressant treatment, medical illness, medications in past 2 weeks
1) Genotypes/phenotypes in patient population: Number of patients with no mutated alleles (EMs): 12 Number of patients with 1 mutated allele (IMs): 27 Number of patients with 2 mutated alleles (PMs): 10 2) Efficacy (including effect of race/ethnicity, diet, and other medications): Stepwise multiple regression showed that final MADRS score, % improvement, and amelioration score were not significantly different across the 3 groups. Logistic regression showed that proportion of responders was not significantly different across the 3 groups
Comments: - Heterogeneous group of patients, including inpatients, outpatients, different subtypes of depression - Small numbers - The same group reported in another study that 2D6 genotypes do not affect steady-state concentration of fluvoxamine and its metabolite, probably because of saturation of the enzyme. - Effect of plasma concentration on response is not concordant with effect of genotype on response Quality assessment: 3b
Gras-mader, Verwohlt, Rietschel, et al., 2004 #450
Geographical location: Germany Dates: 2000-2003 Size of population: 136 total 70 (SSRIs) (68 blood concentrations?)
Age: Mean (SD): 49 (14) Weight: Mean (SD): 76.3 kg (17.5) Race/ethnicity: NR (refers to Caucasians in
1) Genotypes/phenotypes in patient population: Testing for CYP2C9 and 2C19 showed no significant differences with respect to allele frequencies and number of carriers of none, one, or two functional alleles (p = 0.445, p = 0.847. respectively) when compared with other Caucasian control groups. 2D6 PMs were underrepresented in the sample (p = 0.05) compared to 195 healthy volunteers (in literature).
Comments: - Accounted for co-meds that are substrates/inhibitors/inducers of 5 major CYP enzymes - HAMD and CGI used - Cut-off for therapeutic plasma concentration (weekly trough levels measured) - UKU side effect rating scale used

D-38
Evidence Table 3 (continued) Study Study Design
Patient Characteristics
Results Comments/Quality Scoring
Method of CYP testing or product used: - RFLP-PCR - Positive and negative control samples Cytochromes (and specific mutations) tested for: CYP2C9 *1 to *3, CYP2C19*1 and *2, 2D6 *1 to *9 and gene duplication SSRI(s): Fluvoxamine, paroxetine, sertraline, citalopram
conclusion) Inclusion criteria: ICD-10 diagnosis F3, CGI > 4, antidepressant therapy (including SSRIs) Exclusion criteria: Substance abuse/dependency, prior treatment with fluoxetine, acute suicidality, pregnancy, admission by legal commitment or for crisis intervention
2) Efficacy (including effect of race/ethnicity, diet, and other medications): According to HAMD-based response criterion, 42.9% were responders, by CGI criterion, 33% were responders. Plasma concentrations above or below lower limit of presumed therapeutic levels did not predict response (p = 0.082 for CGI, p = 0.982 for HAMD)
- SSRIs and other meds (including TCAs, venlafaxine, mirtazapine); most results reported for entire group, not just for SSRIs - Other treatments allowed (e.g., psychotherapy), some patients on multiple antidepressants. Numbers reported in analyses don’t add up. - Therapeutic levels not well-established for SSRIs. Quality assessment: 4
Kawanishi, Lundgren, Agren, et al., 2004 #11560
Geographical location: Sweden Dates: NR Size of population: 108 Method of CYP testing or product used: PCR-RFLP, long PCR, TaqMan Universal PCR + probes Cytochromes (and specific mutations) tested for: 2D6 gene duplication, and *2, *3, *4, *5 SSRI(s): Various SSRIs, plus other classes of
Age: Mean (SD): 45 (12.4) Weight: NR Race/ethnicity: Caucasians of Nordic origin – 100% Inclusion criteria: Current DSM-IV major depression, persistent symptoms during a recent episode which did not improve over 8 weeks, failed 4-week adequate dose trials of > 2 anti-depressants/mood stabilizers
1) Genotypes/phenotypes in patient population: Frequencies of genotype were as follows: EM 0.0889, PM 0.028, genotype with duplication 0.083. Frequency of PM genotype was 0.028 (95% CI 0 to 0.058), less than in the general population (0.068). Frequency of gene duplication in the subgroup of 81 subjects treated with CYP2D6 substrates was 9.9% (95% CI 3.4 to 16.4%). This is significantly greater than in the general Swedish/Danish population (1%/0.8%; 95% CI 0.2 to 1.4%). Incidence of gene duplication (0.083, 95% CI 0.031 to 0.135) was higher than that reported in healthy Swedish subjects (0.01). 2) Efficacy (including effect of race/ethnicity, diet, and other medications): “Worst week (in past year) HDRS scores” were much higher in
Comments: - Limitations: study of cases only, no control, no therapeutic monitoring, and small sample size. May be better to test in a population where gene duplication is more common. - Plasma lymphocyte samples Quality assessment: 3b
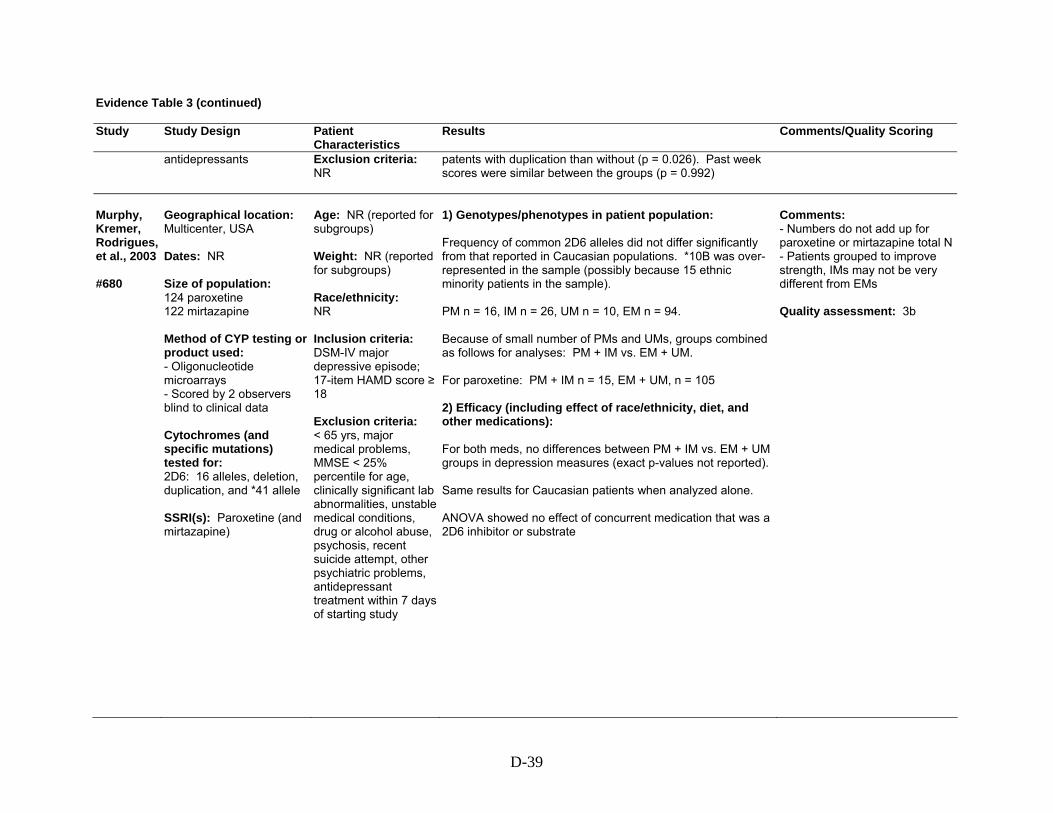
D-39
Evidence Table 3 (continued) Study Study Design
Patient Characteristics
Results Comments/Quality Scoring
antidepressants
Exclusion criteria: NR
patents with duplication than without (p = 0.026). Past week scores were similar between the groups (p = 0.992)
Murphy, Kremer, Rodrigues, et al., 2003 #680
Geographical location: Multicenter, USA Dates: NR Size of population: 124 paroxetine 122 mirtazapine Method of CYP testing or product used: - Oligonucleotide microarrays - Scored by 2 observers blind to clinical data Cytochromes (and specific mutations) tested for: 2D6: 16 alleles, deletion, duplication, and *41 allele SSRI(s): Paroxetine (and mirtazapine)
Age: NR (reported for subgroups) Weight: NR (reported for subgroups) Race/ethnicity: NR Inclusion criteria: DSM-IV major depressive episode; 17-item HAMD score ≥ 18 Exclusion criteria: < 65 yrs, major medical problems, MMSE < 25% percentile for age, clinically significant lab abnormalities, unstable medical conditions, drug or alcohol abuse, psychosis, recent suicide attempt, other psychiatric problems, antidepressant treatment within 7 days of starting study
1) Genotypes/phenotypes in patient population: Frequency of common 2D6 alleles did not differ significantly from that reported in Caucasian populations. *10B was over-represented in the sample (possibly because 15 ethnic minority patients in the sample). PM n = 16, IM n = 26, UM n = 10, EM n = 94. Because of small number of PMs and UMs, groups combined as follows for analyses: PM + IM vs. EM + UM. For paroxetine: PM + IM n = 15, EM + UM, n = 105 2) Efficacy (including effect of race/ethnicity, diet, and other medications): For both meds, no differences between PM + IM vs. EM + UM groups in depression measures (exact p-values not reported). Same results for Caucasian patients when analyzed alone. ANOVA showed no effect of concurrent medication that was a 2D6 inhibitor or substrate
Comments: - Numbers do not add up for paroxetine or mirtazapine total N- Patients grouped to improve strength, IMs may not be very different from EMs Quality assessment: 3b

D-40
Evidence Table 3 (continued) Study Study Design
Patient Characteristics
Results Comments/Quality Scoring
Rau, Wohl-leben, Wuttke, et al., 2004 #11550
Geographical location: Germany Dates: 2000-2002 Size of population: 28 with adverse effects associated with antidepressants; 16 non-responders to antidepressants Method of CYP testing or product used: - PCR-RFLP - Long-range allele-specific PCR used for *5 allele Cytochromes (and specific mutations) tested for: 2D6 *3, *4, *6, *2, *8, *10, *14, *41, *5 SSRI(s): Various
Age: Mean (SD): Adverse effects group: 50 (12) Non-responders: 45 (11) Weight: Mean (SD): Adverse effects group: 75 kg (17) Non-responders: 75 kg (13) Race/ethnicity: NR (alludes to White) Inclusion criteria: Marked adverse effects, or non-responders to 2D6-metabolized antidepressants (non-response requires sufficient dose for at least 4 weeks) Exclusion criteria: NR
1) Genotypes/phenotypes in patient population: Adverse effects group: 29% PM, 7% IM, 64% EM, 0% UM Non-responders: 6% PM, 0% IM, 75% EM, 19% UM 2) Efficacy (including effect of race/ethnicity, diet, and other medications): Non-responders: Various diagnoses (depression, dysthymia, adjustment disorder, etc.). Of the 16, 11 were treated with non-selective RIs, 5 with SSRIs. Of the 16, 4 (25%) had 2D6 gene duplication, i.e., 4/32 (12.5%) amplified functional alleles compared to 1.8% in German population (7-fold higher; p-value NR). Of these, 3 were UM (18%), compared to 2.5 to 3% in the German population (5-fold increase; p = 0.0013)
Comments: - Limitations: Race not specified, retrospective, mainly TCAs, low numbers, no comment on co-medications Quality assessment: 3b

D-41
Evidence Table 4. Question 3c: How well does CYP450 testing predict adverse drug reactions? Do factors such as race/ethnicity, diet, or other medications, affect this association? Study Study Design
Patient Characteristics
Results Comments/Quality Scoring
Allgu-lander and Nilsson, 2001 #1490
Geographical location: Sweden Dates: 1997-2000 Size of population: 42 Method of CYP testing or product used: Allele-specific PCR Cytochromes (and specific mutations) tested for: 2D6 *3 *4 *5 SSRI(s): Paroxetine 20-50 mg
Age: Mean (SD): 40 (10) Weight: NR Race/ethnicity: NR Inclusion criteria: DSM-IV social anxiety disorder Exclusion criteria: Subjects with prior psychiatric treatment
1) Genotypes/phenotypes in patient population: 3 of 42 were PMs by this definition (*3, *4, *5). 2) Adverse drug reactions (including effect of race/ethnicity, diet, and other medications): Only outcome reported as comparison between PM and EM groups was rate of termination due to adverse events: 1/3 PMs and 2/39 EMs dropped out due to adverse events (p-value NR)
Comments: - The main objective of the study was to determine prognosis in newly diagnosed social anxiety disorder. - CYP2D6 genotype was analyzed in subjects randomized to paroxetine with the purpose of relating adverse effects to PM genotype. - Limitations: Very small n, no comment on co-meds, diet, role of other CYP enzymes Quality assessment: 3b
Chen, Chou, Blouin, et al., 1996 #5970
Geographical location: Kentucky Dates: NR Size of population: 74 Method of CYP testing or product used: Multiple methods of DNA extraction, PCR Cytochromes (and specific mutations) tested for: 2D6 – A, B, D, E, and T alleles
Age: NR Weight: NR Race/ethnicity: NR Inclusion criteria: Depressed outpatients (n = 56) and a smaller group of depressed patients who had adverse effects associated with 2D6-metabolized antidepressants (n = 18)
1) Genotypes/phenotypes in patient population: The frequency of A, B, D, E, and T alleles in a random group (n = 56) of depressed outpatients (21%) was similar to that in the general population (20%, p > 0.50). 2) Adverse drug reactions (including effect of race/ethnicity, diet, and other medications): The frequency of alleles associated with deficient 2D6 gene expression (A, B, D, E, T) was significantly higher in depressed patients (44%) reporting adverse effects with antidepressants “known or suspected to be a substrate of” 2D6 (n = 18), compared to the random group (n = 56) of depressed patients (21%), p < 0.05
Comments: - Non-randomized, retrospective - Article mainly deals with optimizing the time and cost associated with genotyping and phenotyping Quality assessment: 4

D-42
Evidence Table 4 (continued) Study Study Design
Patient Characteristics
Results Comments/Quality Scoring
SSRI(s): Various, including paroxetine, fluoxetine, sertraline, fluvoxamine (and TCAs)
Exclusion criteria: NR
Gersten-berg, Aoshima, Fukasawa, et al., 2003 #790
Geographical location: Japan Dates: NR Size of population: 49 Method of CYP testing or product used: - Allele-specific PCR - Long PCR, 2-step PCR - Blinded to clinical ratings Cytochromes (and specific mutations) tested for: 2D6 *1, *3, *4, *5, *10 SSRI(s): Fluvoxamine (50 mg 1st week, 100 mg 2nd week, and 200 mg in remaining 4 weeks)
Age: Median: 45 Range: 24-69 Weight: Median: 55 kg Range: 40-84 kg Race/ethnicity: Japanese Inclusion criteria: DSM-IV major depressive episode, no psychotic/atypical features; no other psychiatric disorders; MADRS ≥ 21; benzodiazepines permitted Exclusion criteria: Current antidepressant treatment, medical illness, medications in past 2 weeks
1) Genotypes/phenotypes in patient population: Number of patients with no mutated alleles (EMs): 12 Number of patients with 1 mutated allele (IMs): 27 Number of patients with 2 mutated alleles (PMs): 10 2) Adverse drug reactions (including effect of race/ethnicity, diet, and other medications): Incidence of adverse effects (nausea) was not significantly different across the 3 groups
Comments: - Heterogeneous group of patients, including inpatients, outpatients, different subtypes of depression - Small numbers - The same group reported in another study that 2D6 genotypes do not affect steady-state concentration of fluvoxamine and its metabolite, probably because of saturation of the enzyme. - Effect of plasma concentration on response is not concordant with effect of genotype on response Quality assessment: 3b

D-43
Evidence Table 4 (continued) Study Study Design
Patient Characteristics
Results Comments/Quality Scoring
Gras-mader, Verwohlt, Rietschel, et al., 2004 #450
Geographical location: Germany Dates: 2000-2003 Size of population: 136 total 70 (SSRIs) (68 blood concentrations?) Method of CYP testing or product used: - RFLP-PCR - Positive and negative control samples Cytochromes (and specific mutations) tested for: CYP2C9 *1 to *3, CYP2C19*1 and *2, 2D6 *1 to *9 and gene duplication SSRI(s): Fluvoxamine, paroxetine, sertraline, citalopram
Age: Mean (SD): 49 (14) Weight: Mean (SD): 76.3 kg (17.5) Race/ethnicity: NR (refers to Caucasians in conclusion) Inclusion criteria: ICD-10 diagnosis F3, CGI > 4, antidepressant therapy (including SSRIs) Exclusion criteria: Substance abuse/dependency, prior treatment with fluoxetine, acute suicidality, pregnancy, admission by legal commitment or for crisis intervention
1) Genotypes/phenotypes in patient population: Testing for CYP2C9 and 2C19 showed no significant differences with respect to allele frequencies and number of carriers of none, one, or two functional alleles (p = 0.445, p = 0.847. respectively) when compared with other Caucasian control groups. 2D6 PMs were underrepresented in the sample (p = 0.05) compared to 195 healthy volunteers (in literature). 2) Adverse drug reactions (including effect of race/ethnicity, diet, and other medications): 5/6 (83%) CYP2D6 PMs developed side effects at their first visit compared to 52/136 (38%) of the whole sample. 2/4 (50%) CYP2C9 PMs developed side effects at their first visit. 2/5 (40%) CYP2C19 PMs developed side effects at their first visit
Comments: - Accounted for co-meds that are substrates/inhibitors/inducers of 5 major CYP enzymes - HAMD and CGI used - Cut-off for therapeutic plasma concentration (weekly trough levels measured) - UKU side effect rating scale used - SSRIs and other meds (including TCAs, venlafaxine, mirtazapine); most results reported for entire group, not just for SSRIs - Other treatments allowed (e.g., psychotherapy), some patients on multiple antidepressants. Numbers reported in analyses don’t add up. - Therapeutic levels not well-established for SSRIs. Quality assessment: 4
Murphy, Kremer, Rodrigues, et al., 2003 #680
Geographical location: Multicenter, USA Dates: NR Size of population: 124 paroxetine 122 mirtazapine Method of CYP testing or product used:
Age: NR (reported for subgroups) Weight: NR (reported for subgroups) Race/ethnicity: NR Inclusion criteria: DSM-IV major
1) Genotypes/phenotypes in patient population: Frequency of common 2D6 alleles did not differ significantly from that reported in Caucasian populations. *10B was over-represented in the sample (possibly because 15 ethnic minority patients in the sample). PM n = 16, IM n = 26, UM n = 10, EM n = 94. Because of small number of PMs and UMs, groups combined as follows for analyses: PM + IM vs. EM + UM.
Comments: - Numbers do not add up for paroxetine or mirtazapine total N- Patients grouped to improve strength, IMs may not be very different from EMs Quality assessment: 3b

D-44
Evidence Table 4 (continued) Study Study Design
Patient Characteristics
Results Comments/Quality Scoring
- Oligonucleotide microarrays - Scored by 2 observers blind to clinical data Cytochromes (and specific mutations) tested for: 2D6: 16 alleles, deletion, duplication, and *41 allele SSRI(s): Paroxetine (and mirtazapine)
depressive episode; 17-item HAMD score ≥ 18 Exclusion criteria: < 65 yrs, major medical problems, MMSE < 25% percentile for age, clinically significant lab abnormalities, unstable medical conditions, drug or alcohol abuse, psychosis, recent suicide attempt, other psychiatric problems, antidepressant treatment within 7 days of starting study
For paroxetine: PM + IM n = 15, EM + UM, n = 105 2) Adverse drug reactions (including effect of race/ethnicity, diet, and other medications): For both meds, no differences between PM + IM vs. EM + UM groups in severity of adverse events or frequency of discontinuation (exact p-values not reported). Same results for Caucasian patients when analyzed alone. ANOVA showed no effect of concurrent medication that was a 2D6 inhibitor or substrate
Rau, Wohl-leben, Wuttke, et al., 2004 #11550
Geographical location: Germany Dates: 2000-2002 Size of population: 28 with adverse effects associated with antidepressants; 16 non-responders to antidepressants Method of CYP testing or product used: - PCR-RFLP - Long-range allele-specific PCR used for *5 allele Cytochromes (and specific mutations)
Age: Mean (SD): Adverse effects group: 50 (12) Non-responders: 45 (11) Weight: Mean (SD): Adverse effects group: 75 kg (17) Non-responders: 75 kg (13) Race/ethnicity: NR (alludes to White) Inclusion criteria: Marked adverse effects, or non-
1) Genotypes/phenotypes in patient population: Adverse effects group: 29% PM, 7% IM, 64% EM, 0% UM Non-responders: 6% PM, 0% IM, 75% EM, 19% UM 2) Adverse drug reactions (including effect of race/ethnicity, diet, and other medications): Adverse effects group: Various diagnoses (depression, dysthymia, adjustment disorder, etc.). Of the 28, 19 were treated with non-selective RIs, 9 with SSRIs. Of the 28, 8 (29%) were PMs compared to 7% in the German population (4-fold higher; p < 0.0001). There were no differences between PMs, IMs, and EMs on
Comments: - Limitations: Race not specified, retrospective, mainly TCAs, low numbers, no comment on co-medications Quality assessment: 3b
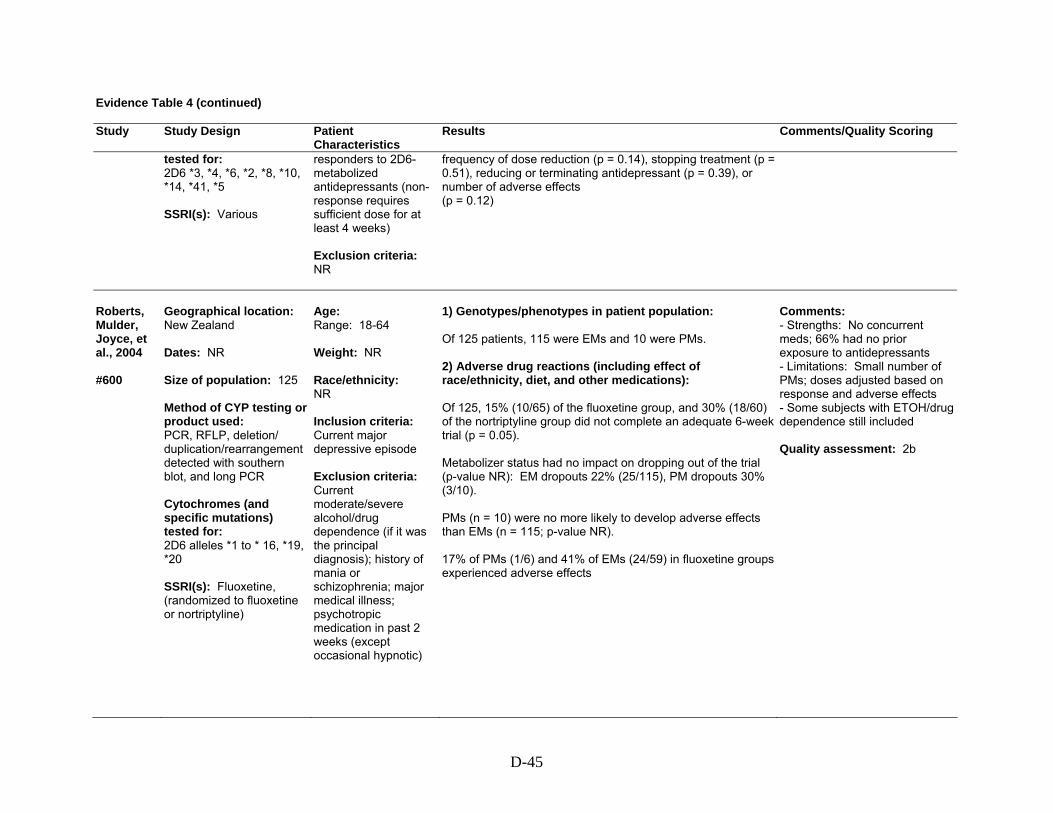
D-45
Evidence Table 4 (continued) Study Study Design
Patient Characteristics
Results Comments/Quality Scoring
tested for: 2D6 *3, *4, *6, *2, *8, *10, *14, *41, *5 SSRI(s): Various
responders to 2D6-metabolized antidepressants (non-response requires sufficient dose for at least 4 weeks) Exclusion criteria: NR
frequency of dose reduction (p = 0.14), stopping treatment (p = 0.51), reducing or terminating antidepressant (p = 0.39), or number of adverse effects (p = 0.12)
Roberts, Mulder, Joyce, et al., 2004 #600
Geographical location: New Zealand Dates: NR Size of population: 125 Method of CYP testing or product used: PCR, RFLP, deletion/ duplication/rearrangement detected with southern blot, and long PCR Cytochromes (and specific mutations) tested for: 2D6 alleles *1 to * 16, *19, *20 SSRI(s): Fluoxetine, (randomized to fluoxetine or nortriptyline)
Age: Range: 18-64 Weight: NR Race/ethnicity: NR Inclusion criteria: Current major depressive episode Exclusion criteria: Current moderate/severe alcohol/drug dependence (if it was the principal diagnosis); history of mania or schizophrenia; major medical illness; psychotropic medication in past 2 weeks (except occasional hypnotic)
1) Genotypes/phenotypes in patient population: Of 125 patients, 115 were EMs and 10 were PMs. 2) Adverse drug reactions (including effect of race/ethnicity, diet, and other medications): Of 125, 15% (10/65) of the fluoxetine group, and 30% (18/60) of the nortriptyline group did not complete an adequate 6-week trial (p = 0.05). Metabolizer status had no impact on dropping out of the trial (p-value NR): EM dropouts 22% (25/115), PM dropouts 30% (3/10). PMs (n = 10) were no more likely to develop adverse effects than EMs (n = 115; p-value NR). 17% of PMs (1/6) and 41% of EMs (24/59) in fluoxetine groups experienced adverse effects
Comments: - Strengths: No concurrent meds; 66% had no prior exposure to antidepressants - Limitations: Small number of PMs; doses adjusted based on response and adverse effects - Some subjects with ETOH/drug dependence still included Quality assessment: 2b

D-46
Evidence Table 4 (continued) Study Study Design
Patient Characteristics
Results Comments/Quality Scoring
Suzuki, Sawamura, and Someya, 2006 #13770
Geographical location: Nigatta, Japan Dates: NR Size of population: 100 Method of CYP testing or product used: PCR, long PCR Cytochromes (and specific mutations) tested for: CYP2D6 *5, *10 SSRI(s): Fluvoxamine 25-200 mg
Age: Mean (SD): 40 (15.7) Weight: NR Race/ethnicity (n [%]): Japanese 100% Inclusion criteria: Mood disorder (depressive disorder not otherwise specified, major depression, bipolar disorder, depressed, adjustment disorder, depressed) Exclusion criteria: Obvious physical illness, psychotropic medication in 14 days before study entry, additional Axis I or II diagnoses
1) Genotypes/ phenotypes in patient population: EM: 75 (77%) PM: 22 (23%) 2) Adverse drug reactions (including effect of race/ethnicity, diet, and other medications): Greater prevalence of GI side effects in PMs compared to EMs (p = 0.043, CI 1.019 to 3.254). No significant difference in cumulative number of GI side effects or all side effects between the groups. Discontinuation rates similar between PMs and EMs (p = 0.310). Combination of 5HT2A receptor polymorphism and CYP 4502D6 polymorphism in predicting GI side effects:
Polymor-phisms
Hazard ratio 95% CI P-value
PM, AA 0.859 0.179 to 4.122 0.849 EM, AG 1.681 0.717 to 3.939 0.234 PM, AG 4.147 1.558 to 11.038 0.004 EM, GG 2.491 0.997 to 6.223 0.051 PM, GG 4.242 1.444 to 12.459 0.009
PM +GG and PM +AG had a significantly greater risk of developing GI side effects compared to EM + AA
Comments: - Data missing for 3 subjects - Study further showed that 5HT2A receptor gene polymorphism and CYP2D6 polymorphism had a synergistic effect for predicting fluvoxamine-induced GI side effects. Quality assessment: 3b
Wang, Liu, Wang, et al., 2001 #1450
Geographical location: China Dates: NR Size of population: 12 unrelated healthy males
Age: Mean (SD): 20 (1) Range: 19-22 Weight: Mean (SD): 65 kg (7) Range: 54-80 kg
1) Genotypes/phenotypes in patient population: Of 77 young, healthy Chinese Han subjects tested, 14.3% were PMs and 85.7% EMs. Of these, 6 PMs and 6 EMs were selected by stratified random sampling. 2) Adverse drug reactions (including effect of race/ethnicity, diet, and other medications):
Comments: - CYP2C19 PMs more common in Asians (13-23%) compared to Caucasians (2-5%) - Did not take into account the role of other CYPs in sertraline metabolism

D-47
Evidence Table 4 (continued) Study Study Design
Patient Characteristics
Results Comments/Quality Scoring
Method of CYP testing or product used: RFLP-PCR Cytochromes (and specific mutations) tested for: 2C19 *1, *2, *3 SSRI(s): Sertraline 100 mg
Race/ethnicity: Chinese Han – 100% Inclusion criteria: Healthy (by history, physical exam, and labs), male, non-smokers Exclusion criteria: Medication, ethanol 2 weeks before study
2 of 6 homozygous PMs had severe GI side effects (nausea, vomiting, diarrhea) and CNS dry mouth and dizziness 2 hours after a single 100-mg sertraline dose
Quality assessment: 4

D-48
References Cited in the Evidence Tables
Allgulander C, Nilsson B. A prospective study of 86 new patients with social anxiety disorder. Acta Psychiatr Scand 2001;103(6):447-52.
Berle JO, Steen VM, Aamo TO, et al. Breastfeeding during maternal antidepressant treatment with serotonin reuptake inhibitors: infant exposure, clinical symptoms, and cytochrome p450 genotypes. J Clin Psychiatry 2004;65(9):1228-34.
Charlier C, Broly F, Lhermitte M, et al. Polymorphisms in the CYP 2D6 gene: association with plasma concentrations of fluoxetine and paroxetine. Ther Drug Monit 2003;25(6):738-42.
Chen S, Chou WH, Blouin RA, et al. The cytochrome P450 2D6 (CYP2D6) enzyme polymorphism: screening costs and influence on clinical outcomes in psychiatry. Clin Pharmacol Ther 1996;60(5):522-34.
Chou WH, Yan FX, Robbins-Weilert DK, et al. Comparison of two CYP2D6 genotyping methods and assessment of genotype-phenotype relationships. Clin Chem 2003;49(4):542-51.
Eap CB, Bondolfi G, Zullino D, et al. Concentrations of the enantiomers of fluoxetine and norfluoxetine after multiple doses of fluoxetine in cytochrome P4502D6 poor and extensive metabolizers. J Clin Psychopharmacol 2001;21(3):330-4.
Eriksson S, Berg LM, Wadelius M, et al. Cytochrome p450 genotyping by multiplexed real-time DNA sequencing with pyrosequencing technology. Assay Drug Dev Technol 2002;1(1 Pt 1):49-59.
Gerstenberg G, Aoshima T, Fukasawa T, et al. Relationship between clinical effects of fluvoxamine and the steady-state plasma concentrations of fluvoxamine and its major metabolite fluvoxamino acid in Japanese depressed patients. Psychopharmacology (Berl) 2003;167(4):443-8.
Grasmader K, Verwohlt PL, Rietschel M, et al. Impact of polymorphisms of cytochrome-P450 isoenzymes 2C9, 2C19 and 2D6 on plasma concentrations and clinical effects of antidepressants in a naturalistic clinical setting. Eur J Clin Pharmacol 2004;60(5):329-36.
Hersberger M, Marti-Jaun J, Rentsch K, et al. Rapid detection of the CYP2D6*3, CYP2D6*4, and CYP2D6*6 alleles by tetra-primer PCR and of the CYP2D6*5 allele by multiplex long PCR. Clin Chem 2000;46(8 Pt 1):1072-7.
Kawanishi C, Lundgren S, Agren H, et al. Increased incidence of CYP2D6 gene duplication in patients with persistent mood disorders: ultrarapid metabolism of antidepressants as a cause of nonresponse. A pilot study. Eur J Clin Pharmacol 2004;59(11):803-7.
Liu ZQ, Cheng ZN, Huang SL, et al. Effect of the CYP2C19 oxidation polymorphism on fluoxetine metabolism in Chinese healthy subjects. Br J Clin Pharmacol 2001;52(1):96-9.
LLerena A, Dorado P, Berecz R, et al. Effect of CYP2D6 and CYP2C9 genotypes on fluoxetine and norfluoxetine plasma concentrations during steady-state conditions. Eur J Clin Pharmacol 2004;59(12):869-73.
Mizugaki M, Hiratsuka M, Agatsuma Y, et al. Rapid detection of CYP2C18 genotypes by real-time fluorescence polymerase chain reaction. J Pharm Pharmacol 2000;52(2):199-205.
Muller B, Zopf K, Bachofer J, et al. Optimized strategy for rapid cytochrome P450 2D6 genotyping by real-time long PCR. Clin Chem 2003;49(10):1624-31.
Murphy GM Jr, Kremer C, Rodrigues HE, et al. Pharmacogenetics of antidepressant medication intolerance. Am J Psychiatry 2003;160(10):1830-5.
Muthiah YD, Lee WL, Teh LK, et al. A simple multiplex PCR method for the concurrent detection of three CYP2C8 variants. Clin Chim Acta 2004;349(1-2):191-8.
Neville M, Selzer R, Aizenstein B, et al. Characterization of cytochrome P450 2D6 alleles using the Invader system. Biotechniques 2002;Suppl:34-8, 40-3.
Ohara K, Tanabu S, Ishibashi K, et al. CYP2D6*10 alleles do not determine plasma fluvoxamine concentration/dose ratio in Japanese subjects. Eur J Clin Pharmacol 2003;58(10):659-61.
Ozdemir V, Tyndale RF, Reed K, et al. Paroxetine steady-state plasma concentration in relation to CYP2D6 genotype in extensive metabolizers. J Clin Psychopharmacol 1999;19(5):472-5.
Rau T, Wohlleben G, Wuttke H, et al. CYP2D6 genotype: impact on adverse effects and nonresponse during treatment with antidepressants-a pilot study. Clin Pharmacol Ther 2004;75(5):386-93.
Roberts RL, Mulder RT, Joyce PR, et al. No evidence of increased adverse drug reactions in cytochrome P450 CYP2D6 poor metabolizers treated with fluoxetine or nortriptyline. Hum Psychopharmacol 2004;19(1):17-23.

D-49
Roche Molecular Systems, Inc. U.S. Food and Drug Administration 510(k) Substantial Equivalence Determination Decision Summary for Roche AmpliChip CYP450 microarray for identifying CYP2D6 genotype (510(k) Number k042259). December 2004. Available at: www.fda.gov/cdrh/reviews/k042259.pdf. Accessed 19 April 2006.
Roche Molecular Systems, Inc. U.S. Food and Drug Administration 510(k) Substantial Equivalence Determination Decision Summary for Roche AmpliChip CYP450 microarray for identifying CYP2C19 genotype (510(k) Number k043576). January 2005. Available at: www.fda.gov/cdrh/reviews/k043576.pdf. Accessed 19 April 2006.
Sawamura K, Suzuki Y, Someya T. Effects of dosage and CYP2D6-mutated allele on plasma concentration of paroxetine. Eur J Clin Pharmacol 2004;60(8):553-7.
Schaeffeler E, Schwab M, Eichelbaum M, et al. CYP2D6 genotyping strategy based on gene copy number determination by TaqMan real-time PCR. Hum Mutat 2003;22(6):476-85.
Scordo MG, Spina E, Dahl ML, et al. Influence of CYP2C9, 2C19 and 2D6 genetic polymorphisms on the steady-state plasma concentrations of the enantiomers of fluoxetine and norfluoxetine. Basic Clin Pharmacol Toxicol 2005;97(5):296-301.
Soderback E, Zackrisson AL, Lindblom B, et al. Determination of CYP2D6 gene copy number by pyrosequencing. Clin Chem 2005;51(3):522-31.
Stamer UM, Bayerer B, Wolf S, et al. Rapid and reliable method for cytochrome P450 2D6 genotyping. Clin Chem 2002;48(9):1412-7.
Stedman CA, Begg EJ, Kennedy MA, et al. Cytochrome P450 2D6 genotype does not predict SSRI (fluoxetine or paroxetine) induced hyponatraemia. Hum Psychopharmacol 2002;17(4):187-90.
Suzuki Y, Sawamura K, Someya T. Polymorphisms in the 5-hydroxytryptamine 2A receptor and cytochromeP4502d6 genes synergistically predict fluvoxamine-induced side effects in Japanese depressed patients. Neuropsychopharmacology 2006;31(4):825-31.
Ueda M, Hirokane G, Morita S, et al. The impact of CYP2D6 genotypes on the plasma concentration of paroxetine in Japanese psychiatric patients. Prog Neuropsychopharmacol Biol Psychiatry 2006;30(3):486-91.
Wang JH, Liu ZQ, Wang W, et al. Pharmacokinetics of sertraline in relation to genetic polymorphism of CYP2C19. Clin Pharmacol Ther 2001;70(1):42-7.
Weise A, Grundler S, Zaumsegel D, et al. Development and evaluation of a rapid and reliable method for cytochrome P450 2C8 genotyping. Clin Lab 2004;50(3-4):141-8.
Wu X, Zhou Y, Xu S. Detection of CYP I A1 polymorphisms with a colorimetric method based on mismatch hybridization. Clin Chim Acta 2002;323(1-2):103-9.
Yoon YR, Cha IJ, Shon JH, et al. Relationship of paroxetine disposition to metoprolol metabolic ratio and CYP2D6*10 genotype of Korean subjects. Clin Pharmacol Ther 2000;67(5):567-76.
Yu BN, Chen GL, He N, et al. Pharmacokinetics of citalopram in relation to genetic polymorphism of CYP2C19. Drug Metab Dispos 2003;31(10):1255-9.

E-1
Appendix E. Quality Assessment Tools
ACCE Model for Evaluation of Genetic Testing1 (used for Question 2)
ACCE: A CDC-Sponsored Project Carried Out by the Foundation of Blood Research
Introduction to ACCE ACCE, which takes its name from the four components of
evaluation—analytic validity, clinical validity, clinical utility
and associated ethical, legal and social implications—is a
model process for evaluating data on emerging genetic tests.
The process includes collecting, evaluating, interpreting, and
reporting data about DNA (and related) testing for disorders
with a genetic component in a format that allows policy
makers to have access to up-to-date and reliable information
for decision making.
An important by-product of this process is the identification
of gaps in knowledge. The ACCE approach builds on a
methodology originally described by Wald and Cuckle (1) and
on terminology introduced by the Secretary's Advisory
Committee on Genetic Testing (2).
Additional information and ACCE reports are available
here.
Components of ACCE
The ACCE wheel (Figure 2) shows the relation among each of the four components of evaluation and the elements of
1 Available at: www.cdc.gov/genomics/gtesting/ACCE.htm. Accessed September 11, 2006.

E-2
each component. At the hub are the clinical disorder being evaluated and the setting in which testing is done (e.g.,
classic cystic fibrosis in the setting of prenatal screening). The evaluation process begins only after the clinical
disorder and setting have been clearly established. Specific questions 1 through 7 in Table 1 help to define the
disorder, the setting, and the type of testing.
Figure 1. The ACCE evaluation process for genetic testing
The analytic validity of a genetic test defines its ability to accurately and reliably measure the genotype of
interest. This aspect of evaluation focuses on the laboratory component. The four specific elements of analytic validity
include analytic sensitivity (or the analytic detection rate), analytic specificity, laboratory quality control, and assay
robustness. Analytic sensitivity defines how effectively the test identifies specific mutations that are present in a
sample. Analytic specificity defines how effectively the test correctly classifies samples that do not have specific

E-3
mutations (although the term “mutation” is used here, the terms “polymorphism” or “variant” may be more
appropriate for certain situations). Quality control assesses the procedures for ensuring that results fall within
specified limits. Robustness measures how resistant the assay is to changes in pre-analytic and analytic variables.
Specific questions 8 through 17 in Table 1 help organize the information available to document analytic validity.
The clinical validity of a genetic test defines its ability to detect or predict the associated disorder (phenotype). The
four elements of analytic validity are all relevant to assessing clinical validity, along with six additional
elements: clinical sensitivity (or the clinical detection rate), clinical specificity, prevalence of the specific disorder,
positive and negative predictive values, penetrance, and modifiers (gene or environmental). Penetrance defines the
relation between genotype and phenotype and allows the frequency of the clinical expression of a genotype
(expressivity) to be determined. Clinical sensitivity measures the proportion of individuals who have a well-defined
clinical disorder (or who will get the disorder in the future) and whose test values are positive. Clinical specificity
measures the proportion of individuals who do not have the well-defined clinical disorder and whose test results are
negative. Prevalence measures the proportion of individuals in the selected setting who have, or who will develop, the
phenotype. The positive and negative predictive values more meaningfully define the genetic test performance by
taking into account clinical sensitivity, clinical specificity and prevalence. Specific questions 18 through 25 in Table 1
help organize the information available to document clinical validity.
The clinical utility of a genetic test defines the elements that need to be considered when evaluating the risks and
benefits associated with its introduction into routine practice. The natural history of the specific disorder needs to be
understood so that such considerations as optimal age for testing might be taken into account. Another factor to be
considered is the availability and effectiveness of interventions aimed at avoiding adverse clinical consequences (if no
interventions are available, for example, testing may not be warranted). Quality assurance assesses procedures in
place for controlling pre-analytic, analytic, and post-analytic factors that could influence the risks and benefits of
testing. Pilot trials assess the performance of testing under real-world conditions. Health risks define adverse
consequences of testing or interventions in individuals with either positive or negative test results. Economic
evaluation helps define financial costs and benefits of testing. Facilities assess the capacity of existing resources to
manage all aspects of the service. Education assesses the quality and availability of informational materials and
expertise for all aspects of a screening service. Monitoring and evaluation assess a program's ability to maintain
surveillance over its activities and make adjustments. Specific questions 26 through 41 in Table 1 help organize the
information available to document clinical utility.
Ethical, legal, and social implications surrounding a genetic test are represented in Figure 2 by a penetrating pie

E-4
slice, implying that the safeguards and impediments should be considered in the context of the other
components. Specific questions 42 through 44 in Table 1 help organize the information available to document ELSI
issues.
Table 1. The ACCE Model's List of Targeted Questions Aimed at a Comprehensive Review of Genetic Testing (3)
Element Component Specific Question
Disorder/Setting
1.
2.
3.
4.
5.
6.
7.
What is the specific clinical disorder to be studied?
What are the clinical findings defining this disorder?
What is the clinical setting in which the test is to be performed?
What DNA test(s) are associated with this disorder?
Are preliminary screening questions employed?
Is it a stand-alone test or is it one of a series of tests?
If it is part of a series of screening tests, are all tests performed in all
instances (parallel) or are only some tests performed on the basis of
other results (series)?
Analytic Validity
Sensitivity
Specificity
8.
9.
10
11.
12.
13.
14.
15.
16.
17.
Is the test qualitative or quantitative?
How often is the test positive when a mutation is present?
How often is the test negative when a mutation is not present?
Is an internal QC program defined and externally monitored?
Have repeated measurements been made on specimens?
What is the within- and between-laboratory precision?
If appropriate, how is confirmatory testing performed to resolve false positive
results in a timely manner?
What range of patient specimens have been tested?
How often does the test fail to give a useable result?
How similar are results obtained in multiple laboratories using the same, or
different technology?

E-5
Clinical Validity
Sensitivity
Specificity
18.
19.
20.
How often is the test positive when the disorder is present?
How often is the test negative when a disorder is not present?
Are there methods to resolve clinical false positive results in a timely manner?
Prevalence 21.
22.
23.
24.
25.
What is the prevalence of the disorder in this setting?
Has the test been adequately validated on all populations to which it may be
offered?
What are the positive and negative predictive values?
What are the genotype/phenotype relationships?
What are the genetic, environmental or other modifiers?
Clinical Utility
Intervention
Intervention
Intervention
Intervention
Intervention
26.
27.
28.
29.
30.
31.
What is the natural history of the disorder?
What is the impact of a positive (or negative) test on patient care?
If applicable, are diagnostic tests available?
Is there an effective remedy, acceptable action, or other measurable benefit?
Is there general access to that remedy or action?
Is the test being offered to a socially vulnerable population?
Quality
Assurance
32. What quality assurance measures are in place?
Pilot Trials
Health Risks
Economic
33.
34.
35.
36.
What are the results of pilot trials?
What health risks can be identified for follow-up testing and/or intervention?
What are the financial costs associated with testing?
What are the economic benefits associated with actions resulting from testing?
Facilities
Education
37.
38.
39.
What facilities/personnel are available or easily put in place?
What educational materials have been developed and validated and which
of these are available?
Are there informed consent requirements?
Monitoring 40.
41.
What methods exist for long term monitoring?
What guidelines have been developed for evaluating program performance?
ELSI
Impediments
42.
What is known about stigmatization, discrimination, privacy/confidentiality and
personal/family social issues?
E-6
Safeguards
43.
44.
Are there legal issues regarding consent, ownership of data and/or
samples, patents, licensing, proprietary testing, obligation to disclose, or
reporting requirements?
What safeguards have been described and are these safeguards in place
and effective?
References
1. Wald N, Cuckle H. Reporting the assessment of screening and diagnostic tests. Br J Obstet Gynaecol 1989
Apr;96(4):389-96.
2. Department of Health and Human Services, Secretary’s Advisory Committee on Genetic Testing. Request for
public comment on a proposed classification methodology for determining level of review for genetic tests.
Federal Register 2000;65(236):76643-76645.
3. Haddow JE, Palomaki GE. ACCE: A Model Process for Evaluating Data on Emerging Genetic Tests. In: Human
Genome Epidemiology: A Scientific Foundation for Using Genetic Information to Improve Health and Prevent
Disease. Khoury M, Little J, Burke W (eds.), Oxford University Press, pp. 217-233, 2003.

E-7
Oxford Centre for Evidence-based Medicine Levels of Evidence2 (used for all remaining questions)
Level Therapy/Prevention,
Aetiology/Harm Prognosis Diagnosis Differential diagnosis/symptom
prevalence study Economic and decision analyses
1a SR (with homogeneity*) of RCTs
SR (with homogeneity*) of inception cohort studies; CDR† validated in different populations
SR (with homogeneity*) of Level 1 diagnostic studies; CDR† with 1b studies from different clinical centres
SR (with homogeneity*) of prospective cohort studies
SR (with homogeneity*) of Level 1 economic studies
1b Individual RCT (with narrow Confidence Interval‡)
Individual inception cohort study with > 80% follow-up; CDR† validated in a single population
Validating** cohort study with good††† reference standards; or CDR† tested within one clinical centre
Prospective cohort study with good follow-up****
Analysis based on clinically sensible costs or alternatives; systematic review(s) of the evidence; and including multi-way sensitivity analyses
1c All or none§ All or none case-series Absolute SpPins and SnNouts†† All or none case-series Absolute better-value or worse-value analyses ††††
2a SR (with homogeneity*) of cohort studies
SR (with homogeneity*) of either retrospective cohort studies or untreated control groups in RCTs
SR (with homogeneity*) of Level >2 diagnostic studies
SR (with homogeneity*) of 2b and better studies
SR (with homogeneity*) of Level >2 economic studies
2b Individual cohort study (including low quality RCT; e.g., <80% follow-up)
Retrospective cohort study or follow-up of untreated control patients in an RCT; Derivation of CDR† or validated on split-sample§§§ only
Exploratory** cohort study with good†††reference standards; CDR† after derivation, or validated only on split-sample§§§ or databases
Retrospective cohort study, or poor follow-up
Analysis based on clinically sensible costs or alternatives; limited review(s) of the evidence, or single studies; and including multi-way sensitivity analyses
2c "Outcomes" Research; Ecological studies
"Outcomes" Research Ecological studies Audit or outcomes research
3a SR (with homogeneity*) of case-control studies
SR (with homogeneity*) of 3b and better studies
SR (with homogeneity*) of 3b and better studies
SR (with homogeneity*) of 3b and better studies
3b Individual Case-Control Study
Non-consecutive study; or without consistently applied reference standards
Non-consecutive cohort study, or very limited population
Analysis based on limited alternatives or costs, poor quality estimates of data, but including sensitivity analyses incorporating clinically sensible variations.
4 Case-series (and poor quality cohort and case-control studies§§)
Case-series (and poor quality prognostic cohort studies***)
Case-control study, poor or non-independent reference standard
Case-series or superseded reference standards
Analysis with no sensitivity analysis
5 Expert opinion without explicit critical appraisal, or based on physiology, bench research or "first principles"
Expert opinion without explicit critical appraisal, or based on physiology, bench research or "first principles"
Expert opinion without explicit critical appraisal, or based on physiology, bench research or "first principles"
Expert opinion without explicit critical appraisal, or based on physiology, bench research or "first principles"
Expert opinion without explicit critical appraisal, or based on economic theory or "first principles"
Produced by Bob Phillips, Chris Ball, Dave Sackett, Doug Badenoch, Sharon Straus, Brian Haynes, Martin Dawes since November 1998.
2 Available at http://www.cebm.net/levels_of_evidence.asp. Accessed September 11, 2006.

E-8
Notes Users can add a minus-sign "-" to denote the level of that fails to provide a conclusive answer because of: • EITHER a single result with a wide Confidence Interval (such that, for example, an ARR in an RCT is not statistically significant but whose confidence intervals fail to exclude
clinically important benefit or harm) • OR a Systematic Review with troublesome (and statistically significant) heterogeneity. • Such evidence is inconclusive, and therefore can only generate Grade D recommendations. * By homogeneity we mean a systematic review that is free of worrisome variations (heterogeneity) in the directions and degrees of results between individual studies.
Not all systematic reviews with statistically significant heterogeneity need be worrisome, and not all worrisome heterogeneity need be statistically significant. As noted above, studies displaying worrisome heterogeneity should be tagged with a "-" at the end of their designated level.
† Clinical Decision Rule. (These are algorithms or scoring systems which lead to a prognostic estimation or a diagnostic category. ) ‡ See note #2 for advice on how to understand, rate and use trials or other studies with wide confidence intervals. § Met when all patients died before the Rx became available, but some now survive on it; or when some patients died before the Rx became available, but none now
die on it. §§ By poor quality cohort study we mean one that failed to clearly define comparison groups and/or failed to measure exposures and outcomes in the same (preferably
blinded), objective way in both exposed and non-exposed individuals and/or failed to identify or appropriately control known confounders and/or failed to carry out a sufficiently long and complete follow-up of patients. By poor quality case-control study we mean one that failed to clearly define comparison groups and/or failed to measure exposures and outcomes in the same (preferably blinded), objective way in both cases and controls and/or failed to identify or appropriately control known confounders.
§§§ Split-sample validation is achieved by collecting all the information in a single tranche, then artificially dividing this into "derivation" and "validation" samples. †† An "Absolute SpPin" is a diagnostic finding whose Specificity is so high that a Positive result rules-in the diagnosis. An "Absolute SnNout" is a diagnostic finding
whose Sensitivity is so high that a Negative result rules-out the diagnosis. ‡‡ Good, better, bad and worse refer to the comparisons between treatments in terms of their clinical risks and benefits. ††† Good reference standards are independent of the test, and applied blindly or objectively to applied to all patients. Poor reference standards are haphazardly applied,
but still independent of the test. Use of a non-independent reference standard (where the 'test' is included in the 'reference', or where the 'testing' affects the 'reference') implies a level 4 study.
†††† Better-value treatments are clearly as good but cheaper, or better at the same or reduced cost. Worse-value treatments are as good and more expensive, or worse and the equally or more expensive.
** Validating studies test the quality of a specific diagnostic test, based on prior evidence. An exploratory study collects information and trawls the data (e.g., using a regression analysis) to find which factors are 'significant'.
*** By poor quality prognostic cohort study we mean one in which sampling was biased in favour of patients who already had the target outcome, or the measurement of outcomes was accomplished in <80% of study patients, or outcomes were determined in an unblinded, non-objective way, or there was no correction for confounding factors.
**** Good follow-up in a differential diagnosis study is >80%, with adequate time for alternative diagnoses to emerge (eg 1-6 months acute, 1 - 5 years chronic)
Grades of Recommendation
A consistent level 1 studies B consistent level 2 or 3 studies or extrapolations from level 1 studies C level 4 studies or extrapolations from level 2 or 3 studies D level 5 evidence or troublingly inconsistent or inconclusive studies of any level
"Extrapolations" are where data is used in a situation which has potentially clinically important differences than the original study situation.

F-1
Appendix F. Peer Reviewers
The Duke Evidence-based Practice Center is grateful to the following peer reviewers who read and commented on a draft version of this report:
Shashi Amur, Ph.D., Senior Staff Fellow, Genomics Group, Office of Clinical Pharmacology and Biopharmaceutics, Center for Drug Evaluation and Research (CDER), U.S. Food and Drug Administration (FDA), Rockville, Maryland Dan Blazer, M.D., Ph.D., JP Gibbons Professor, Department of Psychiatry, Duke University Medical Center, Durham, North Carolina Linda Bradley, Ph.D., Geneticist, Office of Genomics and Disease Prevention, Centers for Disease Control and Prevention (CDC), Atlanta, Georgia Wylie Burke, M.D., Ph.D., Professor and Chair, Department of Medical History and Ethics, University of Washington, Seattle, Washington Stephen Crystal, Ph.D., Institute for Health, Health Care Policy and Aging Research, Research Professor, School of Social Work, Rutgers, State University of New Jersey, New Brunswick, New Jersey Julia Kirchheiner, M.D., Professor of Clinical Pharmacology, Department of Pharmacology of Natural Products and Clinical Pharmacology, University of Ulm, Ulm, Germany William Lawrence, M.D., M.S., Center for Outcomes and Evidence, Agency for Healthcare Research and Quality (AHRQ), Rockville, Maryland Dennis J. O’Kane, Ph.D., FACB, Department of Lab Medicine and Pathology, Mayo Clinic, Rochester, Minnesota Kathryn Phillips, Ph.D., Professor of Health Economics and Health Services Research, School of Pharmacy, Institute for Health Policy Studies and ECSF Comprehensive Cancer Center, University of California SF, San Francisco, California Margaret Piper, Ph.D., M.P.H., Associate Director, Blue Cross/Blue Shield Association, Technology Evaluation Center, Atlanta, Georgia Gurvaneet Randhawa, M.D., M.P.H., Center for Outcomes and Evidence, Agency for Healthcare Research and Quality (AHRQ), Rockville, Maryland Matthew Rudorfer, M.D., Assistant Chief, Division of Services and Intervention Research, National Institute of Mental Health, Bethesda, Maryland

F-2
Stephen Stahl, M.D., Ph.D., Chair, Neuroscience Education Institute, Adjunct Professor of Psychiatry, University of California SD, San Diego, California Combined comments from the Evaluation of Genomics Applications in Practice and Prevention (EGAPP)/Centers for Disease Control and Prevention (CDC) Discussion Group Comments from the Editorial Staff of the Agency for Healthcare Research and Quality (AHRQ), Rockville, Maryland Comments from the National Institute of General Medical Sciences (NIGMS)/National Institutes of Health (NIH) Discussion Group Nominations for peer reviewers were solicited from several sources, including the project’s
technical expert panel and interested federal agencies. The list of nominees was vetted and approved by the Agency for Healthcare Research and Quality (AHRQ).