test rite international co., ltd. 2013 annual report annual report_e... · stock code:2908 test...
TRANSCRIPT

Stock Code:2908
Test Rite International Co., Ltd.
2013 Annual Report
Notice to readers
This English version annual report is a summary translation of the Chinese version
and is not an official document of the shareholders’ meeting. If there is any
discrepancy between the English version and Chinese version, the Chinese version
shall prevail.
Taiwan Stock Exchange Market Observation Post System:
http://newmops.twse.com.tw
Test Rite’s Annual Report is available at
http://www.testitegroup.com
Spokesperson
Name:Jack Chang
Title:Group IR Officer
Tel:886-2-8791-5349
E-mail:[email protected]
Deputy Spokesperson
Name:Hannis Chang
Title:CFO of Test Rite Int‘l Co., Ltd.
Tel:886-2-8791-5888
E-mail:[email protected]
Stock Transfer Agent
Registrar & Transfer Agency Department, Yuanta Securities Co., Ltd
Address:B1F, No. 210, Sec. 3, Chengde Rd., Taipei City, Taiwan (R.O.C.) 103
Tel:886-2-2586-5859
Website:www.yuanta.com.tw
Auditors
Deloitte & Touche
Auditors:HONG, KUO-TYAN, WU, KER-CHANG
Address:12th Floor, Hung Tai Financial Plaza
156 Min Sheng East Road, Sec. 3
Taipei 10596, Taiwan, ROC
Tel.:886-2-2545-9988
Website:http://www.deloitte.com/view/tc_TW/tw/index.htm
Corporate Website
http://www.testritegroup.com
Headquarters, Branches and Plant
Headquarters
Address:6F., No. 23, Hsin Hu 3rd Rd.,
Nei Hu 114, Taipei, Taiwan, R.O.C.
Tel: 886-2- 8791-5888
-i-
Contents
I. Letter to Shareholders ···················································································································· 1
II. Company Profile
2.1 Date of Incorporation ·················································································································· 5
2.2 Company History ························································································································ 5
I. Corporate Governance Report
3.1 Organization ······························································································································· 6
3.2 Directors, Supervisors and Management Team ·········································································· 8
3.3 Implementation of Corporate Governance ··············································································· 26
3.4 Changes in Shareholding of Directors, Supervisors, Managers and Major
Shareholders ····························································································································· 43
3.5. Information Disclosing the Relationship between any of the Company‘s Top Ten
Shareholders ····························································································································· 45
3.6 Long-term Investment Ownership ···························································································· 46
II. Capital Overview
4.1 Capital and Shares ···················································································································· 47
4.2 Issuance of Corporate Bonds ···································································································· 54
4.3 Preferred Shares ························································································································ 54
4.4 Issuance of Global Deposit Receipts ························································································ 54
4.5 Employee Stock Options ·········································································································· 54
4.6 Status of New Shares Issuance in Connection with Mergers and Acquisitions························ 54
4.7 Financing Plans and Implementation ························································································ 54
III. Operational Highlights
5.1 Business Activities ··················································································································· 55
5.2 Market and Sales Overview ······································································································ 67
5.3. Human Resources ···················································································································· 71
5.4 Labor Relations ························································································································· 71
5.5 Important Contracts ·················································································································· 75
IV. Financial Information
6.1 Five-Year Financial Summary ·································································································· 76
6.2 Five-Year Financial Analysis ··································································································· 82
6.3 Supervisors‘ Report in the Most Recent Year ·········································································· 85
6.4 Consolidated Financial Statements for the Years Ended December 31, 2013
and.2012, and Independent Auditors‘ Report ············································································ 86
V. Review of Financial Conditions, Operating Results, and Risk Management
7.1 Analysis of Financial Status ··································································································· 161
7.2 Analysis of Operation Results ································································································ 162
7.3 Analysis of Cash Flow ············································································································ 163
7.4 Major Capital Expenditure Items ···························································································· 163
7.5 Investment Policy in Last Year, Main Causes for Profits or Losses,
Improvement Plans and the Investment Plans for the Coming Year ······································· 163
7.6 Analysis of Risk Management ································································································ 167

-ii-
VI. Special Disclosure
8.1 Summary of Affiliated Companies ························································································· 170
8.2 Private Placement Securities in the Most Recent Years ························································· 175
8.3 The Shares in the Company Held or Disposed of by Subsidiaries
in the Most Recent Years ······································································································· 175
8.4 Other Necessary Supplement ·································································································· 175
VII. Any Events in 2013 and as of the Date of this Annual Report that Had Significant Impacts
on Shareholders’ Right or Security Prices as Stated in Item 2 Paragraph 2 of Article 36 of
Securities and Exchange Law of Taiwan ·················································································· 175
-1-
I. Letter to Shareholders
Dear shareholders,
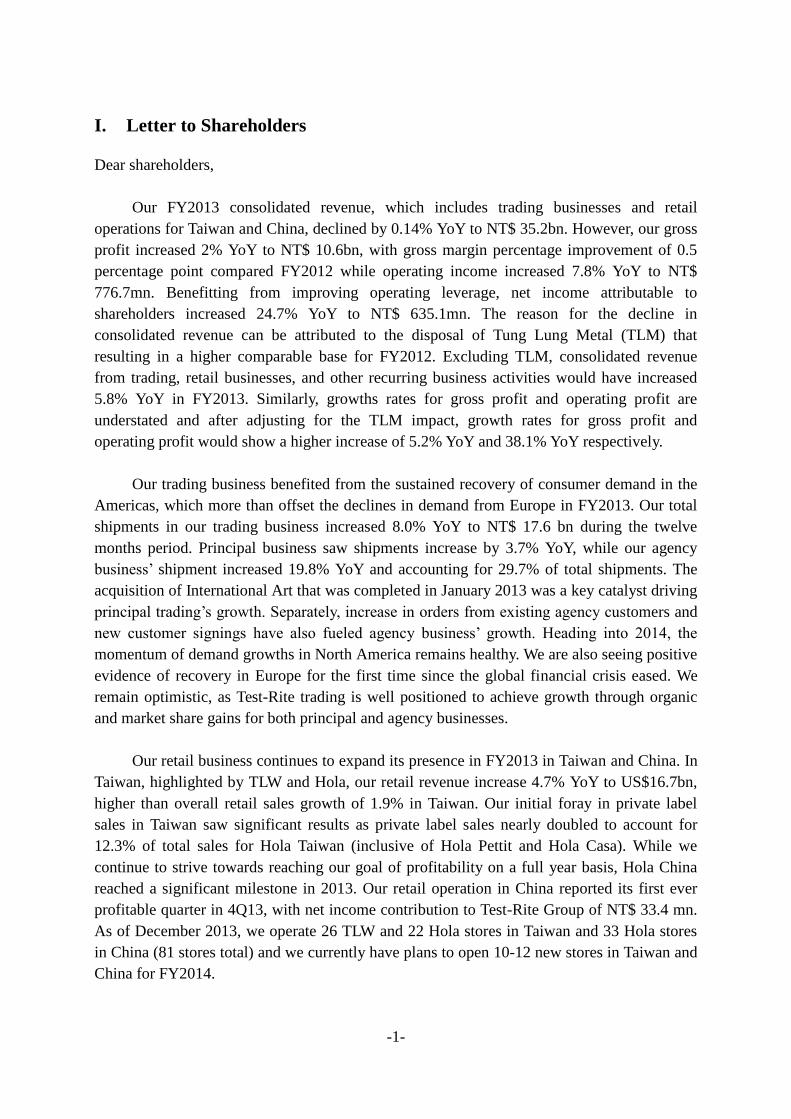
Our FY2013 consolidated revenue, which includes trading businesses and retail
operations for Taiwan and China, declined by 0.14% YoY to NT$ 35.2bn. However, our gross
profit increased 2% YoY to NT$ 10.6bn, with gross margin percentage improvement of 0.5
percentage point compared FY2012 while operating income increased 7.8% YoY to NT$
776.7mn. Benefitting from improving operating leverage, net income attributable to
shareholders increased 24.7% YoY to NT$ 635.1mn. The reason for the decline in
consolidated revenue can be attributed to the disposal of Tung Lung Metal (TLM) that
resulting in a higher comparable base for FY2012. Excluding TLM, consolidated revenue
from trading, retail businesses, and other recurring business activities would have increased
5.8% YoY in FY2013. Similarly, growths rates for gross profit and operating profit are
understated and after adjusting for the TLM impact, growth rates for gross profit and
operating profit would show a higher increase of 5.2% YoY and 38.1% YoY respectively.
Our trading business benefited from the sustained recovery of consumer demand in the
Americas, which more than offset the declines in demand from Europe in FY2013. Our total
shipments in our trading business increased 8.0% YoY to NT$ 17.6 bn during the twelve
months period. Principal business saw shipments increase by 3.7% YoY, while our agency
business‘ shipment increased 19.8% YoY and accounting for 29.7% of total shipments. The
acquisition of International Art that was completed in January 2013 was a key catalyst driving
principal trading‘s growth. Separately, increase in orders from existing agency customers and
new customer signings have also fueled agency business‘ growth. Heading into 2014, the
momentum of demand growths in North America remains healthy. We are also seeing positive
evidence of recovery in Europe for the first time since the global financial crisis eased. We
remain optimistic, as Test-Rite trading is well positioned to achieve growth through organic
and market share gains for both principal and agency businesses.
Our retail business continues to expand its presence in FY2013 in Taiwan and China. In
Taiwan, highlighted by TLW and Hola, our retail revenue increase 4.7% YoY to US$16.7bn,
higher than overall retail sales growth of 1.9% in Taiwan. Our initial foray in private label
sales in Taiwan saw significant results as private label sales nearly doubled to account for
12.3% of total sales for Hola Taiwan (inclusive of Hola Pettit and Hola Casa). While we
continue to strive towards reaching our goal of profitability on a full year basis, Hola China
reached a significant milestone in 2013. Our retail operation in China reported its first ever
profitable quarter in 4Q13, with net income contribution to Test-Rite Group of NT$ 33.4 mn.
As of December 2013, we operate 26 TLW and 22 Hola stores in Taiwan and 33 Hola stores
in China (81 stores total) and we currently have plans to open 10-12 new stores in Taiwan and
China for FY2014.
-2-
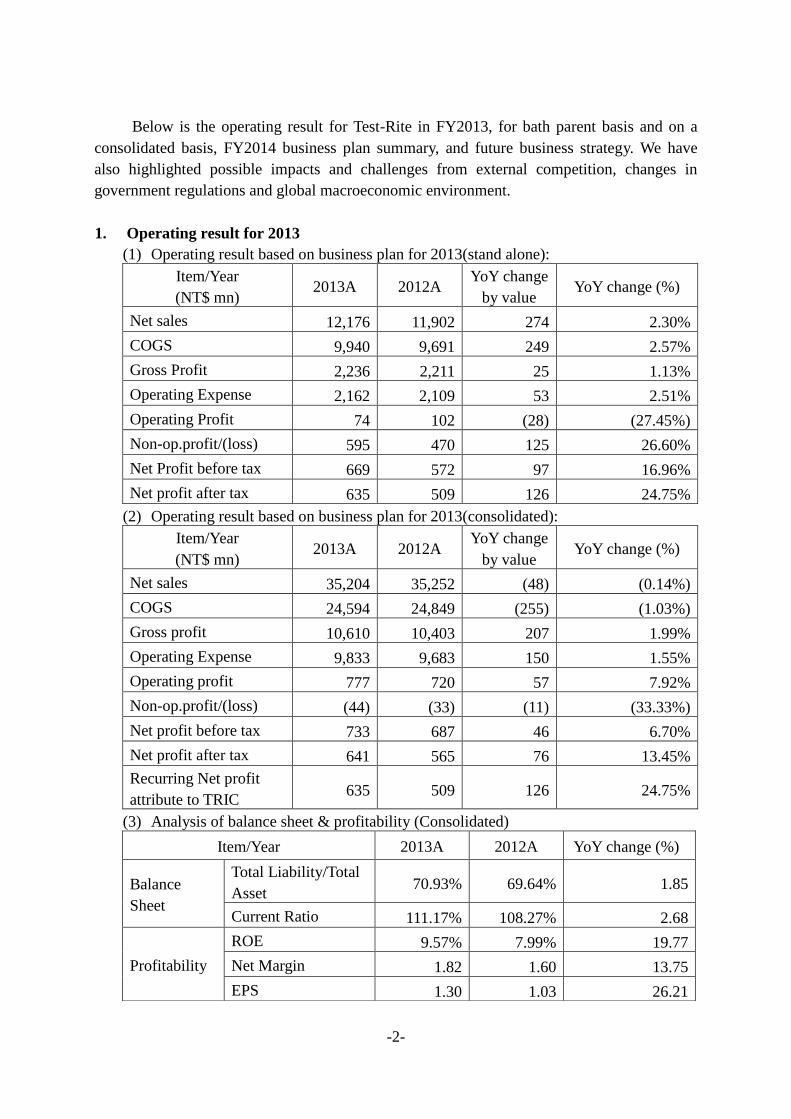
Below is the operating result for Test-Rite in FY2013, for bath parent basis and on a
consolidated basis, FY2014 business plan summary, and future business strategy. We have
also highlighted possible impacts and challenges from external competition, changes in
government regulations and global macroeconomic environment.
1. Operating result for 2013
(1) Operating result based on business plan for 2013(stand alone):
Item/Year
(NT$ mn) 2013A 2012A
YoY change
by value YoY change (%)
Net sales 12,176 11,902 274 2.30%
COGS 9,940 9,691 249 2.57%
Gross Profit 2,236 2,211 25 1.13%
Operating Expense 2,162 2,109 53 2.51%
Operating Profit 74 102 (28) (27.45%)
Non-op.profit/(loss) 595 470 125 26.60%
Net Profit before tax 669 572 97 16.96%
Net profit after tax 635 509 126 24.75%
(2) Operating result based on business plan for 2013(consolidated):
Item/Year
(NT$ mn) 2013A 2012A
YoY change
by value YoY change (%)
Net sales 35,204 35,252 (48) (0.14%)
COGS 24,594 24,849 (255) (1.03%)
Gross profit 10,610 10,403 207 1.99%
Operating Expense 9,833 9,683 150 1.55%
Operating profit 777 720 57 7.92%
Non-op.profit/(loss) (44) (33) (11) (33.33%)
Net profit before tax 733 687 46 6.70%
Net profit after tax 641 565 76 13.45%
Recurring Net profit
attribute to TRIC 635 509 126 24.75%
(3) Analysis of balance sheet & profitability (Consolidated)
Item/Year 2013A 2012A YoY change (%)
Balance
Sheet
Total Liability/Total
Asset 70.93% 69.64% 1.85
Current Ratio 111.17% 108.27% 2.68
Profitability
ROE 9.57% 7.99% 19.77
Net Margin 1.82 1.60 13.75
EPS 1.30 1.03 26.21

-3-
2. 2014 business plan and future development strategy
(1) Business plan and managerial principle:
A. Continue to strengthen relationships with existing trading customers (principal
and agency)
B. Align business plans with newly signed agency customers to ensure growth
targets 2014 remains on track
C. Leverage in-house design capabilities to provide differentiating products for both
trading and retail
D. Enhance range of sourcing services by establishing Shanghai FTZ warehousing
facilities
E. Open 10-12 stores in Taiwan and China
F. Continue to integrate operations of trading and retail subsidiaries to realize
potential synergy.
(2) Future development strategy:
A. Aggressively expand the scope and identify potential new customer targets for
agency business.
B. Target growth opportunities in Taiwan and China‘s retail market through brand
licensing and new store openings
C. Pursue M&A opportunities for both trading and retail businesses to compliment
organic growth of our existing businesses
3. Potential influence from external competition, regulation and macroeconomic
environment
Faced with a rapidly changing competitive landscape, Test-Rite has leveraged its +30
years of experience in trading and continued to strengthen our product offering by developing
Total Solution service for our trading business. These services encompass product and
packaging design, logistics, and storage/warehousing capabilities that we believe is necessary
to further strengthen or role within the supply to chain to global retail operators. Since 4Q12,
we have already signed on five new accounts for our agency business. Both our agency and
principle trading businesses are well positioned to benefit from the recovery of European and
N. American consumer demand.
Taiwanese authorities may continue implement new policies to mitigate concerns over
the overheated real estate markets. Additional regulations being considered may include
higher property taxes and mortgage interest rates, and if implemented, may negatively
adversely impact demand for DIY and home furnishing related products. Prolonged impact
from student protest over the signing The Cross-Strait Trade in Services Agreement and the
construction/operational status of the 4th
Nuclear Power Plant may have further negative
impact of consumer demand in Taiwan. Should the construction of Nuclear Power Plant is
halted, Taiwanese business and households are likely to face higher electricity prices that will
-4-
increase businesses operating costs and reduce consumers disposal income. In China, the
authorities have continued to reign in the purported excess spending of wealthy individuals.
The result is a substantial slowdown of total retail sales by nearly 10 percentage point (from
growth rate of more than 20% YoY). This along with rising labor costs has significantly
increased the challenges of our retail operation in China. Despite these challenges, our
aspiration to become a premier retail operator in Greater China remains unchanged and plans
to open new stores in FY2014.
Lastly, all staff of Test Rite Group will spare no efforts to adequately plan, and manage
our trading, retail and other group businesses in an honest, sincere and dedicated manner, with
the objective to strengthen our balance sheet and further enhance returns on shareholder
equity (ROE). We, on behalf of all the employees at Test-Rite, would like to take this
opportunity to thank our shareholders for your continued support and encouragement.
Sincerely yours,
Chairman CEO & President
Judy Lee Sophia Tong
-5-
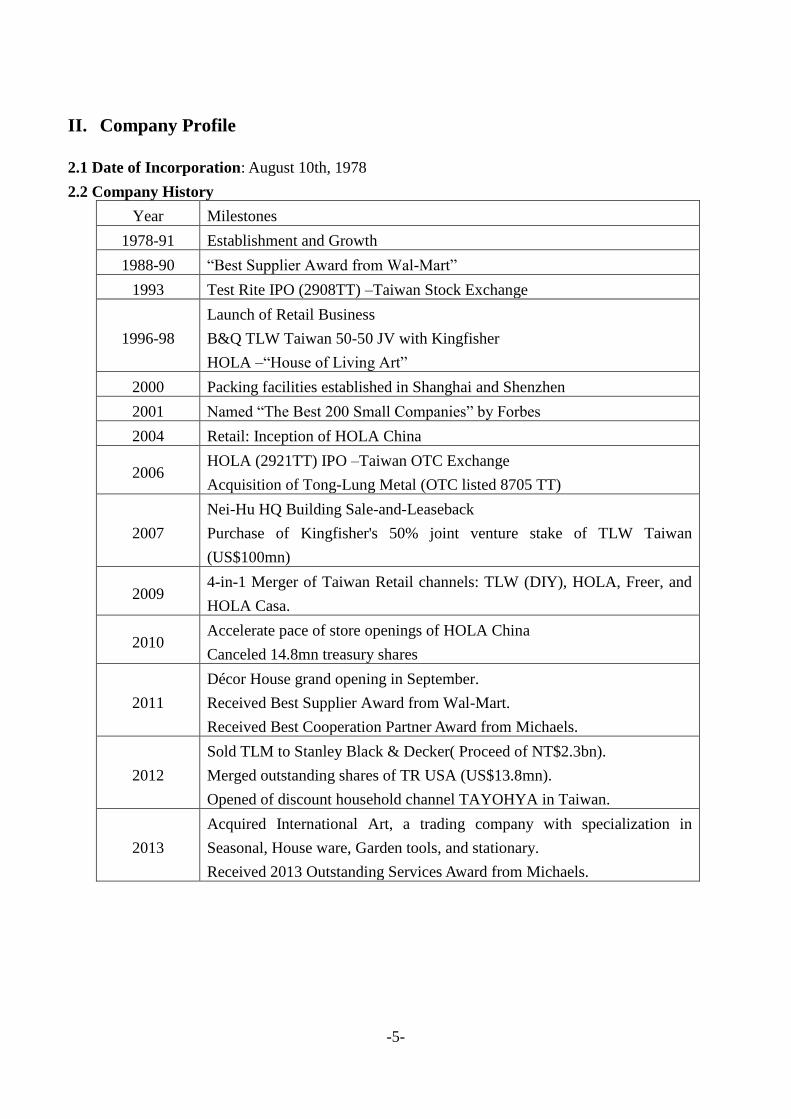
II. Company Profile
2.1 Date of Incorporation: August 10th, 1978
2.2 Company History
Year Milestones
1978-91 Establishment and Growth
1988-90 ―Best Supplier Award from Wal-Mart‖
1993 Test Rite IPO (2908TT) –Taiwan Stock Exchange
1996-98
Launch of Retail Business
B&Q TLW Taiwan 50-50 JV with Kingfisher
HOLA –―House of Living Art‖
2000 Packing facilities established in Shanghai and Shenzhen
2001 Named ―The Best 200 Small Companies‖ by Forbes
2004 Retail: Inception of HOLA China
2006 HOLA (2921TT) IPO –Taiwan OTC Exchange
Acquisition of Tong-Lung Metal (OTC listed 8705 TT)
2007
Nei-Hu HQ Building Sale-and-Leaseback
Purchase of Kingfisher's 50% joint venture stake of TLW Taiwan
(US$100mn)
2009 4-in-1 Merger of Taiwan Retail channels: TLW (DIY), HOLA, Freer, and
HOLA Casa.
2010 Accelerate pace of store openings of HOLA China
Canceled 14.8mn treasury shares
2011
Décor House grand opening in September.
Received Best Supplier Award from Wal-Mart.
Received Best Cooperation Partner Award from Michaels.
2012
Sold TLM to Stanley Black & Decker( Proceed of NT$2.3bn).
Merged outstanding shares of TR USA (US$13.8mn).
Opened of discount household channel TAYOHYA in Taiwan.
2013
Acquired International Art, a trading company with specialization in
Seasonal, House ware, Garden tools, and stationary.
Received 2013 Outstanding Services Award from Michaels.

-6-
III. Corporate Governance Report
3.1 Organization
3.1.1 Organization Chart
Shareholders’ Meeting
Board of Directors
Chairman
General Manager
New
Business
Devl
Project
Michaels
Agency
Creative
Design
Product
Dev.
Logistics AM
&
Product
Quality
&
Technique
Management
On
Supplier
Chain
Agency
Dev.
Domestic
MK
Taiwan
Brand
MK
Group
MK
Group
HRM
Group
Financial
PM
Group
PMO
Group
Leagl
Group
ISM
China
Public
Affairs
GA
Remuneration
Committee
Group Auditing
Supervisors
-7-
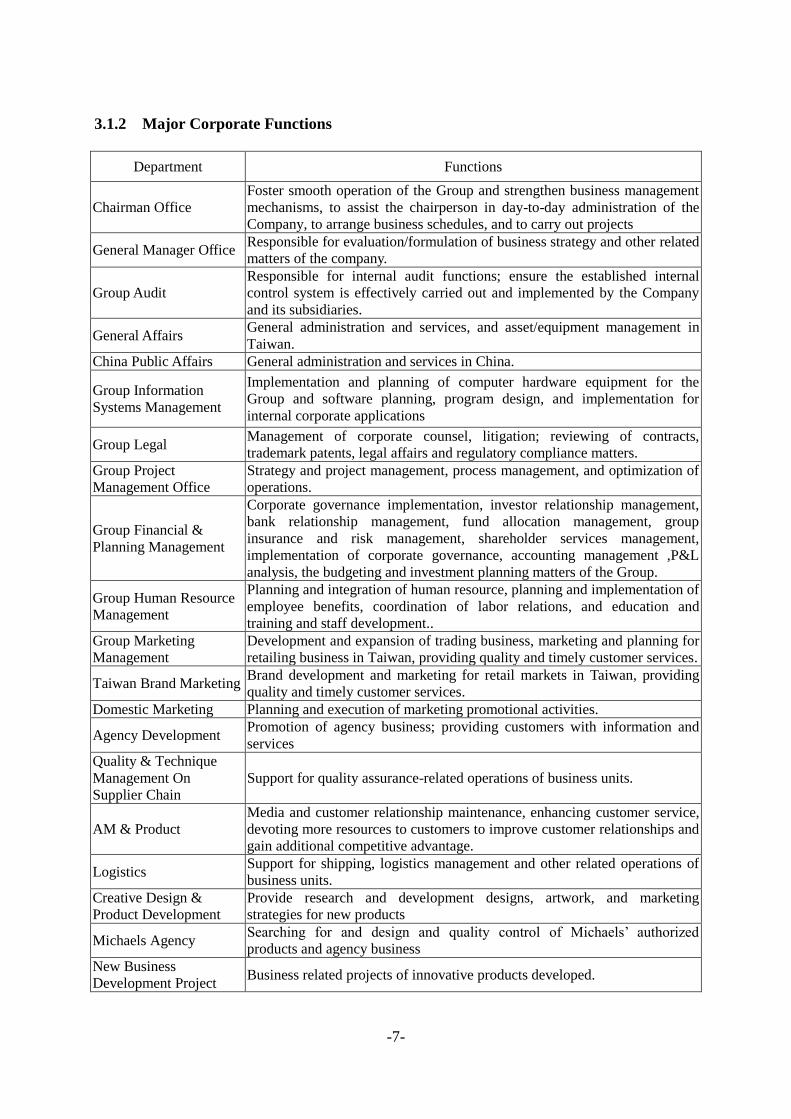
3.1.2 Major Corporate Functions
Department Functions
Chairman Office
Foster smooth operation of the Group and strengthen business management
mechanisms, to assist the chairperson in day-to-day administration of the
Company, to arrange business schedules, and to carry out projects
General Manager Office Responsible for evaluation/formulation of business strategy and other related
matters of the company.
Group Audit
Responsible for internal audit functions; ensure the established internal
control system is effectively carried out and implemented by the Company
and its subsidiaries.
General Affairs General administration and services, and asset/equipment management in
Taiwan.
China Public Affairs General administration and services in China.
Group Information
Systems Management
Implementation and planning of computer hardware equipment for the
Group and software planning, program design, and implementation for
internal corporate applications
Group Legal Management of corporate counsel, litigation; reviewing of contracts,
trademark patents, legal affairs and regulatory compliance matters.
Group Project
Management Office
Strategy and project management, process management, and optimization of
operations.
Group Financial &
Planning Management
Corporate governance implementation, investor relationship management,
bank relationship management, fund allocation management, group
insurance and risk management, shareholder services management,
implementation of corporate governance, accounting management ,P&L
analysis, the budgeting and investment planning matters of the Group.
Group Human Resource
Management
Planning and integration of human resource, planning and implementation of
employee benefits, coordination of labor relations, and education and
training and staff development..
Group Marketing
Management
Development and expansion of trading business, marketing and planning for
retailing business in Taiwan, providing quality and timely customer services.
Taiwan Brand Marketing Brand development and marketing for retail markets in Taiwan, providing
quality and timely customer services.
Domestic Marketing Planning and execution of marketing promotional activities.
Agency Development Promotion of agency business; providing customers with information and
services
Quality & Technique
Management On
Supplier Chain
Support for quality assurance-related operations of business units.
AM & Product
Media and customer relationship maintenance, enhancing customer service,
devoting more resources to customers to improve customer relationships and
gain additional competitive advantage.
Logistics Support for shipping, logistics management and other related operations of
business units.
Creative Design &
Product Development
Provide research and development designs, artwork, and marketing
strategies for new products
Michaels Agency Searching for and design and quality control of Michaels‘ authorized
products and agency business
New Business
Development Project Business related projects of innovative products developed.
-8-
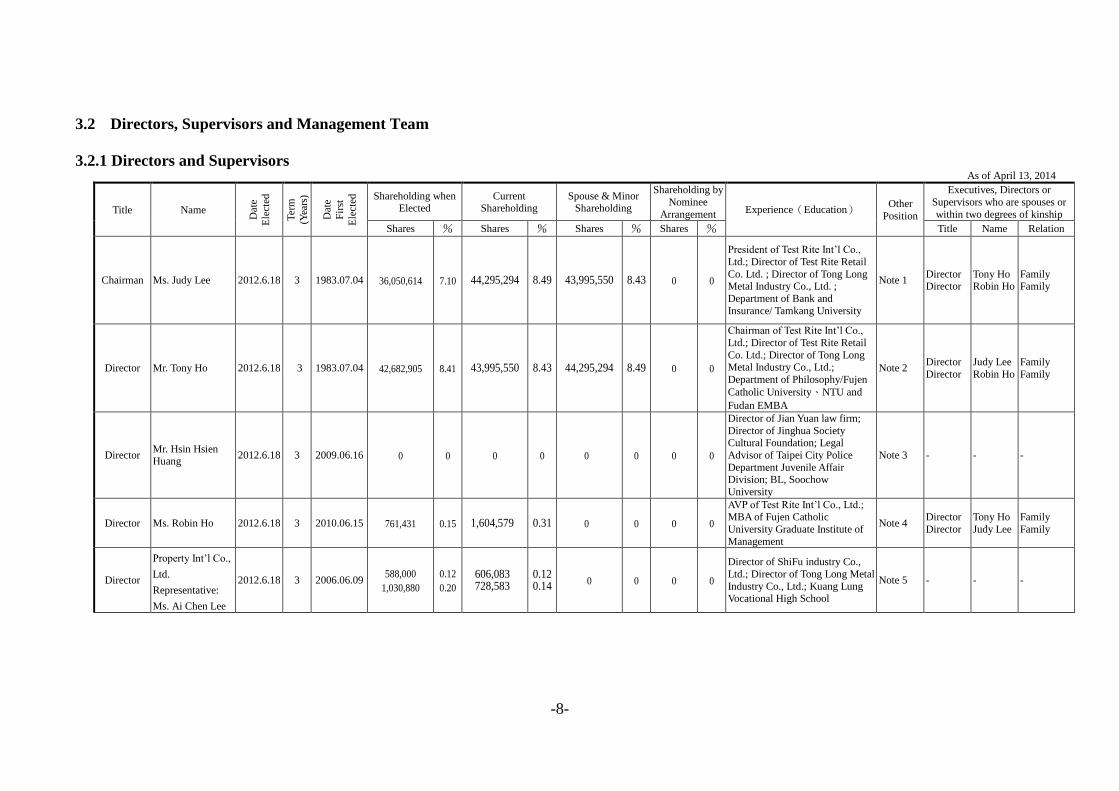
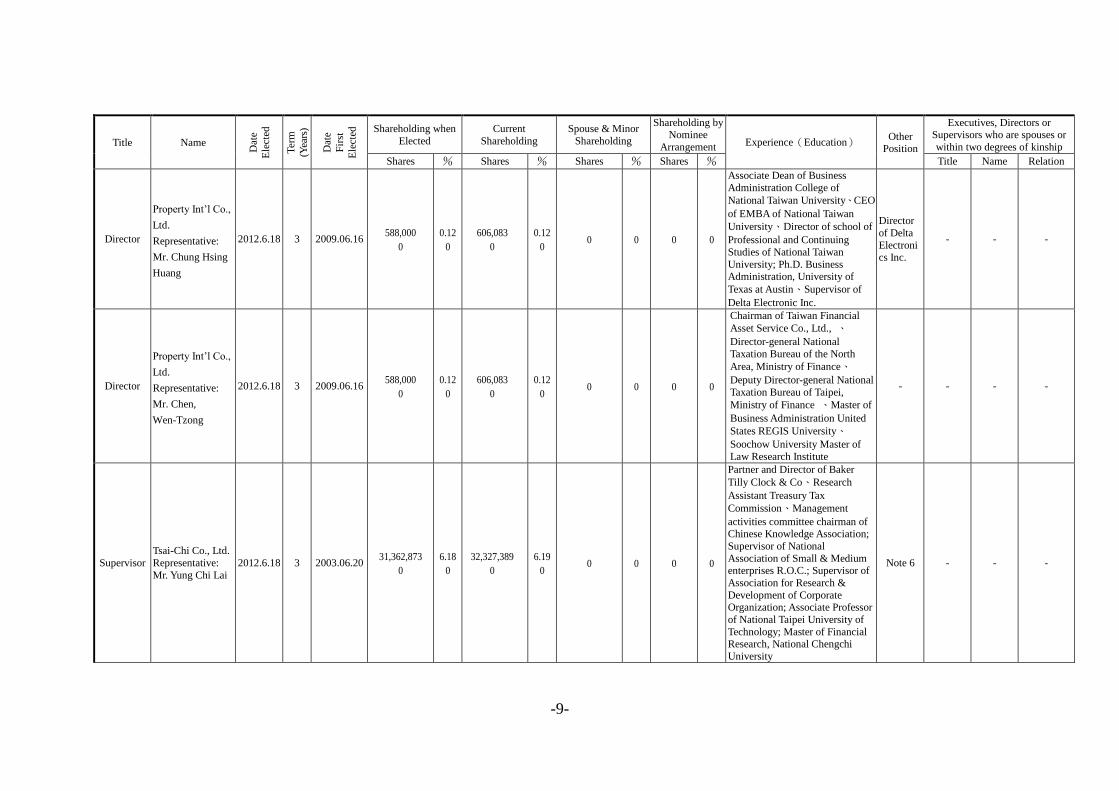
3.2 Directors, Supervisors and Management Team
3.2.1 Directors and Supervisors As of April 13, 2014
Title Name
Dat
e
Ele
cted
Ter
m
(Yea
rs)
Dat
e
Fir
st
Ele
cted
Shareholding when Elected
Current Shareholding
Spouse & Minor Shareholding
Shareholding by
Nominee
Arrangement Experience(Education) Other
Position
Executives, Directors or
Supervisors who are spouses or
within two degrees of kinship
Shares % Shares % Shares % Shares % Title Name Relation
Chairman Ms. Judy Lee 2012.6.18 3 1983.07.04 36,050,614 7.10 44,295,294 8.49 43,995,550 8.43 0 0
President of Test Rite Int‘l Co.,
Ltd.; Director of Test Rite Retail
Co. Ltd. ; Director of Tong Long Metal Industry Co., Ltd. ;
Department of Bank and
Insurance/ Tamkang University
Note 1 Director Director
Tony Ho Robin Ho
Family Family
Director Mr. Tony Ho 2012.6.18 3 1983.07.04 42,682,905 8.41 43,995,550 8.43 44,295,294 8.49 0 0
Chairman of Test Rite Int‘l Co.,
Ltd.; Director of Test Rite Retail
Co. Ltd.; Director of Tong Long
Metal Industry Co., Ltd.;
Department of Philosophy/Fujen
Catholic University、NTU and
Fudan EMBA
Note 2 Director
Director
Judy Lee
Robin Ho
Family
Family
Director Mr. Hsin Hsien Huang
2012.6.18 3 2009.06.16 0 0 0 0 0 0 0 0
Director of Jian Yuan law firm;
Director of Jinghua Society Cultural Foundation; Legal
Advisor of Taipei City Police
Department Juvenile Affair Division; BL, Soochow
University
Note 3 - - -
Director Ms. Robin Ho 2012.6.18 3 2010.06.15 761,431 0.15 1,604,579 0.31 0 0 0 0
AVP of Test Rite Int‘l Co., Ltd.;
MBA of Fujen Catholic
University Graduate Institute of
Management
Note 4 Director
Director
Tony Ho
Judy Lee
Family
Family
Director
Property Int‘l Co.,
Ltd.
Representative:
Ms. Ai Chen Lee
2012.6.18 3 2006.06.09 588,000
1,030,880
0.12
0.20
606,083 728,583
0.12 0.14 0 0 0 0
Director of ShiFu industry Co.,
Ltd.; Director of Tong Long Metal
Industry Co., Ltd.; Kuang Lung Vocational High School
Note 5 - - -
-9-
Title Name
Dat
e
Ele
cted
Ter
m
(Yea
rs)
Dat
e
Fir
st
Ele
cted
Shareholding when
Elected
Current
Shareholding
Spouse & Minor
Shareholding
Shareholding by Nominee
Arrangement Experience(Education) Other
Position
Executives, Directors or Supervisors who are spouses or
within two degrees of kinship
Shares % Shares % Shares % Shares % Title Name Relation
Director
Property Int‘l Co.,
Ltd.
Representative:
Mr. Chung Hsing
Huang
2012.6.18 3 2009.06.16 588,000
0
0.12
0
606,083
0
0.12
0 0 0 0 0
Associate Dean of Business
Administration College of
National Taiwan University、CEO
of EMBA of National Taiwan
University、Director of school of
Professional and Continuing
Studies of National Taiwan
University; Ph.D. Business Administration, University of
Texas at Austin、Supervisor of
Delta Electronic Inc.
Director
of Delta
Electronics Inc.
- - -
Director
Property Int‘l Co.,
Ltd.
Representative:
Mr. Chen,
Wen-Tzong
2012.6.18 3 2009.06.16 588,000
0
0.12
0
606,083
0
0.12
0 0 0 0 0
Chairman of Taiwan Financial
Asset Service Co., Ltd., 、
Director-general National
Taxation Bureau of the North
Area, Ministry of Finance、
Deputy Director-general National
Taxation Bureau of Taipei,
Ministry of Finance 、Master of
Business Administration United
States REGIS University、Soochow University Master of
Law Research Institute
- - - -
Supervisor
Tsai-Chi Co., Ltd.
Representative:
Mr. Yung Chi Lai
2012.6.18 3 2003.06.20 31,362,873
0
6.18
0
32,327,389
0
6.19
0 0 0 0 0
Partner and Director of Baker
Tilly Clock & Co、Research
Assistant Treasury Tax
Commission、Management
activities committee chairman of Chinese Knowledge Association;
Supervisor of National
Association of Small & Medium enterprises R.O.C.; Supervisor of
Association for Research &
Development of Corporate Organization; Associate Professor
of National Taipei University of
Technology; Master of Financial Research, National Chengchi
University
Note 6 - - -
-10-
Title Name
Dat
e
Ele
cted
Ter
m
(Yea
rs)
Dat
e
Fir
st
Ele
cted
Shareholding when
Elected
Current
Shareholding
Spouse & Minor
Shareholding
Shareholding by Nominee
Arrangement Experience(Education) Other
Position
Executives, Directors or Supervisors who are spouses or
within two degrees of kinship
Shares % Shares % Shares % Shares % Title Name Relation
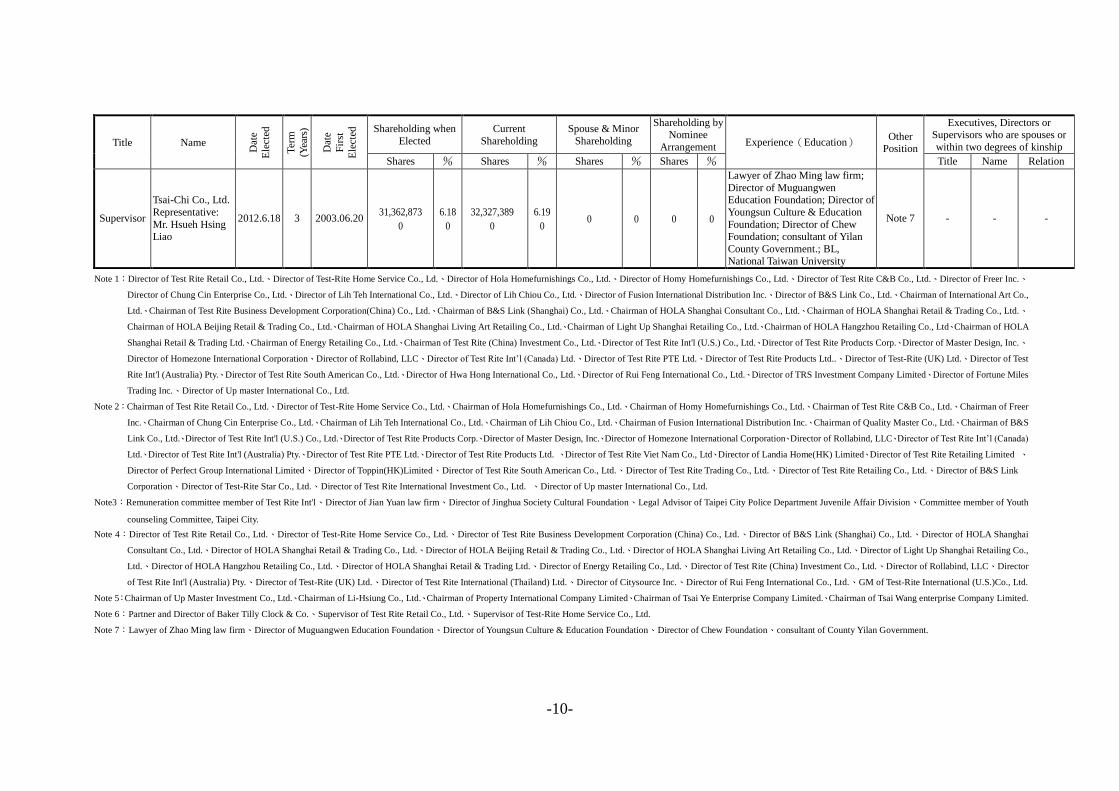
Supervisor
Tsai-Chi Co., Ltd.
Representative:
Mr. Hsueh Hsing Liao
2012.6.18 3 2003.06.20 31,362,873
0
6.18
0
32,327,389
0
6.19
0 0 0 0 0
Lawyer of Zhao Ming law firm;
Director of Muguangwen Education Foundation; Director of
Youngsun Culture & Education
Foundation; Director of Chew Foundation; consultant of Yilan
County Government.; BL,
National Taiwan University
Note 7 - - -
Note 1:Director of Test Rite Retail Co., Ltd.、Director of Test-Rite Home Service Co., Ld.、Director of Hola Homefurnishings Co., Ltd.、Director of Homy Homefurnishings Co., Ltd.、Director of Test Rite C&B Co., Ltd.、Director of Freer Inc.、
Director of Chung Cin Enterprise Co., Ltd.、Director of Lih Teh International Co., Ltd.、Director of Lih Chiou Co., Ltd.、Director of Fusion International Distribution Inc.、Director of B&S Link Co., Ltd.、Chairman of International Art Co.,
Ltd.、Chairman of Test Rite Business Development Corporation(China) Co., Ltd.、Chairman of B&S Link (Shanghai) Co., Ltd.、Chairman of HOLA Shanghai Consultant Co., Ltd.、Chairman of HOLA Shanghai Retail & Trading Co., Ltd.、
Chairman of HOLA Beijing Retail & Trading Co., Ltd.、Chairman of HOLA Shanghai Living Art Retailing Co., Ltd.、Chairman of Light Up Shanghai Retailing Co., Ltd.、Chairman of HOLA Hangzhou Retailing Co., Ltd、Chairman of HOLA
Shanghai Retail & Trading Ltd.、Chairman of Energy Retailing Co., Ltd.、Chairman of Test Rite (China) Investment Co., Ltd.、Director of Test Rite Int'l (U.S.) Co., Ltd.、Director of Test Rite Products Corp.、Director of Master Design, Inc.、
Director of Homezone International Corporation、Director of Rollabind, LLC、Director of Test Rite Int‘l (Canada) Ltd.、Director of Test Rite PTE Ltd.、Director of Test Rite Products Ltd..、Director of Test-Rite (UK) Ltd.、Director of Test
Rite Int'l (Australia) Pty.、Director of Test Rite South American Co., Ltd.、Director of Hwa Hong International Co., Ltd.、Director of Rui Feng International Co., Ltd.、Director of TRS Investment Company Limited、Director of Fortune Miles
Trading Inc.、Director of Up master International Co., Ltd.
Note 2:Chairman of Test Rite Retail Co., Ltd.、Director of Test-Rite Home Service Co., Ltd.、Chairman of Hola Homefurnishings Co., Ltd.、Chairman of Homy Homefurnishings Co., Ltd.、Chairman of Test Rite C&B Co., Ltd.、Chairman of Freer
Inc.、Chairman of Chung Cin Enterprise Co., Ltd.、Chairman of Lih Teh International Co., Ltd.、Chairman of Lih Chiou Co., Ltd.、Chairman of Fusion International Distribution Inc.、Chairman of Quality Master Co., Ltd.、Chairman of B&S
Link Co., Ltd.、Director of Test Rite Int'l (U.S.) Co., Ltd.、Director of Test Rite Products Corp.、Director of Master Design, Inc.、Director of Homezone International Corporation、Director of Rollabind, LLC、Director of Test Rite Int‘l (Canada)
Ltd.、Director of Test Rite Int'l (Australia) Pty.、Director of Test Rite PTE Ltd.、Director of Test Rite Products Ltd. 、Director of Test Rite Viet Nam Co., Ltd、Director of Landia Home(HK) Limited、Director of Test Rite Retailing Limited 、
Director of Perfect Group International Limited、Director of Toppin(HK)Limited、Director of Test Rite South American Co., Ltd.、Director of Test Rite Trading Co., Ltd.、Director of Test Rite Retailing Co., Ltd.、Director of B&S Link
Corporation、Director of Test-Rite Star Co., Ltd.、Director of Test Rite International Investment Co., Ltd. 、Director of Up master International Co., Ltd.
Note3:Remuneration committee member of Test Rite Int'l、Director of Jian Yuan law firm、Director of Jinghua Society Cultural Foundation、Legal Advisor of Taipei City Police Department Juvenile Affair Division、Committee member of Youth
counseling Committee, Taipei City.
Note 4:Director of Test Rite Retail Co., Ltd.、Director of Test-Rite Home Service Co., Ltd.、Director of Test Rite Business Development Corporation (China) Co., Ltd.、Director of B&S Link (Shanghai) Co., Ltd.、Director of HOLA Shanghai
Consultant Co., Ltd.、Director of HOLA Shanghai Retail & Trading Co., Ltd.、Director of HOLA Beijing Retail & Trading Co., Ltd.、Director of HOLA Shanghai Living Art Retailing Co., Ltd.、Director of Light Up Shanghai Retailing Co.,
Ltd.、Director of HOLA Hangzhou Retailing Co., Ltd.、Director of HOLA Shanghai Retail & Trading Ltd.、Director of Energy Retailing Co., Ltd.、Director of Test Rite (China) Investment Co., Ltd.、Director of Rollabind, LLC、Director
of Test Rite Int'l (Australia) Pty.、Director of Test-Rite (UK) Ltd.、Director of Test Rite International (Thailand) Ltd.、Director of Citysource Inc.、Director of Rui Feng International Co., Ltd.、GM of Test-Rite International (U.S.)Co., Ltd.
Note 5:Chairman of Up Master Investment Co., Ltd.、Chairman of Li-Hsiung Co., Ltd.、Chairman of Property International Company Limited、Chairman of Tsai Ye Enterprise Company Limited.、Chairman of Tsai Wang enterprise Company Limited.
Note 6:Partner and Director of Baker Tilly Clock & Co.、Supervisor of Test Rite Retail Co., Ltd.、Supervisor of Test-Rite Home Service Co., Ltd.
Note 7:Lawyer of Zhao Ming law firm、Director of Muguangwen Education Foundation、Director of Youngsun Culture & Education Foundation、Director of Chew Foundation、consultant of County Yilan Government.
-11-
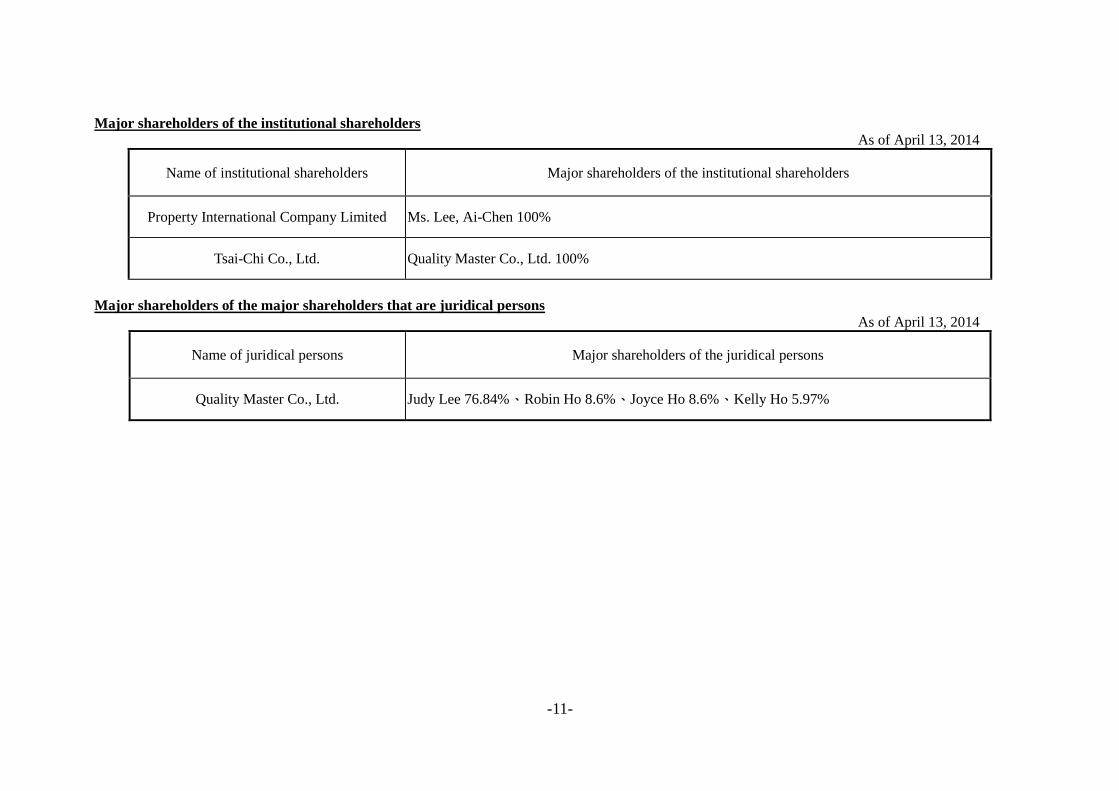
Major shareholders of the institutional shareholders
As of April 13, 2014
Name of institutional shareholders Major shareholders of the institutional shareholders
Property International Company Limited Ms. Lee, Ai-Chen 100%
Tsai-Chi Co., Ltd. Quality Master Co., Ltd. 100%
Major shareholders of the major shareholders that are juridical persons
As of April 13, 2014
Name of juridical persons Major shareholders of the juridical persons
Quality Master Co., Ltd. Judy Lee 76.84%、Robin Ho 8.6%、Joyce Ho 8.6%、Kelly Ho 5.97%
-12-
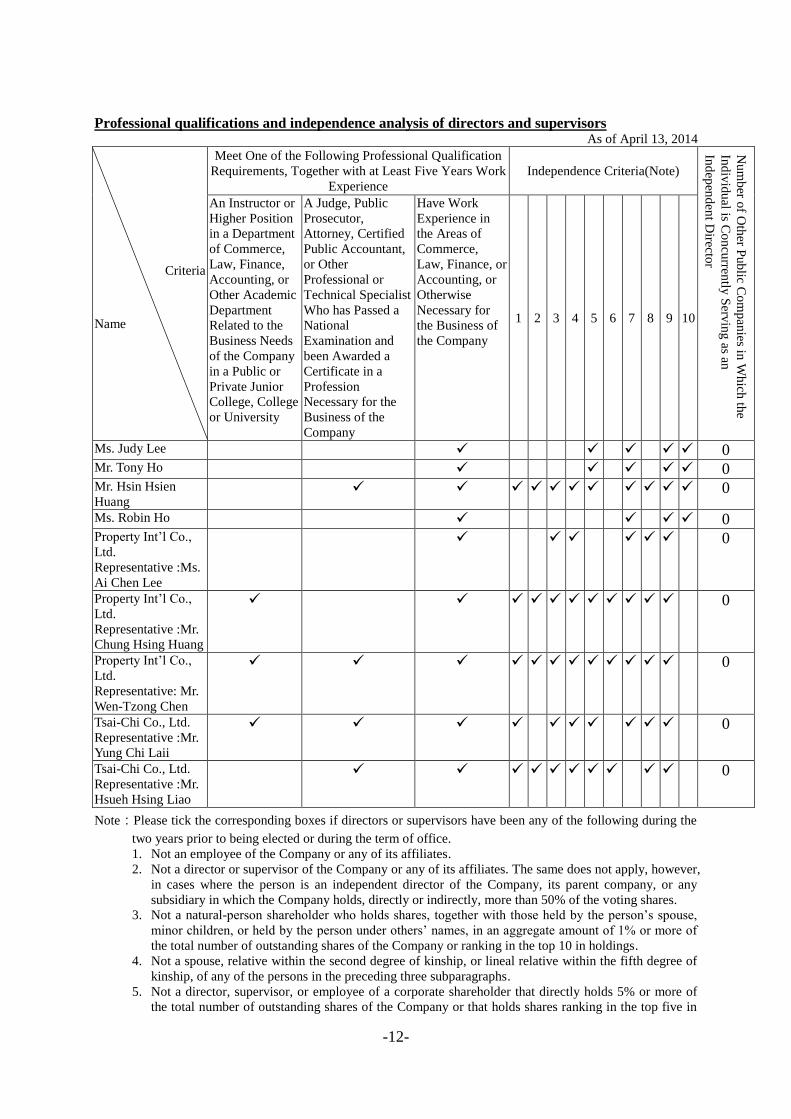
Professional qualifications and independence analysis of directors and supervisors As of April 13, 2014
Criteria
Name
Meet One of the Following Professional Qualification
Requirements, Together with at Least Five Years Work
Experience
Independence Criteria(Note)
Nu
mb
er of O
ther P
ub
lic Co
mp
anies in
Wh
ich th
e
Ind
ivid
ual is C
on
curren
tly S
ervin
g as an
Ind
epen
den
t Directo
r
An Instructor or
Higher Position
in a Department
of Commerce,
Law, Finance,
Accounting, or
Other Academic
Department
Related to the
Business Needs
of the Company
in a Public or
Private Junior
College, College
or University
A Judge, Public
Prosecutor,
Attorney, Certified
Public Accountant,
or Other
Professional or
Technical Specialist
Who has Passed a
National
Examination and
been Awarded a
Certificate in a
Profession
Necessary for the
Business of the
Company
Have Work
Experience in
the Areas of
Commerce,
Law, Finance, or
Accounting, or
Otherwise
Necessary for
the Business of
the Company
1 2 3 4 5 6 7 8 9 10
Ms. Judy Lee 0 Mr. Tony Ho 0 Mr. Hsin Hsien
Huang 0
Ms. Robin Ho 0 Property Int‘l Co.,
Ltd.
Representative :Ms.
Ai Chen Lee
0
Property Int‘l Co.,
Ltd.
Representative :Mr.
Chung Hsing Huang
0
Property Int‘l Co.,
Ltd.
Representative: Mr.
Wen-Tzong Chen
0
Tsai-Chi Co., Ltd.
Representative :Mr.
Yung Chi Laii
0
Tsai-Chi Co., Ltd.
Representative :Mr.
Hsueh Hsing Liao
0
Note:Please tick the corresponding boxes if directors or supervisors have been any of the following during the
two years prior to being elected or during the term of office.
1. Not an employee of the Company or any of its affiliates.
2. Not a director or supervisor of the Company or any of its affiliates. The same does not apply, however,
in cases where the person is an independent director of the Company, its parent company, or any
subsidiary in which the Company holds, directly or indirectly, more than 50% of the voting shares.
3. Not a natural-person shareholder who holds shares, together with those held by the person‘s spouse,
minor children, or held by the person under others‘ names, in an aggregate amount of 1% or more of
the total number of outstanding shares of the Company or ranking in the top 10 in holdings.
4. Not a spouse, relative within the second degree of kinship, or lineal relative within the fifth degree of
kinship, of any of the persons in the preceding three subparagraphs.
5. Not a director, supervisor, or employee of a corporate shareholder that directly holds 5% or more of
the total number of outstanding shares of the Company or that holds shares ranking in the top five in
-13-
holdings.
6. Not a director, supervisor, officer, or shareholder holding 5% or more of the share, of a specified
company or institution that has a financial or business relationship with the Company.
7. Not a professional individual who, or an owner, partner, director, supervisor, or officer of a sole
proprietorship, partnership, company, or institution that, provides commercial, legal, financial,
accounting services or consultation to the Company or to any affiliate of the Company, or a spouse
thereof.
8. Not having a marital relationship, or a relative within the second degree of kinship to any other
director of the Company.
9. Not been a person of any conditions defined in Article 30 of the Company Law.
10. Not a governmental, juridical person or its representative as defined in Article 27 of the Company
Law.
-14-
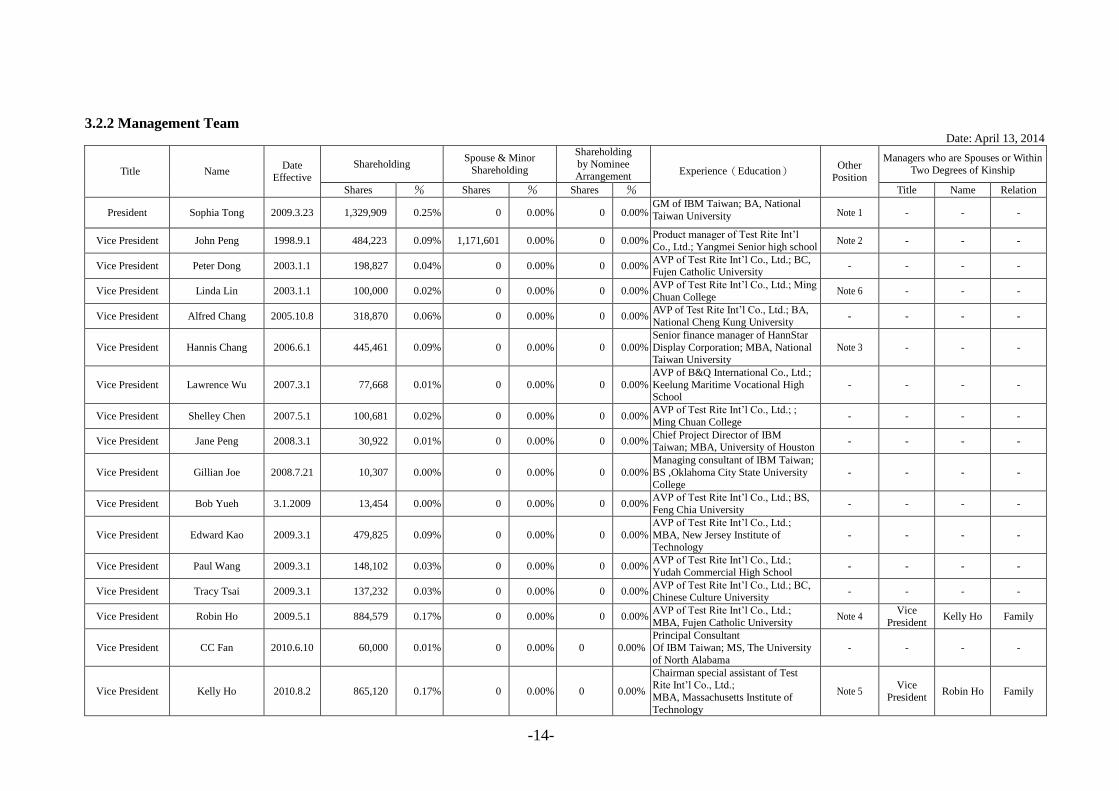
3.2.2 Management Team Date: April 13, 2014
Title Name Date
Effective
Shareholding Spouse & Minor
Shareholding
Shareholding
by Nominee Arrangement
Experience(Education) Other
Position
Managers who are Spouses or Within
Two Degrees of Kinship
Shares % Shares % Shares % Title Name Relation
President Sophia Tong 2009.3.23 1,329,909 0.25% 0 0.00% 0 0.00% GM of IBM Taiwan; BA, National
Taiwan University Note 1 - - -
Vice President John Peng 1998.9.1 484,223 0.09% 1,171,601 0.00% 0 0.00% Product manager of Test Rite Int‘l
Co., Ltd.; Yangmei Senior high school Note 2 - - -
Vice President Peter Dong 2003.1.1 198,827 0.04% 0 0.00% 0 0.00% AVP of Test Rite Int‘l Co., Ltd.; BC, Fujen Catholic University
- - - -
Vice President Linda Lin 2003.1.1 100,000 0.02% 0 0.00% 0 0.00% AVP of Test Rite Int‘l Co., Ltd.; Ming
Chuan College Note 6 - - -
Vice President Alfred Chang 2005.10.8 318,870 0.06% 0 0.00% 0 0.00% AVP of Test Rite Int‘l Co., Ltd.; BA,
National Cheng Kung University - - - -
Vice President Hannis Chang 2006.6.1 445,461 0.09% 0 0.00% 0 0.00%
Senior finance manager of HannStar
Display Corporation; MBA, National Taiwan University
Note 3 - - -
Vice President Lawrence Wu 2007.3.1 77,668 0.01% 0 0.00% 0 0.00%
AVP of B&Q International Co., Ltd.;
Keelung Maritime Vocational High School
- - - -
Vice President Shelley Chen 2007.5.1 100,681 0.02% 0 0.00% 0 0.00% AVP of Test Rite Int‘l Co., Ltd.; ;
Ming Chuan College - - - -
Vice President Jane Peng 2008.3.1 30,922 0.01% 0 0.00% 0 0.00% Chief Project Director of IBM Taiwan; MBA, University of Houston
- - - -
Vice President Gillian Joe 2008.7.21 10,307 0.00% 0 0.00% 0 0.00%
Managing consultant of IBM Taiwan;
BS ,Oklahoma City State University
College
- - - -
Vice President Bob Yueh 3.1.2009 13,454 0.00% 0 0.00% 0 0.00% AVP of Test Rite Int‘l Co., Ltd.; BS,
Feng Chia University - - - -
Vice President Edward Kao 2009.3.1 479,825 0.09% 0 0.00% 0 0.00%
AVP of Test Rite Int‘l Co., Ltd.;
MBA, New Jersey Institute of Technology
- - - -
Vice President Paul Wang 2009.3.1 148,102 0.03% 0 0.00% 0 0.00% AVP of Test Rite Int‘l Co., Ltd.;
Yudah Commercial High School - - - -
Vice President Tracy Tsai 2009.3.1 137,232 0.03% 0 0.00% 0 0.00% AVP of Test Rite Int‘l Co., Ltd.; BC, Chinese Culture University
- - - -
Vice President Robin Ho 2009.5.1 884,579 0.17% 0 0.00% 0 0.00% AVP of Test Rite Int‘l Co., Ltd.;
MBA, Fujen Catholic University Note 4
Vice
President Kelly Ho Family
Vice President CC Fan 2010.6.10 60,000 0.01% 0 0.00% 0 0.00%
Principal Consultant
Of IBM Taiwan; MS, The University
of North Alabama
- - - -
Vice President Kelly Ho 2010.8.2 865,120 0.17% 0 0.00% 0 0.00%
Chairman special assistant of Test Rite Int‘l Co., Ltd.;
MBA, Massachusetts Institute of
Technology
Note 5 Vice
President Robin Ho Family
-15-
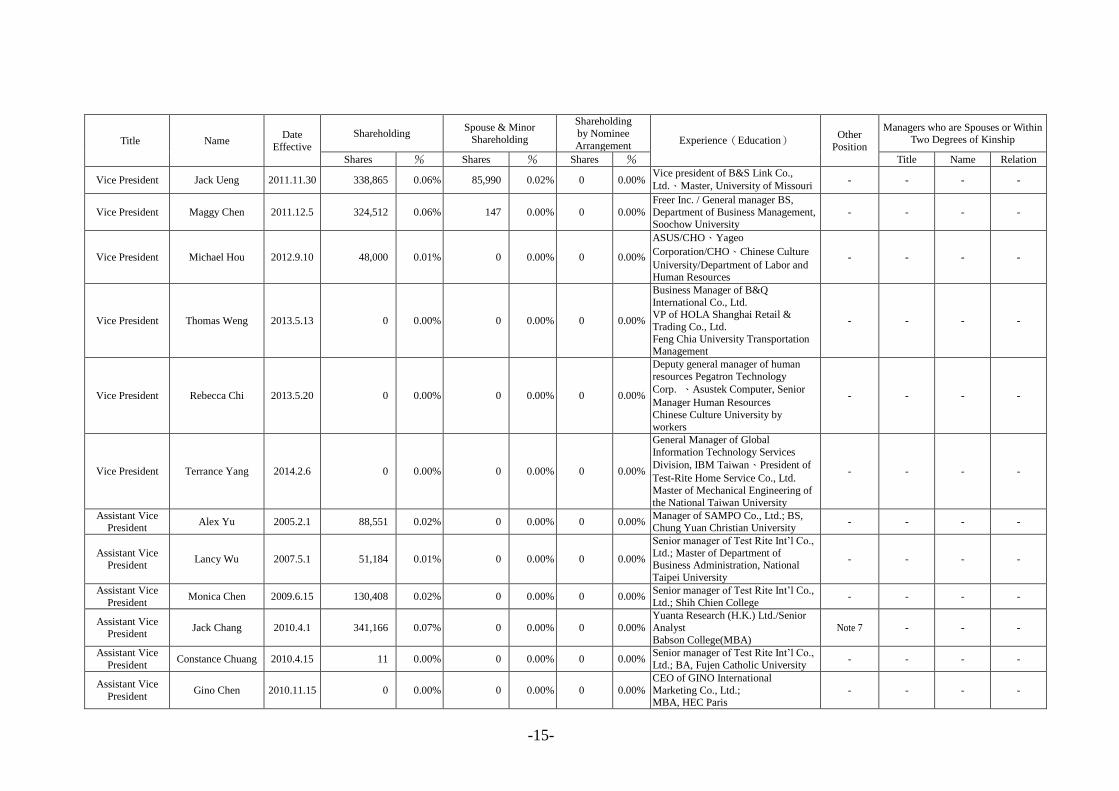
Title Name Date
Effective
Shareholding Spouse & Minor
Shareholding
Shareholding
by Nominee
Arrangement Experience(Education)
Other
Position
Managers who are Spouses or Within Two Degrees of Kinship
Shares % Shares % Shares % Title Name Relation
Vice President Jack Ueng 2011.11.30 338,865 0.06% 85,990 0.02% 0 0.00% Vice president of B&S Link Co.,
Ltd.、Master, University of Missouri - - - -
Vice President Maggy Chen 2011.12.5 324,512 0.06% 147 0.00% 0 0.00%
Freer Inc. / General manager BS,
Department of Business Management,
Soochow University
- - - -
Vice President Michael Hou 2012.9.10 48,000 0.01% 0 0.00% 0 0.00%
ASUS/CHO、Yageo
Corporation/CHO、Chinese Culture
University/Department of Labor and Human Resources
- - - -
Vice President Thomas Weng 2013.5.13 0 0.00% 0 0.00% 0 0.00%
Business Manager of B&Q
International Co., Ltd. VP of HOLA Shanghai Retail &
Trading Co., Ltd.
Feng Chia University Transportation Management
- - - -
Vice President Rebecca Chi 2013.5.20 0 0.00% 0 0.00% 0 0.00%
Deputy general manager of human
resources Pegatron Technology
Corp. 、Asustek Computer, Senior
Manager Human Resources
Chinese Culture University by
workers
- - - -
Vice President Terrance Yang 2014.2.6 0 0.00% 0 0.00% 0 0.00%
General Manager of Global
Information Technology Services
Division, IBM Taiwan、President of
Test-Rite Home Service Co., Ltd.
Master of Mechanical Engineering of
the National Taiwan University
- - - -
Assistant Vice President
Alex Yu 2005.2.1 88,551 0.02% 0 0.00% 0 0.00% Manager of SAMPO Co., Ltd.; BS, Chung Yuan Christian University
- - - -
Assistant Vice President
Lancy Wu 2007.5.1 51,184 0.01% 0 0.00% 0 0.00%
Senior manager of Test Rite Int‘l Co.,
Ltd.; Master of Department of Business Administration, National
Taipei University
- - - -
Assistant Vice
President Monica Chen 2009.6.15 130,408 0.02% 0 0.00% 0 0.00%
Senior manager of Test Rite Int‘l Co.,
Ltd.; Shih Chien College - - - -
Assistant Vice President
Jack Chang 2010.4.1 341,166 0.07% 0 0.00% 0 0.00%
Yuanta Research (H.K.) Ltd./Senior
Analyst
Babson College(MBA)
Note 7 - - -
Assistant Vice
President Constance Chuang 2010.4.15 11 0.00% 0 0.00% 0 0.00%
Senior manager of Test Rite Int‘l Co.,
Ltd.; BA, Fujen Catholic University - - - -
Assistant Vice
President Gino Chen 2010.11.15 0 0.00% 0 0.00% 0 0.00%
CEO of GINO International
Marketing Co., Ltd.; MBA, HEC Paris
- - - -
-16-
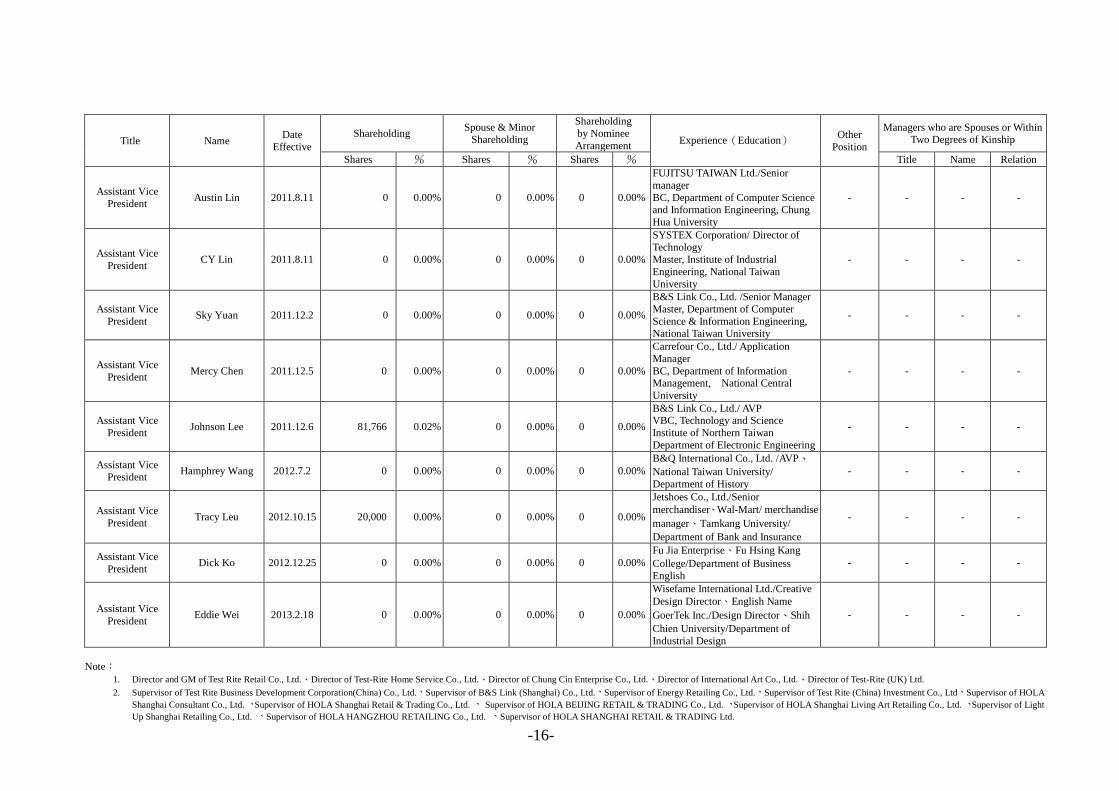
Title Name Date
Effective
Shareholding Spouse & Minor
Shareholding
Shareholding
by Nominee
Arrangement Experience(Education)
Other
Position
Managers who are Spouses or Within Two Degrees of Kinship
Shares % Shares % Shares % Title Name Relation
Assistant Vice
President Austin Lin 2011.8.11 0 0.00% 0 0.00% 0 0.00%
FUJITSU TAIWAN Ltd./Senior
manager
BC, Department of Computer Science and Information Engineering, Chung
Hua University
- - - -
Assistant Vice
President CY Lin 2011.8.11 0 0.00% 0 0.00% 0 0.00%
SYSTEX Corporation/ Director of
Technology Master, Institute of Industrial
Engineering, National Taiwan
University
- - - -
Assistant Vice
President Sky Yuan 2011.12.2 0 0.00% 0 0.00% 0 0.00%
B&S Link Co., Ltd. /Senior Manager
Master, Department of Computer
Science & Information Engineering, National Taiwan University
- - - -
Assistant Vice
President Mercy Chen 2011.12.5 0 0.00% 0 0.00% 0 0.00%
Carrefour Co., Ltd./ Application
Manager
BC, Department of Information Management, National Central
University
- - - -
Assistant Vice
President Johnson Lee 2011.12.6 81,766 0.02% 0 0.00% 0 0.00%
B&S Link Co., Ltd./ AVP VBC, Technology and Science
Institute of Northern Taiwan
Department of Electronic Engineering
- - - -
Assistant Vice President
Hamphrey Wang 2012.7.2 0 0.00% 0 0.00% 0 0.00%
B&Q International Co., Ltd. /AVP、
National Taiwan University/
Department of History
- - - -
Assistant Vice
President Tracy Leu 2012.10.15 20,000 0.00% 0 0.00% 0 0.00%
Jetshoes Co., Ltd./Senior
merchandiser、Wal-Mart/ merchandise
manager、Tamkang University/
Department of Bank and Insurance
- - - -
Assistant Vice
President Dick Ko 2012.12.25 0 0.00% 0 0.00% 0 0.00%
Fu Jia Enterprise、Fu Hsing Kang
College/Department of Business
English
- - - -
Assistant Vice
President Eddie Wei 2013.2.18 0 0.00% 0 0.00% 0 0.00%
Wisefame International Ltd./Creative
Design Director、English Name
GoerTek Inc./Design Director、Shih
Chien University/Department of
Industrial Design
- - - -
Note:
1. Director and GM of Test Rite Retail Co., Ltd.、Director of Test-Rite Home Service Co., Ltd.、Director of Chung Cin Enterprise Co., Ltd.、Director of International Art Co., Ltd.、Director of Test-Rite (UK) Ltd.
2. Supervisor of Test Rite Business Development Corporation(China) Co., Ltd.、Supervisor of B&S Link (Shanghai) Co., Ltd.、Supervisor of Energy Retailing Co., Ltd.、Supervisor of Test Rite (China) Investment Co., Ltd、Supervisor of HOLA
Shanghai Consultant Co., Ltd. 、Supervisor of HOLA Shanghai Retail & Trading Co., Ltd. 、 Supervisor of HOLA BEIJING RETAIL & TRADING Co., Ltd. 、Supervisor of HOLA Shanghai Living Art Retailing Co., Ltd. 、Supervisor of Light
Up Shanghai Retailing Co., Ltd. 、Supervisor of HOLA HANGZHOU RETAILING Co., Ltd. 、Supervisor of HOLA SHANGHAI RETAIL & TRADING Ltd.

-17-
3. Director of Test Rite Retail Co., Ltd.、Director of Test-Rite Home Service Co., Ltd.、Supervisor of Hola Home furnishings Co., Ltd. 、Supervisor of Homy Home furnishings Co., Ltd. 、Supervisor of Freer Inc. 、Supervisor of Chung Cin
Enterprise Co., Ltd. 、 Supervisor of B&S Link Co., Ltd. 、Supervisor of Lih Teh International Co., Ltd., 、Supervisor of Lih Chiou Co., Ltd. 、Supervisor of Fusion International Distribution Inc.、Supervisor of International Art Co., Ltd.
4. Director of Test Rite Int‘l Co., Ltd.、Director of Tong Lung Metal Industry Co., Ltd.、Director of Test Rite Retail Co., Ltd.、Director of Test-Rite Home Service Co., Ltd. 、Director of B&S Link Co., Ltd. 、 Director of Test Rite Business
Development Corporation (China) Co., Ltd.、Director of B&S Link (Shanghai) Co., Ltd.、Director of HOLA Shanghai Consultant Co., Ltd.、Director of HOLA Shanghai Retail & Trading Co., Ltd. 、Director of HOLA BEIJING RETAIL &
TRADING Co., Ltd.、Director of HOLA Shanghai Living Art Retailing Co., Ltd.、Director of Light Up Shanghai Retailing Co., Ltd.、Director of HOLA HANGZHOU RETAILING Co., Ltd. 、Director of HOLA SHANGHAI RETAIL &
TRADING Ltd. 、Director of Energy Retailing Co., Ltd.、Director of Test Rite (China) Investment Co., Ltd.、Director of Rollabind, LLC、Director of Test Rite Int'l (Australia) Pty.、Director of Test-Rite (UK) Ltd.、Director of CITYSOURCE
INC.、Director of Test Rite International (Thailand) Ltd.、Director of Rui Feng International Co., Ltd.、GM of Test-Rite International (U.S.)Co., Ltd.
5. Director of Test Rite Retail Co., Ltd.、Director of Hola Homefurnishings Co., Ltd.、Director of Homy Homefurnishings Co., Ltd.、Director of Freer Inc、Director of Test Rite Business Development Corporation (China) Co., Ltd. 、Director of
B&S Link (Shanghai) Co., Ltd.、Director of HOLA Shanghai Consultant Co., Ltd.、Director of HOLA Shanghai Retail & Trading Co., Ltd.、Director of HOLA BEIJING RETAIL & TRADING Co., Ltd.、Director of HOLA Shanghai Living Art
Retailing Co, Ltd.、Director of Light Up Shanghai Retailing Co., Ltd.、Director of HOLA HANGZHOU RETAILING Co., Ltd.、Director of HOLA SHANGHAI RETAIL & TRADING Ltd.、Director of Energy Retailing Co., Ltd.、Director of
Test Rite (China) Investment Co., Ltd.
6. Director of Lih Chiou Co., Ltd.、Director of Fusion International Distribution Inc.
7. Director of Lih Teh International Co., Ltd.
-18-
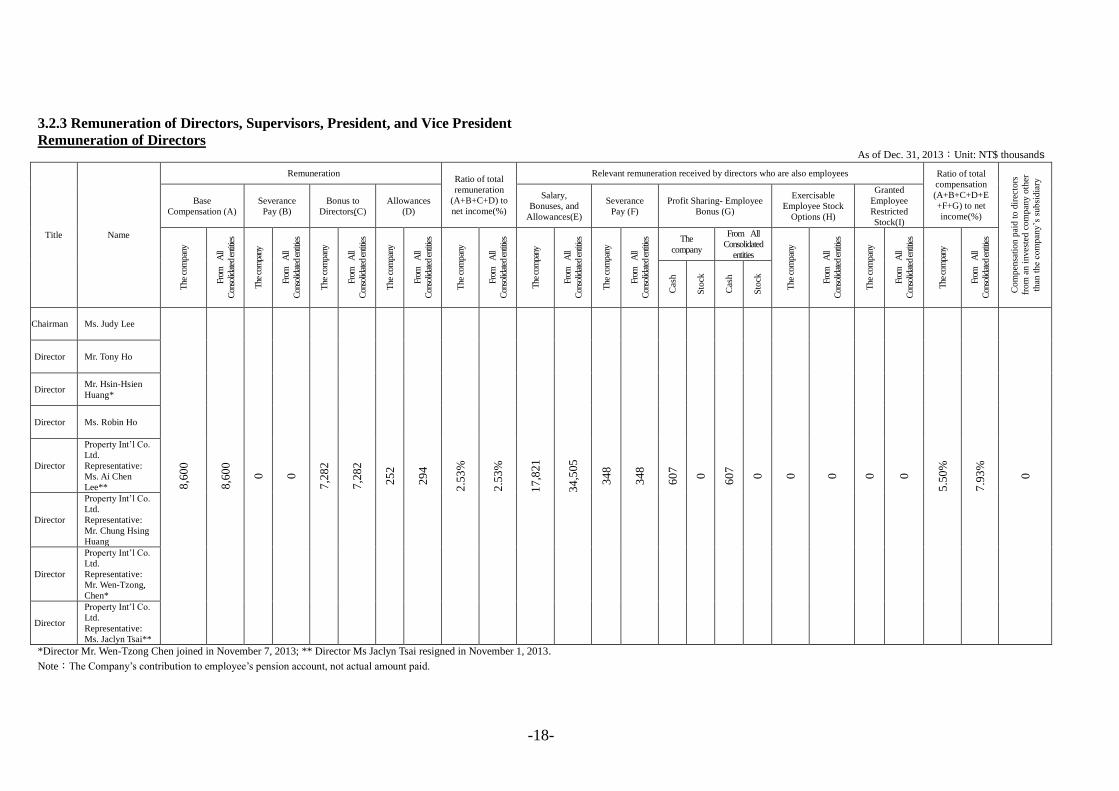
3.2.3 Remuneration of Directors, Supervisors, President, and Vice President
Remuneration of Directors As of Dec. 31, 2013:Unit: NT$ thousands
Title Name
Remuneration Ratio of total
remuneration
(A+B+C+D) to
net income(%)
Relevant remuneration received by directors who are also employees Ratio of total
compensation
(A+B+C+D+E
+F+G) to net
income(%)
Co
mp
ensa
tio
n p
aid
to
dir
ecto
rs
fro
m a
n i
nv
este
d c
om
pan
y o
ther
than
th
e co
mp
any
‘s s
ub
sid
iary
Base
Compensation (A)
Severance
Pay (B)
Bonus to
Directors(C)
Allowances
(D)
Salary,
Bonuses, and
Allowances(E)
Severance
Pay (F)
Profit Sharing- Employee
Bonus (G)
Exercisable
Employee Stock
Options (H)
Granted
Employee
Restricted
Stock(I)
The
com
pany
Fro
m
All
Con
solid
ated
ent
ities
The
com
pany
Fro
m
All
Con
solid
ated
ent
ities
The
com
pany
Fro
m
All
Con
solid
ated
ent
ities
The
com
pany
Fro
m
All
Con
solid
ated
ent
ities
The
com
pany
Fro
m
All
Con
solid
ated
ent
ities
The
com
pany
Fro
m
All
Con
solid
ated
ent
ities
The
com
pany
Fro
m
All
Con
solid
ated
ent
ities
The
company
From All
Consolidated
entities
The
com
pany
Fro
m
All
Con
solid
ated
ent
ities
The
com
pany
Fro
m
All
Con
solid
ated
ent
ities
The
com
pany
Fro
m
All
Con
solid
ated
ent
ities
Cas
h
Sto
ck
Cas
h
Sto
ck
Chairman Ms. Judy Lee
8,6
00
8,6
00
0
0
7,2
82
7,2
82
25
2
29
4
2.5
3%
2.5
3%
17
,821
34
,505
34
8
34
8
60
7
0
60
7
0
0
0
0
0
5.5
0%
7.9
3%
0
Director Mr. Tony Ho
Director Mr. Hsin-Hsien
Huang*
Director Ms. Robin Ho
Director
Property Int‘l Co.
Ltd.
Representative:
Ms. Ai Chen
Lee**
Director
Property Int‘l Co.
Ltd.
Representative:
Mr. Chung Hsing
Huang
Director
Property Int‘l Co.
Ltd.
Representative:
Mr. Wen-Tzong,
Chen*
Director
Property Int‘l Co.
Ltd.
Representative:
Ms. Jaclyn Tsai**
*Director Mr. Wen-Tzong Chen joined in November 7, 2013; ** Director Ms Jaclyn Tsai resigned in November 1, 2013.
Note:The Company‘s contribution to employee‘s pension account, not actual amount paid.
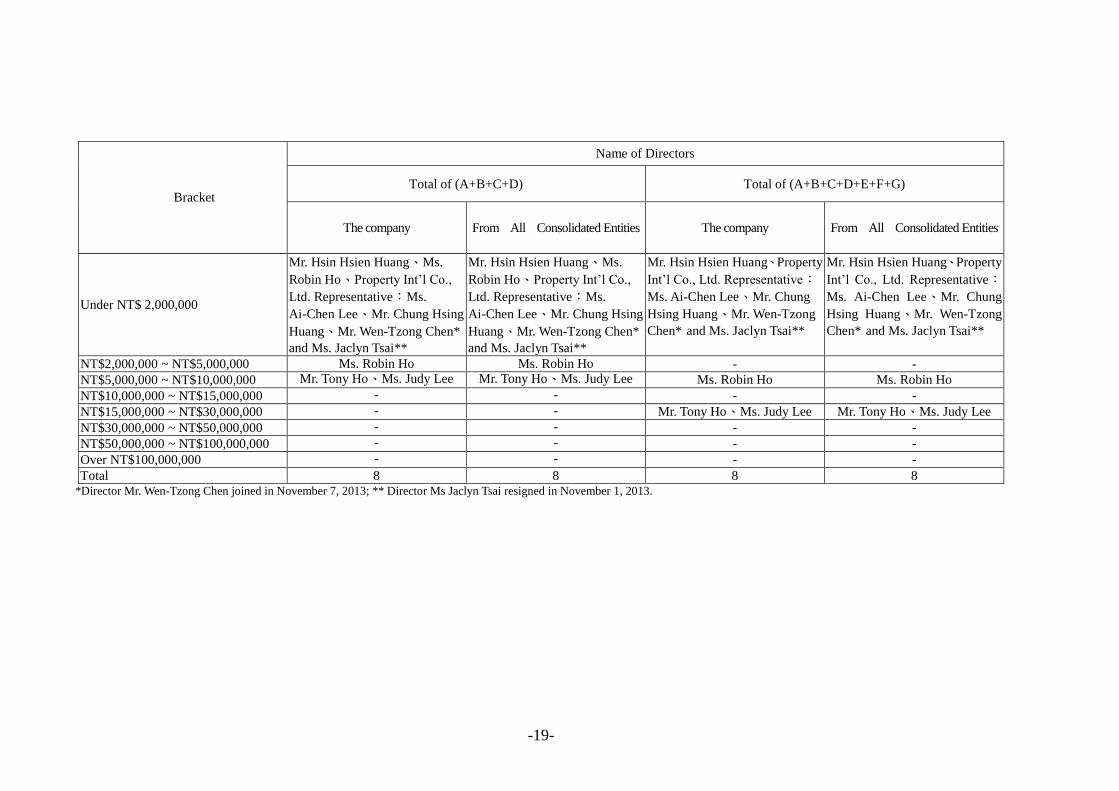
-19-
Bracket
Name of Directors
Total of (A+B+C+D) Total of (A+B+C+D+E+F+G)
The company From All Consolidated Entities The company From All Consolidated Entities
Under NT$ 2,000,000
Mr. Hsin Hsien Huang、Ms.
Robin Ho、Property Int‘l Co.,
Ltd. Representative:Ms.
Ai-Chen Lee、Mr. Chung Hsing
Huang、Mr. Wen-Tzong Chen* and Ms. Jaclyn Tsai**
Mr. Hsin Hsien Huang、Ms.
Robin Ho、Property Int‘l Co.,
Ltd. Representative:Ms.
Ai-Chen Lee、Mr. Chung Hsing
Huang、Mr. Wen-Tzong Chen* and Ms. Jaclyn Tsai**
Mr. Hsin Hsien Huang、Property
Int‘l Co., Ltd. Representative:
Ms. Ai-Chen Lee、Mr. Chung
Hsing Huang、Mr. Wen-Tzong
Chen* and Ms. Jaclyn Tsai**
Mr. Hsin Hsien Huang、Property
Int‘l Co., Ltd. Representative:
Ms. Ai-Chen Lee、Mr. Chung
Hsing Huang、Mr. Wen-Tzong
Chen* and Ms. Jaclyn Tsai**
NT$2,000,000 ~ NT$5,000,000 Ms. Robin Ho Ms. Robin Ho - -
NT$5,000,000 ~ NT$10,000,000 Mr. Tony Ho、Ms. Judy Lee Mr. Tony Ho、Ms. Judy Lee Ms. Robin Ho Ms. Robin Ho
NT$10,000,000 ~ NT$15,000,000 - - - -
NT$15,000,000 ~ NT$30,000,000 - - Mr. Tony Ho、Ms. Judy Lee Mr. Tony Ho、Ms. Judy Lee
NT$30,000,000 ~ NT$50,000,000 - - - -
NT$50,000,000 ~ NT$100,000,000 - - - -
Over NT$100,000,000 - - - -
Total 8 8 8 8 *Director Mr. Wen-Tzong Chen joined in November 7, 2013; ** Director Ms Jaclyn Tsai resigned in November 1, 2013.

-20-
Remuneration of Supervisors As of Dec. 31, 2013; Unit: NT$ thousands
Title Name
Remuneration Ratio of total remuneration
(A+B+C) to net income
(%)
Compensation
paid to
supervisors
from an
invested
company other
than the
company‘s
subsidiary
Base Compensation(A) Bonus to Supervisors(B) Allowances(C)
The
company
From All
Consolidated
entities
The
company
From All
Consolidated
entities
The
company
From All
Consolidated
entities
The
company
From All
Consolidated
entities
Supervisor
Tsai-Chi Co., Ltd.
Representative:
Mr. Yung Chi Lai 0 1,500 2,760 2,760 108 258 0.45% 0.71% 0
Supervisor
Tsai-Chi Co., Ltd.
Representative:
Mr. Hsueh Hsing Liao
Bracket
Name of Supervisors
Total of (A+B+C)
The company From All Consolidated entities
Under NT$ 2,000,000 - -
NT$2,000,000 ~ NT$5,000,000 Tsai-Chi Co., Ltd. Representative:
Mr. Yung Chi Lai、Mr. Hsueh Hsing Liao
Tsai-Chi Co., Ltd. Representative:
Mr. Yung Chi Lai、Mr. Hsueh Hsing Liao
NT$5,000,000 ~ NT$10,000,000 - -
NT$10,000,000 ~ NT$15,000,000 - -
NT$15,000,000 ~ NT$30,000,000 - -
NT$30,000,000 ~ NT$50,000,000 - -
NT$50,000,000 ~ NT$100,000,000 - -
Over NT$100,000,000 - -
Total 2 2
-21-
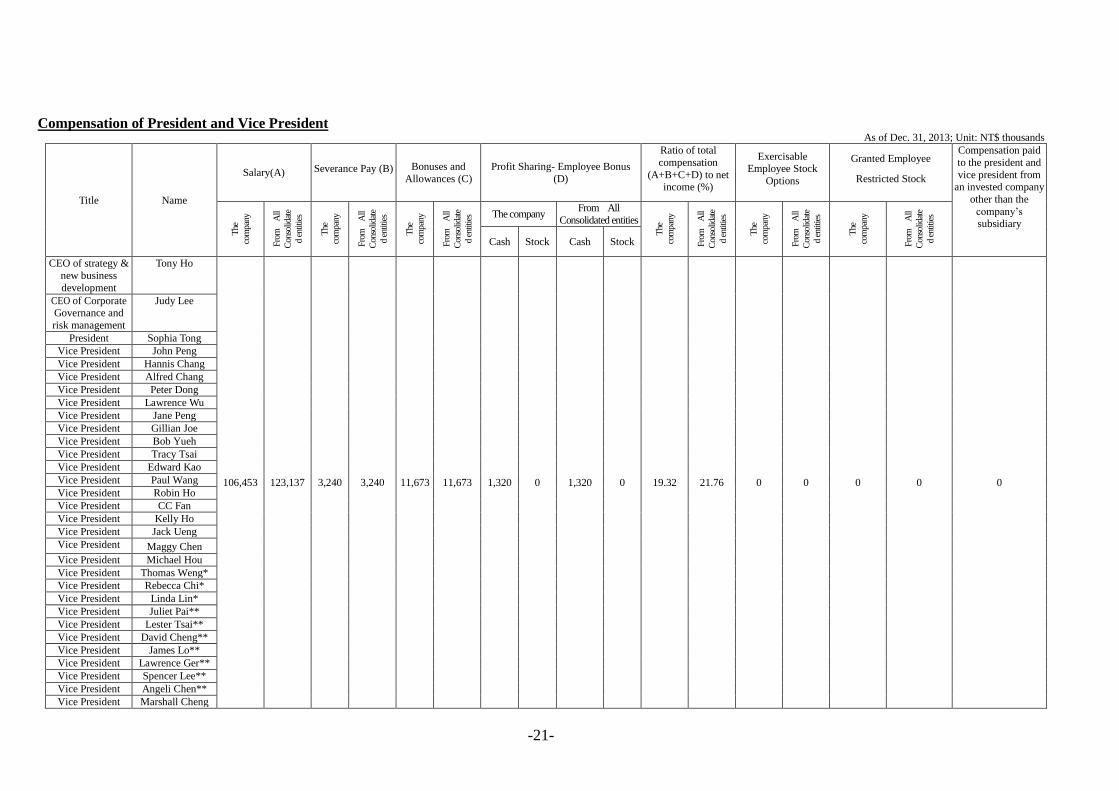
Compensation of President and Vice President As of Dec. 31, 2013; Unit: NT$ thousands
Title Name
Salary(A) Severance Pay (B) Bonuses and
Allowances (C)
Profit Sharing- Employee Bonus
(D)
Ratio of total
compensation
(A+B+C+D) to net income (%)
Exercisable Employee Stock
Options
Granted Employee
Restricted Stock
Compensation paid
to the president and
vice president from an invested company
other than the
company‘s
subsidiary T
he
com
pany
Fro
m
All
Con
solid
ate
d en
titie
s
The
com
pany
Fro
m
All
Con
solid
ate
d en
titie
s
The
com
pany
Fro
m
All
Con
solid
ate
d en
titie
s The company From All
Consolidated entities
The
com
pany
Fro
m
All
Con
solid
ate
d en
titie
s
The
com
pany
Fro
m
All
Con
solid
ate
d en
titie
s
The
com
pany
Fro
m
All
Con
solid
ate
d en
titie
s
Cash Stock Cash Stock
CEO of strategy &
new business
development
Tony Ho
106,453 123,137 3,240 3,240 11,673 11,673 1,320 0 1,320 0 19.32 21.76 0 0 0 0 0
CEO of Corporate Governance and
risk management
Judy Lee
President Sophia Tong
Vice President John Peng
Vice President Hannis Chang
Vice President Alfred Chang
Vice President Peter Dong
Vice President Lawrence Wu
Vice President Jane Peng
Vice President Gillian Joe
Vice President Bob Yueh
Vice President Tracy Tsai
Vice President Edward Kao
Vice President Paul Wang
Vice President Robin Ho
Vice President CC Fan
Vice President Kelly Ho
Vice President Jack Ueng
Vice President Maggy Chen
Vice President Michael Hou
Vice President Thomas Weng*
Vice President Rebecca Chi*
Vice President Linda Lin*
Vice President Juliet Pai**
Vice President Lester Tsai**
Vice President David Cheng**
Vice President James Lo**
Vice President Lawrence Ger**
Vice President Spencer Lee**
Vice President Angeli Chen**
Vice President Marshall Cheng
-22-
*VP Thmas Weng and Rebecca Chi joined in May 2013; Linda Lin promoted in October 2013.
**VP Angeli Chen resigned in January 2013; VP Spencer Lee resigned in February 2013; VP Lawrence Ger resigned and James Lo resigned in May 2013; VP Lester Tsai and David Cheng resigned in August, 2013.
Juliet Pai transferred in December 2013, Marshall Cheng resigned in May, 2014.
Note:The Company‘s contribution to employee‘s pension account, not actual amount paid.
-23-
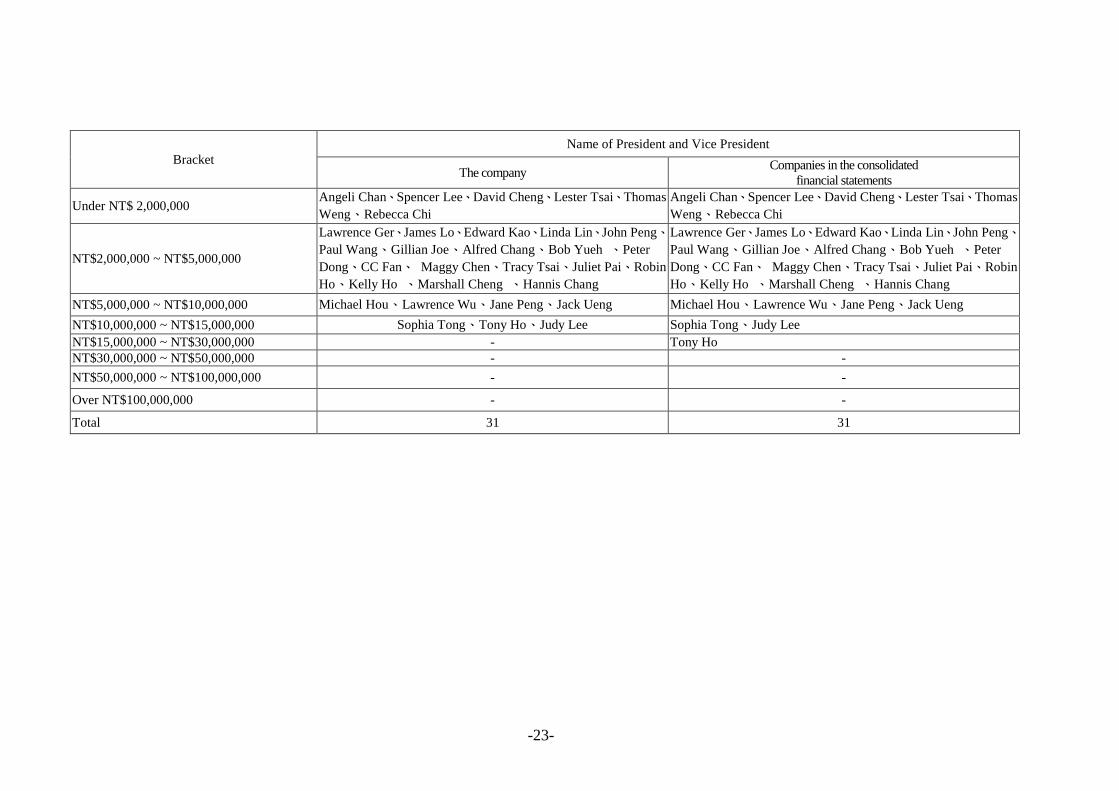
Bracket
Name of President and Vice President
The company Companies in the consolidated
financial statements
Under NT$ 2,000,000 Angeli Chan、Spencer Lee、David Cheng、Lester Tsai、Thomas
Weng、Rebecca Chi
Angeli Chan、Spencer Lee、David Cheng、Lester Tsai、Thomas
Weng、Rebecca Chi
NT$2,000,000 ~ NT$5,000,000
Lawrence Ger、James Lo、Edward Kao、Linda Lin、John Peng、
Paul Wang、Gillian Joe、Alfred Chang、Bob Yueh 、Peter
Dong、CC Fan、 Maggy Chen、Tracy Tsai、Juliet Pai、Robin
Ho、Kelly Ho 、Marshall Cheng 、Hannis Chang
Lawrence Ger、James Lo、Edward Kao、Linda Lin、John Peng、
Paul Wang、Gillian Joe、Alfred Chang、Bob Yueh 、Peter
Dong、CC Fan、 Maggy Chen、Tracy Tsai、Juliet Pai、Robin
Ho、Kelly Ho 、Marshall Cheng 、Hannis Chang
NT$5,000,000 ~ NT$10,000,000 Michael Hou、Lawrence Wu、Jane Peng、Jack Ueng Michael Hou、Lawrence Wu、Jane Peng、Jack Ueng
NT$10,000,000 ~ NT$15,000,000 Sophia Tong、Tony Ho、Judy Lee Sophia Tong、Judy Lee
NT$15,000,000 ~ NT$30,000,000 - Tony Ho
NT$30,000,000 ~ NT$50,000,000 - -
NT$50,000,000 ~ NT$100,000,000 - -
Over NT$100,000,000 - -
Total 31 31
-24-
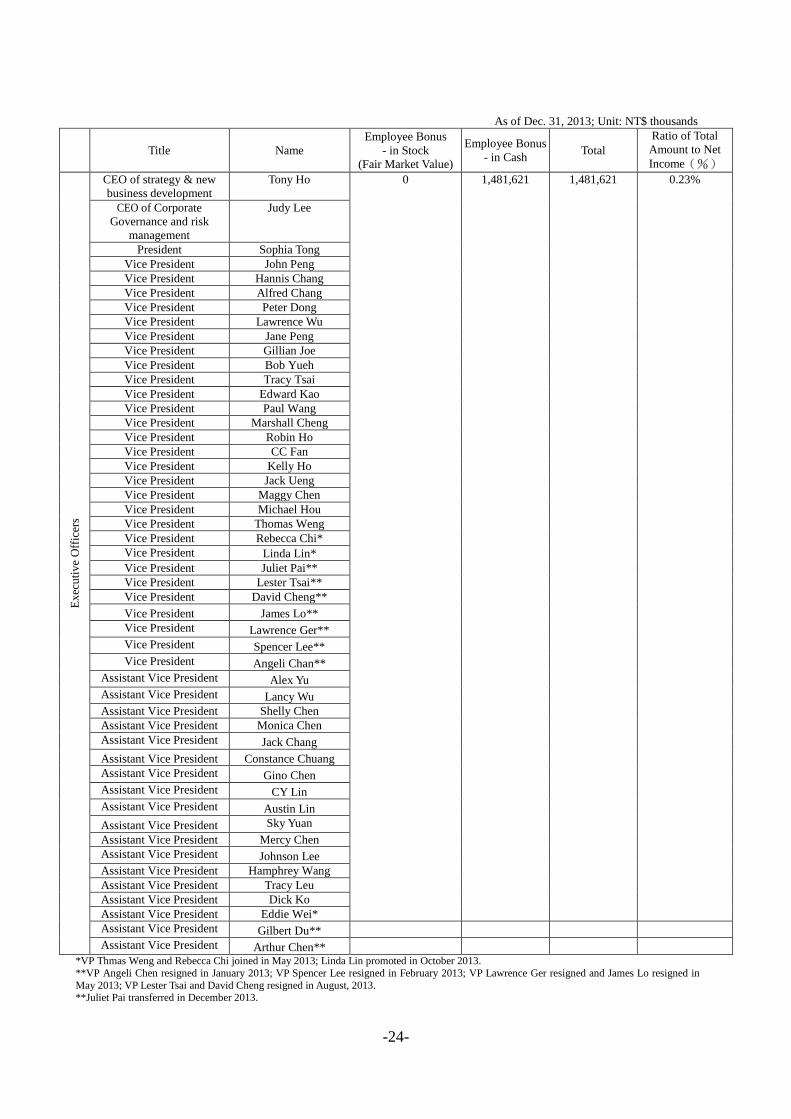
As of Dec. 31, 2013; Unit: NT$ thousands
Title Name
Employee Bonus
- in Stock
(Fair Market Value)
Employee Bonus
- in Cash Total
Ratio of Total
Amount to Net
Income(%)
Ex
ecu
tiv
e O
ffic
ers
CEO of strategy & new
business development
Tony Ho 0 1,481,621 1,481,621 0.23%
CEO of Corporate
Governance and risk
management
Judy Lee
President Sophia Tong
Vice President John Peng
Vice President Hannis Chang
Vice President Alfred Chang
Vice President Peter Dong
Vice President Lawrence Wu
Vice President Jane Peng
Vice President Gillian Joe
Vice President Bob Yueh
Vice President Tracy Tsai
Vice President Edward Kao
Vice President Paul Wang
Vice President Marshall Cheng
Vice President Robin Ho
Vice President CC Fan
Vice President Kelly Ho
Vice President Jack Ueng
Vice President Maggy Chen
Vice President Michael Hou
Vice President Thomas Weng
Vice President Rebecca Chi*
Vice President Linda Lin*
Vice President Juliet Pai**
Vice President Lester Tsai**
Vice President David Cheng**
Vice President James Lo**
Vice President Lawrence Ger**
Vice President Spencer Lee**
Vice President Angeli Chan**
Assistant Vice President Alex Yu
Assistant Vice President Lancy Wu
Assistant Vice President Shelly Chen
Assistant Vice President Monica Chen
Assistant Vice President Jack Chang
Assistant Vice President Constance Chuang
Assistant Vice President Gino Chen
Assistant Vice President CY Lin
Assistant Vice President Austin Lin
Assistant Vice President Sky Yuan
Assistant Vice President Mercy Chen
Assistant Vice President Johnson Lee
Assistant Vice President Hamphrey Wang
Assistant Vice President Tracy Leu
Assistant Vice President Dick Ko
Assistant Vice President Eddie Wei*
Assistant Vice President Gilbert Du**
Assistant Vice President Arthur Chen**
*VP Thmas Weng and Rebecca Chi joined in May 2013; Linda Lin promoted in October 2013.
**VP Angeli Chen resigned in January 2013; VP Spencer Lee resigned in February 2013; VP Lawrence Ger resigned and James Lo resigned in
May 2013; VP Lester Tsai and David Cheng resigned in August, 2013.
**Juliet Pai transferred in December 2013.
-25-
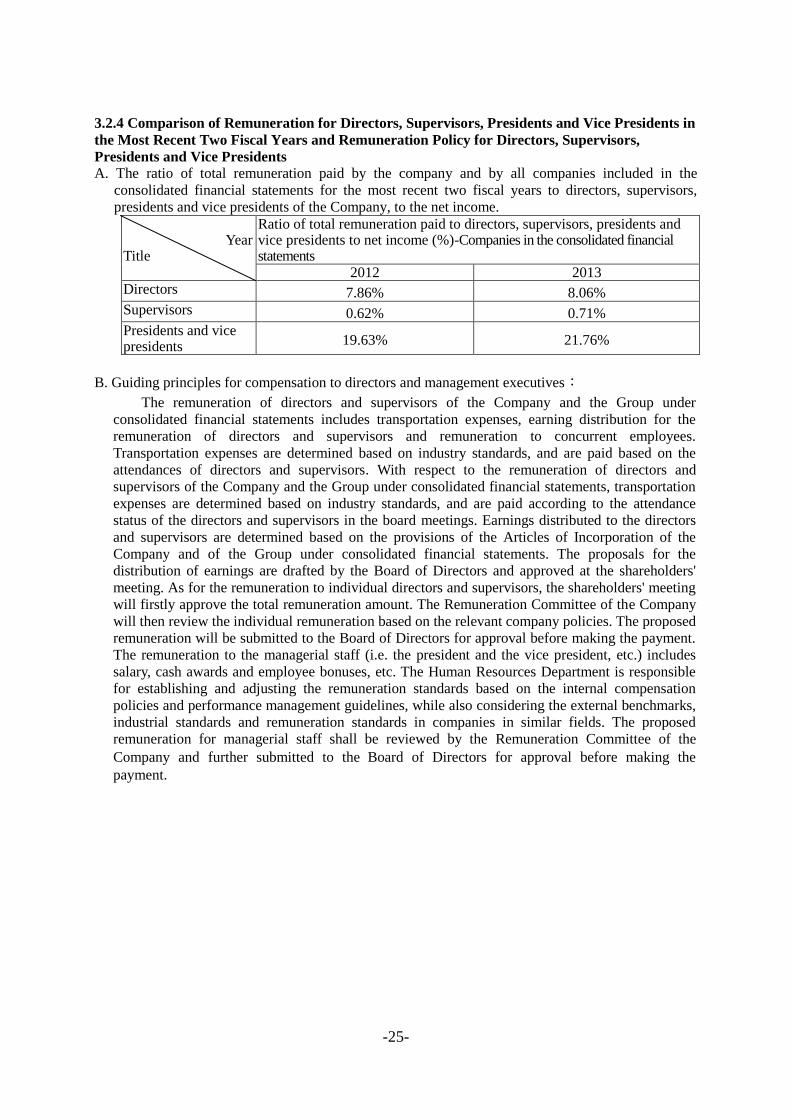
3.2.4 Comparison of Remuneration for Directors, Supervisors, Presidents and Vice Presidents in
the Most Recent Two Fiscal Years and Remuneration Policy for Directors, Supervisors,
Presidents and Vice Presidents
A. The ratio of total remuneration paid by the company and by all companies included in the
consolidated financial statements for the most recent two fiscal years to directors, supervisors,
presidents and vice presidents of the Company, to the net income.
Year
Title
Ratio of total remuneration paid to directors, supervisors, presidents and vice presidents to net income (%)-Companies in the consolidated financial statements
2012 2013 Directors 7.86% 8.06%
Supervisors 0.62% 0.71%
Presidents and vice presidents 19.63% 21.76%
B. Guiding principles for compensation to directors and management executives:
The remuneration of directors and supervisors of the Company and the Group under
consolidated financial statements includes transportation expenses, earning distribution for the
remuneration of directors and supervisors and remuneration to concurrent employees.
Transportation expenses are determined based on industry standards, and are paid based on the
attendances of directors and supervisors. With respect to the remuneration of directors and
supervisors of the Company and the Group under consolidated financial statements, transportation
expenses are determined based on industry standards, and are paid according to the attendance
status of the directors and supervisors in the board meetings. Earnings distributed to the directors
and supervisors are determined based on the provisions of the Articles of Incorporation of the
Company and of the Group under consolidated financial statements. The proposals for the
distribution of earnings are drafted by the Board of Directors and approved at the shareholders'
meeting. As for the remuneration to individual directors and supervisors, the shareholders' meeting
will firstly approve the total remuneration amount. The Remuneration Committee of the Company
will then review the individual remuneration based on the relevant company policies. The proposed
remuneration will be submitted to the Board of Directors for approval before making the payment.
The remuneration to the managerial staff (i.e. the president and the vice president, etc.) includes
salary, cash awards and employee bonuses, etc. The Human Resources Department is responsible
for establishing and adjusting the remuneration standards based on the internal compensation
policies and performance management guidelines, while also considering the external benchmarks,
industrial standards and remuneration standards in companies in similar fields. The proposed
remuneration for managerial staff shall be reviewed by the Remuneration Committee of the
Company and further submitted to the Board of Directors for approval before making the
payment.
-26-
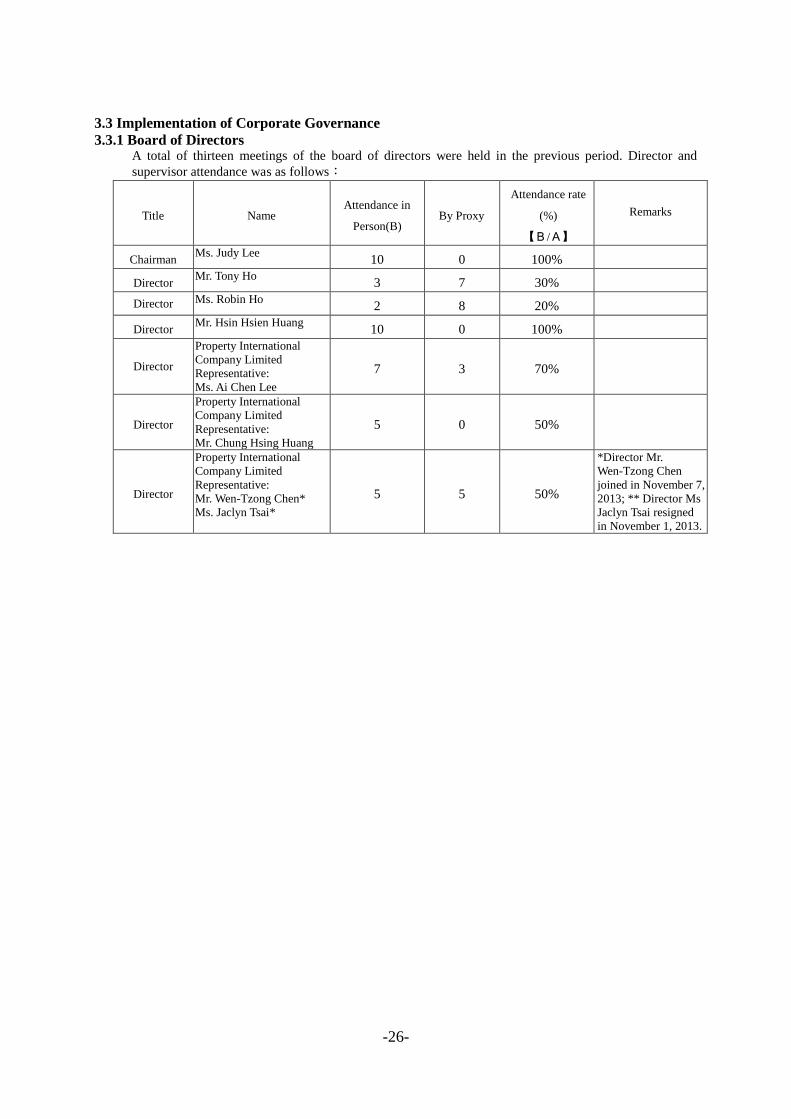
3.3 Implementation of Corporate Governance
3.3.1 Board of Directors A total of thirteen meetings of the board of directors were held in the previous period. Director and
supervisor attendance was as follows:
Title Name Attendance in
Person(B) By Proxy
Attendance rate
(%)
【B/A】
Remarks
Chairman Ms. Judy Lee
10 0 100%
Director Mr. Tony Ho
3 7 30%
Director Ms. Robin Ho 2 8 20%
Director Mr. Hsin Hsien Huang
10 0 100%
Director
Property International
Company Limited
Representative:
Ms. Ai Chen Lee
7 3 70%
Director
Property International
Company Limited
Representative:
Mr. Chung Hsing Huang
5 0 50%
Director
Property International
Company Limited
Representative:
Mr. Wen-Tzong Chen*
Ms. Jaclyn Tsai*
5 5 50%
*Director Mr.
Wen-Tzong Chen
joined in November 7,
2013; ** Director Ms
Jaclyn Tsai resigned
in November 1, 2013.

-27-
Title Name Attendance in
Person(B) By Proxy
Attendance rate
(%)
【B/A】
Remarks
Other notable items:
1. If there are the circumstances referred to in Article 14-3 of Securities and Exchange Act and resolutions of the directors‘
meetings objected to by Independent Directors or subject to qualified opinion and recorded or declared in writing, the
dates of meetings, sessions, contents of motions, all independents‘ opinion and the Company‘s response to independent
directors‘ opinion should be specified:None
2. If there is Directors‘ avoidance of motions in conflict of interest, the Directors‘ names, contents of motions, causes for
avoidance and voting should be specified:
Name of director Content of proposal Reason for abstention from
voting participation
The result for each
motion
Ms. Judy Lee, Mr.
Tony Ho and Ms.
Robin Ho
Discussion on the Company‘s
managers' Performance bonus
distribution proposal for fiscal year
2012.
Because Chairwoman Judy
Lee, Director Tony Ho and
Director Robin Ho act as
managers of the Company, the
said director shall recues
himself/herself from the
voting, to avoid conflicts of
interest.
The proposal has been
unanimously agreed by
other attending
directors.
All directors Discussion on the Company‘s
directors' and supervisors'
remuneration distribution proposal
for fiscal year 2012.
When the board is reviewing
the remuneration proposal of
any individual director, the
said director shall recues
himself/herself from the
voting, to avoid conflicts of
interest.
The proposal has been
unanimously agreed by
other attending
directors.
Mr. Hsin Hsien
Huang
Discussion on the appointing the
Company‘s Remuneration
Committee member.
Director Hsin Hsien Huang is
nominated candidates for the
Company's Remuneration
Committee member.
The proposal has been
unanimously agreed by
other attending
directors.
Ms. Judy Lee, Mr.
Tony Ho and Ms.
Robin Ho
Discussion on the Company‘s
managers' Employee bonus
distribution proposal for fiscal year
2012 and annual bonus for 2013.
Because Chairwoman Judy
Lee, Director Tony Ho and
Director Robin Ho act as
managers of the Company, the
said director shall recues
himself/herself from the
voting, to avoid conflicts of
interest.
The proposal has been
unanimously agreed by
other attending
directors.
3.Measures taken to strengthen the functionality of the Board:
(1) The board approved the ―Rules and Procedures Governing Board of Directors‘ Meetings,‖ which was modeled after the ―Regulations Governing Procedures for Meetings of Listed Companies‘ Board of Directors.‖ The Company announces on
the Market Observation Post System (MOPS) the attendance records of the monthly board meetings, as well as any
significant information resolved in the board meetings.
(2) The company carried out a project manager in charge of arrangements for reporting to the Board of Directors on the status of
implementation of development strategies for Test Rite Group.
(3) The Board of Directors of the Company has, on August 16, 2011, established the Organizational Regulations of the
Remuneration Committee. On December 21 of the same year, the Board also resolved the establishment of the Remuneration Committee and appointed the committee members for the first year. On June 18, 2012, the Board approved the appointment
of the second Remuneration Committee members, who are required to exercise the due care of good administrators and
faithfully fulfill their responsibilities in accordance with the Organizational Regulations.
(4) Provided in accordance with the Regulations Governing the Appointment and Exercise of Powers by the Remuneration
Committee of a Company Whose Stock is Listed on the Stock Exchange or Traded Over the Counter, Mr. Hsin Hsien Huang
expiration of the term dismissal on March 19, 2014. Board of Directors Executive Committee fill Mr. Huang Kuo-Shih served a term with the second session of the Remuneration Committee on March 25, 2014.
(5) To effectively increase its information transparency and fulfill its corporate governance obligations, the Company has sufficiently disclosed various business and financial information on its annual report, company website and the MOPS. To
enhance the function of the Board of Directors, the Company also encourages the directors and supervisors to participate in
various corporate governance courses arranged by the Company each year.
-28-
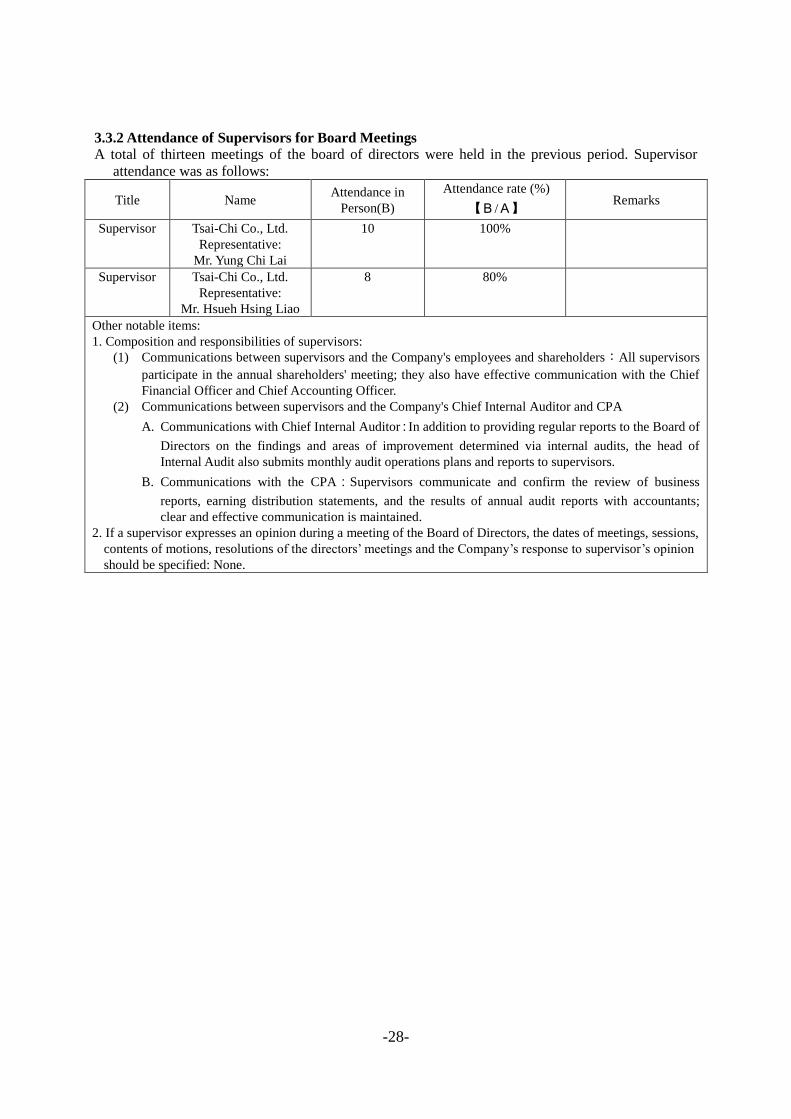
3.3.2 Attendance of Supervisors for Board Meetings
A total of thirteen meetings of the board of directors were held in the previous period. Supervisor
attendance was as follows:
Title Name Attendance in
Person(B)
Attendance rate (%)
【B/A】 Remarks
Supervisor Tsai-Chi Co., Ltd.
Representative:
Mr. Yung Chi Lai
10 100%
Supervisor Tsai-Chi Co., Ltd.
Representative:
Mr. Hsueh Hsing Liao
8 80%
Other notable items:
1. Composition and responsibilities of supervisors:
(1) Communications between supervisors and the Company's employees and shareholders:All supervisors
participate in the annual shareholders' meeting; they also have effective communication with the Chief
Financial Officer and Chief Accounting Officer.
(2) Communications between supervisors and the Company's Chief Internal Auditor and CPA
A. Communications with Chief Internal Auditor:In addition to providing regular reports to the Board of
Directors on the findings and areas of improvement determined via internal audits, the head of
Internal Audit also submits monthly audit operations plans and reports to supervisors.
B. Communications with the CPA:Supervisors communicate and confirm the review of business
reports, earning distribution statements, and the results of annual audit reports with accountants;
clear and effective communication is maintained.
2. If a supervisor expresses an opinion during a meeting of the Board of Directors, the dates of meetings, sessions,
contents of motions, resolutions of the directors‘ meetings and the Company‘s response to supervisor‘s opinion
should be specified: None.
-29-
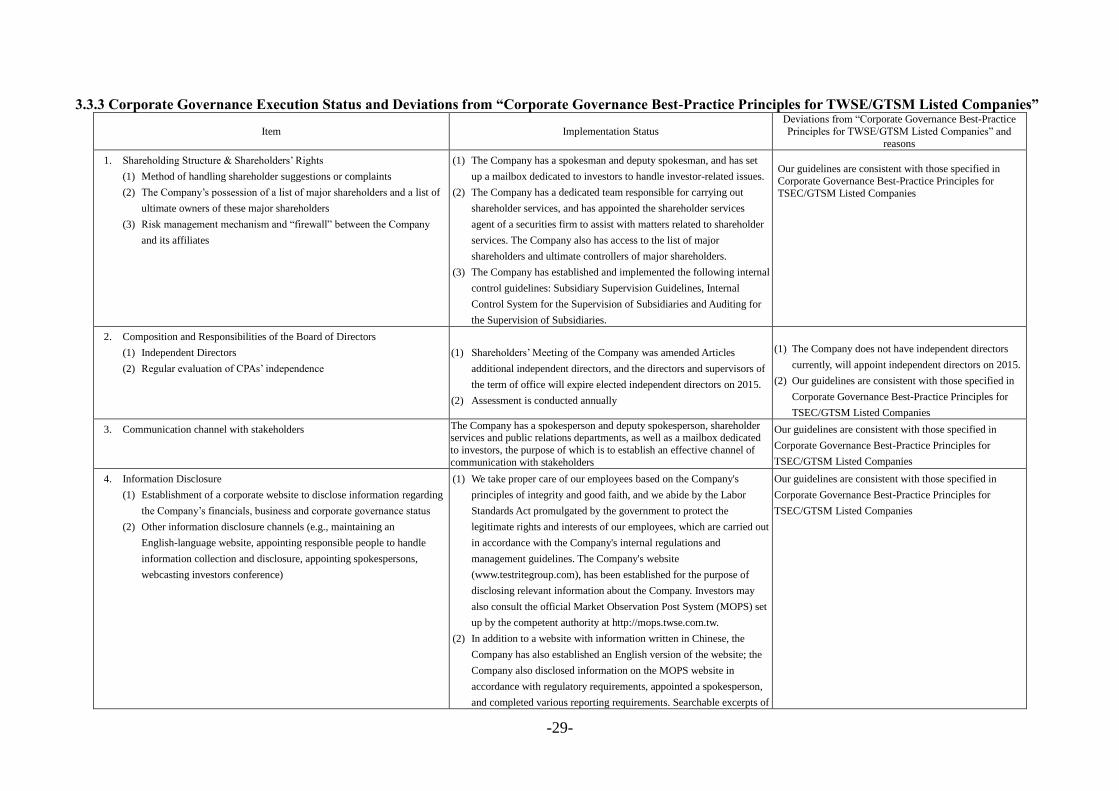
3.3.3 Corporate Governance Execution Status and Deviations from “Corporate Governance Best-Practice Principles for TWSE/GTSM Listed Companies”
Item Implementation Status
Deviations from ―Corporate Governance Best-Practice
Principles for TWSE/GTSM Listed Companies‖ and
reasons
1. Shareholding Structure & Shareholders‘ Rights
(1) Method of handling shareholder suggestions or complaints
(2) The Company‘s possession of a list of major shareholders and a list of
ultimate owners of these major shareholders
(3) Risk management mechanism and ―firewall‖ between the Company
and its affiliates
(1) The Company has a spokesman and deputy spokesman, and has set
up a mailbox dedicated to investors to handle investor-related issues.
(2) The Company has a dedicated team responsible for carrying out
shareholder services, and has appointed the shareholder services
agent of a securities firm to assist with matters related to shareholder
services. The Company also has access to the list of major
shareholders and ultimate controllers of major shareholders.
(3) The Company has established and implemented the following internal
control guidelines: Subsidiary Supervision Guidelines, Internal
Control System for the Supervision of Subsidiaries and Auditing for
the Supervision of Subsidiaries.
Our guidelines are consistent with those specified in
Corporate Governance Best-Practice Principles for
TSEC/GTSM Listed Companies
2. Composition and Responsibilities of the Board of Directors
(1) Independent Directors
(2) Regular evaluation of CPAs‘ independence
(1) Shareholders‘ Meeting of the Company was amended Articles
additional independent directors, and the directors and supervisors of
the term of office will expire elected independent directors on 2015.
(2) Assessment is conducted annually
(1) The Company does not have independent directors
currently, will appoint independent directors on 2015.
(2) Our guidelines are consistent with those specified in
Corporate Governance Best-Practice Principles for
TSEC/GTSM Listed Companies
3. Communication channel with stakeholders The Company has a spokesperson and deputy spokesperson, shareholder services and public relations departments, as well as a mailbox dedicated
to investors, the purpose of which is to establish an effective channel of
communication with stakeholders
Our guidelines are consistent with those specified in
Corporate Governance Best-Practice Principles for
TSEC/GTSM Listed Companies
4. Information Disclosure
(1) Establishment of a corporate website to disclose information regarding
the Company‘s financials, business and corporate governance status
(2) Other information disclosure channels (e.g., maintaining an
English-language website, appointing responsible people to handle
information collection and disclosure, appointing spokespersons,
webcasting investors conference)
(1) We take proper care of our employees based on the Company's
principles of integrity and good faith, and we abide by the Labor
Standards Act promulgated by the government to protect the
legitimate rights and interests of our employees, which are carried out
in accordance with the Company's internal regulations and
management guidelines. The Company's website
(www.testritegroup.com), has been established for the purpose of
disclosing relevant information about the Company. Investors may
also consult the official Market Observation Post System (MOPS) set
up by the competent authority at http://mops.twse.com.tw.
(2) In addition to a website with information written in Chinese, the
Company has also established an English version of the website; the
Company also disclosed information on the MOPS website in
accordance with regulatory requirements, appointed a spokesperson,
and completed various reporting requirements. Searchable excerpts of
Our guidelines are consistent with those specified in
Corporate Governance Best-Practice Principles for
TSEC/GTSM Listed Companies

-30-
Item Implementation Status
Deviations from ―Corporate Governance Best-Practice
Principles for TWSE/GTSM Listed Companies‖ and reasons
briefings of institutional investor conferences are available at the
corporate website.
5. Operations of the Company‘s Nomination Committee, Compensation
Committee, or other committees of the Board of Directors
The Company has established the Remuneration Committee on Dec.21st,
2012.
The Company has established the Remuneration
Committee. Other functional committees shall be
established as needed in accordance with business or
regulatory requirements.
6. If the Company has established corporate governance principles based on ―Corporate Governance Best-Practice Principles for TWSE/GTSM Listed Companies‖, please describe any discrepancy between the
principles and their implementation:The company has not established the Corporate Governance Best-Practice Principles .The Company's corporate governance best-practice principles are currently being
developed; however, the Corporate Governance Best-Practice Principles for TSEC/GTSM Listed Companies shall be adopted as the basis for the Company's corporate governance practices.
7. Other important information to facilitate better understanding of the Company‘s corporate governance practices (e.g., employee rights, employee wellness, investor relations, supplier relations, rights of
stakeholders, directors‘ and supervisors‘ training records, the implementation of risk management policies and risk evaluation measures, the implementation of customer relations policies, and purchasing
insurance for directors and supervisors):
(1) Employee rights:The Company takes proper care of employees based on the Company's principles of integrity and good faith and abides by the Labor Standards Act promulgated by the government to
protect the legitimate rights and interests of employees and provide equal employment opportunities; The Employee Welfare Committee established by the Company has implemented an employee pension
system, offers employee group insurance, and organizes various training courses for employees, etc.
(2) Employee wellness:The Employee Welfare Committee is established in accordance with the law and organizes various recreational activities, medical checkups, employee travel, and employee shopping
days from time to time. The Committee also provides subsidies to social clubs organized by employees. In addition, the Company has made available a large number of parking spaces to employees in order
to resolve employee parking issues. With respect to emergency assistance, in addition to providing employees with protection through group insurance, the Company's responsible person shall also take the
initiative to call for voluntary contributions from employees to render assistance to fellow employees in the event of major emergencies.
(3) Investor relations:The Company discloses relevant information in accordance with the law and has appointed a dedicated investor relations officer who is responsible for managing investor relations and
associated activities in order to protect the interests of investors and stakeholders and fulfill our corporate responsibility to shareholders.
(4) Supplier relations and rights of stakeholders:The Company's business philosophy lies in achieving success together with our suppliers. We have always maintained a positive and healthy relationship with
each supplier and requests made to both vendors and stakeholders have been reasonable. We always offer the opportunity for communication and respect the legitimate rights and interests of all parties involved.
(5) Directors‘ and supervisors‘ training records:
Title Name Study Date Sponsoring Organization Course Training hours
Director Huang, Chung-Hsing 2013.09.23 Securities & Futures Institute Enterprise business integrity and
social responsibility seminar 3
Supervisor Yung Chi Lai 2013.05.28 Taiwan Stock Exchange Corporation
(TWSE)
The functions of the independent directors of listed
companies seminar in 2013 3
(6) Implementation of risk management policies and risk measurement standards: The Company's internal control, risk management system and essential management regulations and guidelines are subject to
approval by the Board of Directors. For the status of implementation of other relevant risk management policies and risk measurement standards, please refer to the "Risk Management" section of this Annual Report.
(7) Customer policy implementation: The Company adheres to the provisions of the contracts entered into with customers and is committed to protecting their rights and to providing good service quality.
(8) Insurance coverage purchased by the Company on liability of directors and supervisors: The Company has purchased liability insurance coverage for directors and supervisors.
8. If the Company has implemented a self corporate governance evaluation or has authorized any other professional organization to conduct such an evaluation, the evaluation results, major deficiencies or
suggestions, and improvements are stated as follows: In the annual internal control self-evaluation operation conducted by the Company, no material deficiencies requiring rectification or improvement have been
found.
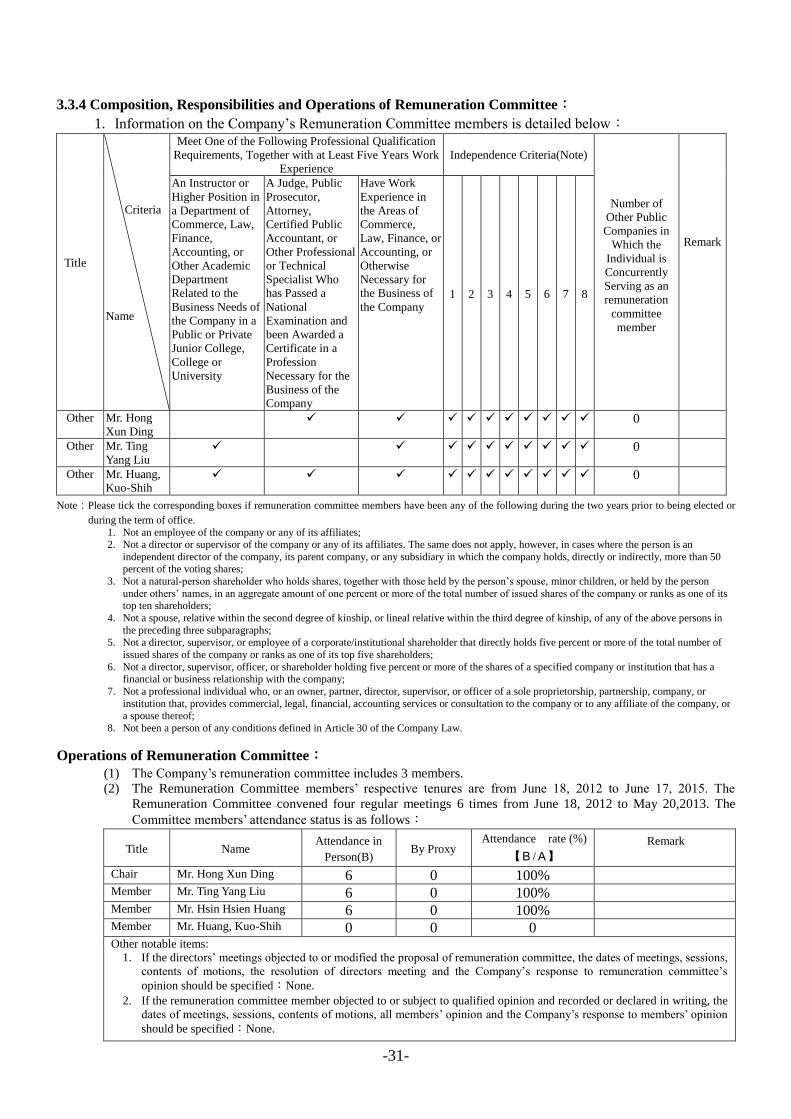
-31-
3.3.4 Composition, Responsibilities and Operations of Remuneration Committee:
1. Information on the Company‘s Remuneration Committee members is detailed below:
Title
Criteria
Name
Meet One of the Following Professional Qualification
Requirements, Together with at Least Five Years Work
Experience
Independence Criteria(Note)
Number of
Other Public
Companies in
Which the
Individual is
Concurrently
Serving as an
remuneration
committee
member
Remark
全
文
完
An Instructor or
Higher Position in
a Department of
Commerce, Law,
Finance,
Accounting, or
Other Academic
Department
Related to the
Business Needs of
the Company in a
Public or Private
Junior College,
College or
University
A Judge, Public
Prosecutor,
Attorney,
Certified Public
Accountant, or
Other Professional
or Technical
Specialist Who
has Passed a
National
Examination and
been Awarded a
Certificate in a
Profession
Necessary for the
Business of the
Company
Have Work
Experience in
the Areas of
Commerce,
Law, Finance, or
Accounting, or
Otherwise
Necessary for
the Business of
the Company 1 2 3 4 5 6 7 8
Other Mr. Hong
Xun Ding 0
Other Mr. Ting
Yang Liu 0
Other Mr. Huang,
Kuo-Shih 0
Note:Please tick the corresponding boxes if remuneration committee members have been any of the following during the two years prior to being elected or
during the term of office.
1. Not an employee of the company or any of its affiliates; 2. Not a director or supervisor of the company or any of its affiliates. The same does not apply, however, in cases where the person is an
independent director of the company, its parent company, or any subsidiary in which the company holds, directly or indirectly, more than 50 percent of the voting shares;
3. Not a natural-person shareholder who holds shares, together with those held by the person‘s spouse, minor children, or held by the person
under others‘ names, in an aggregate amount of one percent or more of the total number of issued shares of the company or ranks as one of its top ten shareholders;
4. Not a spouse, relative within the second degree of kinship, or lineal relative within the third degree of kinship, of any of the above persons in
the preceding three subparagraphs; 5. Not a director, supervisor, or employee of a corporate/institutional shareholder that directly holds five percent or more of the total number of
issued shares of the company or ranks as one of its top five shareholders;
6. Not a director, supervisor, officer, or shareholder holding five percent or more of the shares of a specified company or institution that has a financial or business relationship with the company;
7. Not a professional individual who, or an owner, partner, director, supervisor, or officer of a sole proprietorship, partnership, company, or
institution that, provides commercial, legal, financial, accounting services or consultation to the company or to any affiliate of the company, or a spouse thereof;
8. Not been a person of any conditions defined in Article 30 of the Company Law.
Operations of Remuneration Committee:
(1) The Company‘s remuneration committee includes 3 members.
(2) The Remuneration Committee members‘ respective tenures are from June 18, 2012 to June 17, 2015. The
Remuneration Committee convened four regular meetings 6 times from June 18, 2012 to May 20,2013. The
Committee members‘ attendance status is as follows:
Title Name Attendance in
Person(B) By Proxy
Attendance rate (%)
【B/A】
Remark
Chair Mr. Hong Xun Ding 6 0 100%
Member Mr. Ting Yang Liu 6 0 100%
Member Mr. Hsin Hsien Huang 6 0 100%
Member Mr. Huang, Kuo-Shih 0 0 0
Other notable items:
1. If the directors‘ meetings objected to or modified the proposal of remuneration committee, the dates of meetings, sessions,
contents of motions, the resolution of directors meeting and the Company‘s response to remuneration committee‘s
opinion should be specified:None.
2. If the remuneration committee member objected to or subject to qualified opinion and recorded or declared in writing, the
dates of meetings, sessions, contents of motions, all members‘ opinion and the Company‘s response to members‘ opinion
should be specified:None.
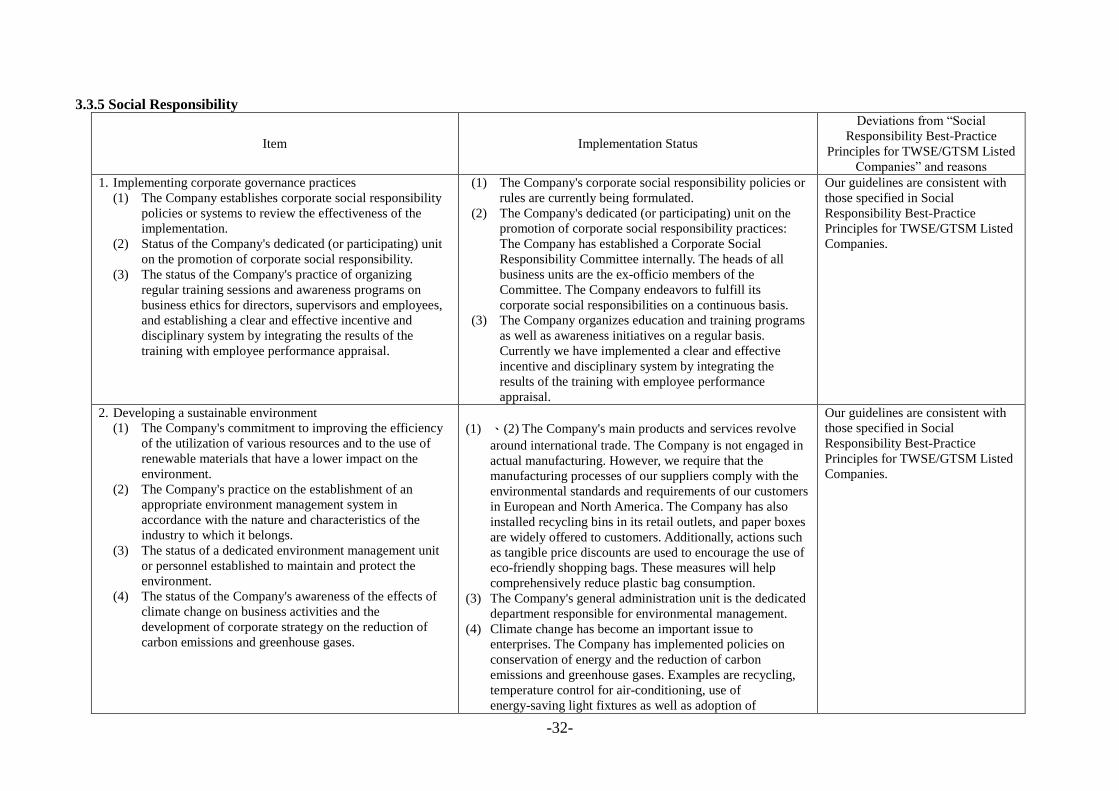
-32-
3.3.5 Social Responsibility
Item Implementation Status
Deviations from ―Social
Responsibility Best-Practice
Principles for TWSE/GTSM Listed
Companies‖ and reasons
1. Implementing corporate governance practices
(1) The Company establishes corporate social responsibility
policies or systems to review the effectiveness of the
implementation.
(2) Status of the Company's dedicated (or participating) unit
on the promotion of corporate social responsibility.
(3) The status of the Company's practice of organizing
regular training sessions and awareness programs on
business ethics for directors, supervisors and employees,
and establishing a clear and effective incentive and
disciplinary system by integrating the results of the
training with employee performance appraisal.
(1) The Company's corporate social responsibility policies or
rules are currently being formulated.
(2) The Company's dedicated (or participating) unit on the
promotion of corporate social responsibility practices:
The Company has established a Corporate Social
Responsibility Committee internally. The heads of all
business units are the ex-officio members of the
Committee. The Company endeavors to fulfill its
corporate social responsibilities on a continuous basis.
(3) The Company organizes education and training programs
as well as awareness initiatives on a regular basis.
Currently we have implemented a clear and effective
incentive and disciplinary system by integrating the
results of the training with employee performance
appraisal.
Our guidelines are consistent with
those specified in Social
Responsibility Best-Practice
Principles for TWSE/GTSM Listed
Companies.
2. Developing a sustainable environment
(1) The Company's commitment to improving the efficiency
of the utilization of various resources and to the use of
renewable materials that have a lower impact on the
environment.
(2) The Company's practice on the establishment of an
appropriate environment management system in
accordance with the nature and characteristics of the
industry to which it belongs.
(3) The status of a dedicated environment management unit
or personnel established to maintain and protect the
environment.
(4) The status of the Company's awareness of the effects of
climate change on business activities and the
development of corporate strategy on the reduction of
carbon emissions and greenhouse gases.
(1) 、(2) The Company's main products and services revolve
around international trade. The Company is not engaged in
actual manufacturing. However, we require that the
manufacturing processes of our suppliers comply with the
environmental standards and requirements of our customers
in European and North America. The Company has also
installed recycling bins in its retail outlets, and paper boxes
are widely offered to customers. Additionally, actions such
as tangible price discounts are used to encourage the use of
eco-friendly shopping bags. These measures will help
comprehensively reduce plastic bag consumption.
(3) The Company's general administration unit is the dedicated
department responsible for environmental management.
(4) Climate change has become an important issue to
enterprises. The Company has implemented policies on
conservation of energy and the reduction of carbon
emissions and greenhouse gases. Examples are recycling,
temperature control for air-conditioning, use of
energy-saving light fixtures as well as adoption of
Our guidelines are consistent with
those specified in Social
Responsibility Best-Practice
Principles for TWSE/GTSM Listed
Companies.
-33-
Item Implementation Status
Deviations from ―Social
Responsibility Best-Practice
Principles for TWSE/GTSM Listed
Companies‖ and reasons
water-conserving faucets. In terms of logistics operations,
we are continuously reducing carbon emissions in the
transportation process through various approaches,
including the reuse of boxes and pallets during
transportation, and adequate planning of the transportation
routes, etc.
3. Promoting social welfare
(1) The Company observes the relevant labor laws and
internationally-recognized labor right principles, aiming
to protect the lawful rights and interests of its employees
and to ensure a non-discriminating employment policy.
The Company has established adequate management
methodologies, procedures and monitoring mechanisms.
(2) The Company's practices in providing employees with a
safe and healthy working environment and in
implementing training on safety and health for employees
on a regular basis.
(3) The Company has also implemented a periodic employee
communication mechanism. Employees are advised,
through reasonable channels, of any operational changes
which may cause significant impact on them.
(4) Establishment and announcement of the company's
consumer protection policy, as well as the existence of
transparent and effective procedures for handling
consumers' complaints over products and services.
(5) The Company's cooperation and joint efforts with
suppliers to improve their corporate social responsibility.
(6) How the Company engages in the donations of
commodities, enterprise volunteer services or the
provision of other free professional services, participation
in community development and in the work of charities
through its commercial activities.
(1) We take proper care of our employees based on the
Company's principles of integrity and good faith, and we
abide by the Labor Standards Act promulgated by the
government to protect the legitimate rights and interests of
our employees, which are carried out in accordance with
the Company's internal regulations and management
guidelines.
(2) The Company endeavors to provide employees with a safe
and healthy working environment and arrange for
employees to participate in annual medical checkups. In
addition, the Company has engaged the Employee
Assistance and Services Center and professional
consultants to provide the staff with specialized
psychological counseling, adjustment to work, sleep
disorder counseling and related services. The Company also
organizes health workshops and provides health education
information from time to time to enable the staff to take
better control of their health.
A. The Company has passed all the yearly fire safety
inspections.
B. We have also entered into cooperative agreements
with many professional physical examination centers,
providing free annual physical examinations to our
employees.
C. The employees are also offered free psychological
counseling services up to five times (60 minute for
session) per year through our contracted agent, the
Employee Assistance Center of Hsinchu City Lifeline
Association.
Our guidelines are consistent with
those specified in Social
Responsibility Best-Practice
Principles for TWSE/GTSM Listed
Companies.
-34-
Item Implementation Status
Deviations from ―Social
Responsibility Best-Practice
Principles for TWSE/GTSM Listed
Companies‖ and reasons
D. The Company also organizes health workshops and
provides health education information from time to
time to enable the staff to take better control of their
health.
(3) The Company regularly issues employee communication
documents and CEO's letters, and arranges employee
seminars to improve the internal communication. From
time to time, the Company also arranges employee
activities, communication forums and one-on-one
discussions to enable two-way communication on various
topics. A designated e-mail address is made available to
receive opinions from the employees.
(4) The Company has a designated business unit which reports
directly to the CEO and handles all customer complaint
issues on a full-time basis. Consumers may send their
complaints through various channels including the retail
outlets, the website message boards, customer service
hotlines and e-mails, etc. All complaint channels are openly
announced to customers. All customer complaints will be
responded to by the designated staff, and will be
documented and followed up through the internal
monitoring system.
(5) The Company is increasing the percentage of green
products procured year by year. It has comprehensively
upgraded the suppliers' operational platforms, being the
first company in the industry to implement a paperless
order processing system and electronic invoice system. In
the future, we will ask our suppliers to gradually improve
their operating systems and collectively contribute to the
fulfillment of our corporate responsibilities.
(6) The Company is actively involved in community activities
and charities with its Test Rite Happy Community project
Sponsorship of Formosa Charity Group; Members of the
Company's staff are involved with activities such as
traveling to schools in remote towns and villages as
volunteers, donating books, and participating in charity
-35-
Item Implementation Status
Deviations from ―Social
Responsibility Best-Practice
Principles for TWSE/GTSM Listed
Companies‖ and reasons
bazaars and providing donations to the Chinese Christian
Relief Association's project, "After School Reading
Program for Children of Disadvantaged Families."
4. Enhancing information disclosure
(1) The manner in which the Company discloses information
related to corporate social responsibility that concerns
relevance and reliability.
(2) The status of the Company compiling the Corporate Social
Responsibility Report and disclosing its work on the
promotion of corporate social responsibility.
(1)、(2) The Company has reconstructed its official website to
provide clearer, more timely and more comprehensive
disclosure of information including corporate governance and
financial performance, etc. The Company has not yet drafted
the Corporate Social Responsibility Report, but will do so
depending on practical needs in the future and to enhance
disclosure of the Company's practices of corporate social
responsibility.
The Company has not yet drafted
the Corporate Social Responsibility
Report, but will do so depending on
practical needs in the future.
5. If the Company has established its own corporate social responsibility codes of conduct based on "Corporate social responsibility codes of practice of listed companies,"
describe its operations and discrepancies with the standards:
The Company's Code of Practice for Corporate Social Responsibility and associated guidelines are currently being formulated.
6. Other important information that may help to clarify the status of the Company's corporate social responsibility (such as the systems and measures adopted by the
Company's on environmental protection, community involvement, contributions to the society, social services, social welfare, consumer rights and human rights as well
as security and health, together with the results of these activities):
(1) The Company of trading business unit is engaged only in international trade without any involvement in manufacturing, but we require that the manufacturing
processes of our suppliers be compliant with the environmental standards and requirements of our customers in European and North America. The retailing business
TLW has won the ―Green Marketing Award‖ for 4 years running from the Environmental Protection Administration. (TLW has 23 retail locations across Taiwan and is
the only mega-store to have passed the ―Green Store‖ certification island-wide; Ministry of Economic Affairs presented TLW with ―Voluntary Energy Conservation
Award‖ in 2010. Taipei City Government awards ―Energy Conservation Products Promotion Award‖ every year). With the guidance of the Ministry of Economic
Affairs, Test Rite took the lead in acquiring for the latest ISO50001 International Energy Management System certification in 2012, becoming the first and the only one
company in the domestic wholesale/logistic industry to receive the certification. TLW Shin-Lin Store won the Excellence Award at the 6th Taipei City Golden Energy
Saving Awards; S*smart won the Senior-Friendly Stations Award from the Taipei City Government Department of Social Welfare; TLW on the Outstanding Franchise
Headquarters Award from the Ministry of Economic Affairs; TLW won the 3rd Taiwan Green Classics Award; TLW & Test Rite Home Service Co., Ltd. obtained the
dp.mark Data Privacy Protection Mark certification from the Ministry of Economic Affairs in 2013.
(2) Community involvement, social contributions, social services, social welfare, human rights, security, health and other social responsibility activities: Test Rite Group
expresses concern for the community, participates in activities benefiting the society and devotes efforts in practicing corporate social responsibility, such as the Test
Rite Happy Community project; Sponsorship of Formosa Charity Group; Sponsorship and support of the sport of archery in Taiwan; Support Chung-Yu Foundation of
public car washing activities; Support Men-Nuo Foundation of simple repair volunteer services; Donation to Fu Jen Catholic University of campus outdoor learning
platform; Joined the Friends of the Flower Expo to build Taiwan's international image; Donating NT$10 million material to assist the reconstruction in disaster of
Typhoon Morakot (August 2009); Participated in the Japan 311 flood donations to express the care for tsunami victims; Continuously held The Group's Volunteer Day
of 2011, "Let Love Guide Us in Moving Forward," and 2012‖The Unlimited Love of Test Rite‖, company organized charity bazaars and donations to the Chinese
Christian Relief Association's project, "After School Reading Program for Children of Disadvantaged Families," which helps children in desperate need of education
and family support; Members of the Company's staff are involved with activities such as traveling to schools in remote towns and villages as volunteers and donating
-36-
Item Implementation Status
Deviations from ―Social
Responsibility Best-Practice
Principles for TWSE/GTSM Listed
Companies‖ and reasons
books. Participated in World Vision Taiwan, the 23rd "Hunger 12" experience, company hope to raise community donations to help emergency needs of families in
Taiwan, and to bring hope of survival to poor children, AIDS orphans and war children in the world. A total of 650 employees took part in the Volunteer Day event and
participated in a total of 35 volunteer programs throughout Taiwan, providing free repairs, cleaning, beautification, and reading services to disadvantaged groups.
Volunteers also shared in the festivities on the eve of the Mid-Autumn Festival; Sponsored the Chinese Christian Relief Association's "12th 1919 Love
Overflows—Relief Camp"; assisted with beautification at the Kanjiao Elementary School in Wanli District, New Taipei City; Supported dementia advocacy and love
charity events; Co-sponsored youth charity car wash events; TLW provided care for disadvantaged groups and contributed air conditioning facilities at the Ciyu Home
in Pingtung; TLW Hua-Lien Store served as corporate volunteers for four consecutive years and cooperated with the Mennonite Social Welfare Foundation to improve
and restore the residences of single-living senior citizens.
7. Provide description for any of the Company's products or corporate social responsibility reports that have received certifications from relevant accreditation bodies: The
Company has received certification for ISO9001: 2008 Quality Management System.

-37-
3.3.6 Corporate Governance Guidelines and Regulations:The company established a set of operational procedures for significant information and disclosed in
the company‘s website and internal document system. The company also provides relevant laws and advocacy for new directors, supervisors and managers when
they are on board.
Item Implementation Status Non-implementation and Its Reason(s)
1. Establishment of Corporate Conduct and Ethics Policy and Implementation
Measures
(1) The company‘s guidelines on corporate conduct and ethics are provided in
internal policies and disclosed publicly. The Board of Directors and the
management team demonstrate their commitments to implement the
policies.
(2) The company establishes relevant policies for preventing any unethical
conduct. The implementation of the relevant procedures, guidelines and
training mechanism are provided in the policies.
(3) The company establishes appropriate measures for preventing bribery and
illegal political contribution for higher potential unethical conduct in the
relevant policies.
(1) The Board approved by the Corporate Governance
guidelines and Regulations on November 11, 2013 and
announced immediate effect on the implementation of the
human resources unit and assign a dedicated unit, and
regularly report to the Board oversee the implementation of
the case; Our corporate culture is based on the integrity of
business management. The Company has included in its
internal rules the Employee Integrity Policy and the "Group
Guidelines Governing Employee Award and Disciplinary
Actions". The Company has also expressed explicitly its
business principles of integrity and abiding by the law in all
commercial agreements with the customers and suppliers.
(2) The HR department of the Company requests all employees
to sign an "Integrity Declaration and Undertaking" on a
regular basis and announce the law irregular.
(3) The Company prohibits the use and acceptance of bribery,
illegal campaign contributions, improper charity donations,
the offering or accepting of unreasonable gifts, hospitality,
or other improper benefits. Violators are punished pursuant
to regulations. The Company has invested in crime
insurance.
Our guidelines are consistent with those specified in
"Code of Ethics for Business Management for
TWSE/GTSM Listed Companies".
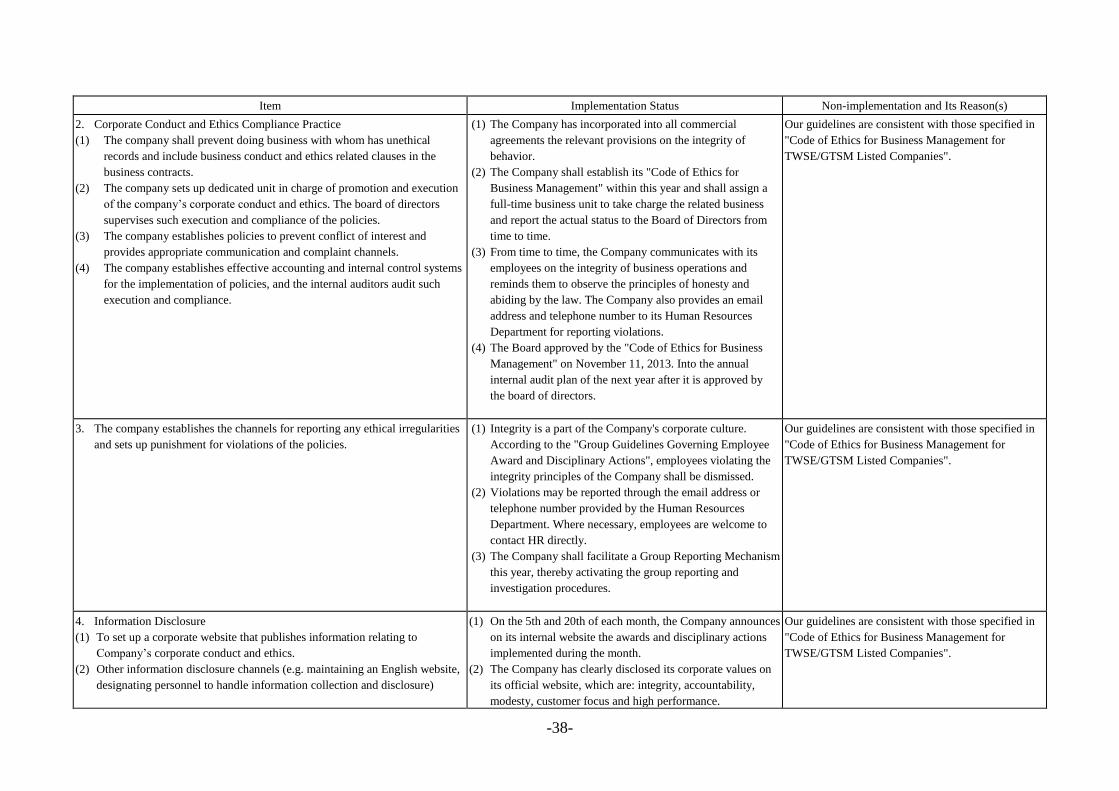
-38-
Item Implementation Status Non-implementation and Its Reason(s)
2. Corporate Conduct and Ethics Compliance Practice
(1) The company shall prevent doing business with whom has unethical
records and include business conduct and ethics related clauses in the
business contracts.
(2) The company sets up dedicated unit in charge of promotion and execution
of the company‘s corporate conduct and ethics. The board of directors
supervises such execution and compliance of the policies.
(3) The company establishes policies to prevent conflict of interest and
provides appropriate communication and complaint channels.
(4) The company establishes effective accounting and internal control systems
for the implementation of policies, and the internal auditors audit such
execution and compliance.
(1) The Company has incorporated into all commercial
agreements the relevant provisions on the integrity of
behavior.
(2) The Company shall establish its "Code of Ethics for
Business Management" within this year and shall assign a
full-time business unit to take charge the related business
and report the actual status to the Board of Directors from
time to time.
(3) From time to time, the Company communicates with its
employees on the integrity of business operations and
reminds them to observe the principles of honesty and
abiding by the law. The Company also provides an email
address and telephone number to its Human Resources
Department for reporting violations.
(4) The Board approved by the "Code of Ethics for Business
Management" on November 11, 2013. Into the annual
internal audit plan of the next year after it is approved by
the board of directors.
Our guidelines are consistent with those specified in
"Code of Ethics for Business Management for
TWSE/GTSM Listed Companies".
3. The company establishes the channels for reporting any ethical irregularities
and sets up punishment for violations of the policies.
(1) Integrity is a part of the Company's corporate culture.
According to the "Group Guidelines Governing Employee
Award and Disciplinary Actions", employees violating the
integrity principles of the Company shall be dismissed.
(2) Violations may be reported through the email address or
telephone number provided by the Human Resources
Department. Where necessary, employees are welcome to
contact HR directly.
(3) The Company shall facilitate a Group Reporting Mechanism
this year, thereby activating the group reporting and
investigation procedures.
Our guidelines are consistent with those specified in
"Code of Ethics for Business Management for
TWSE/GTSM Listed Companies".
4. Information Disclosure
(1) To set up a corporate website that publishes information relating to
Company‘s corporate conduct and ethics.
(2) Other information disclosure channels (e.g. maintaining an English website,
designating personnel to handle information collection and disclosure)
(1) On the 5th and 20th of each month, the Company announces
on its internal website the awards and disciplinary actions
implemented during the month.
(2) The Company has clearly disclosed its corporate values on
its official website, which are: integrity, accountability,
modesty, customer focus and high performance.
Our guidelines are consistent with those specified in
"Code of Ethics for Business Management for
TWSE/GTSM Listed Companies".

-39-
Item Implementation Status Non-implementation and Its Reason(s)
5. If the company has established corporate governance policies based on TSE Corporate Conduct and Ethics Best Practice Principles, please describe any discrepancy between the policies and their
implementation. : None.
6. Other important information to facilitate better understanding of the company‘s corporate conduct and ethics compliance practices (e.g., promote and demonstrate the company‘s commitment to
ethical standard and provide training to its business partners; review the company‘s corporate conduct and ethics policy).
The Board approved by the Corporate Governance guidelines and Regulations on November 11, 2013 and announced company website.
The HR department of the Company requests all employees to sign an "Integrity Declaration and Undertaking" on a regular basis. The purpose is to communicate with the employees the importance
of personal integrity and honesty at work, as well as the obligations they should fulfill.
We have been, from time to time, communicating with our suppliers the corporate values of integrity, accountability, modesty, customer focus and high performance. We have also incorporated into
our commercial agreements the relevant provisions on the integrity of behavior.
7. Other information enabling better understanding of the company's corporate governance:
Other information enabling better understanding of the company‘s corporate governance: Please refer to the ―Investor Relationship‖ section of the company website.
(http://www.testritegroup.com/GWS/en/) or the official website of the Market Observation Post System (http://mops.twse.com.tw/index.htm, company stock code: 2908)

-40-
3.3.7 Other Important Information Regarding Corporate Governance:
1、Managers‘ training records:
Title Name Study Date Sponsoring Organization Course Training
hours
Accounting
VP Linda Lin
2014/4/9~16 Accounting Research and Development
Foundation in Taiwan
Accounting manager training course of securities of issue providers
of TWSE 12
Auditing
AVP Lancy Wu
2013/05/20 Computer Audit Association Enterprise Risk Management and Business Continuity Management 2
2013/08/31 Computer Audit Association Information Governance and Corporate Governance 7 2013/10/01 Taiwan Corporate Governance Association Best Practices of Intellectual Property Management Disclosure 3 2013/10/17 The Institute of Internal Auditors Major financial scandals and legal risks 6
2013/10/29-10/30 The Institute of Internal Auditors The right way to increase the value of the control and management of
business risks 14
2013/10/31-11/01 Taiwan Corporate Governance Association The 9th Taipei Corporate Governance Forum 9
2、Employees‘ certification related to financial transparency:
Name certification
Lancy Wu Qualified Internal Auditor (QIA)、Certified Internal Auditor (CIA)、Basic examination on internal controls by the Securities and Futures Institute
Paul Chen Qualified Internal Auditor (QIA)、Certified Internal Auditor (CIA)、Certification in Control Self-Assessment、Internal Control of Corporation Test of
Securities and Futures Institute
Lynn Lee Qualified Internal Auditor (QIA)、Certified Internal Auditor (CIA)、Certification in Risk Management Assurance、Internal Control of Corporation Test of
Securities and Futures Institute
Weilin Chen Internal Control of Corporation Test of Securities and Futures Institute
Jason Lee Internal Control of Corporation Test of Securities and Futures Institute
Johnny Huang Internal Control of Corporation Test of Securities and Futures Institute、Internal Bank Controls the Basic Test for Compliance Certification
Vivian Ko Internal Control of Corporation Test of Securities and Futures Institute
Marilyn Ho Internal Control of Corporation Test of Securities and Futures Institute
Claire Lin Proficiency Test for Financial Planning Personnel、The Securities Specialist、For taking Investment Trust and Consulting Regulations(including Professional
Ethics Rules) 」 、Proficiency Test for Trust Operations Personnel
Jack Chang Senior Securities Specialist、Paper 1
Eva Huang CPA(USA)
Doris Yang Qualified Internal Auditor (QIA)、Certified Internal Auditor (CIA)
Amy Chen Internal Control of Corporation Test of Securities and Futures Institute
Susanna Yen Shares Officer Test of Securities and Futures Institute
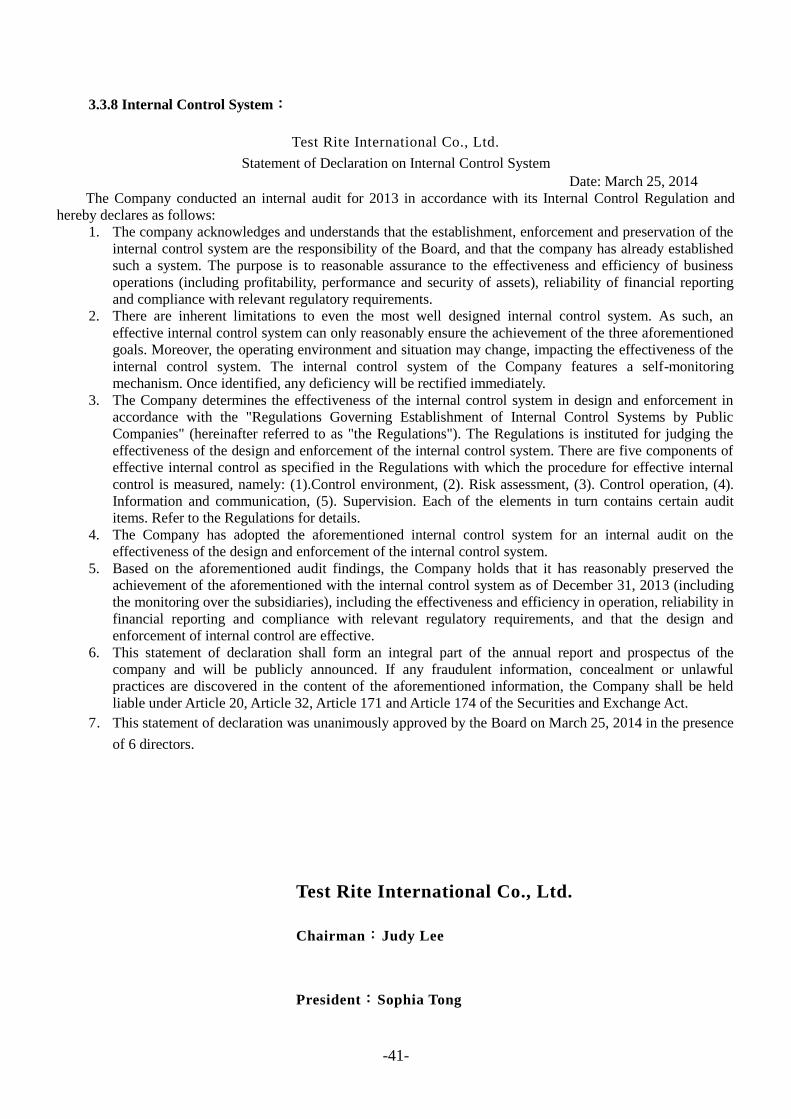
-41-
3.3.8 Internal Control System:
Test Rite International Co., Ltd.
Statement of Declaration on Internal Control System
Date: March 25, 2014
The Company conducted an internal audit for 2013 in accordance with its Internal Control Regulation and
hereby declares as follows:
1. The company acknowledges and understands that the establishment, enforcement and preservation of the
internal control system are the responsibility of the Board, and that the company has already established
such a system. The purpose is to reasonable assurance to the effectiveness and efficiency of business
operations (including profitability, performance and security of assets), reliability of financial reporting
and compliance with relevant regulatory requirements.
2. There are inherent limitations to even the most well designed internal control system. As such, an
effective internal control system can only reasonably ensure the achievement of the three aforementioned
goals. Moreover, the operating environment and situation may change, impacting the effectiveness of the
internal control system. The internal control system of the Company features a self-monitoring
mechanism. Once identified, any deficiency will be rectified immediately.
3. The Company determines the effectiveness of the internal control system in design and enforcement in
accordance with the "Regulations Governing Establishment of Internal Control Systems by Public
Companies" (hereinafter referred to as "the Regulations"). The Regulations is instituted for judging the
effectiveness of the design and enforcement of the internal control system. There are five components of
effective internal control as specified in the Regulations with which the procedure for effective internal
control is measured, namely: (1).Control environment, (2). Risk assessment, (3). Control operation, (4).
Information and communication, (5). Supervision. Each of the elements in turn contains certain audit
items. Refer to the Regulations for details.
4. The Company has adopted the aforementioned internal control system for an internal audit on the
effectiveness of the design and enforcement of the internal control system.
5. Based on the aforementioned audit findings, the Company holds that it has reasonably preserved the
achievement of the aforementioned with the internal control system as of December 31, 2013 (including
the monitoring over the subsidiaries), including the effectiveness and efficiency in operation, reliability in
financial reporting and compliance with relevant regulatory requirements, and that the design and
enforcement of internal control are effective.
6. This statement of declaration shall form an integral part of the annual report and prospectus of the
company and will be publicly announced. If any fraudulent information, concealment or unlawful
practices are discovered in the content of the aforementioned information, the Company shall be held
liable under Article 20, Article 32, Article 171 and Article 174 of the Securities and Exchange Act.
7. This statement of declaration was unanimously approved by the Board on March 25, 2014 in the presence
of 6 directors.
Test Rite International Co., Ltd.
Chairman:Judy Lee
President:Sophia Tong

-42-
3.3.9 Major Resolutions of Shareholders’ Meeting and Board Meetings As of May 8, 2014
Date/Item Major resolutions
6/17/2013
Shareholders‘
Meeting
Approved the partial amendments to the Company's Endorsement / Guarantee Procedures.
Approved the partial amendments to the Company's Procedures for Lending Funds to Others.
Approved the partial amendments to ‖Acquisition or disposal of the asset process ‖
Approved the partial amendments to ‖Article‖
Approved the capitalization of retained earnings issuance of new shares.
6/25/2013
Board meeting
Approved the Company's earning distribution and cash dividend proposal for fiscal year 2012
and related matters has been passed.
Approved the Company‘s directors' and supervisors' Remuneration distribution proposal for
fiscal year 2012.
Approved the members of Remuneration Committee member distribution.
8/6/2013
Board meeting
Approved Company‘s indirect capital injection in Test Rite (China) Investment Co., Ltd.
through Test Rite Retailing Co., Ltd.
Approved Company‘s indirect capital injection in Test Rite Business Development Corporation
(China) Co., Ltd. through Test Rite Trading Co., Ltd.
9/30/2013
Board meeting
Approved signatory and authority in the case of branches of HSBC India account transaction
by changing our India office.
11/11/2013
Board meeting
Approved the corporate governance policies established.
Approved the Company‘s managers' Employee bonus distribution proposal for fiscal year 2012
and annual bonus for 2013.
12/18/2013
Board meeting
Approved the Company's business plan and budget review for fiscal year 2014.
Approved the Company's Internal Audit Plan for fiscal year 2014.
1/22/2014
Board meeting
Approved the Company‘s managers' performance bonus distribution proposal for 2013.
3/10/2014
Board meeting
Approved the Company as treasury stock transferred to employees.
3/25/2014
Board meeting
Approved the earning distribution proposal for 2013.
Approved the 2013 Statement of Declaration on Internal Control System.
Approved the capitalization of retained earnings issuance of new shares.
Approved the partial amendments to ‖ Rules for Election of Directors and Supervisors‖
Approved the partial amendments to ‖Acquisition or disposal of the asset process ‖
Approved the partial amendments to ‖Article‖
Approved the convening of the Company's annual shareholders' meeting for 2014.
Approved Company‘s indirect capital injection in Test Rite Business Development Corporation
(China) Co., Ltd. through Test Rite Trading Co., Ltd.
5/8/2014
Board meeting
Approved the capitalization of retained earnings issuance of new shares, the proposed
revocation because of there was no issue.

-43-
3.3.10 Major Issues of Record or Written Statements Made by Any Director or Supervisor
Dissenting to Important Resolutions Passed by the Board of Directors:None
3.3.11 Resignation or Dismissal of Personnel Involved in Preparation of Financial Reports:None
3.4 Changes in Shareholding of Directors, Supervisors, Managers and Major Shareholders:
(Unit:Share)
Title Name
2013 As of Apr. 30, 2014
Holding
Increase
(Decrease)
Pledged
Holding
Increase
(Decrease)
Holding
Increase
(Decrease)
Pledged
Holding
Increase
(Decrease)
Chairman Judy Lee 0 0 7,136,000 1,400,000
Director Tony Ho 0 0 0 10,000,000 Director
Hsin-Hsien Huang 0 0 0 0
Director Robin Ho (300,000) 0 420,000 0
Director Property Co., Ltd. 0 0 0 0
Supervisor Tsai-Chi Co., Ltd. 0 0 0 0
President Sophia Tong 0 0 428,000 0
VP John Peng 0 0 160,000 0 VP
Peter Dong 0 0 0 0
VP Linda Lin* 0 0 60,000 0
VP Alfred Chang (30,000) 0 38,000 0
VP Hannis Chang 0 0 100,000 0
VP Lawrence Wu 0 0 0 0
VP Shelly Chen* 0 0 60,000 0
VP Jane Peng 0 0 0 0
VP Gillian Joe 0 0 0 0
VP Bob Yueh 0 0 0 0
VP Edward Kao 0 0 50,000 0
VP Paul Wang 0 0 0 0
VP Tracy Tsai 0 0 0 0
VP Robin Ho (300,000) 0 420,000 0
VP CC Fan 0 0 60,000 0
VP Kelly Ho 0 0 300,000 0
VP Jack Ueng 0 0 100,000 0
VP Maggy Chen 0 0 29,000 0
VP Michael Hou 0 0 48,000 0
VP Thomas Weng* 0 0 0 0
VP Rebecca Chi* 0 0 0 0
VP Terrance Yang* NA NA 0 0
AVP Alex Yu 0 0 50,000 0
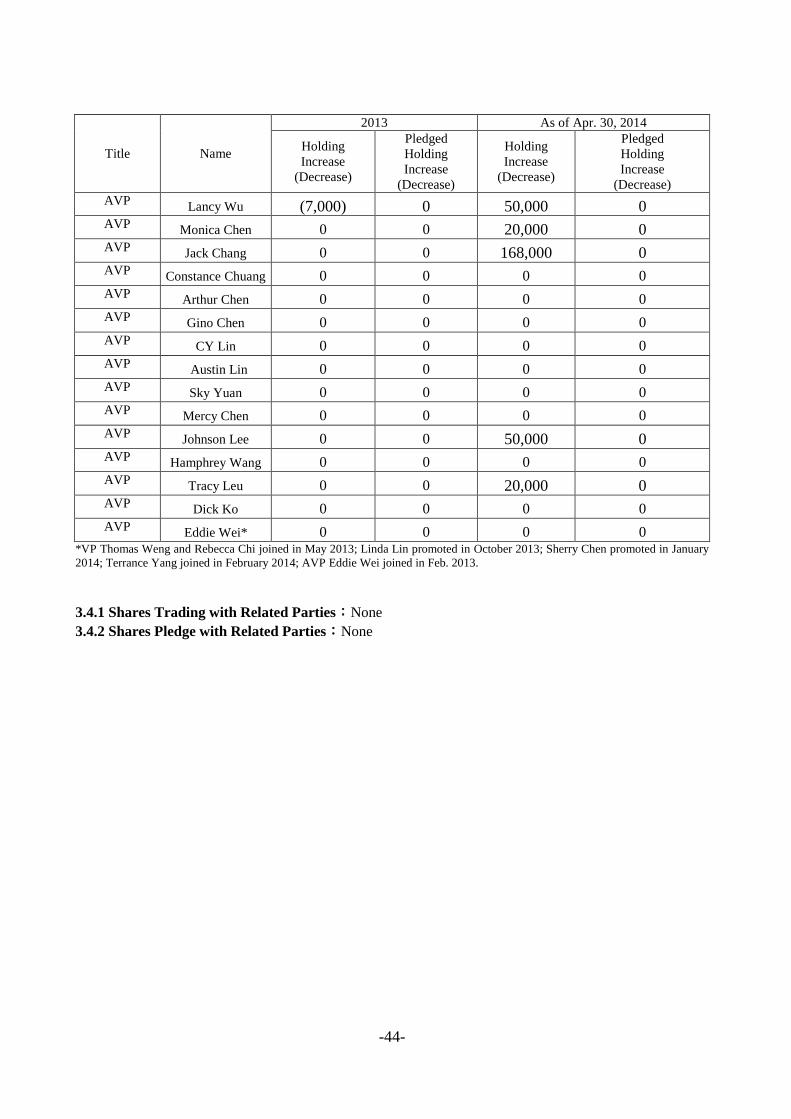
-44-
Title Name
2013 As of Apr. 30, 2014
Holding
Increase
(Decrease)
Pledged
Holding
Increase
(Decrease)
Holding
Increase
(Decrease)
Pledged
Holding
Increase
(Decrease)
AVP Lancy Wu (7,000) 0 50,000 0
AVP Monica Chen 0 0 20,000 0
AVP Jack Chang 0 0 168,000 0
AVP Constance Chuang 0 0 0 0
AVP Arthur Chen 0 0 0 0
AVP Gino Chen 0 0 0 0
AVP CY Lin 0 0 0 0
AVP Austin Lin 0 0 0 0
AVP Sky Yuan 0 0 0 0
AVP Mercy Chen 0 0 0 0
AVP Johnson Lee 0 0 50,000 0
AVP Hamphrey Wang 0 0 0 0
AVP Tracy Leu 0 0 20,000 0
AVP Dick Ko 0 0 0 0
AVP Eddie Wei* 0 0 0 0
*VP Thomas Weng and Rebecca Chi joined in May 2013; Linda Lin promoted in October 2013; Sherry Chen promoted in January
2014; Terrance Yang joined in February 2014; AVP Eddie Wei joined in Feb. 2013.
3.4.1 Shares Trading with Related Parties:None
3.4.2 Shares Pledge with Related Parties:None

-45-
3.5 Information Disclosing the Relationship between any of the Company’s Top Ten Shareholders
As of 4/13/2014
Name Shareholding Spouse & Minor
Shareholding
by Nominee
Arrangement
The relationship
between
any of the Company‘s
Top Ten Share holders
Remarks
%
Shares % Shares % Shares % Name Relation
Tony Ho 44,295,294 8.82 43,995,550 8.76 0 0
Judy Lee Spouse -
Judy Lee 43,995,550 8.76 44,295,294 8.82 0 0
Tony Ho Spouse
-
Up Master
Investment
Co., Ltd.
Representative:
Ms. Lee,
Ai-Chen
41,286,395 8.22 0 0 0 0
Tony Ho
Judy Lee
Substantive
sponsor
-
JPMorgan
Chase Bank
N.A. Taipei
Branch in
custody for
Saudi Arabian
Monetary
Agency
35,436,789 7.06 0 0 0 0
- - -
Tsai-Chi Co.,
Ltd.
Representative:
Ms. Lee,
Li-Heng
32,327,389 6.44 0 0 0 0
Tony Ho
Judy Lee
Substantive
sponsor
-
Chang Qiu Dun 27,330,714 5.44 0 0 0 0 - - -
Tsai Ye
Enterprise
Company
Limited
26,270,635 5.23 0 0 0 0
Tony Ho
Judy Lee
Substantive
sponsor
-
Fubon Life
Assurance
Co.,Ltd.
26,000,037 5.18 0 0 0 0
- - -
Chang Lin Rui
Feng 20,199,416 4.02 0 0 0 0
- - -
Test Rite
International
Co., Ltd.
Treasury Stock
19,868,000 3.96 0 0 0 0
Tony Ho
Judy Lee
Substantive
sponsor
-

-46-
3.6 Long-term Investment Ownership As of 12/31/2013;Unit:Share:%
Long-term Investment Ownership by Test Rite
Direct/Indirect
Ownership by Directors
and Management Total Ownership
Shares % Shares % Shares %
Test-Rite Retail Co., Ltd. 24,999,999 25.00% 75,000,001 75.00% 100,000,000 100.00%
Test-Rite Home Service Co., Ltd. 0 0.00% 19,800,000 100.00% 19,800,000 100.00%
Hola Homefurnishings Co., Ltd. 0 0.00 30,000 100.00% 30,000 100.00%
Homy Homefurnishings Co., Ltd. 0 0.00 30,000 100.00% 30,000 100.00%
Freer Inc. 0 0.00 30,000 100.00% 30,000 100.00%
Chung Cin Enterprise Co., Ltd. 77,600,000 100.00% 0 0.00% 77,600,000 100.00%
Test Cin M&E Engineering Co., Ltd. 0 0.00% 8,000,000 100.00% 8,000,000 100.00%
Tony Construction Co., Ltd. 0 0.00% 23,000,000 100.00% 23,000,000 100.00%
Chung Cin Interior Design Construction
Co., Ltd.
0 0.00% 1,200,000 100.00% 1,200,000 100.00%
B&S Link Co., Ltd. 5,000,000 100.00% 0 0.00% 5,000,000 100.00%
Lih Teh International Co., Ltd. 16,269,479 100.00% 0 0.00% 16,269,479 100.00%
Lih Chiou Co., Ltd. 419,414,000 100.00% 0 0.00% 419,414,000 100.00%
Fusion International Distribution, Inc. 5,499,838 100.00% 0 0.00% 5,499,838 100.00%
International Art Enterprise Co., Ltd. 1,000,000 100.00% 0 0.00% 1,000,000 100.00%
Test-Rite Pte. Ltd. 3,520,000 100.00% 0 0.00% 3,520,000 100.00%
Test-Rite Int‘l (Thailand) Ltd. 220,497 49.00% 229,500 51.00% 449,997 100.00%
Test-Rite Vietnam Co., Ltd. 1,064,000 95.00% 56,000 5.00% 1,120,000 100.00%
Test-Rite Product (Hong Kong) Ltd. 9,999 100.00% 0 0.00% 9,999 100.00%
Test-Rite Int‘l (U.S.) Co., Ltd. 3,335.1 88.04% 452.8 11.96% 3,788 100.00%
Test-Rite Canada Co., Ltd. 100 100.00% 0 0.00% 100 100.00%
Test-Rite Int‘l (Australia) Pty Ltd. 1,800,000 100.00% 0 0.00% 1,800,000 100.00%
Test-Rite (UK) Co., Ltd. 1,475,930 100.00% 0 0.00% 1,475,930 100.00%
Test-Rite Development Co., Ltd. 9,670,000 100.00% 0 0.00% 9,670,000 100.00%
Test-Rite Star Co., Ltd. 1,089,000 100.00% 0 0.00% 1,089,000 100.00%
Test-Rite Investment Co., Ltd. 500,000 100.00% 0 0.00% 500,000 100.00%
Test-Rite Retailing Co., Ltd. 78,331,000 100.00% 0 0.00% 78,331,000 100.00%
Test-Rite Trading Co., Ltd. 48,126,494.6 100.00% 0 0.00% 48,126,494.6 100.00%
Fortune Miles Co., Ltd. 30,000 100.00% 0 0.00% 30,000 100.00%
TRS Investment Co., Ltd. 2,275,590.58 100.00% 0 0.00% 2,275,590.58 100.00%
Upmaster Int‘l Co., Ltd. 6,400,000 100.00% 0 0.00% 6,400,000 100.00%

-47-
IV. Capital Overview
4.1 Capital and Shares
4.1.1 Source of Capital
A. Issued Shares As of 04/13/2014
Month / Year
Par
Value
(NTD)
Authorized Capital Paid-in Capital Remark
Shares Amount
(NTD) Shares
Amount
(NTD) Sources of Capital
Capital
Increased by
Assets Other
than Cash
Other
67.07 10 200,000 2,000,000 200,000 2,000,000 Initial issue NT$2,000,000 -
70.12 10 700,000 7,000,000 700,000 7,000,000 Capital injection NT$5,000,000 -
72.09 10 1,700,000 17,000,000 1,700,000 17,000,000
Capital injection NT$5,800,000
Capitalization of earnings
NT$4,200,000
-
73.12 10 4,700,000 47,000,000 4,700,000 47,000,000
Capital injection NT$25,000,000
Capitalization of earnings
NT$5,000,000
-
76.10 10 8,000,000 80,000,000 8,000,000 80,000,000
Capital injection NT$9,400,000
Capitalization of earnings
NT$23,600,000
-
78.11 10 19,000,000 190,000,000 19,000,000 190,000,000
Capital injection 78,000,000
Capitalization of earnings
NT$32,000,000
-
79.12 10 36,100,000 361,000,000 36,100,000 361,000,000 Capital surplus NT$171,000,000 -
80.07 10 45,125,000 451,250,000 45,125,000 451,250,000 Capital surplus NT$90,250,000 -
81.07 10 56,406,250 564,062,500 56,406,250 564,062,500
Capitalization of earnings
NT$67,687,500
Capital surplus NT$45,125,000
-

-48-
82.08 10 100,000,000 1,000,000,000 71,018,816 710,188,160
Capitalization of earnings
NT$28,203,120
Capital surplus NT$112,812,500
Employee bonuses NT$5,110,040
-
83.08 10 150,000,000 1,500,000,000 116,137,660 1,161,376,600
Capitalization of earnings
NT$139,999,948
Employee bonuses
NT$11,376,652
Capital surplus NT$10,000,000
Capital injection 289,811,840
-
84.07 10 150,000,000 1,500,000,000 129,400,000 1,294,000,000
Capital surplus NT$116,137,660
Employee bonuses
NT$16,485,740
-
85.09 10 150,000,000 1,500,000,000 136,400,000 1,364,000,000 Capital surplus NT$64,700,000
Employee bonuses NT$5,300,000
-
86.08 10 183,680,000 1,836,800,000 150,920,000 1,509,200,000
Capitalization of earnings
NT$13,640,000
Employee bonuses NT$8,800,000
Capital surplus NT$122,760,000
- No:(86)111752
87.07 10 230,000,000 2,300,000,000 167,600,000 1,676,000,000
Capitalization of earnings
NT$15,092,000
Employee bonuses
NT$15,880,000
Capital surplus NT$135,828,000
- No:(087)087118452
88.07 10 250,000,000 2,500,000,000 200,000,000 2,000,000,000
Capitalization of earnings
NT$301,680,000
Employee bonuses
NT$22,320,000
- No:(088)088126231
89.10 10 370,000,000 3,700,000,000 233,500,000 2,335,000,000
Capitalization of earnings
NT$300,000,000
Employee bonuses
NT$35,000,000
- No:(089)135122
90.03 10 370,000,000 3,700,000,000 239,890,794 2,398,907,940 CB conversion: NT$63,907,940 - No:(90)09001094870
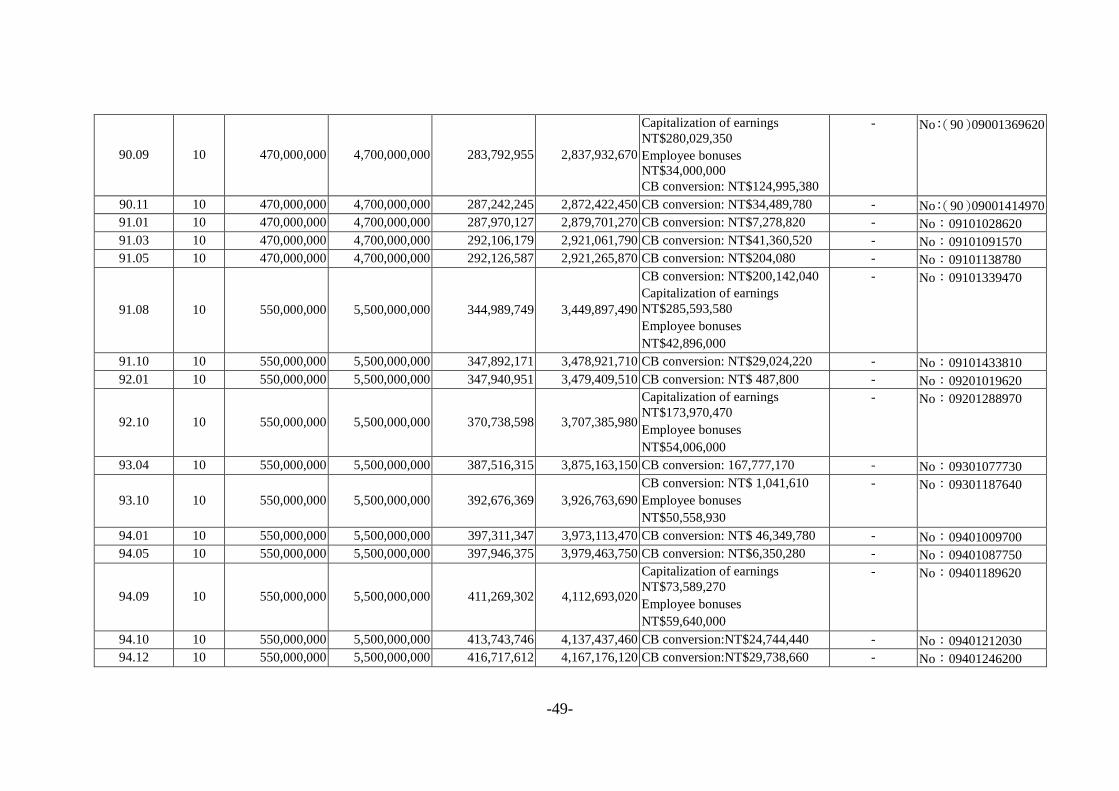
-49-
90.09 10 470,000,000 4,700,000,000 283,792,955 2,837,932,670
Capitalization of earnings
NT$280,029,350
Employee bonuses
NT$34,000,000
CB conversion: NT$124,995,380
- No:(90)09001369620
90.11 10 470,000,000 4,700,000,000 287,242,245 2,872,422,450 CB conversion: NT$34,489,780 - No:(90)09001414970
91.01 10 470,000,000 4,700,000,000 287,970,127 2,879,701,270 CB conversion: NT$7,278,820 - No:09101028620
91.03 10 470,000,000 4,700,000,000 292,106,179 2,921,061,790 CB conversion: NT$41,360,520 - No:09101091570
91.05 10 470,000,000 4,700,000,000 292,126,587 2,921,265,870 CB conversion: NT$204,080 - No:09101138780
91.08 10 550,000,000 5,500,000,000 344,989,749 3,449,897,490
CB conversion: NT$200,142,040
Capitalization of earnings
NT$285,593,580
Employee bonuses
NT$42,896,000
- No:09101339470
91.10 10 550,000,000 5,500,000,000 347,892,171 3,478,921,710 CB conversion: NT$29,024,220 - No:09101433810
92.01 10 550,000,000 5,500,000,000 347,940,951 3,479,409,510 CB conversion: NT$ 487,800 - No:09201019620
92.10 10 550,000,000 5,500,000,000 370,738,598 3,707,385,980
Capitalization of earnings
NT$173,970,470
Employee bonuses
NT$54,006,000
- No:09201288970
93.04 10 550,000,000 5,500,000,000 387,516,315 3,875,163,150 CB conversion: 167,777,170 - No:09301077730
93.10 10 550,000,000 5,500,000,000 392,676,369 3,926,763,690
CB conversion: NT$ 1,041,610
Employee bonuses
NT$50,558,930
- No:09301187640
94.01 10 550,000,000 5,500,000,000 397,311,347 3,973,113,470 CB conversion: NT$ 46,349,780 - No:09401009700
94.05 10 550,000,000 5,500,000,000 397,946,375 3,979,463,750 CB conversion: NT$6,350,280 - No:09401087750
94.09 10 550,000,000 5,500,000,000 411,269,302 4,112,693,020
Capitalization of earnings
NT$73,589,270
Employee bonuses
NT$59,640,000
- No:09401189620
94.10 10 550,000,000 5,500,000,000 413,743,746 4,137,437,460 CB conversion:NT$24,744,440 - No:09401212030
94.12 10 550,000,000 5,500,000,000 416,717,612 4,167,176,120 CB conversion:NT$29,738,660 - No:09401246200
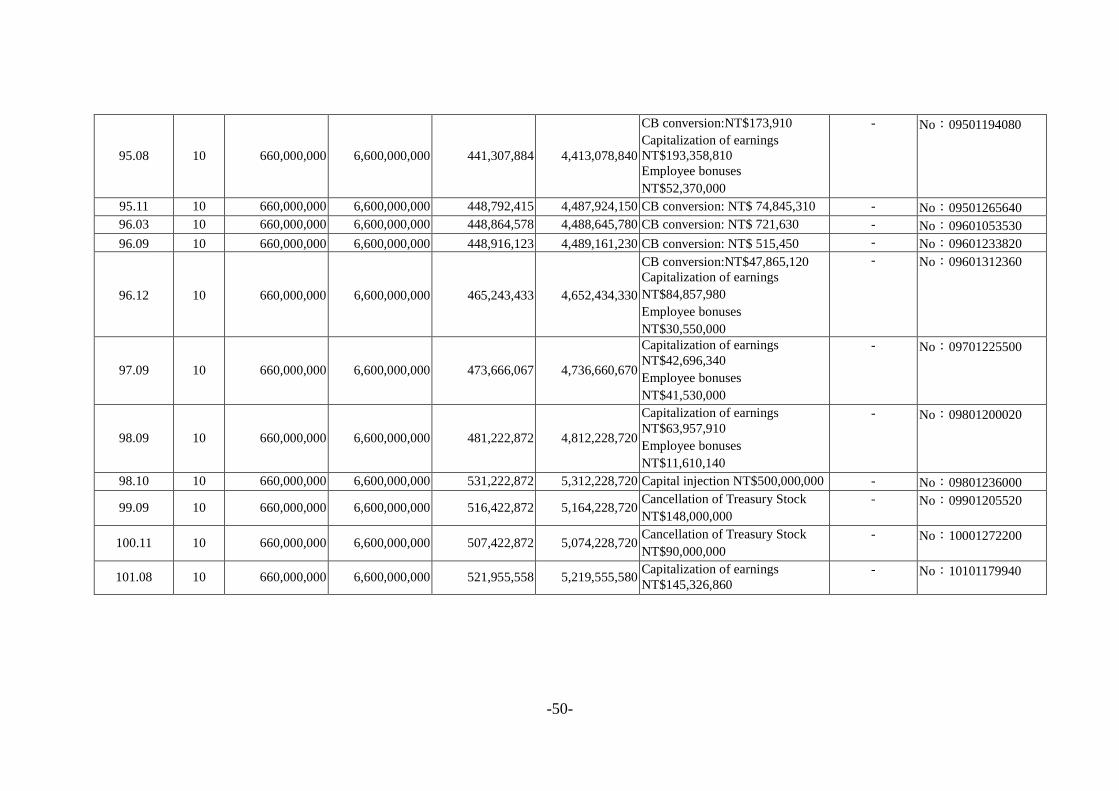
-50-
95.08 10 660,000,000 6,600,000,000 441,307,884 4,413,078,840
CB conversion:NT$173,910
Capitalization of earnings
NT$193,358,810
Employee bonuses
NT$52,370,000
- No:09501194080
95.11 10 660,000,000 6,600,000,000 448,792,415 4,487,924,150 CB conversion: NT$ 74,845,310 - No:09501265640
96.03 10 660,000,000 6,600,000,000 448,864,578 4,488,645,780 CB conversion: NT$ 721,630 - No:09601053530
96.09 10 660,000,000 6,600,000,000 448,916,123 4,489,161,230 CB conversion: NT$ 515,450 - No:09601233820
96.12 10 660,000,000 6,600,000,000 465,243,433 4,652,434,330
CB conversion:NT$47,865,120
Capitalization of earnings
NT$84,857,980
Employee bonuses
NT$30,550,000
- No:09601312360
97.09 10 660,000,000 6,600,000,000 473,666,067 4,736,660,670
Capitalization of earnings
NT$42,696,340
Employee bonuses
NT$41,530,000
- No:09701225500
98.09 10 660,000,000 6,600,000,000 481,222,872 4,812,228,720
Capitalization of earnings
NT$63,957,910
Employee bonuses
NT$11,610,140
- No:09801200020
98.10 10 660,000,000 6,600,000,000 531,222,872 5,312,228,720 Capital injection NT$500,000,000 - No:09801236000
99.09 10 660,000,000 6,600,000,000 516,422,872 5,164,228,720 Cancellation of Treasury Stock
NT$148,000,000
- No:09901205520
100.11 10 660,000,000 6,600,000,000 507,422,872 5,074,228,720 Cancellation of Treasury Stock
NT$90,000,000
- No:10001272200
101.08 10 660,000,000 6,600,000,000 521,955,558 5,219,555,580 Capitalization of earnings
NT$145,326,860
- No:10101179940

-51-
B. Type of Stock
As of 4/13/2014
Share Type Authorized Capital
Remarks Issued Shares Treasury Stock Un-issued Shares Total Shares
Common Stock 502,087,558 19,868,000 157,912,442 660,000,000 -
C. Information for Shelf Registration:None.
4.1.2 Status of Shareholders
As of 4/13/2014
Item Government
Agencies
Financial
Institutions
Other
Juridical
Person
Domestic
Natural
Persons
Foreign
Institutions &
Natural
Persons
Total
Number of
Shareholders 2 3 63 21,459 103 21,631
Shareholding
(shares) 40,016
27,971,935 162,943,070 253,646,487 77,354,050 521,955,558
Percentage % 0.01 5.36 31.22 48.60 14.82 100.00
4.1.3 Shareholding Distribution Status
A. Common Shares (The par value for each share is NT$10)
As of 4/13/2014
Class of Shareholding (Unit :
Share)
Number of
Shareholders
Shareholding
(Shares) Percentage %
1 - 999 11,251 2,273,577 0.44
1000 - 5000 6,913 14,381,586 2.76
5001 - 10000 1,541 10,178,653 1.95
10001 - 15000 734 8,269,408 1.58
15001 - 20000 252 4,403,189 0.84
20001 - 30000 342 8,034,456 1.54
30001 - 40000 139 4,650,918 0.89
40001 - 50000 66 2,956,384 0.57
50001 - 100000 180 12,658,565 2.43
100001 - 200000 93 12,615,959 2.42
200001 - 400000 45 12,451,574 2.39
400001 - 600000 23 11,143,762 2.14
600001 - 800000 8 5,496,011 1.05
800001 - 1000000 6 5,447,618 1.04
1000001 or over 38 406,993,898 77.97
Total: 21,631 521,955,558 100.00
B. Preferred Shares:None.
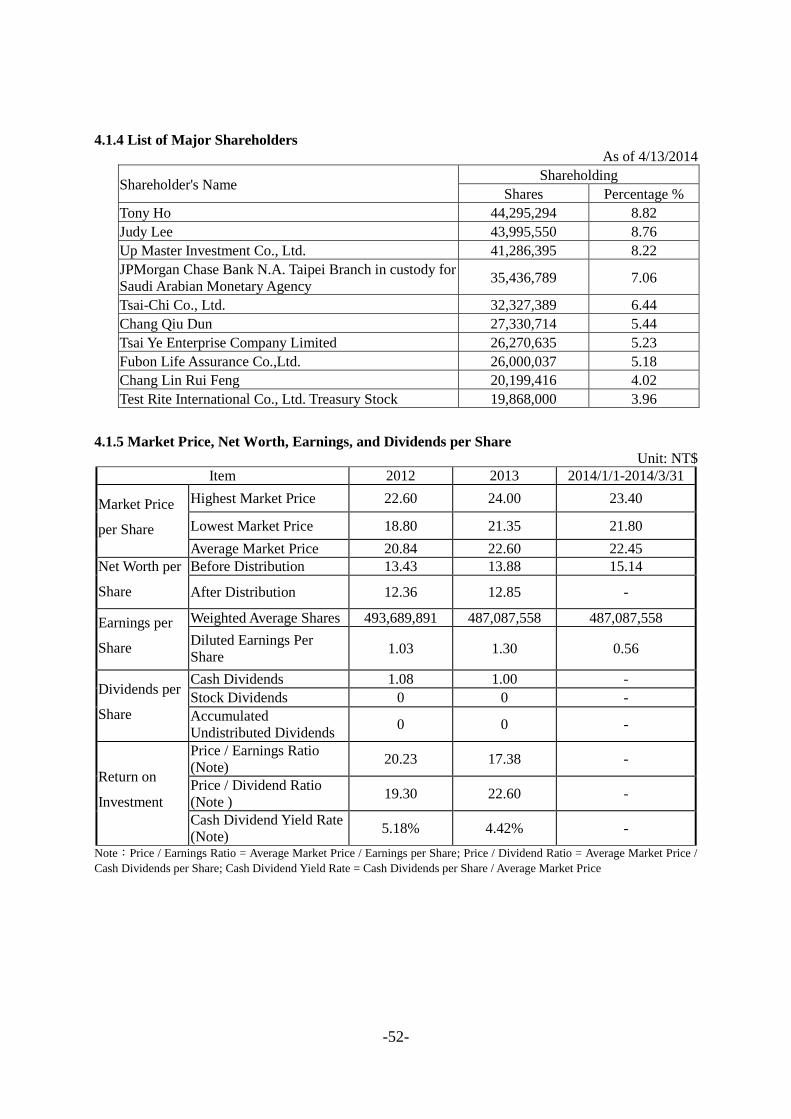
-52-
4.1.4 List of Major Shareholders
As of 4/13/2014
Shareholder's Name Shareholding
Shares Percentage %
Tony Ho 44,295,294 8.82
Judy Lee 43,995,550 8.76
Up Master Investment Co., Ltd. 41,286,395 8.22
JPMorgan Chase Bank N.A. Taipei Branch in custody for
Saudi Arabian Monetary Agency 35,436,789 7.06
Tsai-Chi Co., Ltd. 32,327,389 6.44
Chang Qiu Dun 27,330,714 5.44
Tsai Ye Enterprise Company Limited 26,270,635 5.23
Fubon Life Assurance Co.,Ltd. 26,000,037 5.18
Chang Lin Rui Feng 20,199,416 4.02
Test Rite International Co., Ltd. Treasury Stock 19,868,000 3.96
4.1.5 Market Price, Net Worth, Earnings, and Dividends per Share
Unit: NT$
Item 2012 2013 2014/1/1-2014/3/31
Market Price
per Share
Highest Market Price 22.60 24.00 23.40
Lowest Market Price 18.80 21.35 21.80
Average Market Price 20.84 22.60 22.45
Net Worth per
Share
Before Distribution 13.43 13.88 15.14
After Distribution 12.36 12.85 -
Earnings per
Share
Weighted Average Shares 493,689,891 487,087,558 487,087,558
Diluted Earnings Per
Share 1.03 1.30 0.56
Dividends per
Share
Cash Dividends 1.08 1.00 -
Stock Dividends 0 0 -
Accumulated
Undistributed Dividends 0 0 -
Return on
Investment
Price / Earnings Ratio
(Note) 20.23 17.38 -
Price / Dividend Ratio
(Note ) 19.30 22.60 -
Cash Dividend Yield Rate
(Note) 5.18% 4.42% -
Note:Price / Earnings Ratio = Average Market Price / Earnings per Share; Price / Dividend Ratio = Average Market Price /
Cash Dividends per Share; Cash Dividend Yield Rate = Cash Dividends per Share / Average Market Price
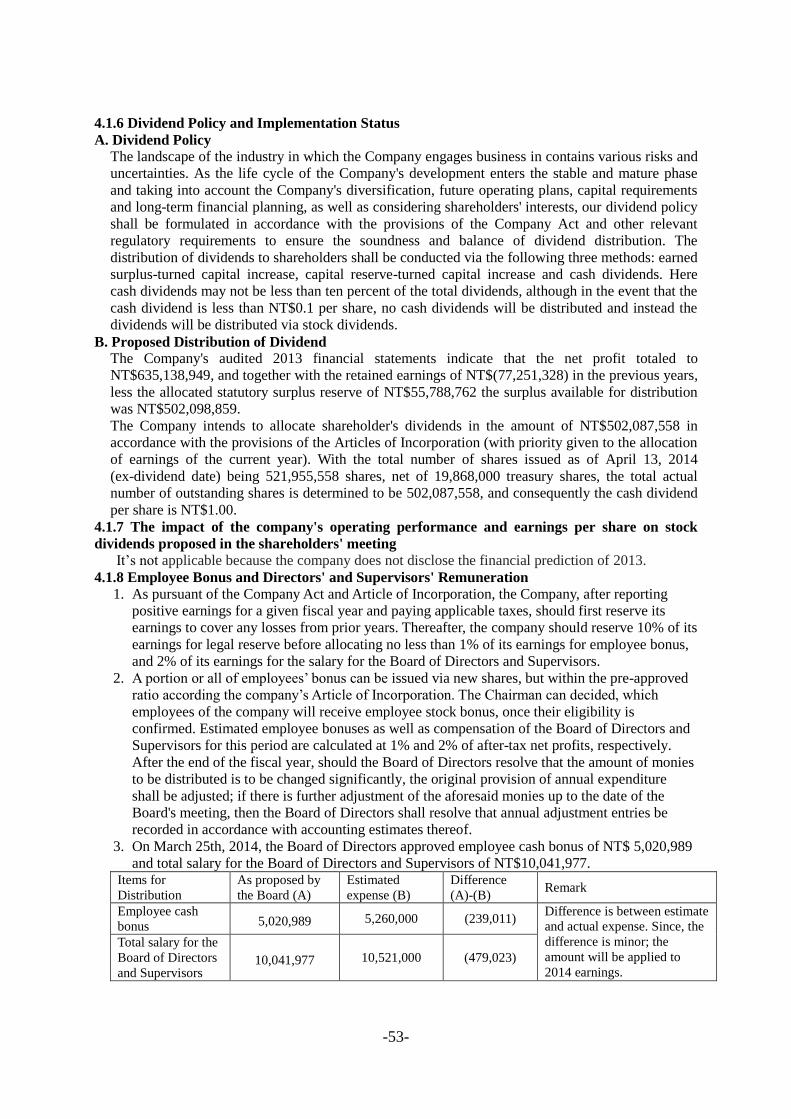
-53-
4.1.6 Dividend Policy and Implementation Status
A. Dividend Policy
The landscape of the industry in which the Company engages business in contains various risks and
uncertainties. As the life cycle of the Company's development enters the stable and mature phase
and taking into account the Company's diversification, future operating plans, capital requirements
and long-term financial planning, as well as considering shareholders' interests, our dividend policy
shall be formulated in accordance with the provisions of the Company Act and other relevant
regulatory requirements to ensure the soundness and balance of dividend distribution. The
distribution of dividends to shareholders shall be conducted via the following three methods: earned
surplus-turned capital increase, capital reserve-turned capital increase and cash dividends. Here
cash dividends may not be less than ten percent of the total dividends, although in the event that the
cash dividend is less than NT$0.1 per share, no cash dividends will be distributed and instead the
dividends will be distributed via stock dividends.
B. Proposed Distribution of Dividend
The Company's audited 2013 financial statements indicate that the net profit totaled to
NT$635,138,949, and together with the retained earnings of NT$(77,251,328) in the previous years,
less the allocated statutory surplus reserve of NT$55,788,762 the surplus available for distribution
was NT$502,098,859.
The Company intends to allocate shareholder's dividends in the amount of NT$502,087,558 in
accordance with the provisions of the Articles of Incorporation (with priority given to the allocation
of earnings of the current year). With the total number of shares issued as of April 13, 2014
(ex-dividend date) being 521,955,558 shares, net of 19,868,000 treasury shares, the total actual
number of outstanding shares is determined to be 502,087,558, and consequently the cash dividend
per share is NT$1.00.
4.1.7 The impact of the company's operating performance and earnings per share on stock
dividends proposed in the shareholders' meeting
It‘s not applicable because the company does not disclose the financial prediction of 2013.
4.1.8 Employee Bonus and Directors' and Supervisors' Remuneration
1. As pursuant of the Company Act and Article of Incorporation, the Company, after reporting
positive earnings for a given fiscal year and paying applicable taxes, should first reserve its
earnings to cover any losses from prior years. Thereafter, the company should reserve 10% of its
earnings for legal reserve before allocating no less than 1% of its earnings for employee bonus,
and 2% of its earnings for the salary for the Board of Directors and Supervisors.
2. A portion or all of employees‘ bonus can be issued via new shares, but within the pre-approved
ratio according the company‘s Article of Incorporation. The Chairman can decided, which
employees of the company will receive employee stock bonus, once their eligibility is
confirmed. Estimated employee bonuses as well as compensation of the Board of Directors and
Supervisors for this period are calculated at 1% and 2% of after-tax net profits, respectively.
After the end of the fiscal year, should the Board of Directors resolve that the amount of monies
to be distributed is to be changed significantly, the original provision of annual expenditure
shall be adjusted; if there is further adjustment of the aforesaid monies up to the date of the
Board's meeting, then the Board of Directors shall resolve that annual adjustment entries be
recorded in accordance with accounting estimates thereof.
3. On March 25th, 2014, the Board of Directors approved employee cash bonus of NT$ 5,020,989
and total salary for the Board of Directors and Supervisors of NT$10,041,977. Items for
Distribution
As proposed by
the Board (A)
Estimated
expense (B)
Difference
(A)-(B) Remark
Employee cash
bonus 5,020,989 5,260,000 (239,011) Difference is between estimate
and actual expense. Since, the
difference is minor; the
amount will be applied to
2014 earnings.
Total salary for the
Board of Directors
and Supervisors 10,041,977 10,521,000 (479,023)
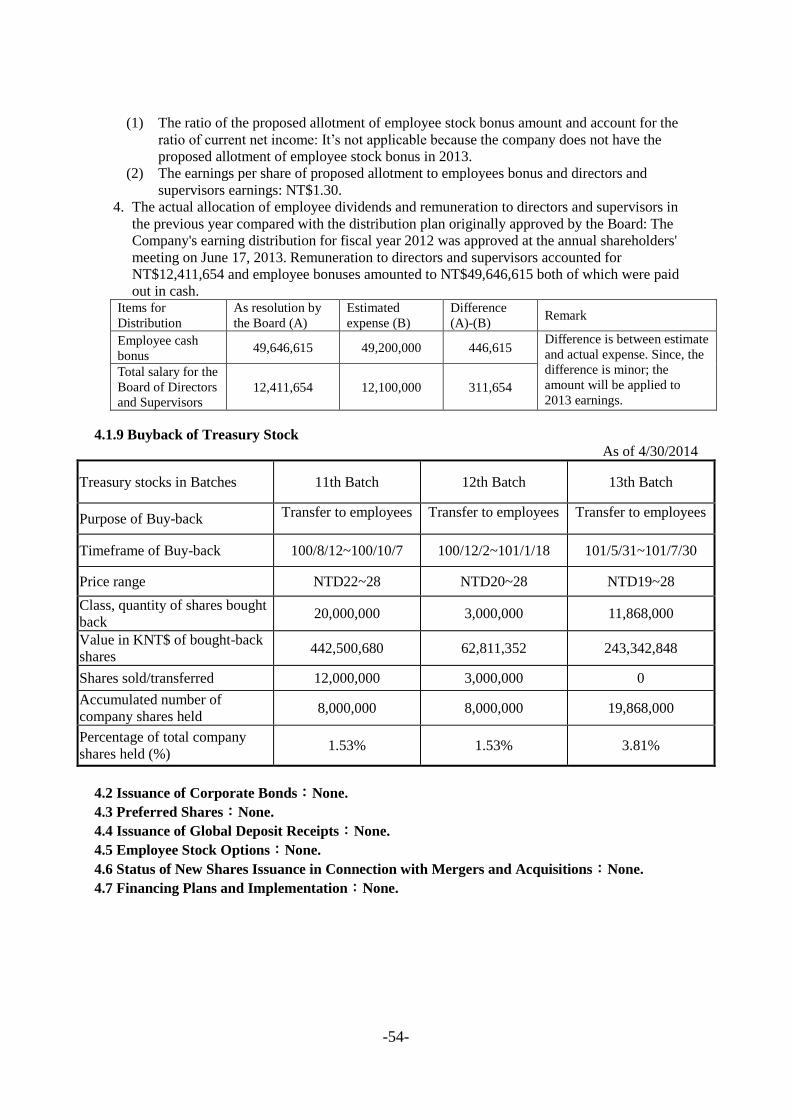
-54-
(1) The ratio of the proposed allotment of employee stock bonus amount and account for the
ratio of current net income: It‘s not applicable because the company does not have the
proposed allotment of employee stock bonus in 2013.
(2) The earnings per share of proposed allotment to employees bonus and directors and
supervisors earnings: NT$1.30.
4. The actual allocation of employee dividends and remuneration to directors and supervisors in
the previous year compared with the distribution plan originally approved by the Board: The
Company's earning distribution for fiscal year 2012 was approved at the annual shareholders'
meeting on June 17, 2013. Remuneration to directors and supervisors accounted for
NT$12,411,654 and employee bonuses amounted to NT$49,646,615 both of which were paid
out in cash. Items for
Distribution
As resolution by
the Board (A)
Estimated
expense (B)
Difference
(A)-(B) Remark
Employee cash
bonus 49,646,615 49,200,000 446,615
Difference is between estimate
and actual expense. Since, the
difference is minor; the
amount will be applied to
2013 earnings.
Total salary for the
Board of Directors
and Supervisors 12,411,654 12,100,000 311,654
4.1.9 Buyback of Treasury Stock
As of 4/30/2014
Treasury stocks in Batches 11th Batch 12th Batch 13th Batch
Purpose of Buy-back Transfer to employees Transfer to employees Transfer to employees
Timeframe of Buy-back 100/8/12~100/10/7 100/12/2~101/1/18 101/5/31~101/7/30
Price range NTD22~28 NTD20~28 NTD19~28
Class, quantity of shares bought
back 20,000,000 3,000,000 11,868,000
Value in KNT$ of bought-back
shares 442,500,680 62,811,352 243,342,848
Shares sold/transferred 12,000,000 3,000,000 0
Accumulated number of
company shares held 8,000,000 8,000,000 19,868,000
Percentage of total company
shares held (%) 1.53% 1.53% 3.81%
4.2 Issuance of Corporate Bonds:None.
4.3 Preferred Shares:None.
4.4 Issuance of Global Deposit Receipts:None.
4.5 Employee Stock Options:None.
4.6 Status of New Shares Issuance in Connection with Mergers and Acquisitions:None.
4.7 Financing Plans and Implementation:None.

-55-
V. Operational Highlights
5.1 Business Activities
5.1.1 Business Scope
1. The main content of the company's current business operations
(1) E605010 Computing Equipments Installation Construction
(2) E801010 Building Maintenance and Upholstery
(3) F101081 Wholesale of Seedling
(4) F101100 Wholesale of Flowers
(5) F101120 Wholesale of Aquarium Fishes
(6) F101130 Wholesale of Vegetable and Fruits
(7) F102020 Wholesale of Edible Oil
(8) F102030 Wholesale of Tobacco Products and Alcoholic Beverages
(9) F102040 Wholesale of Nonalcoholic Beverages
(10) F102170 Wholesale of Food and Grocery
(11) F103010 Wholesale of Animal Feeds
(12) F104110 Wholesale of Cloths, Clothes, Shoes, Hat, Umbrella and Apparel,
Clothing Accessories and Other Textile Products
(13) F105050 Wholesale of Furniture, Bedclothes Kitchen Equipment and Fixtures
(14) F106010 Wholesale of Ironware
(15) F106020 Wholesale of Articles for Daily Use
(16) F106030 Wholesale of Die
(17) F106040 Wholesale of Water Containers
(18) F106050 Wholesale of Pottery, Porcelain and Glassware
(19) F107030 Wholesale of Cleaning Preparations
(20) F107050 Wholesale of Manure
(21) F108040 Wholesale of Cosmetics
(22) F109070 Wholesale of Stationery Articles, Musical Instruments and Educational
Entertainment Articles
(23) F110010 Wholesale of Clocks and Watches
(24) F110020 Wholesale of Spectacles
(25) F111090 Wholesale of Building Materials
(26) F113010 Wholesale of Machinery
(27) F113020 Wholesale of Household Appliance
(28) F113030 Wholesale of Precision Instruments
(29) F113050 Wholesale of Computing and Business Machinery Equipment
(30) F113060 Wholesale of Metrological Instruments
(31) F113070 Wholesale of Telecom Instruments
(32) F113090 Wholesale of Traffic Signal Equipments and Materials
(33) F114010 Wholesale of Automobiles
(34) F114020 Wholesale of Motorcycles
(35) F114030 Wholesale of Motor Vehicle Parts and Supplies
(36) F114040 Wholesale of Bicycle Parts and Supplies
(37) F115010 Wholesale of Jewelry and Precious Metals
(38) F116010 Wholesale of Photographic Equipment
(39) F118010 Wholesale of Computer Software
(40) F119010 Wholesale of Electronic Materials
(41) F199990 Other Wholesale Trade
(42) F201010 Retail sale of Agricultural Products
(43) F201020 Retail sale of Husbandry Products
(44) F201061 Retail sale of Seedling
(45) F201070 Retail sale of Flowers
(46) F201090 Retail Sale of Aquarium Fishes
(47) F202010 Retail sale of Animal Feeds

-56-
(48) F203020 Retail Sale of Tobacco and Alcoholic Drinks
(49) F204110 Retail sale of Cloths, Clothes, Shoes, Hat, Umbrella and Apparel,
Clothing Accessories and Other Textile Products
(50) F205040 Retail sale of Furniture, Bedclothes, Kitchen Equipment and Fixtures
(51) F206010 Retail Sale of Ironware
(52) F206020 Retail Sale of Articles for Daily Use
(53) F207030 Retail Sale of Cleaning Preparations
(54) F207050 Retail Sale of Manure
(55) F208040 Retail Sale of Cosmetics
(56) F209060 Retail sale of Stationery Articles, Musical Instruments and Educational
Entertainment Articles
(57) F210010 Retail Sale of Watches and Clocks
(58) F210020 Retail Sale of Spectacles
(59) F211010 Retail Sale of Building Materials
(60) F213010 Retail Sale of Household Appliance
(61) F213030 Retail sale of Computing and Business Machinery Equipment
(62) F213040 Retail Sale of Precision Instruments
(63) F213050 Retail Sale of Metrological Instruments
(64) F213080 Retail Sale of Other Machinery and Equipment
(65) F214010 Retail Sale of Automobiles
(66) F214030 Retail Sale of Motor Vehicle Parts and Supplies
(67) F214040 Retail Sale of Bicycles and Parts
(68) F215010 Retail Sale of Jewelry and Precious Spectacles Metals
(69) F216010 Retail Sale of Photographic Equipment
(70) F218010 Retail Sale of Computer Software
(71) F299990 Retail Sale of Other Retail Trade Not Elsewhere Classified
(72) F301020 Supermarkets
(73) F399040 Retail Business Without Shop
(74) F399010 Supermarkets
(75) F401010 International Trade
(76) F401071 Export and Import of Seedling
(77) F501060 Restaurants
(78) G801010 Warehousing and Storage
(79) H701020 Industrial Factory Buildings Lease Construction and Development
(80) H701010 Residence and Buildings Lease Construction and Development
(81) H703090 Real Estate Commerce
(82) H703100 Real Estate Rental and Leasing
(83) I102010 Investment Consultancy
(84) I103060 Management Consulting Services
(85) I301010 Software Design Services
(86) I301020 Data Processing Services
(87) I301030 Digital Information Supply Services
(88) I401010 General Advertising Services
(89) I501010 Product Designing
(90) I503010 Landscape and Interior Designing
(91) IZ99990 Other Industry and Commerce Services Not Elsewhere Classified
(92) J801030 Athletics and Recreational Sports Stadium
(93) JE01010 Rental and Leasing Business
(94) ZZ99999 Except the permitted business, the Company may engage in other
businesses not prohibited or restricted by laws and regulations
(95) A102060 Grain Commerce
(96) F108031 Wholesale of Drugs, Medical Goods
(97) F208031 Retail sale of Medical Equipments
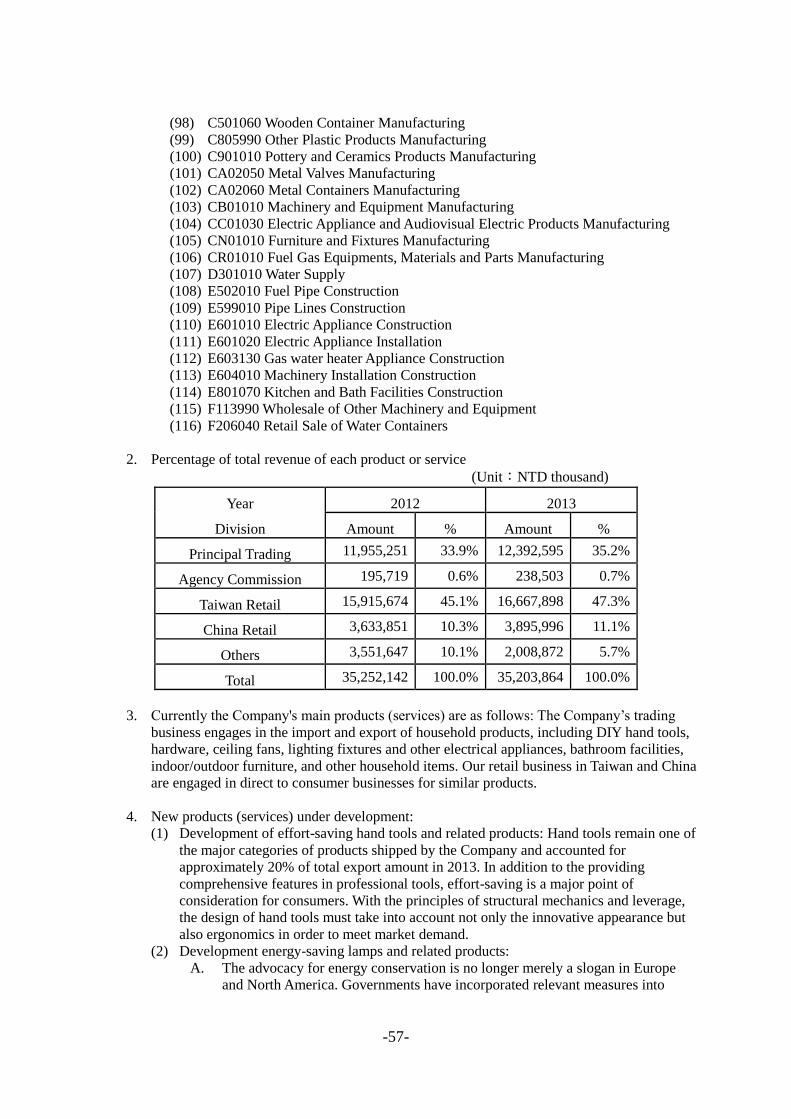
-57-
(98) C501060 Wooden Container Manufacturing
(99) C805990 Other Plastic Products Manufacturing
(100) C901010 Pottery and Ceramics Products Manufacturing
(101) CA02050 Metal Valves Manufacturing
(102) CA02060 Metal Containers Manufacturing
(103) CB01010 Machinery and Equipment Manufacturing
(104) CC01030 Electric Appliance and Audiovisual Electric Products Manufacturing
(105) CN01010 Furniture and Fixtures Manufacturing
(106) CR01010 Fuel Gas Equipments, Materials and Parts Manufacturing
(107) D301010 Water Supply
(108) E502010 Fuel Pipe Construction
(109) E599010 Pipe Lines Construction
(110) E601010 Electric Appliance Construction
(111) E601020 Electric Appliance Installation
(112) E603130 Gas water heater Appliance Construction
(113) E604010 Machinery Installation Construction
(114) E801070 Kitchen and Bath Facilities Construction
(115) F113990 Wholesale of Other Machinery and Equipment
(116) F206040 Retail Sale of Water Containers
2. Percentage of total revenue of each product or service
(Unit:NTD thousand)
Year 2012 2013
Division Amount % Amount %
Principal Trading 11,955,251 33.9% 12,392,595 35.2%
Agency Commission 195,719 0.6% 238,503 0.7%
Taiwan Retail 15,915,674 45.1% 16,667,898 47.3%
China Retail 3,633,851 10.3% 3,895,996 11.1%
Others 3,551,647 10.1% 2,008,872 5.7%
Total 35,252,142 100.0% 35,203,864 100.0%
3. Currently the Company's main products (services) are as follows: The Company‘s trading
business engages in the import and export of household products, including DIY hand tools,
hardware, ceiling fans, lighting fixtures and other electrical appliances, bathroom facilities,
indoor/outdoor furniture, and other household items. Our retail business in Taiwan and China
are engaged in direct to consumer businesses for similar products.
4. New products (services) under development:
(1) Development of effort-saving hand tools and related products: Hand tools remain one of
the major categories of products shipped by the Company and accounted for
approximately 20% of total export amount in 2013. In addition to the providing
comprehensive features in professional tools, effort-saving is a major point of
consideration for consumers. With the principles of structural mechanics and leverage,
the design of hand tools must take into account not only the innovative appearance but
also ergonomics in order to meet market demand.
(2) Development energy-saving lamps and related products:
A. The advocacy for energy conservation is no longer merely a slogan in Europe
and North America. Governments have incorporated relevant measures into
-58-
legislations and policies to encourage investments by private enterprises.
B. Lamps and light fixtures are also a category of products exported by the
Company. Apart from the modern designs of their exterior, lamps shipped by the
Company contain automatic cut-off loop control circuitry to prevent consumers
from misusing light bulbs that do not conform to the correct specifications and
wasting energy; this helps to put the concept of energy conservation into practice
effectively in product design.
5.1.2 Industry Overview
1. Current status and development of the industries
The Company was founded in the August, 1978. During its earlier years, the Company
focused on the export of hand tools and hardware. As the Company's customer base expanded,
the product offerings also increased, including DIY hand tools and hardware to ceiling fans,
light fixtures and other electrical appliances, bathroom equipment, indoor/outdoor furniture
and other household items. The Company also gradually expanded operations into China,
Southeast Asia (Hong Kong, Thailand and Singapore), Europe (Germany and the U.K.) and
Australia by setting up subsidiaries, representative offices or branch offices. In 1989, the
Company targeted Taiwan‘s domestic retail market and established a domestic sales/import
team, targeting major discount store customers in Taiwan. By leveraging the company‘s
sourcing capabilities, the domestic sales/import team introduced +1,000 products to Taiwan
consumers that were exclusively sourced for the export market originally. In 1995, Test Rite
entered into a joint venture agreement with Kingfisher of the U.K. to introduce DIY retailer
B&Q in Taiwan. The following, the company developed its own retail channel Hola in Taiwan
and later in December 2004 entered the China retailer market when first Hola China stored
opened in Shanghai.
Below we describe the industry dynamics for trading and retail:
(1) Market Conditions of the trading business
From the early import-substitution policy and export expansion policy in the 1960s
to the current policy of trade liberalization and internationalization, Taiwan has
experienced rapid trade expansion. During a period of 19 years spanning from 1994 to
2013, Taiwan's total import/export trade has continued to see substantial growth (see
table below). In recent years, trading activities with mainland China have become
increasingly important given the emergency of China as the world‘s manufacturing hub.
In 2013 and 2013 Taiwan's the amount of export to China accounted for 40% of the
island's total exports, and import from China amounted to 16% of total imports for both
2012 and 2013.
Test Rite Group has aggressively expanded its presence in China. Since Shanghai
trading subsidiary was founded in 2005, the Group has maintained a solid relationship
with Chinese suppliers. In 2006, the company opened its Shenzhen office to tap into the
vast supplier/vendor network in the Pearl River Delta and Southern China. Most recently,
Test-Rite further entrenched its presence in Shenzhen by acquiring 100% stake in
International Art, a trading company specializes in the design and sourcing of Seasonal
and Home Décor products.
Upholding its business philosophy of "Everything in the home is Test Rite's
business," the Test Rite Group has continued to introduce famous international brands
and products so that, through the brands it distributes, consumers in Taiwan and China
may enjoy world-class convenience and quality of life. Rising consumer demand in
Taiwan and China also offers another growth opportunity for Test-Rite. The company is
the agent for home furnishing/home décor/other home related products such as Frette,
La-Z-Boy, Joseph Joseph, OXO, 7th Generation, and Joyoung. The company intends to
further strengthen its agent brand portfolio and leverage its retail channels Hola and
TLW to gain additional access to the rapidly growing consumer market in Taiwan and
China.

-59-
Import/Export Amounts by Year - Taiwan (Unit:USD million)
Year Total
exports
Export Growth rate (%)
Total imports
Import Growth rate
(%)
Total amount of
trade
Total trade growth rate
%
1994 94,300.4 9.7 85,698.0 10.7 179,998.4 10.19
1995 113,342.0 20.2 104,011.6 21.4 217,353.6 20.75
1996 117,581.0 3.7 102,922.4 -1.0 220,503.4 1.45
1997 124,170.2 5.6 114,955.4 11.7 239,125.6 8.45
1998 112,595.4 -9.3 105,229.8 -8.5 217,825.2 -8.91
1999 123,733.3 9.9 111,196.1 5.7 234,929.4 7.85
2000 151,949.8 22.8 140,732.0 26.6 292,681.8 24.58
2001 126,314.3 -16.9 107,970.6 -23.3 234,284.9 -19.95
2002 135,316.7 7.1 113,245.1 4.9 248,561.8 6.09
2003 150,600.5 11.3 128,010.1 13.0 278,610.6 12.09
2004 182,370.4 21.1 168,757.6 31.8 351,128.0 26.03
2005 198,431.7 8.8 182,614.4 8.2 381,046.1 8.52
2006 224,017.3 12.9 202,698.1 11.0 426,715.4 11.99
2007 246,676.9 10.1 219,251.6 8.2 465,928.5 9.19
2008 255,628.7 3.6 240,447.8 9.7 496,076.5 6.47
2009 203,674.6 -20.3 174,370.6 -27.5 378,045.2 -23.79
2010 274,600.6 34.8 251,236.4 44.1 525,837.0 39.09
2011 308,257.3 12.3 281,437.5 12.0 589,694.8 12.14
2012 301,180.9 -2.3 270,472.7 -3.9 571,653.6 -3.06
2013 305,451.9 1.4 270,070.8 -0.1 575,522.7 0.68
Source:Department of Statistics, Ministry of Finance, R.O.C.
The overall business operation of an import/export business can be more complex
relative to other industries. The major factors that affect trading business include FOREX
fluctuations and non-economic barriers to trade such as government policy, trade
protectionism, customs, and regional alliances. The fluctuations of exchange rates can be
regarded as the main factor that would affect the profitability, i.e. margins of the trading
business, where as non-economic barriers can create challenging hurdles especially when
expanding overseas presence in various markets.
Regional economic integration has become the mainstream of international trade
and economic development at present. And with the formation of the World Trade
Organization (WTO) and later the Association of Southeast Asian nations (ASEAN),
when combined with the increasing frequency of cross-strait trades, the trading sector in
Taiwan is now facing a new challenge. In the following we present our view of Taiwan's
current trade development from the viewpoints of trade concentration, development of
triangular trade, increasing scale and internationalization of customers and the trends
toward multi-function trading companies.
A. Degrees of export/import concentration have increased while trading with Asian
countries have become more frequent
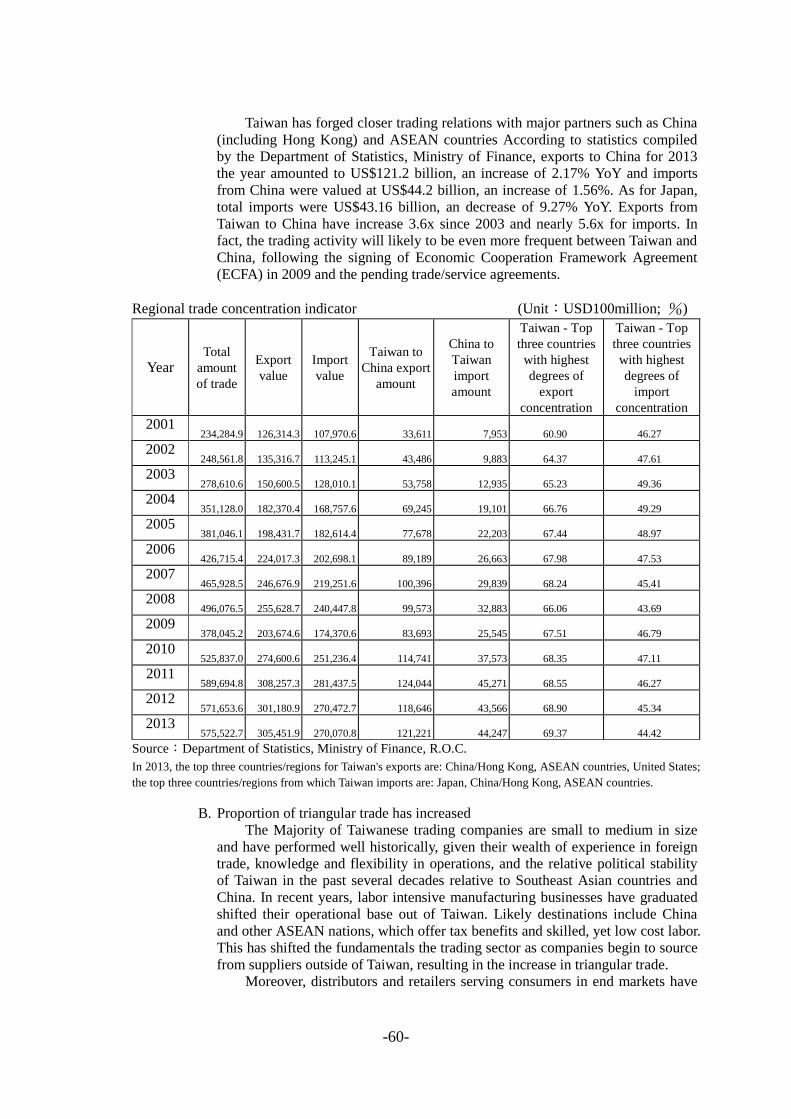
-60-
Taiwan has forged closer trading relations with major partners such as China
(including Hong Kong) and ASEAN countries According to statistics compiled
by the Department of Statistics, Ministry of Finance, exports to China for 2013
the year amounted to US$121.2 billion, an increase of 2.17% YoY and imports
from China were valued at US$44.2 billion, an increase of 1.56%. As for Japan,
total imports were US$43.16 billion, an decrease of 9.27% YoY. Exports from
Taiwan to China have increase 3.6x since 2003 and nearly 5.6x for imports. In
fact, the trading activity will likely to be even more frequent between Taiwan and
China, following the signing of Economic Cooperation Framework Agreement
(ECFA) in 2009 and the pending trade/service agreements.
Regional trade concentration indicator (Unit:USD100million; %)
Year Total
amount
of trade
Export
value
Import
value
Taiwan to
China export
amount
China to
Taiwan
import
amount
Taiwan - Top
three countries
with highest
degrees of
export
concentration
Taiwan - Top
three countries
with highest
degrees of
import
concentration
2001 234,284.9 126,314.3 107,970.6 33,611 7,953 60.90 46.27
2002 248,561.8 135,316.7 113,245.1 43,486 9,883 64.37 47.61
2003 278,610.6 150,600.5 128,010.1 53,758 12,935 65.23 49.36
2004 351,128.0 182,370.4 168,757.6 69,245 19,101 66.76 49.29
2005 381,046.1 198,431.7 182,614.4 77,678 22,203 67.44 48.97
2006 426,715.4 224,017.3 202,698.1 89,189 26,663 67.98 47.53
2007 465,928.5 246,676.9 219,251.6 100,396 29,839 68.24 45.41
2008 496,076.5 255,628.7 240,447.8 99,573 32,883 66.06 43.69
2009 378,045.2 203,674.6 174,370.6 83,693 25,545 67.51 46.79
2010 525,837.0 274,600.6 251,236.4 114,741 37,573 68.35 47.11
2011 589,694.8 308,257.3 281,437.5 124,044 45,271 68.55 46.27
2012 571,653.6 301,180.9 270,472.7 118,646 43,566 68.90 45.34
2013 575,522.7 305,451.9 270,070.8 121,221 44,247 69.37 44.42
Source:Department of Statistics, Ministry of Finance, R.O.C.
In 2013, the top three countries/regions for Taiwan's exports are: China/Hong Kong, ASEAN countries, United States;
the top three countries/regions from which Taiwan imports are: Japan, China/Hong Kong, ASEAN countries.
B. Proportion of triangular trade has increased
The Majority of Taiwanese trading companies are small to medium in size
and have performed well historically, given their wealth of experience in foreign
trade, knowledge and flexibility in operations, and the relative political stability
of Taiwan in the past several decades relative to Southeast Asian countries and
China. In recent years, labor intensive manufacturing businesses have graduated
shifted their operational base out of Taiwan. Likely destinations include China
and other ASEAN nations, which offer tax benefits and skilled, yet low cost labor.
This has shifted the fundamentals the trading sector as companies begin to source
from suppliers outside of Taiwan, resulting in the increase in triangular trade.
Moreover, distributors and retailers serving consumers in end markets have
-61-
benefited from increase in scalability and internalization. As a result, the supply
and demand structure of the upstream and downstream sectors of trading sector in
Taiwan have shifted to accommodate the change in the competitive landscape. In
fact, trading companies must rely on triangular trade to thrive and to seek cheaper
resources from overseas markets in order to fill the void left by the loss of price
competitiveness as manufacturing base relocate to China and ASEAN regions.
C. Impact on Taiwan's trading sector due to the growth in size of manufacturers,
trading companies and retailers
Following decades of industrial development both at home and abroad,
manufacturers have benefited from significant increase in production scale. Given
the increase in scale, large manufacturers has benefitted from more efficient
production given lower production and labor costs, while improving their
relationships with key customers. Larger trading companies too are also able
leverage development of global trades and benefit from scalable logistics and
procurement capabilities. However, this scenario enervates the impact for small
and medium trading companies, who are forced to accept lower margins with
higher complexity for single orders such as smaller quantity and higher SKUs
compared with more mainstream, scalable and repeatable orders.
The rapid development of sales channels has also contributed to the growth
of large multinational retail chains. These large retailers have not only gained
dominating pricing powers; their transnational procurement activities have also
contributed to domestic traders developing multinational logistics and
procurement services, thereby furthering increasing the speed of the
transformation of the trading business where smaller players are gradually
marginalized.
D. Trading firms are equipped with multiple functions such as after-sales services,
warehousing and logistics
As global retailers continue to increase in size, they are able to gain
bargaining leverage on their suppliers, which include manufacturers, distributors
and trading companies. Consequently, these global retailers continues to demand
better pricing, the newest and exclusive designs, and other services such as
financing, and logistic.
As such, role player traditional companies have evolved from companies
providing simple buy and sell functions to companies with multi-national and
multi-functional teams that able to provide services such as product marketing,
warehouse logistics, QA/QC, and after sale customer service.
Taiwan's trade industry is expected to benefit from the signing of Economic
Cooperation Framework Agreement (ECFA) with China. As economic activities
increase, Taiwanese trading companies can benefit from their experience in
international trade to strengthen communication between multi-national retailers
(customers) and various players along the supply chain.
Trading companies are also well positioned to benefit from to develop
additional brand licensing opportunities to tap the fast growing demand of
Chinese consumers. For Test-Rite, we have already partnered with various global
houseware/product brands, including LA-Z-BOY、Umbra、 Frette、Joseph Joseph、
Bissell、Joyoung、StanleyBlack&Decker、OXO、WEDGWOOD、7th Generation
for Taiwan and China markets.
(2) Principal trading
Test Rite major products include hand tools (including hand tools and gardening
tools; which account for 20% of total revenue) and household items (including sanitary
equipment, automo supplies, fireplace equipment and supplies, furniture, Christmas and
seasonal products, and barbecue utensils; which account for 60% of total revenue),
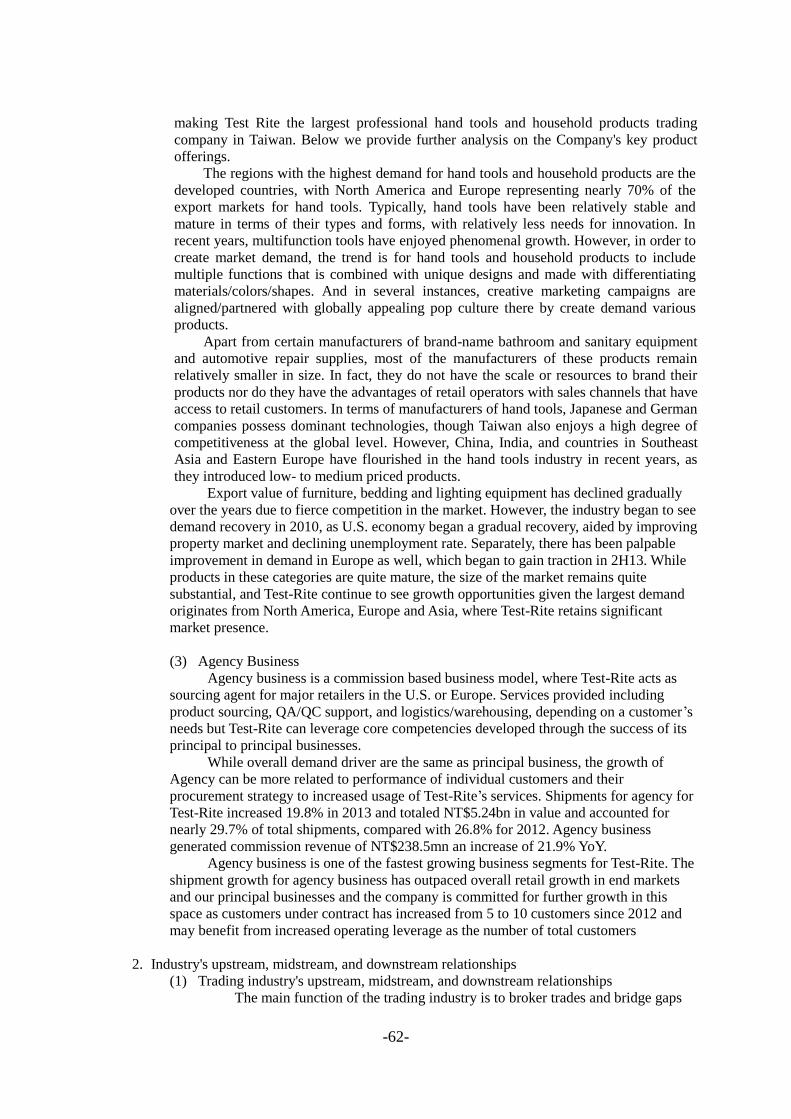
-62-
making Test Rite the largest professional hand tools and household products trading
company in Taiwan. Below we provide further analysis on the Company's key product
offerings.
The regions with the highest demand for hand tools and household products are the
developed countries, with North America and Europe representing nearly 70% of the
export markets for hand tools. Typically, hand tools have been relatively stable and
mature in terms of their types and forms, with relatively less needs for innovation. In
recent years, multifunction tools have enjoyed phenomenal growth. However, in order to
create market demand, the trend is for hand tools and household products to include
multiple functions that is combined with unique designs and made with differentiating
materials/colors/shapes. And in several instances, creative marketing campaigns are
aligned/partnered with globally appealing pop culture there by create demand various
products.
Apart from certain manufacturers of brand-name bathroom and sanitary equipment
and automotive repair supplies, most of the manufacturers of these products remain
relatively smaller in size. In fact, they do not have the scale or resources to brand their
products nor do they have the advantages of retail operators with sales channels that have
access to retail customers. In terms of manufacturers of hand tools, Japanese and German
companies possess dominant technologies, though Taiwan also enjoys a high degree of
competitiveness at the global level. However, China, India, and countries in Southeast
Asia and Eastern Europe have flourished in the hand tools industry in recent years, as
they introduced low- to medium priced products.
Export value of furniture, bedding and lighting equipment has declined gradually
over the years due to fierce competition in the market. However, the industry began to see
demand recovery in 2010, as U.S. economy began a gradual recovery, aided by improving
property market and declining unemployment rate. Separately, there has been palpable
improvement in demand in Europe as well, which began to gain traction in 2H13. While
products in these categories are quite mature, the size of the market remains quite
substantial, and Test-Rite continue to see growth opportunities given the largest demand
originates from North America, Europe and Asia, where Test-Rite retains significant
market presence.
(3) Agency Business
Agency business is a commission based business model, where Test-Rite acts as
sourcing agent for major retailers in the U.S. or Europe. Services provided including
product sourcing, QA/QC support, and logistics/warehousing, depending on a customer‘s
needs but Test-Rite can leverage core competencies developed through the success of its
principal to principal businesses.
While overall demand driver are the same as principal business, the growth of
Agency can be more related to performance of individual customers and their
procurement strategy to increased usage of Test-Rite‘s services. Shipments for agency for
Test-Rite increased 19.8% in 2013 and totaled NT$5.24bn in value and accounted for
nearly 29.7% of total shipments, compared with 26.8% for 2012. Agency business
generated commission revenue of NT$238.5mn an increase of 21.9% YoY.
Agency business is one of the fastest growing business segments for Test-Rite. The
shipment growth for agency business has outpaced overall retail growth in end markets
and our principal businesses and the company is committed for further growth in this
space as customers under contract has increased from 5 to 10 customers since 2012 and
may benefit from increased operating leverage as the number of total customers
2. Industry's upstream, midstream, and downstream relationships
(1) Trading industry's upstream, midstream, and downstream relationships The main function of the trading industry is to broker trades and bridge gaps
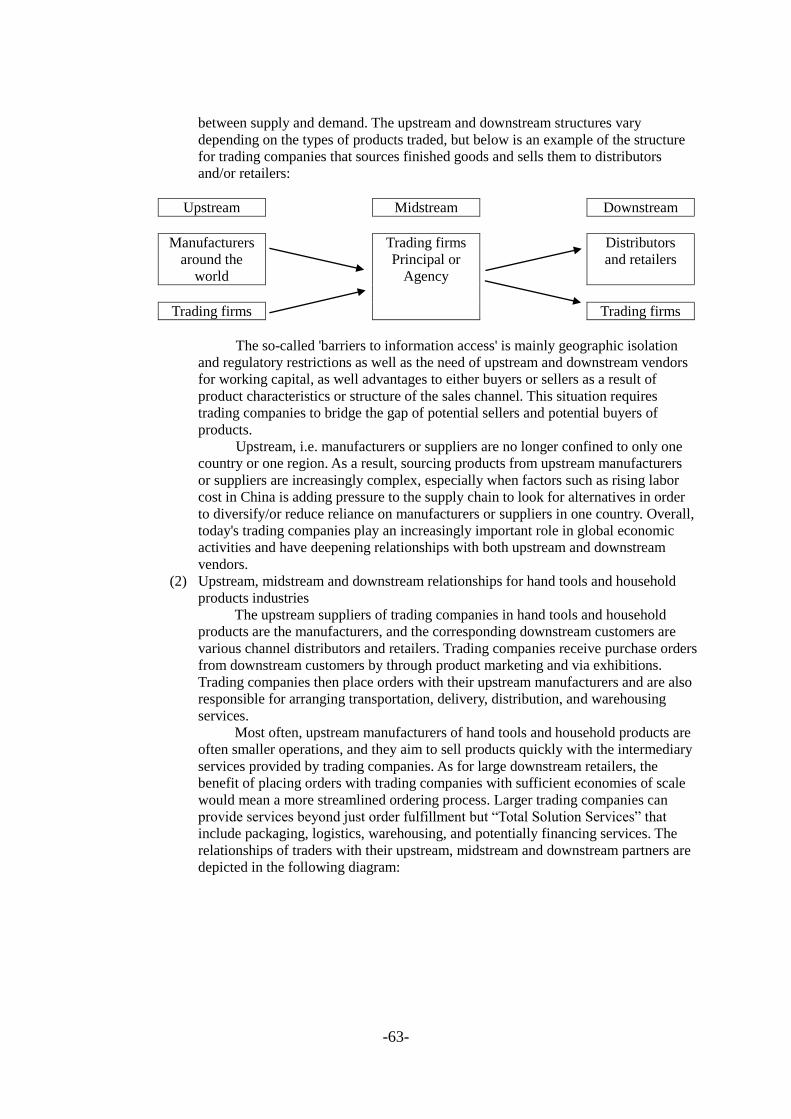
-63-
between supply and demand. The upstream and downstream structures vary
depending on the types of products traded, but below is an example of the structure
for trading companies that sources finished goods and sells them to distributors
and/or retailers:
Upstream Midstream Downstream
Manufacturers
around the
world
Trading firms
Principal or
Agency
Distributors
and retailers
Trading firms Trading firms
The so-called 'barriers to information access' is mainly geographic isolation
and regulatory restrictions as well as the need of upstream and downstream vendors
for working capital, as well advantages to either buyers or sellers as a result of
product characteristics or structure of the sales channel. This situation requires
trading companies to bridge the gap of potential sellers and potential buyers of
products.
Upstream, i.e. manufacturers or suppliers are no longer confined to only one
country or one region. As a result, sourcing products from upstream manufacturers
or suppliers are increasingly complex, especially when factors such as rising labor
cost in China is adding pressure to the supply chain to look for alternatives in order
to diversify/or reduce reliance on manufacturers or suppliers in one country. Overall,
today's trading companies play an increasingly important role in global economic
activities and have deepening relationships with both upstream and downstream
vendors.
(2) Upstream, midstream and downstream relationships for hand tools and household
products industries
The upstream suppliers of trading companies in hand tools and household
products are the manufacturers, and the corresponding downstream customers are
various channel distributors and retailers. Trading companies receive purchase orders
from downstream customers by through product marketing and via exhibitions.
Trading companies then place orders with their upstream manufacturers and are also
responsible for arranging transportation, delivery, distribution, and warehousing
services.
Most often, upstream manufacturers of hand tools and household products are
often smaller operations, and they aim to sell products quickly with the intermediary
services provided by trading companies. As for large downstream retailers, the
benefit of placing orders with trading companies with sufficient economies of scale
would mean a more streamlined ordering process. Larger trading companies can
provide services beyond just order fulfillment but ―Total Solution Services‖ that
include packaging, logistics, warehousing, and potentially financing services. The
relationships of traders with their upstream, midstream and downstream partners are
depicted in the following diagram:
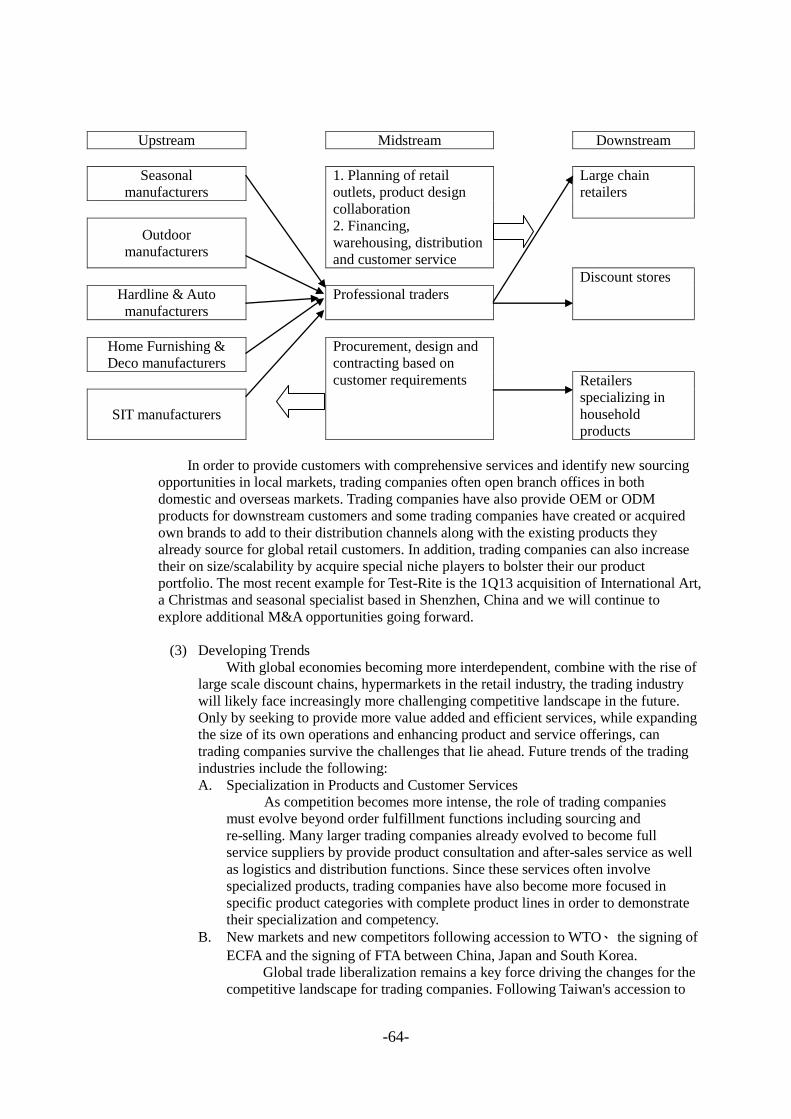
-64-
Upstream Midstream Downstream
Seasonal
manufacturers
1. Planning of retail
outlets, product design
collaboration
2. Financing,
warehousing, distribution
and customer service
Large chain
retailers
Outdoor
manufacturers
Discount stores
Hardline & Auto manufacturers
Professional traders
Home Furnishing &
Deco manufacturers
Procurement, design and
contracting based on
customer requirements
Retailers
specializing in
household
products SIT manufacturers
In order to provide customers with comprehensive services and identify new sourcing
opportunities in local markets, trading companies often open branch offices in both
domestic and overseas markets. Trading companies have also provide OEM or ODM
products for downstream customers and some trading companies have created or acquired
own brands to add to their distribution channels along with the existing products they
already source for global retail customers. In addition, trading companies can also increase
their on size/scalability by acquire special niche players to bolster their our product
portfolio. The most recent example for Test-Rite is the 1Q13 acquisition of International Art,
a Christmas and seasonal specialist based in Shenzhen, China and we will continue to
explore additional M&A opportunities going forward.
(3) Developing Trends
With global economies becoming more interdependent, combine with the rise of
large scale discount chains, hypermarkets in the retail industry, the trading industry
will likely face increasingly more challenging competitive landscape in the future.
Only by seeking to provide more value added and efficient services, while expanding
the size of its own operations and enhancing product and service offerings, can
trading companies survive the challenges that lie ahead. Future trends of the trading
industries include the following:
A. Specialization in Products and Customer Services
As competition becomes more intense, the role of trading companies
must evolve beyond order fulfillment functions including sourcing and
re-selling. Many larger trading companies already evolved to become full
service suppliers by provide product consultation and after-sales service as well
as logistics and distribution functions. Since these services often involve
specialized products, trading companies have also become more focused in
specific product categories with complete product lines in order to demonstrate
their specialization and competency.
B. New markets and new competitors following accession to WTO、 the signing of
ECFA and the signing of FTA between China, Japan and South Korea.
Global trade liberalization remains a key force driving the changes for the
competitive landscape for trading companies. Following Taiwan's accession to

-65-
WTO as a full member, once trade practices are deemed unfair or damaging to
Taiwanese businesses can be resolved through the WTO. This enables all parties
involved to have effective access to international trade regulations and trends in
a more regulated environment thereby mitigating regulatory risk of trading and
investing activities. Following the signing of Economic Cooperation
Framework Agreement (ECFA), economic activities between Taiwan and
mainland China have flourished and cross-strait trade and investment
opportunities have become increasingly accessible. But as China, Japan and
South Korea held the first round of FTA negotiation in March 2013, there will
likely be negative impact on the competitiveness of Taiwanese businesses.
Taiwan government will need to accelerate negotiations on economic
cooperation agreements with other countries in order to mitigate this impact and
further eliminations of trade barriers will likely presents trading companies with
many different challenges and opportunities. These include increased pressure
from overseas competitors, threats from expansion of emerging markets and
more transparent information of competitors and suppliers in other markets.
C. Applications to accommodate e-Commerce
Use of the Internet has already become commonplace among enterprises.
As such, online (i.e., electronic) procurement has become the new norm.
According to a study conducted by the Aberdeen Group, successfully adopting
electronic procurement will enable an enterprise to lower the procurement cost
by 70% compared with a more traditional approach. Major manufacturers both
in Taiwan and abroad, including industry giants such as IBM and Intel, are
aggressively pursuing the implementation of electronic procurement systems
and electronic component trading with their upstream and downstream partners.
Following the completion of the Taiwan Product Procurement Portal by
the Ministry of Economic Affairs (MOEA), a total of 180,000 importers and
exporters began to conduct transactions in the B2B e-Commerce market. The
ministry has also made available subsidies from the Trade Promotion Fund to
trade associations in the following industries: machinery, automobiles,
computers, electronics, electromechanical, and textiles. The purpose of the
subsidies is to implement specialized websites (ICP) to propel the trading
practices of Taiwan into the Internet era.
While value-added services such as logistics, distribution, and after-sales
services cannot be completely replaced by the lower cost procurement offered
by online sourcing, trading companies will need to develop its own online
strategy in order to prevent being replaced, or circumvented, by global retailers
desire to go direct to manufacturers to fulfill lower cost sourcing needs.
Test-Rite has its on e-market place platform developed by our subsidiary B&S
Link. The platform enables full range of of order fulfillment services to both our
customers and suppliers.
D. the Capabilities of Manufacturers
With the liberalization of global trade, distributors and retailers have
undergone significant changes in terms of their business structures. They have
evolved from traditionally small, regional based, or brick-and-mortal sales
points in the past, to larger companies that have gained stable economies of
scale that enjoys significant operating leverage while becoming multi-national
or global entities.
Under these market conditions, smaller manufacturers can work with larger
trading companies to become a partner of trading companies‘ net work of
suppliers. This will enable smaller manufacturers to leverage the service
platform established by the trading companies and at the same time minimize
the financial pressure from tougher payment terms demanded by larger, global
-66-
retailers. Smaller manufacturers can also leverage trading companies‘ logistics
capabilities and services or even act as representatives for functions such as
product sales, warehousing and distribution.
E. Competition Status
Currently there are no competitors of comparable size in Taiwan as
Test-Rite is the largest trading company in Taiwan. However, there are still
many small and medium trading companies in the North American and
European markets (which are much smaller than the Company in terms of the
size of business operations). Large trading companies such as Test Rite will be
able to widen the gap versus small and medium trading firms given their
relative scale, add on services such as QA/QC, logistics, and warehousing
capabilities.
5.1.3 Research and Development:This is not applicable, as the Company is engaged in the
traditional trading industry and is not involved in R&D other than product design.
5.1.4 Long-term and Short-term Development 1. Operational Guidelines
(1) Steady Growth of Trading, the Company's Primary Business
A. The Company utilizes the experience and resources accumulated over the years in
services such as product design, packaging design, logistics and warehousing. We
have also developed new businesses services and products for multi-national retail
operators with comprehensive solutions for cross-border procurement. In addition, the
Company will also be actively developing brand distribution rights for the domestic
and mainland Chinese markets, in order to benefit from rapidly growing consumer
demand. In addition, the Company will continue to expand its partnerships in
procurement agency services with existing customers such as Michaels, AutoZone,
Tractor Supply, AAFES, Spotlight, OSH, Arteriors, Express gift, and the Pep Boys,,
and will continue to cultivate additional opportunities to growth our agency business..
B. With wage levels in China rising steadily, significant growth in consumer spending
power can be expected. The Company will be actively developing product distribution
rights on both sides of the Taiwan Strait and taking advantage of opportunities for high
growth in the domestic consumption market. We will also continue to plan for and
develop new potential procurement sources and regions in order to improve our
production and marketing cost efficiency. In particular, we have added procurement
teams in Southeast Asia, while setting set up a new office in India as well.
(2) Maintaining Growth in the Retail Business
A. Test Rite retail outlets and HOLA TW are expanding their presence and provide a
more complete selection of products. We are also considering the possibility of
providing different services and become more active in home improvement sector or
to formulate business strategies such as store-within-the-store in order to improve our
operational efficiency. The operating performance of our mainland Chinese retail
operations and HOLA China outlets also continues to improve. After rapidly
expanding 9 small to medium stores in 2010, the company emphasis on enhancing
store operating performance. In 2013 the company opened three new stores and closed
two stores during the year, with the total number of stores at 33 at December end 2013.
More significantly, Hola China posted a profit of NT$33.4mn (check) in 4Q13, the
first ever single profitability since entering the China market.
B. Taiwan's consumer market is a relatively more mature market, but it is a market where
more and more consumers are looking to make purchases to improve their standard of
living. Meanwhile with China's 12th five-year plan aimed at driving demand for
domestic consumption, considerable growth opportunities exist in China as well.
(3) Group Integration
The Group continues with its integration effort. Trading business will look to become
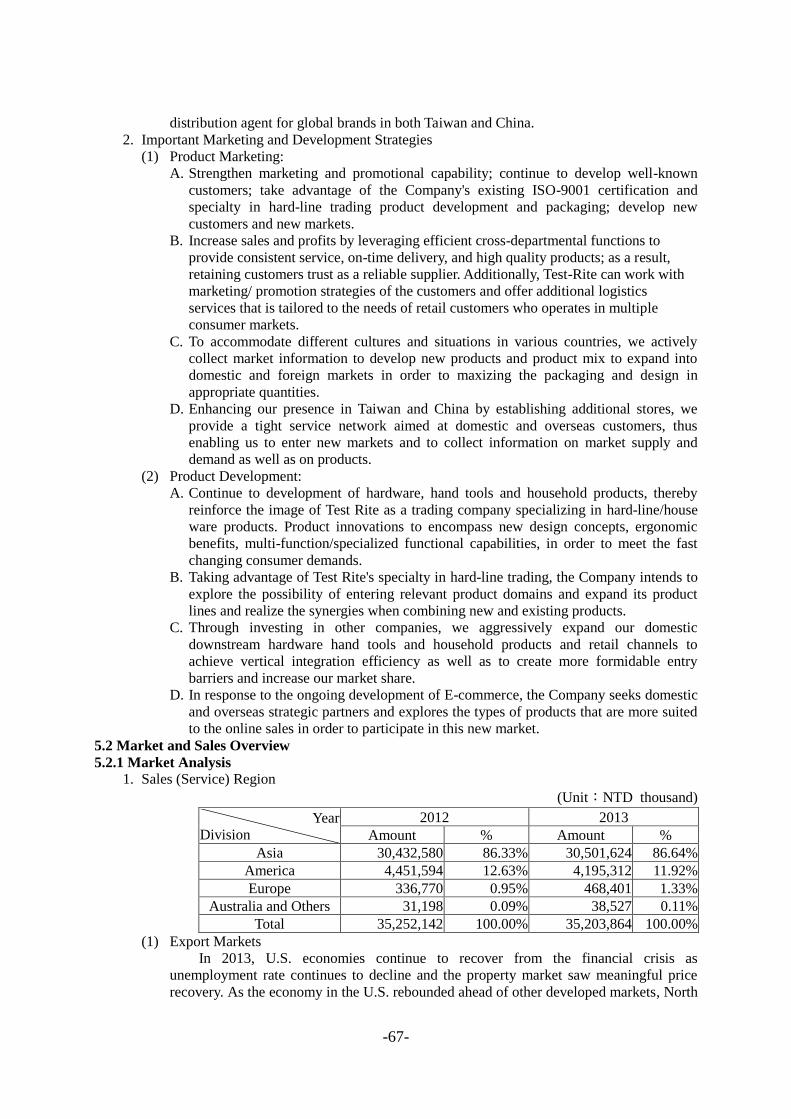
-67-
distribution agent for global brands in both Taiwan and China.
2. Important Marketing and Development Strategies
(1) Product Marketing:
A. Strengthen marketing and promotional capability; continue to develop well-known
customers; take advantage of the Company's existing ISO-9001 certification and
specialty in hard-line trading product development and packaging; develop new
customers and new markets.
B. Increase sales and profits by leveraging efficient cross-departmental functions to
provide consistent service, on-time delivery, and high quality products; as a result,
retaining customers trust as a reliable supplier. Additionally, Test-Rite can work with
marketing/ promotion strategies of the customers and offer additional logistics
services that is tailored to the needs of retail customers who operates in multiple
consumer markets.
C. To accommodate different cultures and situations in various countries, we actively
collect market information to develop new products and product mix to expand into
domestic and foreign markets in order to maxizing the packaging and design in
appropriate quantities.
D. Enhancing our presence in Taiwan and China by establishing additional stores, we
provide a tight service network aimed at domestic and overseas customers, thus
enabling us to enter new markets and to collect information on market supply and
demand as well as on products.
(2) Product Development:
A. Continue to development of hardware, hand tools and household products, thereby
reinforce the image of Test Rite as a trading company specializing in hard-line/house
ware products. Product innovations to encompass new design concepts, ergonomic
benefits, multi-function/specialized functional capabilities, in order to meet the fast
changing consumer demands.
B. Taking advantage of Test Rite's specialty in hard-line trading, the Company intends to
explore the possibility of entering relevant product domains and expand its product
lines and realize the synergies when combining new and existing products.
C. Through investing in other companies, we aggressively expand our domestic
downstream hardware hand tools and household products and retail channels to
achieve vertical integration efficiency as well as to create more formidable entry
barriers and increase our market share.
D. In response to the ongoing development of E-commerce, the Company seeks domestic
and overseas strategic partners and explores the types of products that are more suited
to the online sales in order to participate in this new market.
5.2 Market and Sales Overview
5.2.1 Market Analysis
1. Sales (Service) Region
(Unit:NTD thousand)
Year
Division
2012 2013
Amount % Amount %
Asia 30,432,580 86.33% 30,501,624 86.64%
America 4,451,594 12.63% 4,195,312 11.92%
Europe 336,770 0.95% 468,401 1.33%
Australia and Others 31,198 0.09% 38,527 0.11%
Total 35,252,142 100.00% 35,203,864 100.00%
(1) Export Markets
In 2013, U.S. economies continue to recover from the financial crisis as
unemployment rate continues to decline and the property market saw meaningful price
recovery. As the economy in the U.S. rebounded ahead of other developed markets, North
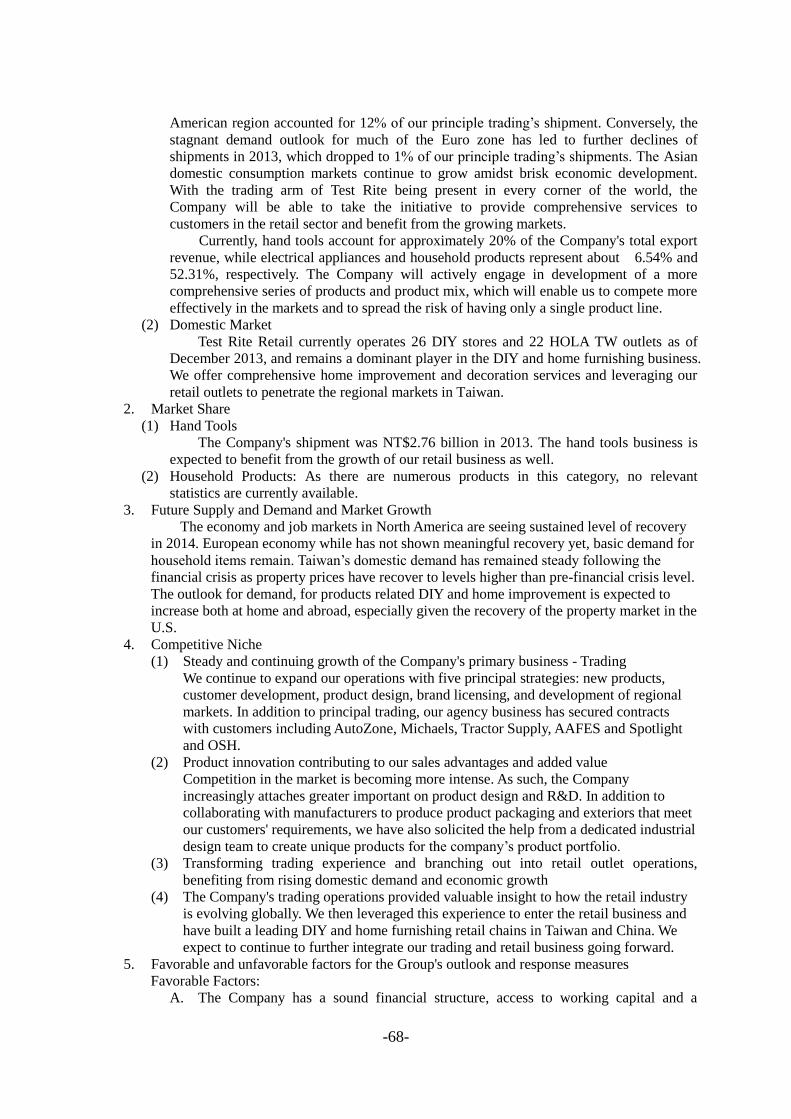
-68-
American region accounted for 12% of our principle trading‘s shipment. Conversely, the
stagnant demand outlook for much of the Euro zone has led to further declines of
shipments in 2013, which dropped to 1% of our principle trading‘s shipments. The Asian
domestic consumption markets continue to grow amidst brisk economic development.
With the trading arm of Test Rite being present in every corner of the world, the
Company will be able to take the initiative to provide comprehensive services to
customers in the retail sector and benefit from the growing markets.
Currently, hand tools account for approximately 20% of the Company's total export
revenue, while electrical appliances and household products represent about 6.54% and
52.31%, respectively. The Company will actively engage in development of a more
comprehensive series of products and product mix, which will enable us to compete more
effectively in the markets and to spread the risk of having only a single product line.
(2) Domestic Market
Test Rite Retail currently operates 26 DIY stores and 22 HOLA TW outlets as of
December 2013, and remains a dominant player in the DIY and home furnishing business.
We offer comprehensive home improvement and decoration services and leveraging our
retail outlets to penetrate the regional markets in Taiwan.
2. Market Share
(1) Hand Tools
The Company's shipment was NT$2.76 billion in 2013. The hand tools business is
expected to benefit from the growth of our retail business as well.
(2) Household Products: As there are numerous products in this category, no relevant
statistics are currently available.
3. Future Supply and Demand and Market Growth
The economy and job markets in North America are seeing sustained level of recovery
in 2014. European economy while has not shown meaningful recovery yet, basic demand for
household items remain. Taiwan‘s domestic demand has remained steady following the
financial crisis as property prices have recover to levels higher than pre-financial crisis level.
The outlook for demand, for products related DIY and home improvement is expected to
increase both at home and abroad, especially given the recovery of the property market in the
U.S.
4. Competitive Niche
(1) Steady and continuing growth of the Company's primary business - Trading
We continue to expand our operations with five principal strategies: new products,
customer development, product design, brand licensing, and development of regional
markets. In addition to principal trading, our agency business has secured contracts
with customers including AutoZone, Michaels, Tractor Supply, AAFES and Spotlight
and OSH.
(2) Product innovation contributing to our sales advantages and added value
Competition in the market is becoming more intense. As such, the Company
increasingly attaches greater important on product design and R&D. In addition to
collaborating with manufacturers to produce product packaging and exteriors that meet
our customers' requirements, we have also solicited the help from a dedicated industrial
design team to create unique products for the company‘s product portfolio.
(3) Transforming trading experience and branching out into retail outlet operations,
benefiting from rising domestic demand and economic growth
(4) The Company's trading operations provided valuable insight to how the retail industry
is evolving globally. We then leveraged this experience to enter the retail business and
have built a leading DIY and home furnishing retail chains in Taiwan and China. We
expect to continue to further integrate our trading and retail business going forward.
5. Favorable and unfavorable factors for the Group's outlook and response measures
Favorable Factors:
A. The Company has a sound financial structure, access to working capital and a
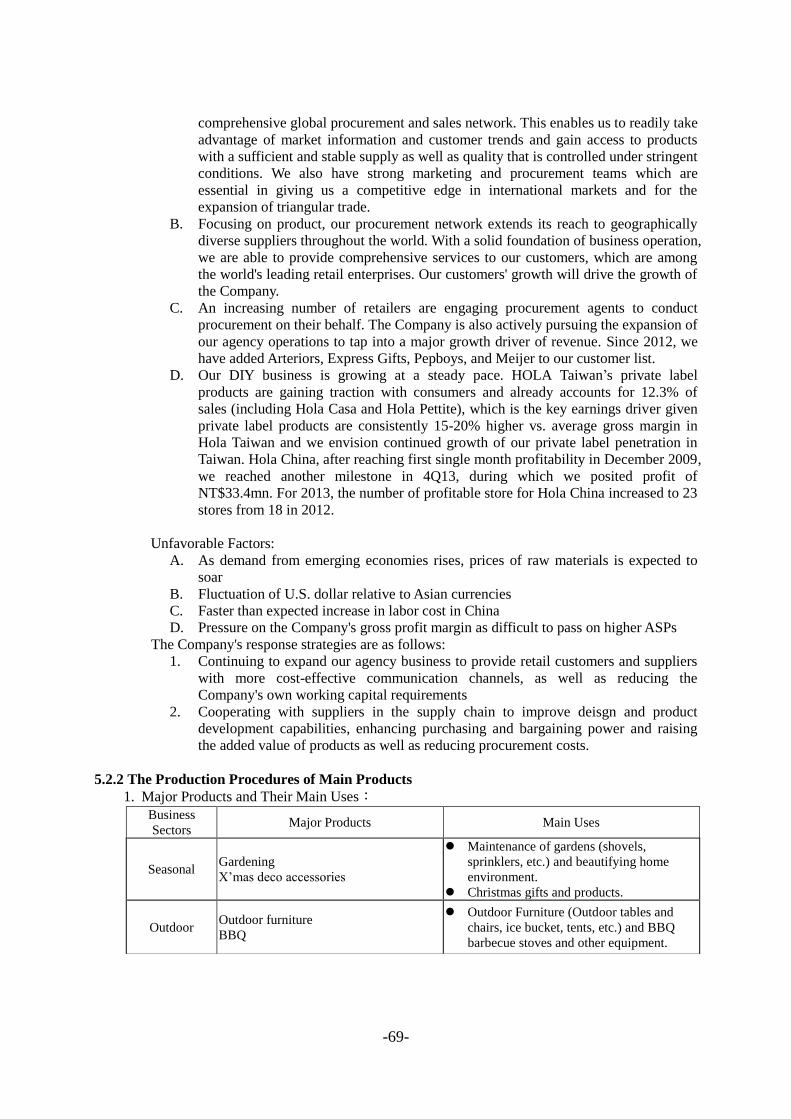
-69-
comprehensive global procurement and sales network. This enables us to readily take
advantage of market information and customer trends and gain access to products
with a sufficient and stable supply as well as quality that is controlled under stringent
conditions. We also have strong marketing and procurement teams which are
essential in giving us a competitive edge in international markets and for the
expansion of triangular trade.
B. Focusing on product, our procurement network extends its reach to geographically
diverse suppliers throughout the world. With a solid foundation of business operation,
we are able to provide comprehensive services to our customers, which are among
the world's leading retail enterprises. Our customers' growth will drive the growth of
the Company.
C. An increasing number of retailers are engaging procurement agents to conduct
procurement on their behalf. The Company is also actively pursuing the expansion of
our agency operations to tap into a major growth driver of revenue. Since 2012, we
have added Arteriors, Express Gifts, Pepboys, and Meijer to our customer list.
D. Our DIY business is growing at a steady pace. HOLA Taiwan‘s private label
products are gaining traction with consumers and already accounts for 12.3% of
sales (including Hola Casa and Hola Pettite), which is the key earnings driver given
private label products are consistently 15-20% higher vs. average gross margin in
Hola Taiwan and we envision continued growth of our private label penetration in
Taiwan. Hola China, after reaching first single month profitability in December 2009,
we reached another milestone in 4Q13, during which we posited profit of
NT$33.4mn. For 2013, the number of profitable store for Hola China increased to 23
stores from 18 in 2012.
Unfavorable Factors:
A. As demand from emerging economies rises, prices of raw materials is expected to
soar
B. Fluctuation of U.S. dollar relative to Asian currencies
C. Faster than expected increase in labor cost in China
D. Pressure on the Company's gross profit margin as difficult to pass on higher ASPs
The Company's response strategies are as follows:
1. Continuing to expand our agency business to provide retail customers and suppliers
with more cost-effective communication channels, as well as reducing the
Company's own working capital requirements
2. Cooperating with suppliers in the supply chain to improve deisgn and product
development capabilities, enhancing purchasing and bargaining power and raising
the added value of products as well as reducing procurement costs.
5.2.2 The Production Procedures of Main Products
1. Major Products and Their Main Uses:
Business
Sectors Major Products Main Uses
Seasonal Gardening
X‘mas deco accessories
Maintenance of gardens (shovels,
sprinklers, etc.) and beautifying home
environment.
Christmas gifts and products.
Outdoor Outdoor furniture
BBQ
Outdoor Furniture (Outdoor tables and
chairs, ice bucket, tents, etc.) and BBQ
barbecue stoves and other equipment.

-70-
2. Major Products and Their Production Processes:N/A. The Company is engaged in the
traditional trading industry and is not involved in manufacturing.
5.2.3 Supply Status of Main Materials
The Company does not manufacture any products, thus no issues exist with regard to supply of
raw materials. Upstream suppliers are mainly manufacturers of hardware and hand tools, household
products, furniture, office supplies, and IT products. The Company maintains long-term relationships
and is on good terms with upstream suppliers. We collaborate with them extensively on product
specifications and delivery dates, and the supply of products has not been a problem.
Hardline &
Auto
Hand tool
Tools
Hardware
Auto accessories
Auto parts
New business development
General Hand Tools (including axes, saws,
wrenches, and pliers) for Do It Yourself
(DIY) projects, essential for the
installation and maintenance of household
accessories.
Hardware Components (e.g. screws) for
the necessary spare parts for maintenance.
Automobile accessories and supplies (e.g.
automobile mats and windshield wipers)
and automotive repair and maintenance
products.
Home
Furnishing &
Deco
Bathing and Storage
Kitchenware
Home decoration
Luggage & Travel accessories
Home storage box and cabinets or do it
yourself (DIY)'s furniture supplies.
Travel Storage Products (trunk)
SIT
Christmas decoration
Sport equipments stationary
Indoor furniture
Office supplies
PC peripherals
Computer accessories
Consumer electronics
Lighting
OA Furniture (e.g. desks and office chairs)
Stationery (e.g. office supplies, file folders
and document holders)
Computer Accessories 3C merchandise.
Lamps and light fixtures (including wall
lamps, table lamps and floor lamps)
Bathroom and sanitary equipment,
automotive repair and maintenance
supplies, fireplace accessories, furniture,
barbecue utensils and other Electrical
Accessories (e.g. Hair dryers, electric
razors and infrared detectors)
Recreational Products (mainly bicycles
and ice chests) and Leisure products that
make life more fun.
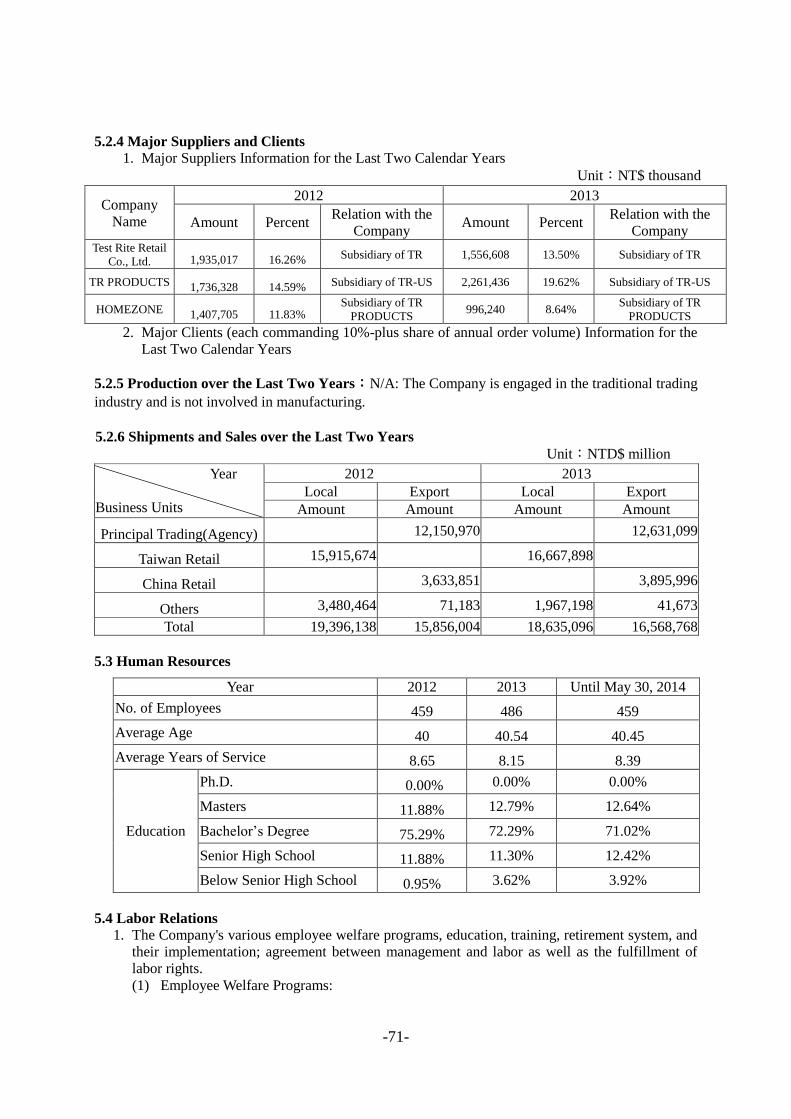
-71-
5.2.4 Major Suppliers and Clients
1. Major Suppliers Information for the Last Two Calendar Years
Unit:NT$ thousand
Company
Name
2012 2013
Amount Percent Relation with the
Company Amount Percent
Relation with the
Company Test Rite Retail
Co., Ltd. 1,935,017 16.26% Subsidiary of TR 1,556,608 13.50% Subsidiary of TR
TR PRODUCTS 1,736,328 14.59% Subsidiary of TR-US 2,261,436 19.62% Subsidiary of TR-US
HOMEZONE 1,407,705 11.83% Subsidiary of TR
PRODUCTS 996,240 8.64%
Subsidiary of TR
PRODUCTS
2. Major Clients (each commanding 10%-plus share of annual order volume) Information for the
Last Two Calendar Years
5.2.5 Production over the Last Two Years:N/A: The Company is engaged in the traditional trading
industry and is not involved in manufacturing.
5.2.6 Shipments and Sales over the Last Two Years
Unit:NTD$ million
Year
Business Units
2012 2013
Local Export Local Export
Amount Amount Amount Amount
Principal Trading(Agency) 12,150,970 12,631,099
Taiwan Retail 15,915,674 16,667,898
China Retail 3,633,851 3,895,996
Others 3,480,464 71,183 1,967,198 41,673
Total 19,396,138 15,856,004 18,635,096 16,568,768
5.3 Human Resources
Year 2012 2013 Until May 30, 2014
No. of Employees 459 486 459
Average Age 40 40.54 40.45
Average Years of Service 8.65 8.15 8.39
Education
Ph.D. 0.00% 0.00% 0.00%
Masters 11.88% 12.79% 12.64%
Bachelor‘s Degree 75.29% 72.29% 71.02%
Senior High School 11.88% 11.30% 12.42%
Below Senior High School 0.95% 3.62% 3.92%
5.4 Labor Relations
1. The Company's various employee welfare programs, education, training, retirement system, and
their implementation; agreement between management and labor as well as the fulfillment of
labor rights.
(1) Employee Welfare Programs:

-72-
To promote the welfare of our employees and to create an environment in which our
employees can enjoy working in, the Company established the Employee Welfare
Committee on April 6, 1983 to implement various employee welfare activities. The sources
of funding for the committee consist of 0.05% of the Company's total monthly revenue and
0.5% of employees' total monthly salary. In addition, the Company's employee welfare
programs include healthcare plans, loans and employee stock ownership plans.
(2) Employee Education and Training Programs
Continuous learning is one of the key factors that affect the survival of an enterprise
in the marketplace. The company has a long-term, systematic training program that offers
leadership courses for managers of various levels, key specialized training courses, and
general knowledge courses. In addition, a corporate university consisting of a management
college, a trade college, and a general knowledge college has been established by the
company, with its human resources development system transformed into a learning
organization. The program has been designed to work closely with the company‘s operating
strategies and development needs. At the beginning of each year, the department in charge
of training will submit an annual training program for approval. The training results are
periodically evaluated to provide the basis for the drafting of the next program.
A. Management training: The courses are designed and categorized based on the skills
required for the different levels of leadership management. Basic-level management
courses focus on personnel management, with the aim of training internal lecturers,
who will pass down the company‘s management philosophy and culture, based on the
concept of leaders mentoring leaders. These courses include the roles and duties of
executives, performance management, motivation, and interpersonal communication
for executives. Mid-level management courses concentrate on teamwork and creating
synergy through self-regulated team learning. Furthermore, the Action Learning
technique is introduced for trainees to learn to simultaneously address organizational
issues and fully apply what they have learned to their work. Examples include courses
that teach trainees to establish teamwork, how to cultivate employees‘ potential, etc.
High-level management courses are designed with an emphasis on forward-looking
strategic thinking and self-improvement. Senior management is given advice on the
operation of the company by the board members, with external consultants hired to
help inspect the situations encountered and come up with countermeasures, in an effort
to enable senior management to continue to develop strategies and look ahead as it
endeavors to expand the company. At the same time, the company attaches much
importance to the self-improvement of its senior executives. Based on individual
needs, they are sent to participate in external humanistic and leadership training
programs.
B. Specialized training: Specialized training roadmaps are drawn up based on various key
specialized functions. A series of specialized courses on subjects including purchasing,
marketing, and trading are designed for both beginners and advanced learners. In
recent years, career roadmaps have been formulated to encourage employees to
develop a second specialty and accumulate different kinds of specialized experience.
In addition, to enable employees to quickly adapt themselves to external changes,
apart from internal training sessions the company periodically sends employees to
external training sessions or workshops, in an attempt to raise their awareness of
market changes and maintain their level of specialized skills. Moreover, the company
provides employees with the opportunity to work overseas and subsidizes their foreign
language learning expenses.
C. General knowledge training and orientation: Various general knowledge courses for
various levels of the management are designed based on individual employees‘ general
knowledge functions, with the aim of helping them improve their efficiency. These
courses include communication skills, presentation skills, work management, problem
analysis and resolution, and customer service. The company attaches much importance
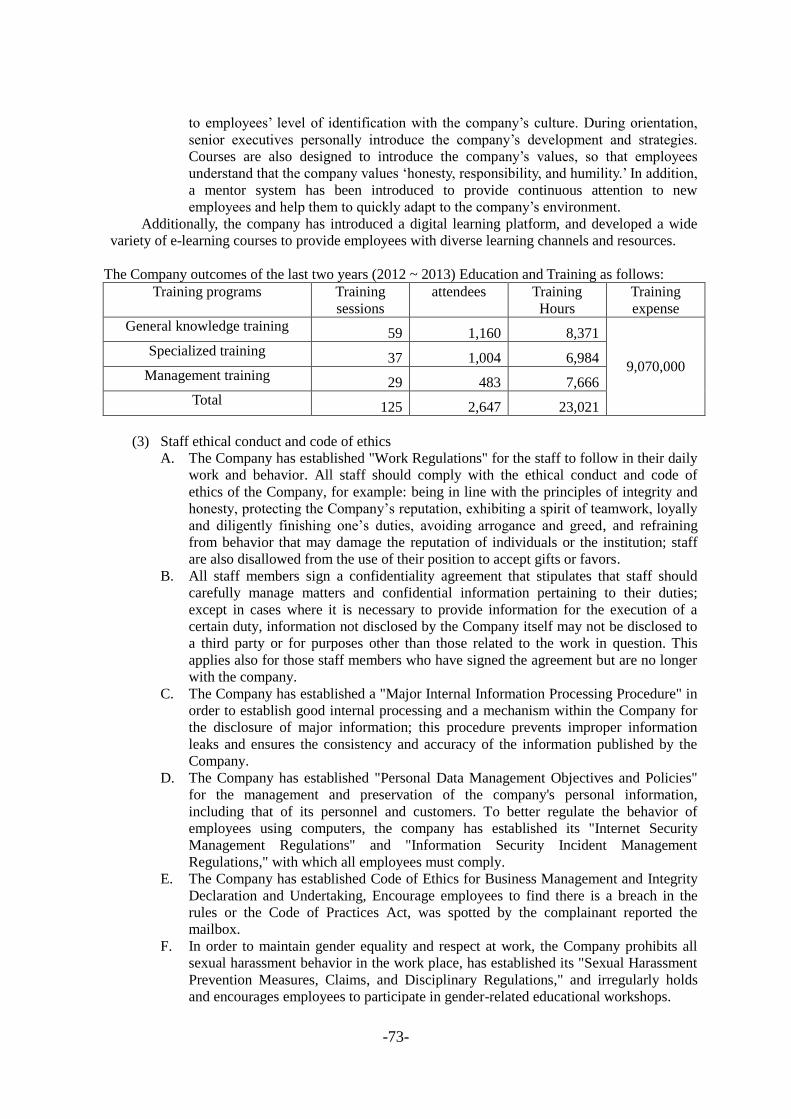
-73-
to employees‘ level of identification with the company‘s culture. During orientation,
senior executives personally introduce the company‘s development and strategies.
Courses are also designed to introduce the company‘s values, so that employees
understand that the company values ‗honesty, responsibility, and humility.‘ In addition,
a mentor system has been introduced to provide continuous attention to new
employees and help them to quickly adapt to the company‘s environment.
Additionally, the company has introduced a digital learning platform, and developed a wide
variety of e-learning courses to provide employees with diverse learning channels and resources.
The Company outcomes of the last two years (2012 ~ 2013) Education and Training as follows:
Training programs Training
sessions
attendees Training
Hours
Training
expense
General knowledge training 59 1,160 8,371
9,070,000 Specialized training
37 1,004 6,984
Management training 29 483 7,666
Total 125 2,647 23,021
(3) Staff ethical conduct and code of ethics
A. The Company has established "Work Regulations" for the staff to follow in their daily
work and behavior. All staff should comply with the ethical conduct and code of
ethics of the Company, for example: being in line with the principles of integrity and
honesty, protecting the Company‘s reputation, exhibiting a spirit of teamwork, loyally
and diligently finishing one‘s duties, avoiding arrogance and greed, and refraining
from behavior that may damage the reputation of individuals or the institution; staff
are also disallowed from the use of their position to accept gifts or favors.
B. All staff members sign a confidentiality agreement that stipulates that staff should
carefully manage matters and confidential information pertaining to their duties;
except in cases where it is necessary to provide information for the execution of a
certain duty, information not disclosed by the Company itself may not be disclosed to
a third party or for purposes other than those related to the work in question. This
applies also for those staff members who have signed the agreement but are no longer
with the company.
C. The Company has established a "Major Internal Information Processing Procedure" in
order to establish good internal processing and a mechanism within the Company for
the disclosure of major information; this procedure prevents improper information
leaks and ensures the consistency and accuracy of the information published by the
Company.
D. The Company has established "Personal Data Management Objectives and Policies"
for the management and preservation of the company's personal information,
including that of its personnel and customers. To better regulate the behavior of
employees using computers, the company has established its "Internet Security
Management Regulations" and "Information Security Incident Management
Regulations," with which all employees must comply.
E. The Company has established Code of Ethics for Business Management and Integrity
Declaration and Undertaking, Encourage employees to find there is a breach in the
rules or the Code of Practices Act, was spotted by the complainant reported the
mailbox.
F. In order to maintain gender equality and respect at work, the Company prohibits all
sexual harassment behavior in the work place, has established its "Sexual Harassment
Prevention Measures, Claims, and Disciplinary Regulations," and irregularly holds
and encourages employees to participate in gender-related educational workshops.

-74-
(4) Retirement programs and status of implementation:
The Labor Standards Act is applicable to the Company. However, in order to reward
our employees for their dedication and to protect their livelihood, the Company established
an Employee Pension Plan in 1982. Prior to 1991, 8% of actual total gross salary matched
by the Company was set aside in a dedicated account for the pension plan, and starting in
1992, the percentage was changed to 4%. The company has allocated a pension fund,
which is submitted to the Supervisory Committee of the Labor Retirement Reserve to be
deposited into a special account at the Bank of Taiwan under the Committee's name. The
Company has a sound retirement program, and according to the actuarial report, the fair
value of the assets in our pension plan is NT$52,360,000 as of year-end 2013. In addition,
pursuant to the Labor Pension Act, the Company has adopted the new pension system and
has been setting aside 6% of employees' monthly salary as employee pension since July 1,
2005.
(5) Labor-management agreement:
The provisions of the Labor Standards Act apply to the Company, and labor-related
affairs are carried out in accordance with this Act. An employee suggestion box has been
set up to take into consideration the opinions of employees and to address their complaints,
as well as to solicit feedback and recommendations from them as the basis for improving
the Company's operations going forward. Since the Company has always attached great
importance to employee welfare and valued two-way communication with employees, we
have had very amicable labor relations since the Company's inception and there have not
been any incidents of labor dispute.
(6) Fulfillment of labor rights and interests
The Company has established a set of human resources management guidelines and
has been reinforcing the rules contained therein to protect the rights and interests of our
employees.
2. As of the current fiscal year up to the date of publication of the annual report, all losses due to
labor disputes shall be reported and the estimated amount of losses likely to occur at present and
in the future as well as corresponding measures adopted by the Company shall be disclosed. If it
is not possible to provide a reasonable estimate, the reasons should be clearly stated:
For the past two years and up to the present, the Company has suffered no losses due to labor
disputes. It is difficult to provide a reasonable estimate to current or future losses. However, the
Company is committed to strengthening communication with employees and we intend to
maintain benefit programs that are satisfactory to them so as to promote more harmonious labor
relations and to reduce the likelihood of any labor disputes in the future.

-75-
5.5 Important Contracts
As of Dec. 31, 2013 Agreement Counterparty Period Major Contents Restrictions
AR
Factoring
Agreement
E. Sun Commercial
Bank
February 12,2014
to February
12,2015
The agreement
declared that the
bank has no right of
further recourse
against Test-Rite.
According to the agreement, the bank
should pay 90% of the proceeds to
Test-Rite at the time of sale. Test-Rite
only has to be responsible for loss that
resulted from business disputes.
Lease
Agreement
Tsai Wang
Enterprise
Company Limited
December 26,
2011 to December
25,2017
Lease TR building
The yearly rent for the building is
NTD$28,000 million.
During leasing year, the yearly rental
has to be increased by 3% of previous
year agreement
Long-term
debt
The First Bank‘s
Syndicate Loan
June 24, 2011 to
June 24, 2016.
Unsecured loan Total Liabilities Ratio not more than
200%.
Current Ratio not less than 100%.
EBITDA Ratio less than250%.
Minimum Tangible Net Worth not less
than $5,200,000 thousand.
Long-term
debt
Bank SinoPac Co.,
Ltd.
June 18, 2012 to
June 18, 2015.
Unsecured loan Total Liabilities Ratio not more than
200%.
Current Ratio not less than 100%.
EBITDA Ratio less than250%.
Minimum Tangible Net Worth not less
than $5,200,000 thousand.
Long-term
debt
The Export-Import
Bank of the
Republic of China
November 18,
2013 to November
19, 2018
Unsecured loan N.A.
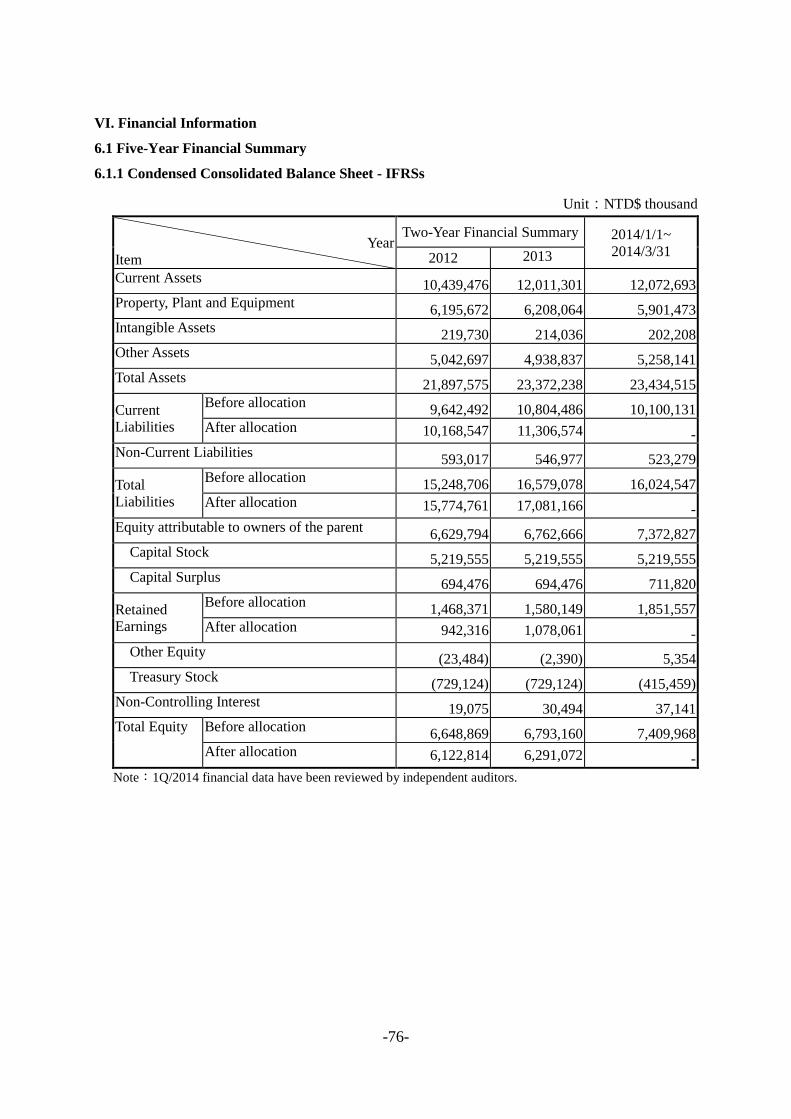
-76-
VI. Financial Information
6.1 Five-Year Financial Summary
6.1.1 Condensed Consolidated Balance Sheet - IFRSs
Unit:NTD$ thousand
Year
Item
Two-Year Financial Summary 2014/1/1~
2014/3/31 2012 2013
Current Assets 10,439,476 12,011,301 12,072,693
Property, Plant and Equipment 6,195,672 6,208,064 5,901,473
Intangible Assets 219,730 214,036 202,208
Other Assets 5,042,697 4,938,837 5,258,141
Total Assets 21,897,575 23,372,238 23,434,515
Current
Liabilities
Before allocation 9,642,492 10,804,486 10,100,131
After allocation 10,168,547 11,306,574 -
Non-Current Liabilities 593,017 546,977 523,279
Total
Liabilities
Before allocation 15,248,706 16,579,078 16,024,547
After allocation 15,774,761 17,081,166 -
Equity attributable to owners of the parent 6,629,794 6,762,666 7,372,827
Capital Stock 5,219,555 5,219,555 5,219,555
Capital Surplus 694,476 694,476 711,820
Retained
Earnings
Before allocation 1,468,371 1,580,149 1,851,557
After allocation 942,316 1,078,061 -
Other Equity (23,484) (2,390) 5,354
Treasury Stock (729,124) (729,124) (415,459)
Non-Controlling Interest 19,075 30,494 37,141
Total Equity Before allocation 6,648,869 6,793,160 7,409,968
After allocation 6,122,814 6,291,072 -
Note:1Q/2014 financial data have been reviewed by independent auditors.

-77-
6.1.2 Condensed Standalone Balance Sheet - IFRSs
Unit:NTD$ thousand
Year
Item
Two-Year Financial Summary
2012 2013
Current Assets 4,286,495 4,646,500
Property, Plant and Equipment 571,917 553,406
Intangible Assets 53,994 59,471
Other Assets 671,817 638,729
Total Assets 12,906,508 13,702,521
Current
Liabilities
Before allocation 2,550,827 3,266,928
After allocation 3,076,882 3,769,016
Non-Current Liabilities 406,127 354,627
Total
Liabilities
Before allocation 6,276,714 6,939,855
After allocation 6,802,769 7,441,943
Equity attributable to owners of the parent - -
Capital Stock 5,219,555 5,219,555
Capital Surplus 694,476 694,476
Retained
Earnings
Before allocation 1,468,371 1,580,149
After allocation 942,316 1,078,061
Other Equity (23,484) (2,390)
Treasury Stock (729,124) (729,124)
Non-Controlling Interest - -
Total Equity Before allocation 6,629,794 6,762,666
After allocation 6,103,739 6,260,578
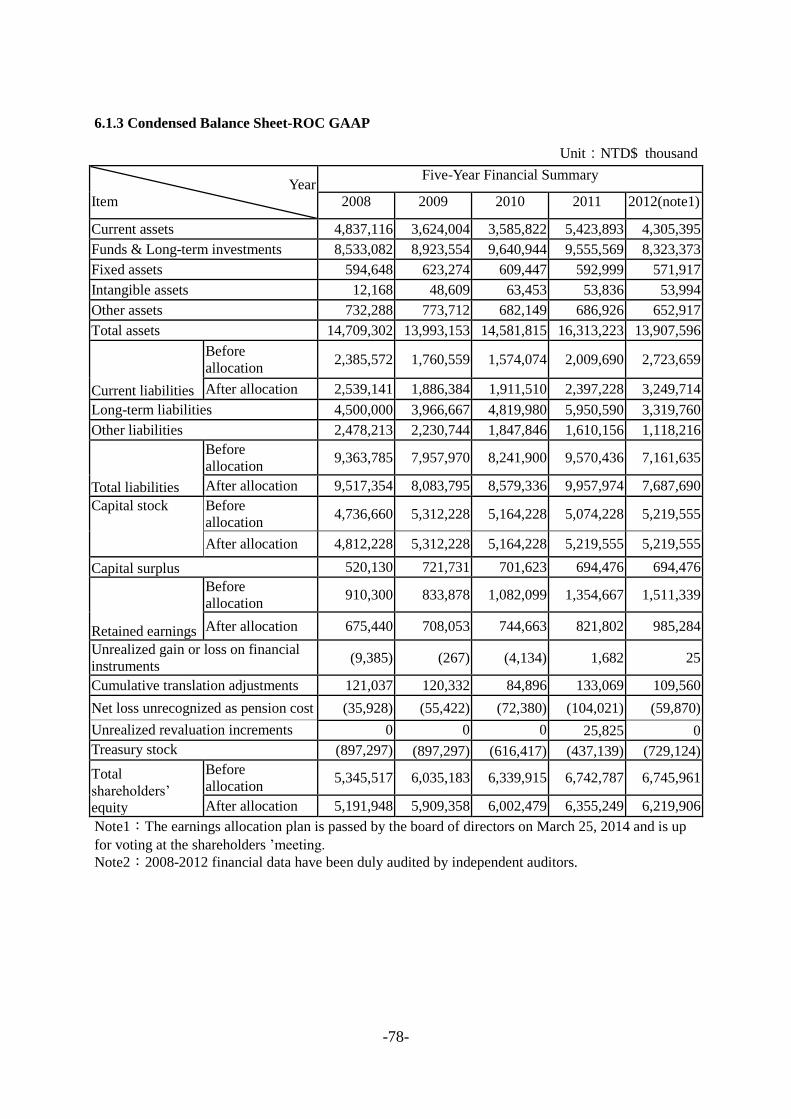
-78-
6.1.3 Condensed Balance Sheet-ROC GAAP
Unit:NTD$ thousand
Year
Item
Five-Year Financial Summary
2008 2009 2010 2011 2012(note1)
Current assets 4,837,116 3,624,004 3,585,822 5,423,893 4,305,395
Funds & Long-term investments 8,533,082 8,923,554 9,640,944 9,555,569 8,323,373
Fixed assets 594,648 623,274 609,447 592,999 571,917
Intangible assets 12,168 48,609 63,453 53,836 53,994
Other assets 732,288 773,712 682,149 686,926 652,917
Total assets 14,709,302 13,993,153 14,581,815 16,313,223 13,907,596
Current liabilities
Before
allocation 2,385,572 1,760,559 1,574,074 2,009,690 2,723,659
After allocation 2,539,141 1,886,384 1,911,510 2,397,228 3,249,714
Long-term liabilities 4,500,000 3,966,667 4,819,980 5,950,590 3,319,760
Other liabilities 2,478,213 2,230,744 1,847,846 1,610,156 1,118,216
Total liabilities
Before
allocation 9,363,785 7,957,970 8,241,900 9,570,436 7,161,635
After allocation 9,517,354 8,083,795 8,579,336 9,957,974 7,687,690
Capital stock Before
allocation 4,736,660 5,312,228 5,164,228 5,074,228 5,219,555
After allocation 4,812,228 5,312,228 5,164,228 5,219,555 5,219,555
Capital surplus 520,130 721,731 701,623 694,476 694,476
Retained earnings
Before
allocation 910,300 833,878 1,082,099 1,354,667 1,511,339
After allocation 675,440 708,053 744,663 821,802 985,284
Unrealized gain or loss on financial
instruments (9,385) (267) (4,134) 1,682 25
Cumulative translation adjustments 121,037 120,332 84,896 133,069 109,560
Net loss unrecognized as pension cost (35,928) (55,422) (72,380) (104,021) (59,870)
Unrealized revaluation increments 0 0 0 25,825 0
Treasury stock (897,297) (897,297) (616,417) (437,139) (729,124)
Total
shareholders‘
equity
Before
allocation 5,345,517 6,035,183 6,339,915 6,742,787 6,745,961
After allocation 5,191,948 5,909,358 6,002,479 6,355,249 6,219,906
Note1:The earnings allocation plan is passed by the board of directors on March 25, 2014 and is up
for voting at the shareholders ‘meeting.
Note2:2008-2012 financial data have been duly audited by independent auditors.

-79-
6.1.4 Condensed Consolidated statement of Income - IFRSs
Unit:NTD$ thousand
Year
Item
Two-Year Financial Summary 2014/1/1~
2014/3/31 2012 2013
Revenue 35,252,142 35,203,864 9,052,489
Operating revenue 10,403,161 10,610,334 2,683,419
Gross profit 720,317 776,738 335,312
Non-operating income and expense (33,590) (44,016) (11,916)
Income before tax 686,727 732,722 323,396
Income from operations of continued segments -
after tax 564,694 640,614 277,395
Income from discontinued operations 0 0 0
Profit or loss for the period 564,694 640,614 277,395
Other comprehensive income 50,177 29,732 8,404
Total comprehensive income 514,517 670,346 285,799
Allocations of profit or loss for the period
attributable to owners of the parent. 509,214 635,139 271,408
Allocations of profit or loss for the period
attributable to non-controlling interest. 55,480 5,475 5,987
Allocations of total comprehensive income for
the period attributable to owners of the parent. 477,225 658,927 279,152
Allocations of total comprehensive income for
the period attributable to non-controlling interest. 37,292 11,419 6,647
Earnings per share 1.03 1.30 0.56
Note :1Q/2014 financial data have been reviewed by independent auditors.

-80-
6.1.4 Condensed Standalone statement of Income - IFRSs
Unit:NTD$ thousand
Year
Item
Two-Year Financial Summary
2012 2013
Revenue 11,902,223 12,175,665
Operating revenue 2,211,418 2,235,640
Gross profit 102,694 73,554
Non-operating income and expense 469,620 594,907
Income before tax 572,314 668,461
Income from operations of continued segments -
after tax 509,214 635,139
Income from discontinued operations 0 0
Profit or loss for the period 509,214 635,139
Other comprehensive income (31,989) 23,788
Total comprehensive income 477,225 658,927
Allocations of profit or loss for the period
attributable to owners of the parent. - -
Allocations of profit or loss for the period
attributable to non-controlling interest. - -
Allocations of total comprehensive income for
the period attributable to owners of the parent. - -
Allocations of total comprehensive income for
the period attributable to non-controlling interest. - -
Earnings per share 1.03 1.30
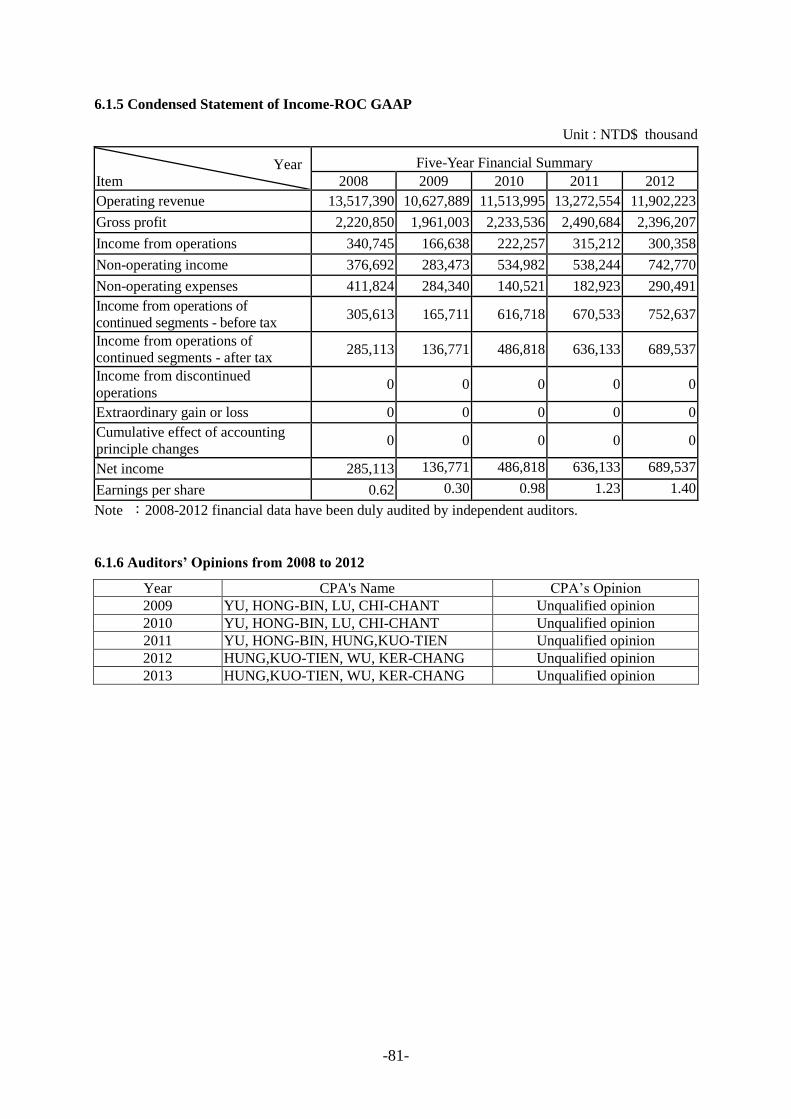
-81-
6.1.5 Condensed Statement of Income-ROC GAAP
Unit:NTD$ thousand
Year
Item
Five-Year Financial Summary
2008 2009 2010 2011 2012
Operating revenue 13,517,390 10,627,889 11,513,995 13,272,554 11,902,223
Gross profit 2,220,850 1,961,003 2,233,536 2,490,684 2,396,207
Income from operations 340,745 166,638 222,257 315,212 300,358
Non-operating income 376,692 283,473 534,982 538,244 742,770
Non-operating expenses 411,824 284,340 140,521 182,923 290,491
Income from operations of
continued segments - before tax 305,613 165,711 616,718 670,533 752,637
Income from operations of
continued segments - after tax 285,113 136,771 486,818 636,133 689,537
Income from discontinued
operations 0 0 0 0 0
Extraordinary gain or loss 0 0 0 0 0
Cumulative effect of accounting
principle changes 0 0 0 0 0
Net income 285,113 136,771 486,818 636,133 689,537
Earnings per share 0.62 0.30 0.98 1.23 1.40
Note :2008-2012 financial data have been duly audited by independent auditors.
6.1.6 Auditors’ Opinions from 2008 to 2012
Year CPA's Name CPA‘s Opinion
2009 YU, HONG-BIN, LU, CHI-CHANT Unqualified opinion
2010 YU, HONG-BIN, LU, CHI-CHANT Unqualified opinion
2011 YU, HONG-BIN, HUNG,KUO-TIEN Unqualified opinion
2012 HUNG,KUO-TIEN, WU, KER-CHANG Unqualified opinion
2013 HUNG,KUO-TIEN, WU, KER-CHANG Unqualified opinion

-82-
6.2.1 Five-Year Financial Analysis
6.2.2 Consolidated Financial Analysis - IFRSs
Year
Item
Financial analysis in the past 2 years 2014/1/1
~2014/3/31 2012 2013
Financial
structure (%)
Ratio of liabilities to assets 69.64 70.93 68.38
Ratio of long-term capital to Property,
Plant and Equipment 187.92 193.14 225.32
Solvency (%)
Current ratio 108.27 111.17 119.53
Quick ratio 52.38 58.25 67.89
Times interest earned ratio 4.52 5.80 9.38
AR/AP
(turnover)
Accounts receivable turnover (turns) 13.04 13.61 12.68
Average collection period 28 27 29
Inventory turnover (turns) 4.61 4.92 5.19
Accounts payable turnover (turns) 5.52 4.92 4.67
Average days in sales 79 74 70
Property, Plant and Equipment turnover
(turns) 5.06 5.68 5.98
Total assets turnover (turns) 1.42 1.56 1.55
Profitability
Return on total assets (%) 2.94 3.39 1.32
Return on stockholders' equity (%) 7.99 9.57 3.92
Pretax income Ratio to issued capital
(%)
Operating profit 13.16 14.04 6.20
Profit ratio (%) 1.60 1.82 3.06
Earnings per share ($) 1.03 1.30 0.56
Cash flow
Cash flow ratio (%) 36.20 11.50 0.97
Cash flow adequacy ratio (%) 91.97 98.80 92.66
Cash reinvestment ratio (%) 20.37 4.43 1.28
Leverage Operating leverage 15.82 14.97 8.34
Financial leverage 1.37 1.24 1.13
Note :1Q/2014 financial data have been reviewed by independent auditors.

-83-
6.2.4 Standalone Financial Analysis - IFRSs
Year
Item
Financial analysis in the past 2 years
2012 2013
Financial
structure (%)
Ratio of liabilities to assets 48.63 50.65
Ratio of long-term capital to Property,
Plant and Equipment 1,739.68 1,821.62
Solvency (%)
Current ratio 168.04 142.23
Quick ratio 154.58 135.38
Times interest earned ratio 7.45 12.67
AR/AP
(turnover)
Accounts receivable turnover (turns) 3.45 3.89
Average collection period 106 94
Inventory turnover (turns) 65.09 71.44
Accounts payable turnover (turns) 6.99 5.33
Average days in sales 6 5
Property, Plant and Equipment turnover
(turns) 20.43 21.64
Total assets turnover (turns) 0.82 0.92
Profitability
Return on total assets (%) 4.03 5.13
Return on stockholders' equity (%) 7.21 9.49
Pretax income Ratio to issued capital
(%)
Operating profit 10.96 12.81
Profit ratio (%) 4.28 5.22
Earnings per share ($) 1.03 1.30
Cash flow
Cash flow ratio (%) 101.85 32.96
Cash flow adequacy ratio (%) 10.30 38.90
Cash reinvestment ratio (%) 28.40 15.13
Leverage Operating leverage 12.79 16.26
Financial leverage 7.37 4.53

-84-
6.2.3 Five-Year Financial Analysis - ROC GAAP
Year
Item
Financial analysis in the past five years
2008 2009 2010 2011 2012
Financial
structure (%)
Ratio of liabilities to assets 63.66 56.87 56.52 58.67 51.49
Ratio of long-term capital to fixed assets 1,655.69 1,604.73 1,831.15 2,140.54 1,760.00
Solvency (%)
Current ratio 202.77 205.84 227.81 269.89 158.07
Quick ratio 194.22 194.97 210.93 245.39 145.47
Times interest earned ratio 2.33 2.8 9.27 8.21 9.48
AR/AP
(turnover)
Accounts receivable turnover (turns) 4.53 3.76 4.57 4.17 3.45
Average collection period 81 97 80 88 105.79
Inventory turnover (turns) 128.86 121.66 134.38 92.88 63.85
Accounts payable turnover (turns) 11.75 9.65 11.54 11.79 6.79
Average days in sales 3 3 3 4 6
Fixed assets turnover (turns) 22.96 17.45 18.68 22.08 20.43
Total assets turnover (turns) 0.9 0.74 0.81 0.86 0.79
Profitability
Return on total assets (%) 3.04 1.44 3.84 4.62 5.05
Return on stockholders' equity (%) 4.98 2.4 7.87 9.72 10.22
Ratio to issued
capital (%)
Operating profit 7.1 3.14 4.30 6.21 5.75
Pretax income 6.45 3.12 11.94 13.21 14.42
Profit ratio (%) 2.11 1.29 4.23 4.79 5.79
Earnings per share ($) 0.65 0.31 1.01 1.27 1.40
Cash flow
Cash flow ratio (%) 13.97 31.88 19.83 18.47 96.76
Cash flow adequacy ratio (%) 26.02 23.36 21.16 17.49 42.55
Cash reinvestment ratio (%) (0.75) 3.31 1.41 0.23 19.82
Leverage Operating leverage 3.52 6.75 5.26 4.43 4.37
Financial leverage 3.14 2.24 1.51 1.42 1.42
Note 1:2008-2012 financial data have been duly audited by independent auditors.
Note 2:Formulas for the above table:
1. Financial structure
(1) Debt to asset ratio = Total liabilities / Total assets
(2) Long-term capital to fixed asset ratio = (Shareholders‘ equity +Long-term liabilities) / Net fixed assets
2. Solvency
(1) Current ratio = Current assets / Current liabilities
(2) Quick ratio = (Current assets – Inventory – Prepaid expenses) /Current liabilities
(3) Interest cover = Income before interest and tax / Interest expense
3. A/R, A/P and other turnover ratios
(1) Accounts receivable turnover = Net revenue / Average accounts receivable
(2) Average collection days = 365 / AR turnover ratio
(3) Inventory turnover = COGS / Average inventory
(4) Accounts payable turnover = COGS / Average accounts payable
(5) Average days sales = 365 / Inventory turnover ratio
(6) Fixed asset turnover = Net revenue / Net fixed assets
(7) Total asset turnover = Net revenue / Total assets
4. Profitability
(1) Return on assets = [Net income + Interest expense * (1 – Tax rate)]/ Average assets
(2) Return on equity = Net income / Average equity
(3) Net income margin = Net income / Net sales
(4) EPS = (Net income – Preferred stock dividend) / Weighted average outstanding shares
5. Cash flow
(1) Cash flow ratio = Cash flow from operating activities / Current liabilities
(2) Cash flow adequacy ratio = Net cash flow from operating activities for the past 5 years / (Capital expenditures + Increases
in inventory + Cash dividend) for the past 5 years
(3) Cash reinvestment rate = (Cash flow from operating activities –Cash dividends) / (Gross fixed assets + Long-term
investments +Other assets + Working capital) (Note: Use 0 if working capital value is negative)
6. Leverage
(1) Operating leverage = (Net revenue – Variable operating costs and expenses) / Operating income
(2) Financial leverage = Operating income / (Operating income – Interest expense)
-85-
6.3 Supervisors’ Report in the Most Recent Year
To: Test Rite International Co., Ltd. 2014 Shareholders Meeting
From: Supervisors of Test Rite International Co., Ltd
Re: Supervisor‘s review report on the 2013 Financial Statements
Dear shareholders,
Here we ensure the annual financial reports of TRIC stands alone and its consolidation for
2013 have been rendered by Board and audited independent auditors Mr. HONG,
KUO-TYAN and Mr. WU, KER-CHANG of Deloitte Touche. Further we review 2013
Business report and 2013 Profits Distribution proposal and assure to it‘s compliance with
Company Act No. 219 as well.
Supervisors:
Tsai-Chi Co., Ltd.
Representative: Mr. Lai, Yung-Chi
Representative: Mr. Liao, Hsueh-Hsing
March 25, 2014

-86-
6.4 Consolidated Financial Statements for the Years Ended December 31, 2013 and 2012, and
Independent Auditors’ Report

-87-
INDEPENDENT AUDITORS’ REPORT The Board of Directors and Stockholders Test-Rite International Co., Ltd. We have audited the accompanying consolidated balance sheets of Test-Rite International Co., Ltd. and its subsidiaries (the ―Company‖) as of December 31, 2013, December 31, 2012 and January 1, 2012, and the related consolidated statements of comprehensive income, changes in equity and cash flows for the years ended December 31, 2013 and 2012 (all expressed in thousands of New Taiwan dollars). These consolidated financial statements are the responsibility of the Company‘s management. Our responsibility is to express an opinion on these consolidated financial statements based on our audits. We conducted our audits in accordance with the Rules Governing the Audit of Financial Statements by Certified Public Accountants and auditing standards generally accepted in the Republic of China. Those rules and standards require that we plan and perform the audit to obtain reasonable assurance about whether the consolidated financial statements are free of material misstatement. An audit includes examining, on a test basis, evidence supporting the amounts and disclosures in the consolidated financial statements. An audit also includes assessing the accounting principles used and significant estimates made by management, as well as evaluating the overall consolidated financial statement presentation. We believe that our audits provide a reasonable basis for our opinion. In our opinion, the consolidated financial statements referred to above present fairly, in all material respects, the consolidated financial position of the Company as of December 31, 2013, December 31, 2012 and January 1, 2012, and their consolidated financial performance and their consolidated cash flows for the years ended December 31, 2013 and 2012, in conformity with the Regulations Governing the Preparation of Financial Reports by Securities Issuers and International Financial Reporting Standards (IFRS), International Accounting Standards (IAS), IFRIC Interpretations (IFRIC), and SIC Interpretations (SIC) endorsed by the Financial Supervisory Commission of the Republic of China. We have also audited the parent company only financial statements of Test-Rite International Co., Ltd. as of and for the years ended December 31, 2013 and 2012 on which we have issued an unqualified report. March 25, 2014
Notice to Readers The accompanying consolidated financial statements are intended only to present the consolidated financial position, financial performance and cash flows in accordance with accounting principles and practices generally accepted in the Republic of China and not those of any other jurisdictions. The standards, procedures and practices to audit such consolidated financial statements are those generally applied in the Republic of China. For the convenience of readers, the independent auditors’ report and the accompanying consolidated financial statements have been translated into English from the original Chinese version prepared and used in the Republic of China. If there is any conflict between the English version and the original Chinese version or any difference in the interpretation of the two versions, the Chinese-language independent auditors’ report and consolidated financial statements shall prevail. Also, as stated in Note 4 to the consolidated financial statements, the additional footnote disclosures that are not required under accounting principles and practices generally applied in the Republic of China were not translated into English.

-88-
TEST-RITE INTERNATIONAL CO., LTD. AND SUBSIDIARIES
CONSOLIDATED BALANCE SHEETS
(In Thousands of New Taiwan Dollars)
December 31, 2013 December 31, 2012 January 1, 2012
ASSETS Amount % Amount % Amount %
CURRENT ASSETS
Cash and cash equivalents (Notes 4 and 6) $ 2,418,439 10 $ 1,881,727 9 $ 2,093,773 8
Financial assets at fair value through profit or loss - current (Notes 4 and 7) 351,967 1 299,925 1 249,736 1
Available-for-sale financial assets - current (Notes 4 and 8) - - - - 2,141 -
Debt investments with no active market - current (Notes 4 and 10) 166,123 1 - - 2,000 -
Notes receivable (Notes 4 and 11) 5,176 - 5,207 - 39,343 -
Trade receivables (Notes 4 and 11) 2,754,264 12 2,408,278 11 2,952,561 11
Other receivables 455,619 2 364,285 2 310,823 1
Inventories (Notes 4 and 12) 5,154,266 22 4,840,887 22 5,928,469 21
Prepayments 563,633 2 547,474 3 915,460 3
Other current financial assets 262 - 599 - 613 -
Other current assets 141,552 1 91,094 - 232,268 1
Total current assets 12,011,301 51 10,439,476 48 12,727,187 46
NON-CURRENT ASSETS
Available-for-sale financial assets - non-current (Notes 4 and 8) - - - - 30,450 -
Financial assets measured at cost - non-current (Notes 4 and 9) 71,823 - 73,709 - 109,989 -
Debt investments with no active market - non-current (Notes 4 and 10) 50,000 - 50,000 - 50,000 -
Investments accounted for using equity method (Notes 4 and 13) - - - - 1 -
Property, plant and equipment (Notes 4 and 14) 6,208,064 27 6,195,672 28 7,743,922 28
Goodwill (Notes 4 and 15) 2,205,300 9 2,180,889 10 3,647,854 13
Other intangible assets (Notes 4 and 16) 214,036 1 219,730 1 209,675 1
Deferred tax assets (Notes 4 and 23) 1,089,192 5 1,066,752 5 1,031,216 4
Refundable deposits paid 933,648 4 841,804 4 833,364 3
Other non-current assets 588,874 3 829,543 4 1,224,003 5
Total non-current assets 11,360,937 49 11,458,099 52 14,880,474 54
TOTAL $ 23,372,238 100 $ 21,897,575 100 $ 27,607,661 100
LIABILITIES AND EQUITY
CURRENT LIABILITIES
Short-term borrowings (Note 17) $ 2,256,663 10 $ 1,764,129 8 $ 3,397,071 12
Short-term bills payable (Note 17) 9,997 - - - 159,842 1
Financial liabilities at fair value through profit or loss - current (Notes 4 and 7) - - 21,085 - 33,755 -
Notes payable 101,403 - 18,372 - 21,100 -
Trade payables 5,365,575 23 4,512,979 20 4,450,756 16
Other payables (Notes 4 and 19) 1,831,223 8 2,164,747 10 1,883,173 7
Current tax liabilities (Note 4) 105,401 - 134,184 1 180,359 1
Advance receipts 603,381 3 604,073 3 655,472 2
Current portion of long-term borrowings (Note 17) 300,000 1 200,000 1 - -
Liability component of preferred stocks, current - - - - 335,361 1
Other current liabilities 230,843 1 222,923 1 415,438 2
Total current liabilities 10,804,486 46 9,642,492 44 11,532,327 42
LONG-TERM LIABILITIES
Long-term borrowings (Note 17) 5,227,615 23 5,013,197 23 7,150,590 26
NON-CURRENT LIABILITIES
Accrued pension liabilities (Notes 4 and 20) 123,385 - 129,709 1 406,765 1
Refundable deposits received 197,999 1 180,471 1 157,853 1
Deferred credit (Note 14) 150,000 1 200,000 1 250,000 1
Other non-current liabilities 75,593 - 82,837 - 140,678 -
Total non-current liabilities 546,977 2 593,017 3 955,296 3
Total liabilities 16,579,078 71 15,248,706 70 19,638,213 71
EQUITY ATTRIBUTABLE TO OWNERS OF THE COMPANY
Share capital
Common stock (Notes 4 and 21) 5,219,555 22 5,219,555 24 5,074,228 18
Capital surplus (Notes 4 and 21) 694,476 3 694,476 3 694,476 3
Retain earnings (Notes 4 and 21)
Legal reserve 874,164 4 805,210 4 744,159 3
Special reserve 148,098 1 - - - -
Unappropriated earnings 557,887 2 663,161 3 1,426,309 5
Total retain earnings 1,580,149 7 1,468,371 7 2,170,468 8
Other equity (Notes 4 and 21) (2,390) - (23,484) - 1,682 -
Treasury shares (Notes 4 and 22) (729,124) (3) (729,124) (4) (437,139) (2)
Total equity attributable to owners of the Company 6,762,666 29 6,629,794 30 7,503,715 27
NON-CONTROLLING INTERESTS (Note 4) 30,494 - 19,075 - 465,733 2
Total equity 6,793,160 29 6,648,869 30 7,969,448 29
TOTAL $ 23,372,238 100 $ 21,897,575 100 $ 27,607,661 100
The accompanying notes are an integral part of the consolidated financial statements.
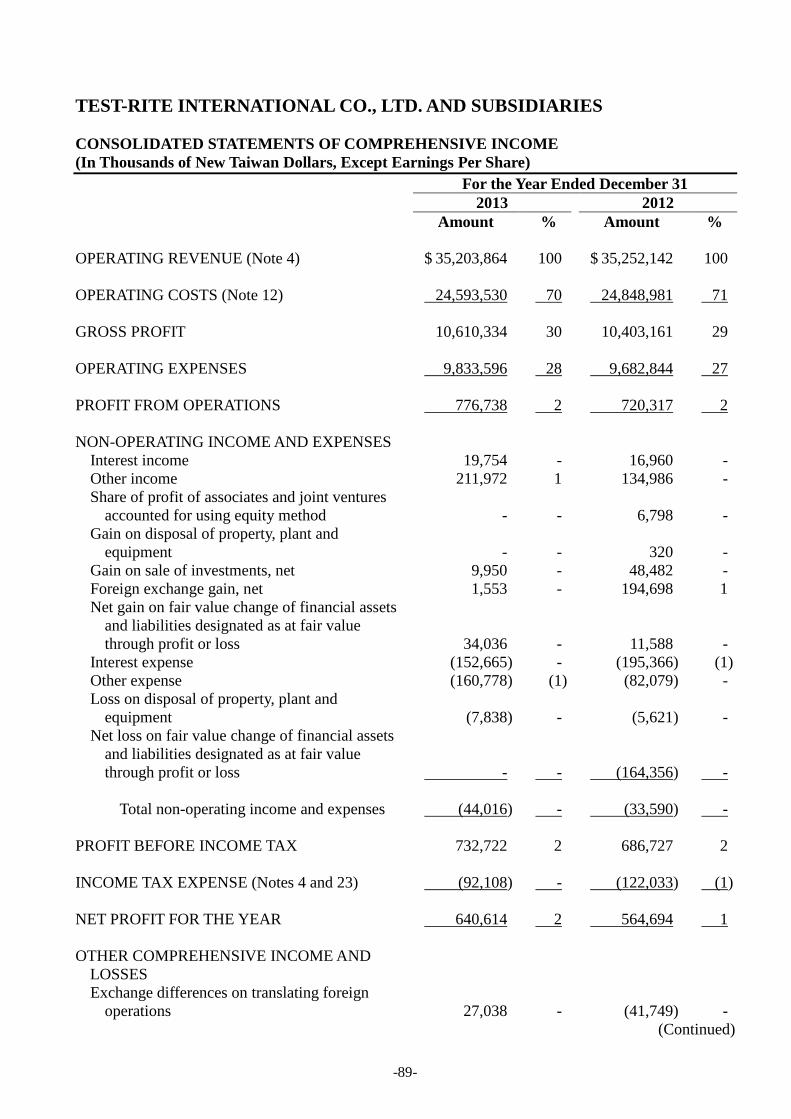
-89-
TEST-RITE INTERNATIONAL CO., LTD. AND SUBSIDIARIES
CONSOLIDATED STATEMENTS OF COMPREHENSIVE INCOME
(In Thousands of New Taiwan Dollars, Except Earnings Per Share)
For the Year Ended December 31
2013 2012
Amount % Amount %
OPERATING REVENUE (Note 4) $ 35,203,864 100 $ 35,252,142 100
OPERATING COSTS (Note 12) 24,593,530 70 24,848,981 71
GROSS PROFIT 10,610,334 30 10,403,161 29
OPERATING EXPENSES 9,833,596 28 9,682,844 27
PROFIT FROM OPERATIONS 776,738 2 720,317 2
NON-OPERATING INCOME AND EXPENSES
Interest income 19,754 - 16,960 -
Other income 211,972 1 134,986 -
Share of profit of associates and joint ventures
accounted for using equity method - - 6,798 -
Gain on disposal of property, plant and
equipment - - 320 -
Gain on sale of investments, net 9,950 - 48,482 -
Foreign exchange gain, net 1,553 - 194,698 1
Net gain on fair value change of financial assets
and liabilities designated as at fair value
through profit or loss 34,036 - 11,588 -
Interest expense (152,665) - (195,366) (1)
Other expense (160,778) (1) (82,079) -
Loss on disposal of property, plant and
equipment (7,838) - (5,621) -
Net loss on fair value change of financial assets
and liabilities designated as at fair value
through profit or loss - - (164,356) -
Total non-operating income and expenses (44,016) - (33,590) -
PROFIT BEFORE INCOME TAX 732,722 2 686,727 2
INCOME TAX EXPENSE (Notes 4 and 23) (92,108) - (122,033) (1)
NET PROFIT FOR THE YEAR 640,614 2 564,694 1
OTHER COMPREHENSIVE INCOME AND
LOSSES
Exchange differences on translating foreign
operations 27,038 - (41,749) -
(Continued)
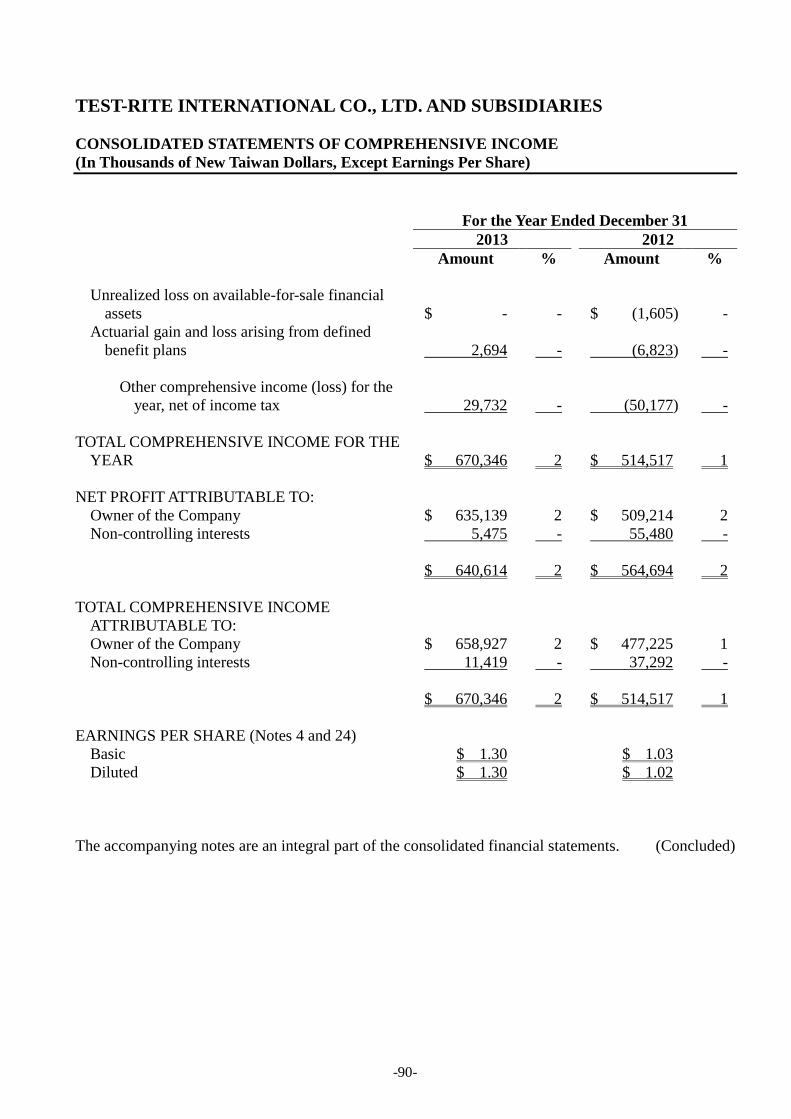
-90-
TEST-RITE INTERNATIONAL CO., LTD. AND SUBSIDIARIES
CONSOLIDATED STATEMENTS OF COMPREHENSIVE INCOME
(In Thousands of New Taiwan Dollars, Except Earnings Per Share)
For the Year Ended December 31
2013 2012
Amount % Amount %
Unrealized loss on available-for-sale financial
assets $ - - $ (1,605) -
Actuarial gain and loss arising from defined
benefit plans 2,694 - (6,823) -
Other comprehensive income (loss) for the
year, net of income tax 29,732 - (50,177) -
TOTAL COMPREHENSIVE INCOME FOR THE
YEAR $ 670,346 2 $ 514,517 1
NET PROFIT ATTRIBUTABLE TO:
Owner of the Company $ 635,139 2 $ 509,214 2
Non-controlling interests 5,475 - 55,480 -
$ 640,614 2 $ 564,694 2
TOTAL COMPREHENSIVE INCOME
ATTRIBUTABLE TO:
Owner of the Company $ 658,927 2 $ 477,225 1
Non-controlling interests 11,419 - 37,292 -
$ 670,346 2 $ 514,517 1
EARNINGS PER SHARE (Notes 4 and 24)
Basic $ 1.30 $ 1.03
Diluted $ 1.30 $ 1.02
The accompanying notes are an integral part of the consolidated financial statements. (Concluded)
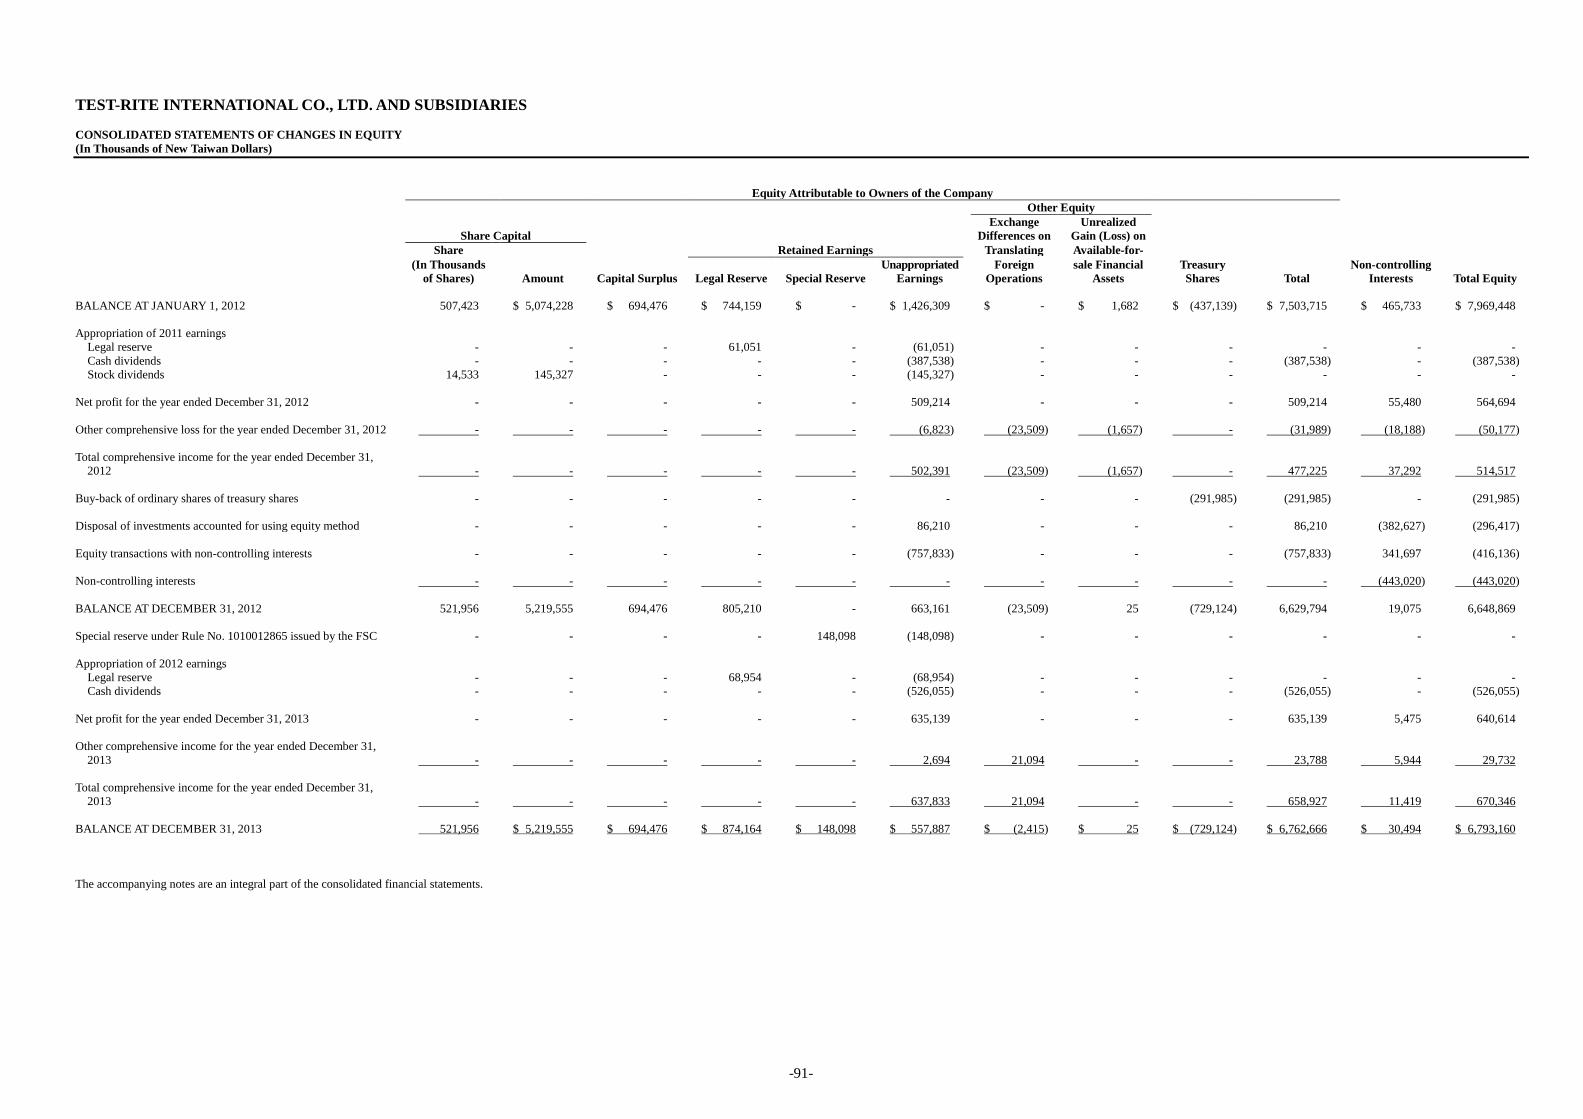
-91-
TEST-RITE INTERNATIONAL CO., LTD. AND SUBSIDIARIES
CONSOLIDATED STATEMENTS OF CHANGES IN EQUITY
(In Thousands of New Taiwan Dollars)
Equity Attributable to Owners of the Company
Other Equity
Share Capital
Exchange
Differences on
Unrealized
Gain (Loss) on
Share Retained Earnings Translating Available-for-
(In Thousands Unappropriated Foreign sale Financial Treasury Non-controlling
of Shares) Amount Capital Surplus Legal Reserve Special Reserve Earnings Operations Assets Shares Total Interests Total Equity
BALANCE AT JANUARY 1, 2012 507,423 $ 5,074,228 $ 694,476 $ 744,159 $ - $ 1,426,309 $ - $ 1,682 $ (437,139) $ 7,503,715 $ 465,733 $ 7,969,448
Appropriation of 2011 earnings
Legal reserve - - - 61,051 - (61,051) - - - - - -
Cash dividends - - - - - (387,538) - - - (387,538) - (387,538)
Stock dividends 14,533 145,327 - - - (145,327) - - - - - -
Net profit for the year ended December 31, 2012 - - - - - 509,214 - - - 509,214 55,480 564,694
Other comprehensive loss for the year ended December 31, 2012 - - - - - (6,823) (23,509) (1,657) - (31,989) (18,188) (50,177)
Total comprehensive income for the year ended December 31,
2012 - - - - - 502,391 (23,509) (1,657) - 477,225 37,292 514,517
Buy-back of ordinary shares of treasury shares - - - - - - - - (291,985) (291,985) - (291,985)
Disposal of investments accounted for using equity method - - - - - 86,210 - - - 86,210 (382,627) (296,417)
Equity transactions with non-controlling interests - - - - - (757,833) - - - (757,833) 341,697 (416,136)
Non-controlling interests - - - - - - - - - - (443,020) (443,020)
BALANCE AT DECEMBER 31, 2012 521,956 5,219,555 694,476 805,210 - 663,161 (23,509) 25 (729,124) 6,629,794 19,075 6,648,869
Special reserve under Rule No. 1010012865 issued by the FSC - - - - 148,098 (148,098) - - - - - -
Appropriation of 2012 earnings
Legal reserve - - - 68,954 - (68,954) - - - - - -
Cash dividends - - - - - (526,055) - - - (526,055) - (526,055)
Net profit for the year ended December 31, 2013 - - - - - 635,139 - - - 635,139 5,475 640,614
Other comprehensive income for the year ended December 31,
2013 - - - - - 2,694 21,094 - - 23,788 5,944 29,732
Total comprehensive income for the year ended December 31,
2013 - - - - - 637,833 21,094 - - 658,927 11,419 670,346
BALANCE AT DECEMBER 31, 2013 521,956 $ 5,219,555 $ 694,476 $ 874,164 $ 148,098 $ 557,887 $ (2,415) $ 25 $ (729,124) $ 6,762,666 $ 30,494 $ 6,793,160
The accompanying notes are an integral part of the consolidated financial statements.

-92-
TEST-RITE INTERNATIONAL CO., LTD. AND SUBSIDIARIES
CONSOLIDATED STATEMENTS OF CASH FLOWS
(In Thousands of New Taiwan Dollars)
For the Year Ended December
31
2013 2012
CASH FLOWS FROM OPERATING ACTIVITIES
Profit before income tax $ 732,722 $ 686,727
Adjustments for:
Depreciation expenses 668,398 653,700
Amortization expenses 143,140 162,781
Impairment loss recognized on trade receivables 4,501 3,174
Net (gain) loss on fair value change of financial assets and
liabilities designated as at fair value through profit or loss (34,036) 152,768
Interest expense 152,665 195,366
Interest income (19,754) (16,960)
Share of profit of associates and joint ventures accounted for
using equity method - (6,798)
Loss on disposal and impairment of property, plant and
equipment 7,838 5,301
Gain on sale of investments (9,950) (48,482)
Unrealized net gain on foreign currency exchange (1,553) (194,698)
Amortization of unrealized gain on sale-leaseback (50,000) (50,000)
Amortization of liability component of preferred stocks,
non-current - 5,229
Changes in operating assets and liabilities
Increase in financial assets held for trading (39,092) (159,435)
Decrease in notes receivable 31 34,136
(Increase) decrease in trade receivables (303,563) 439,334
Increase in other receivables (95,212) (49,436)
(Increase) decrease in inventories (313,375) 519,035
(Increase) decrease in prepayments (42,611) 347,335
(Increase) decrease in other current assets (50,212) 54,744
Decrease in other financial assets 337 14
Decrease in other operating assets 198,932 737,929
Increase (decrease) in notes payable 82,029 (2,728)
Increase in trade payables 817,872 383,578
(Decrease) increase in other payables (360,783) 274,327
Decrease in advance receipts (692) (51,399)
Increase (decrease) in other current liabilities 7,771 (192,515)
Decrease in other operating liabilities (10,873) (24,557)
Cash generated from operations 1,484,530 3,858,470
Interest received 23,636 12,934
Interest paid (151,766) (197,921)
Income tax paid (114,397) (183,093)
Net cash generated from operating activities 1,242,003 3,490,390

-93-
CASH FLOWS FROM INVESTING ACTIVITIES
Purchase of debt investments with no active market (166,123) -
Proceeds from decreased capital stock of financial assets carried
at cost, non-current 4,867 635
(Continued)

-94-
TEST-RITE INTERNATIONAL CO., LTD. AND SUBSIDIARIES
CONSOLIDATED STATEMENTS OF CASH FLOWS
(In Thousands of New Taiwan Dollars)
For the Year Ended December
31
2013 2012
Proceeds on sale of financial assets measured at cost $ 6,969 $ 175
Proceeds on sale of available-for-sale financial assets - 28,771
Net cash outflow on acquisition of subsidiaries (8,053) -
Net cash inflow on disposal of subsidiaries - 2,109,643
Payments for property, plant and equipment (703,022) (563,593)
Proceeds from disposal of property, plant and equipment 14,588 8,304
Increase in refundable deposits paid (91,844) (8,440)
Payments for intangible assets (119,806) (603,063)
Proceeds from disposal of intangible assets 21,673 130,758
Proceeds on sale of debt investments with no active market - 2,000
Net cash (used in) generated from investing activities (1,040,751) 1,105,190
CASH FLOWS FROM FINANCING ACTIVITIES
Increase (decrease) in short-term borrowings 492,534 (1,275,677)
Increase (decrease) in short-term bills payable 9,997 (29,923)
Increase in long-term borrowings 2,496,413 7,505,202
Decrease in long-term borrowings (2,181,995) (9,442,595)
Increase in refundable deposits received 17,528 22,618
Dividends paid to owners of the Company (526,055) (387,538)
Payments for buy-back of ordinary shares - (291,985)
Payments for equity transactions with non-controlling interests - (416,136)
Change in non-controlling interests - (443,020)
Net cash generated from (used in) financing activities 308,422 (4,759,054)
EFFECTS OF EXCHANGE RATE CHANGES ON THE
BALANCE OF CASH HELD IN FOREIGN CURRENCIES 27,038 (48,572)
NET INCREASE (DECREASE) IN CASH AND CASH
EQUIVALENTS 536,712 (212,046)
CASH AND CASH EQUIVALENTS AT THE BEGINNING OF
THE YEAR 1,881,727 2,093,773
CASH AND CASH EQUIVALENTS AT THE END OF THE
YEAR $ 2,418,439 $ 1,881,727
The accompanying notes are an integral part of the consolidated financial statements. (Concluded)

-95-
TEST-RITE INTERNATIONAL CO., LTD. AND SUBSIDIARIES
NOTES TO CONSOLIDATED FINANCIAL STATEMENTS
YEARS ENDED DECEMBER 31, 2013 AND 2012
(In Thousands of New Taiwan Dollars, Unless Stated Otherwise)
1. ORGANIZATION AND OPERATIONS
Information of Parent Company
Test-Rite International Co., Ltd. (―Test-Rite‖) was established in August 1978.
Test-Rite is engaged mainly in the import and export of hand tools, auto parts, machinery, furniture, and
various home appliances. Test-Rite‘s marketplaces are primarily located in the United States of America,
Canada, Great Britain, France, Germany, Australia, etc.
The Taiwan Securities and Futures Commission approved in February 1993 Test-Rite‘s application for
stock listing in the Taiwan Stock Exchange.
The consolidated financial statements are presented in Test-Rite‘s functional currency, New Taiwan dollars.
As of December 31, 2013 and 2012, Test-Rite and subsidiaries (collectively, the ―Company‖) had 6,115
and 6,318 employees, respectively.
2. APPROVAL OF FINANCIAL STATEMENTS
The consolidated financial statements were approved and authorized for issue by the Board of Directors on
March 25, 2014.
3. APPLICATION OF NEW AND REVISED STANDARDS, AMENDMENTS AND
INTERPRETATIONS
a. New, amended and revised standards and interpretations (the ―New IFRSs‖) in issue but not yet
effective
Test-Rite and its entire controlled subsidiaries (the ―Company‖) have not applied the following
International Financial Reporting Standards, International Accounting Standards, International
Financial Reporting Interpretations, and Standing Interpretations that have been issued by the IASB.
On January 28, 2014, the Financial Supervisory Commission (FSC) announced the framework for the
adoption of updated IFRSs version in the ROC. Under this framework, starting January 1, 2015, the
previous version of IFRSs endorsed by the FSC (the 2010 IFRSs version) currently applied by
companies with shares listed on the Taiwan Stock Exchange or traded on the Taiwan GreTai Securities
Market or Emerging Stock Market will be replaced by the updated IFRSs without IFRS 9 (the 2013
IFRSs version). However, as of the date that the consolidated financial statements were authorized for
issue, the FSC has not endorsed the following new, amended and revised standards and interpretations
issued by the IASB (the ―New IFRSs‖) included in the 2013 IFRSs version. Furthermore, the FSC has
not announced the effective date for the following New IFRSs that are not included in the 2013 IFRSs
version.

-96-
The New IFRSs Included in the
2013 IFRSs Version Not Yet Endorsed by the FSC
Effective Date
Announced by IASB (Note
1)
Improvements to IFRSs (2009) - amendment to IAS 39 January 1, 2009 and January
1, 2010, as appropriate
Amendment to IAS 39 ―Embedded Derivatives‖ Effective for annual periods
ending on or after June
30, 2009
Improvements to IFRSs (2010) July 1, 2010 and January 1,
2011, as appropriate
Annual Improvements to IFRSs 2009-2011 Cycle January 1, 2013
Amendment to IFRS 1 ―Limited Exemption from Comparative
IFRS 7 Disclosures for First-Time Adopters‖
July 1, 2010
Amendment to IFRS 1 ―Severe Hyperinflation and Removal of
Fixed Dates for First-Time Adopters‖
July 1, 2011
Amendment to IFRS 1 ―Government Loans‖ January 1, 2013
Amendment to IFRS 7 ―Disclosure - Offsetting Financial Assets
and Financial Liabilities‖
January 1, 2013
Amendment to IFRS 7 ―Disclosure - Transfer of Financial
Assets‖
July 1, 2011
IFRS 10 ―Consolidated Financial Statements‖ January 1, 2013
IFRS 11 ―Joint Arrangements‖ January 1, 2013
IFRS 12 ―Disclosure of Interests in Other Entities‖ January 1, 2013
Amendments to IFRS 10, IFRS 11 and IFRS 12 ―Consolidated
Financial Statements, Joint Arrangements and Disclosure of
Interests in Other Entities: Transition Guidance‖
January 1, 2013
Amendments to IFRS 10 and IFRS 12 and IAS 27 ―Investment
Entities‖
January 1, 2014
IFRS 13 ―Fair Value Measurement‖ January 1, 2013
Amendment to IAS 1 ―Presentation of Other Comprehensive
Income‖
July 1, 2012
Amendment to IAS 12 ―Deferred tax: Recovery of Underlying
Assets‖
January 1, 2012
IAS 19 (Revised 2011) ―Employee Benefits‖ January 1, 2013
IAS 27 (Revised 2011) ―Separate Financial Statements‖ January 1, 2013
IAS 28 (Revised 2011) ―Investments in Associates and Joint
Ventures‖
January 1, 2013
Amendment to IAS 32 ―Offsetting Financial Assets and
Financial Liabilities‖
January 1, 2014
IFRIC 20 ―Stripping Costs in Production Phase of a Surface
Mine‖
January 1, 2013
The New IFRSs Not Included in the 2013 IFRSs Version
Effective Date
Announced by IASB (Note
1)
Annual Improvements to IFRSs 2010-2012 Cycle July 1, 2014 (Note 2)
Annual Improvements to IFRSs 2011-2013 Cycle July 1, 2014
IFRS 9 ―Financial Instruments‖ Note 3
Amendments to IFRS 9 and IFRS 7 ―Mandatory Effective Date Note 3
-97-
The New IFRSs Not Included in the 2013 IFRSs Version
Effective Date
Announced by IASB (Note
1)
of IFRS 9 and Transition Disclosures‖
IFRS 14 ―Regulatory Deferral Accounts‖ January 1, 2016
Amendment to IAS 19 ―Defined Benefit Plans: Employee
Contributions‖
July 1, 2014
Amendment to IAS 36 ―Impairment of Assets: Recoverable
Amount Disclosures for Non-Financial Assets‖
January 1, 2014
Amendment to IAS 39 ―Novation of Derivatives and
Continuation of Hedge Accounting‖
January 1, 2014
IFRIC 21 ―Levies‖ January 1, 2014
Note 1: Unless stated otherwise, the above New IFRSs are effective for annual periods
beginning on or after the respective effective dates.
Note 2: The amendment to IFRS 2 applies to share-based payment transactions for which the
grant date is on or after July 1, 2014; the amendment to IFRS 3 applies to business
combinations for which the acquisition date is on or after 1 July 2014; the amendment
to IFRS 13 is effective immediately; the remaining amendments are effective for
annual periods beginning on or after July 1, 2014.
Note 3: IASB tentatively decided that an entity should apply IFRS 9 for annual periods
beginning on or after January 1, 2018.
b. Significant impending changes in accounting policy that would result from adoption of New IFRSs in
issue but not yet effective
Except for the following, the impending initial application of the above New IFRSs would not have any
material impact on the Company‘s accounting policies:
1) IFRS 9 ―Financial Instruments‖
Recognition and measurement of financial assets
With regards to financial assets, all recognized financial assets that are within the scope of IAS 39
―Financial Instruments: Recognition and Measurement‖ are subsequently measured at amortized
cost or fair value. Specifically, financial assets that are held within a business model whose
objective is to collect the contractual cash flows, and that have contractual cash flows that are solely
payments of principal and interest on the principal outstanding are generally measured at amortized
cost at the end of subsequent accounting periods. All other financial assets are measured at their
fair values at the end of reporting period. However, the Company may make an irrevocable
election to present subsequent changes in the fair value of an equity investment (that is not held for
trading) in other comprehensive income, with only dividend income generally recognized in profit
or loss.
Recognition and measurement of financial liabilities
As for financial liabilities, the main changes in the classification and measurement relate to the
subsequent measurement of financial liabilities designated as at fair value through profit or loss.
The amount of change in the fair value of such financial liability attributable to changes in the credit
risk of that liability is presented in other comprehensive income and the remaining amount of
-98-
change in the fair value of that liability is presented in profit or loss, unless the recognition of the
effects of changes in the liability‘s credit risk in other comprehensive income would create or
enlarge an accounting mismatch in profit or loss. Changes in fair value attributable to a financial
liability‘s credit risk are not subsequently reclassified to profit or loss. If the above accounting
treatment would create or enlarge an accounting mismatch in profit or loss, the Company presents
all gains or losses on that liability in profit or loss.
2) New and revised standards on consolidation, joint arrangement, and associates and disclosure
a) IFRS 10 ―Consolidated Financial Statements‖
IFRS 10 replaces IAS 27 ―Consolidated and Separate Financial Statements‖ and SIC 12
―Consolidation - Special Purpose Entities‖. The Company considers whether it has control
over other entities for consolidation. The Company has control over an investee if and only if
it has i) power over the investee; ii) exposure, or rights, to variable returns from its involvement
with the investee and iii) the ability to use its power over the investee to affect the amount of its
returns. Additional guidance has been included in IFRS 10 to explain when an investor has
control over an investee.
b) IFRS 12 ―Disclosure of Interests in Other Entities‖
IFRS 12 is a new disclosure standard and is applicable to entities that have interests in
subsidiaries, joint arrangements, associates and/or unconsolidated structured entities. In
general, the disclosure requirements in IFRS 12 are more extensive than in the current
standards.
c) Revision to IAS 28 ―Investments in Associates and Joint Ventures‖
Revised IAS 28 requires when a portion of an investment in an associate meets the criteria to be
classified as held for sale, that portion is classified as held for sale. Any retained portion that
has not been classified as held for sale is accounted for using the equity method. Under
current IAS 28, when a portion of an investment in associates meets the criteria to be classified
as held for sale, the entire investment is classified as held for sale and ceases to apply the equity
method.
3) IFRS 13 ―Fair Value Measurement‖
IFRS 13 establishes a single source of guidance for fair value measurements. It defines fair value,
establishes a framework for measuring fair value, and requires disclosures about fair value
measurements. The disclosure requirements in IFRS 13 are more extensive than those required in
the current standards. For example, quantitative and qualitative disclosures based on the
three-level fair value hierarchy currently required for financial instruments only will be extended by
IFRS 13 to cover all assets and liabilities within its scope.
4) Amendment to IAS 1 ―Presentation of Items of Other Comprehensive Income‖
The amendment to IAS 1 requires items of other comprehensive income to be grouped into those
that (1) will not be reclassified subsequently to profit or loss; and (2) will be reclassified
subsequently to profit or loss when specific conditions are met. Income taxes on related items of
other comprehensive income are grouped on the same basis. Under current IAS 1, there were no
such requirements.
5) Amendment to IAS 36 ―Recoverable Amount Disclosures for Non-Financial Assets‖
In issuing IFRS 13 ―Fair Value Measurement‖, the IASB made consequential amendment to the
disclosure requirements in IAS 36 ―Impairment of Assets‖, introducing a requirement to disclose in
-99-
every reporting period the recoverable amount of an asset or each cash-generating unit. The
amendment clarifies that such disclosure of recoverable amounts is required only when an
impairment loss has been recognized or reversed during the period. Furthermore, the Company is
required to disclose the discount rate used in measurements of the recoverable amount based on fair
value less costs of disposal measured using a present value technique.
c. The impact of the application of New IFRSs and the Regulations Governing the Preparation of
Financial Reports by Securities Issuers (the ―Regulations‖) in issue but not yet effective on the
Company‘s consolidated financial statements is as follows:
As of the date the consolidated financial statements were authorized for issue, the Company is
continuingly assessing the possible impact that the application of the above New IFRSs will have on the
Company's financial position and operating result, and will disclose the relevant impact when the
assessment is complete.
4. SUMMARY OF SIGNIFICANT ACCOUNTING POLICIES
On May 14, 2009, the FSC announced the ―Framework for the Adoption of IFRSs by the Companies in the
ROC.‖ In this framework, starting 2013, companies with shares listed on the Taiwan Stock Exchange or
traded on the Taiwan GreTai Securities Market or Emerging Stock Market should prepare their
consolidated financial statements in accordance with the Regulations Governing the Preparation of
Financial Reports by Securities Issuers and the IFRSs approved by the FSC.
The Company‘s consolidated financial statements for the years ended December 31, 2013 is its first IFRS
consolidated financial statements. The date of transition to IFRSs was January 1, 2012. Refer to Note 37
for the impact of IFRS conversion on the Company‘s consolidated financial statements.
Statement of Compliance
The consolidated financial statements have been prepared in accordance with the Regulations Governing
the Preparation of Financial Reports by Securities Issuers and IFRSs as endorsed by the FSC.
Basis of Preparation
The consolidated financial statements have been prepared on the historical cost basis except for financial
instruments that are measured at fair values. Historical cost is generally based on the fair value of the
consideration given in exchange for assets.
The opening consolidated balance sheet as of the date of transition to IFRSs was prepared in accordance
with IFRS 1 - First-time Adoption of International Financial Reporting Standards. The applicable IFRSs
have been applied retrospectively by the Company except for some aspects where other IFRS 1 prohibits
retrospective application or grants optional exemptions to this general principle. For the exemptions taken
by the Company, please refer to Note 37.
Classification of Current and Non-current Assets and Liabilities
Current assets include:
a. Those assets held primarily for trading purposes;
b. Those assets to be realized within twelve months;
c. Cash and cash equivalents from the balance sheet date unless the asset is to be used for an exchange or
to settle a liability, or otherwise remains restricted, at more than twelve months after the balance sheet
date.

-100-
Current liabilities are:
a. Obligations incurred for trading purposes;
b. Obligations to be settled within twelve months from the balance sheet date;
c. An unconditional right to defer settlement of the liability for at least twelve months after the balance
sheet date.
Aforementioned assets and liabilities that are not classified as current are classified as non-current.

-101-
Basis of Consolidation
a. Principles for preparing consolidated financial statements
The consolidated financial statements incorporate the financial statements of Test-Rite and entities
controlled by Test-Rite (its subsidiaries).
Income and expenses of subsidiaries acquired or disposed of during the year are included in the
consolidated statement of comprehensive income from the effective date of acquisition and up to the
effective date of disposal, as appropriate.
All intra-group transactions, balances, income and expenses are eliminated in full on consolidation.
When necessary, adjustments are made to the financial statements of subsidiaries to bring their
accounting policies in line with those used by other members of the Company.
When the Company loses control of a subsidiary, a gain or loss is recognized in profit or loss and is
calculated as the difference between (i) the aggregate of the fair value of the consideration received and
any investment retained in the former subsidiary at its fair value at the date when control is lost and (ii)
the assets (including any goodwill), and liabilities of the former subsidiary and any non-controlling
interests at their carrying amounts at the date when control is lost. If the Company loses control of a
subsidiary, the Company accounts for all amounts recognized in other comprehensive income in
relation to that subsidiary on the same basis as would be required if the Company had directly disposed
of the related assets or liabilities.
b. Subsidiary included in consolidated financial statements
Investor Subsidiaries Main Businesses
% of Ownership
December 31,
2013
December 31,
2012
January 1,
2012
Test-Rite International Co., Ltd.
Fortune Miles Co., Ltd. Investment holding company 100.00 100.00 100.00
Test-Rite International Co.,
Ltd.
Test-Rite Star Co., Ltd. Investment holding company 100.00 100.00 100.00
Test-Rite International Co.,
Ltd.
Test-Rite Investment (B.V.I.)
Co., Ltd.
Investment in various industries 100.00 100.00 100.00
Test-Rite International Co., Ltd.
Test-Rite Retailing Co., Ltd. Investment holding company 100.00 100.00 100.00
Test-Rite International Co.,
Ltd.
Test-Rite Trading Co., Ltd. Investment holding company 100.00 100.00 100.00
Test-Rite International Co.,
Ltd.
TRS Investment Co., Ltd. Investment holding company 100.00 100.00 100.00
Test-Rite International Co.,
Ltd.
Test-Rite Pte. Ltd. Importation and exportation 100.00 100.00 100.00
Test-Rite International Co.,
Ltd.
Test-Rite Product (Hong Kong)
Ltd.
Importation and exportation 100.00 100.00 100.00
Test-Rite International Co.,
Ltd.
Test-Rite Int‘l (Australia) Pty
Ltd.
Importation and exportation 100.00 100.00 100.00
Test-Rite International Co., Ltd.
Test-Rite Canada Co., Ltd. Importation and exportation 100.00 100.00 100.00
Test-Rite International Co.,
Ltd.
Test-Rite (UK) Co., Ltd. Importation and exportation 100.00 100.00 100.00
Test-Rite International Co.,
Ltd.
Test-Rite Development Co., Ltd. Investment holding company 100.00 100.00 100.00
Test-Rite International Co.,
Ltd.
Upmaster Co., Ltd. Investment holding company 100.00 100.00 -
Test-Rite International Co., Ltd. and Upmaster Co.,
Ltd.
Test-Rite Int‘l (U.S.) Co., Ltd. Investment holding company 100.00 100.00 49.00
Test-Rite International Co., Ltd.
Test-Rite Vietnam Co., Ltd. Importation and exportation 95.00 95.00 95.00
Test-Rite International Co.,
Ltd.
Test-Rite Int‘l (Thailand) Ltd. Importation and exportation 48.99 48.99 48.99
(Continued)

-102-
Investor Subsidiaries Main Businesses
% of Ownership
December 31,
2013
December 31,
2012
January 1,
2012
Test-Rite International Co.,
Ltd.
Lih Chiou Co., Ltd. Investment holding company 100.00 100.00 100.00
Test-Rite International Co.,
Ltd.
Lih Teh International Co., Ltd. Logistics services 100.00 100.00 100.00
Test-Rite International Co., Ltd.
B&S Link Co., Ltd. Providing information software and electronic information
100.00 100.00 100.00
Test-Rite International Co.,
Ltd.
Fusion International
Distribution, Inc.
Importation and exportation 100.00 100.00 100.00
Test-Rite International Co.,
Ltd.
Chung Cin Enterprise Co., Ltd. Authorized builder to build
dwelling, rental and sale of
building
100.00 100.00 100.00
Test-Rite International Co.,
Ltd. and Lih Chiou Co.,
Ltd.
Test-Rite Retail Co., Ltd. Sale of house decoration
hardware and construction
materials
100.00 100.00 100.00
Test-Rite International Co.,
Ltd.
International Art Enterprise Co.,
Ltd.
Trading of leisure goods 100.00 - -
Test-Rite International Co., Ltd.
Tong Lung Metal Industry Co., Ltd.
The manufacture and sale of (1) various advanced lock,
building metals parts and
processed plastic goods (2) molding and tool machines
and (3) kitchen and bathroom
equipment (4) import and export business related to the
aforementioned products
- - 68.27
Lih Chiou Co., Ltd. Hola Homefurnishings Co., Ltd. Sales of furniture, bedclothes, kitchen equipment and
fixtures
100.00 100.00 100.00
Lih Chiou Co., Ltd. Homy Homefurnishings Co., Ltd.
Sales of furniture, bedclothes, kitchen equipment and
fixtures
100.00 100.00 100.00
Lih Chiou Co., Ltd. Freer Inc. Sales of furniture, bedclothes, kitchen equipment and
fixtures
100.00 100.00 100.00
Chung Cin Enterprise Co., Ltd.
Tony Construction Co., Ltd. Build and civil engineering 100.00 100.00 100.00
Chung Cin Enterprise Co., Ltd.
Test Cin M&E Engineering Co., Ltd.
Mechanical and electronic engineering
100.00 100.00 100.00
Chung Cin Enterprise Co.,
Ltd.
Chung Cin Interior Design
Construction Co., Ltd.
Interior design 100.00 100.00 100.00
Chung Cin Enterprise Co.,
Ltd.
Viet Han Co., Ltd. Importation and exportation 51.00 51.00 51.00
Test-Rite Retail Test-Rite Home Service Co., Ltd.
Interior design 100.00 100.00 100.00
Tong Lung Metal Industry
Co., Ltd.
Lucky International (Samoa)
Ltd.
Investment - - 68.27
Lucky International
(Samoa) Ltd.
Tong Lung (Philippines) Metal
Industry Co., Inc.
The manufacture and fabrication
of various lock
- - 68.27
(Concluded)
Note 1: Acquisition Upmaster in August 2012.
Note 2: Acquisition International Art Enterprise in January 2013.
Note 3: Disposal Tong Lung in August 2012.
Foreign Currencies
In preparing the financial statements of each individual group entity, transactions in currencies other than
the entity‘s functional currency (foreign currencies) are recognized at the rates of exchange prevailing at the
dates of the transactions.
At the end of each reporting period, monetary items denominated in foreign currencies are retranslated at
the rates prevailing at that date.

-103-
Non-monetary items measured at fair value that are denominated in foreign currencies are retranslated at
the rates prevailing at the date when the fair value was determined. Exchange differences arising on the
retranslation of non-monetary items are included in profit or loss for the period except for exchange
differences arising from the retranslation of non-monetary items in respect of which gains and losses are
recognized directly in other comprehensive income, in which case, the exchange differences are also
recognized directly in other comprehensive income.
Non-monetary items that are measured at historical cost in a foreign currency are not retranslated.
For the purposes of presenting consolidated financial statements, the assets and liabilities of the Company‘s
foreign operations are translated into New Taiwan dollars using exchange rates prevailing at the end of each
reporting period. Income and expense items are translated at the average exchange rates for the period.
Exchange differences arising are recognized in other comprehensive income (attributed to the owners of the
Company and non-controlling interests as appropriate).
On the disposal of a foreign operation (i.e. a disposal of the Company‘s entire interest in a foreign
operation, or a disposal involving loss of control over a subsidiary that includes a foreign operation, a
disposal involving loss of joint control over a jointly controlled entity that includes a foreign operation, or a
disposal involving loss of significant influence over an associate that includes a foreign operation), all of
the exchange differences accumulated in equity in respect of that operation attributable to the owners of the
Company are reclassified to profit or loss.
In relation to a partial disposal of a subsidiary that does not result in the Company losing control over the
subsidiary, the proportionate share of accumulated exchange differences is re-attributed to non-controlling
interests of the subsidiary and is not recognized in profit or loss. For all other partial disposals, the
proportionate share of the accumulated exchange differences recognized in other comprehensive income is
reclassified to profit or loss.
Inventories
Inventories are stated at the lower of cost or net realizable value. Inventory write-downs are made by
category, except where it may be appropriate to group similar or related categories. Net realizable value is
the estimated selling price of inventories less all estimated costs necessary to make the sale. Inventories
are recorded using the moving average method.
Real estate and construction in progress are stated at carrying cost or construction cost by construction
project. Interest is capitalized during the construction period.
Constructions in progress and advance construction receipts related to the same construction should be
netted. If the netted amount is a debit balance, then it should be recorded in construction in progress,
whereas credit balance should be recorded in advance construction receipts.
Investment in Associates
An associate is an entity over which the Company has significant influence and that is neither a subsidiary
nor an interest in a joint venture.
The results and assets and liabilities of associates are incorporated in these consolidated financial
statements using the equity method of accounting. Under the equity method, an investment in an associate
is initially recognized at cost and adjusted thereafter to recognize the Company‘s share of the profit or loss
and other comprehensive income of the associate. The Company also recognizes the changes in the
Company‘s share of equity of associates attributable to the Company.
When a group entity transacts with its associate, profits and losses resulting from the transactions with the
associate are recognized in the Company‘ consolidated financial statements only to the extent of interests in
the associate that are not related to the Company.
-104-
Property, Plant and Equipment
Property, plant and equipment are stated at cost, less subsequent accumulated depreciation and subsequent
accumulated impairment loss.
Depreciation is recognized using the straight-line method. Each significant part is depreciated separately.
The estimated useful lives, residual values and depreciation method are reviewed at the end of each
reporting period, with the effect of any changes in estimate accounted for on a prospective basis.
Any gain or loss arising on the disposal or retirement of an item of property, plant and equipment is
determined as the difference between the sales proceeds and the carrying amount of the asset and is
recognized in profit or loss.
When an item of property, plant and equipment is purchased, the Company calculates related cost of future
dismantling and transportation of the asset as well as the cost of restoring the area to its original condition;
interest expense is recognized annually at the original discount rate and added to the book value of the
asset; when the asset is decommissioned at the end of its useful life, the book value is accumulated in the
estimated cost of decommissioning the asset.
Goodwill
Goodwill arising from the acquisition of a business is carried at cost as established at the date of acquisition
of the business less accumulated impairment loss.
For the purposes of impairment testing, goodwill is allocated to each of the Company‘s cash-generating
units (or groups of cash-generating units) that is expected to benefit from the synergies of the combination.
A cash-generating unit to which goodwill has been allocated is tested for impairment annually, or more
frequently when there is an indication that the unit may be impaired, by comparing its carrying amount,
including the attributable goodwill, with its recoverable amount. However, if the goodwill allocated to a
cash-generating unit was acquired in a business combination during the current annual period, that unit
shall be tested for impairment before the end of the current annual period. If the recoverable amount of
the cash-generating unit is less than its carrying amount, the impairment loss is allocated first to reduce the
carrying amount of any goodwill allocated to the unit and then to the other assets of the unit pro rata based
on the carrying amount of each asset in the unit. Any impairment loss is recognized directly in profit or
loss. An impairment loss recognized for goodwill is not reversed in subsequent periods.
Intangible Assets
Intangible assets with finite useful lives that are acquired separately are initially measured at cost and
subsequently measured at cost less accumulated amortization and accumulated impairment loss.
Amortization is recognized on a straight-line basis. The estimated useful life, residual value, and
amortization method are reviewed at the end of each reporting period, with the effect of any changes in
estimate accounted for on a prospective basis. The residual value of an intangible asset with a finite useful
life shall be assumed to be zero unless the Company expects to dispose of the intangible asset before the
end of its economic life. Intangible assets with indefinite useful lives that are acquired separately are
measured at cost less accumulated impairment loss.
Gains or losses arising from derecognition of an intangible asset, measured as the difference between the
net disposal proceeds and the carrying amount of the asset, are recognized in profit or loss when the asset is
derecognized.

-105-
Impairment of Tangible and Intangible Assets Other Than Goodwill
At the end of each reporting period, the Company reviews the carrying amounts of its tangible and
intangible assets, excluding goodwill, to determine whether there is any indication that those assets have
suffered an impairment loss. If any such indication exists, the recoverable amount of the asset is estimated
in order to determine the extent of the impairment loss. When it is not possible to estimate the recoverable
amount of an individual asset, the Company estimates the recoverable amount of the cash-generating unit to
which the asset belongs.
Intangible assets with indefinite useful lives and intangible assets not yet available for use are tested for
impairment at least annually, and whenever there is an indication that the asset may be impaired.
Recoverable amount is the higher of fair value less costs to sell and value in use. If the recoverable
amount of an asset or cash-generating unit is estimated to be less than its carrying amount, the carrying
amount of the asset or cash-generating unit is reduced to its recoverable amount.
When an impairment loss is subsequently reversed, the carrying amount of the asset or cash-generating unit
is increased to the revised estimate of its recoverable amount, but only to the extent of the carrying amount
that would have been determined had no impairment loss been recognized for the asset or cash-generating
unit in prior years. A reversal of an impairment loss is recognized in profit or loss.
Financial Instruments
Financial assets and financial liabilities are recognized when a group entity becomes a party to the
contractual provisions of the instruments.
Financial assets and financial liabilities are initially measured at fair value. Transaction costs that are
directly attributable to the acquisition or issue of financial assets and financial liabilities (other than
financial assets and financial liabilities at fair value through profit or loss) are added to or deducted from
the fair value of the financial assets or financial liabilities, as appropriate, on initial recognition.
Transaction costs directly attributable to the acquisition of financial assets or financial liabilities at fair
value through profit or loss are recognized immediately in profit or loss.
a. Financial assets
All regular way purchases or sales of financial assets are recognized and derecognized on a trade date
basis.
1) Measurement category
Financial assets are classified into the following categories: Financial assets at fair value through
profit or loss, available-for-sale financial assets, and loans and receivables.
a) Financial assets at fair value through profit or loss
Financial assets are classified as at fair value through profit or loss when the financial asset is
either held for trading or it is designated as at fair value through profit or loss.
Financial assets at fair value through profit or loss are stated at fair value, with any gains or
losses arising on remeasurement recognized in profit or loss.
b) Available-for-sale financial assets
Available-for-sale financial assets are non-derivatives that are either designated as
available-for-sale or are not classified as loans and receivables, held-to-maturity investments or
financial assets at fair value through profit or loss.
-106-
Available-for-sale financial assets are measured at fair value. Changes in the carrying amount
of available-for-sale monetary financial assets relating to changes in foreign currency exchange
rates, interest income calculated using the effective interest method and dividends on
available-for-sale equity investments are recognized in profit or loss. Other changes in the
carrying amount of available-for-sale financial assets are recognized in other comprehensive
income and will be reclassified to profit or loss when the investment is disposed of or is
determined to be impaired.
Dividends on available-for-sale equity instruments are recognized in profit or loss when the
Company‘s right to receive the dividends is established.
c) Loans and receivables
Loans and receivables (including trade receivables, cash and cash equivalent, debt investments
with no active market) are measured at amortized cost using the effective interest method, less
any impairment, except for short-term receivables when the effect of discounting is immaterial.
d) Financial assets measured at cost
Investments in equity instruments under financial assets at fair value through profit or loss that
do not have a quoted market price in an active market and whose fair value cannot be reliably
measured is subsequently measured at cost less any identified impairment loss at the end of each
reporting period.
2) Impairment of financial assets
Financial assets, other than those at fair value through profit or loss, are assessed for indicators of
impairment at the end of each reporting period. Financial assets are considered to be impaired
when there is objective evidence that, as a result of one or more events that occurred after the initial
recognition of the financial asset, the estimated future cash flows of the investment have been
affected.
For financial assets carried at amortized cost, such as trade receivables, assets are assessed for
impairment on a collective basis even if they were assessed not to be impaired individually.
Objective evidence of impairment for a portfolio of receivables could include the aging of
receivables, historical experience of the counterparties and an analysis of their current financial
position for estimating irrecoverable amounts.
For available-for-sale equity investments, a significant or prolonged decline in the fair value of the
security below its cost is considered to be objective evidence of impairment.
When an available-for-sale financial asset is considered to be impaired, cumulative gains or losses
previously recognized in other comprehensive income are reclassified to profit or loss in the period.
In respect of available-for-sale equity securities, impairment loss previously recognized in profit or
loss are not reversed through profit or loss. Any increase in fair value subsequent to an
impairment loss is recognized in other comprehensive income.
For financial assets that are carried at cost, the amount of the impairment loss is measured as the
difference between the asset‘s carrying amount and the present value of the estimated future cash
flows discounted at the current market rate of return for a similar financial asset. Such impairment
loss will not be reversed in subsequent periods.

-107-
The carrying amount of the financial asset is reduced by the impairment loss directly for all
financial assets with the exception of trade receivables, where the carrying amount is reduced
through the use of an allowance account. When a trade receivable and other receivables are
considered uncollectible, it is written off against the allowance account. Subsequent recoveries of
amounts previously written off are credited against the allowance account. Changes in the
carrying amount of the allowance account are recognized in profit or loss.
3) Derecognition of financial assets
The Company derecognizes a financial asset only when the contractual rights to the cash flows from
the asset expire, or when it transfers the financial asset and substantially all the risks and rewards of
ownership of the asset to another party.
On derecognition of a financial asset in its entirety, the difference between the asset‘s carrying
amount and the sum of the consideration received and receivable and the cumulative gain or loss
that had been recognized in other comprehensive income is recognized in profit or loss.
b. Financial liabilities
1) Subsequent measurement
Except financial liabilities at fair value through profit or loss, all the financial liabilities are
measured at amortized cost using the effective interest method.
Financial liabilities are classified as at fair value through profit or loss when the financial liability is
either held for trading or it is designated as at fair value through profit or loss.
Financial liabilities at fair value through profit or loss are stated at fair value, with any gains or
losses arising on remeasurement recognized in profit or loss.
2) Derecognition of financial liabilities
The Company derecognizes a financial liabilities only when the obligation is removed, cancelled or
at maturity. The difference between the carrying amount of the financial liability derecognized
and the consideration paid, including any non-cash assets transferred or liabilities assumed, is
recognized in profit or loss.
c. Derivative financial instruments
The Company enters into a variety of derivative financial instruments to manage its exposure to foreign
exchange rate risks, including foreign exchange forward contracts.
Derivatives are initially recognized at fair value at the date the derivative contracts are entered into and
are subsequently remeasured to their fair value at the end of each reporting period. When the fair
value of derivative financial instruments is positive, the derivative is recognized as a financial asset;
when the fair value of derivative financial instruments is negative, the derivative is recognized as a
financial liability.
Provisions
The Company recognizes provisions when it has the present obligation resulting from past events which
would be paid probably, and the amount can be reliably measured.
-108-
Provisions are measured at the best estimate of the consideration required to settle the present obligation at
the end of the reporting period, taking into account the risks and uncertainties surrounding the obligation.
When a provision is measured using the cash flows estimated to settle the present obligation, its carrying
amount is the present value of those cash flows.
Revenue Recognition
Revenue is measured at the fair value of the consideration received or receivable. Revenue is reduced for
estimated customer returns, rebates and other similar allowances. Sales returns are recognized at the time
of sale provided the seller can reliably estimate future returns and recognizes a liability for returns based on
previous experience and other relevant factors.
a. Sale of goods
Revenue from the sale of goods is recognized when the goods are delivered and titles have passed, at
which time all the following conditions are satisfied:
1) The Company has transferred to the buyer the significant risks and rewards of ownership of the
goods;
2) The Company retains neither continuing managerial involvement to the degree usually associated
with ownership nor effective control over the goods sold;
3) The amount of revenue can be measured reliably;
4) It is probable that the economic benefits associated with the transaction will flow to the Company;
and
5) The costs incurred or to be incurred in respect of the transaction can be measured reliably.
Specifically, the Company recognize sales revenue when goods are delivered to the buyer and the legal
ownership is transferred to the buyer.
Sales of goods that result in award credits for customers, under the Company‘s award scheme, are
accounted for as multiple element revenue transactions and the fair value of the consideration received
or receivable is allocated between the goods supplied and the award credits granted. The
consideration allocated to the award credits is measured by reference to their fair value. Such
consideration is not recognized as revenue at the time of the initial sale transaction but is deferred and
recognized as revenue when the award credits are redeemed and the Company‘s obligations have been
fulfilled.
b. Rendering of services
Service is recognized when services are provided.
Revenue from a contract to provide services is recognized by reference to the stage of completion of the
contract.
c. Dividend and interest income
Dividend income from investments is recognized when the shareholder‘s right to receive payment has
been established provided that it is probable that the economic benefits will flow to the Company and
the amount of income can be measured reliably.
-109-
Interest income from a financial asset is recognized when it is probable that the economic benefits will
flow to the Company and the amount of income can be measured reliably. Interest income is accrued
on a time basis, by reference to the principal outstanding and at the effective interest rate applicable.
Leasing
Leases are classified as finance leases whenever the terms of the lease transfer substantially all the risks and
rewards of ownership to the lessee. All other leases are classified as operating leases.
a. The Company as lessor
Rental income from operating leases is recognized on a straight-line basis over the term of the relevant
lease unless another systematic basis is representative of the time pattern of the lessee‘s benefit from the
use of the leased asset.
b. The Company as lessee
Operating lease payments are recognized as an expense on a straight-line basis over the lease term,
except where another systematic basis is more representative of the time pattern in which economic
benefits from the leased asset are consumed.
Retirement Benefit Costs
Payments to defined contribution retirement benefit plans are recognized as an expense when employees
have rendered service entitling them to the contributions.
For defined benefit retirement benefit plans, the cost of providing benefits is determined using the Projected
Unit Credit Method. All actuarial gains and losses on the defined benefit obligation are recognized
immediately in other comprehensive income. Past service cost is recognized immediately to the extent
that the benefits are already vested, and otherwise is amortized on a straight-line basis over the average
period until the benefits become vested.
The retirement benefit obligation recognized in the consolidated balance sheets represents the present value
of the defined benefit obligation as reduced by the fair value of plan assets. Any asset resulting from this
calculation is limited to the unrecognized past service cost, plus the present value of available refunds and
reductions in future contributions to the plan.
Curtailment or settlement gains or losses on the defined benefit plan are recognized when the curtailment or
settlement occurs.
Taxation
Income tax expense represents the sum of the tax currently payable and deferred tax.
a. Current tax
According to the Income Tax Law, an additional tax at 10% of unappropriated earnings is provided for
as income tax in the year the shareholders approve to retain the earnings.
Adjustments of prior years‘ tax liabilities are added to or deducted from the current year‘s tax provision.
-110-
b. Deferred tax
Deferred tax is recognized on temporary differences between the carrying amounts of assets and
liabilities in the consolidated financial statements and the corresponding tax bases used in the
computation of taxable profit. Deferred tax liabilities are generally recognized for all taxable
temporary differences. Deferred tax assets are generally recognized for all deductible temporary
differences and unused loss carry forward to the extent that it is probable that taxable profits will be
available against which those deductible temporary differences can be utilized.
The carrying amount of deferred tax assets is reviewed at the end of each reporting period and reduced
to the extent that it is no longer probable that sufficient taxable profits will be available to allow all or
part of the asset to be recovered. A previously unrecognized deferred tax asset is also reviewed at the
end of each reporting period and recognized to the to the extent that it has become probable that future
taxable profit will allow the deferred tax asset to be recovered.
Deferred tax liabilities and assets are measured at the tax rates that are expected to apply in the period in
which the liability is settled or the asset realized, based on tax rates (and tax laws) that have been
enacted or substantively enacted by the end of the reporting period. The measurement of deferred tax
liabilities and assets reflects the tax consequences that would follow from the manner in which the
Company expects, at the end of the reporting period, to recover or settle the carrying amount of its
assets and liabilities.
5. CRITICAL ACCOUNTING JUDGEMENTS AND KEY SOURCES OF ESTIMATION
UNCERTAINTY
In the application of the Company‘s accounting policies, which are described in Note 4, the management is
required to make judgments, estimates and assumptions about the carrying amounts of assets and liabilities
that are not readily apparent from other sources. The estimates and associated assumptions are based on
historical experience and other factors that are considered to be relevant. Actual results may differ from
these estimates.
The estimates and underlying assumptions are reviewed on an ongoing basis. Revisions to accounting
estimates are recognized in the period in which the estimate is revised if the revision affects only that
period, or in the period of the revision and future periods if the revision affects both current and future
periods.
Estimated Impairment of Trade Receivables
When there is objective evidence of impairment loss, the Company takes into consideration the estimation
of future cash flows. The amount of the impairment loss is measured as the difference between the asset‘s
carrying amount and the present value of estimated future cash flows (excluding future credit losses that
have not been incurred) discounted at the financial asset‘s original effective interest rate. Where the actual
future cash flows are less than expected, a material impairment loss may arise.
As of December 31, 2013, December 31, 2012 and January 1, 2012, the carrying amounts of trade
receivables were $2,754,264 thousand, $2,408,278 thousand and $2,952,561 thousand (deducted by
allowances for doubtful debts of $44,755 thousand, $40,238 thousand and $49,807 thousand, respectively).

-111-
6. CASH AND CASH EQUIVALENTS
December 31,
2013
December 31,
2012
January 1,
2012
Cash on hand $ 55,850 $ 47,566 $ 55,639
Checking accounts and demand deposits 2,241,054 1,736,589 2,014,836
Cash equivalents 121,535 97,572 23,298
$ 2,418,439 $ 1,881,727 $ 2,093,773
Cash equivalent includes time deposits with original maturities within three months from the date of
acquisition, highly liquid, readily convertible to a known amount of cash and be subject to an insignificant
risk of changes in value. These cash equivalents are held for the purpose of meeting short-term cash
commitments.
The time deposits with original maturity more than 3 months were $166,123 thousand, zero and $2,000
thousand, respectively, as of December 31, 2013, December 31, 2012 and January 1, 2012 were reclassified
to debt investments with no active market (Notes 10 and 32).
The time certificates of deposit of the Company, pledged as collaterals for purchases of raw materials and
collaterals for warranties of construction and reclassified to refundable deposits paid were as follows:
December 31,
2013
December 31,
2012
January 1,
2012
Time deposits $ 114,169 $ 13,134 $ 27,275
7. FINANCIAL INSTRUMENTS AT FAIR VALUE THROUGH PROFIT OR LOSS
December 31,
2013
December 31,
2012
January 1,
2012
Financial assets held for trading - current
Derivative financial assets
Foreign exchange forward contracts $ 2,348 $ - $ 150,289
Non-derivative financial assets
Equity securities listed in open market 92,464 85,676 7,358
Mutual funds 101,496 149,451 80,472
Corporate bonds 61,862 64,508 11,127
Receivable on short selling stocks - 290 490
Other 93,797 - -
$ 351,967 $ 299,925 $ 249,736
Financial liabilities held for trading - current
Derivative financial liabilities
Payable on forward contracts, net $ - $ 20,795 $ 11,975
Metal commodity futures contracts - - 1,340
Non-derivative financial liabilities
Payable on short selling stocks - 290 490
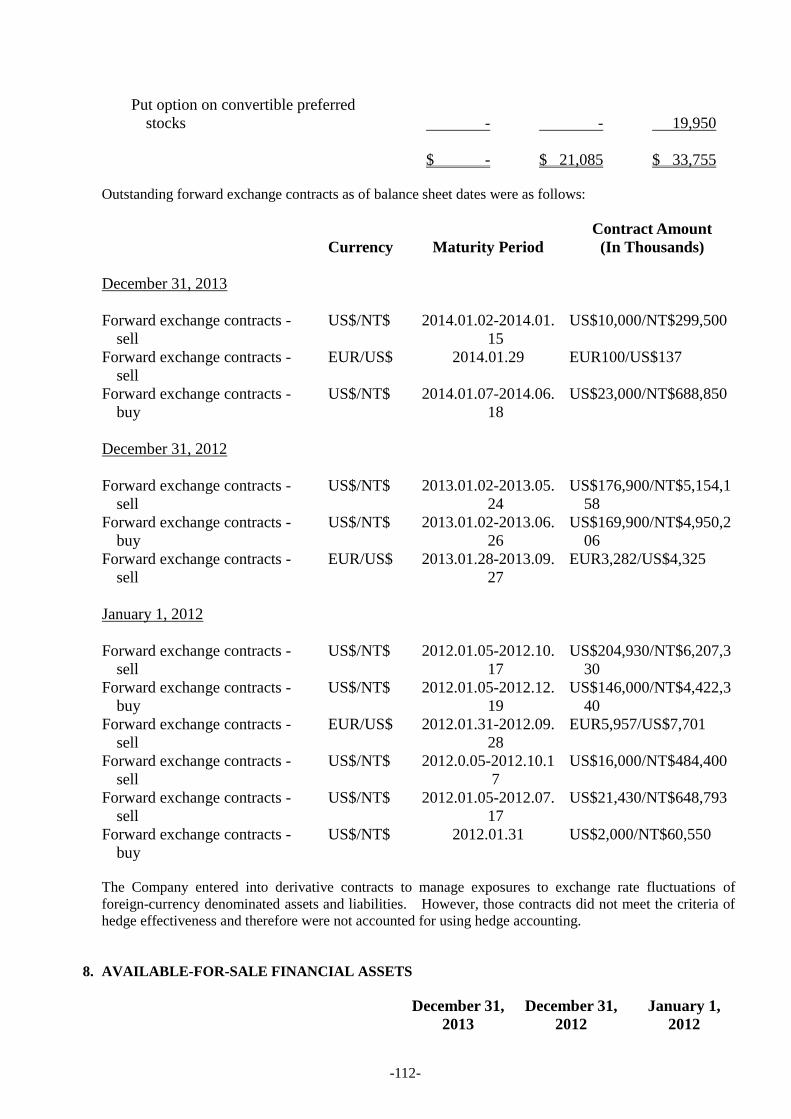
-112-
Put option on convertible preferred
stocks - - 19,950
$ - $ 21,085 $ 33,755
Outstanding forward exchange contracts as of balance sheet dates were as follows:
Contract Amount
Currency Maturity Period (In Thousands)
December 31, 2013
Forward exchange contracts -
sell
US$/NT$ 2014.01.02-2014.01.
15
US$10,000/NT$299,500
Forward exchange contracts -
sell
EUR/US$ 2014.01.29 EUR100/US$137
Forward exchange contracts -
buy
US$/NT$ 2014.01.07-2014.06.
18
US$23,000/NT$688,850
December 31, 2012
Forward exchange contracts -
sell
US$/NT$ 2013.01.02-2013.05.
24
US$176,900/NT$5,154,1
58
Forward exchange contracts -
buy
US$/NT$ 2013.01.02-2013.06.
26
US$169,900/NT$4,950,2
06
Forward exchange contracts -
sell
EUR/US$ 2013.01.28-2013.09.
27
EUR3,282/US$4,325
January 1, 2012
Forward exchange contracts -
sell
US$/NT$ 2012.01.05-2012.10.
17
US$204,930/NT$6,207,3
30
Forward exchange contracts -
buy
US$/NT$ 2012.01.05-2012.12.
19
US$146,000/NT$4,422,3
40
Forward exchange contracts -
sell
EUR/US$ 2012.01.31-2012.09.
28
EUR5,957/US$7,701
Forward exchange contracts -
sell
US$/NT$ 2012.0.05-2012.10.1
7
US$16,000/NT$484,400
Forward exchange contracts -
sell
US$/NT$ 2012.01.05-2012.07.
17
US$21,430/NT$648,793
Forward exchange contracts -
buy
US$/NT$ 2012.01.31 US$2,000/NT$60,550
The Company entered into derivative contracts to manage exposures to exchange rate fluctuations of
foreign-currency denominated assets and liabilities. However, those contracts did not meet the criteria of
hedge effectiveness and therefore were not accounted for using hedge accounting.
8. AVAILABLE-FOR-SALE FINANCIAL ASSETS
December 31,
2013
December 31,
2012
January 1,
2012
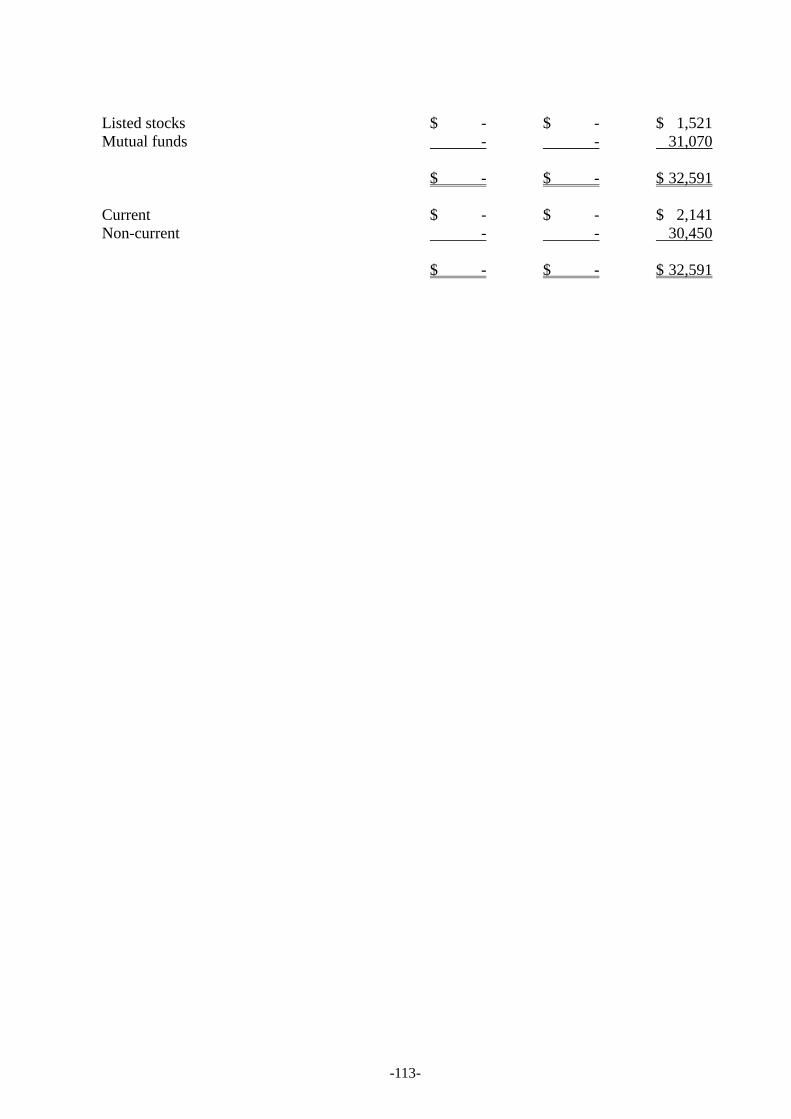
-113-
Listed stocks $ - $ - $ 1,521
Mutual funds - - 31,070
$ - $ - $ 32,591
Current $ - $ - $ 2,141
Non-current - - 30,450
$ - $ - $ 32,591

-114-
9. FINANCIAL ASSETS MEASURED AT COST
December 31,
2013
December 31,
2012
January 1,
2012
Domestic investments
Domestic unlisted common shares $ 43,902 $ 46,304 $ 48,657
Foreign investments
Overseas unlisted common shares 27,921 27,405 61,332
$ 71,823 $ 73,709 $ 109,989
Classified according to financial asset
measurement categories
Available-for-sale financial assets $ 71,823 $ 73,709 $ 109,989
Management believed that the above unlisted equity investments held by the Company, whose fair value
cannot be reliably measured due to the range of reasonable fair value estimates was so significant; therefore
they were measured at cost less impairment at the end of reporting period.
10. DEBT INVESTMENTS WITH NO ACTIVE MARKET
December 31,
2013
December 31,
2012
January 1,
2012
Current
Time deposits with original maturity more
than 3 months (Note 6) $ 166,123 $ - $ 2,000
Non-current
Subordinated bond of Ta Chong Bank $ 50,000 $ 50,000 $ 50,000
As of December 31, 2013, December 31, 2012 and January 1, 2012, time deposits with no active market of
$100,932 thousand, zero and zero were pledged as collaterals for borrowings (see Note 33).
11. NOTES AND TRADE RECEIVABLES
December 31,
2013
December 31,
2012
January 1,
2012
Non-related parties
Notes receivable $ 5,176 $ 5,207 $ 39,343
Less allowance for doubtful accounts - - -
5,176 5,207 39,343
Trade receivables 2,799,019 2,448,516 3,002,368
Less allowance for doubtful accounts (44,755) (40,238) (49,807)
2,754,264 2,408,278 2,952,561
$ 2,759,440 $ 2,413,485 $ 2,991,904

-115-
The average credit period of sales of goods was 90 days. In determining the recoverability of a trade
receivable, the Company considered any change in the credit quality of the trade receivable since the date
credit was initially granted to the end of the reporting period. Allowance for impairment loss is
recognized based on estimated irrecoverable amounts determined by reference to the aging of receivables,
historical experience of the counterparties and an analysis of their current financial position.
The aging of trade receivables (current and past due) was as follows:
December 31,
2013
December 31,
2012
January 1,
2012
Not overdue $ 2,347,396 $ 1,979,758 $ 2,679,949
Less than 30 days 155,356 243,262 228,448
31-60 days 24,514 117,255 22,576
More than 61 days 271,753 108,241 71,395
$ 2,799,019 $ 2,448,516 $ 3,002,368
Movements in the allowance for impairment loss recognized on notes receivable and trade receivables were
as follows:
For the Year Ended December
31
2013 2012
Balance at January 1 $ 40,238 $ 49,807
Add: Impairment losses recognized on receivables 4,501 3,174
Effect of exchange rate changes 16 (12,743)
Balance at December 31 $ 44,755 $ 40,238
The trade receivables factoring was summarized as follows:
(Unit: US$ in Dollars; NT$ in Thousands)
Counterparties
Balance at
Beginning of
Year
Factoring
During the
Year
Amounts
Collected
During the
Year
Balance at
End of Year
(Note 1)
Balance at End
of Year of
Advances
Received
Interest Rates
on Advances
Received (%)
Retention for
Factoring Credit Line Collateral
2013
E.SUN Bank $ - $ 617
(Note 3)
$ 617
(Note 4)
$ - $ - - $ - - -
2012
Taishin
International
Bank
$ 22,507
(Note 2)
$ 46,524
(Note 3)
$ 55,389
(Note 4)
$ -
$ -
- $ -
US$6,200,000 US$ 620,000
Taipei Fubon
Bank
$ 356,819
(Note 5)
$ 1,605,193
(Note 6)
$ 1,962,012
(Note 7)
$ -
$ -
- $ -
- -
Note 1: Balance at end of year of factored receivables had been derecognized as trade receivables.
Note 2: US$772,475.
Note 3: US$20,602; US$1,128,587.
Note 4: US$20,602; US$1,901,062.
Note 5: US$12,246,670.
Note 6: US$55,093,105.
Note 7: US$67,339,775.
The above credit lines may be used on a revolving basis.

-116-
12. INVENTORIES
December 31,
2013
December 31,
2012
January 1,
2012
Merchandise - retail $ 3,465,040 $ 3,351,533 $ 3,606,406
Merchandise - trade 1,367,664 1,362,443 1,589,063
Raw materials - - 389,106
Work-in-process - - 144,882
Finished goods - - 74,414
Merchandise - manufacturing - - 59,004
Construction in progress 321,562 126,911 65,594
$ 5,154,266 $ 4,840,887 $ 5,928,469
The cost of inventories recognized as cost of goods sold for the years ended December 31, 2013 and 2012
was $22,369,054 thousand and $22,703,295 thousand, respectively.
The operating cost included inventory devaluation in the amount of $16,975 thousand and loss on physical
inventory count in the amount of $922 thousand for the year ended December 31, 2013; the operating cost
included reversal of inventory devaluation in the amount of $9,972 thousand and loss on physical inventory
count in the amount of $57,211 thousand for the year ended December 31, 2012.
Merchandise - retail is the inventories of TR Retailing and Test-Rite Retail.
Merchandise - trade is the inventories of Test-Rite, TR Trading, TR Canada, TR Development, Test-Rite
Int‘l (U.S.), Test Cin M&E Engineering and Chung Cin Enterprise.
Construction in progress is the inventories of Chung Cin Enterprise, Tony Construction, Test Cin M&E
Engineering, Chung Cin Interior Design Construction.
13. INVESTMENTS ACCOUNTED FOR USING EQUITY METHOD
Investments in Associates
December 31,
2013
December 31,
2012
January 1,
2012
Unlisted companies
TR Mexico $ - $ - $ 1
At the end of the reporting period, the proportion of ownership and voting rights in associates held by the
Company were as follows:
Name of Associate December 31,
2013
December 31,
2012
January 1,
2012
TR Mexico - - 49%
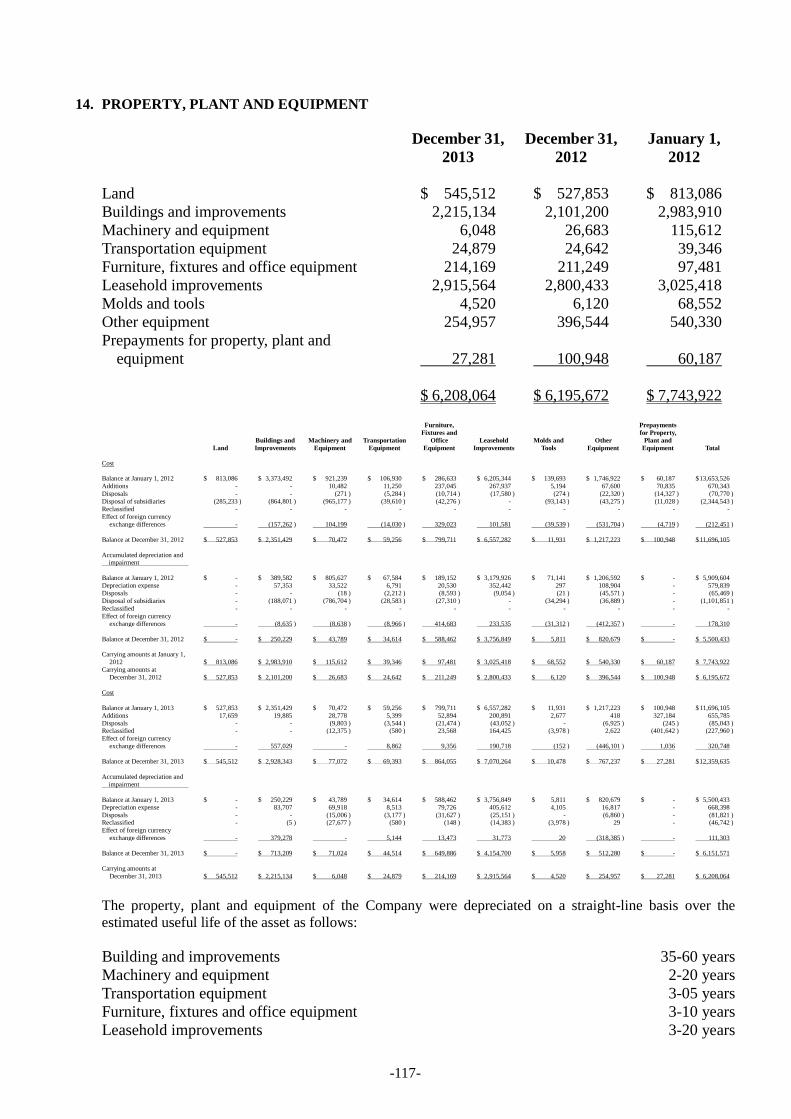
-117-
14. PROPERTY, PLANT AND EQUIPMENT
December 31,
2013
December 31,
2012
January 1,
2012
Land $ 545,512 $ 527,853 $ 813,086
Buildings and improvements 2,215,134 2,101,200 2,983,910
Machinery and equipment 6,048 26,683 115,612
Transportation equipment 24,879 24,642 39,346
Furniture, fixtures and office equipment 214,169 211,249 97,481
Leasehold improvements 2,915,564 2,800,433 3,025,418
Molds and tools 4,520 6,120 68,552
Other equipment 254,957 396,544 540,330
Prepayments for property, plant and
equipment 27,281 100,948 60,187
$ 6,208,064 $ 6,195,672 $ 7,743,922
Land
Buildings and
Improvements
Machinery and
Equipment
Transportation
Equipment
Furniture,
Fixtures and
Office
Equipment
Leasehold
Improvements
Molds and
Tools
Other
Equipment
Prepayments
for Property,
Plant and
Equipment Total
Cost
Balance at January 1, 2012 $ 813,086 $ 3,373,492 $ 921,239 $ 106,930 $ 286,633 $ 6,205,344 $ 139,693 $ 1,746,922 $ 60,187 $ 13,653,526
Additions - - 10,482 11,250 237,045 267,937 5,194 67,600 70,835 670,343
Disposals - - (271 ) (5,284 ) (10,714 ) (17,580 ) (274 ) (22,320 ) (14,327 ) (70,770 )
Disposal of subsidiaries (285,233 ) (864,801 ) (965,177 ) (39,610 ) (42,276 ) - (93,143 ) (43,275 ) (11,028 ) (2,344,543 )
Reclassified - - - - - - - - - -
Effect of foreign currency
exchange differences - (157,262 ) 104,199 (14,030 ) 329,023 101,581 (39,539 ) (531,704 ) (4,719 ) (212,451 )
Balance at December 31, 2012 $ 527,853 $ 2,351,429 $ 70,472 $ 59,256 $ 799,711 $ 6,557,282 $ 11,931 $ 1,217,223 $ 100,948 $ 11,696,105
Accumulated depreciation and impairment
Balance at January 1, 2012 $ - $ 389,582 $ 805,627 $ 67,584 $ 189,152 $ 3,179,926 $ 71,141 $ 1,206,592 $ - $ 5,909,604
Depreciation expense - 57,353 33,522 6,791 20,530 352,442 297 108,904 - 579,839
Disposals - - (18 ) (2,212 ) (8,593 ) (9,054 ) (21 ) (45,571 ) - (65,469 )
Disposal of subsidiaries - (188,071 ) (786,704 ) (28,583 ) (27,310 ) - (34,294 ) (36,889 ) - (1,101,851 )
Reclassified - - - - - - - - - -
Effect of foreign currency
exchange differences - (8,635 ) (8,638 ) (8,966 ) 414,683 233,535 (31,312 ) (412,357 ) - 178,310
Balance at December 31, 2012 $ - $ 250,229 $ 43,789 $ 34,614 $ 588,462 $ 3,756,849 $ 5,811 $ 820,679 $ - $ 5,500,433
Carrying amounts at January 1,
2012 $ 813,086 $ 2,983,910 $ 115,612 $ 39,346 $ 97,481 $ 3,025,418 $ 68,552 $ 540,330 $ 60,187 $ 7,743,922
Carrying amounts at
December 31, 2012 $ 527,853 $ 2,101,200 $ 26,683 $ 24,642 $ 211,249 $ 2,800,433 $ 6,120 $ 396,544 $ 100,948 $ 6,195,672
Cost
Balance at January 1, 2013 $ 527,853 $ 2,351,429 $ 70,472 $ 59,256 $ 799,711 $ 6,557,282 $ 11,931 $ 1,217,223 $ 100,948 $ 11,696,105
Additions 17,659 19,885 28,778 5,399 52,894 200,891 2,677 418 327,184 655,785
Disposals - - (9,803 ) (3,544 ) (21,474 ) (43,052 ) - (6,925 ) (245 ) (85,043 ) Reclassified - - (12,375 ) (580 ) 23,568 164,425 (3,978 ) 2,622 (401,642 ) (227,960 )
Effect of foreign currency
exchange differences - 557,029 - 8,862 9,356 190,718 (152 ) (446,101 ) 1,036 320,748
Balance at December 31, 2013 $ 545,512 $ 2,928,343 $ 77,072 $ 69,393 $ 864,055 $ 7,070,264 $ 10,478 $ 767,237 $ 27,281 $ 12,359,635
Accumulated depreciation and
impairment
Balance at January 1, 2013 $ - $ 250,229 $ 43,789 $ 34,614 $ 588,462 $ 3,756,849 $ 5,811 $ 820,679 $ - $ 5,500,433
Depreciation expense - 83,707 69,918 8,513 79,726 405,612 4,105 16,817 - 668,398
Disposals - - (15,006 ) (3,177 ) (31,627 ) (25,151 ) - (6,860 ) - (81,821 ) Reclassified - (5 ) (27,677 ) (580 ) (148 ) (14,383 ) (3,978 ) 29 - (46,742 )
Effect of foreign currency
exchange differences - 379,278 - 5,144 13,473 31,773 20 (318,385 ) - 111,303
Balance at December 31, 2013 $ - $ 713,209 $ 71,024 $ 44,514 $ 649,886 $ 4,154,700 $ 5,958 $ 512,280 $ - $ 6,151,571
Carrying amounts at
December 31, 2013 $ 545,512 $ 2,215,134 $ 6,048 $ 24,879 $ 214,169 $ 2,915,564 $ 4,520 $ 254,957 $ 27,281 $ 6,208,064
The property, plant and equipment of the Company were depreciated on a straight-line basis over the
estimated useful life of the asset as follows:
Building and improvements 35-60 years
Machinery and equipment 2-20 years
Transportation equipment 3-05 years
Furniture, fixtures and office equipment 3-10 years
Leasehold improvements 3-20 years
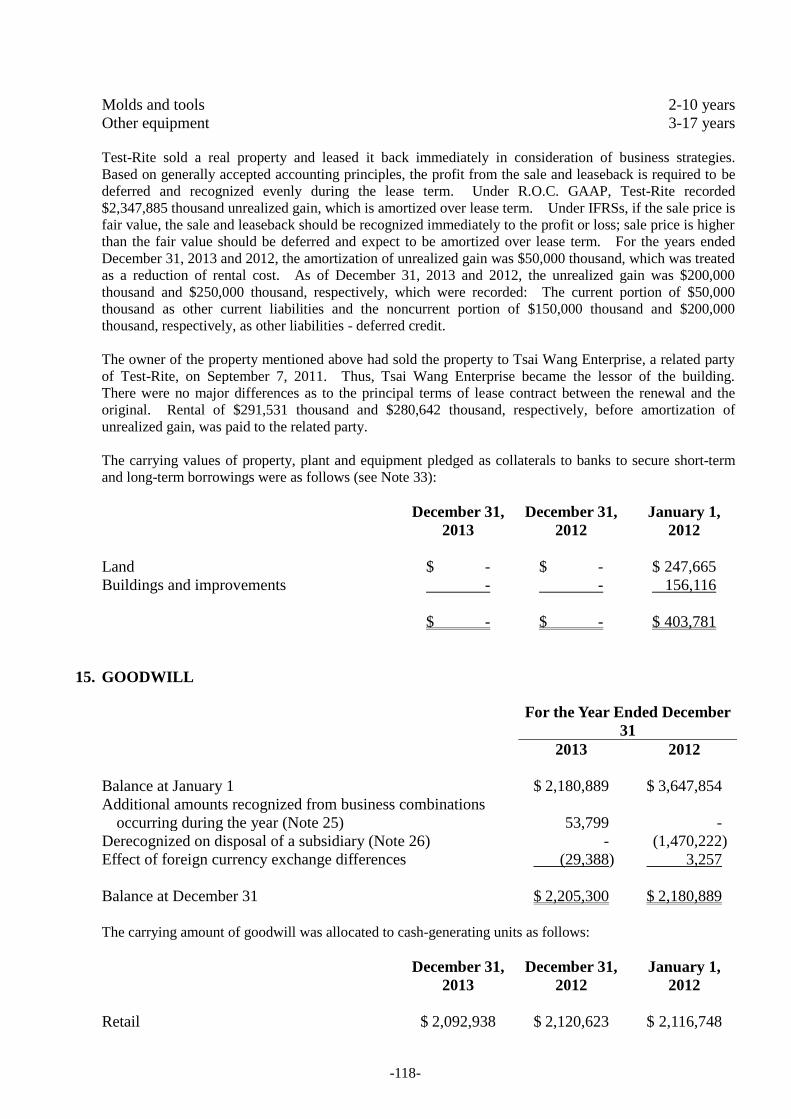
-118-
Molds and tools 2-10 years
Other equipment 3-17 years
Test-Rite sold a real property and leased it back immediately in consideration of business strategies.
Based on generally accepted accounting principles, the profit from the sale and leaseback is required to be
deferred and recognized evenly during the lease term. Under R.O.C. GAAP, Test-Rite recorded
$2,347,885 thousand unrealized gain, which is amortized over lease term. Under IFRSs, if the sale price is
fair value, the sale and leaseback should be recognized immediately to the profit or loss; sale price is higher
than the fair value should be deferred and expect to be amortized over lease term. For the years ended
December 31, 2013 and 2012, the amortization of unrealized gain was $50,000 thousand, which was treated
as a reduction of rental cost. As of December 31, 2013 and 2012, the unrealized gain was $200,000
thousand and $250,000 thousand, respectively, which were recorded: The current portion of $50,000
thousand as other current liabilities and the noncurrent portion of $150,000 thousand and $200,000
thousand, respectively, as other liabilities - deferred credit.
The owner of the property mentioned above had sold the property to Tsai Wang Enterprise, a related party
of Test-Rite, on September 7, 2011. Thus, Tsai Wang Enterprise became the lessor of the building.
There were no major differences as to the principal terms of lease contract between the renewal and the
original. Rental of $291,531 thousand and $280,642 thousand, respectively, before amortization of
unrealized gain, was paid to the related party.
The carrying values of property, plant and equipment pledged as collaterals to banks to secure short-term
and long-term borrowings were as follows (see Note 33):
December 31,
2013
December 31,
2012
January 1,
2012
Land $ - $ - $ 247,665
Buildings and improvements - - 156,116
$ - $ - $ 403,781
15. GOODWILL
For the Year Ended December
31
2013 2012
Balance at January 1 $ 2,180,889 $ 3,647,854
Additional amounts recognized from business combinations
occurring during the year (Note 25) 53,799 -
Derecognized on disposal of a subsidiary (Note 26) - (1,470,222)
Effect of foreign currency exchange differences (29,388) 3,257
Balance at December 31 $ 2,205,300 $ 2,180,889
The carrying amount of goodwill was allocated to cash-generating units as follows:
December 31,
2013
December 31,
2012
January 1,
2012
Retail $ 2,092,938 $ 2,120,623 $ 2,116,748
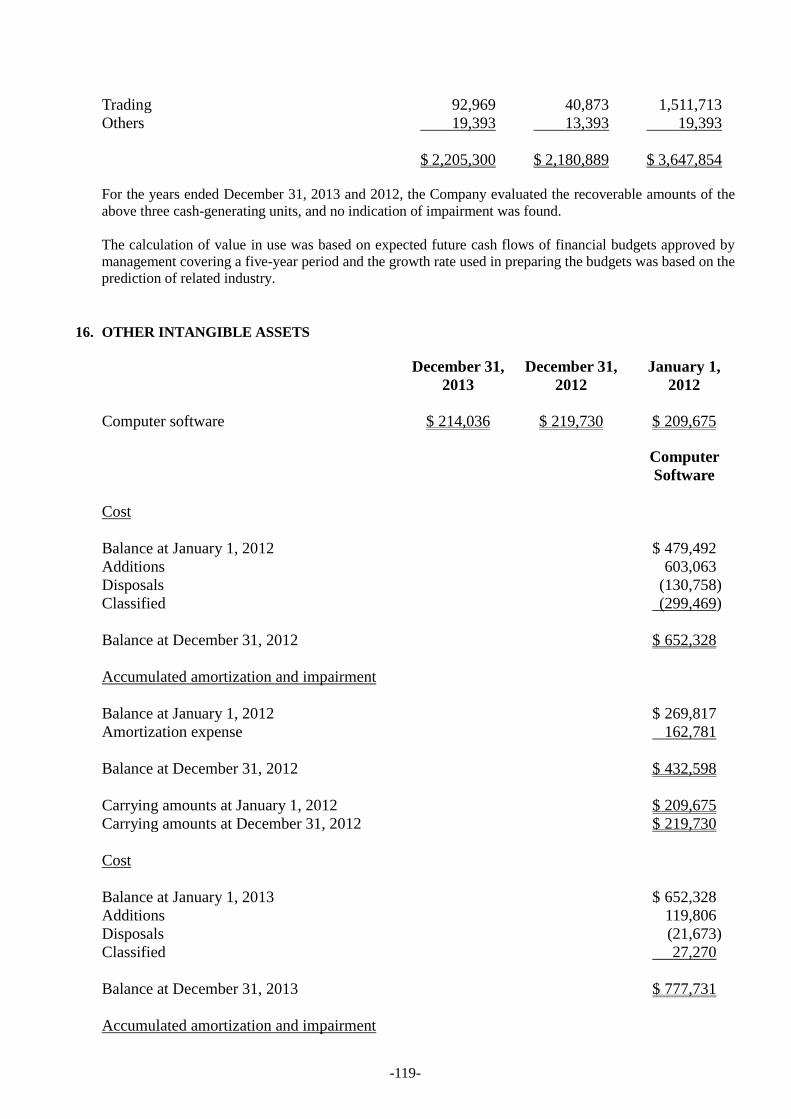
-119-
Trading 92,969 40,873 1,511,713
Others 19,393 13,393 19,393
$ 2,205,300 $ 2,180,889 $ 3,647,854
For the years ended December 31, 2013 and 2012, the Company evaluated the recoverable amounts of the
above three cash-generating units, and no indication of impairment was found.
The calculation of value in use was based on expected future cash flows of financial budgets approved by
management covering a five-year period and the growth rate used in preparing the budgets was based on the
prediction of related industry.
16. OTHER INTANGIBLE ASSETS
December 31,
2013
December 31,
2012
January 1,
2012
Computer software $ 214,036 $ 219,730 $ 209,675
Computer
Software
Cost
Balance at January 1, 2012 $ 479,492
Additions 603,063
Disposals (130,758)
Classified (299,469)
Balance at December 31, 2012 $ 652,328
Accumulated amortization and impairment
Balance at January 1, 2012 $ 269,817
Amortization expense 162,781
Balance at December 31, 2012 $ 432,598
Carrying amounts at January 1, 2012 $ 209,675
Carrying amounts at December 31, 2012 $ 219,730
Cost
Balance at January 1, 2013 $ 652,328
Additions 119,806
Disposals (21,673)
Classified 27,270
Balance at December 31, 2013 $ 777,731
Accumulated amortization and impairment
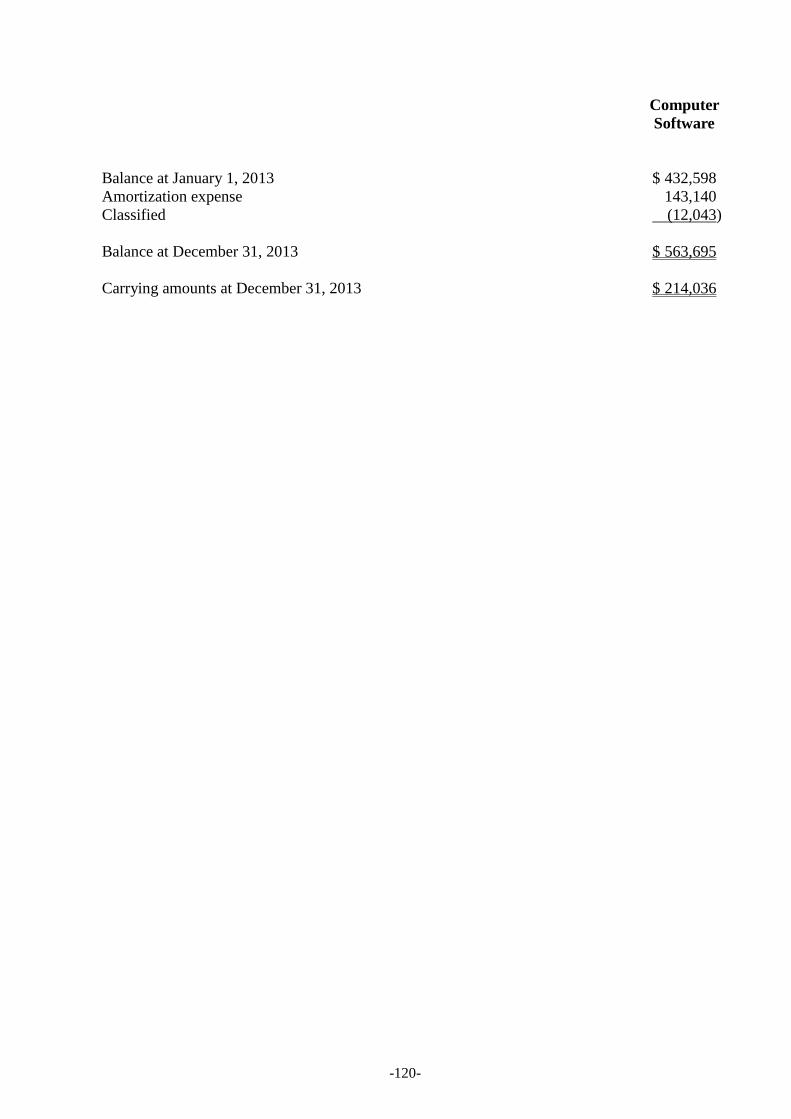
-120-
Computer
Software
Balance at January 1, 2013 $ 432,598
Amortization expense 143,140
Classified (12,043)
Balance at December 31, 2013 $ 563,695
Carrying amounts at December 31, 2013 $ 214,036

-121-
17. BORROWINGS
December 31,
2013
December 31,
2012
January 1,
2012
Short-term borrowings $ 2,256,663 $ 1,764,129 $ 3,397,071
Short-term bills payable $ 9,997 $ - $ 159,842
Current portion of long-term borrowings $ 300,000 $ 200,000 $ -
Long-term borrowings $ 5,227,615 $ 5,013,197 $ 7,150,590
a. Short-term borrowings as of December 31, 2013, December 31, 2012 and January 1, 2012 were as
follows:
December 31, 2013 December 31, 2012 January 1, 2012
Interest Rate
% Amount Interest Rate
% Amount Interest Rate
% Amount
Secured borrowings 0.88%-6.60% $ 2,256,663 1.11%-6.60% $ 1,764,129 0.75%-7.216% $ 3,291,316
Unsecured borrowings - - - - 6.405% 105,755
$ 2,256,663 $ 1,764,129 $ 3,397,071
b. Short-term bills payable
December 31,
2013
December 31,
2012
January 1,
2012
Commercial paper $ 10,000 $ - $ 160,000
Less: Unamortized discount on bills
payable
(3) - (158)
$ 9,997 $ - $ 159,842
c. Long-term borrowings
December 31, 2013
December
31, 2012
January 1,
2012
Interest
Rate Amount Amount Amount
First Commercial Bank‘s
Syndicate Loan
Unsecured loan from June 24,
2011 to June 24, 2016. The
authorized credit line of
$2,000 million. Interest is
paid monthly. The principal
due in 7 semi-annual
installments with first
installment due on June 24,
2013.
1.6284% $ 1,800,000 $ 2,000,000 $ 2,000,000
Unsecured loan from
September 24, 2013 to June
24, 2016. The authorized
credit line of $4,000 million.
1.5947% 300,000 - -
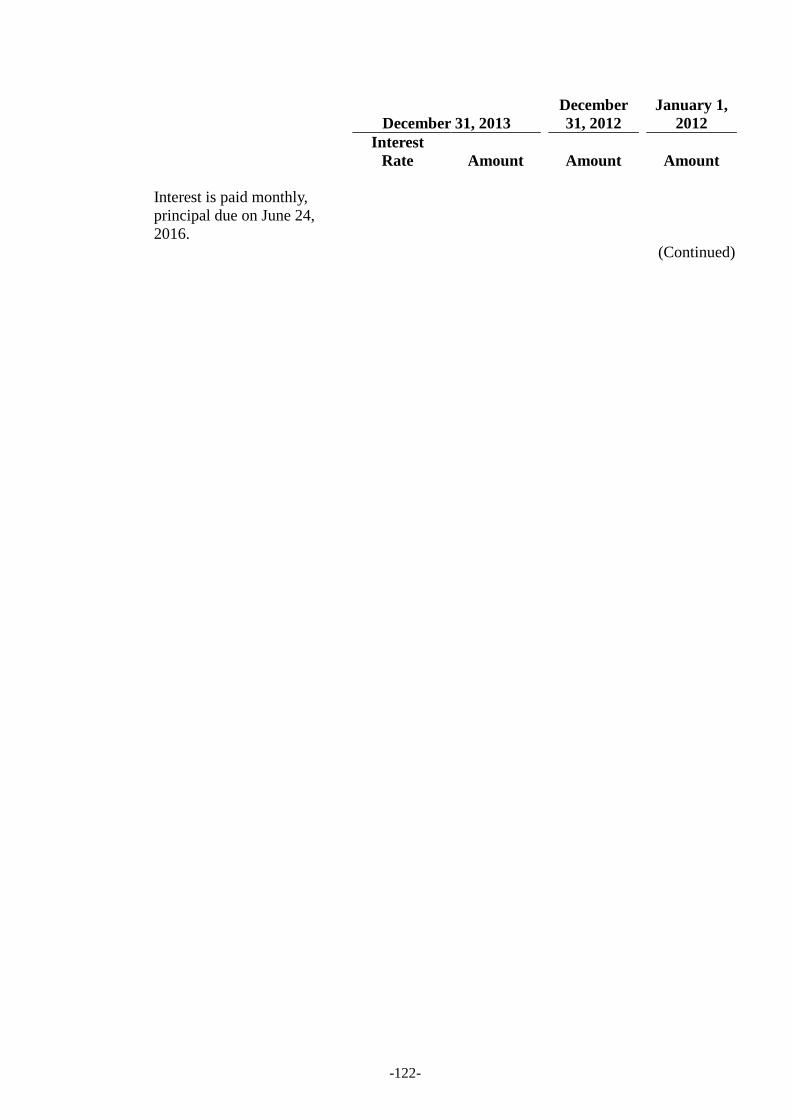
-122-
December 31, 2013
December
31, 2012
January 1,
2012
Interest
Rate Amount Amount Amount
Interest is paid monthly,
principal due on June 24,
2016.
(Continued)
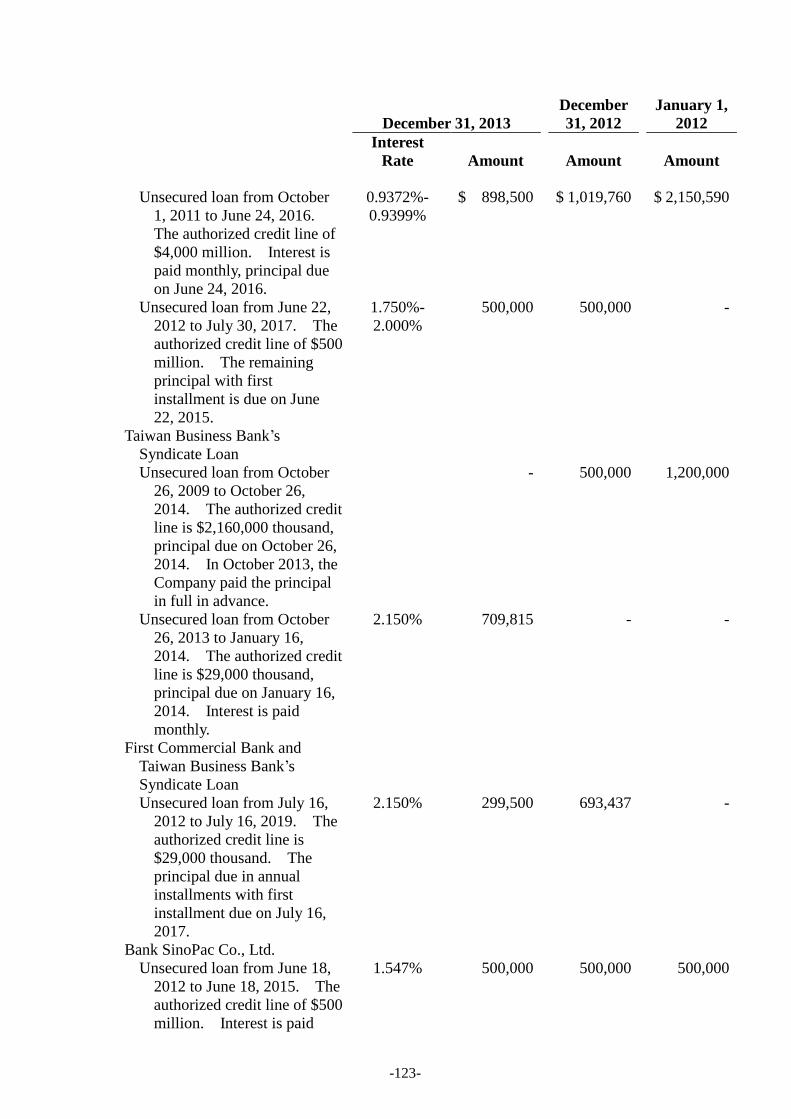
-123-
December 31, 2013
December
31, 2012
January 1,
2012
Interest
Rate Amount Amount Amount
Unsecured loan from October
1, 2011 to June 24, 2016.
The authorized credit line of
$4,000 million. Interest is
paid monthly, principal due
on June 24, 2016.
0.9372%-
0.9399%
$ 898,500 $ 1,019,760 $ 2,150,590
Unsecured loan from June 22,
2012 to July 30, 2017. The
authorized credit line of $500
million. The remaining
principal with first
installment is due on June
22, 2015.
1.750%-
2.000%
500,000 500,000 -
Taiwan Business Bank‘s
Syndicate Loan
Unsecured loan from October
26, 2009 to October 26,
2014. The authorized credit
line is $2,160,000 thousand,
principal due on October 26,
2014. In October 2013, the
Company paid the principal
in full in advance.
- 500,000 1,200,000
Unsecured loan from October
26, 2013 to January 16,
2014. The authorized credit
line is $29,000 thousand,
principal due on January 16,
2014. Interest is paid
monthly.
2.150% 709,815 - -
First Commercial Bank and
Taiwan Business Bank‘s
Syndicate Loan
Unsecured loan from July 16,
2012 to July 16, 2019. The
authorized credit line is
$29,000 thousand. The
principal due in annual
installments with first
installment due on July 16,
2017.
2.150% 299,500 693,437 -
Bank SinoPac Co., Ltd.
Unsecured loan from June 18,
2012 to June 18, 2015. The
authorized credit line of $500
million. Interest is paid
1.547% 500,000 500,000 500,000

-124-
December 31, 2013
December
31, 2012
January 1,
2012
Interest
Rate Amount Amount Amount
monthly, principal due on
June 18, 2015.
(Continued)
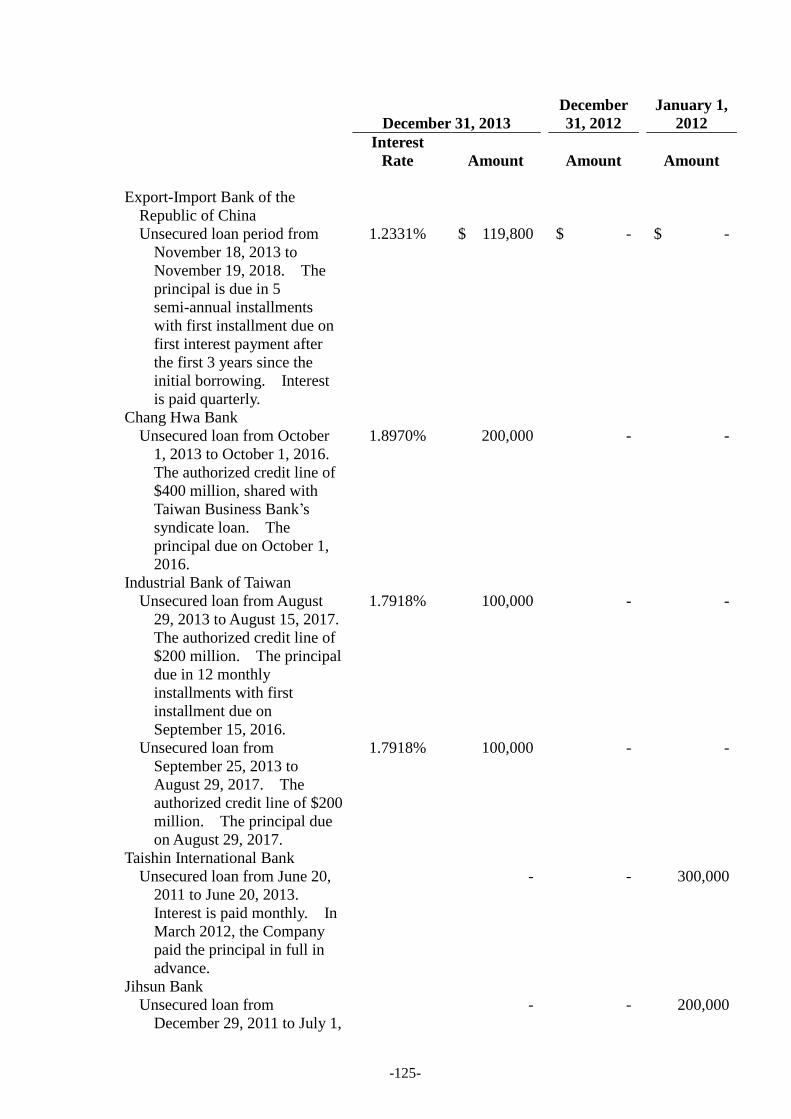
-125-
December 31, 2013
December
31, 2012
January 1,
2012
Interest
Rate Amount Amount Amount
Export-Import Bank of the
Republic of China
Unsecured loan period from
November 18, 2013 to
November 19, 2018. The
principal is due in 5
semi-annual installments
with first installment due on
first interest payment after
the first 3 years since the
initial borrowing. Interest
is paid quarterly.
1.2331% $ 119,800 $ - $ -
Chang Hwa Bank
Unsecured loan from October
1, 2013 to October 1, 2016.
The authorized credit line of
$400 million, shared with
Taiwan Business Bank‘s
syndicate loan. The
principal due on October 1,
2016.
1.8970% 200,000 - -
Industrial Bank of Taiwan
Unsecured loan from August
29, 2013 to August 15, 2017.
The authorized credit line of
$200 million. The principal
due in 12 monthly
installments with first
installment due on
September 15, 2016.
1.7918% 100,000 - -
Unsecured loan from
September 25, 2013 to
August 29, 2017. The
authorized credit line of $200
million. The principal due
on August 29, 2017.
1.7918% 100,000 - -
Taishin International Bank
Unsecured loan from June 20,
2011 to June 20, 2013.
Interest is paid monthly. In
March 2012, the Company
paid the principal in full in
advance.
- - 300,000
Jihsun Bank
Unsecured loan from
December 29, 2011 to July 1,
- - 200,000

-126-
December 31, 2013
December
31, 2012
January 1,
2012
Interest
Rate Amount Amount Amount
2013. In January 2012, the
Company paid the principal
in full in advance.
(Continued)

-127-
December 31, 2013
December
31, 2012
January 1,
2012
Interest
Rate Amount Amount Amount
Taiwan Business Bank
Unsecured loan from
November 22, 2010 to
November 22, 2015.
Principal is paid in 12
quarterly payments starting
from February 15, 2013.
Interest is paid monthly. In
March 2012, the Company
paid the principal in full in
advance.
$ - $ - $ 500,000
Shanghai Commercial & Savings
Bank
Unsecured loan from
November 22, 2010 to
November 22, 2014.
Principal is paid in 8
quarterly payments starting
from February 21, 2013.
Interest is paid monthly. In
March 2012, the Company
paid the principal in full in
advance.
- - 300,000
Less current portion (300,000) (200,000) -
$ 5,227,615 $ 5,013,197 $ 7,150,590
(Concluded)
1) Test-Rite promised to maintain the following financial covenants according to the loan agreements:
a) First Commercial Bank Syndicated Loan
i. Total Liabilities Ratio, Test-Rite shall maintain a ratio of Total Liabilities to Total Assets of
not more than 2 to 1.
ii. Current Ratio, Test-Rite shall maintain a ratio of Current Assets to Current Liabilities of not
less than 1 to 1.
iii. EBITDA Ratio, Test-Rite shall maintain a ratio of EBITDA to interest expense of greater
than 2.5 to 1.
iv. Minimum Tangible Net Worth, Test-Rite shall maintain Tangible Net Worth of not less than
$5,200,000 thousand.
v. The calculations of the ratios are based on Test-Rite financial statements for the year ended
December 31.
b) First Commercial Bank and Taiwan Business Bank‘s Syndicated Loan
-128-
i. Total Liabilities Ratio, Test-Rite shall maintain a ratio of Total Liabilities to Total Assets of
not more than 2 to 1.
ii. Current Ratio, Test-Rite shall maintain a ratio of Current Assets to Current Liabilities of not
less than 1 to 1.
iii. EBITDA Ratio, Test-Rite shall maintain a ratio of EBITDA to interest expense of greater
than 2.5 to 1.
iv. Minimum Tangible Net Worth, Test-Rite shall maintain Tangible Net Worth of not less than
$5,200,000 thousand.
v. The calculations of the ratios are based on Test-Rite financial statements for the year ended
December 31.
c) Bank SinoPac Co., Ltd.
i. Total Liabilities Ratio, Test-Rite shall maintain a ratio of Total Liabilities to Total Assets of
not more than 2 to 1. (Total liabilities should exclude other current liabilities and other
liabilities - deferred credit that resulted from sale-leaseback.)
ii. Current Ratio, Test-Rite shall maintain a ratio of Current Assets to Current Liabilities of not
less than 1 to 1.
iii. EBITDA Ratio, Test-Rite shall maintain a ratio of EBITDA to interest expense of greater
than 2.5 to 1.
iv. Minimum Tangible Net Worth, Test-Rite shall maintain Tangible Net Worth of not less than
$5,200,000 thousand.
v. The calculations of the ratios are based on Test-Rite financial statements for the year ended
December 31.
2) According to the loan agreement, Test-Rite Retail promised to maintain certain financial covenants
as follows:
a) Total Liabilities Ratio, Test-Rite shall maintain a ratio of Bank Loans and Bills Payable to
Tangible Assets of not more than 2 to 1.
b) Current Ratio, Test-Rite shall maintain a ratio of Current Assets to Short-Term Bank Loans and
Short-Term Bills Payable of not less than 1 to 1.
c) EBITDA Ratio, Test-Rite shall maintain a ratio of EBITDA to interest expense of greater than 3
to 1.
d) The calculations of the ratios are based on Test-Rite Retail financial statements for the year
ended December 31.
18. PROVISIONS
December 31,
2013
December 31,
2012
January 1,
2012
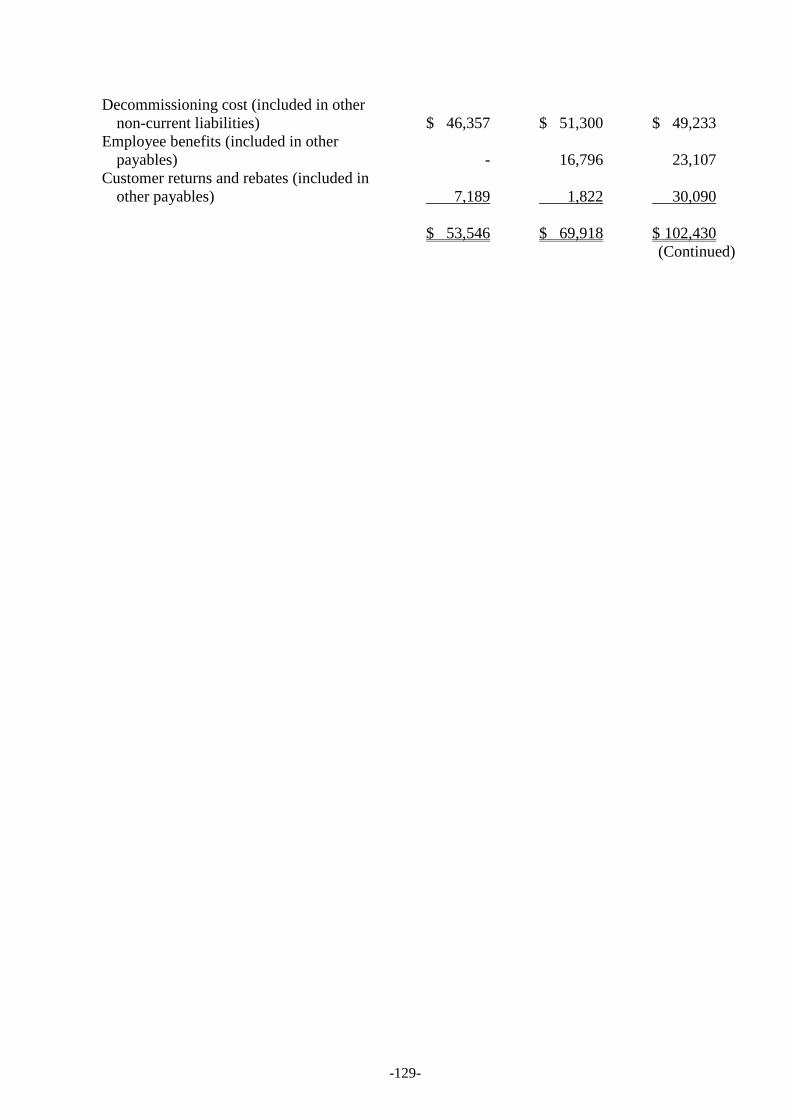
-129-
Decommissioning cost (included in other
non-current liabilities) $ 46,357 $ 51,300 $ 49,233
Employee benefits (included in other
payables) - 16,796 23,107
Customer returns and rebates (included in
other payables) 7,189 1,822 30,090
$ 53,546 $ 69,918 $ 102,430
(Continued)
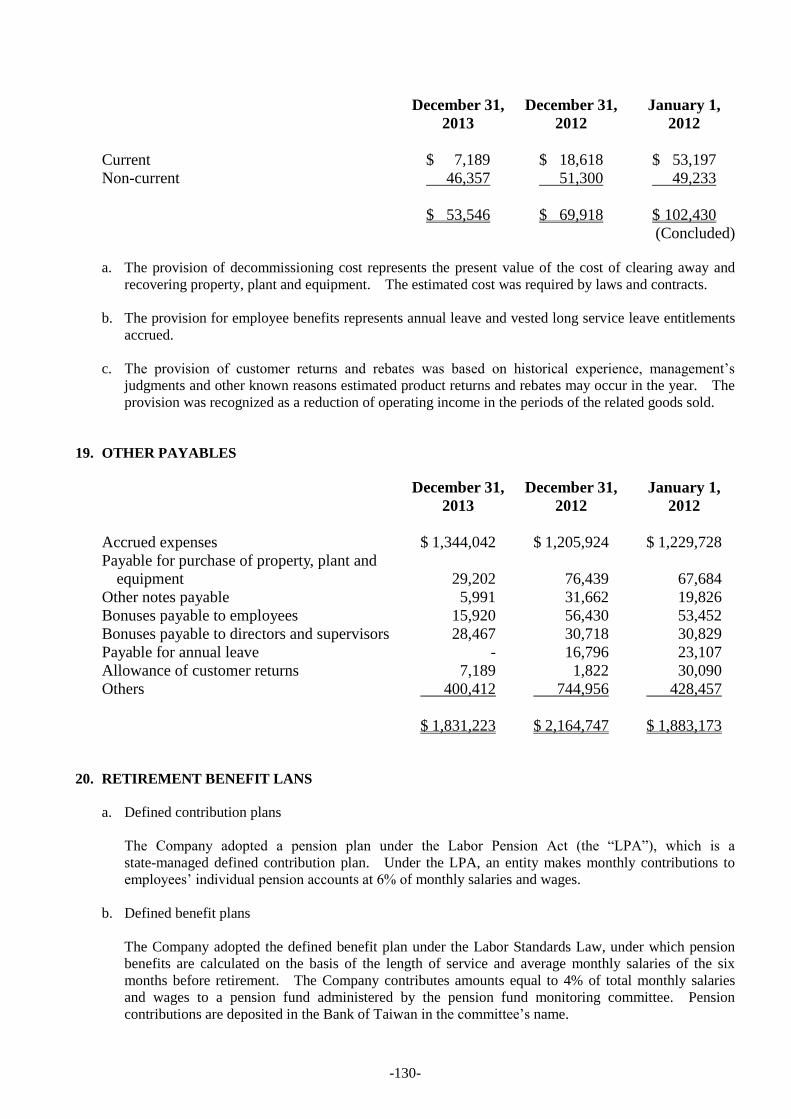
-130-
December 31,
2013
December 31,
2012
January 1,
2012
Current $ 7,189 $ 18,618 $ 53,197
Non-current 46,357 51,300 49,233
$ 53,546 $ 69,918 $ 102,430
(Concluded)
a. The provision of decommissioning cost represents the present value of the cost of clearing away and
recovering property, plant and equipment. The estimated cost was required by laws and contracts.
b. The provision for employee benefits represents annual leave and vested long service leave entitlements
accrued.
c. The provision of customer returns and rebates was based on historical experience, management‘s
judgments and other known reasons estimated product returns and rebates may occur in the year. The
provision was recognized as a reduction of operating income in the periods of the related goods sold.
19. OTHER PAYABLES
December 31,
2013
December 31,
2012
January 1,
2012
Accrued expenses $ 1,344,042 $ 1,205,924 $ 1,229,728
Payable for purchase of property, plant and
equipment 29,202 76,439 67,684
Other notes payable 5,991 31,662 19,826
Bonuses payable to employees 15,920 56,430 53,452
Bonuses payable to directors and supervisors 28,467 30,718 30,829
Payable for annual leave - 16,796 23,107
Allowance of customer returns 7,189 1,822 30,090
Others 400,412 744,956 428,457
$ 1,831,223 $ 2,164,747 $ 1,883,173
20. RETIREMENT BENEFIT LANS
a. Defined contribution plans
The Company adopted a pension plan under the Labor Pension Act (the ―LPA‖), which is a
state-managed defined contribution plan. Under the LPA, an entity makes monthly contributions to
employees‘ individual pension accounts at 6% of monthly salaries and wages.
b. Defined benefit plans
The Company adopted the defined benefit plan under the Labor Standards Law, under which pension
benefits are calculated on the basis of the length of service and average monthly salaries of the six
months before retirement. The Company contributes amounts equal to 4% of total monthly salaries
and wages to a pension fund administered by the pension fund monitoring committee. Pension
contributions are deposited in the Bank of Taiwan in the committee‘s name.
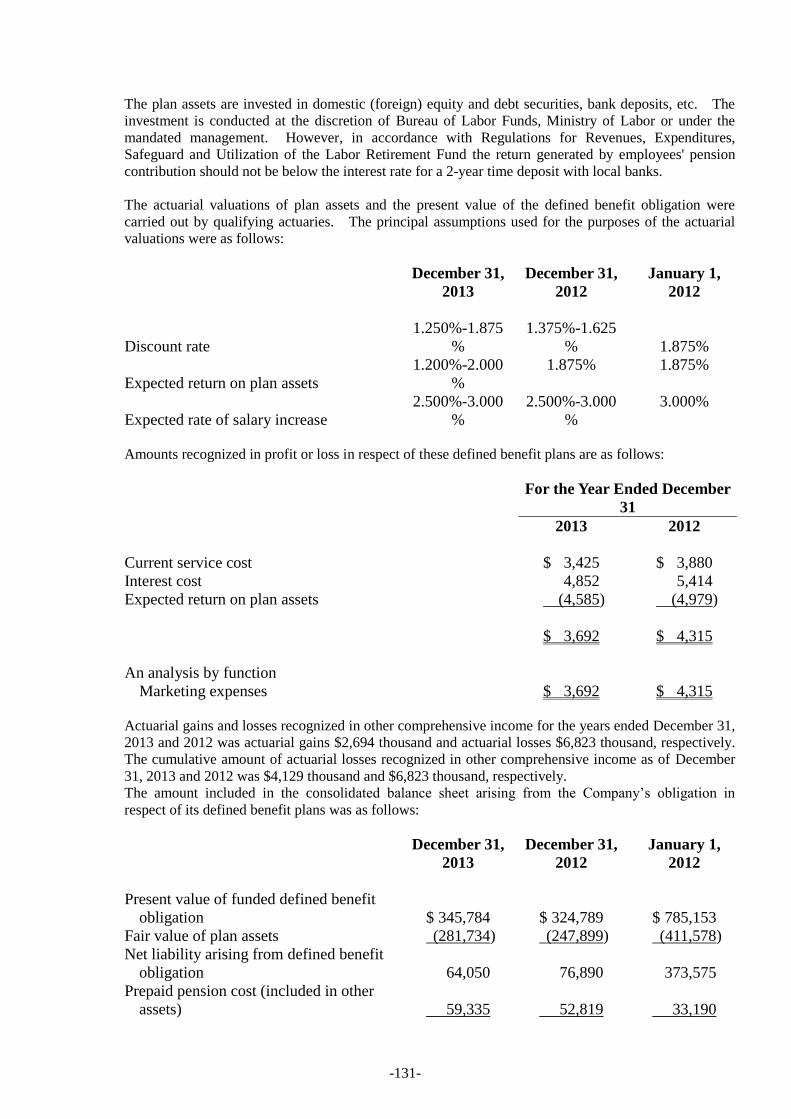
-131-
The plan assets are invested in domestic (foreign) equity and debt securities, bank deposits, etc. The
investment is conducted at the discretion of Bureau of Labor Funds, Ministry of Labor or under the
mandated management. However, in accordance with Regulations for Revenues, Expenditures,
Safeguard and Utilization of the Labor Retirement Fund the return generated by employees' pension
contribution should not be below the interest rate for a 2-year time deposit with local banks.
The actuarial valuations of plan assets and the present value of the defined benefit obligation were
carried out by qualifying actuaries. The principal assumptions used for the purposes of the actuarial
valuations were as follows:
December 31,
2013
December 31,
2012
January 1,
2012
Discount rate
1.250%-1.875
%
1.375%-1.625
%
1.875%
Expected return on plan assets
1.200%-2.000
%
1.875% 1.875%
Expected rate of salary increase
2.500%-3.000
%
2.500%-3.000
%
3.000%
Amounts recognized in profit or loss in respect of these defined benefit plans are as follows:
For the Year Ended December
31
2013 2012
Current service cost $ 3,425 $ 3,880
Interest cost 4,852 5,414
Expected return on plan assets (4,585) (4,979)
$ 3,692 $ 4,315
An analysis by function
Marketing expenses $ 3,692 $ 4,315
Actuarial gains and losses recognized in other comprehensive income for the years ended December 31,
2013 and 2012 was actuarial gains $2,694 thousand and actuarial losses $6,823 thousand, respectively.
The cumulative amount of actuarial losses recognized in other comprehensive income as of December
31, 2013 and 2012 was $4,129 thousand and $6,823 thousand, respectively.
The amount included in the consolidated balance sheet arising from the Company‘s obligation in
respect of its defined benefit plans was as follows:
December 31,
2013
December 31,
2012
January 1,
2012
Present value of funded defined benefit
obligation $ 345,784 $ 324,789 $ 785,153
Fair value of plan assets (281,734) (247,899) (411,578)
Net liability arising from defined benefit
obligation 64,050 76,890 373,575
Prepaid pension cost (included in other
assets) 59,335 52,819 33,190

-132-
Liability arising from defined benefit
obligation (included in other liabilities) $ 123,385 $ 129,709 $ 406,765
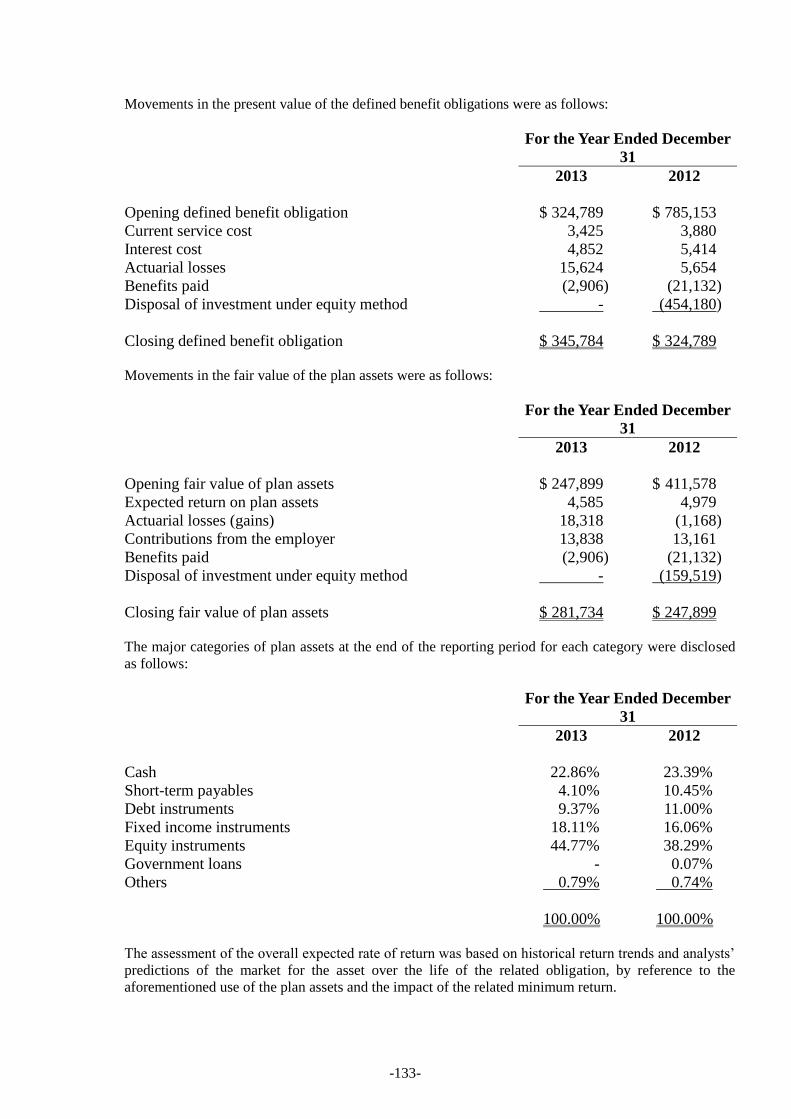
-133-
Movements in the present value of the defined benefit obligations were as follows:
For the Year Ended December
31
2013 2012
Opening defined benefit obligation $ 324,789 $ 785,153
Current service cost 3,425 3,880
Interest cost 4,852 5,414
Actuarial losses 15,624 5,654
Benefits paid (2,906) (21,132)
Disposal of investment under equity method - (454,180)
Closing defined benefit obligation $ 345,784 $ 324,789
Movements in the fair value of the plan assets were as follows:
For the Year Ended December
31
2013 2012
Opening fair value of plan assets $ 247,899 $ 411,578
Expected return on plan assets 4,585 4,979
Actuarial losses (gains) 18,318 (1,168)
Contributions from the employer 13,838 13,161
Benefits paid (2,906) (21,132)
Disposal of investment under equity method - (159,519)
Closing fair value of plan assets $ 281,734 $ 247,899
The major categories of plan assets at the end of the reporting period for each category were disclosed
as follows:
For the Year Ended December
31
2013 2012
Cash 22.86% 23.39%
Short-term payables 4.10% 10.45%
Debt instruments 9.37% 11.00%
Fixed income instruments 18.11% 16.06%
Equity instruments 44.77% 38.29%
Government loans - 0.07%
Others 0.79% 0.74%
100.00% 100.00%
The assessment of the overall expected rate of return was based on historical return trends and analysts‘
predictions of the market for the asset over the life of the related obligation, by reference to the
aforementioned use of the plan assets and the impact of the related minimum return.

-134-
21. EQUITY
a. Share capital
December 31,
2013
December 31,
2012
January 1,
2012
Numbers of shares authorized (in
thousands) 750,000 750,000 660,000
Shares authorized $ 7,500,000 $ 7,500,000 $ 6,600,000
Number of shares issued and fully paid
(in thousands) 521,956 521,956 507,423
Shares issued $ 5,219,555 $ 5,219,555 $ 5,074,228
Fully paid ordinary shares, which have a par value of $10, carry one vote per share and carry a right to
dividends.
b. Capital surplus
December 31,
2013
December 31,
2012
January 1,
2012
Additional paid-in capital - issuance of
shares in excess of par $ 689,395 $ 689,395 $ 689,395
Treasury shares 5,081 5,081 5,081
$ 694,476 $ 694,476 $ 694,476
The capital surplus arising from shares issued in excess of par (including share premium from issuance
of common shares, treasury share transactions and donations) may be used to offset a deficit; in
addition, when the Company has no deficit, such capital surplus may be distributed as cash dividends or
transferred to share capital limited to a certain percentage of the Company‘s capital surplus and once a
year.
c. Retained earnings and dividend policy
According to the Company Law of the Republic of China and Test-Rite‘s Articles of Incorporation,
10% of Test-Rite‘s earnings, after paying tax and offsetting deficit, if any, shall first be appropriated as
legal reserve. The remaining balance, if any, shall be distributed in the following order:
1) Bonus to directors and supervisors - 2%, and
2) Bonus to employees - at least 1% or more,
3) The remainder shall then be allocated in accordance with the resolution of the stockholders in their
annual meeting.
The dividend policy of Test-Rite is as follows:
The dividend policy is designed for the Company to achieve its business plan and at the same time,
maintain stockholders‘ benefits. Distribution is made through stock dividends, common stocks from
capital surplus and cash dividends. Cash dividends shall not be less than 10% of total distribution.
However, if cash dividends per share are less than $0.1, stock dividends could be distributed instead of
cash dividends.

-135-
The appropriations of earnings for 2012 and 2011 had been approved in the shareholders‘ meetings on
June 17, 2013 and June 18, 2012, respectively. The appropriations and dividends per share were as
follows:
Appropriation of Earnings
Dividends Per Share
(NT$)
For the Year Ended
December 31
For the Year Ended
December 31
2012 2011 2012 2011
Legal reserve $ 68,954 $ 61,051 $ - $ -
Share dividends - 145,327 - 0.30
Cash dividends 526,055 387,538 1.08 0.80
Bonuses to employees and remuneration to directors and supervisors for 2012 and 2011 approved in the
shareholders‘ meetings on June 17, 2013 and June 18, 2012, respectively, were as follows:
For the Year Ended December
31
2012 2011
Cash
Dividends Cash
Dividends
Bonus to employees $ 49,647 $ 43,956
Remuneration of directors and supervisors 12,412 10,989
For the years ended December 31, 2013 and 2012, the bonus to employees was $5,260 thousand and
$49,200 thousand, respectively, and the remuneration to directors and supervisors was $10,521
thousand and $12,100 thousand, respectively. For the year ended December 31, 2013, the bonus to
employees and remuneration to directors and supervisors represented 1% and 2%, respectively, of net
income (net of bonus and remuneration). And for the year ended December 31, 2012, the bonus to
employees and remuneration to directors and supervisors represented 8% and 2%, respectively, of net
income (net of the bonus and remuneration). Material differences between such estimated amounts
and the amounts proposed by the Board of Directors in the following year are adjusted for in the current
year. If the actual amounts subsequently resolved by the stockholders differ from the proposed
amounts, the differences are recorded in the year of stockholders‘ resolution as a change in accounting
estimate. If a share bonus is resolved to be distributed to employees, the number of shares is
determined by dividing the amount of the share bonus by the closing price (after considering the effect
of cash and stock dividends) of the shares of the day immediately preceding the stockholders‘ meeting.
The appropriations of 2013 earnings had been proposed by the board of directors on March 25, 2014.
The proposed appropriations and dividends per share were as follows:
Appropriation
of Earnings
Dividends Per
Share (NT$)
Legal reserve $ 55,789 $ -
Cash dividends 502,088 1.00
The appropriations of 2013 earnings and the amounts of bonus to employees and remuneration to
directors and supervisors will be resolved by the shareholders in their meeting scheduled for June 11,
2014.

-136-
The appropriations of earnings for 2012 were proposed according to the Company‘s financial
statements for the year ended December 31, 2012, which were prepared in accordance with the
Guidelines Governing the Preparation of Financial Reports by Securities Issuers and the Generally
Accepted Accounting Standard in the Republic of China (―ROC GAAP‖), and by reference to the
balance sheet for the year ended December 31, 2012, which was prepared in accordance with the
Guidelines Governing the Preparation of Financial Reports by Securities Issuers (revised) and
International Financial Reporting Standards. Information on the bonus to employees, directors and
supervisors proposed by the Company‘s board of directors is available on the Market Observation Post
System website of the Taiwan Stock Exchange.
Under Rule No. 100116 and Rule No. 0950000507 issued by the FSC, an amount equal to the net debit
balance of shareholders‘ other equity items (including exchange differences on translating foreign
operations, unrealized gain (loss) on available-for-sale financial assets, and the gain or loss on the
hedging instrument relating to the effective portion of cash flow hedge) shall be transferred from
unappropriated earnings to a special reserve before any appropriation of earnings generated before
January 1, 2012 shall be made. Any special reserve appropriated may be reversed to the extent of the
decrease in the net debit balance.
Under Rule No. 1010012865 issued by the FSC on April 6, 2012 and the directive titled ―Questions and
Answers for Special Reserves Appropriated Following Adoption of IFRSs‖, on the first-time adoption
of IFRSs, a company should appropriate to a special reserve of an amount that was the same as these of
unrealized revaluation increment and cumulative translation differences (gains) transferred to retained
earnings as a result of the company‘s use of exemptions under IFRS 1. However, at the date of
transitions to IFRSs, if the increase in retained earnings that resulted from all IFRSs adjustments is not
sufficient for this appropriation, only the increase in retained earnings that resulted from all IFRSs
adjustments will be appropriated to special reserve. The special reserve appropriated as above may be
reversed in proportion to the usage, disposal or reclassification of the related assets and thereafter
distributed.
As of January 1, 2012, the amount appropriated to special reserve from cumulative translation
differences transferred to retained earnings at the date of first-time adoption of IFRSs was $158,894
thousand. For the year ended December 31, 2012, the special reserve reversed on the disposal of the
assets was $148,098 thousand.
d. Special reserves appropriated following first-time adoption of IFRSs
The Company‘s special reserves appropriated following first-time adoption of IFRSs were as follows:
December 31,
2013
December 31,
2012
January 1,
2012
Special reserve $ 148,098 $ - $ -
e. Others equity items
1) Exchange differences on translating foreign operations
Exchange differences relating to the translation of the results and net assets of the Company‘s
foreign operations from their functional currencies to the Company‘s presentation currency (New
Taiwan dollars) were recognized directly in other comprehensive income and accumulated in the
foreign currency translation reserve. Exchange differences previously accumulated in the foreign
currency translation reserve were reclassified to profit or loss on the disposal of the foreign
operation.

-137-
2) Unrealized gains or losses on available-for-sale financial assets
Unrealized gains or losses on available-for-sale financial assets represents the cumulative gains and
losses arising on the revaluation of AFS financial assets that have been recognized in other
comprehensive income, net of amounts reclassified to profit or loss when those assets have been
disposed of or are determined to be impaired.
22. TREASURY SHARES
The changes in treasury shares for the years ended December 31, 2013 and 2012 were summarized as
follows (in shares):
Purpose 2013.1.1 Increase Decrease 2013.12.31
To transfer to employees 34,868,000 - - 34,868,000
Purpose 2012.1.1 Increase Decrease 2012.12.31
To transfer to employees 20,698,000 14,170,000 - 34,868,000
As of December 31, 2013 and 2012, the treasury shares of Test-Rite was both $729,124 thousand, which
was purchased back by Test-Rite.
Test-Rite should transfer all shares purchased back in lump sum or from time to time to employees,
including those of subsidiaries in which Test-Rite holds directly or indirectly more than one half of the total
number of voting shares, within three years from the buyback date.
According to the Stock Exchange Law of the ROC, the shares of treasury shares should not be over 10% of
Test-Rite‘s issued and outstanding shares and the amount of treasury shares should not be over the total of
retained earnings and realized additional paid-in capital. The highest number of shares of treasury shares
that Test-Rite held as of December 31, 2013 was 34,868 thousand shares. The total amount was $729,124
thousand pursuant to the law.
According to the Stock Exchange Law of the ROC, the treasury shares of Test-Rite should not be pledged
and does not have the same right as the common stock.
23. INCOME TAX
a. Income tax recognized in profit or loss
The major components of tax expense (income) were as follows:
For the Year Ended December
31
2013 2012
In respect of the current year $ 104,300 $ 126,067
Adjustments to deferred tax (5,498) 6
Income tax expense of unappropriated earnings 9,500 1,700
In respect of prior periods (16,194) (6,150)
Additional income tax under alternative minimum tax act - 410
$ 92,108 $ 122,033
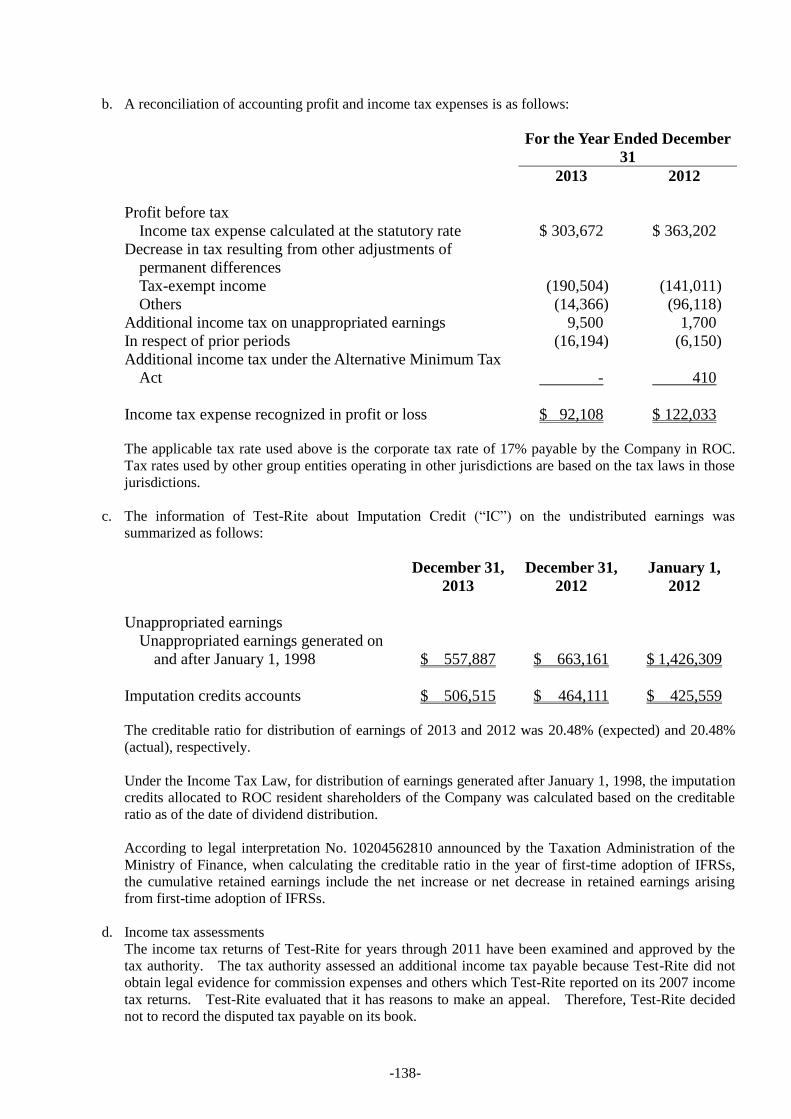
-138-
b. A reconciliation of accounting profit and income tax expenses is as follows:
For the Year Ended December
31
2013 2012
Profit before tax
Income tax expense calculated at the statutory rate $ 303,672 $ 363,202
Decrease in tax resulting from other adjustments of
permanent differences
Tax-exempt income (190,504) (141,011)
Others (14,366) (96,118)
Additional income tax on unappropriated earnings 9,500 1,700
In respect of prior periods (16,194) (6,150)
Additional income tax under the Alternative Minimum Tax
Act - 410
Income tax expense recognized in profit or loss $ 92,108 $ 122,033
The applicable tax rate used above is the corporate tax rate of 17% payable by the Company in ROC.
Tax rates used by other group entities operating in other jurisdictions are based on the tax laws in those
jurisdictions.
c. The information of Test-Rite about Imputation Credit (―IC‖) on the undistributed earnings was
summarized as follows:
December 31,
2013
December 31,
2012
January 1,
2012
Unappropriated earnings
Unappropriated earnings generated on
and after January 1, 1998 $ 557,887 $ 663,161 $ 1,426,309
Imputation credits accounts $ 506,515 $ 464,111 $ 425,559
The creditable ratio for distribution of earnings of 2013 and 2012 was 20.48% (expected) and 20.48%
(actual), respectively.
Under the Income Tax Law, for distribution of earnings generated after January 1, 1998, the imputation
credits allocated to ROC resident shareholders of the Company was calculated based on the creditable
ratio as of the date of dividend distribution.
According to legal interpretation No. 10204562810 announced by the Taxation Administration of the
Ministry of Finance, when calculating the creditable ratio in the year of first-time adoption of IFRSs,
the cumulative retained earnings include the net increase or net decrease in retained earnings arising
from first-time adoption of IFRSs.
d. Income tax assessments
The income tax returns of Test-Rite for years through 2011 have been examined and approved by the
tax authority. The tax authority assessed an additional income tax payable because Test-Rite did not
obtain legal evidence for commission expenses and others which Test-Rite reported on its 2007 income
tax returns. Test-Rite evaluated that it has reasons to make an appeal. Therefore, Test-Rite decided
not to record the disputed tax payable on its book.
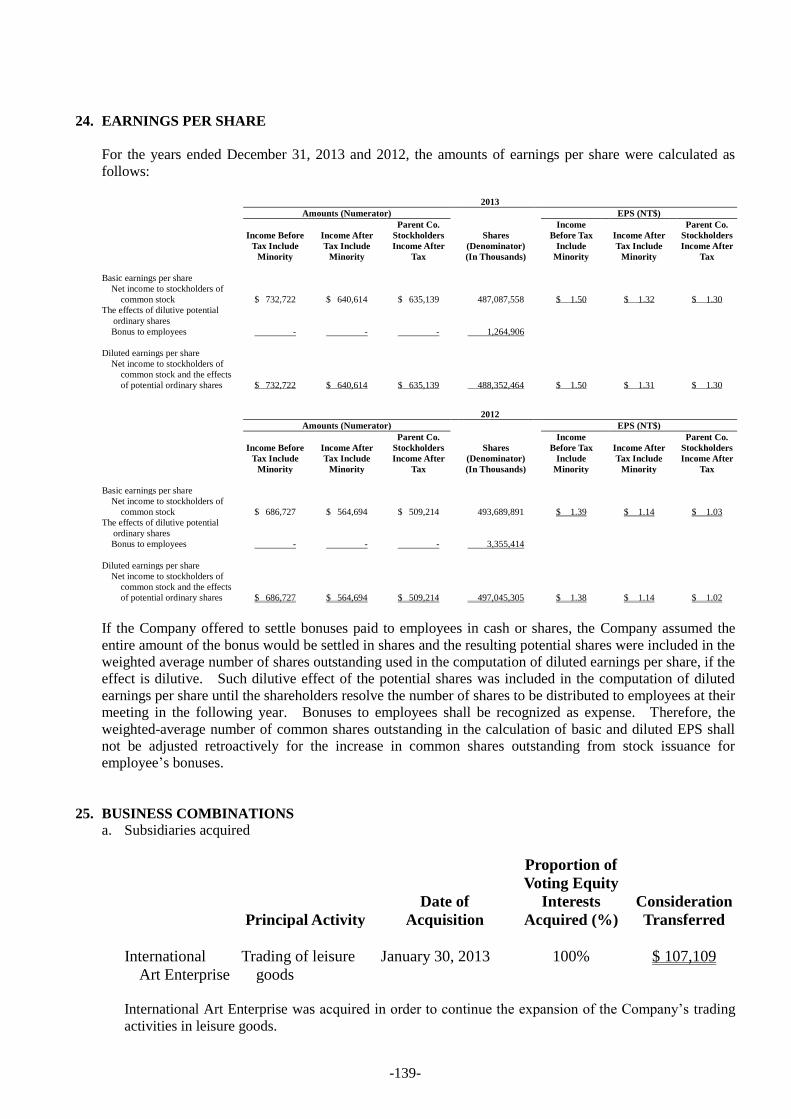
-139-
24. EARNINGS PER SHARE
For the years ended December 31, 2013 and 2012, the amounts of earnings per share were calculated as
follows:
2013
Amounts (Numerator) EPS (NT$)
Income Before
Tax Include
Minority
Income After
Tax Include
Minority
Parent Co.
Stockholders
Income After
Tax
Shares
(Denominator)
(In Thousands)
Income
Before Tax
Include
Minority
Income After
Tax Include
Minority
Parent Co.
Stockholders
Income After
Tax
Basic earnings per share
Net income to stockholders of
common stock
$ 732,722 $ 640,614 $ 635,139 487,087,558 $ 1.50 $ 1.32 $ 1.30
The effects of dilutive potential
ordinary shares
Bonus to employees - - - 1,264,906
Diluted earnings per share
Net income to stockholders of
common stock and the effects
of potential ordinary shares
$ 732,722 $ 640,614 $ 635,139 488,352,464 $ 1.50 $ 1.31 $ 1.30
2012
Amounts (Numerator) EPS (NT$)
Income Before
Tax Include
Minority
Income After
Tax Include
Minority
Parent Co.
Stockholders
Income After
Tax
Shares
(Denominator)
(In Thousands)
Income
Before Tax
Include
Minority
Income After
Tax Include
Minority
Parent Co.
Stockholders
Income After
Tax
Basic earnings per share
Net income to stockholders of
common stock
$ 686,727 $ 564,694 $ 509,214 493,689,891 $ 1.39 $ 1.14 $ 1.03
The effects of dilutive potential
ordinary shares
Bonus to employees - - - 3,355,414
Diluted earnings per share
Net income to stockholders of
common stock and the effects
of potential ordinary shares
$ 686,727 $ 564,694 $ 509,214 497,045,305 $ 1.38 $ 1.14 $ 1.02
If the Company offered to settle bonuses paid to employees in cash or shares, the Company assumed the
entire amount of the bonus would be settled in shares and the resulting potential shares were included in the
weighted average number of shares outstanding used in the computation of diluted earnings per share, if the
effect is dilutive. Such dilutive effect of the potential shares was included in the computation of diluted
earnings per share until the shareholders resolve the number of shares to be distributed to employees at their
meeting in the following year. Bonuses to employees shall be recognized as expense. Therefore, the
weighted-average number of common shares outstanding in the calculation of basic and diluted EPS shall
not be adjusted retroactively for the increase in common shares outstanding from stock issuance for
employee‘s bonuses.
25. BUSINESS COMBINATIONS
a. Subsidiaries acquired
Principal Activity
Date of
Acquisition
Proportion of
Voting Equity
Interests
Acquired (%)
Consideration
Transferred
International
Art Enterprise
Trading of leisure
goods
January 30, 2013 100% $ 107,109
International Art Enterprise was acquired in order to continue the expansion of the Company‘s trading
activities in leisure goods.

-140-
b. Considerations transferred
International
Art Enterprise
Cash $ 78,069
Contingent consideration arrangement 29,040
$ 107,109
Under the contingent consideration arrangement, the Company is required to pay the vendors an
additional US$1,000 thousand if International Art Enterprise‘s sales revenue in 2013 exceeds
US$24,000 thousand or gross profit in 2013 exceeds US$3,240 thousand. The amount of US$1,000
thousand represents the estimated fair value of this obligation at the acquisition date, which amounted
to $29,040 thousand approximately.
c. Assets acquired and liabilities assumed at the date of acquisition
Amount
Cash $ 70,016
Trade receivables 45,371
Inventories 4
Other receivables 4
Prepayments 2,482
Other current assets 246
Other intangible assets 13,700
Goodwill 53,799
Other assets 1,919
Notes payable (1,002)
Trade payables (34,724)
Other payables (44,557)
Other current liabilities (149)
$ 107,109
d. Net cash outflow on acquisition of subsidiaries
For the Year
Ended
December 31,
2013
Consideration paid in cash $ 78,069
Less: Cash and cash equivalent balances acquired (70,016)
$ 8,053
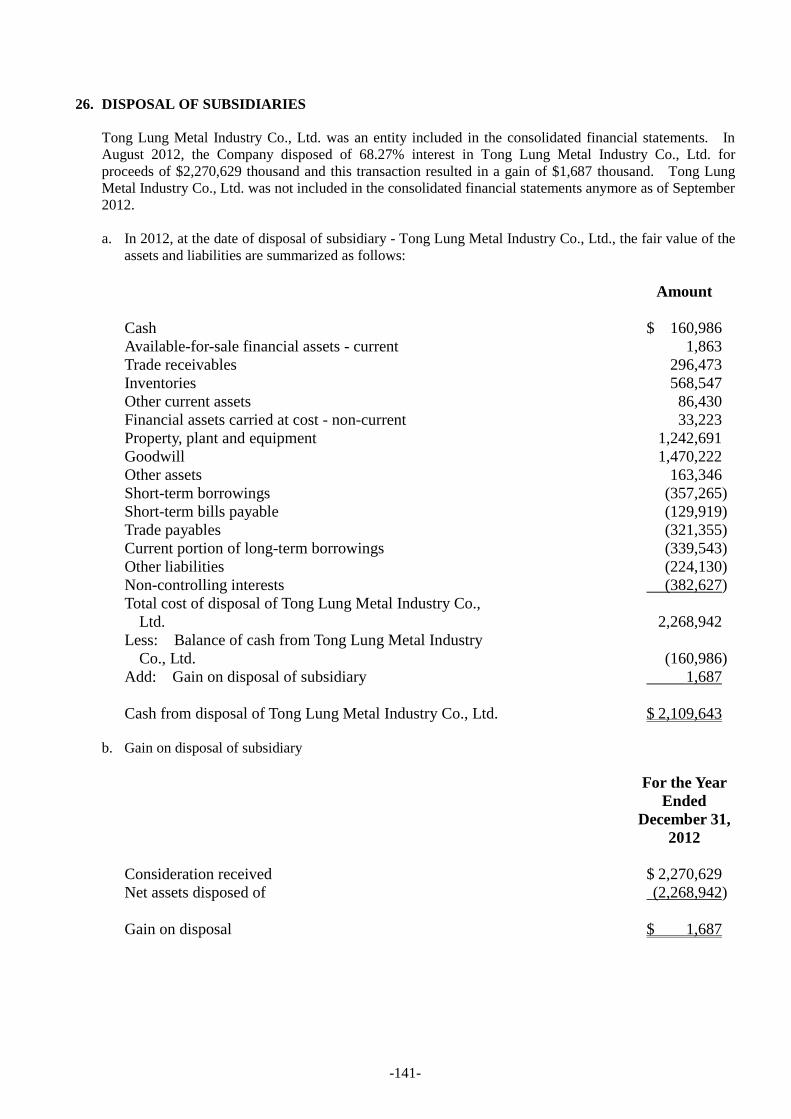
-141-
26. DISPOSAL OF SUBSIDIARIES
Tong Lung Metal Industry Co., Ltd. was an entity included in the consolidated financial statements. In
August 2012, the Company disposed of 68.27% interest in Tong Lung Metal Industry Co., Ltd. for
proceeds of $2,270,629 thousand and this transaction resulted in a gain of $1,687 thousand. Tong Lung
Metal Industry Co., Ltd. was not included in the consolidated financial statements anymore as of September
2012.
a. In 2012, at the date of disposal of subsidiary - Tong Lung Metal Industry Co., Ltd., the fair value of the
assets and liabilities are summarized as follows:
Amount
Cash $ 160,986
Available-for-sale financial assets - current 1,863
Trade receivables 296,473
Inventories 568,547
Other current assets 86,430
Financial assets carried at cost - non-current 33,223
Property, plant and equipment 1,242,691
Goodwill 1,470,222
Other assets 163,346
Short-term borrowings (357,265)
Short-term bills payable (129,919)
Trade payables (321,355)
Current portion of long-term borrowings (339,543)
Other liabilities (224,130)
Non-controlling interests (382,627)
Total cost of disposal of Tong Lung Metal Industry Co.,
Ltd.
2,268,942
Less: Balance of cash from Tong Lung Metal Industry
Co., Ltd.
(160,986)
Add: Gain on disposal of subsidiary 1,687
Cash from disposal of Tong Lung Metal Industry Co., Ltd. $ 2,109,643
b. Gain on disposal of subsidiary
For the Year
Ended
December 31,
2012
Consideration received $ 2,270,629
Net assets disposed of (2,268,942)
Gain on disposal $ 1,687

-142-
c. Net cash inflow on disposal of subsidiary
For the Year
Ended
December 31,
2012
Consideration received in cash and cash equivalents $ 2,270,629
Less: Cash and cash equivalent balances disposed of (160,986)
$ 2,109,643
27. EQUITY TRANSACTIONS WITH NON-CONTROLLING INTERESTS
On August 31, 2012, the Company paid total US$13,899 thousand to related parties, Quality Master,
Li-Heng Lee, Li-Shan Lee and Robin Ho to acquire 100% of interests in Upmaster and additional 10.53%
of interests in TR US.
After these acquisitions, the Company increased both its interests of ownership in TR US and TR
PRODUCTS to 100%. The Company acquired entire non-controlling interests of TR US and TR
PRODUCTS, so the transactions were accounted for as equity transaction.
The above transactions were accounted for as equity transactions, since the Company did not cease to have
control over these subsidiaries.
TR US
Cash consideration paid $ 416,136
The proportionate share of the carrying amount of the net
assets of the subsidiary transferred to non-controlling
interests 341,697
Differences arising from equity transaction $ 757,833
28. OPERATING LEASE
The agreement on lease of land, buildings and improvements which Test-Rite entered into with related
party, Tsai Wang, required Test-Rite to pay guarantee deposit of $125,000 thousand, which was recorded
under ―refundable deposits paid‖.
A list of rent expense for the next 4 years as of December 31, 2013 was as follows:
Period Amount
2014 $ 298,513
2015 307,468
2016 316,693
2017 326,193
$ 1,248,867
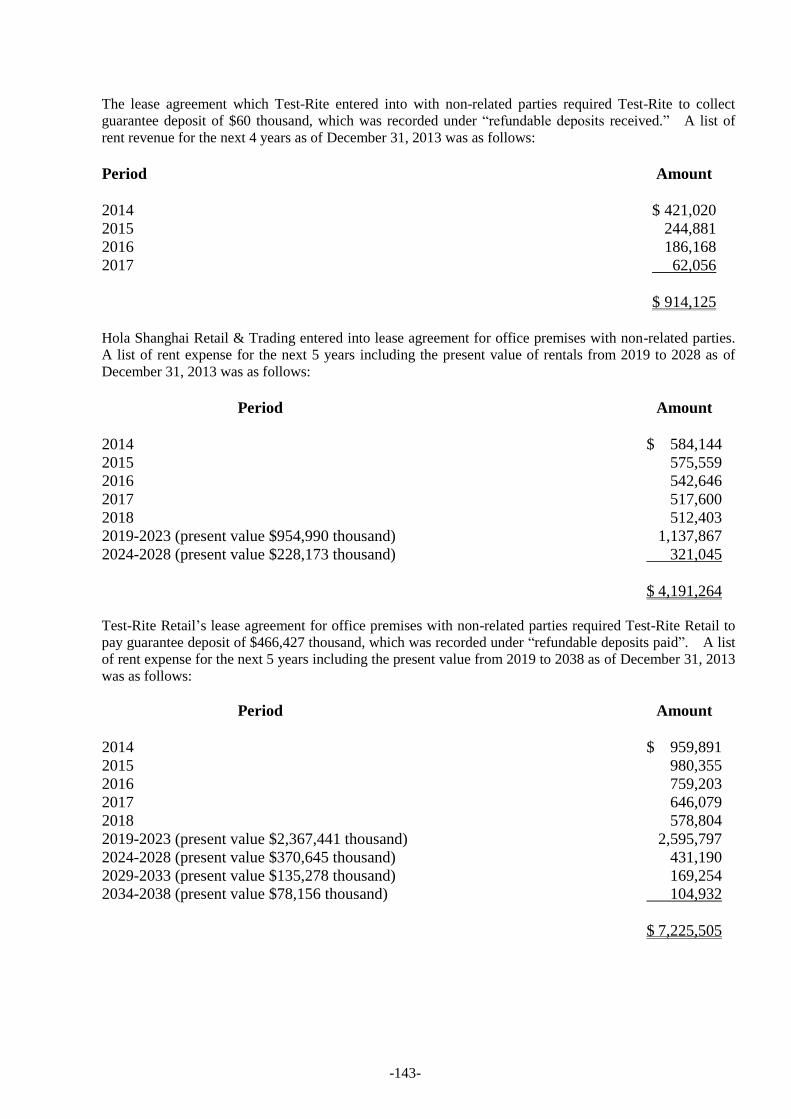
-143-
The lease agreement which Test-Rite entered into with non-related parties required Test-Rite to collect
guarantee deposit of $60 thousand, which was recorded under ―refundable deposits received.‖ A list of
rent revenue for the next 4 years as of December 31, 2013 was as follows:
Period Amount
2014 $ 421,020
2015 244,881
2016 186,168
2017 62,056
$ 914,125
Hola Shanghai Retail & Trading entered into lease agreement for office premises with non-related parties.
A list of rent expense for the next 5 years including the present value of rentals from 2019 to 2028 as of
December 31, 2013 was as follows:
Period Amount
2014 $ 584,144
2015 575,559
2016 542,646
2017 517,600
2018 512,403
2019-2023 (present value $954,990 thousand) 1,137,867
2024-2028 (present value $228,173 thousand) 321,045
$ 4,191,264
Test-Rite Retail‘s lease agreement for office premises with non-related parties required Test-Rite Retail to
pay guarantee deposit of $466,427 thousand, which was recorded under ―refundable deposits paid‖. A list
of rent expense for the next 5 years including the present value from 2019 to 2038 as of December 31, 2013
was as follows:
Period Amount
2014 $ 959,891
2015 980,355
2016 759,203
2017 646,079
2018 578,804
2019-2023 (present value $2,367,441 thousand) 2,595,797
2024-2028 (present value $370,645 thousand) 431,190
2029-2033 (present value $135,278 thousand) 169,254
2034-2038 (present value $78,156 thousand) 104,932
$ 7,225,505

-144-
29. PERSONNEL, DEPRECIATION, AND AMORTIZATION EXPENSES
Personnel, depreciation, and amortization expenses for the years ended December 31, 2013 and 2012 were
summarized as follows:
Function
Expense Item
2013 2012
Operating
Costs
Operating
Expenses Total
Operating
Costs
Operating
Expenses Total
Personnel expenses
Salaries $ 90,014 $ 2,587,630 $ 2,677,644 $ 241,543 $ 3,053,772 $ 3,295,315
Labor insurance and health insurance 5,396 214,599 219,995 15,394 235,568 250,962
Pension cost 3,266 117,149 120,415 15,601 133,013 148,614
Others 2,417 267,680 270,097 12,528 262,197 274,725
Depreciation expenses 61,671 606,727 668,398 83,260 570,440 653,700
Amortization expenses 25 143,115 143,140 1,656 161,125 162,781
30. CAPITAL MANAGEMENT
The objective of the company‘s capital management is to ensure it has the necessary financial resource and
operational plan so that it can cope with the next twelve months working capital requirements, capital
expenditures and dividends spending.
31. TRANSACTIONS WITH RELATED PARTIES
Balances and transactions between Test-Rite and its subsidiaries have been eliminated on consolidation.
Details of transactions between the Company and other related parties are disclosed below.
a. Operating transactions
Rent Expense
Year Ended December 31
2013 2012
Others (Tsai Wang) $ 291,531 $ 280,692
Commission Expense
Year Ended December 31
2013 2012
Associates (TR Mexico) $ - $ 2,979
Outstanding balance in reporting date was as follows:
Receivables From Related Parties
December 31,
2013
December 31,
2012
January 1,
2012
.Associates (TR Mexico) $ - $ 1,798 $ 5,400
Accrued Commission Expense to Related
Parties
December 31,
2013
December 31,
2012
January 1,
2012
.Associates (TR Mexico) $ - $ - $ 1,394

-145-
Refundable Deposits Paid
December 31,
2013
December 31,
2012
January 1,
2012
Others (Tsai Wang) $ 125,000 $ 125,000 $ 125,000
The transaction conditions of related parties are almost the same as non-related parties.
b. Equity transaction
See Note 27.
c. Property lease
See Notes 14 and 28.
d. Endorsements or Guarantees
Endorsements or guarantees that Test-Rite provided to subsidiaries were summarized in Note 34.
As of December 31, 2013, short-term borrowings of $512,794 thousand were guaranteed by others
(Tony Ho and Judy Lee).
As of December 31, 2013, long-term borrowings of $1,006,788 thousand was guaranteed by others
(Tony Ho and Judy Lee) and long-term borrowings of $3,198,500 thousand was guaranteed by others
(Judy Lee).
e. Compensation of key management personnel
For the Year Ended December
31
2013 2012
Short-term employee benefits $ 354,267 $ 201,354
Post-employment benefits 618 3,365
$ 354,885 $ 204,719
The remuneration of directors and key executives was determined by the remuneration committee
having regard to the performance of individuals and market trends.
32. FINANCIAL INSTRUMENTS
a. Fair value of financial instruments,
1) Fair value of financial instruments not carried at fair value
The management considers that the carrying amounts of financial assets and financial liabilities not
carried at fair value approximate their fair value or the fair values are not measured reliably.
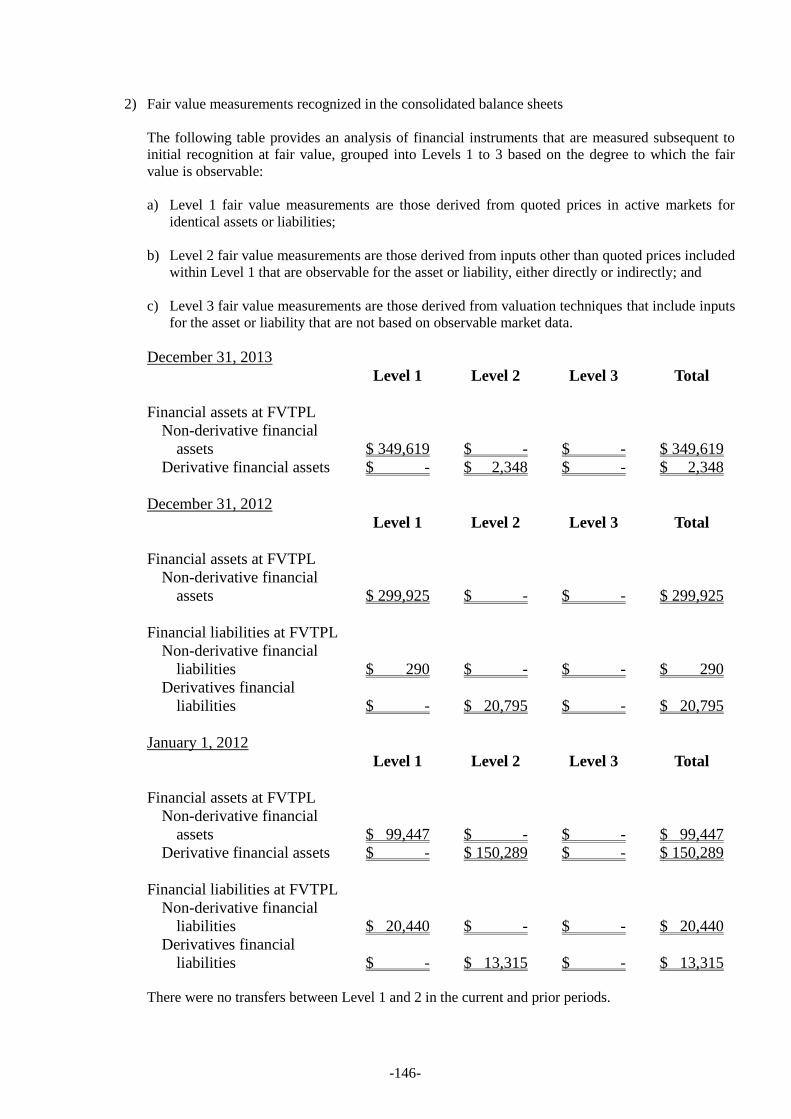
-146-
2) Fair value measurements recognized in the consolidated balance sheets
The following table provides an analysis of financial instruments that are measured subsequent to
initial recognition at fair value, grouped into Levels 1 to 3 based on the degree to which the fair
value is observable:
a) Level 1 fair value measurements are those derived from quoted prices in active markets for
identical assets or liabilities;
b) Level 2 fair value measurements are those derived from inputs other than quoted prices included
within Level 1 that are observable for the asset or liability, either directly or indirectly; and
c) Level 3 fair value measurements are those derived from valuation techniques that include inputs
for the asset or liability that are not based on observable market data.
December 31, 2013
Level 1 Level 2 Level 3 Total
Financial assets at FVTPL
Non-derivative financial
assets $ 349,619 $ - $ - $ 349,619
Derivative financial assets $ - $ 2,348 $ - $ 2,348
December 31, 2012
Level 1 Level 2 Level 3 Total
Financial assets at FVTPL
Non-derivative financial
assets $ 299,925 $ - $ - $ 299,925
Financial liabilities at FVTPL
Non-derivative financial
liabilities $ 290 $ - $ - $ 290
Derivatives financial
liabilities $ - $ 20,795 $ - $ 20,795
January 1, 2012
Level 1 Level 2 Level 3 Total
Financial assets at FVTPL
Non-derivative financial
assets $ 99,447 $ - $ - $ 99,447
Derivative financial assets $ - $ 150,289 $ - $ 150,289
Financial liabilities at FVTPL
Non-derivative financial
liabilities $ 20,440 $ - $ - $ 20,440
Derivatives financial
liabilities $ - $ 13,315 $ - $ 13,315
There were no transfers between Level 1 and 2 in the current and prior periods.

-147-
3) Valuation techniques and assumptions applied for the purpose of measuring fair value
The fair values of financial assets and financial liabilities were determined as follows:
The fair values of financial assets and financial liabilities with standard terms and conditions
and traded on active liquid markets are determined with reference to quoted market prices.
Where such prices were not available, valuation techniques were applied. The estimates and
assumptions used by the Company are consistent with those that market participants would use
in setting a price for the financial instrument;
The fair values of foreign currency forward contracts of derivative instruments were calculated
using forward exchange swap rate and discount rate published by financial organization and the
forward exchange rates on maturity date of specific contract, respectively. Discounted cash
flow analysis was performed using the applicable yield curve for the duration of the instruments
for non-optional derivatives, and option pricing models for optional derivatives.
The fair values of other financial assets and financial liabilities (excluding those described
above) were determined in accordance with generally accepted pricing models based on
discounted cash flow analysis.
Fair Value of Financial Instruments
The fair value of non-derivative financial instruments as of December 31, 2013, December 31, 2012 and
January 1, 2012 was summarized as follows:
December 31,
2013
December 31,
2012
January 1,
2012
Assets
Cash and cash equivalents $ 2,418,439 $ 1,881,727 $ 2,093,773
Financial assets at fair value through profit
or loss - current 351,967 299,925 249,736
Notes receivable, trade receivables and
other receivables 3,215,059 2,777,770 3,302,727
Prepayments 563,633 547,474 915,460
Other current assets 262 599 613
Available-for-sale financial assets - - 32,591
Financial assets measured at cost 71,823 73,709 109,989
Debt investments with no active market 216,123 50,000 52,000
$ 6,837,306 $ 5,631,204 $ 6,756,889
Liabilities
Short-term borrowings $ 2,256,663 $ 1,764,129 $ 3,397,071
Short-term bills payable 9,997 - 159,842
Financial liabilities at fair value through
profit or loss - current - 21,085 33,755
Notes payable, trade payables and other
payables 7,298,201 6,696,098 6,355,029
Liability component of preferred stocks,
current - - 335,361
Advance receipts 603,381 604,073 655,472
Long-term borrowings (Note) 5,527,615 5,213,197 7,150,590
$ 15,695,857 $ 14,298,582 $ 18,087,120

-148-
Note: The balance included short-term portion of long-term borrowings.
Financial Risk Management Objectives and Policies
The Company‘s major financial instruments include equity and debt investments, borrowings, trade
receivables and trade payables. The Company‘s Corporate Treasury function provides services to the
business, coordinates access to domestic and international financial markets, monitors and manages the
financial risks relating to the operations of the Company through internal risk reports which analyze
exposures by degree and magnitude of risks. These risks include market risk, credit risk and liquidity risk.
The Company sought to minimize the effects of these risks by using derivative financial instruments to
hedge risk exposures. The use of financial derivatives was governed by the company‘s policies approved
by the board of directors, which provided written principles on foreign exchange risk, interest rate risk,
credit risk, the use of financial derivatives and non-derivative financial instruments, and the investment of
excess liquidity. Compliance with policies and exposure limits was reviewed by the internal auditors on a
continuous basis. The Company did not enter into or trade financial instruments for speculative purposes.
a. Market risk
The Company‘s activities exposed it primarily to the financial risks of changes in foreign currency
exchange rates. The Company entered into a variety of derivative financial instruments to manage its
exposure to foreign currency risk, including forward foreign exchange contracts to hedge the exchange
rate risk arising on the export.
There had been no change to the Company‘s exposure to market risks or the manner in which these
risks were managed and measured.
1) Foreign currency risk
Several subsidiaries of the Company had foreign currency sales and purchases, which exposed the
Company to foreign currency risk. Exchange rate exposures were managed within approved
policy parameters utilizing forward foreign exchange contracts.
The carrying amounts of the Company‘s foreign currency denominated monetary assets and
monetary liabilities (see Note 35).
Currency USD Impact Currency EUR Impact Currency GBP Impact Currency RMB Impact
For the Year Ended
December 31
For the Year Ended
December 31
For the Year Ended
December 31
For the Year Ended
December 31
2013 2012 2013 2012 2013 2012 2013 2012
Equity $ (305,304 ) $ (64,851 ) $ (6,853 ) $ (2,861 ) $ 1,965 $ 1,781 $ (110,345 ) $ (129,589 )
The sensitivity analysis included only outstanding foreign currency denominated monetary items,
and the effect on profit and loss by their translation at the end of the reporting period for a 10%
change in foreign currency rates.
2) Interest rate risk
The Company was exposed to interest rate risk because entities in the Company borrowed funds at
floating interest rates. The risk is managed by the Company by maintaining floating rate
borrowings, and using Company forward interest rate contracts. Hedging activities are evaluated
regularly to align with interest rate views and defined risk appetite, ensuring the most cost-effective
hedging strategies are applied.
The Company‘s interest rate risk arises primarily from fixed revenue investment and floating
interest rate borrowings.

-149-
The carrying amount of the Company‘s financial assets and financial liabilities with exposure to
interest rates at the end of the reporting period were as follows:
December 31,
2013
December 31,
2012
January 1,
2012
Fair value interest rate risk
Financial assets $ 287,658 $ 97,572 $ 25,298
Financial liabilities 7,794,275 6,977,326 10,707,503
The sensitivity analyses were calculated by a change in fair value of the fixed interest rates financial
assets and liabilities at the end of the reporting period.
If interest rates at end of the reporting period were higher by 1% and all other variables were held
constant, the Company‘s cash outflow for the years ended December 31, 2013 and 2012 would have
been higher by $75,066 thousand and $68,798 thousand.
b. Credit risk
Credit risk refers to the risk that counterparty will default on its contractual obligations resulting in
financial loss to the Company. As at the end of the reporting period, the Company‘s maximum
exposure to credit risk which will cause a financial loss to the Company due to failure of counterparties
to discharge an obligation and financial guarantees provided by the Company could arise from:
1) The carrying amount of the respective recognized financial assets as stated in the balance sheets;
and
2) The amount of contingent liabilities in relation to financial guarantee issued by the Company.
The Company direct against the counterparties which deal with materially to providing sufficient
collateral or other right pledged, so that it could minimize credit risk effectively. Management of the
Company has delegated a team responsible for determining credit limits, credit approvals and other
monitoring procedures to ensure that follow-up action is taken to recover overdue debts. In addition,
the Company reviews the recoverable amount of each individual trade debt at the end of the reporting
period to ensure that adequate allowances are made for irrecoverable amounts. In this regard,
management believes the Company‘s credit risk was significantly reduced.
The credit risk on liquid funds and derivatives was limited because the counterparties are banks with
high credit ratings assigned by international credit-rating agencies.
The Company did transactions with a large number of customers among different industries and
geography area. Ongoing credit evaluation is performed on the financial condition of trade receivables
and, where appropriate, credit guarantee insurance cover is purchased.
3) Liquidity risk
The Company manages and contains sufficient working capital to support the operations so there is no
liquidity risk of shortage of funds by the maturity date of implementing obligation to the contracts,
reduce the impact on fluctuation of cash flow.
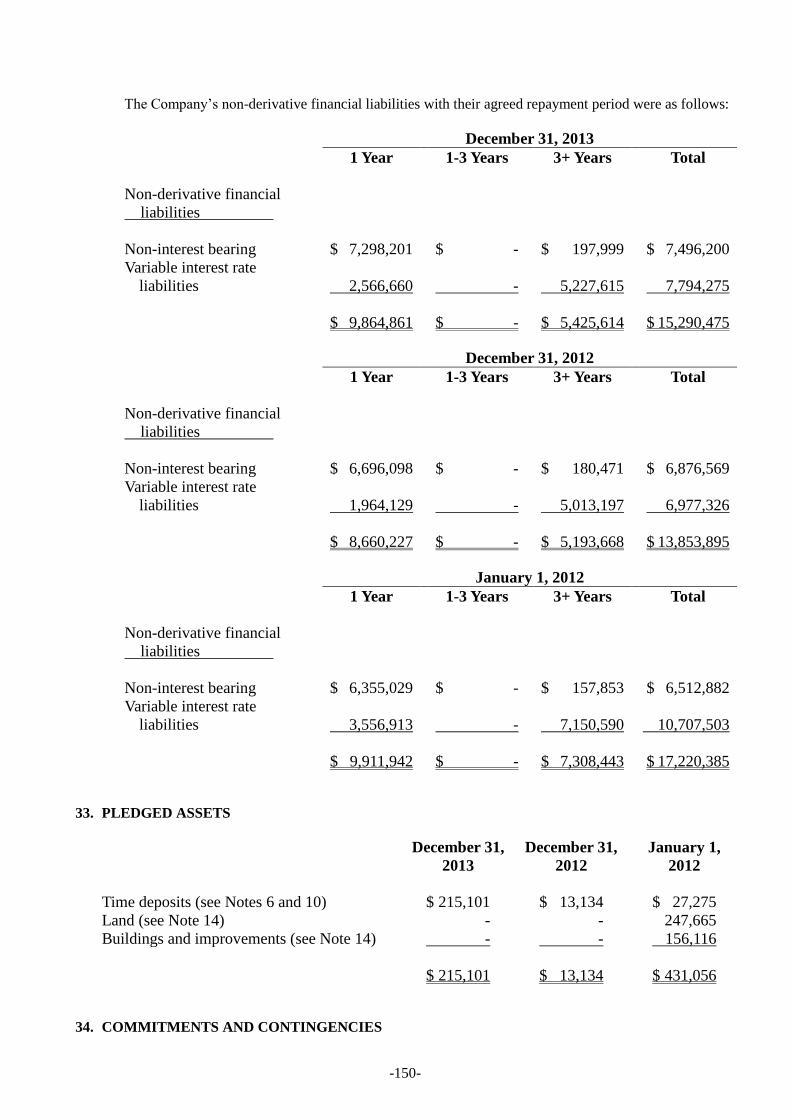
-150-
The Company‘s non-derivative financial liabilities with their agreed repayment period were as follows:
December 31, 2013
1 Year 1-3 Years 3+ Years Total
Non-derivative financial
liabilities
Non-interest bearing $ 7,298,201 $ - $ 197,999 $ 7,496,200
Variable interest rate
liabilities
2,566,660 - 5,227,615 7,794,275
$ 9,864,861 $ - $ 5,425,614 $ 15,290,475
December 31, 2012
1 Year 1-3 Years 3+ Years Total
Non-derivative financial
liabilities
Non-interest bearing $ 6,696,098 $ - $ 180,471 $ 6,876,569
Variable interest rate
liabilities
1,964,129 - 5,013,197 6,977,326
$ 8,660,227 $ - $ 5,193,668 $ 13,853,895
January 1, 2012
1 Year 1-3 Years 3+ Years Total
Non-derivative financial
liabilities
Non-interest bearing $ 6,355,029 $ - $ 157,853 $ 6,512,882
Variable interest rate
liabilities
3,556,913 - 7,150,590 10,707,503
$ 9,911,942 $ - $ 7,308,443 $ 17,220,385
33. PLEDGED ASSETS
December 31,
2013
December 31,
2012
January 1,
2012
Time deposits (see Notes 6 and 10) $ 215,101 $ 13,134 $ 27,275
Land (see Note 14) - - 247,665
Buildings and improvements (see Note 14) - - 156,116
$ 215,101 $ 13,134 $ 431,056
34. COMMITMENTS AND CONTINGENCIES
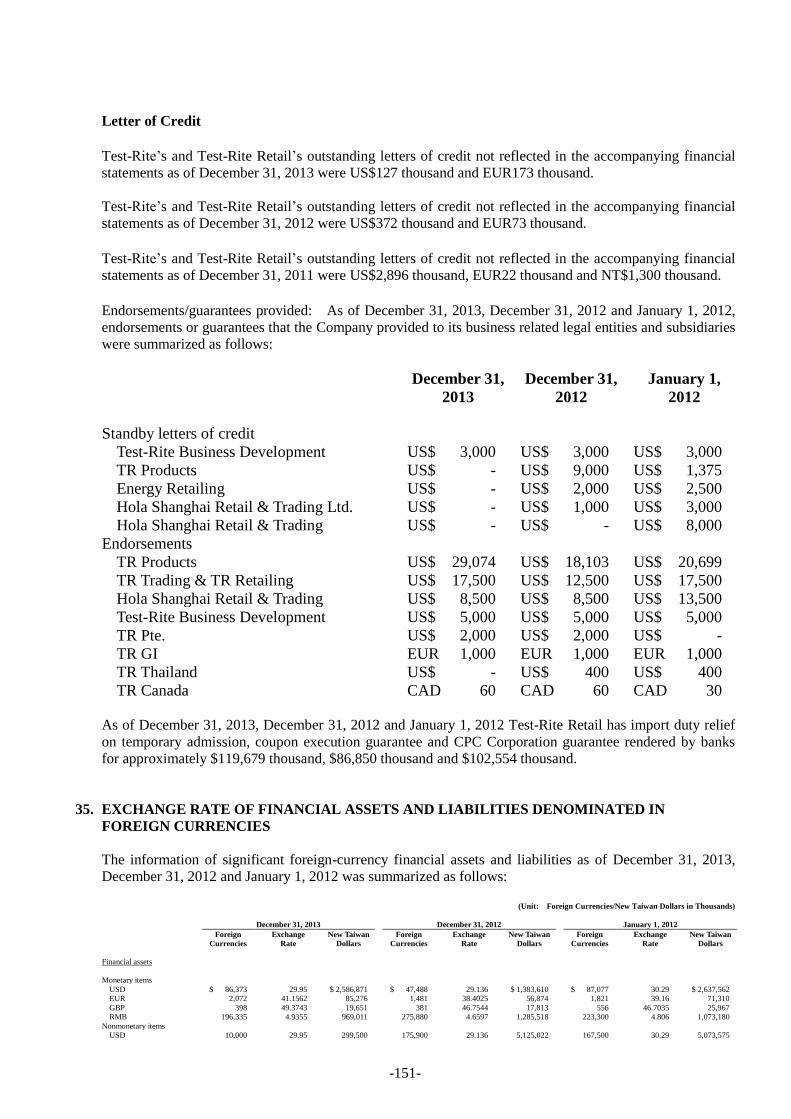
-151-
Letter of Credit
Test-Rite‘s and Test-Rite Retail‘s outstanding letters of credit not reflected in the accompanying financial
statements as of December 31, 2013 were US$127 thousand and EUR173 thousand.
Test-Rite‘s and Test-Rite Retail‘s outstanding letters of credit not reflected in the accompanying financial
statements as of December 31, 2012 were US$372 thousand and EUR73 thousand.
Test-Rite‘s and Test-Rite Retail‘s outstanding letters of credit not reflected in the accompanying financial
statements as of December 31, 2011 were US$2,896 thousand, EUR22 thousand and NT$1,300 thousand.
Endorsements/guarantees provided: As of December 31, 2013, December 31, 2012 and January 1, 2012,
endorsements or guarantees that the Company provided to its business related legal entities and subsidiaries
were summarized as follows:
December 31,
2013
December 31,
2012
January 1,
2012
Standby letters of credit
Test-Rite Business Development US$ 3,000 US$ 3,000 US$ 3,000
TR Products US$ - US$ 9,000 US$ 1,375
Energy Retailing US$ - US$ 2,000 US$ 2,500
Hola Shanghai Retail & Trading Ltd. US$ - US$ 1,000 US$ 3,000
Hola Shanghai Retail & Trading US$ - US$ - US$ 8,000
Endorsements
TR Products US$ 29,074 US$ 18,103 US$ 20,699
TR Trading & TR Retailing US$ 17,500 US$ 12,500 US$ 17,500
Hola Shanghai Retail & Trading US$ 8,500 US$ 8,500 US$ 13,500
Test-Rite Business Development US$ 5,000 US$ 5,000 US$ 5,000
TR Pte. US$ 2,000 US$ 2,000 US$ -
TR GI EUR 1,000 EUR 1,000 EUR 1,000
TR Thailand US$ - US$ 400 US$ 400
TR Canada CAD 60 CAD 60 CAD 30
As of December 31, 2013, December 31, 2012 and January 1, 2012 Test-Rite Retail has import duty relief
on temporary admission, coupon execution guarantee and CPC Corporation guarantee rendered by banks
for approximately $119,679 thousand, $86,850 thousand and $102,554 thousand.
35. EXCHANGE RATE OF FINANCIAL ASSETS AND LIABILITIES DENOMINATED IN
FOREIGN CURRENCIES
The information of significant foreign-currency financial assets and liabilities as of December 31, 2013,
December 31, 2012 and January 1, 2012 was summarized as follows:
(Unit: Foreign Currencies/New Taiwan Dollars in Thousands)
December 31, 2013 December 31, 2012 January 1, 2012
Foreign
Currencies
Exchange
Rate
New Taiwan
Dollars Foreign
Currencies
Exchange
Rate
New Taiwan
Dollars
Foreign
Currencies
Exchange
Rate
New Taiwan
Dollars
Financial assets
Monetary items
USD $ 86,373 29.95 $ 2,586,871 $ 47,488 29.136 $ 1,383,610 $ 87,077 30.29 $ 2,637,562
EUR 2,072 41.1562 85,276 1,481 38.4025 56,874 1,821 39.16 71,310
GBP 398 49.3743 19,651 381 46.7544 17,813 556 46.7035 25,967
RMB 196,335 4.9355 969,011 275,880 4.6597 1,285,518 223,300 4.806 1,073,180
Nonmonetary items
USD 10,000 29.95 299,500 175,900 29.136 5,125,022 167,500 30.29 5,073,575
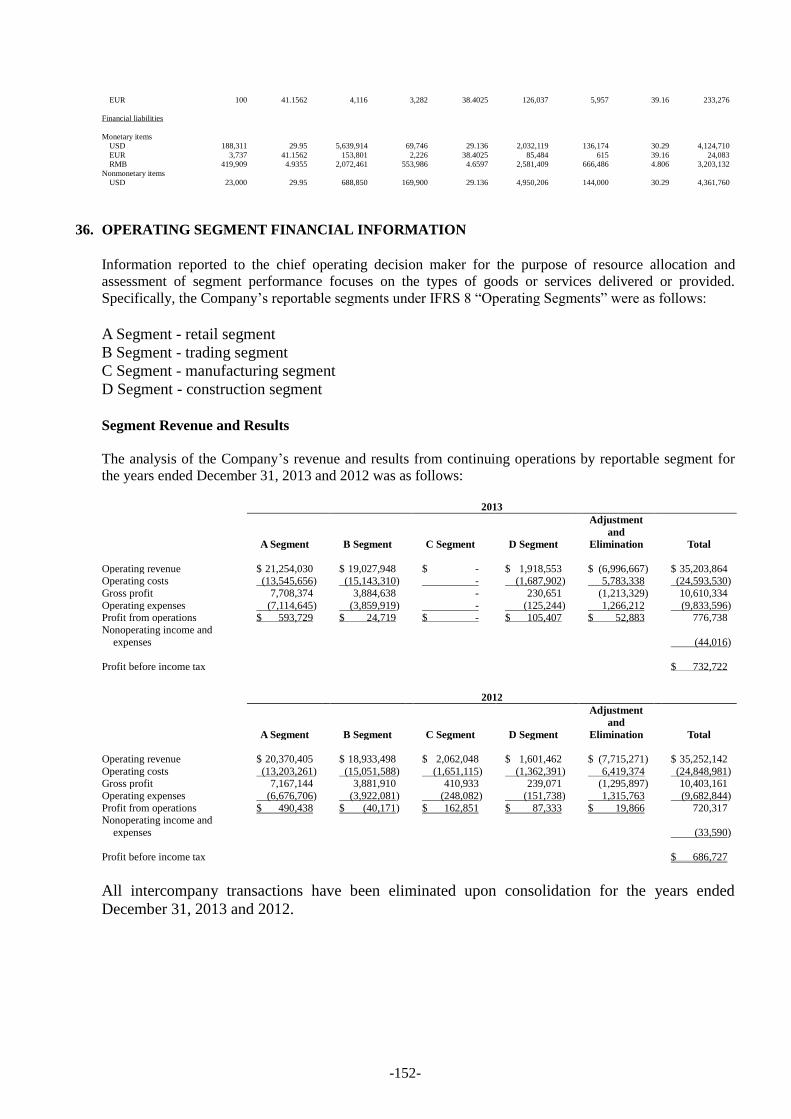
-152-
EUR 100 41.1562 4,116 3,282 38.4025 126,037 5,957 39.16 233,276
Financial liabilities
Monetary items
USD 188,311 29.95 5,639,914 69,746 29.136 2,032,119 136,174 30.29 4,124,710
EUR 3,737 41.1562 153,801 2,226 38.4025 85,484 615 39.16 24,083
RMB 419,909 4.9355 2,072,461 553,986 4.6597 2,581,409 666,486 4.806 3,203,132
Nonmonetary items
USD 23,000 29.95 688,850 169,900 29.136 4,950,206 144,000 30.29 4,361,760
36. OPERATING SEGMENT FINANCIAL INFORMATION
Information reported to the chief operating decision maker for the purpose of resource allocation and
assessment of segment performance focuses on the types of goods or services delivered or provided.
Specifically, the Company‘s reportable segments under IFRS 8 ―Operating Segments‖ were as follows:
A Segment - retail segment
B Segment - trading segment
C Segment - manufacturing segment
D Segment - construction segment
Segment Revenue and Results
The analysis of the Company‘s revenue and results from continuing operations by reportable segment for
the years ended December 31, 2013 and 2012 was as follows:
2013
A Segment B Segment C Segment D Segment
Adjustment
and
Elimination Total
Operating revenue $ 21,254,030 $ 19,027,948 $ - $ 1,918,553 $ (6,996,667 ) $ 35,203,864 Operating costs (13,545,656 ) (15,143,310 ) - (1,687,902 ) 5,783,338 (24,593,530 )
Gross profit 7,708,374 3,884,638 - 230,651 (1,213,329 ) 10,610,334
Operating expenses (7,114,645 ) (3,859,919 ) - (125,244 ) 1,266,212 (9,833,596 ) Profit from operations $ 593,729 $ 24,719 $ - $ 105,407 $ 52,883 776,738
Nonoperating income and
expenses (44,016 )
Profit before income tax $ 732,722
2012
A Segment B Segment C Segment D Segment
Adjustment
and
Elimination Total
Operating revenue $ 20,370,405 $ 18,933,498 $ 2,062,048 $ 1,601,462 $ (7,715,271 ) $ 35,252,142
Operating costs (13,203,261 ) (15,051,588 ) (1,651,115 ) (1,362,391 ) 6,419,374 (24,848,981 ) Gross profit 7,167,144 3,881,910 410,933 239,071 (1,295,897 ) 10,403,161
Operating expenses (6,676,706 ) (3,922,081 ) (248,082 ) (151,738 ) 1,315,763 (9,682,844 )
Profit from operations $ 490,438 $ (40,171 ) $ 162,851 $ 87,333 $ 19,866 720,317 Nonoperating income and
expenses (33,590 )
Profit before income tax $ 686,727
All intercompany transactions have been eliminated upon consolidation for the years ended
December 31, 2013 and 2012.

-153-
Segment Assets and Liabilities
The analysis of the Company‘s assets and liabilities by reportable segment as of December 31, 2013 and
2012 was as follows:
2013
A Segment B Segment C Segment D Segment
Adjustment
and
Elimination Total
Assets $ 8,407,033 $ 16,406,444 $ - $ 1,867,210 $ (3,308,449 ) $ 23,372,238
Liabilities $ 8,407,033 $ 9,573,665 $ - $ 690,489 $ (2,092,109 ) $ 16,579,078
2012
A Segment B Segment C Segment D Segment
Adjustment
and
Elimination Total
Assets $ 9,642,569 $ 14,477,297 $ - $ 1,531,943 $ (3,754,234 ) $ 21,897,575 Liabilities $ 6,439,169 $ 9,856,335 $ - $ 1,544,549 $ (2,591,347 ) $ 15,248,706
All intercompany transactions have been eliminated upon consolidation for the years ended December 31,
2013 and 2012.
Geographical Information
The Company operates in two principal geographical areas - Asia and America. The Company‘s revenue
from continuing operations from external customers and information about its noncurrent assets by
geographical location were detailed below:
Revenue from External
Customers Noncurrent Assets
Year Ended December 31 Year Ended December 31
2013 2012 2013 2012
Asia $ 30,501,624 $ 30,432,580 $ 10,332,024 $ 12,155,322
America 4,195,312 4,451,594 - -
Europe 468,401 336,770 - -
Australia and others 38,527 31,198 - -
$ 35,203,864 $ 35,252,142 $ 10,332,024 $ 12,155,322
Noncurrent assets excluded those classified as financial instruments, deferred pension cost and deferred
income tax assets.
Major Customer
No individual customer accounted for at least 10% of consolidated revenue in 2013 and 2012.
37. FIRST-TIME ADOPTION OF IFRSs
a. Basis of the preparation for financial information under IFRSs
The Company‘s consolidated financial statements for the year ended December 31, 2013 were the first
IFRS financial statements. The Company‘s not only follows the significant accounting policies stated
in Note 4 but also applies the requirements under IFRS 1 ―First-time Adoption of IFRS‖ as the basis for
the preparation.

-154-
b. Impact on the transition to IFRSs
After transition to IFRSs, the impact on the Company‘s consolidated balance sheets and consolidated
statements of comprehensive income is stated as follows:
1) Reconciliation of consolidated balance sheet as of January 1, 2012
Effect of Transition to IFRSs
R.O.C. GAAP
Recognition and
Measurement Presentation IFRSs
Item Amount Difference Difference Amount Item Explanation
Current assets Current assets
Cash and cash equivalents $ 2,095,773 $ - $ (2,000 ) $ 2,093,773 Cash and cash equivalents 5) g)
Financial assets at fair value
through profit or loss - current
249,736 - - 249,736 Financial assets at fair value
through profit or loss - current
Available-for-sale financial assets -
current
2,141 - - 2,141 Available-for-sale financial assets -
current
Debt investments with no active
market - current
- - 2,000 2,000 Debt investments with no active
market - current
5) g)
Notes receivable 39,343 - - 39,343 Notes receivable
Trade receivables 2,922,471 - 30,090 2,952,561 Trade receivables 5) d)
Other receivables 310,823 - - 310,823 Other receivables
Other current financial assets 613 - - 613 Other current financial assets
Inventories 5,928,469 - - 5,928,469 Inventories
Prepayments 915,460 - - 915,460 Prepayments
Other current assets 260,980 - (28,712 ) 232,268 Other current assets 5) a)
Total current assets 12,725,809 - 1,378 12,727,187 Total current assets
Fund and investment Non-current assets
Long-term equity investments at
equity method
1 - - 1 Investments accounted for using
equity method
Available-for-sale financial assets -
non-current
30,450 - - 30,450 Available-for-sale financial assets -
non-current
Financial assets carried at cost -
non-current
109,989 - - 109,989 Financial assets measured at cost -
non-current
Debt investments with no active
market - non-current
50,000
-
-
50,000
Debt investments with no active
market - non-current
Total long-term investments 190,440 - -
Property, plant and equipment, net 7,709,067 34,855 - 7,743,922 Property, plant and equipment 4) e)
Intangible assets
Computer software cost 209,675 - - 209,675 Computer software
Goodwill 3,647,854 - - 3,647,854 Goodwill
Deferred pension cost 19,692 (19,692 ) - 5) c)
Total intangible assets 3,877,221 (19,692 ) -
Other assets
Refundable deposits paid 833,364 - - 833,364 Refundable deposits paid
Deferred income tax assets -
non-current
1,002,504 - 28,712 1,031,216 Deferred tax assets 5) a)
Other assets - other 1,224,003 - - 1,224,003 Other assets
Total other assets 3,059,871 - 28,712
14,880,474 Total non-current assets
Total assets $ 27,562,408 $ 15,163 $ 30,090 $ 27,607,661 Total
Current liabilities Current liabilities
Short-term borrowings $ 3,397,071 $ - $ - $ 3,397,071 Short-term borrowings
Short-term bills payable 159,842 - - 159,842 Short-term bills payable
Financial liabilities at fair value
through profit or loss - current
33,755 - - 33,755 Financial liabilities at fair value
through profit or loss - current
Notes payable 21,100 - - 21,100 Notes payable
Accounts payable 4,450,756 - - 4,450,756 Trade payables
Income tax payable 180,359 - - 180,359 Current tax liabilities
Other payables 1,860,066 23,107 - 1,883,173 Other payables 5) b)
Liability component of preferred
stocks - current
335,361 - - 335,361 Liability component of preferred
stocks - current
Advance receipts 457,602 197,870 - 655,472 Advance receipts 5) f)
Other current liabilities 582,137
(184,789 )
18,090
415,438
Other current liabilities 5) a), 5) d),
5) e)
Total current liabilities 11,478,049 36,188 18,090 11,532,327 Total current liabilities
Long-term liabilities Non-current liabilities
Long-term borrowings 7,150,590 - - 7,150,590 Long-term borrowings
Estimated land value increment tax
payable
41,791
-
(41,791 )
5) h)
Other liabilities
Accrued pension cost 291,829 114,936 - 406,765 Accrued pension liabilities 5) c)
Refundable deposits received 157,853 - - 157,853 Refundable deposits received
Deferred credit 1,173,942 (923,942 ) - 250,000 Deferred credit 5) e)
Other liabilities - others 37,654
49,233
53,791
140,678
Other non-current liabilities 4) e), 5) a),
5) h)
Total other liabilities 1,661,278 (759,773 ) 53,791
8,105,886 Total non-current liabilities
Total liabilities 20,331,708 (723,585 ) 30,090 19,638,213 Total liabilities
Equity attributable to stockholders of
the parent
Stockholders‘ equity
Capital Capital
Common stock 5,074,228 - - 5,074,228 Common stock
Capital surplus Capital surplus
Additional paid-in capital 689,395 - - 689,395 Additional paid-in capital
Treasury stock transactions 5,081 - - 5,081 Treasury stock transactions
Retained earnings Retained earnings
Legal reserve 744,159 - - 744,159 Legal reserve
Unappropriated earnings 610,508 815,801 - 1,426,309 Unappropriated earnings 4) b), 4) c),
4) d), 4) e),
5) b), 5) c),
5) e), 5) f)

-155-
(Continued) Effect of Transition to IFRSs
R.O.C. GAAP
Recognition and
Measurement Presentation IFRSs
Item Amount Difference Difference Amount Item Explanation
Others Other equity
Cumulative translation
adjustments
$ 133,069 $ (133,069 ) $ - $ - Exchange differences on
translating foreign operations
4) d)
Net loss not recognized as
pension costs
(104,021 ) 104,021 - - 5) c)
Unrealized holding gain on
available-for-sale financial
assets
1,682 - - 1,682 Unrealized holding gain on
available-for-sale financial
assets
Unrealized revaluation
increment
25,825 (25,825 ) - - 4) b)
Treasury shares (437,139 ) - - (437,139 ) Treasury shares
Total equity attributable to
stockholders of the parent
6,742,787 760,928 - 7,503,715 Total equity attributable to owners
of the Company
Minority interest 487,913 (22,180 ) - 465,733 Non-controlling interests
Total stockholders‘ equity 7,230,700 738,748 - 7,969,448 Total equity
Total liabilities and stockholders‘
equity
$ 27,562,408 $ 15,163 $ 30,090 $ 27,607,661 Total
(Concluded)
2) Reconciliation of consolidated balance sheet as of December 31, 2012
Effect of Transition to IFRSs
R.O.C. GAAP
Recognition and
Measurement Presentation IFRSs
Item Amount Difference Difference Amount Item Explanation
Current assets Current assets
Cash and cash equivalents $ 1,881,727 $ - $ - $ 1,881,727 Cash and cash equivalents 5) g)
Financial assets at fair value
through profit or loss - current
299,925 - - 299,925 Financial assets at fair value
through profit or loss - current
Notes receivable 5,207 - - 5,207 Notes receivable
Trade receivables 2,406,456 - 1,822 2,408,278 Trade receivables 5) d)
Other receivables 364,285 - - 364,285 Other receivables 5) g)
Other current financial assets 599 - - 599 Other current financial assets
Inventories 4,840,887 - - 4,840,887 Inventories
Other prepayments 547,474 - - 547,474 Prepayments
Other current assets 129,729 - (38,635 ) 91,094 Other current assets 5) a)
Total current assets 10,476,289 - (36,813 ) 10,439,476 Total current assets
Fund and investment Non-current assets
Financial assets carried at cost -
non-current
73,709 - - 73,709 Financial assets measured at cost -
non-current
Debt investments with no active
market - non-current
50,000
-
-
50,000 Debt investments with no active
market - non-current
Total long-term investments 123,709 - -
Property, plant and equipment, net 6,161,973 33,699 - 6,195,672 Property, plant and equipment 4) e)
Intangible assets
Computer software cost 219,730 - - 219,730 Computer software cost
Goodwill 2,880,444 (699,555 ) - 2,180,889 Goodwill 5) i)
Deferred pension cost 376 (376 ) - - 5) c)
Other intangible assets 68,737 (68,737 ) - - Other intangible assets 5) i)
Total intangible assets 3,169,287 (768,668 ) -
Other assets
Refundable deposits paid 841,804 - - 841,804 Refundable deposits paid
Deferred income tax assets -
non-current
1,028,117 - 38,635 1,066,752 Deferred tax assets 5) a)
Other assets - other 829,543 - - 829,543 Other non-current assets
Total other assets 2,699,464 - 38,635
11,458,099 Total non-current assets
Total assets $ 22,630,722 $ (734,969 ) $ 1,822 $ 21,897,575 Total
Current liabilities Current liabilities
Short-term borrowings $ 1,764,129 $ - $ - $ 1,764,129 Short-term borrowings
Financial liabilities at fair value
through profit or loss - current
21,085 - - 21,085 Financial liabilities at fair value
through profit and loss - current
Notes payable 18,372 - - 18,372 Notes payable
Accounts payable 4,512,979 - - 4,512,979 Trade payables
Income tax payable 134,184 - - 134,184 Current tax liabilities
Other payables 2,147,951 16,796 - 2,164,747 Other payables 5) b)
Advance receipts 411,071 193,002 - 604,073 Advance receipts 5) f)
Current portion of long-term
borrowings
200,000 - - 200,000 Current portion of long-term
borrowings
Other current liabilities 405,890
(184,789 )
1,822
222,923
Other current liabilities 5) a), 5) d),
5) e)
Total current liabilities 9,615,661 25,009 1,822 9,642,492 Total current liabilities
Long-term liabilities Non-current liabilities
Long-term borrowings 5,013,197 - - 5,013,197 Long-term borrowings
Other liabilities
Accrued pension cost 85,667 44,042 - 129,709 Accrued pension liabilities 5) c)
Refundable deposits received 180,471 - - 180,471 Refundable deposits received
Deferred credit 939,153 (739,153 ) - 200,000 Deferred credit 5) e)
Other liabilities - other 31,537
51,300
-
82,837
Other non-current liabilities 4) e), 5) a),
5) h)
Total other liabilities 1,236,828 (643,811 ) -
5,606,214 Total non-current liabilities
Total liabilities 15,865,686 (618,802 ) 1,822 15,248,706 Total liabilities
(Continued)

-156-
Effect of Transition to IFRSs
R.O.C. GAAP
Recognition and
Measurement Presentation IFRSs
Item Amount Difference Difference Amount Item Explanation
Stockholders‘ equity Stockholders‘ equity
Capital Capital
Common stock $ 5,219,555 $ - $ - $ 5,219,555 Common stock
Capital surplus Capital surplus
Additional paid-in capital 689,395 - - 689,395 Additional paid-in capital
Treasury stock transactions 5,081 - - 5,081 Treasury stock transactions
Retained earnings Retained earnings
Legal reserve 805,210 - - 805,210 Legal reserve
Unappropriated earnings 706,129 (42,968 ) - 663,161 Unappropriated earnings 4) b), 4) c),
4) d), 4) e),
5) b), 5) c),
5) e), 5) f),
5) i)
Others Other equity
Cumulative translation
adjustments
109,560 (133,069 ) - (23,509 ) Cumulative translation
adjustments
4) d)
Net loss not recognized as
pension costs
(59,870 ) 59,870 - - 5) c)
Unrealized holding loss on
available-for-sale financial
asset
25 - - 25 Unrealized holding loss on
available-for-sale financial
asset
Treasury shares (729,124 ) - - (729,124 ) Treasury shares
Total equity attributable to
stockholders of the parent
6,745,961
(116,167 )
-
6,629,794
Total equity attributable to owners
of the Company
Minority interest 19,075 - - 19,075 Non-controlling interests
Total stockholders‘ equity 6,765,036 (116,167 ) - 6,648,869 Total equity
Total liabilities and stockholders‘
equity
$ 22,630,722 $ (734,969 ) $ 1,822 $ 21,897,575 Total
(Concluded)
3) Reconciliation of consolidated statement of comprehensive income for the year ended December
31, 2012
Effect of Transition to IFRSs
R.O.C. GAAP
Recognition and
Measurement Presentation IFRSs
Item Amount Difference Difference Amount Item Explanation
Net operating revenue $ 35,247,274 $ 4,868 $ - $ 35,252,142 Operating revenue 5) f)
Operating costs 24,664,192 184,789 - 24,848,981 Operating costs 5) e)
Gross profit 10,583,082 (179,921 ) - 10,403,161 Gross profit
Operating expenses 9,679,286
3,558
-
9,682,844
Operating expenses 4) e), 5) b),
5) c)
Operating income 903,796 (183,479 ) - 720,317 Profit from operations
Nonoperating income and gains Nonoperating income and gains
Interest income 16,960 - - 16,960 Interest income
Investment gain recognized under
equity method
6,798 - - 6,798 Share of profit of associates and
joint ventures accounted for
using equity method
Gain on disposal of property, plant
and equipment
320 - - 320 Gain on disposal of property, plant
and equipment
Gain on sale of investments, net 48,482 - - 48,482 Gain on sale of investments, net
Foreign exchange gain, net 194,698 - - 194,698 Foreign exchange gain, net
Gain on valuation of financial
liabilities
11,588 - - 11,588 Net gain or loss on fair value
change of financial assets and
liabilities designated as at fair
value through profit or loss
Others 134,986 - - 134,986 Other income
Total non-operating income 413,832 - - 413,832 Total non-operating income
Nonoperating expenses and loss Nonoperating expenses and loss
Interest expenses 193,299 2,067 - 195,366 Interest expense 4) e)
Loss on disposal of property, plant,
and equipment
5,621 - - 5,621 Loss on disposal of property, plant,
and equipment
Amortization of liability
component of preferred stocks -
non-current
5,229 - - 5,229 Other expense
Dividends paid on liability
component of preferred stocks -
non-current
8,726 - - 8,726 Other expense
Loss on valuation of financial
assets
164,356 - - 164,356 Net gain or loss on fair value
change of financial assets and
liabilities designated as at fair
value through profit or loss
Reverse split loss 1,717 - - 1,717 Other expense
Others 66,407 - - 66,407 Other expense
Total non-operating expenses 445,355 2,067 - 447,422 Total non-operating expenses
Provision for income tax 872,273 (185,546 ) - 686,727 Profit before income tax
Income tax expense (122,033 ) - - (122,033 ) Income tax expense
Total consolidated net income $ 750,240 $ (185,546 ) $ - 564,494 Net profit for the year
(41,749 ) Exchange differences on translating
foreign operations
(6,823 ) Actuarial gain and loss arising from
defined benefit plans
(1,605 )
Unrealized loss on available-for-sale
financial assets
$ 514,517 Total comprehensive income for the
year
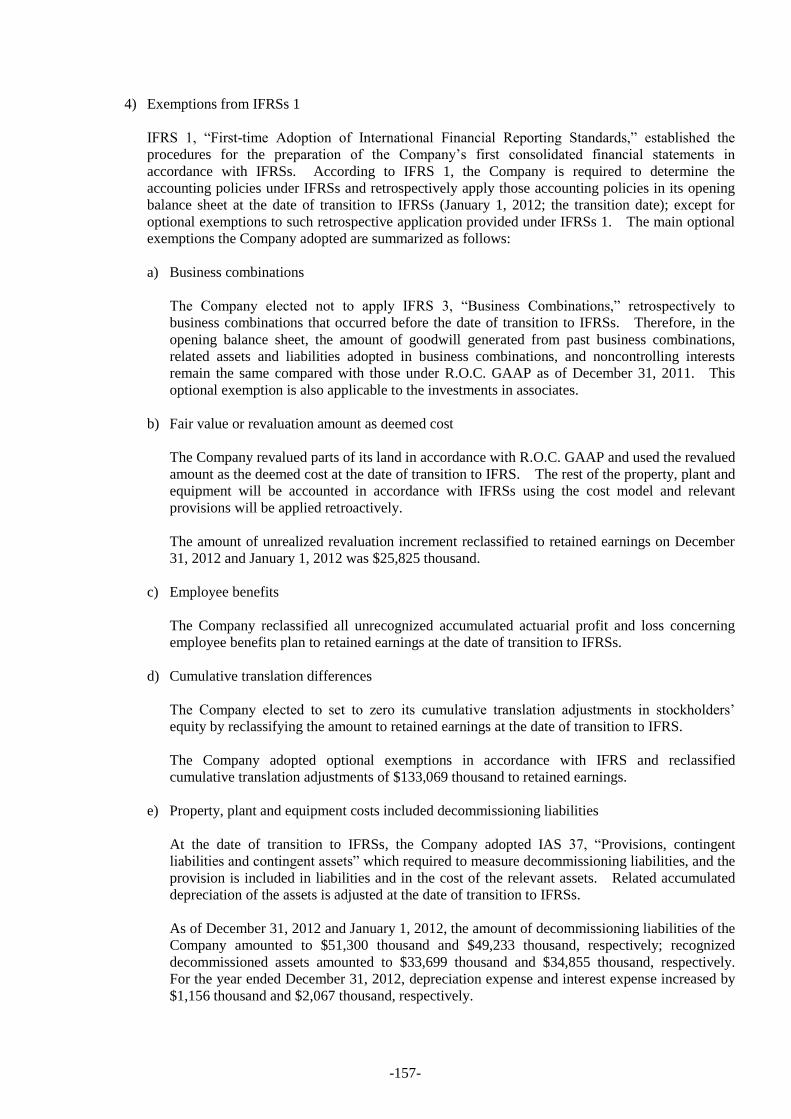
-157-
4) Exemptions from IFRSs 1
IFRS 1, ―First-time Adoption of International Financial Reporting Standards,‖ established the
procedures for the preparation of the Company‘s first consolidated financial statements in
accordance with IFRSs. According to IFRS 1, the Company is required to determine the
accounting policies under IFRSs and retrospectively apply those accounting policies in its opening
balance sheet at the date of transition to IFRSs (January 1, 2012; the transition date); except for
optional exemptions to such retrospective application provided under IFRSs 1. The main optional
exemptions the Company adopted are summarized as follows:
a) Business combinations
The Company elected not to apply IFRS 3, ―Business Combinations,‖ retrospectively to
business combinations that occurred before the date of transition to IFRSs. Therefore, in the
opening balance sheet, the amount of goodwill generated from past business combinations,
related assets and liabilities adopted in business combinations, and noncontrolling interests
remain the same compared with those under R.O.C. GAAP as of December 31, 2011. This
optional exemption is also applicable to the investments in associates.
b) Fair value or revaluation amount as deemed cost
The Company revalued parts of its land in accordance with R.O.C. GAAP and used the revalued
amount as the deemed cost at the date of transition to IFRS. The rest of the property, plant and
equipment will be accounted in accordance with IFRSs using the cost model and relevant
provisions will be applied retroactively.
The amount of unrealized revaluation increment reclassified to retained earnings on December
31, 2012 and January 1, 2012 was $25,825 thousand.
c) Employee benefits
The Company reclassified all unrecognized accumulated actuarial profit and loss concerning
employee benefits plan to retained earnings at the date of transition to IFRSs.
d) Cumulative translation differences
The Company elected to set to zero its cumulative translation adjustments in stockholders‘
equity by reclassifying the amount to retained earnings at the date of transition to IFRS.
The Company adopted optional exemptions in accordance with IFRS and reclassified
cumulative translation adjustments of $133,069 thousand to retained earnings.
e) Property, plant and equipment costs included decommissioning liabilities
At the date of transition to IFRSs, the Company adopted IAS 37, ―Provisions, contingent
liabilities and contingent assets‖ which required to measure decommissioning liabilities, and the
provision is included in liabilities and in the cost of the relevant assets. Related accumulated
depreciation of the assets is adjusted at the date of transition to IFRSs.
As of December 31, 2012 and January 1, 2012, the amount of decommissioning liabilities of the
Company amounted to $51,300 thousand and $49,233 thousand, respectively; recognized
decommissioned assets amounted to $33,699 thousand and $34,855 thousand, respectively.
For the year ended December 31, 2012, depreciation expense and interest expense increased by
$1,156 thousand and $2,067 thousand, respectively.
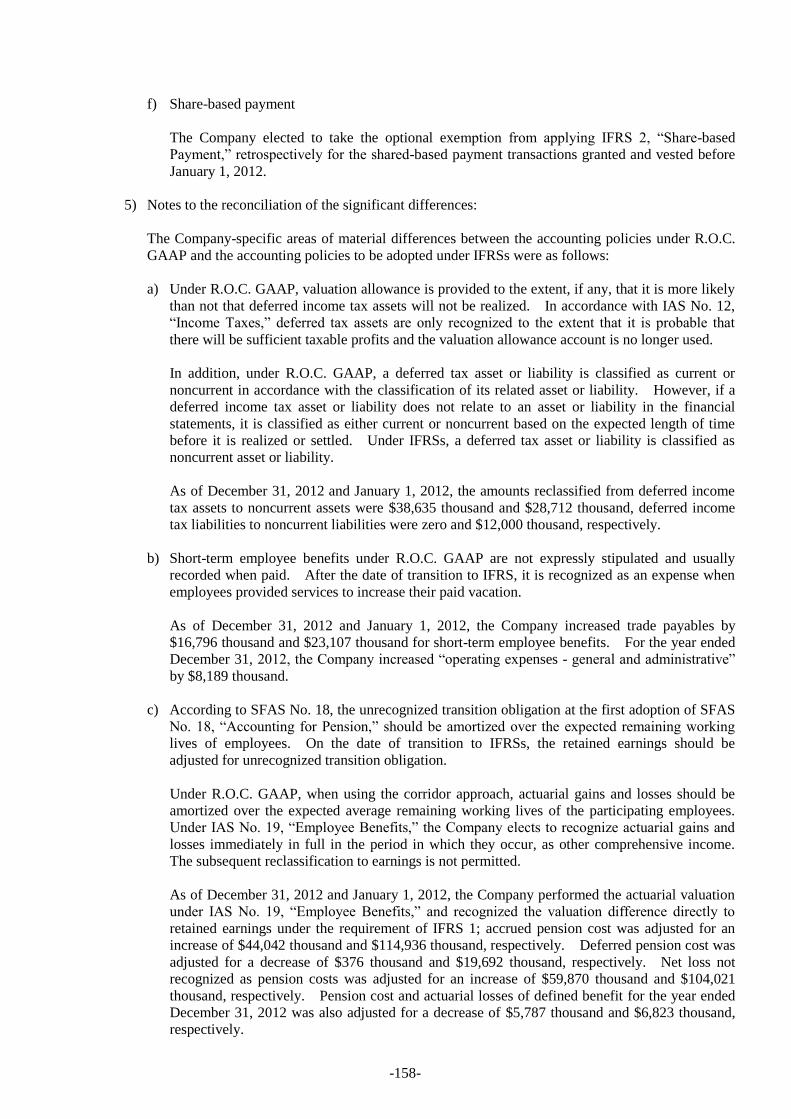
-158-
f) Share-based payment
The Company elected to take the optional exemption from applying IFRS 2, ―Share-based
Payment,‖ retrospectively for the shared-based payment transactions granted and vested before
January 1, 2012.
5) Notes to the reconciliation of the significant differences:
The Company-specific areas of material differences between the accounting policies under R.O.C.
GAAP and the accounting policies to be adopted under IFRSs were as follows:
a) Under R.O.C. GAAP, valuation allowance is provided to the extent, if any, that it is more likely
than not that deferred income tax assets will not be realized. In accordance with IAS No. 12,
―Income Taxes,‖ deferred tax assets are only recognized to the extent that it is probable that
there will be sufficient taxable profits and the valuation allowance account is no longer used.
In addition, under R.O.C. GAAP, a deferred tax asset or liability is classified as current or
noncurrent in accordance with the classification of its related asset or liability. However, if a
deferred income tax asset or liability does not relate to an asset or liability in the financial
statements, it is classified as either current or noncurrent based on the expected length of time
before it is realized or settled. Under IFRSs, a deferred tax asset or liability is classified as
noncurrent asset or liability.
As of December 31, 2012 and January 1, 2012, the amounts reclassified from deferred income
tax assets to noncurrent assets were $38,635 thousand and $28,712 thousand, deferred income
tax liabilities to noncurrent liabilities were zero and $12,000 thousand, respectively.
b) Short-term employee benefits under R.O.C. GAAP are not expressly stipulated and usually
recorded when paid. After the date of transition to IFRS, it is recognized as an expense when
employees provided services to increase their paid vacation.
As of December 31, 2012 and January 1, 2012, the Company increased trade payables by
$16,796 thousand and $23,107 thousand for short-term employee benefits. For the year ended
December 31, 2012, the Company increased ―operating expenses - general and administrative‖
by $8,189 thousand.
c) According to SFAS No. 18, the unrecognized transition obligation at the first adoption of SFAS
No. 18, ―Accounting for Pension,‖ should be amortized over the expected remaining working
lives of employees. On the date of transition to IFRSs, the retained earnings should be
adjusted for unrecognized transition obligation.
Under R.O.C. GAAP, when using the corridor approach, actuarial gains and losses should be
amortized over the expected average remaining working lives of the participating employees.
Under IAS No. 19, ―Employee Benefits,‖ the Company elects to recognize actuarial gains and
losses immediately in full in the period in which they occur, as other comprehensive income.
The subsequent reclassification to earnings is not permitted.
As of December 31, 2012 and January 1, 2012, the Company performed the actuarial valuation
under IAS No. 19, ―Employee Benefits,‖ and recognized the valuation difference directly to
retained earnings under the requirement of IFRS 1; accrued pension cost was adjusted for an
increase of $44,042 thousand and $114,936 thousand, respectively. Deferred pension cost was
adjusted for a decrease of $376 thousand and $19,692 thousand, respectively. Net loss not
recognized as pension costs was adjusted for an increase of $59,870 thousand and $104,021
thousand, respectively. Pension cost and actuarial losses of defined benefit for the year ended
December 31, 2012 was also adjusted for a decrease of $5,787 thousand and $6,823 thousand,
respectively.

-159-
d) Under R.O.C. GAAP, provisions for estimated sales returns and others are recognized as a
reduction in revenue in the period, the related revenue is recognized based on historical
experience. Allowance for sales returns and others is recorded as a deduction in trade
receivables. Under IFRSs, the allowance for sales returns and others is a present obligation
with uncertain timing and an amount that arises from past events and is therefore reclassified as
provisions (classified under current liabilities) in accordance with IAS No. 37, ―Provisions,
Contingent Liabilities and Contingent Assets.‖
As of December 31, 2012 and January 1, 2012, the amounts reclassified from allowance for
sales returns and others to provisions were $1,822 thousand and $30,090 thousand, respectively.
e) Under R.O.C. GAAP, when the nature of the lessee‘s sale and leaseback transaction is operating
lease, the profit from the sale and leaseback is required to be recognized and deferred evenly
during the lease term. The present value of total rental is compared to the fair value of sold
asset; excess of present value of rental is immediately recognized as loss and excess of fair
value is the deferred amount. Under IFRSs, if the sale price is fair value, the sale and
leaseback should be recognized immediately to the profit or loss; sale price is higher than the
fair value should be deferred and expect to be amortized over lease term.
As of December 31, 2012 and January 1, 2012, the Company adjusted to reduce unrealized gain
in the amount of $923,942 thousand and $1,108,731 thousand, respectively. In addition, for
the year ended December 31, 2012, the amortization increased the lease costs by $184,789
thousand.
f) Under R.O.C. GAAP, when the reward points are generated, the liabilities and marketing costs
should be estimated and recognized. Under IFRSs, part of the sales revenue is reward point
revenue; fair value of sales of goods and reward point is the basis in calculating the revenue;
when the convertible obligation actually materialized or failed, the related award points should
be recognized as revenue.
As of December 31, 2012 and January 1, 2012, deferred reward points revenues were $193,002
thousand and $197,870 thousand, respectively. For the year ended December 31, 2012, due to
the realized convertible obligations, revenue was recognized for $4,868 thousand.
g) Under R.O.C. GAAP, the term ―Cash and cash equivalents‖ used in the financial statements
includes cash on hand, demand deposits, check deposits, time deposits that are cancellable but
without any loss of principal and negotiable certificates of deposit that are readily salable
without any loss of principal. However, under IFRSs, cash equivalents are held for the
purpose of meeting short-term cash commitments rather than for investment or other purposes.
An investment normally qualifies as a cash equivalent only when it has a short maturity of three
months or less from the date of acquisition. Some certificates of deposit the Company held
had maturity of more than three months from the date of investment; therefore, they were
reclassified from cash and cash equivalents to debt investments with no active market.
As of December 31, 2012 and January 1, 2012, the amounts reclassified from cash and cash
equivalents to other financial assets were zero and $2,000 thousand, respectively.
h) By the Guidelines Governing the Preparation of Financial Reports by Securities Issuers for land
revaluation increment tax payable should be classified as long-term liabilities. According to
IFRS, if an entity elected to use the revaluation amount of land as the deemed cost under its
first-time adoption of IFRS, the related reserve for land revaluation increment tax must be
reclassified into deferred income tax liabilities - land value increment tax.
-160-
As of December 31, 2012 and January 1, 2012, the amount of reserve for land revaluation
increment tax reclassified to deferred income tax liabilities - non-current was zero and $41,791
thousand, respectively.
i) Under R.O.C. GAAP, the acquisition cost of investment is allocated to the assets acquired and
liabilities assumed on the basis of their fair values at the date of acquisition, the acquisition cost
in excess of the fair value of the identifiable net assets acquired is recognized as other tangible
assets and goodwill. Under IFRSs, changes in the Company‘s ownership interests in
subsidiaries that do not result in the Company losing control over the subsidiaries are accounted
for as equity transactions, and the adjustment is debited to capital surplus, but if the capital
surplus recognized from long-term investments is insufficient, the shortage is debited to retained
earnings. As of December 31, 2012, retained earnings were adjusted for a decrease of
$768,292 thousand, other tangible assets were adjusted for a decrease of $68,737 thousand and
goodwill was adjusted for a decrease of $699,555 thousand.

-161-
VII. Review of Financial Conditions, Operating Results, and Risk Management
7.1 Analysis of Financial Status
Unit:NTD$ thousand
Year
Item 2012 2013
Difference
Amount %
Current Assets 10,439,476 12,011,301 1,571,825 15.06%
Long-term Investment 6,195,672 6,208,064 12,392 0.20%
Fixed Assets 219,730 214,036 (5,694) (2.59%)
Other Assets 5,042,697 4,938,837 (103,860) (2.06%)
Total Assets 21,897,575 23,372,238 1,474,663 6.73%
Current Liabilities 9,642,492 10,804,486 1,161,994 12.05%
Long-term Liabilities 593,017 546,977 (46,040) (7.76%)
Other Liabilities 15,248,706 16,579,078 1,330,372 8.72%
Total Liabilities 5,219,555 5,219,555 0 0.00%
Capital stock 694,476 694,476 0 0.00%
Capital surplus 1,468,371 1,580,149 111,778 7.61%
Retained Earnings (23,484) (2,390) 21,094 *(89.82%)
Other Adjustments (729,124) (729,124) 0 0.00%
Total Stockholders' Equity 6,648,869 6,793,160 144,291 2.17%
Analysis of changes in financial ratios:
The IFRSs cumulative translation adjustment is due to the exchange differences in the translation
of financial statements by foreign operated institutions.
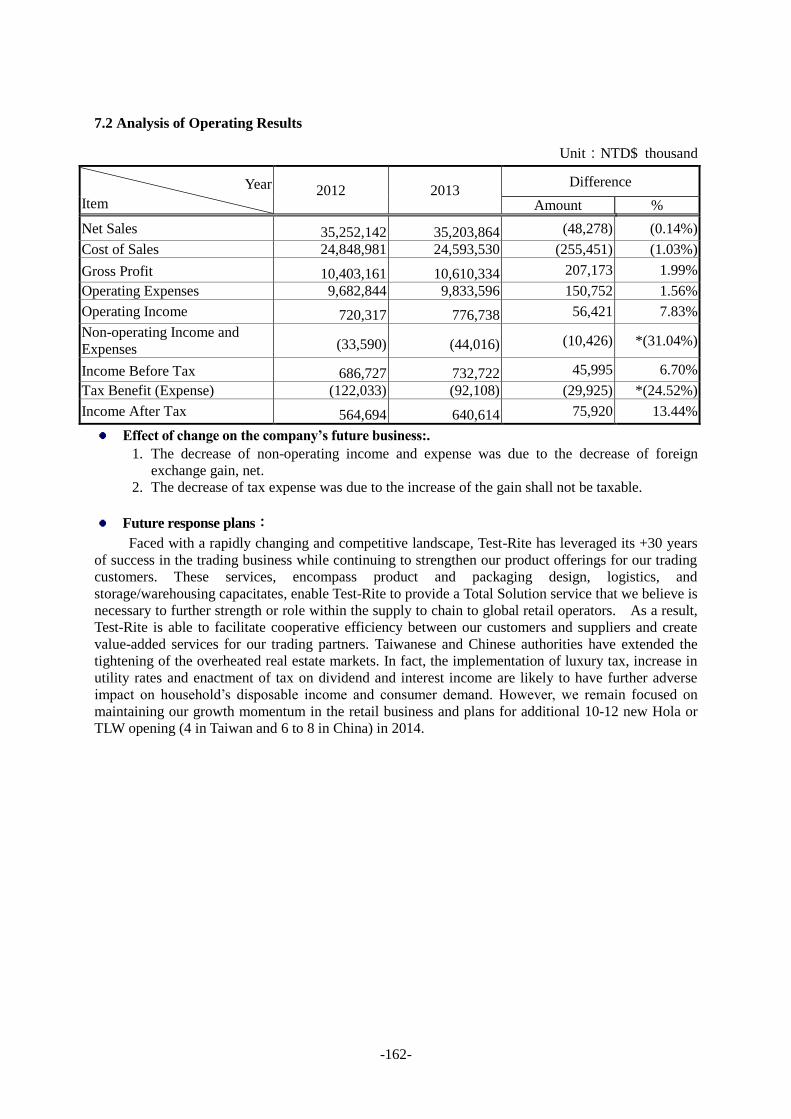
-162-
7.2 Analysis of Operating Results
Unit:NTD$ thousand
Year
Item 2012 2013
Difference
Amount %
Net Sales 35,252,142 35,203,864 (48,278) (0.14%)
Cost of Sales 24,848,981 24,593,530 (255,451) (1.03%)
Gross Profit 10,403,161 10,610,334 207,173 1.99%
Operating Expenses 9,682,844 9,833,596 150,752 1.56%
Operating Income 720,317 776,738 56,421 7.83%
Non-operating Income and
Expenses (33,590) (44,016) (10,426) *(31.04%)
Income Before Tax 686,727 732,722 45,995 6.70%
Tax Benefit (Expense) (122,033) (92,108) (29,925) *(24.52%)
Income After Tax 564,694 640,614 75,920 13.44%
Effect of change on the company’s future business:.
1. The decrease of non-operating income and expense was due to the decrease of foreign
exchange gain, net.
2. The decrease of tax expense was due to the increase of the gain shall not be taxable.
Future response plans:
Faced with a rapidly changing and competitive landscape, Test-Rite has leveraged its +30 years
of success in the trading business while continuing to strengthen our product offerings for our trading
customers. These services, encompass product and packaging design, logistics, and
storage/warehousing capacitates, enable Test-Rite to provide a Total Solution service that we believe is
necessary to further strength or role within the supply to chain to global retail operators. As a result,
Test-Rite is able to facilitate cooperative efficiency between our customers and suppliers and create
value-added services for our trading partners. Taiwanese and Chinese authorities have extended the
tightening of the overheated real estate markets. In fact, the implementation of luxury tax, increase in
utility rates and enactment of tax on dividend and interest income are likely to have further adverse
impact on household‘s disposable income and consumer demand. However, we remain focused on
maintaining our growth momentum in the retail business and plans for additional 10-12 new Hola or
TLW opening (4 in Taiwan and 6 to 8 in China) in 2014.
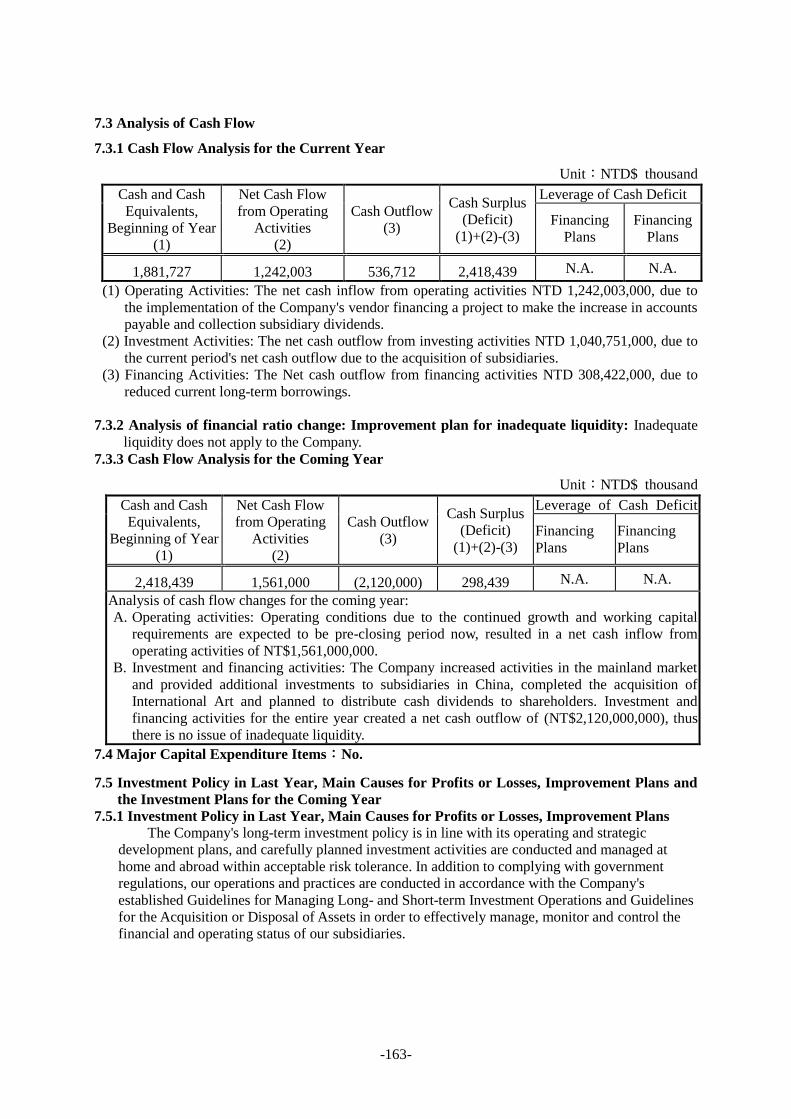
-163-
7.3 Analysis of Cash Flow
7.3.1 Cash Flow Analysis for the Current Year
Unit:NTD$ thousand
Cash and Cash
Equivalents,
Beginning of Year
(1)
Net Cash Flow
from Operating
Activities
(2)
Cash Outflow
(3)
Cash Surplus
(Deficit)
(1)+(2)-(3)
Leverage of Cash Deficit
Financing
Plans
Financing
Plans
1,881,727 1,242,003 536,712 2,418,439 N.A. N.A.
(1) Operating Activities: The net cash inflow from operating activities NTD 1,242,003,000, due to
the implementation of the Company's vendor financing a project to make the increase in accounts
payable and collection subsidiary dividends.
(2) Investment Activities: The net cash outflow from investing activities NTD 1,040,751,000, due to
the current period's net cash outflow due to the acquisition of subsidiaries.
(3) Financing Activities: The Net cash outflow from financing activities NTD 308,422,000, due to
reduced current long-term borrowings.
7.3.2 Analysis of financial ratio change: Improvement plan for inadequate liquidity: Inadequate
liquidity does not apply to the Company.
7.3.3 Cash Flow Analysis for the Coming Year
Unit:NTD$ thousand
Cash and Cash
Equivalents,
Beginning of Year
(1)
Net Cash Flow
from Operating
Activities
(2)
Cash Outflow
(3)
Cash Surplus
(Deficit)
(1)+(2)-(3)
Leverage of Cash Deficit
Financing
Plans
Financing
Plans
2,418,439 1,561,000 (2,120,000) 298,439 N.A. N.A.
Analysis of cash flow changes for the coming year:
A. Operating activities: Operating conditions due to the continued growth and working capital
requirements are expected to be pre-closing period now, resulted in a net cash inflow from
operating activities of NT$1,561,000,000.
B. Investment and financing activities: The Company increased activities in the mainland market
and provided additional investments to subsidiaries in China, completed the acquisition of
International Art and planned to distribute cash dividends to shareholders. Investment and
financing activities for the entire year created a net cash outflow of (NT$2,120,000,000), thus
there is no issue of inadequate liquidity.
7.4 Major Capital Expenditure Items:No.
7.5 Investment Policy in Last Year, Main Causes for Profits or Losses, Improvement Plans and
the Investment Plans for the Coming Year
7.5.1 Investment Policy in Last Year, Main Causes for Profits or Losses, Improvement Plans
The Company's long-term investment policy is in line with its operating and strategic
development plans, and carefully planned investment activities are conducted and managed at
home and abroad within acceptable risk tolerance. In addition to complying with government
regulations, our operations and practices are conducted in accordance with the Company's
established Guidelines for Managing Long- and Short-term Investment Operations and Guidelines
for the Acquisition or Disposal of Assets in order to effectively manage, monitor and control the
financial and operating status of our subsidiaries.
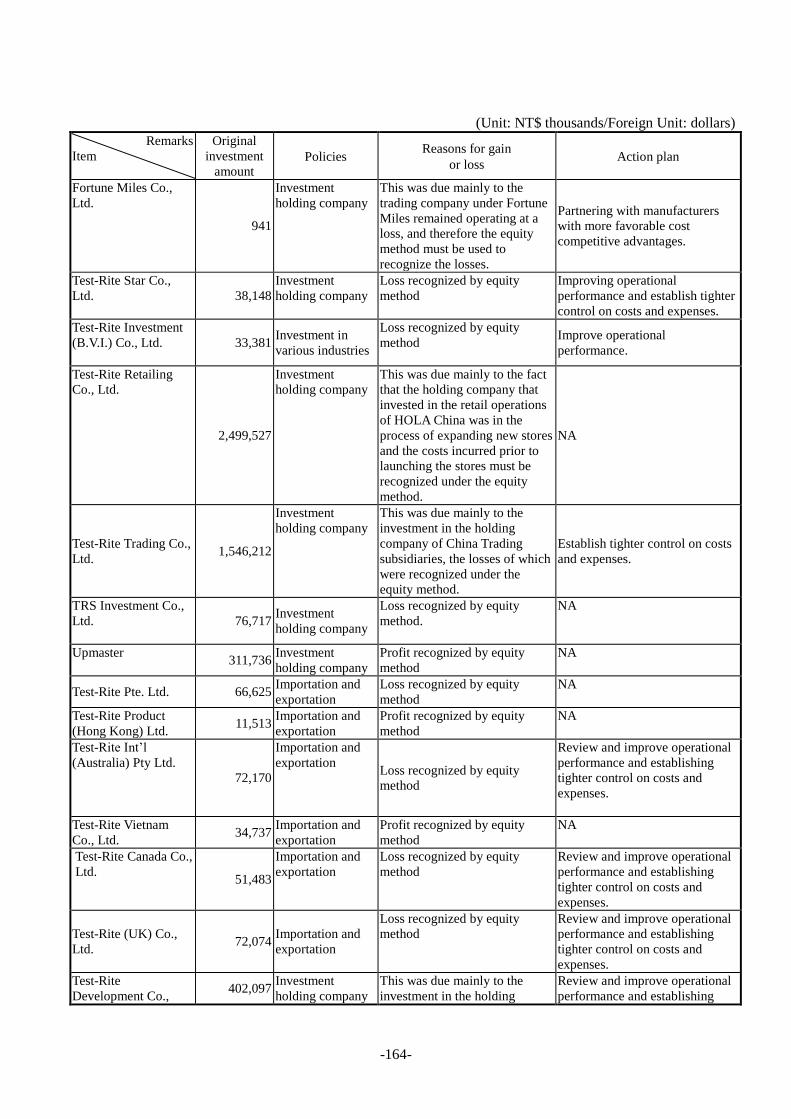
-164-
(Unit: NT$ thousands/Foreign Unit: dollars)
Remarks
Item
Original
investment
amount Policies
Reasons for gain
or loss Action plan
Fortune Miles Co.,
Ltd.
941
Investment
holding company
This was due mainly to the
trading company under Fortune
Miles remained operating at a
loss, and therefore the equity
method must be used to
recognize the losses.
Partnering with manufacturers
with more favorable cost
competitive advantages.
Test-Rite Star Co.,
Ltd. 38,148
Investment
holding company
Loss recognized by equity
method
Improving operational
performance and establish tighter
control on costs and expenses.
Test-Rite Investment
(B.V.I.) Co., Ltd. 33,381 Investment in
various industries
Loss recognized by equity
method
Improve operational
performance.
Test-Rite Retailing
Co., Ltd.
2,499,527
Investment
holding company
This was due mainly to the fact
that the holding company that
invested in the retail operations
of HOLA China was in the
process of expanding new stores
and the costs incurred prior to
launching the stores must be
recognized under the equity
method.
NA
Test-Rite Trading Co.,
Ltd. 1,546,212
Investment
holding company
This was due mainly to the
investment in the holding
company of China Trading
subsidiaries, the losses of which
were recognized under the
equity method.
Establish tighter control on costs
and expenses.
TRS Investment Co.,
Ltd. 76,717 Investment
holding company
Loss recognized by equity
method.
NA
Upmaster 311,736
Investment
holding company
Profit recognized by equity
method
NA
Test-Rite Pte. Ltd. 66,625 Importation and
exportation
Loss recognized by equity
method
NA
Test-Rite Product
(Hong Kong) Ltd. 11,513
Importation and
exportation
Profit recognized by equity
method
NA
Test-Rite Int‘l
(Australia) Pty Ltd.
72,170
Importation and
exportation Loss recognized by equity
method
Review and improve operational
performance and establishing
tighter control on costs and
expenses.
Test-Rite Vietnam
Co., Ltd. 34,737
Importation and
exportation
Profit recognized by equity
method
NA
Test-Rite Canada Co.,
Ltd. 51,483
Importation and
exportation
Loss recognized by equity
method
Review and improve operational
performance and establishing
tighter control on costs and
expenses.
Test-Rite (UK) Co.,
Ltd. 72,074
Importation and
exportation
Loss recognized by equity
method
Review and improve operational
performance and establishing
tighter control on costs and
expenses.
Test-Rite
Development Co., 402,097
Investment
holding company
This was due mainly to the
investment in the holding
Review and improve operational
performance and establishing
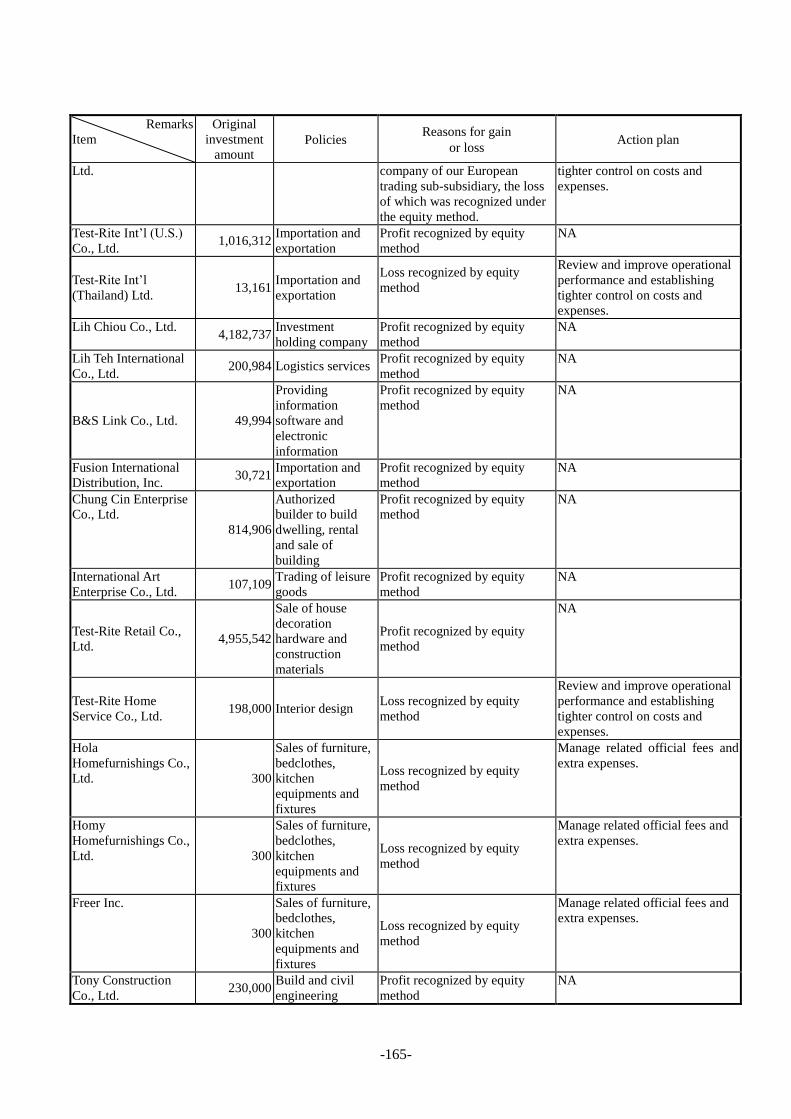
-165-
Remarks
Item
Original
investment
amount Policies
Reasons for gain
or loss Action plan
Ltd. company of our European
trading sub-subsidiary, the loss
of which was recognized under
the equity method.
tighter control on costs and
expenses.
Test-Rite Int‘l (U.S.)
Co., Ltd. 1,016,312
Importation and
exportation
Profit recognized by equity
method
NA
Test-Rite Int‘l
(Thailand) Ltd. 13,161
Importation and
exportation
Loss recognized by equity
method
Review and improve operational
performance and establishing
tighter control on costs and
expenses.
Lih Chiou Co., Ltd. 4,182,737
Investment
holding company
Profit recognized by equity
method
NA
Lih Teh International
Co., Ltd. 200,984 Logistics services
Profit recognized by equity
method
NA
B&S Link Co., Ltd. 49,994
Providing
information
software and
electronic
information
Profit recognized by equity
method
NA
Fusion International
Distribution, Inc. 30,721
Importation and
exportation
Profit recognized by equity
method
NA
Chung Cin Enterprise
Co., Ltd.
814,906
Authorized
builder to build
dwelling, rental
and sale of
building
Profit recognized by equity
method
NA
International Art
Enterprise Co., Ltd. 107,109
Trading of leisure
goods
Profit recognized by equity
method
NA
Test-Rite Retail Co.,
Ltd. 4,955,542
Sale of house
decoration
hardware and
construction
materials
Profit recognized by equity
method
NA
Test-Rite Home
Service Co., Ltd. 198,000 Interior design
Loss recognized by equity
method
Review and improve operational
performance and establishing
tighter control on costs and
expenses.
Hola
Homefurnishings Co.,
Ltd. 300
Sales of furniture,
bedclothes,
kitchen
equipments and
fixtures
Loss recognized by equity
method
Manage related official fees and
extra expenses.
Homy
Homefurnishings Co.,
Ltd. 300
Sales of furniture,
bedclothes,
kitchen
equipments and
fixtures
Loss recognized by equity
method
Manage related official fees and
extra expenses.
Freer Inc.
300
Sales of furniture,
bedclothes,
kitchen
equipments and
fixtures
Loss recognized by equity
method
Manage related official fees and
extra expenses.
Tony Construction
Co., Ltd. 230,000
Build and civil
engineering
Profit recognized by equity
method
NA
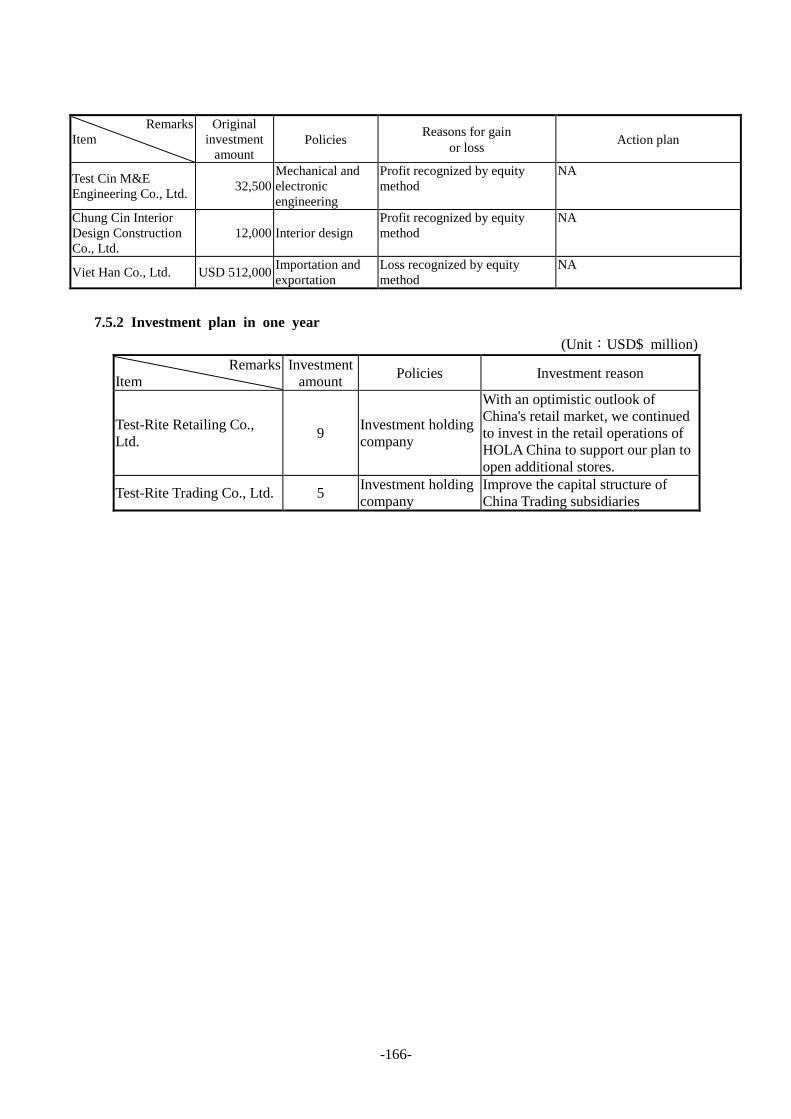
-166-
Remarks
Item
Original
investment
amount Policies
Reasons for gain
or loss Action plan
Test Cin M&E
Engineering Co., Ltd. 32,500
Mechanical and
electronic
engineering
Profit recognized by equity
method
NA
Chung Cin Interior
Design Construction
Co., Ltd.
12,000 Interior design
Profit recognized by equity
method
NA
Viet Han Co., Ltd. USD 512,000 Importation and
exportation
Loss recognized by equity
method
NA
7.5.2 Investment plan in one year
(Unit:USD$ million)
Remarks
Item
Investment
amount Policies Investment reason
Test-Rite Retailing Co.,
Ltd. 9
Investment holding
company
With an optimistic outlook of
China's retail market, we continued
to invest in the retail operations of
HOLA China to support our plan to
open additional stores.
Test-Rite Trading Co., Ltd. 5 Investment holding
company
Improve the capital structure of
China Trading subsidiaries

-167-
7.6 Analysis of Risk Management
7.6.1 Effects of Changes in Interest Rates, Foreign Exchange Rates and Inflation on Corporate
Finance, and Future Response Measures
1. Interest rate
Unit:NT$ thousand
Item/Year 2012 2013
Ratio of liabilities to assets(%) 69.63 70.93
Interest Expense 195,366 152,665
Income before Tax 686,727 732,722
Ratio of Interest Expense to income before tax(%) 28.45 20.84
(1) The impact to company‘s profit and loss: The Company's interest expense on loans for the
most recent two years, 2012 and 2013, was NT$195,366,000 and NT$152,665,000,
respectively. Interest expense on borrowings decrease over the previous year, mainly due to
the implementation of vendor financing projects and repayment of bank borrowings.
(2) Future measurement: Because the profitability of both the Company‘s core business and
investment business is sustainable, the amount of debt borrowed can be gradually repaid,
financing amounts for future operating needs can be gradually decreased, and interest
expenses can be lowered accordingly. The Company shall continue to closely monitor
market interest rate trends, adjust its capital structure as needed, allocate capital as efficiently,
and lower cost of capital.
2. Foreign exchange rates
(1) The impact to company‘s profit and loss:
Unit:NT$ thousand
Item/Year 2012 2013
Foreign exchange gain 194,698 1,553
Operating revenues 35,252,142 35,203,864
Income before income tax 686,727 732,722
Foreign exchange gain / Operating revenues(%) 0.55% 0.004%
Foreign exchange gain / Income before income tax(%) 28.35% 0.21%
(2) Future measurement: The Company is a professional trading company focusing
predominantly on export trade. For the most recent fiscal year, our export revenue accounted
for approximately 80% of total revenue. We place orders with suppliers as soon as we
receive purchase orders from customers. In accordance with the Company's order and sales
process, we have adopted a two-way quotation system to shorten the entire order
management process and are able to provide quotations that reflect the latest foreign
exchange rate trends. In addition, the Company pays close attention to changes of the global
economic landscape and fluctuations of foreign exchange rates of major currencies. Our
overseas subsidiaries also constantly provide us with local market news and conditions,
thereby enabling us to make adjustments to our hedging approaches.
In addition, the Company assesses the market price risk of financial instruments for
transaction purposes based on market prices, and establishes stop-loss points based on our risk
tolerance level. As for non-transactional financial instruments, since losses incurred from
interest or exchange rate fluctuations generally offset the gain or loss of hedged items, market
price risk is not significant.
-168-
3. Inflation
Affected by rising costs of energy and raw materials, countries around the world are faced
with the threat of inflation. Although inflation has very limited effect on the Company due to
the nature of our industry, we will continue to observe its impact closely.
7.6.2 Policies, Main Causes of Gain or Loss and Future Response Measures with Respect to
High-risk, High-leveraged Investments, Lending or Endorsement Guarantees, and
Derivatives Transactions
The Company is committed to the development of our primary business and does not
engage in high-risk or highly-leveraged investment activities.
Any loans extended by the Company to third parties require approval by the Board and
conducted in compliance with the Company‘s Procedure for Extending Loans to Third Parties.
The Company provides guarantees to affiliated enterprises that it owns in excess of 50% in
equity and to other enterprises with which it conducts business. The total amount of guarantees
and guarantee provided to a single enterprise are well within the allowable limits. We have
provided all guarantees in compliance with the Company's Procedure for Providing Guarantees,
and they have received prior approval from or are recognized retroactively by the Board. These
guarantees are not expected to have a major impact on the Company's financial position.
In addition, with respect to derivatives trading, the Company is an export-oriented trading
firm; as such, we engage in hedging measures such as forward foreign exchange and foreign
currency option contracts to hedge the risk of exchange rate fluctuations. As option contracts
expire, even if the counterparties elect to exercise their contractual obligations, the Company
shall conduct settlements with the foreign currency claims that have reached the expiration
dates. The market price risk from exchange rate fluctuations and demand for cash in the future
have no significant impact on the Company and our counterparties are reputable banks with
excellent credit ratings. As a result, the likelihood of credit risk is limited. In addition, the
procedure for conducting derivatives trading is compliant with the Company's Procedure for
Trading Derivative Instruments, and the amount traded is also within the authorized limits. We
also provide monthly reports in accordance with regulations and therefore no significant impact
on the Company's financial position is expected.
7.6.3 Future Research & Development Projects and Corresponding Budget:None.
7.6.4 Effects of and Response to Changes in Policies and Regulations Relating to Corporate
Finance and Sales
As the Company exports mainly to the Americas and Europe, there have not been
occurrences of major incidents regarding policy or legislative changes in foreign countries in
recent years that have had a major impact on the Company's financial position or business
operations.
The Company will continue to improve the access to and collection of business intelligence
in our major overseas markets in order gain better control of our business operations and
financial position. In addition, the Company's legal department is charged with the
responsibility of monitoring major policy and legislative changes at home and abroad in order
to be able to propose appropriate response measures for the Company in a timely manner.
7.6.5 Effects of and Response to Changes in Technology and in Industry Relating to Corporate
Finance and Sales:
The Company has established the B&S Link global electronic trading platform, which
employs information technology to streamline supply chain management operations. In order to
strengthen the partnerships between Test Rite Group, suppliers and banks as well as to improve
the overall value of the supply chain and to create a win-win scenario for all parties involved,
Test Rite Group are collaborating with a number of banks and the subsidiary B&S Link to offer
a comprehensive, convenient and preferential online financing services program to our
suppliers, fully integrating information flow, business flow and cash flow. With this platform,
we have pioneered a brand new cross-sector cooperative business model. Thereby have greater
-169-
financial resources to expand our business to grow, but also enables more suppliers all aspects
of business development.
7.6.6 The Impact of Changes in Corporate Image on Corporate Risk Management, and the
Company’s Response Measures
The Company has a reputable corporate image and there has not been any changes that
would require enterprise crisis management.
7.6.7 Expected Benefits from, Risks Relating to and Response to Merger and Acquisition Plans:
None.
7.6.8 Expected Benefits from, Risks Relating to and Response to Factory Expansion Plans:The
Company is a trading company and does not own any manufacturing plants following the sale
of Tung Lung Metal, and we do not have any additional plans to invest in factories.
7.6.9 Risks Relating to and Response to Excessive Concentration of Purchasing Sources and
Excessive Customer Concentration:The Company does not have any issues associated with
the consolidation of sales or purchasing operations.
7.6.10 Effects of, Risks Relating to and Response to Large Share Transfers or Changes in
Shareholdings by Directors, Supervisors, or Shareholders with Shareholdings of over
10%:The shareholdings of the Company‘s directors and supervisors have been stable during
the last few years, and there have been no major transfers or changes of shares.
7.6.11 Effects of, Risks Relating to and Response to Changes in Control over the Company:The
structure of our principal shareholders is solid, and we have a strong professional management
team. There is minimal risk that a change in control would cause damage to the Company.
7.6.12 Litigation or Non-litigation Matters:None.
7.6.13 Other Major Risks:None.

-170-
VIII. Special Disclosure
8.1 Summary of Affiliated Companies
8.1.1 Investment Holding Structure
TRIC
100%
Test rite retail Co
., Ltd.
10
0%
Test Rite H
Om
e Service Co
., Ltd
. 10
0%
Lih C
hio
u C
o.,
Ltd. 1
00
%
Test Rite R
etail co
., Ltd. 7
5%
HO
LA
Ho
mefu
rnish
ings
Co
., Ltd. 100%
HO
MY
Ho
mefu
rnish
ings C
o.,
Ltd. 100%
Freer In
c.
100%
Fusio
n In
ternatio
nal D
ist. In
c. 10
0%
Lih Teh
Intern
ation
al Co
., Ltd
. 10
0%
B&
S Link C
o.,
Ltd. 1
00
%
Intern
ation
al Art en
terprise
Co
., Ltd. 1
00
%
Ch
un
g Cin
Enterp
rise Co
., Ltd.
10
0%
Ton
y Co
nstru
ction
C
o., Ltd
. 100%
Test Cin
Interio
r D
esign co
nstru
ction
C
o., Ltd
. 100%
Test Cin
M&
E en
ginee
ring C
o., Ltd
. 10
0%
V
iet Nan
Co
., Ltd
. 100%
TR-P
TE
10
0%
TR-TH
AILA
ND
1
00
%
TR-V
N
95
%
TR-H
K
10
0%
TR-U
S
10
0%
TR-C
AN
AD
A
10
0%
TR-A
USTR
ALIA
1
00
%
TR-U
K
10
0%
TR D
EVELO
PM
ENT
10
0%
TR STA
R
10
0%
TR IN
VESTM
ENT
10
0%
TR R
ETAILIN
G
10
0%
TR TR
AD
ING
10
0%
TRS IN
VESTM
ENT
10
0%
FOR
TUN
E MILES
10
0%
UP
MA
STER
10
0%
TR-U
S 1
00
%
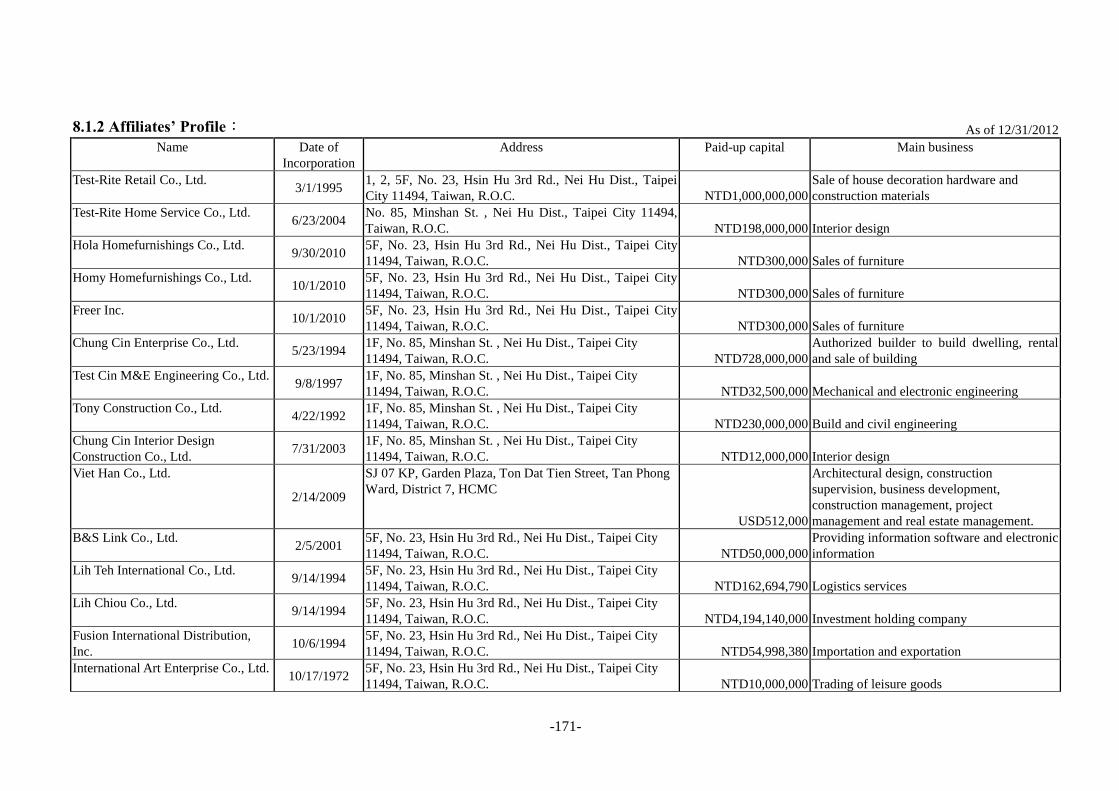
-171-
8.1.2 Affiliates’ Profile: As of 12/31/2012
Name Date of
Incorporation
Address Paid-up capital Main business
Test-Rite Retail Co., Ltd. 3/1/1995
1, 2, 5F, No. 23, Hsin Hu 3rd Rd., Nei Hu Dist., Taipei
City 11494, Taiwan, R.O.C. NTD1,000,000,000
Sale of house decoration hardware and
construction materials
Test-Rite Home Service Co., Ltd. 6/23/2004
No. 85, Minshan St. , Nei Hu Dist., Taipei City 11494,
Taiwan, R.O.C. NTD198,000,000 Interior design
Hola Homefurnishings Co., Ltd. 9/30/2010
5F, No. 23, Hsin Hu 3rd Rd., Nei Hu Dist., Taipei City
11494, Taiwan, R.O.C. NTD300,000 Sales of furniture
Homy Homefurnishings Co., Ltd. 10/1/2010
5F, No. 23, Hsin Hu 3rd Rd., Nei Hu Dist., Taipei City
11494, Taiwan, R.O.C. NTD300,000 Sales of furniture
Freer Inc. 10/1/2010
5F, No. 23, Hsin Hu 3rd Rd., Nei Hu Dist., Taipei City
11494, Taiwan, R.O.C. NTD300,000 Sales of furniture
Chung Cin Enterprise Co., Ltd. 5/23/1994
1F, No. 85, Minshan St. , Nei Hu Dist., Taipei City
11494, Taiwan, R.O.C. NTD728,000,000
Authorized builder to build dwelling, rental
and sale of building
Test Cin M&E Engineering Co., Ltd. 9/8/1997
1F, No. 85, Minshan St. , Nei Hu Dist., Taipei City
11494, Taiwan, R.O.C. NTD32,500,000 Mechanical and electronic engineering
Tony Construction Co., Ltd. 4/22/1992
1F, No. 85, Minshan St. , Nei Hu Dist., Taipei City
11494, Taiwan, R.O.C. NTD230,000,000 Build and civil engineering
Chung Cin Interior Design
Construction Co., Ltd. 7/31/2003
1F, No. 85, Minshan St. , Nei Hu Dist., Taipei City
11494, Taiwan, R.O.C. NTD12,000,000 Interior design
Viet Han Co., Ltd.
2/14/2009
SJ 07 KP, Garden Plaza, Ton Dat Tien Street, Tan Phong
Ward, District 7, HCMC
USD512,000
Architectural design, construction
supervision, business development,
construction management, project
management and real estate management.
B&S Link Co., Ltd. 2/5/2001
5F, No. 23, Hsin Hu 3rd Rd., Nei Hu Dist., Taipei City
11494, Taiwan, R.O.C. NTD50,000,000
Providing information software and electronic
information
Lih Teh International Co., Ltd. 9/14/1994
5F, No. 23, Hsin Hu 3rd Rd., Nei Hu Dist., Taipei City
11494, Taiwan, R.O.C. NTD162,694,790 Logistics services
Lih Chiou Co., Ltd. 9/14/1994
5F, No. 23, Hsin Hu 3rd Rd., Nei Hu Dist., Taipei City
11494, Taiwan, R.O.C. NTD4,194,140,000 Investment holding company
Fusion International Distribution,
Inc. 10/6/1994
5F, No. 23, Hsin Hu 3rd Rd., Nei Hu Dist., Taipei City
11494, Taiwan, R.O.C. NTD54,998,380 Importation and exportation
International Art Enterprise Co., Ltd. 10/17/1972
5F, No. 23, Hsin Hu 3rd Rd., Nei Hu Dist., Taipei City
11494, Taiwan, R.O.C. NTD10,000,000 Trading of leisure goods

-172-
Test-Rite Pte. Ltd. 8/11/1989 260 Orchard Road, #12-08 The Heeren Singapore 238855 S$3,520,000 Importation and exportation
Test-Rite Int‘l (Thailand) Ltd. 1/7/1989
1000/60-61 P.B. Tower 15th
fl., Sunhumvit 71 Road,
North Klongtan, Wattana, Bangkok 10110, Thailand B$5,625,000 Importation and exportation
Test-Rite Vietnam Co., Ltd. 3/23/2009
SJ-07, Garden Plaza 1, Ton Dat Tien Street, Tan Phong
Ward, District 7, HCMC US$1,120,000 Importation and exportation
Test-Rite Product (Hong Kong) Ltd. 12/30/1980
7F, New Bright Building,11 Sheung Yuet Road, Kowloon
Bay, Kowloon ,Hong Kong HK$1,000,000 Importation and exportation
Test-Rite Int‘l (U.S.) Co., Ltd. 6/25/1991
1013 Centre Road Wilmington New Castle State of
Delaware US$37,878,800 Investment holding company
Test-Rite Canada Co., Ltd. 12/29/1999
431 Alden Road, Unit 3, Markham Ontario, L3R 3L4,
Canada CAD$1,025,000 Importation and exportation
Test-Rite Int‘l (Australia) Pty Ltd. 4/12/1990
Suite 3.01, 14 Lexington Dr, Bella Vista N.S.W.,
Australia A$1,800,000 Importation and exportation
Test-Rite (UK) Co., Ltd. 7/27/2010
Unit 18, Basepoint Business Centre, 1 Winnall Valley
Road, Winchester, Hampshire, SO23 0LD GBP$1,475,930 Importation and exportation
TR DEVELOPMENT 1/25/2002 Merkurring 82, 22143 Hamburg, Germany EURO$9,670,000 Investment holding company
Test-Rite Star Co., Ltd. 4/17/2001
Omar Hodge Buildng, Wickhaus Cay I, P. O. Box 362,
Road Town, Tortola, British, Virgin Islands US$1,089,000 Investment holding company
TR INVESTMENT (B.V.I.) 10/1/1997
Omar Hodge Buildng, Wickhaus Cay I, P. O. Box 362,
Road Town, Tortola, British, Virgin Islands US$500,000 Investment in various industries
TR RETAILING 4/8/2003
One Capital Place P. O. Box897, GT Grand Cayman,
Cayman, British West Indies US$78,331,000 Investment holding company
TR TRADING 10/23/2002
One Capital Place P. O. Box897, GT Grand Cayman,
Cayman, British West Indies US$39,126,495 Investment holding company
TRS INVESTMENT 1/17/2002
Trust Net Chambers, Lotemau Center, P.O.Box 217,
Apia,Samoa US$2,275,590.58 Investment holding company
FORTUNE MILES 9/21/2001
Trust Net Chambers, Lotemau Center, P.O.Box 1225,
Apia,Samoa US$30,000 Investment holding company
UPMASTER 6/14/1996
Omar Hodge Buildng, Wickhaus Cay I, P. O. Box 362,
Road Town, Tortola, British, Virgin Islands US$6,400,000 Investment holding company
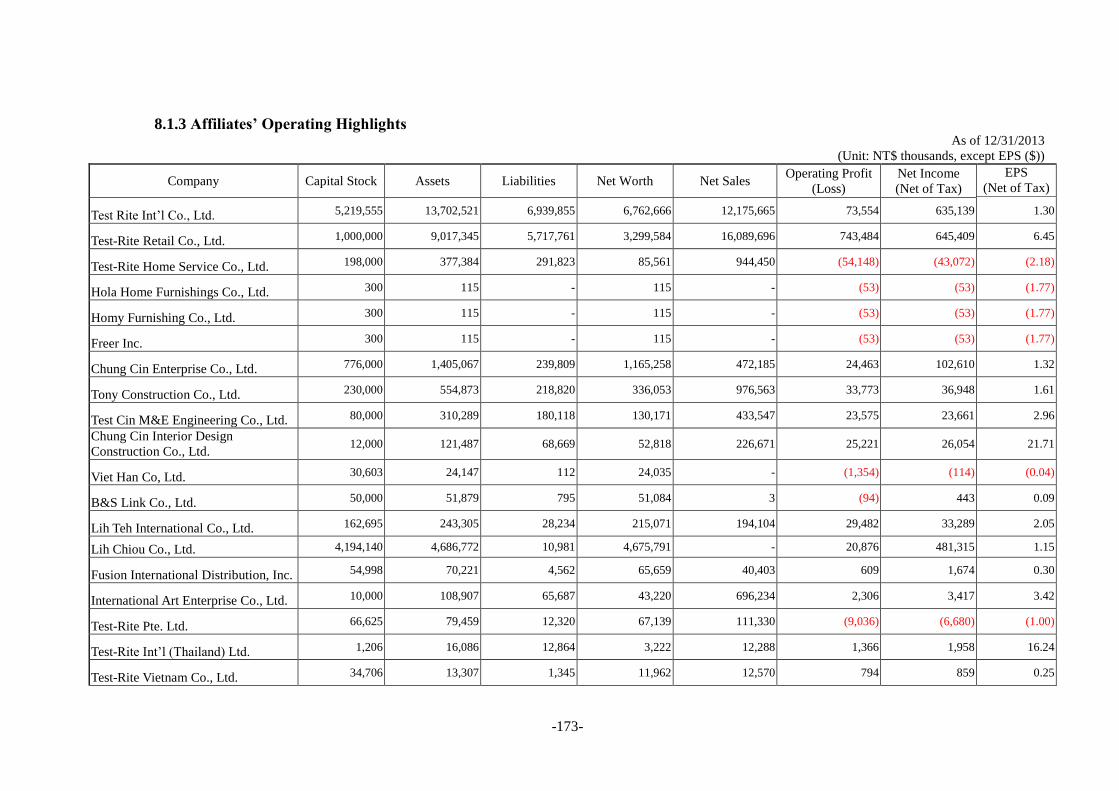
-173-
8.1.3 Affiliates’ Operating Highlights
As of 12/31/2013
(Unit: NT$ thousands, except EPS ($))
Company Capital Stock Assets Liabilities Net Worth Net Sales Operating Profit
(Loss)
Net Income
(Net of Tax)
EPS
(Net of Tax)
Test Rite Int‘l Co., Ltd. 5,219,555 13,702,521 6,939,855 6,762,666 12,175,665 73,554 635,139 1.30
Test-Rite Retail Co., Ltd. 1,000,000 9,017,345 5,717,761 3,299,584 16,089,696 743,484 645,409 6.45
Test-Rite Home Service Co., Ltd. 198,000 377,384 291,823 85,561 944,450 (54,148) (43,072) (2.18)
Hola Home Furnishings Co., Ltd. 300 115 - 115 - (53) (53) (1.77)
Homy Furnishing Co., Ltd. 300 115 - 115 - (53) (53) (1.77)
Freer Inc. 300 115 - 115 - (53) (53) (1.77)
Chung Cin Enterprise Co., Ltd. 776,000 1,405,067 239,809 1,165,258 472,185 24,463 102,610 1.32
Tony Construction Co., Ltd. 230,000 554,873 218,820 336,053 976,563 33,773 36,948 1.61
Test Cin M&E Engineering Co., Ltd. 80,000 310,289 180,118 130,171 433,547 23,575 23,661 2.96
Chung Cin Interior Design
Construction Co., Ltd. 12,000 121,487 68,669 52,818 226,671 25,221 26,054 21.71
Viet Han Co, Ltd. 30,603 24,147 112 24,035 - (1,354) (114) (0.04)
B&S Link Co., Ltd. 50,000 51,879 795 51,084 3 (94) 443 0.09
Lih Teh International Co., Ltd. 162,695 243,305 28,234 215,071 194,104 29,482 33,289 2.05
Lih Chiou Co., Ltd. 4,194,140 4,686,772 10,981 4,675,791 - 20,876 481,315 1.15
Fusion International Distribution, Inc. 54,998 70,221 4,562 65,659 40,403 609 1,674 0.30
International Art Enterprise Co., Ltd. 10,000 108,907 65,687 43,220 696,234 2,306 3,417 3.42
Test-Rite Pte. Ltd. 66,625 79,459 12,320 67,139 111,330 (9,036) (6,680) (1.00)
Test-Rite Int‘l (Thailand) Ltd. 1,206 16,086 12,864 3,222 12,288 1,366 1,958 16.24
Test-Rite Vietnam Co., Ltd. 34,706 13,307 1,345 11,962 12,570 794 859 0.25

-174-
Company Capital Stock Assets Liabilities Net Worth Net Sales Operating Profit
(Loss)
Net Income
(Net of Tax)
EPS
(Net of Tax)
Test-Rite Product (Hong Kong) Ltd. 3,795 24,544 3,643 20,901 23,418 2,716 2,579 6.80
Test-Rite Int‘l (U.S.) Co., Ltd. 1,103,300 2,001,070 1,672,303 328,767 4,174,408 81,527 100,092 0.91
Test-Rite Canada Co., Ltd. 46,970 4,040 2,313 1,727 20,904 (4,880) (4,915) (1.05)
Test-Rite Int‘l (Australia) Pty Ltd. 51,938 17,873 14,952 2,921 38,527 12,941 (1,722) (0.33)
Test-Rite (UK) Co., Ltd. 57,011 19,786 12,529 7,257 7,073 (11,319) (11,348) (1.99)
Test-Rite Development Co., Ltd. 474,414 207,077 156,691 50,386 461,328 (1,985) 1,838 0.04
TR Star 38,148 11,902 - 11,902 - (64) (64) (0.02)
Test-Rite Investment (B.V.I.) Co., Ltd. 17,387 22,455 - 22,455 - (63) (54) (0.03)
Test-Rite Retailing Co., Ltd. 2,499,526 2,459,199 2,468,577 (9,378) 4,330,093 (104,842) (140,665) (0.56)
Test-Rite Trading Co., Ltd. 1,518,739 804,475 678,367 126,108 1,293,313 (133,922) (153,279) (1.01)
TRS Investment Co., Ltd. 76,717 78,041 - 78,041 - (32) (32) (0.00)
Fortune Miles Co., Ltd. 947 1,034 - 1,034 - (35) (66) (0.70)
Upmaster Int‘l Co., Ltd. 191,616 60,518 - 60,518 - (62,318) 16,588 0.87

-175-
8.1.4. Consolidated financial statements of affiliated enterprises
Statement of Declaration
For fiscal year 2013 (January 1 to December 31, 2013), the affiliated enterprises that should be
incorporated into the Company's consolidated financial statements pursuant to the Criteria Governing
Preparation of Affiliation Reports, Consolidated Business Reports and Consolidated Financial
Statements of Affiliated Enterprises, and those that should be incorporated similarly in accordance
with Statement of Financial Accounting Standards No. 7 are in fact the same companies, and the
relevant information required to be disclosed in the consolidated financial statements of affiliated
enterprises have already been disclosed in the aforementioned consolidated financial statements of
parent and subsidiaries. Therefore there is no need to prepare consolidated financial statements
separately for the Company's affiliated enterprises.
The above is hereby declared.
Test Rite International Co., Ltd.
Chairman: Judy Lee
March 25, 2014
8.2 Private Placement Securities in the Most Recent Years: None.
8.3 The Shares in the Company Held or Disposed of by Subsidiaries in the Most Recent Years:
None.
8.4 Other Necessary Supplement: None.
IX. Any Events in 2013 and as of the Date of this Annual Report that Had Significant
Impacts on Shareholders’ Right or Security Prices as Stated in Item 2 Paragraph 2 of
Article 36 of Securities and Exchange Law of Taiwan: None.