test report of performance of climcaps-snpp and climcaps
TRANSCRIPT

Goddard Earth Sciences Data and Information Services Center (GES DISC) http://disc.gsfc.nasa.gov NASA Goddard Space Flight Center Code 610.2 Greenbelt, MD 20771 USA © 2020. All rights reserved.
Test Report of Performance of CLIMCAPS-SNPP and
CLIMCAPS-JPSS1 Retrievals
Prepared by Tao Wang, Jacola Roman, Qing Yue, and Sun Wong
Contributors: Bjorn Lambrigtsen, Ruth Monarrez, Evan Manning, Eric Fetzer
Jet Propulsion Laboratory, California Institute of Technology
CLIMCAPS Product Version v02_28_02 (algorithm version v02.00.02)
This assessment was carried out at the Jet Propulsion Laboratory, California Institute of Technology,
under a contract with the National Aeronautics and Space Administration (80NM0018D0004).
August, 2020
2
Table of Contents
1. Technical Summary ................................................................................................................ 3
2. Data and Methodology ............................................................................................................ 4
2.1 CLIMCAPS v02_28_02 L2 Data....................................................................................... 4
2.2 IGRA radiosondes .............................................................................................................. 5
2.3 ECMWF reanalysis ............................................................................................................ 6
2.4 Testing metric .................................................................................................................... 6
3. Results ..................................................................................................................................... 7
3.1 Retrieval yield .................................................................................................................... 8
3.2 Retrieval deviations from first guess (FG)......................................................................... 9
3.2.1 Water Vapor (H2O) ..................................................................................................... 9
3.2.2 Temperature .............................................................................................................. 12
3.3 Biases and RMSE comparing to IGRA ........................................................................... 14
3.3.1 CLIMCAPS collocated to IGRA .............................................................................. 14
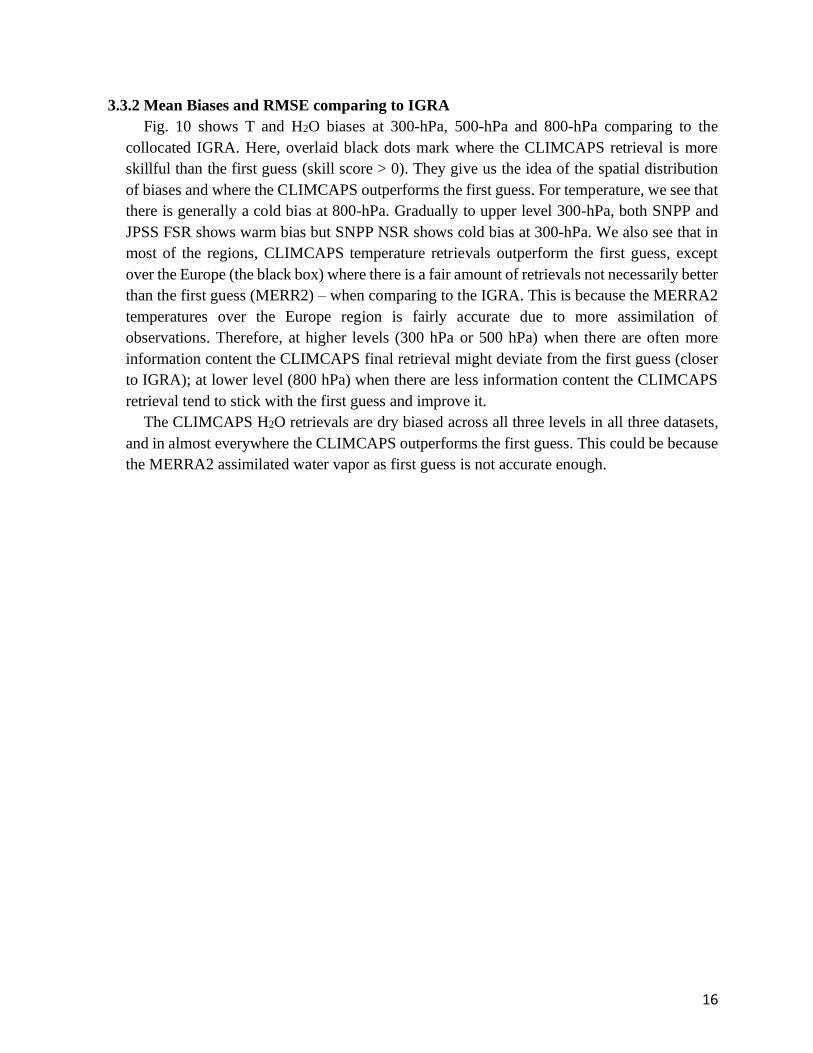
3.3.2 Mean Biases and RMSE comparing to IGRA .......................................................... 16
3.3.3 Clouds’ impact on CLIMCAPS retrievals ................................................................ 19
3.3.4 Skill Score Comparing to IGRA over the Europe .................................................... 22
3.4 Biases and RMSEs comparing to collocated ECMWF reanalysis.................................... 23
3.4.1 Global Maps of Temperature & Specific Humidity .................................................. 23
3.4.2 Global Mean Plots of Temperature & Specific Humidity ......................................... 27
3.4.3 Zonal Mean Plots of Temperature and Specific Humidity ........................................ 30
3.4.4 Skill Score When Comparing to ECMWF................................................................. 38
4. Summary and Conclusions ................................................................................................... 40
References ..................................................................................................................................... 42
3
1. Technical Summary
This report assesses the general quality of the v02_28_02 (algorithm version v02.00.02)
Level 2 (L2) products from the CLIMCAPS (Community Long-term Infrared Microwave
Coupled Atmospheric Product System, Smith and Barnet, [2019]) retrieval system.
CLIMCAPS is the NASA’s sounding observing system for the AIRS (Atmospheric Infrared
Sounder) and the CrIS (Cross-track Infrared Sounder). CLIMCAPS implements Bayesian
optimal estimation as inversion scheme and generates averaging kernel matrices of each
variable to characterize its dependence on information measured about the true state of that
variable. CLIMCAPS employs explicit background error quantification with uncertainty
propagation. The CLIMCAPS algorithm uses MERRA2 (Modern-Era Retrospective Analysis
for Research and Applications version 2) meteorological products interpolated to time and
space of the satellite observations as a first guess.
The CrIS instrument is a Fourier Transform Spectrometer (FTS) with infrared (IR)
sounding channels covering the longwave (650-1095 cm-1, LWIR), the midwave (1210-1750
cm-1, MWIR), and the shortwave (2155-2550 cm-1, SWIR) spectral bands, similar to that of
AIRS. CrIS is accompanied by the ATMS (Advanced Technology Microwave Sounder),
which is a cross-track scanner with 22 channels in spectral bands from 23 GHz to 183 GHz,
providing microwave (MW) measurements in both clear and cloudy conditions similar to that
of AMSU on board the aqua satellite. ATMS has better sampling and two more channels than
its predecessor AMSU.
The CrIS/ATMS combination is known as the Cross-track Infrared Microwave Sounding
Suite (CrIMSS), which provides high quality hyper-spectral IR and MW observations to
retrieve atmospheric vertical temperature, moisture, trace gases, etc., in scenes with up to 80%
cloud-cover. The instrument suite CrIMSS has been onboard the SNPP (Suomi-National Polar-
orbiting Partnership) since 2011, and we refer to this version of the CLIMCAPS retrieval as
the CLIMCAPS-SNPP. Meanwhile, the CLIMCAPS retrieval from the CrIMSS onboard the
JPSS-1 (Joint Polar Satellite System), now known as NOAA-20 since November 2017, is
referred to as the CLIMCAPS-JPSS1. Both SNPP and JPSS-1 are polar orbiting satellites that
cross the equator about 14 times daily, providing full global coverage twice a day. JPSS-1
operates about 50 minutes ahead of SNPP, allowing overlap in observational coverage. Fig. 1
below is an example of the first 9 granules (T0000–T0048) of CrIMSS footprints onboard the
SNPP and the JPSS-1 during January 1st, 2019.
4
Figure 1. The first 9 granules (T0000 – T0048) of CrIMSS onboard the SNPP and the
JPSS-1 during January 1st, 2019. The JPSS-1/NOAA-20 is ahead of SNPP by about 50
minutes.
This report aims to test the performance of CrIMSS (with IR+MW channels) L2 retrievals
from CLIMCAPS-SNPP and CLIMCAPS-JPSS1 version v02_28_02. The data can be
downloaded from the Goddard Distributed Active Archive Center (GDAAC). The testing
analysis aims to 1) evaluate the general quality of the retrieval by looking at the retrieval yield;
2) quantify the role of first guess by comparing the differences between the first guess and the
physical retrievals on the key products moisture (H2O) and temperature (T); 3) quantify the
biases and root mean square errors (RMSE) of retrieved H2O and T by comparing with pixel-
scale collocated radiosonde measurements from the Integrated Global Radiosonde Archive
(IGRA) and pixel-scale collocated European Centre for Medium-Range Weather Forecasts
(ECMWF) model analyses.
2. Data and Methodology
2.1 CLIMCAPS v02_28_02 L2 Data
This test version of CLIMCAPS applied to CrIMSS onboard the SNPP and JPSS-1 is
v02_28_02 (algorithm version v02.00.02). The CLIMCAPS-SNPP products are from CrIMSS
onboard the SNPP, in which the CrIS was originally operated at NSR (Normal Spectral
Resolution) mode since the beginning on February 2012. Starting December 4, 2014, CrIS
switched to FSR (Full Spectral Resolution) mode, although the data processing system
continued to process the raw data records into NSR sensor data records by truncating the
microwave and shortwave band data into the NSR interferograms, and the data is kept the same
way as post December 4th [Han et al., 2015]. The FSR [Barnet, 2019a] includes a total of 2211
spectral channels (713 in LWIR, 865 in MWIR, 633 in SWIR), which is a substantial increase
from the 1305 channels (713 in LWIR, 433 in MWIR, 159 in SWIR) of the NSR [Barnet,

5
2019b]. The increased information content in FSR provides critical radiance for retrieving
carbonate products such as carbon monoxide (CO), carbon dioxide (CO2), and methane (CH4).
More details on the instrument description and the retrieval algorithm can be found in the S-
NPP CLIMCAPS L2 ATBD (Algorithm Theoretical Basis Documents)
(https://disc.gsfc.nasa.gov/datasets/SNDRSNIML2CCPRET_2/summary). The L2
CLIMCAPS-JPSS1 products are from CrIMSS onboard the JPSS-1/NOAA-20. For
v02_28_02, CLIMCAPS-JPSS1 only has FSR available [Barnet, 2019c]. Currently, the three
datasets are accessible at GDAAC:
CLIMCAPS-SNPP FSR: https://disc.gsfc.nasa.gov/datasets/SNDRSNIML2CCPRET_2/summary?keywords=climcaps%20snpp%20L2
CLIMCAPS-SNPP NSR: https://disc.gsfc.nasa.gov/datasets/SNDRSNIML2CCPRETN_2/summary?keywords=climcaps%20snpp%20L2
CLIMCAPS-JPSS1 FSR: https://disc.gsfc.nasa.gov/datasets/SNDRJ1IML2CCPRET_2/summary?keywords=climcaps%20snpp%20L2
Both the first guess (FG) and the final retrievals of the CrIMSS temperature (T) profiles
are reported at 100 pressure levels. For H2O profiles, two variables are reported in the L2
product: the specific humidity (mass fraction of water vapor in moist air in units of kg/kg) on
pressure levels and the layer mass density in units of water molecules/cm2 per layer. The water
vapor first guess (FG) is also a layer mass density reported in pressure layers. The layer density
of both FG and the physical retrieval of CrIMSS H2O (in molecules/cm2 per layer) are further
converted to mass mixing ratio in the unit of g/kg, where “air_press_lay” in the L2 product is
used as the effective pressure of the layer quantities.
For both T and H2O retrievals, CLIMCAPS L2 provides associated quality control
indicators with names “_qc” appended to each variable; QC=0 indicates the best retrievals that
meet the accuracy requirements, QC=1 indicates good retrievals, and QC=2 indicates the use
of such data is not recommended.
For better interpreting the H2O and T retrievals from the CLIMCAPS system, we also
include analyses of the associated averaging kernel/verticality, cloud fraction, cloud top
pressure, surface type, etc. from the product. The averaging kernel tells us the vertical
distribution of information content received from the instrument’s radiance. The verticality is
the sum of the ith row in averaging kernels, with values near unity indicating that the retrieval
comes primarily from the measured radiances at that particular level; while lower verticality
indicates more influence from the a-priori, which is MERRA2. Because of the strong
dependence of retrieval qualities on cloud conditions within the field of view of instruments
such as CrIMSS, histograms are on the cloud fraction vs. cloud top pressure variable space.
The detailed file format and definitions of variables in the CLIMCAPS-SNPP and -JPSS1 can
be found in the products user guide [Monarrez et al., 2020].
2.2 IGRA radiosondes
In order to evaluate the performance of CLIMCAPS retrieval products, we collocate the
retrieved L2 moisture and temperature profiles to radiosonde observations of the version 2

6
Integrated Global Radiosonde Archive (IGRA) [Durre and Yin, 2008] using a nearest neighbor
approach with temporal and spatial tolerances of 3 hours and within 50 km. The v2 IGRA
consists of radiosonde and pilot balloon observations at over 2,700 globally distributed
stations. The time period availability of the IGRA archive varies from station to station, and
approximately 866 stations are reporting data for the testing period of 2019 January (the whole
month). Previously, the IGRA dataset has been used to investigate the cloud-induced
uncertainties in AIRS version 6 data [Wong et al., 2015].
2.3 ECMWF reanalysis
The CrIMSS L2 water vapor and temperature vertical profiles are also evaluated by
comparing with the European Centre for Medium-Range Weather Forecasts (ECMWF) model
analysis collocated to CrIMSS at pixel scale [Fishbein, 2018]. Seven days of retrievals in
January 2019 from the V2 CLIMCAPS algorithm are analyzed by compositing retrievals
based on quality control, surface type, cloudy conditions and more. The differences of both the
final retrieval and the first guess (FG) against the collocated ECMWF model analysis are
calculated for various ensembles and regions. Note that the ECMWF model analysis is used in
this initial testing as the reference data since the purpose is not to quantify the retrieval bias
through a thorough validation study, instead, the initial testing analysis aims to 1) evaluate the
general quality of the retrieval, 2) quantify the differences between the first guess (FG) and the
physical retrieval on the key products (temperature and water vapor profiles) from the retrieval
system, and 3) explore the possible connections between the differences and other physical
parameters such as cloud properties and surface class. Since the CLIMCAPS algorithm uses
MERRA2 interpolated in both time and space to the satellite observations as first guess, the
differences between the CLIMCAPS FG and ECMWF reflect the differences between
MERRA2 and the ECMWF model analysis [e.g., Yue et al., 2013]. The ECMWF specific
humidity is on pressure levels. The layer quantities of both the FG and the physical retrieval
of CrIMSS water vapor profiles are converted from layer densities to specific humidity in g/kg
by a linear interpolation of log(layer quantity) on the log(pressure) followed by a unit
conversion from molecules/m2 to g/kg, where the “air_press_lay” in the L2 product is used as
the effective pressure of the layer quantities. Since the FG is also reported on layers instead of
levels, results on humidity profiles in the test report are based on layer quantities unless
mentioned otherwise.
2.4 Testing metric
The bias and root mean square error (RMSE) will be used to assess the differences of
CLIMCAPS retrievals to reference datasets. For this test report we compare CLIMCAPS to
first guess (section 3.2), to IGRA (section 3.3) and to ECMWF (section 3.4). For temperature,
the bias is calculated using the following formula:
𝑇𝑏𝑖𝑎𝑠 = 𝑚𝑒𝑎𝑛(𝑇𝑟𝑒𝑡𝑟𝑖𝑒𝑣𝑎𝑙 − 𝑇𝑟𝑒𝑓𝑒𝑟𝑒𝑛𝑐𝑒 ) (1)
Similarly, the RMSE for temperature is defined as:

7
𝑇𝑅𝑀𝑆𝐸 = √𝑚𝑒𝑎𝑛((𝑇𝑟𝑒𝑡𝑟𝑖𝑒𝑣𝑎𝑙 − 𝑇𝑟𝑒𝑓𝑒𝑟𝑒𝑛𝑐𝑒 )2
) (2)
Because of the large variability of H2O from the surface to the upper troposphere, in most
of the cases we calculate H2O bias relative to the mean state of the reference using the
following equation:
𝐻2𝑂𝑏𝑖𝑎𝑠 =𝑚𝑒𝑎𝑛(𝐻2𝑂𝑟𝑒𝑡𝑟𝑖𝑒𝑣𝑎𝑙−𝐻2𝑂𝑟𝑒𝑓𝑒𝑟𝑒𝑛𝑐𝑒)
𝑚𝑒𝑎𝑛(𝐻2𝑂𝑟𝑒𝑓𝑒𝑟𝑒𝑛𝑐𝑒) × 100 (3)
Similarly, the RMSE will be normalized for specific humidity using the following formula:
𝐻2𝑂𝑅𝑀𝑆𝐸 =√𝑚𝑒𝑎𝑛((𝐻2𝑂𝑟𝑒𝑡𝑟𝑖𝑒𝑣𝑎𝑙−𝐻2𝑂𝑟𝑒𝑓𝑒𝑟𝑒𝑛𝑐𝑒)
2)
𝑚𝑒𝑎𝑛(𝐻2𝑂𝑟𝑒𝑓𝑒𝑟𝑒𝑛𝑐𝑒)× 100 (4)
Both temperature and H2O will be conditioned by the quality control flags (QC) and other
variables such as cloud fraction, microwave surface class, and orbit direction. Global maps at
select pressure levels, global means, as well as zonal means will be presented to highlight
spatial differences.
2.5 Skill Score of The Final Retrieval Against First Guess with Respect to Reference Datasets
We also perform a skill score test to assess whether the final retrieval has more skill than
the first guess – when comparing to the reference datasets from IGRA or ECMWF. Skill score
is a forecasting metric that allows a user to test whether one forecast has more skill than another
[Murphy, 1988; WMO, 2012]. The formula for the mean squared error skill score is as follows:
𝑆𝑘𝑖𝑙𝑙 𝑆𝑐𝑜𝑟𝑒 = 1 −𝑀𝑆𝐸𝑟𝑒𝑡𝑟𝑖𝑒𝑣𝑎𝑙
𝑀𝑆𝐸𝐹𝑖𝑟𝑠𝑡 𝐺𝑢𝑒𝑠𝑠= 1 −
𝑚𝑒𝑎𝑛((𝑇𝑟𝑒𝑡𝑟𝑖𝑒𝑣𝑎𝑙−𝑇𝑟𝑒𝑓𝑒𝑟𝑒𝑛𝑐𝑒)2)
𝑚𝑒𝑎𝑛((𝑇𝐹𝑖𝑟𝑠𝑡 𝐺𝑢𝑒𝑠𝑠−𝑇𝑟𝑒𝑓𝑒𝑟𝑒𝑛𝑐𝑒)2) (5)
The skill score for H2O uses the same formula. Please note that this metric depends highly
on what is considered the reference, which in this case is either the IGRA or the ECMWF.
If the skill score is greater than 0, the retrieval has more skill than the first guess (the MSE
of the retrieval is smaller than the MSE of the first guess). If the skill score is less than 0, the
first guess has more skill than the retrieval (the MSE of the retrieval is larger than the MSE of
the first guess). The skill score not only tells you whether the final retrieval deviates from the
first guess but whether that deviation was good (positive) or not (negative).
3. Results
Below we first demonstrate the inter-comparisons of CLIMCAPS-SNPP and CLIMCAPS-
JPSS1 in terms of retrieval yield (section 3.1) and retrieval deviations from the first guess (e.g.,
MERRA2) and the verticality representing the information content (section 3.2). The results
are based on January 10-12, 2019. In section 3.3, we used the entire month of January 2019
CLIMCAPS data collocated to IGRA to analyze the mean retrieval biases and RMSE in
temperature and H2O. Section 3.4 will show the bias and RMSE comparing to the collocated
ECWMF over a 7-day period (January 1st – January 7th, 2019). In sections 3.3-3.4 we also
investigate the clouds’ impact on CLIMCAPS retrievals and evaluate the retrieval skill by
comparing biases and RMSE from reference datasets (IGRA and ECMWF) against that from
the first guess.

8
3.1 Retrieval yield
Fig. 2 compares the zonal mean vertical cross section of CLIMCAPS retrieval yields (%)
considering QC=0 for best retrievals, QC=0 or 1 for good retrievals, and QC=2 for results not
suggested for scientific use. Here we are using QC flag for H2O; QC flag for temperatures are
the same because the current CLIMCAPS adopt a final quality flag for all variables including
trace gases. We calculated the yield as the percentage of retrievals that are flagged by QC,
divided by the total observation count; therefore, the yields of QC=0 or 1 plus the yields of
QC=2 equal to 100%. In the lower two rows, we plotted the differences between FSR and NSR
for CLIMCAPS-SNPP and the differences between FSR CLIMCAPS-SNPP and -JPSS1.
For the first two scenarios (QC=0 or QC=0 or 1), Fig. 2 shows that all three retrievals
(SNPP FSR, SNPP NSR and JPSS1 FSR) have a 100% data yield when the pressure is at or
above 300-hPa. This is because the current version of CLIMCAPS algorithm assumes that
there should be excellent cloud contrast starting from this level and up, and cloud clearing
should be working reasonably well so that all measurements are considered useful here. For
CLIMCAPS-SNPP, the retrieval yields between NSR and FSR are quite similar, but NSR has
a slightly higher yield with QC=0 or 1 between 300-800 hPa within the tropics to mid-latitude
while the FSR yield is 20-40% higher than NSR over the region 50–80oS. The yields in
CLIMCAPS-JPSS1 FSR are very similar to that of CLIMCAPS-SNPP FSR, with the
differences less than 10%, which is as expected because the CrIMSS instruments onboard the
SNPP and JPSS1 are essentially the same. Note that JPSS1 and SNPP pixels are not collocated
due to their different orbital characteristics, therefore, the yield difference shows statistically
how different the yields of two instruments are.
The retrieval yields of QC=0 is very close to QC=0 or 1 because the majority of the cases
in the QC=0 or 1 population is QC=0 FOVs in the current CLMCAPS algorithm. The
unsuccessful retrievals (QC=2) in the three datasets show similar features and quantities, but
be aware that the amount of observations flagged as QC=2 is fairly small especially over the
tropics.

9
Figure 2. Zonal mean vertical cross section of CLIMCAPS retrieval yields in percentage for retrievals with quality flag
QC=0 (best, left column), QC=0 or 1 (best and good, middle column), and QC=2 (not for scientific use, right column)
among CLIMCAPS-SNPP FSR (top row), CLIMCAPS-SNPP NSR (second row from top), and CLIMCAPS-JPSS1 FSR
(third row from top). The bottom two rows are the differences between FSR and NSR for CLIMCAPS-SNPP and the
differences between FSR CLIMCAPS-SNPP and -JPSS1. The dashed lines are the tropopause. The black filling indicating
either no data reaching below surface or no data falling into that specific scenario.
3.2 Retrieval deviations from first guess (FG)
In this section we investigate the deviations of final retrievals from the first guess
(MERRA2) for H2O and T. A smaller deviation means the retrieval system sticks with the first
guess; while larger deviations mean the final retrievals are more different from the first guess.
Similar to the bias and RMSE calculations, (eqns. 1-4) here we replace the reference datasets
with the first guess and we calculate the deviations of final retrieved H2O from the first guess
as the relative change in percentage.
3.2.1 Water Vapor (H2O)
Fig. 3 demonstrates the deviations of CLIMCAPS-SNPP H2O final retrievals from the first
guess in magnitude (g/kg, panel a) and the relative differences in percentage (%, panel b). In
terms of magnitude deviations, over the tropics we see larger negative deviations from the first
guess in 300-600 hPa and larger positive deviations from the surface to 600 hPa. Note that the
positive and negative values are not important; it is the magnitude of the deviation that really
matters. However, due to the large vertical variability of H2O, the magnitude of these
deviations is not easy to interpret. The percent deviations, on the other hand, show a similar
pattern but provide a more qualitive demonstration of the deviations. It also shows that the
close-to-zero deviation (white stripes in panel b) are either close to the surface or probably at

10
the cloudy region (15oN from surface to ~500 hPa), where clouds block the radiance that
generates less information content for the retrieval. This makes the retrievals stick to the first
guess. Note that above the tropopause (dashed line) the deviation is mostly zero, this is because,
at those high levels CrIS loses its sensitivity. Because the H2O vary drastically in the vertical,
in later results we are going to present the H2O differences and biases in relative percentage
change from the first guess or from the reference datasets IGRA/ECMWF.
Figure 3. Deviations of CLIMCAPS-SNPP H2O retrievals from the first guess in a) magnitude (g/kg) and in b) relative
percentage change (%). The dashed lines are the tropopause.
Fig. 4 compares the deviations of the H2O final retrievals to the first guess between
CLIMCAPS-SNPP and CLIMCAPS-JPSS1. We see that the general patterns are quite similar
and that the retrievals follow the first guess closest (<5% deviation) either near the surface,
due to blockage by clouds above, or above the tropopause, where the sounder has limited
sensitivity to H2O. This can also be viewed from the overlaid verticality (black contours
for >0.6) that mostly fall between the reported total effective cloud top pressure (white line)
and the tropopause (black dashed line). In the tropics between 300-500 hPa, CrIMSS radiances
have more information content so the retrievals deviate more from the first guess of H2O. For
CLIMCAPS-SNPP, the first guess used in the FSR is closer to the final retrieval (in general
smaller deviation) than in the NSR. In Fig. 4 the right column of QC=2 suggests that besides
the air in-between the total cloud top pressure and the tropopause, where CrIMSS has more
information content in general, the system tries to correct the first guess more near the surface
although eventually the results are not good enough (flagged as QC=2).

11
Figure 4. Comparing the deviations of final retrieved H2O from the first guess (MERRA2) in relative percent change for
CLIMCAPS-SNPP FSR (top row), CLIMCAPS-SNPP NSR (middle row), and CLIMCAPS-JPSS1 FSR (bottom row) in
scenarios of QC=0 or 1 (left column) and QC=2 (right column). The overlaid black dashed lines mark the tropopause, white
lines mark the total effective cloud top pressure, and the black solid contours of 0.6, 0.8, 1.0 for the mean H2O verticality.
The deviations could be cancelled by positive and negative values. Therefore, it is helpful
to examine the root-mean-square differences (RMSD) of the final retrievals from the first guess,
which is shown in Fig. 5 below. Fig. 5 demonstrates that the CLIMCAPS system tries to
modify the first guess more from the level of total effective cloud top pressure (white line) to
the tropopause (black dashed lines). This is especially pronounced for the CLIMCAPS-SNPP
NSR such that the modification is more often greater than 40%. This could be caused by a few
reasons: 1) the NSR forward model is much older than the FSR forward model; 2) NSR has
fewer channels to resolve the upper tropospheric H2O. Beyond this region, the final retrievals
stick to the first guess more above the tropopause where the sounder has limited sensitivity to
water vapor concentrations and below the level of total effective cloud top pressure, where the
retrievals are contaminated by clouds above.
12
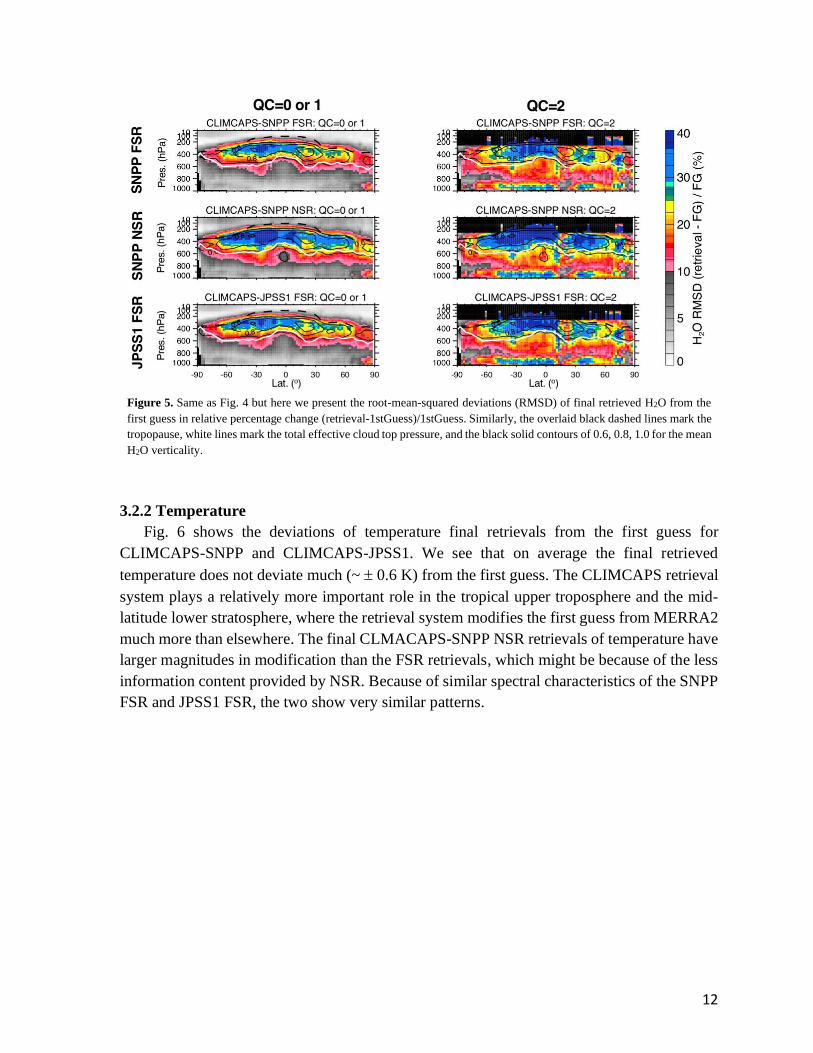
Figure 5. Same as Fig. 4 but here we present the root-mean-squared deviations (RMSD) of final retrieved H2O from the
first guess in relative percentage change (retrieval-1stGuess)/1stGuess. Similarly, the overlaid black dashed lines mark the
tropopause, white lines mark the total effective cloud top pressure, and the black solid contours of 0.6, 0.8, 1.0 for the mean
H2O verticality.
3.2.2 Temperature
Fig. 6 shows the deviations of temperature final retrievals from the first guess for
CLIMCAPS-SNPP and CLIMCAPS-JPSS1. We see that on average the final retrieved
temperature does not deviate much (~ 0.6 K) from the first guess. The CLIMCAPS retrieval
system plays a relatively more important role in the tropical upper troposphere and the mid-
latitude lower stratosphere, where the retrieval system modifies the first guess from MERRA2
much more than elsewhere. The final CLMACAPS-SNPP NSR retrievals of temperature have
larger magnitudes in modification than the FSR retrievals, which might be because of the less
information content provided by NSR. Because of similar spectral characteristics of the SNPP
FSR and JPSS1 FSR, the two show very similar patterns.

13
Figure 6. Comparing the deviations of final retrieved temperatures from the first guess (MERRA2) for CLIMCAPS-SNPP
FSR (top row), CLIMCAPS-SNPP NSR (middle row), and CLIMCAPS-JPSS1 FSR (bottom row) in scenarios of QC=0
or 1 (left column) and QC=2 (right column). The overlaid black dashed lines mark the tropopause, white lines mark the
total effective cloud top pressure, and the black solid contours of 0.6, 0.8, 1.0 for the mean T verticality.
In Fig. 7 we show the root-mean-square differences (RMSD) of the retrieved temperature
to the first guess for CLIMCAPS-SNPP FSR/NSR (top/middle row) and for CLIMCAPS-
JPSS1 FSR (bottom row) for QC=0 or 1 and QC=2. Again, we see larger RMSD from the first
guess over the entire 100-500 hPa level, indicating that the retrieval system is providing more
information to derive the final temperatures. We see that the deviations in FSR is less than in
NSR mode, this could probably due to better calibration in FSR that could potentially improve
temperature in lower troposphere.

14
Figure 7. Similar to Fig. 6, but with temperature root-mean-squared deviations (RMSD) plotted. The overlaid black dashed
lines mark the tropopause, white lines mark the total effective cloud top pressure, and the black solid contours of 0.6, 0.8,
1.0 for the mean T verticality.
3.3 Biases and RMSE comparing to IGRA
1In the previous section we performed an inter-comparison of CLIMCAPS retrieved
temperature and H2O profiles in terms of retrieval yields and deviations of final retrievals from
their first guesses served by MERRA2. In this section, we explore the biases and root-mean-
square errors (RMSE) of temperature and H2O defined by eqns. (1-4) against the IGRA
radiosonde measurements.
3.3.1 CLIMCAPS collocated to IGRA
Fig. 8a below shows one month (January 2019) of collocated CLIMCAPS-SNPP FSR
profiles (red dots, total 7479) comparing to all IGRA stations (black dots), with a temporal
tolerance within 3 hours and a spatial tolerance within 50 km radius from the sonde sites. Fig.
8c shows that the distances of collocated profiles to IGRA sites have a distribution with peak
at center 25 km. The time differences equally distributed across the 180min window, which
is also shown in the 2D histogram of time differences vs. distances in Fig 8d. Fig. 8b shows
the normalized density distribution of all 7479 profiles, with the most frequent collocations
centered in Europe, where the launching times of the radiosondes are more frequently within
the tolerance from the S-NPP passing times. Because JPSS-1 flies by about 50 minutes ahead
of SNPP, which is within our collocating window of 3-hours, the collocated profiles of
CLIMCAPS-JPSS1 show similar features as in Fig. 8.

15
Figure 8. (a) The IGRA stations (black dots) and successfully collocated CLIMCAPS-SNPP FSR profiles (red dots, total
7479) within 3-hour, 50-km searching criteria for January 2019; (b) the density distribution (%) of all collocated profiles;
(c) histogram of the distance (lower x-axis, blue) and time differences in minutes (upper x-axis, red) from the collocated
records; (d) normalized 2D histogram (%) of time differences (minutes) in function of distance (km) for all 7479 collocated
profiles.
As an example, Fig. 9 shows one collocated T (panel a) and H2O (panel b) profile from the
CLIMCAPS-SNPP during January 1st of 2019, comparing to IGRA station RSM00034009
located in Kursk, Russia (36.2oE and 51.8oN). CLIMCAPS-SNPP T/H2O profiles are located
~37 km away from the radiosonde station and are plotted in blue lines in both panels. The
yellow lines are the original radiosonde in its native vertical resolution. For comparison with
CLIMCAPS retrievals, the radiosonde data are linearly interpolated to the CLIMCAPS 100-
pressure levels. The differences (red, upper x-axis) between the interpolated radiosonde profile
and CLIMCAPS profile are the expected biases. On the right showing the average verticality
(black) of this retrieved profile and the two-layer cloud fraction vs. cloud top pressure (two
green horizontal bars) and the total effective cloud fraction vs. total effective cloud top pressure.
This particular case is a cloudy condition, with upper layer cloud fraction ~50% at 400 hPa
and lower layer cloud fraction ~30% at 900 hPa, which makes the total effective cloud fraction
to be ~80% at 550 hPa. We see that starting from upper layer clouds at 400 hPa, temperature
retrieval has a warm bias of +1 K till ~800 hPa. Then because of the low-level clouds, the bias
becomes larger but in negative direction (cold biased). H2O retrieval is also challenged by
clouds. At both layer of clouds, there is a dry bias of ~30% comparing to the radiosonde. Note
that despite the higher H2O verticality in 300-600 hPa for this case, the existence of clouds
makes the retrieval difficult. This implies that clouds affect the retrieval quality of infrared
sounder tremendously.
Figure 9. One collocated CLIMCAPS-SNPP retrievals (blue) comparing to the IGRA radiosonde observations (orange),
and the differences (retrieval – radiosonde, red) at station Kursk, Russia (ID RSM00034000) located at 36.2oE and 51.8oN
on January 1, 2019 for a) temperature profile and b) H2O profile. On the right of each panel shows the associated verticality
(black) and effective two-layer cloud top pressure vs. cloud fractions (two green horizontal bars) and the total effective
cloud top height vs. total effective cloud fraction (red circle). The light-gray shaded in H2O panel suggests that CrIMSS
starts to lose sensitivity to H2O from 300-hPa level to the above air.
16
3.3.2 Mean Biases and RMSE comparing to IGRA
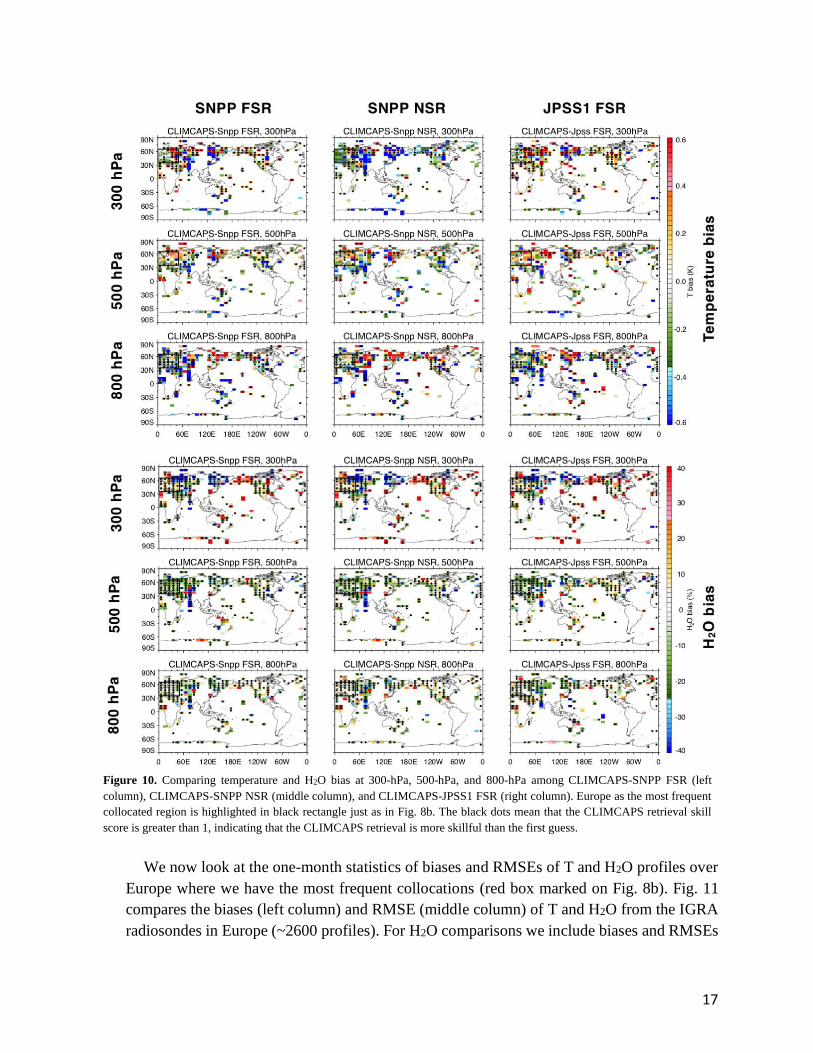
Fig. 10 shows T and H2O biases at 300-hPa, 500-hPa and 800-hPa comparing to the
collocated IGRA. Here, overlaid black dots mark where the CLIMCAPS retrieval is more
skillful than the first guess (skill score > 0). They give us the idea of the spatial distribution
of biases and where the CLIMCAPS outperforms the first guess. For temperature, we see that
there is generally a cold bias at 800-hPa. Gradually to upper level 300-hPa, both SNPP and
JPSS FSR shows warm bias but SNPP NSR shows cold bias at 300-hPa. We also see that in
most of the regions, CLIMCAPS temperature retrievals outperform the first guess, except
over the Europe (the black box) where there is a fair amount of retrievals not necessarily better
than the first guess (MERR2) – when comparing to the IGRA. This is because the MERRA2
temperatures over the Europe region is fairly accurate due to more assimilation of
observations. Therefore, at higher levels (300 hPa or 500 hPa) when there are often more
information content the CLIMCAPS final retrieval might deviate from the first guess (closer
to IGRA); at lower level (800 hPa) when there are less information content the CLIMCAPS
retrieval tend to stick with the first guess and improve it.
The CLIMCAPS H2O retrievals are dry biased across all three levels in all three datasets,
and in almost everywhere the CLIMCAPS outperforms the first guess. This could be because
the MERRA2 assimilated water vapor as first guess is not accurate enough.
17
Figure 10. Comparing temperature and H2O bias at 300-hPa, 500-hPa, and 800-hPa among CLIMCAPS-SNPP FSR (left
column), CLIMCAPS-SNPP NSR (middle column), and CLIMCAPS-JPSS1 FSR (right column). Europe as the most frequent
collocated region is highlighted in black rectangle just as in Fig. 8b. The black dots mean that the CLIMCAPS retrieval skill
score is greater than 1, indicating that the CLIMCAPS retrieval is more skillful than the first guess.
We now look at the one-month statistics of biases and RMSEs of T and H2O profiles over
Europe where we have the most frequent collocations (red box marked on Fig. 8b). Fig. 11
compares the biases (left column) and RMSE (middle column) of T and H2O from the IGRA
radiosondes in Europe (~2600 profiles). For H2O comparisons we include biases and RMSEs
18
in both relative magnitude (eqns. 3-4) and absolute magnitude (eqns. 1-2). The comparisons
of CLIMCAPS against IGRA are plotted in solid lines, and the comparisons of first guess
(MERRA2) against IGRA are plotted in dashed lines. We see that the final retrieval biases
(solid lines) are almost always smaller than the biases from first guess (dashed lines) for H2O,
indicating that the retrieval system manages to reduce the uncertainty and yields results closer
to the radiosonde measurements. The temperature first guess, on the other hand, has smaller
bias because the MERRA2 temperatures are in unexceptional quality.
Over our selected region in Europe, the temperature retrievals perform really well with a
bias mostly within 0.3 K and RMSE less than 0.4 K below the tropopause (~300 hPa).
Above the tropopause, CLIMCAPS-SNPP NSR retrievals show a cold-bias of ~ -0.4 K on
average, deviating from the first guess in a substantial amount. This could be caused by a few
reasons such as the older forward model in NSR mode and the less information content and
slightly worse calibration in NSR,
The H2O bias has a larger dynamic range from 600-hPa to the tropopause, with RMSE
peaks at the tropopause, most likely because of the existence of clouds that makes the retrieval
more challenging in this altitude. To better interpret the results, we also included the mean
verticality and associated cloud conditions on the right column (panels c, f). In general, the
H2O bias over Europe is readily controlled within 15% on average comparing to what IGRA
observes. If we look at the absolute bias in mass mixing ratio, we see that instead of having
the lowest percentage bias and RMSE near the surface, in absolute differences the H2O bias
is higher near the lower troposphere and the bias could be as high as 0.03 g/kg and the RMSE
could be as high as 0.4-0.5 g/kg. This further justifies that a more proper comparison of H2O
should be taken at the relative difference point of view, as shown in Fig. 3.

19
Figure 11. Biases (left column) and RMSEs (middle column) for T (first row), for H2O in percentage
(middle row, %), and for H2O in absolute differences (g/kg) over Europe for CLIMCAPS-SNPP FSR
(red), -SNPP NSR (orange), and CLIMCAPS-JPSS1 FSR (blue) in January 2019, when comparing to
IGRA observations. The right column shows the mean CLIMCAPS verticality (solid lines) of those ~2600
collocated profiles and their associated cloud conditions, with effective two-layer cloud top pressure vs.
effective two-layer cloud fractions indicated by the blue horizontal bars and the total effective cloud top
pressure vs. total effective cloud fraction marked in circles.
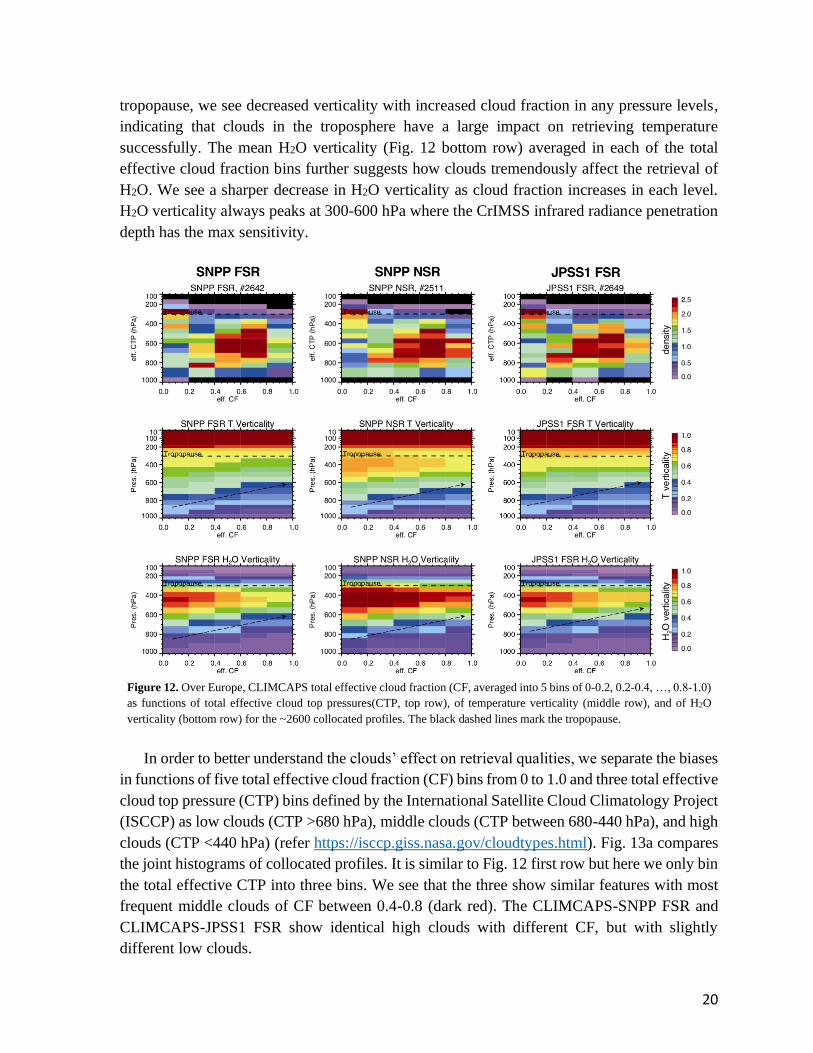
3.3.3 Clouds’ impact on CLIMCAPS retrievals In this section we plot the CLIMCAPS results in function of cloud fractions. In Fig. 12, the
top row shows the occurring frequencies examined for each profile over Europe as a function
of its reported total effective cloud fractions (x-axis, 0.2 interval from 0 to 1) and total effective
cloud top pressure (y-axis). Here, all numbers are normalized to sum up to 100%. We see that
the retrieved cloud conditions in three CLIMCAPS results are quite similar: cloud fractions >
0.5 are more frequently located in the lower troposphere from 800 to 500 hPa. Meanwhile, the
mean temperature verticality (Fig. 12 middle row) averaged in each of the total effective cloud
fraction bins (i.e., 0-0.2, 0.2-0.4, … 0.8-1.0) for the three CLIMCAPS retrieval types show
similar features as well. CrIMSS has more information content above the tropopause, where
the information content does not change much with increased cloud fractions. This means that
the temperature retrievals are not affected as much by clouds above the tropopause. Below the
20
tropopause, we see decreased verticality with increased cloud fraction in any pressure levels,
indicating that clouds in the troposphere have a large impact on retrieving temperature
successfully. The mean H2O verticality (Fig. 12 bottom row) averaged in each of the total
effective cloud fraction bins further suggests how clouds tremendously affect the retrieval of
H2O. We see a sharper decrease in H2O verticality as cloud fraction increases in each level.
H2O verticality always peaks at 300-600 hPa where the CrIMSS infrared radiance penetration
depth has the max sensitivity.
Figure 12. Over Europe, CLIMCAPS total effective cloud fraction (CF, averaged into 5 bins of 0-0.2, 0.2-0.4, …, 0.8-1.0)
as functions of total effective cloud top pressures(CTP, top row), of temperature verticality (middle row), and of H2O
verticality (bottom row) for the ~2600 collocated profiles. The black dashed lines mark the tropopause.
In order to better understand the clouds’ effect on retrieval qualities, we separate the biases
in functions of five total effective cloud fraction (CF) bins from 0 to 1.0 and three total effective
cloud top pressure (CTP) bins defined by the International Satellite Cloud Climatology Project
(ISCCP) as low clouds (CTP >680 hPa), middle clouds (CTP between 680-440 hPa), and high
clouds (CTP <440 hPa) (refer https://isccp.giss.nasa.gov/cloudtypes.html). Fig. 13a compares
the joint histograms of collocated profiles. It is similar to Fig. 12 first row but here we only bin
the total effective CTP into three bins. We see that the three show similar features with most
frequent middle clouds of CF between 0.4-0.8 (dark red). The CLIMCAPS-SNPP FSR and
CLIMCAPS-JPSS1 FSR show identical high clouds with different CF, but with slightly
different low clouds.

21
Fig. 13b shows the H2O retrieval biases (CLIMCAPS – radiosonde) and first guess biases
(FG – radiosondes) averaged in each bin of panel a, with mean total effective CTP marked in
horizontal thin lines. The ratio (%) of each bin relative to each dataset (as total 100%) is also
marked in the lower right corner of each panel; those numbers repeat what’s showing in panel
a. We can clearly see that the H2O first guess bias is larger than the retrieval bias, indicating
that the retrieval system managed to correct the first guess closer to the truth (radiosonde
observations). The large correction most often occurs between 300-600 hPa where the H2O
verticality peaks at (Fig. 12 bottom panel), implying that more information content is available
in this portion of the atmosphere to help correct the first guess. Meanwhile, for clouds with
similar CTP, the H2O retrieval biases increase with increased cloud fraction. For example, for
high clouds with CTP < 440 hPa (top row in panel b), we see that the H2O retrieval biases
increase from ~5% when CF<0.2 to about -30% when CF > 0.8. In most of the scenarios the
three datasets perform similarly.
Figure 13. (a) Joint histogram of occurring frequencies of all collocated profiles within the Europe reorganized in functions
of five total effective cloud fraction (CF) bins from 0 to 1.0 (x-axis) and three total effective cloud top pressure (CTP) bins
(y-axis) defined by the International Satellite Cloud Climatology Project (ISCCP) as low clouds (CTP >680 hPa), middle
clouds (CTP between 680-440 hPa), and high clouds (CTP <440 hPa). (b) the H2O retrieval and first guess biases (both
in % relative to the radiosonde) in each of the bin defined by total effective cloud fraction (CF) and total effective cloud
top pressure (CTP) in panel a). For easy visualization the H2O bias profiles are smoothed with 3-point moving window
vertically. In panel b) the dashed black lines are tropopause; the thin horizontal lines mark the mean total effective CTP;
the ratio (%) of each bin relative to each dataset (as total 100%) is marked in lower right corner of each panel (those
numbers repeat what’s showing in panel a).
22
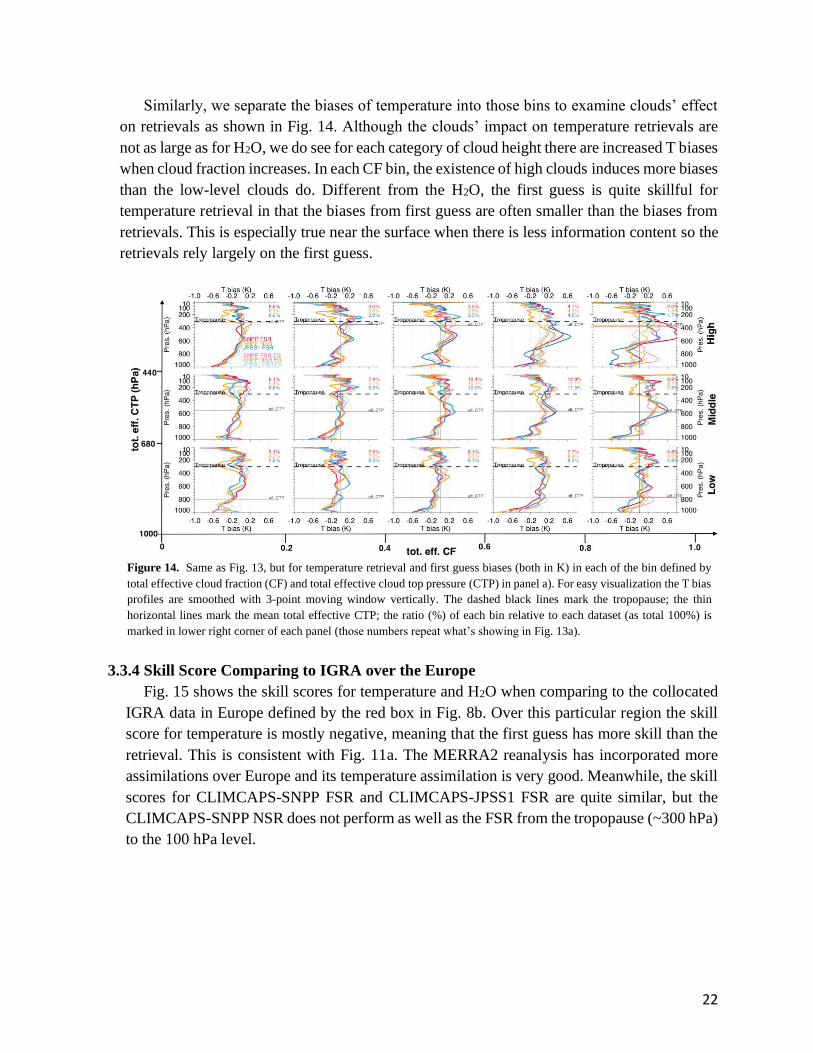
Similarly, we separate the biases of temperature into those bins to examine clouds’ effect
on retrievals as shown in Fig. 14. Although the clouds’ impact on temperature retrievals are
not as large as for H2O, we do see for each category of cloud height there are increased T biases
when cloud fraction increases. In each CF bin, the existence of high clouds induces more biases
than the low-level clouds do. Different from the H2O, the first guess is quite skillful for
temperature retrieval in that the biases from first guess are often smaller than the biases from
retrievals. This is especially true near the surface when there is less information content so the
retrievals rely largely on the first guess.
Figure 14. Same as Fig. 13, but for temperature retrieval and first guess biases (both in K) in each of the bin defined by
total effective cloud fraction (CF) and total effective cloud top pressure (CTP) in panel a). For easy visualization the T bias
profiles are smoothed with 3-point moving window vertically. The dashed black lines mark the tropopause; the thin
horizontal lines mark the mean total effective CTP; the ratio (%) of each bin relative to each dataset (as total 100%) is
marked in lower right corner of each panel (those numbers repeat what’s showing in Fig. 13a).
3.3.4 Skill Score Comparing to IGRA over the Europe
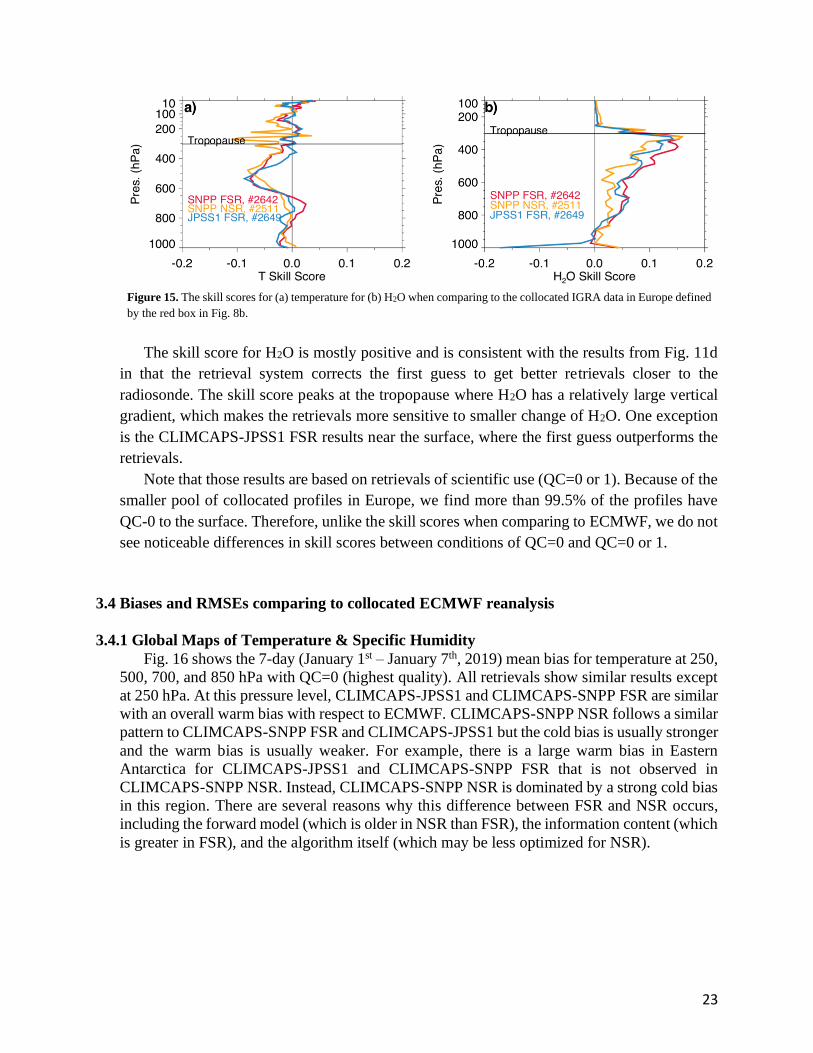
Fig. 15 shows the skill scores for temperature and H2O when comparing to the collocated
IGRA data in Europe defined by the red box in Fig. 8b. Over this particular region the skill
score for temperature is mostly negative, meaning that the first guess has more skill than the
retrieval. This is consistent with Fig. 11a. The MERRA2 reanalysis has incorporated more
assimilations over Europe and its temperature assimilation is very good. Meanwhile, the skill
scores for CLIMCAPS-SNPP FSR and CLIMCAPS-JPSS1 FSR are quite similar, but the
CLIMCAPS-SNPP NSR does not perform as well as the FSR from the tropopause (~300 hPa)
to the 100 hPa level.
23
Figure 15. The skill scores for (a) temperature for (b) H2O when comparing to the collocated IGRA data in Europe defined
by the red box in Fig. 8b.
The skill score for H2O is mostly positive and is consistent with the results from Fig. 11d
in that the retrieval system corrects the first guess to get better retrievals closer to the
radiosonde. The skill score peaks at the tropopause where H2O has a relatively large vertical
gradient, which makes the retrievals more sensitive to smaller change of H2O. One exception
is the CLIMCAPS-JPSS1 FSR results near the surface, where the first guess outperforms the
retrievals.
Note that those results are based on retrievals of scientific use (QC=0 or 1). Because of the
smaller pool of collocated profiles in Europe, we find more than 99.5% of the profiles have
QC-0 to the surface. Therefore, unlike the skill scores when comparing to ECMWF, we do not
see noticeable differences in skill scores between conditions of QC=0 and QC=0 or 1.
3.4 Biases and RMSEs comparing to collocated ECMWF reanalysis
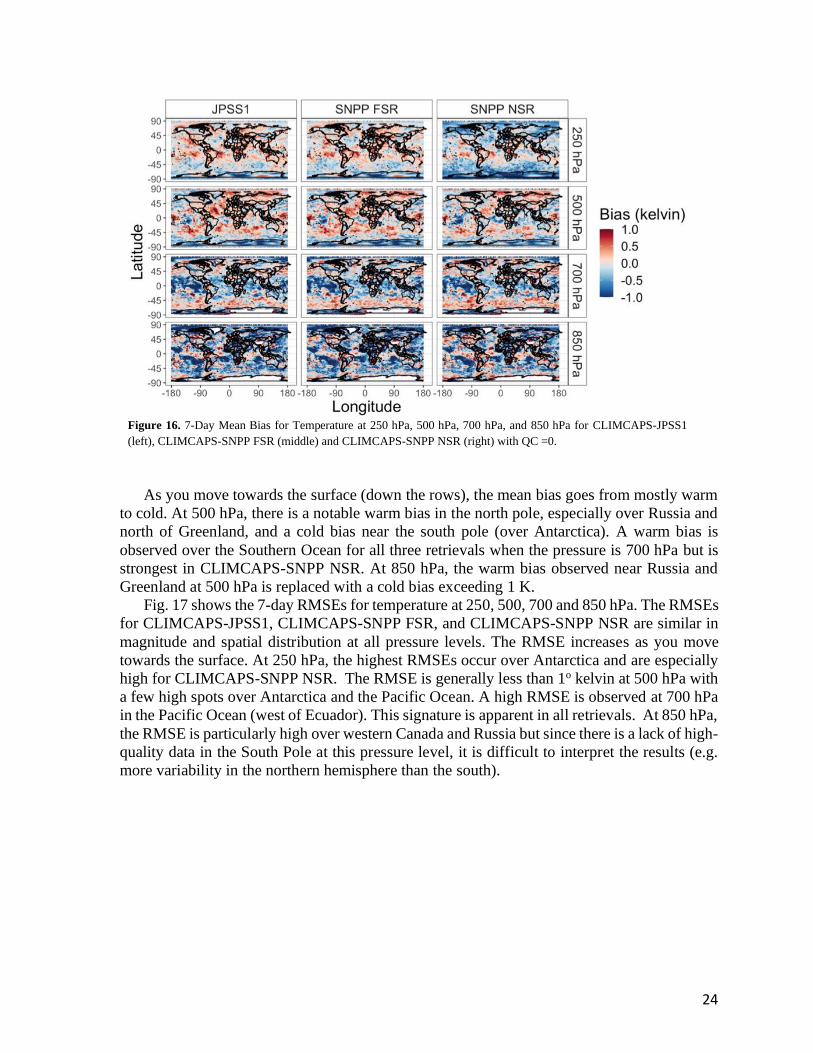
3.4.1 Global Maps of Temperature & Specific Humidity Fig. 16 shows the 7-day (January 1st – January 7th, 2019) mean bias for temperature at 250,
500, 700, and 850 hPa with QC=0 (highest quality). All retrievals show similar results except
at 250 hPa. At this pressure level, CLIMCAPS-JPSS1 and CLIMCAPS-SNPP FSR are similar
with an overall warm bias with respect to ECMWF. CLIMCAPS-SNPP NSR follows a similar
pattern to CLIMCAPS-SNPP FSR and CLIMCAPS-JPSS1 but the cold bias is usually stronger
and the warm bias is usually weaker. For example, there is a large warm bias in Eastern
Antarctica for CLIMCAPS-JPSS1 and CLIMCAPS-SNPP FSR that is not observed in
CLIMCAPS-SNPP NSR. Instead, CLIMCAPS-SNPP NSR is dominated by a strong cold bias
in this region. There are several reasons why this difference between FSR and NSR occurs,
including the forward model (which is older in NSR than FSR), the information content (which
is greater in FSR), and the algorithm itself (which may be less optimized for NSR).
24
Figure 16. 7-Day Mean Bias for Temperature at 250 hPa, 500 hPa, 700 hPa, and 850 hPa for CLIMCAPS-JPSS1
(left), CLIMCAPS-SNPP FSR (middle) and CLIMCAPS-SNPP NSR (right) with QC =0.
As you move towards the surface (down the rows), the mean bias goes from mostly warm
to cold. At 500 hPa, there is a notable warm bias in the north pole, especially over Russia and
north of Greenland, and a cold bias near the south pole (over Antarctica). A warm bias is
observed over the Southern Ocean for all three retrievals when the pressure is 700 hPa but is
strongest in CLIMCAPS-SNPP NSR. At 850 hPa, the warm bias observed near Russia and
Greenland at 500 hPa is replaced with a cold bias exceeding 1 K.
Fig. 17 shows the 7-day RMSEs for temperature at 250, 500, 700 and 850 hPa. The RMSEs
for CLIMCAPS-JPSS1, CLIMCAPS-SNPP FSR, and CLIMCAPS-SNPP NSR are similar in
magnitude and spatial distribution at all pressure levels. The RMSE increases as you move
towards the surface. At 250 hPa, the highest RMSEs occur over Antarctica and are especially
high for CLIMCAPS-SNPP NSR. The RMSE is generally less than 1o kelvin at 500 hPa with
a few high spots over Antarctica and the Pacific Ocean. A high RMSE is observed at 700 hPa
in the Pacific Ocean (west of Ecuador). This signature is apparent in all retrievals. At 850 hPa,
the RMSE is particularly high over western Canada and Russia but since there is a lack of high-
quality data in the South Pole at this pressure level, it is difficult to interpret the results (e.g.
more variability in the northern hemisphere than the south).

25
Figure 17. 7-Day RMSE for Temperature at 250 hPa, 500 hPa, 700 hPa, and 850 hPa for CLIMCAPS-JPSS1
(left), CLIMCAPS-SNPP FSR (middle) and CLIMCAPS-SNPP NSR (right) with QC = 0.
Fig. 18 shows the 7-day mean biases (normalized as a percent) for specific humidity at 250,
500, 700, and 850 hPa. Unlike temperature at 250 hPa, CLIMCAPS-JPSS1, CLIMCAPS-
SNPP FSR, and CLIMCAPS-SNPP NSR show similar results. The largest fractional error
occurs at the poles. Very dry values, however, occur in this spatial region so a small absolute
bias can produce a large fractional error. A much smaller error (~10% range) is observed
between 50oS and 40oN for all three retrievals at this pressure level. This sharp sudden change
in the bias depends on the tropopause location as the drier stratosphere is more outside the
sensitivity of the instruments.
The mean bias is smallest and mostly dry at 500 hPa. While at 700 hPa the bias becomes
wetter, especially over the Southern Ocean where the bias begins to exceed 20%. A large wet
bias occurs off the coast of Russia (Pacific Ocean) at 850 hPa. This feature is observed in all
three retrievals. In addition, at this pressure level, a consistent dry bias of about 10% is
observed over the Arctic Ocean while a wet bias (> 20%) spans the Atlantic Ocean from the
coast of Brazil to the coast of Namibia and Angola.

26
Figure 18. 7-Day Mean Bias for Specific Humidity (as a percent) at 250 hPa, 500 hPa, 700 hPa, and 800 hPa for
CLIMCAPS-JPSS1 (left), CLIMCAPS-SNPP FSR (middle) and CLIMCAPS-SNPP NSR (right) with QC =0.
Fig. 19 shows the corresponding normalized RMSEs (in percentage) for specific humidity.
In most cases, regions of large biases correlate to regions of high RMSE. All three retrievals
show remarkably similar results regardless of the pressure level. The largest variability occurs
at 250 hPa (also where the largest bias was observed). The RMSE at 250 hPa is highest over
Antarctica (> 70%) and the northern border of Russia. At 500 hPa, the RMSE is smaller
(generally less than 25%), although some high RMSEs occur over the ocean, in particular a
large red feature (high RMSE) is observed in the Gulf of Mexico. The RMSE at 700 hPa is
very similar to that observed at 500 hPa, albeit a few higher values over the Southern Ocean
and the Pacific Ocean south of Alaska. At 850 hPa, the RMSE is relatively small (typically
less than 20%).

27
Figure 19. 7-Day RMSE for Specific Humidity (in percentage) at 250 hPa, 500 hPa, 700 hPa, and 850 hPa for
CLIMCAPS-JPSS1 (left), CLIMCAPS-SNPP FSR (middle) and CLIMCAPS-SNPP NSR (right) with QC = 0.
3.4.2 Global Mean Plots of Temperature & Specific Humidity
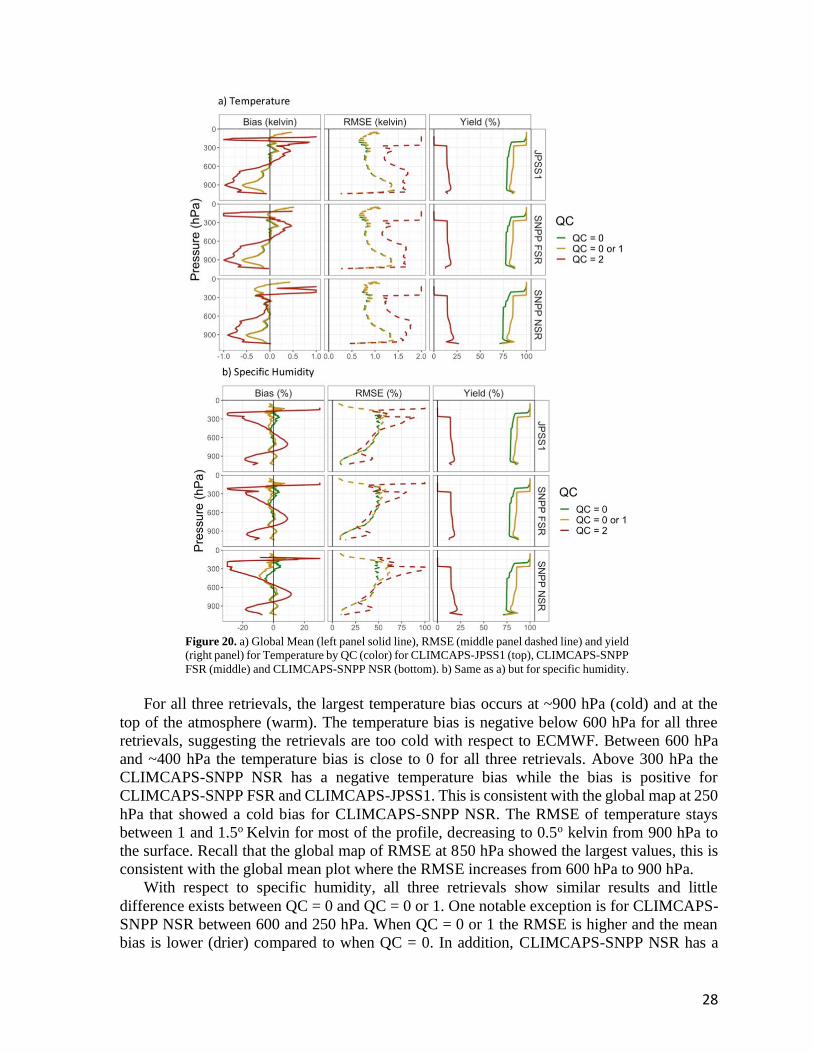
Fig. 20 shows the global mean bias, RMSE, and yield over the 7-day period (January 1st –
January 7th 2019) for CLIMCAPS-JPSS1, CLIMCAPS-SNPP FSR, and CLIMCAPS-SNPP
NSR for a) temperature and b) specific humidity. Similar to previous results, the yields above
~200 hPa are low for QC = 2. As expected, the bias and RMSE become larger as the QC
increases. When QC =0 (highest quality) and QC = 0 or 1 (good quality), the mean bias and
RMSE are almost identical for temperature and specific humidity.
28
Figure 20. a) Global Mean (left panel solid line), RMSE (middle panel dashed line) and yield
(right panel) for Temperature by QC (color) for CLIMCAPS-JPSS1 (top), CLIMCAPS-SNPP
FSR (middle) and CLIMCAPS-SNPP NSR (bottom). b) Same as a) but for specific humidity.
For all three retrievals, the largest temperature bias occurs at ~900 hPa (cold) and at the
top of the atmosphere (warm). The temperature bias is negative below 600 hPa for all three
retrievals, suggesting the retrievals are too cold with respect to ECMWF. Between 600 hPa
and ~400 hPa the temperature bias is close to 0 for all three retrievals. Above 300 hPa the
CLIMCAPS-SNPP NSR has a negative temperature bias while the bias is positive for
CLIMCAPS-SNPP FSR and CLIMCAPS-JPSS1. This is consistent with the global map at 250
hPa that showed a cold bias for CLIMCAPS-SNPP NSR. The RMSE of temperature stays
between 1 and 1.5o Kelvin for most of the profile, decreasing to 0.5o kelvin from 900 hPa to
the surface. Recall that the global map of RMSE at 850 hPa showed the largest values, this is
consistent with the global mean plot where the RMSE increases from 600 hPa to 900 hPa.
With respect to specific humidity, all three retrievals show similar results and little
difference exists between QC = 0 and QC = 0 or 1. One notable exception is for CLIMCAPS-
SNPP NSR between 600 and 250 hPa. When QC = 0 or 1 the RMSE is higher and the mean
bias is lower (drier) compared to when QC = 0. In addition, CLIMCAPS-SNPP NSR has a
29
stronger dry bias between 600 hPa and 300 hPa compared to what is observed in CLIMCAPS-
JPSS1 and CLIMCAPS-SNPP FSR.
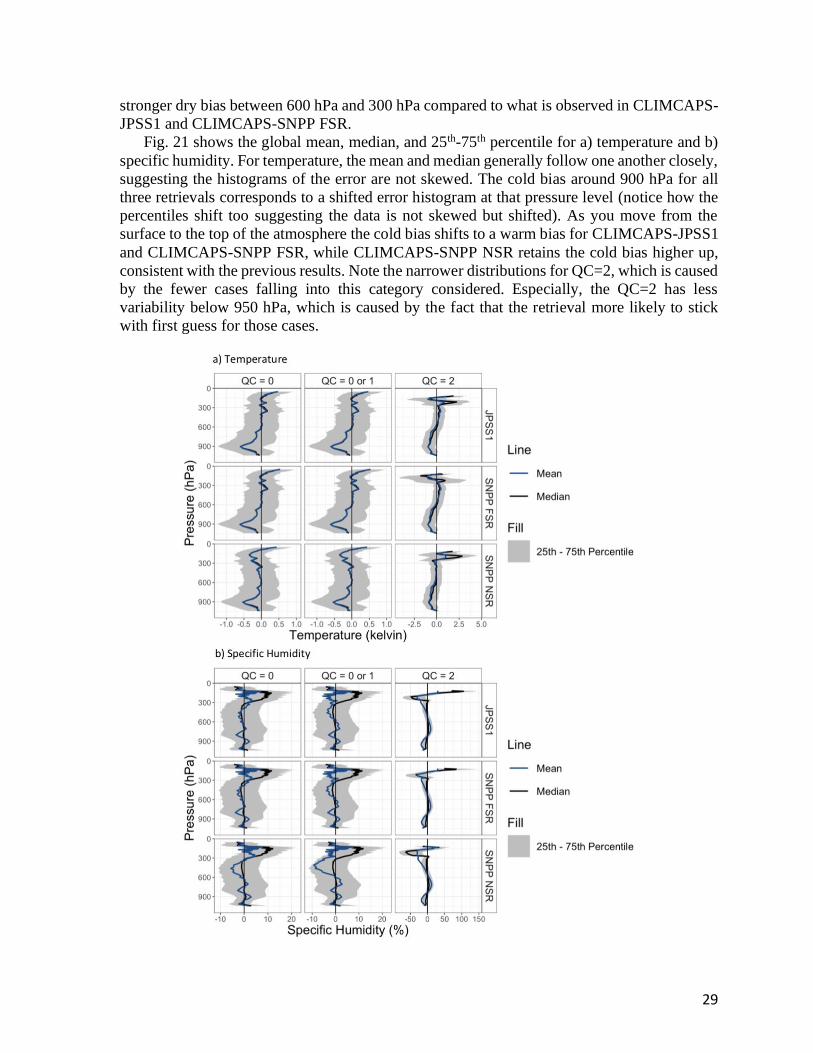
Fig. 21 shows the global mean, median, and 25th-75th percentile for a) temperature and b)
specific humidity. For temperature, the mean and median generally follow one another closely,
suggesting the histograms of the error are not skewed. The cold bias around 900 hPa for all
three retrievals corresponds to a shifted error histogram at that pressure level (notice how the
percentiles shift too suggesting the data is not skewed but shifted). As you move from the
surface to the top of the atmosphere the cold bias shifts to a warm bias for CLIMCAPS-JPSS1
and CLIMCAPS-SNPP FSR, while CLIMCAPS-SNPP NSR retains the cold bias higher up,
consistent with the previous results. Note the narrower distributions for QC=2, which is caused
by the fewer cases falling into this category considered. Especially, the QC=2 has less
variability below 950 hPa, which is caused by the fact that the retrieval more likely to stick
with first guess for those cases.
30
Figure 21. a) Global Mean (solid blue line), Median (solid black line) and 25th-75th Percentile
(gray ribbon) for Temperature with QC = 0 (left), QC = 0 or 1 (middle) and QC = 2 (right) for
CLIMCAPS-JPSS1 (top), CLIMCAPS-SNPP FSR (middle) and CLIMCAPS-SNPP NSR
(bottom). b) Same as a) but for Specific Humidity.
For specific humidity, the mean does not follow the median as closely as observed in
temperature, suggesting outliers are skewing the results. In particular, between 300 and 100
hPa all retrievals have a small mean (close to 0) but a large positive (wet) median (~10 %).
Furthermore, the mean falls outside the 25th-75th percentile range. Outliers may be skewing the
data and therefore the mean should be interpreted cautiously here. In addition, CLIMCAPS-
SNPP NSR shows deviations from the mean for QC = 0 and especially for QC = 0 or 1 between
600 and 300 hPa. Further analysis on the distribution of the error (CLIMCAPS-ECMWF) is
needed to understand the impact of outliers in more detail.
3.4.3 Zonal Mean Plots of Temperature and Specific Humidity
Fig. 22 shows the zonal bias and RMSE for a) Temperature and b) Specific Humidity with
QC =0. For temperature, a warm bias is observed between 50oS and 50oN when the pressure
is between ~500 hPa and ~250 hPa. In addition, a warm bias is consistently observed above
100 hPa, regardless of the latitude zone, for all retrievals. Between ~250 hPa and ~100 hPa the
bias is warm over most latitude zones in CLIMCAPS-SNPP FSR and CLIMCAPS-JPSS1 but
cold for CLIMCAPS-SNPP NSR. This is consistent with the cold bias observed in the global
mean and global map at 250 hPa shown in Fig. 17. The RMSE for the three retrievals is similar
and is highest at the surface for all latitudes and at the top of atmosphere in the tropics. Again,
this is consistent with the global maps in which the RMSE was highest at 850 hPa. For specific
humidity, a similar structure is observed for all three retrievals for both the mean bias and
RMSE. In particular, a wet bias at the poles and a dry bias at the tropics is observed between
300 and 100 hPa. This is consistent with the global map at 250 hPa shown in Fig. 16. Between
the surface and 300 hPa the bias tends to be slightly wet. The RMSE for specific humidity is
largest at the poles between 300 and 200 hPa for all three retrievals, consistent with the
previous results. Above 100 hPa the RMSE is small (< 25%).

31
Figure 22. a) Zonal Mean Bias (top) and RMSE (bottom) for CLIMCAPS-JPSS1 (left),
CLIMCAPS-SNPP FSR (middle) and CLIMCAPS-SNPP NSR (right) for Temperature with QC =
0. b) Same as a) but for Specific Humidity.
Conditional plots will now be examined. The goal of a conditional plot is to explain
observed features in the biases and RMSEs by using other variables. Zonal means will be
presented. The conditional variables are: total effective cloud fraction, total effective cloud top
pressure, MW surface class, and orbit direction. These variables come from the CLIMCAPS
retrieval. The cloud top pressure has been binned into cloud top heights of: ‘low (1000-680
hPa)’, ‘medium (680 – 440 hPa)’, and ‘high (above 440 hPa)’. These bins were selected using
the International Satellite Cloud Climatology Project (ISCCP) Cloud-type map
(https://isccp.giss.nasa.gov/cloudtypes.html).
Fig. 23 shows the zonal mean bias for a) Temperature and b) Specific Humidity
conditioned by orbital direction with QC = 0. For temperature, ascending and descending show
a similar structure that is very consistent with the zonal means shown in Fig. 22. Furthermore,
all three retrievals show consistent results (except for the notable cold bias above 250 hPa for

32
CLIMCAPS-SNPP NSR). A cold bias occurs throughout the whole profile for CLIMCAPS-
SNPP NSR for both ascending and descending over the south pole, whereas a warm bias occurs
above 250 hPa in CLIMCAPS-JPSS1 and CLIMCAPS-SNPP FSR. In addition, CLIMAPS-
SNPP NSR shows a cold bias in the north pole above 250 hPa that is flipped (warm bias) for
the other two retrievals. CLIMCAPS-SNPP NSR does show the similar warm bias feature
around 600 hPa in the north pole that is observed in the other two retrievals, suggesting the
primary problem lies above 250 hPa.
Unlike temperature, specific humidity from CLIMCAPS-JPSS1, CLIMCAPS-SNPP FSR,
and CLIMCAPS-SNPP NSR exhibit similar behaviors regardless of pressure level or orbital
direction. A large wet bias occurs between 300 and 100 hPa over the north and south pole for
all three retrievals regardless of orbital direction. Since ascending and descending show similar
patterns that match the zonal mean in Fig. 22, there is likely no artificial difference due to
orbital direction.
Figure 23. a) Zonal Mean Bias for CLIMCAPS-JPSS1 (top), CLIMCAPS-SNPP FSR (middle) and
CLIMCAPS-SNPP NSR (bottom) for Temperature with QC = 0 Conditioned by Orbital Direction. b)
Same as a) but for Specific Humidity.

33
Fig. 24 shows the zonal mean bias for a) Temperature and b) Specific Humidity
conditioned by microwave surface class with QC = 0. For temperature, there is a lot of
variability when the class is Glacier/Snow, Snow (higher-freq.) and Snow (lower-freq.). For
these classes, the zonal pattern from Fig. 22 begins to break. For the other classes, however,
the same structure from Fig. 22 is observed. This suggests that snow, in particular, may cause
the most variability in the retrieval. Since this result is consistent among the three retrievals
(CLIMCAPS-JPSS1, CLIMCAPS-SNPP FSR, and CLIMCAPS-SNPP NSR), MW surface
class does not explain the cold bias above 250 hPa observed in CLIMCAPS-SNPP NSR but
suggests a general uncertainty when retrieving over snow or ice conditions.
Figure 24. a) Zonal Mean Bias for CLIMCAPS-JPSS1 (top), CLIMCAPS-SNPP FSR (middle) and CLIMCAPS-SNPP NSR
(bottom) for Temperature with QC = 0 Conditioned by MW Surface Class. b) Same as a) but for Specific Humidity.
Similar variability is observed for specific humidity when the surface class is
Glacier/Snow, Snow (higher-freq.) and Snow (lower-freq.). This variability may explain the
deviation of the mean from the median in Fig. 21 between 300 hPa and 100 hPa. Recall that
the mean bias was close to 0 but the median was ~10% (wet bias) for this pressure range. If
34
strong dry outliers occur for these surface classes, as seen, in particular, for Snow (lower-freq.),
the mean may be pulled to drier values. In addition, there is a bit of variability in the land class
around 60oS-70oS. This, however, may be due to poor sampling as very little land is observed
in this latitude bin which is dominated by the Southern Ocean. Further investigation into the
error distribution for each of these classes is needed to better understand potential outliers as
well as a deeper look at the potential sampling biases.
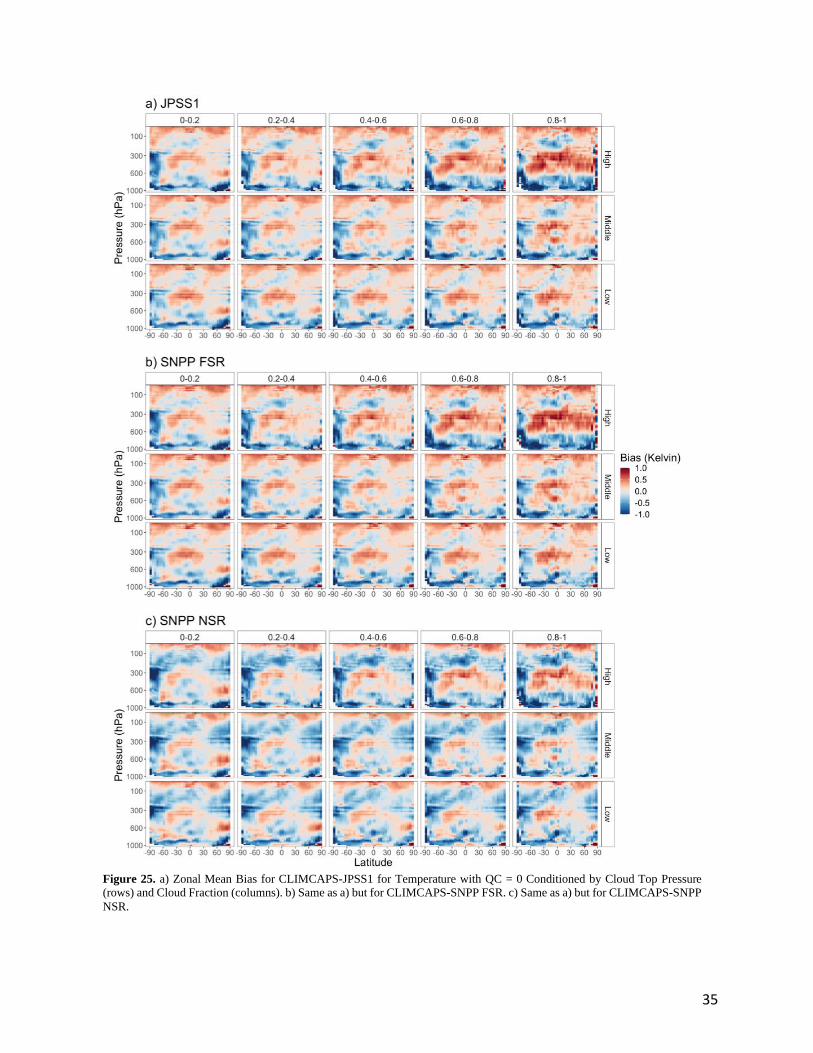
Fig. 25 shows the zonal mean bias of temperature for a) CLIMCAPS-JPSS1, b)
CLIMCAPS-SNPP FSR, and c) CLIMCAPS-SNPP NSR conditioned by cloud fraction and
cloud top pressure with QC = 0. The columns represent the cloud fraction and the rows are the
cloud top heights (determined by the cloud top pressure). All retrievals have a similar structure
that doesn’t change much from the zonal mean shown in Fig. 22. However, there are some
subtle differences. The strongest bias (both positive and negative) occurs when the cloud top
height is high and the cloud fraction is large. Larger biases (both negative and positive) occur
for cloud top heights that are high (bottom row) rather than large cloud fractions (right column).
This suggests that a high cloud top impacts the final retrieval more than a low cloud with a
large cloud fraction. With respect to the CLIMCAPS-SNPP NSR cold bias above 300 hPa,
nothing in terms of clouds really explains this bias. Generally, the CLIMCAPS final
temperature retrieval is too warm in the middle part of the atmosphere when the cloud top
height is high and the cloud fraction is large and too cold in the south pole between the surface
and ~300 hPa, regardless of the cloud height or fraction.
35
Figure 25. a) Zonal Mean Bias for CLIMCAPS-JPSS1 for Temperature with QC = 0 Conditioned by Cloud Top Pressure
(rows) and Cloud Fraction (columns). b) Same as a) but for CLIMCAPS-SNPP FSR. c) Same as a) but for CLIMCAPS-SNPP
NSR.
36
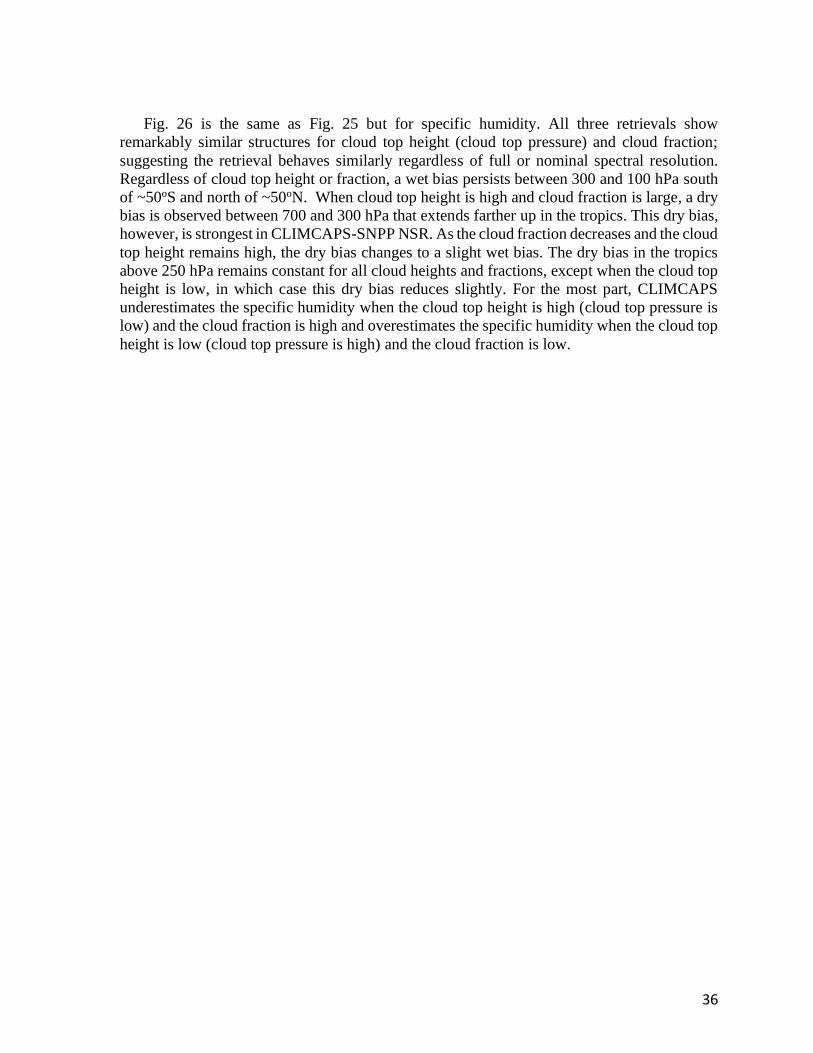
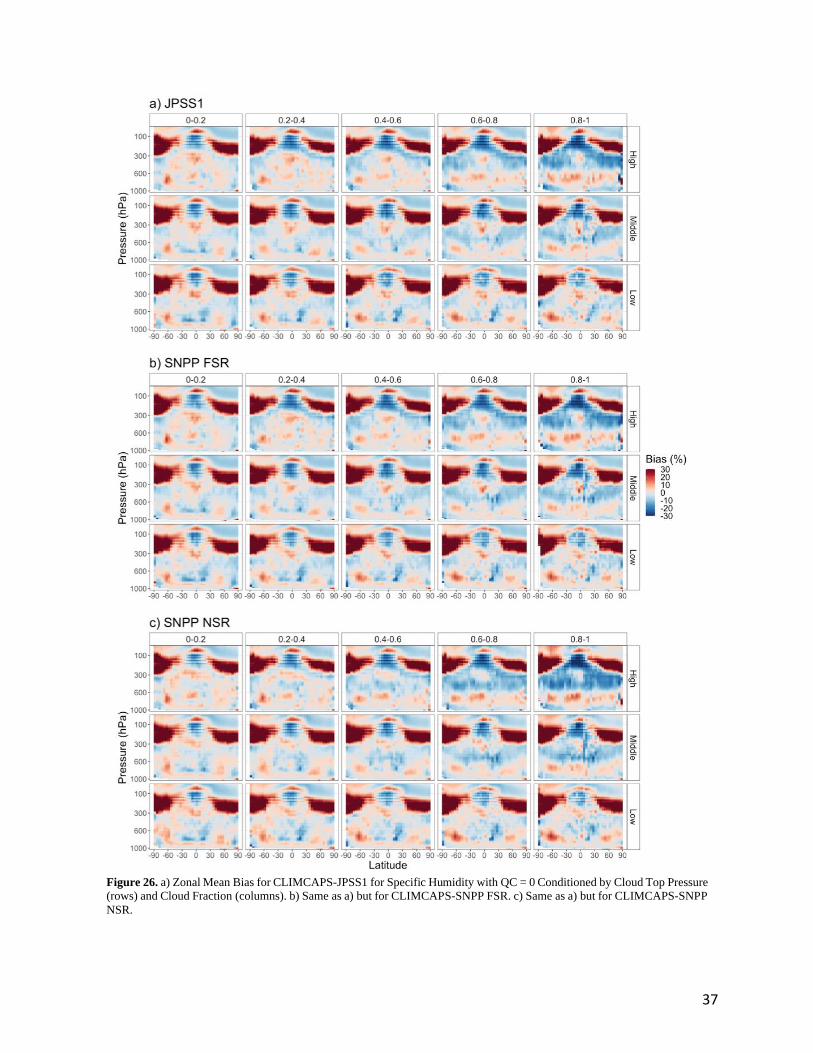
Fig. 26 is the same as Fig. 25 but for specific humidity. All three retrievals show
remarkably similar structures for cloud top height (cloud top pressure) and cloud fraction;
suggesting the retrieval behaves similarly regardless of full or nominal spectral resolution.
Regardless of cloud top height or fraction, a wet bias persists between 300 and 100 hPa south
of ~50oS and north of ~50oN. When cloud top height is high and cloud fraction is large, a dry
bias is observed between 700 and 300 hPa that extends farther up in the tropics. This dry bias,
however, is strongest in CLIMCAPS-SNPP NSR. As the cloud fraction decreases and the cloud
top height remains high, the dry bias changes to a slight wet bias. The dry bias in the tropics
above 250 hPa remains constant for all cloud heights and fractions, except when the cloud top
height is low, in which case this dry bias reduces slightly. For the most part, CLIMCAPS
underestimates the specific humidity when the cloud top height is high (cloud top pressure is
low) and the cloud fraction is high and overestimates the specific humidity when the cloud top
height is low (cloud top pressure is high) and the cloud fraction is low.
37
Figure 26. a) Zonal Mean Bias for CLIMCAPS-JPSS1 for Specific Humidity with QC = 0 Conditioned by Cloud Top Pressure
(rows) and Cloud Fraction (columns). b) Same as a) but for CLIMCAPS-SNPP FSR. c) Same as a) but for CLIMCAPS-SNPP
NSR.

38
3.4.4 Skill Score When Comparing to ECMWF Fig. 27 shows the global mean skill score for a) Temperature and b) Specific Humidity.
For all three retrievals, the skill score for temperature is close to 0 for most of the profile
suggesting little difference between the final retrieval and the first guess (when QC = 0 or 1).
For CLIMCAPS-JPSS1 and CLIMCAPS-SNPP FSR a slight increase in skill score (greater
than 0) occurs between 500 and 150 hPa. A large negative skill score is observed in
CLIMCAPS-SNPP NSR above 300 hPa that is not observed in CLIMCAPS-JPSS1 or
CLIMCAPS-SNPP FSR. Since the skill score is negative at this pressure level, the final
retrieval is worse (with respect to ECMWF) than the first guess. Recall that CLIMCAPS-SNPP
NSR had a consistently cold bias in this same pressure region that was not observed in
CLIMCAPS-SNPP FSR or CLIMCAPS-JPSS1. Because of these consistent results, caution
should be practiced when using the temperature retrieval from CLIMCAPS-SNPP NSR above
300 hPa.
We also noticed that the QC=2 has positive skill over the first guess near the surface. This
is caused by the yield issue at that level that there are only a few tens of samples being
considered.
Figure 27. a) Global Mean Skill Score for Temperature by QC (color) for CLIMCAPS-JPSS1 (top), CLIMCAPS-SNPP FSR
(middle) and CLIMCAPS-SNPP NSR (bottom). b) Same as a) but for Specific Humidity.
Unlike temperature, where the final retrieval does not change much from the first guess,
specific humidity deviates more making the skill score an interesting tool to assess whether
that deviation is good or not. For all of the retrievals, QC = 2 has the lowest skill score while
QC = 0 has the highest, suggesting that the quality control is correctly flagging bad retrievals.
For most of the profile, the final retrieval has more skill than the first guess, particularly
between 600 and 200 hPa, where H2O verticality peaks. Between the surface and 900 hPa the
first guess tends to have more skill than the final retrieval regardless of the quality control. One

39
notable feature is the decreased skill from CLIMCAPS-SNPP NSR when QC = 0 or 1
compared to CLIMCAPS-SNPP FSR and CLIMCAPS-JPSS1. This suggest QC = 0 or 1 does
not have the same skill for CLIMCAPS-SNPP NSR as it does for CLIMCAPS-SNPP FSR and
CLIMCAPS-JPSS1. One might want to only use QC = 0 when using CLIMCAPS-SNPP NSR.
Fig. 28 shows the zonal skill score for a) Temperature and b) Specific Humidity with QC
= 0, providing a spatial distribution of the retrieval skill. Between 600 and 200 hPa a negative
skill score in temperature occurs south of ~70oS for all retrievals, although the magnitude of
the skill score is stronger (more negative) in CLIMCAPS-SNPP NSR. A positive skill score
occurs in the same pressure range but between ~50oS and 50oN. Fig. 27 highlighted a negative
skill score for temperature in CLIMCAPS-SNPP NSR above 300 hPa. The zonal figure
suggests that this poor skill score occurs predominantly near the north and south pole, where
both CLIMCAPS-SNPP FSR and CLIMCAPS-JPSS1 have a slight positive skill score in these
geographical regions and CLIMCAPS-SNPP NSR is notably negative.
Figure 28. a) Zonal Mean Skill Score for Temperature for CLIMCAPS-JPSS1 (left), CLIMCAPS-
SNPP FSR (middle) and CLIMCAPS-SNPP NSR (right) with QC = 0. b) Same as a) but for
Specific Humidity.

40
For specific humidity, all three retrievals show a similar spatial structure with a strong
negative skill score above 100 hPa and north of ~20oN. Everything below this pressure level
is generally positive suggesting the final retrievals have more skill than the first guess.
CLIMCAPS-SNPP NSR follows the same pattern as CLIMCAPS-JPSS1 and CLIMCAPS-
SNPP FSR but there are more occurrences of negative skill scores in CLIMCAPS-SNPP NSR.
For example, in the region above 100 hPa the negative skill score prominent in all retrievals
appears to continue farther south for CLIMCAPS-SNPP NSR than in the other two retrievals.
In addition, between ~350 and ~100 hPa near the north pole CLIMCAPS-SNPP NSR has a
stronger negative skill score than observed in CLIMCAPS-SNPP FSR and CLIMCAPS-
JPSS1. There are some upper-tropospheric water vapor channels that are resolved in FSR but
not in NSR so specific humidity may be slightly better for FSR between 200-300 hPa. This
could explain the slightly reduced skill observed in CLIMCAPS-SNPP NSR over this pressure
region near the north pole.
4. Summary and Conclusions
The goal of this report is to provide an initial testing analysis aimed at evaluating the
general quality of the retrieval including the retrieval yields, the deviations of final retrievals
from the initial first guess, and the bias and RMSE of key parameters such as temperature (T)
and water vapor/specific humidity (H2O). We explore the possible connections of bias and
RMSE to other parameters such as verticality, cloud fraction, and surface class. IGRA
radiosondes and ECMWF model analysis provided truth data for the comparison of retrievals
from CLIMCAPS-JPSS1, CLIMCAPS-SNPP FSR and CLIMCAPS-SNPP NSR. Results are
presented that highlight retrieval yield, deviations from the first guess and biases and RMSEs
with respect to the truth data. Below is a brief summary of the key results.
The results from comparing to IGRA are mostly focused on Europe, where more frequent
collocations build a robust and solid statistics. The results show that over Europe the
temperature is biased cold, within -0.5 K, below the 700-hPa level and above the 100-hPa level.
In-between there is a mean warm bias of +0.2 K. The retrieval skill score of temperature
suggests that the CLIMCAPS final retrievals of temperature are not necessarily better than the
first guess (MERRA2). This is as expected because over Europe there are more observational
datasets being assimilated into the MERRA2 reanalysis that produces fairly accurate
temperatures already closer to that of IGRA. In terms of H2O, the CLIMCAPS retrieval is
overall <10% dry biased below the tropopause level, with the smallest bias of as little as <2%
near the surface and about 7-14% near 300-500 hPa. The skill score for CLIMCAPS H2O
retrievals is positive, indicating that the CLIMCAPS retrieval system outperforms the first
guess in H2O. More corrections on first guess often occur in 300-600 hPa where the H2O
verticality peaks with more information content available. Both temperature and H2O retrievals
are affected by clouds. H2O retrievals are especially more sensitive to clouds’ existence in that
cloud could decrease the bias by 30% or more. Note that those conclusions are limited to only
the Europe region.
When comparing to the ECMWF, for temperature the CLIMCAPS-JPSS1 and
CLIMCAPS-SNPP FSR have remarkably similar results. The largest temperature biases for all
retrievals occur near the surface (~900 hPa – biased cold) and at the top of the atmosphere
(warm bias). Generally, a warm bias is observed between 50oS and 50oN for pressures between
41
500 hPa and 200 hPa. In addition, a warm bias is observed above 100 hPa at all latitudes for
all retrievals. Glacier/snow surfaces corresponds to strong cold biases between 600 and 300
hPa for all three retrievals. Little difference is observed between the final retrieval of
temperature and the first guess. A notable exception is for CLIMCAPS-SNPP NSR above 300
hPa where a strong cold bias is observed in CLIMCAPS-SNPP NSR that is not observed in the
other two retrievals.
With respect to specific humidity, all retrievals have consistent results. Generally, a wet
bias between 300 hPa and 100 hPa is observed at the poles while a dry bias is observed at the
tropics. Specific humidity appears to be skewed at pressures above 300 hPa, although future
work should be done to better understand the distribution of the retrievals at these pressure
levels. Low cloud top pressures (high cloud heights) and large cloud fractions corresponded to
large dry biases above 700 hPa. There is more skill in the specific humidity retrieval than the
temperature retrieval. Since the skill score of temperature remains close to zero, it is inferred
that the final retrieval of temperature follows the first guess more than the final retrieval of
specific humidity. Most skill in the specific humidity retrieval lies between 900 hPa and 200
hPa with the highest skill between 600 hPa and 250 hPa; corresponding to the region of high
verticality so there is more information content. A notable reduction in retrieval skill occurs
above 100 hPa and north of 20oN. In addition, CLIMCAPS-SNPP NSR has a substantially
lower skill when QC = 0 or 1 (good) than is observed in CLIMCAPS-JPSS1 and CLIMCAPS-
SNPP FSR for the same quality control. The difference in quality control among the retrievals
(CLIMCAPS-JPSS1, CLIMCAPS-SNPP FSR, and CLIMCAPS-SNPP NSR), especially the
change from best (QC = 0) to good (QC = 0 or 1), should be studied in more detail.
Overall, CLIMCAPS-JPSS1, CLIMCAPSS-SNPP FSR and CLIMCAPS-SNPP NSR show
consistent results for both temperature and specific humidity. A notable exception is for
temperature above 300 hPa and specific humidity with a QC = 0 or 1 in CLIMCAPS-SNPP
NSR. There are several reasons why the CLIMCAPS-SNPP NSR retrieval could be different
from the CLIMCAPS-SNPP FSR. For one, the NSR forward model is much older which could
affect biases. Second, FSR has additional information content (for various reasons). And
lastly, the algorithm for CLIMCAPS-SNPP NSR may be less optimized because of tuning,
channel selection, and more that has not been updated. Because of this and the results presented
in this report, users should be cautious when using the CLIMCAPS-SNPP NSR retrieval
(especially for temperature above 300 hPa) and should use the highest quality control
(especially for specific humidity) until further investigation can be done into the differences
between CLIMCAPS-SNPP NSR and CLIMCAPS-JPSS1/SNPP FSR.
42
References
Barnet, Chris (2019a), Sounder SIPS: Suomi NPP CrIMSS Level 2 CLIMCAPS Full Spectral Resolution:
Atmosphere cloud and surface geophysical state V2, Greenbelt, MD, USA, Goddard Earth Sciences Data and
Information Services Center (GES DISC), Accessed: [Data Access Date], 10.5067/62SPJFQW5Q9B
Barnet, Chris (2019b), Sounder SIPS: Suomi NPP CrIMSS Level 2 CLIMCAPS Normal Spectral Resolution:
Atmosphere cloud and surface geophysical state V2, Greenbelt, MD, USA, Goddard Earth Sciences Data and
Information Services Center (GES DISC), Accessed: [Data Access Date], 10.5067/9HR0XHCH3IGS
Barnet, Chris (2019c), Sounder SIPS: JPSS-1 CrIS Level 2 CLIMCAPS: Atmosphere cloud and surface geophysical
state V2, Greenbelt, MD, USA, Goddard Earth Sciences Data and Information Services Center (GES DISC),
Accessed: [Data Access Date], 10.5067/LESQUBLWS18H
Durre, I., and X. Yin (2008), Enhanced radiosonde data for studies of vertical structure. Bulletin of the American
Meteorological Society, 89, 1257-1262.
Fishbein, E, 2018, IDL tool: ECMWF_INTERP_LLT.
Han, Y., Y. Chen, X. Xiong, X. Jin, (2015), S-NPP CRIS Full Spectral Resolution SDR Processing and Data Quality
Assessment, AMS 2015 Proceedings. https://ams.confex.com/ams/95Annual/webprogram/Paper261524.html
Monarrez, R., Barnet, C., Smith, N., etc., NASA S-NPP and NOAA-20 (JPSS-1) CLIMCAPS CrIS and ATMS
Level-2 Products User Guide: File Format and Definition, April 2020,
https://docserver.gesdisc.eosdis.nasa.gov/public/project/Sounder/CLIMCAPS.V2.README.pdf
Murphy, A. H., Skill scores based on the mean square error and their relationship to the correlation coefficient, Mon.
Weather Rev., 116, 2417–2424, 1988.
Smith, N. and Barnet, C. D.: Uncertainty Characterization and Propagation in the Community Long-Term Infrared
Microwave Combined Atmospheric Product System (CLIMCAPS), Remote Sensing, 11(10), 1227,
doi:10.3390/rs11101227, 2019.
WMO. Manual on the Global Data-Processing and Forecasting system, Volume I - Global Aspects. 2012; Geneva,
Switzerland: World Meteorological Organization. II. 7-36 - II. 7-38. Online
at: http://www.wmo.int/pages/prog/www/DPFS/documents/485_Vol_I_en_colour.pdf .
Wong, S., E. J. Fetzer, M. Schreier, G. Manipon, E. F. Fishbein, B. H, Kahn, Q. Yue, and F. W. Irion (2015), Cloud-
induced uncertainties in AIRS and ECMWF temperature and specific humidity, J. Geophys. Res., 120,
doi:10.1002/2014JD022440.
Yue, Q., E. J. Fetzer, B. H. Kahn, S. Wong, G. Manipon, A. Guilaume, and B. Wilson, 2013: Cloud-state-dependent
sampling in AIRS observations based on CloudSat cloud classification, J. of Climate, 26, 8357–8377, doi:
http://dx.doi.org/10.1175/JCLI-D-13-00065.1.