test report 8420999. smart systems limited incorporating
TRANSCRIPT

8420999-Test Report.
Page 1 of 59
Test Report 8420999.
Smart Systems Limited
Incorporating Smart Extrusions

8420999-Test Report.
Page 2 of 59
Introduction.
This report has been prepared by Jack Nicholls and relates to the activity detailed below:
Job/Registration Details Client Details
Job number: 8420999
Job type: Testing Samples Submitted
Start Date: 11/12/2015
Test type: Type
Sample ID: 10158566
Registration: KM 81543
Scheme: BS 4873
Protocol: PP 519
Scheme Mgr: Lorraine Balch
Quality system: ISO 9001:2008
Smart Systems Limited
Incorporating Smart Extrusions
Arnolds Way
Yatton
BS49 4QN
United Kingdom
The report has been approved for issue by Mark Manito – Team Manager
Approved For Issue
Approver Name:
Issue Date:17 November 2016
Objectives.
Type Test for Product Certification
Product Scope.
Smart Systems Eco Futural Aluminium Alloy Windows
Report Summary.
The samples were received on 10 December 2015 and the testing was started on 16 December 2015.
The samples submitted complied with the requirements of the test work conducted.

8420999-Test Report.
Page 3 of 59
Eco Futural Side Hung Next to Side Hung.
Outer Frame width 1722MM Outer Frame Material ALUMINIUM
Outer Frame height 1440MM Outer Frame Gasket
Outer Frame Part Numbers Gasket Type EDPM
Top EF910 Manufacturer EBP
Bottom EF910 Product Name ECO FUTURAL
Lock Side EF910 Product Code ACVL032
Hinge Side EF910 Threshold
Outer Frame section dimensions Manufacturer
Width 44MM Product name
Depth 65MM Product Code
Reinforcing: Materials
Manufacturer NA Outer Frame Joint Method
Product Name Head CRIMP, GLUED, SEALED
Product code Foot
Material
Leaf Leaf Material: ALUMINIUM
Leaf Width: 838MM Leaf Gasket
Leaf Height: 1405MM Gasket type: EDPM
Leaf Part Numbers: Manufacturer: EBP
Top: EF926 Product Name: ECO FUTURAL
Bottom: EF926 Product Code ACVL032
Lock side: EF926 MULLION
Hinge Side EF926 Manufacturer: SMART SYSTEMS
Leaf section size Product name: ECO FUTURAL
Width: 74MM Product code: EF930
Depth: 65MM Material: ALUMINIUM
Reinforcing Leaf joint method
Manufacturer: NA Head: CRIMPED, GLUED, SEALED
Product Name: Foot:
Product Code:
Material:
Bead
Manufacturer: SMART SYSTEMS
Product Name: ECO FUTURAL
Product Code: GL526
Material: ALUMINIUM
Bead Size: 22MM X 26MM.

8420999-Test Report.
Page 4 of 59
Eco Futural Side Hung Next to Side Hung. (continued)
Glazing Unit Glazing Gasket
Manufacturer: MACROE GLASS Gasket Type: EDPM
Inner Thickness: 6MM Manufacturer: SEMPERIT PROFILES
Spacer Material: ALUMINIUM Product Name: ECO FUTURAL
Outer Thickness: 6MM Product Code ACFT031N, ACFT033N
Unit Sizes: 720MM X 1227MM Glazing Clip NA
Glazing Tape Details Manufacturer:
Manufacturer: NA Product Name:
Product Name: Product Code
Product Code
Hardware Fixings Quantity
Hinges: ACINSSH16 ACET070, ACET099 2PRS
Hinge Protectors: ACET516 ACET060 4 PRS
Lock: ACET956 ACET060 2
Cylinder:
Handle: ACCET868 HEA132SSZ 2 PRS
Touch Bar:
Cylinder Support:
Cylinder Escutcheon:
Keeps:
Drip Bar
Additional Hardware ACEF980 RUN UP BLOCKS 8
ACGSL045 DRAIN CAPS 4
ACSIL04 SEALANT
ACSIL013 CLEAT GLUE.
ACMX09830 GASKET SEALANT

8420999-Test Report.
Page 5 of 59
Eco Futural Top Hung Window.
Outer Frame width 1475MM Outer Frame Material Aluminium
Outer Frame height 2535MM Outer Frame Gasket
Outer Frame Part Numbers Gasket Type EDPM
Top EF910 Manufacturer EBP
Bottom EF910 Product Name ECO FUTURAL
Lock Side EF910 Product Code ACVL 032
Hinge Side EF910 Threshold
Outer Frame section dimensions Manufacturer
Width 44MM Product name
Depth 65MM Product Code
Reinforcing: Materials
Manufacturer NA Outer Frame Joint Method
Product Name NA Head CRIMPED, GLUED, SEALED.
Product code NA Foot
Material NA
Leaf Leaf Material: ALUMINIUM
Leaf Width: 1440MM Leaf Gasket
Leaf Height: 2500MM Gasket type: EDPM
Leaf Part Numbers: Manufacturer: EBP
Top: EF926 Product Name: ECO FUTURAL
Bottom: EF926 Product Code ACVL 032
Lock side: EF926 Leaf Midrail:
Hinge Side EF926 Manufacturer:
Leaf section size Product name:
Width: 74MM Product code:
Depth: 65MM Material:
Reinforcing Leaf joint method
Manufacturer: Head: CRIMPED, GLUED, SEALED
Product Name: Foot:
Product Code:
Material:
Bead
Manufacturer: SMART SYSTEMS
Product Name: ECO FUTURAL
Product Code: GL526
Material: ALUMINIUM
Bead Size: 22MM X 26MM

8420999-Test Report.
Page 6 of 59
Eco Futural Top Hung Window. (continued)
Glazing Unit Glazing Gasket
Manufacturer: MACROE GLASS Gasket Type: EDPM
Inner Thickness: 6MM TOUGHENED Manufacturer: SEMPERIT PROFILES
Spacer Material: 16MM ALUMINIUM Product Name: ECO FUTURAL
Outer Thickness: 6MM TOUGHENED Product Code ACFT 031N, ACFT 033N.
Unit Sizes: 1322MM X 2382MM Glazing Clip
Glazing Tape Details Manufacturer: NA
Manufacturer: NA Product Name:
Product Name: Product Code
Product Code
Hardware Fixings Quantity
Hinges: ACINS26. ACET070, ACET099 2
Hinge Protectors: ACET516 ACET060 2 PRS.
Lock: ACEF956 ACET060 1
Cylinder:
Handle: ACET868 HEA132SSZ. 2
Touch Bar:
Cylinder Support:
Cylinder Escutcheon:
Keeps:
Drip Bar
Additional Hardware ACEF980 RUN UP BLOCKS ACET060 2
ACGSL 045 DRAIN CAPS 2
ACSIL04 SEALANT
ACSIL013 CLEAT GLUE

8420999-Test Report.
Page 7 of 59
Eco Futural Side Hung Next To Fixed.(continued)
Outer Frame width 2421MM Outer Frame Material ALUMINIUM
Outer Frame height 1440MM Outer Frame Gasket
Outer Frame Part Numbers Gasket Type EDPM
Top EF110 Manufacturer EBP
Bottom EF110 Product Name ECO FUTURAL
Lock Side EF110 Product Code ACVL032
Hinge Side EF110 Threshold
Outer Frame section dimensions Manufacturer
Width 50MM Product name
Depth 65MM Product Code
REVERSE ADAPTOR Materials
Manufacturer SMART SYSTEMS Outer Frame Joint Method
Product Name ECO FUTURAL Head CRIMPED, GLUED, SEALED
Product code EF945 Foot
Material ALUMINIUM
Leaf Leaf Material: ALUMINIUM
Leaf Width: 848MM Leaf Gasket
Leaf Height: 1345MM Gasket type: EDPM
Leaf Part Numbers: Manufacturer: EBP
Top: EF926 Product Name: ECO FUTURAL
Bottom: EF926 Product Code ACVL032
Lock side: EF926 Leaf Midrail:
Hinge Side EF926 Manufacturer:
Leaf section size Product name:
Width: 74MM Product code:
Depth: 65MM Material:
MULLION Leaf joint method
Manufacturer: SMART SYSTEMS Head: CRIMPED, GLUED, SEALED
Product Name: ECO FUTURAL Foot:
Product Code: EF030
Material: ALUMINIUM
Bead
Manufacturer: SMART SYSTEMS
Product Name: ECO FUTURAL
Product Code: GL526
Material: ALUMINIUM
Bead Size: 22MM X 26MM

8420999-Test Report.
Page 8 of 59
Eco Futural Side Hung Next To Fixed. (continued)
Glazing Unit Glazing Gasket
Manufacturer: MACROE GLASS Gasket Type: EDPM
Inner Thickness: 6MM TOUGHENED Manufacturer: SEMPERIT PROFILES
Spacer Material: 16MM ALUMINIUM Product Name: ECO FUTURAL
Outer Thickness: 6MM TOUGHENED Product Code ACFT031N, ACFT033N.
Unit Sizes: 720MM X 1227MM. Glazing Clip NA.
Glazing Tape Details Manufacturer:
Manufacturer: NA Product Name:
Product Name: Product Code
Product Code
Hardware Fixings Quantity
Hinges: ACINSSH16 ACET070,ACET099. 1PAIR
Hinge Protectors: ACET516 ACET060 2 PAIRS
Lock: ACET956 ACET060 1
Cylinder:
Handle: ACET868 HEA132SSZ. 1
Touch Bar:
Cylinder Support:
Cylinder Escutcheon:
Keeps: ACEF956 ACET060,ACET390 4
Drip Bar
Additional Hardware ACEF980 RUN UP BLOCKS 4
ACVG45 DRAIN CAPS 4
MULLION ANTI-TWIST CLIP
2
ACSIL04 SEALANT
ACSIL013 CLEAT GLUE
ACMX09830 GASKET SEALANT
8420999-Test Report.
Page 9 of 59
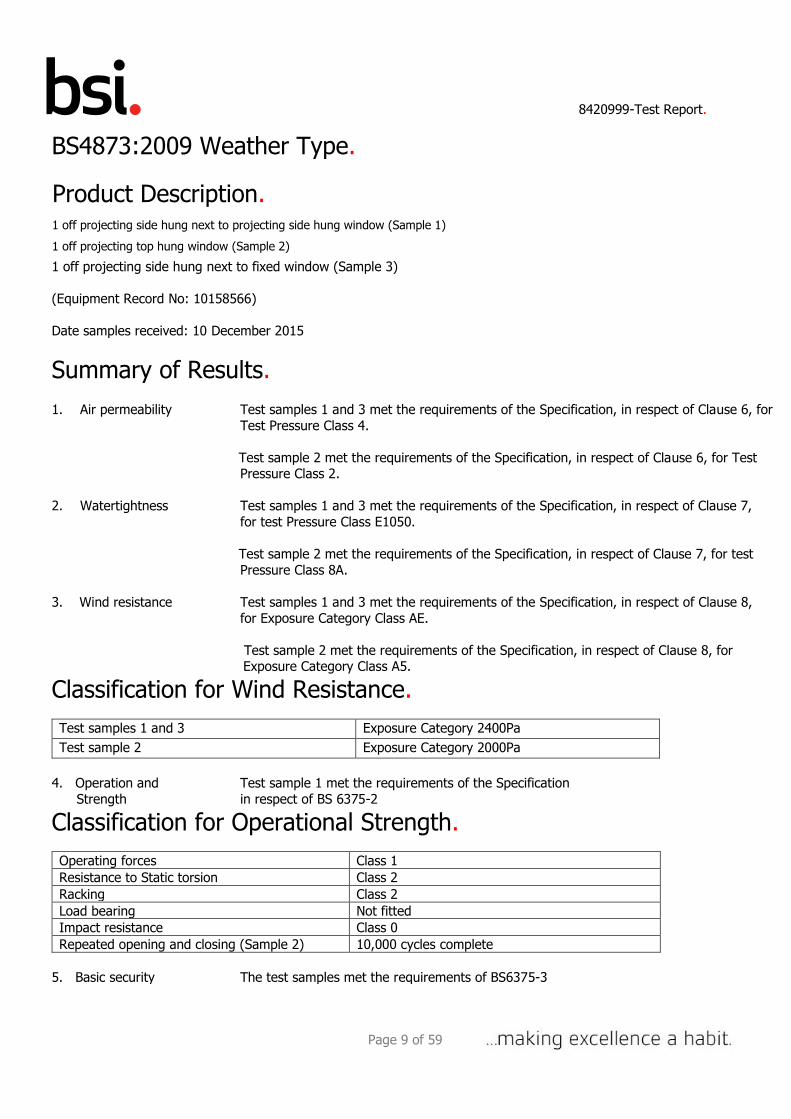
BS4873:2009 Weather Type.
Product Description. 1 off projecting side hung next to projecting side hung window (Sample 1)
1 off projecting top hung window (Sample 2)
1 off projecting side hung next to fixed window (Sample 3)
(Equipment Record No: 10158566)
Date samples received: 10 December 2015
Summary of Results. 1. Air permeability Test samples 1 and 3 met the requirements of the Specification, in respect of Clause 6, for
Test Pressure Class 4.
Test sample 2 met the requirements of the Specification, in respect of Clause 6, for Test Pressure Class 2.
2. Watertightness Test samples 1 and 3 met the requirements of the Specification, in respect of Clause 7,
for test Pressure Class E1050.
Test sample 2 met the requirements of the Specification, in respect of Clause 7, for test
Pressure Class 8A.
3. Wind resistance Test samples 1 and 3 met the requirements of the Specification, in respect of Clause 8,
for Exposure Category Class AE.
Test sample 2 met the requirements of the Specification, in respect of Clause 8, for Exposure Category Class A5.
Classification for Wind Resistance.
Test samples 1 and 3 Exposure Category 2400Pa
Test sample 2 Exposure Category 2000Pa
4. Operation and Test sample 1 met the requirements of the Specification
Strength in respect of BS 6375-2
Classification for Operational Strength.
Operating forces Class 1
Resistance to Static torsion Class 2
Racking Class 2
Load bearing Not fitted
Impact resistance Class 0
Repeated opening and closing (Sample 2) 10,000 cycles complete
5. Basic security The test samples met the requirements of BS6375-3

8420999-Test Report.
Page 10 of 59
Sample Selection. The sample submitted for tests were selected using the PCP Scheme Document Specification.
The sample was submitted for test mounted in a 50mm x 100mm timber subframe in accordance with the manufacturer’s installation requirements. Sample manufactured by the client.
Clause 5 Sequence of Tests.
The sequence of testing the sample followed that detailed in Clause 5 of BS 6375-1:2015.
Clause 5 Performance Requirements. The performance of the sample was assessed against the requirements detailed in
Table 1 Exposure categories and classifications
8420999-Test Report.
Page 11 of 59
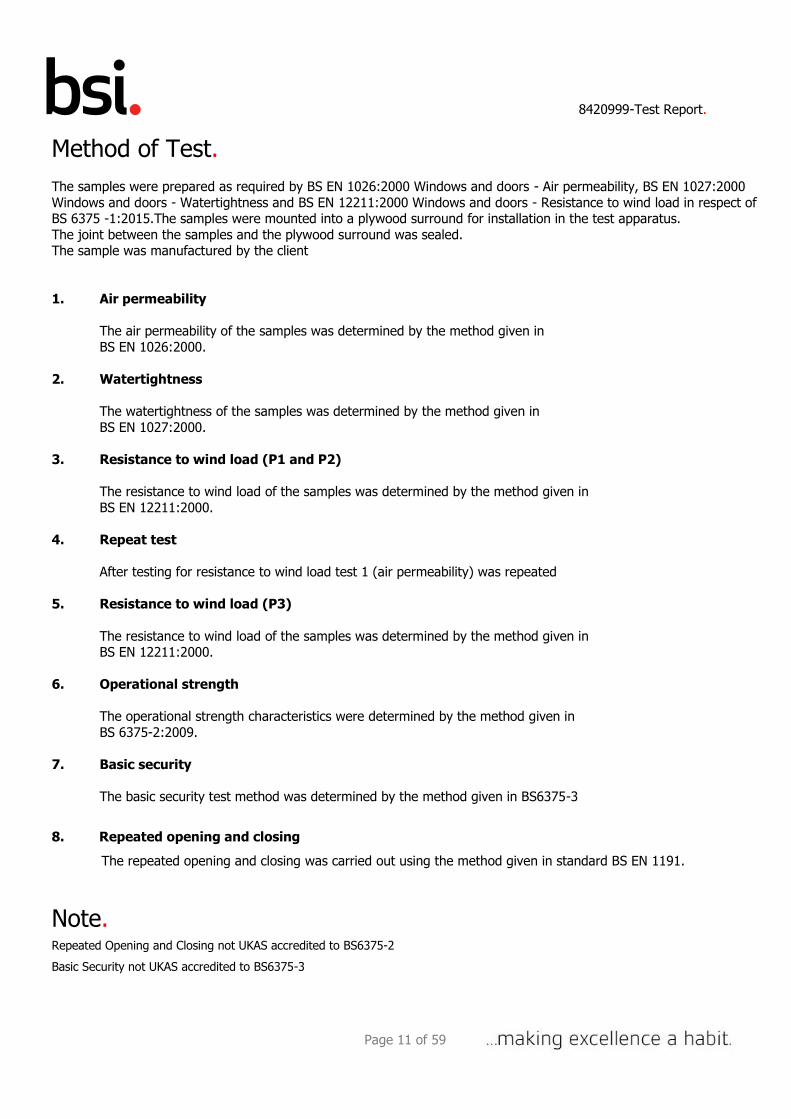
Method of Test. The samples were prepared as required by BS EN 1026:2000 Windows and doors - Air permeability, BS EN 1027:2000
Windows and doors - Watertightness and BS EN 12211:2000 Windows and doors - Resistance to wind load in respect of BS 6375 -1:2015.The samples were mounted into a plywood surround for installation in the test apparatus.
The joint between the samples and the plywood surround was sealed. The sample was manufactured by the client
1. Air permeability
The air permeability of the samples was determined by the method given in
BS EN 1026:2000.
2. Watertightness
The watertightness of the samples was determined by the method given in
BS EN 1027:2000.
3. Resistance to wind load (P1 and P2)
The resistance to wind load of the samples was determined by the method given in
BS EN 12211:2000.
4. Repeat test
After testing for resistance to wind load test 1 (air permeability) was repeated
5. Resistance to wind load (P3)
The resistance to wind load of the samples was determined by the method given in BS EN 12211:2000.
6. Operational strength
The operational strength characteristics were determined by the method given in
BS 6375-2:2009.
7. Basic security
The basic security test method was determined by the method given in BS6375-3
8. Repeated opening and closing
The repeated opening and closing was carried out using the method given in standard BS EN 1191.
Note. Repeated Opening and Closing not UKAS accredited to BS6375-2
Basic Security not UKAS accredited to BS6375-3

8420999-Test Report.
Page 12 of 59
Description of Sample. (Sample 1)
Manufacturer - Smart Systems
Window type - Projecting side hung next to projecting side hung
Material - Aluminium
Finish - White
Construction - Outerframe: Cleated Sash: Cleated
Fittings (Each sash) - Hinge: 16” Securistyle side hung stays
Locking: A six point locking (six mushroom bolt) ERA locking system
operated by a key locking handle 5 off run up blocks
2 of pairs of Vector hinge protectors
Glass - Double glazed, 6-18-6mm toughened glass sealed units
Glazing system - Internal beads and gaskets
Sample dimensions - For information only (nominal sizes)
Overall size
Length: 1730mm Height: 1440mm
Each sash size
Length: 840mm Height: 1410mm
Date of test - 16 December 2015
Laboratory temperature - 18.6C
Laboratory humidity - 48.4%
Atmospheric pressure: 100.1kPa
8420999-Test Report.
Page 13 of 59
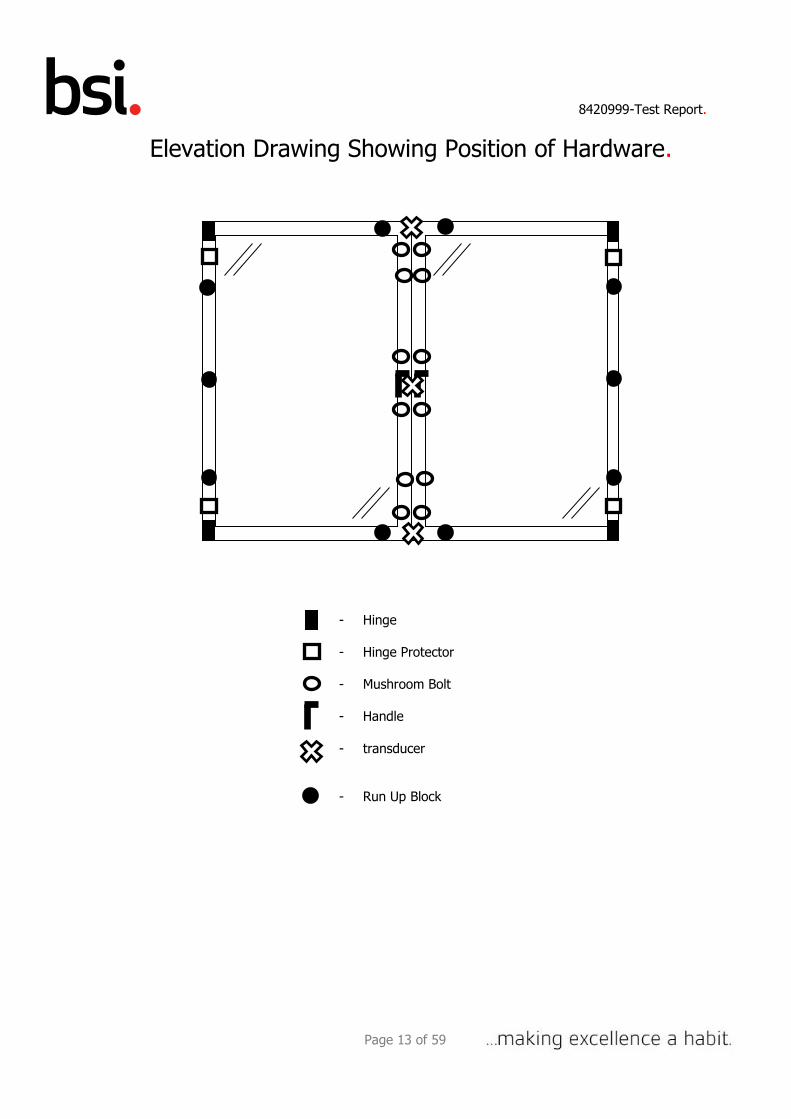
Elevation Drawing Showing Position of Hardware.
- Hinge
- Hinge Protector
- Mushroom Bolt
- Handle
- transducer
- Run Up Block

8420999-Test Report.
Page 14 of 59
Graph of Air Permeability Before Gusting.
1
10
100
10 100 1000
Air p
erm
eabili
ty [m
³/h.m
² of overa
ll are
a]
Differential pressure [Pa]
Air p
erm
eabili
ty [m
³/h.m
of openin
g jo
ints
]
Class 1
Class 4
Class 2
Class 3
5 30 600
90
0.50
0.75
1.00
1.25
1.50
1.75
2.00
2.25
5.0
7.5
10.0
12.5
15.0
17.5
20.0
22.5
2.50
25.0
0.25
80
70
60
50
40
30
20
9
8
7
6
5
4
3
2
Infiltration [m³/h.m]
Infiltration [m³/h.m²]
Exfiltration [m³/h.m]
Exfiltration [m³/h.m²]

8420999-Test Report.
Page 15 of 59
Table of Average Air Permeability Before Gusting.
Clause 6 Before resistance to wind tests
Three positive pressure pulses of 660Pa were applied prior to testing
Table 4
Air Pressure
[Pa]
Average rate of air leakage
[m³/h]
Average rate of air leakage per meter length of opening joint [m³/h.m]
Average rate of air leakage relative to area
of sample [m³/h.m²]
50 0.6 0.07 0.24
100 0.8 0.09 0.34
150 0.8 0.09 0.34
200 0.4 0.05 0.18
250 0.9 0.10 0.36
300 1.3 0.14 0.52
450 2.5 0.28 1.00
600 1.0 0.11 0.40 Note: The figures in the table above give the leakage as an average of the leakage at positive pressure and
the leakage at negative pressure
Total opening perimeter = 9m
Overall area = 2.49m²
BS 6375-1:2015 Clause 6.2 - Joint class = 4
BS 6375-1:2015 Clause 6.2 - Area class = 4
BS 6375-1:2015 Clause 6.2 - Overall class = 4

8420999-Test Report.
Page 16 of 59
Graph of Average Air Permeability Before Gusting.
1
10
100
10 100 1000
Air p
erm
eabili
ty [m
³/h.m
² of overa
ll are
a]
Differential pressure [Pa]
Air p
erm
eabili
ty [m
³/h.m
of openin
g jo
ints
]
Class 1
Class 4
Class 2
Class 3
Average leakage [m³/h.m]
Average leakage [m³/h.m²]
5 300 600
90
0.50
0.75
1.00
1.25
1.50
1.75
2.00
2.25
5.0
7.5
10.0
12.5
15.0
17.5
20.0 22.5
2.50
25.0
0.25
80
70
60
50
40
30
20
9
8
7
6
5
4
3
2
8420999-Test Report.
Page 17 of 59
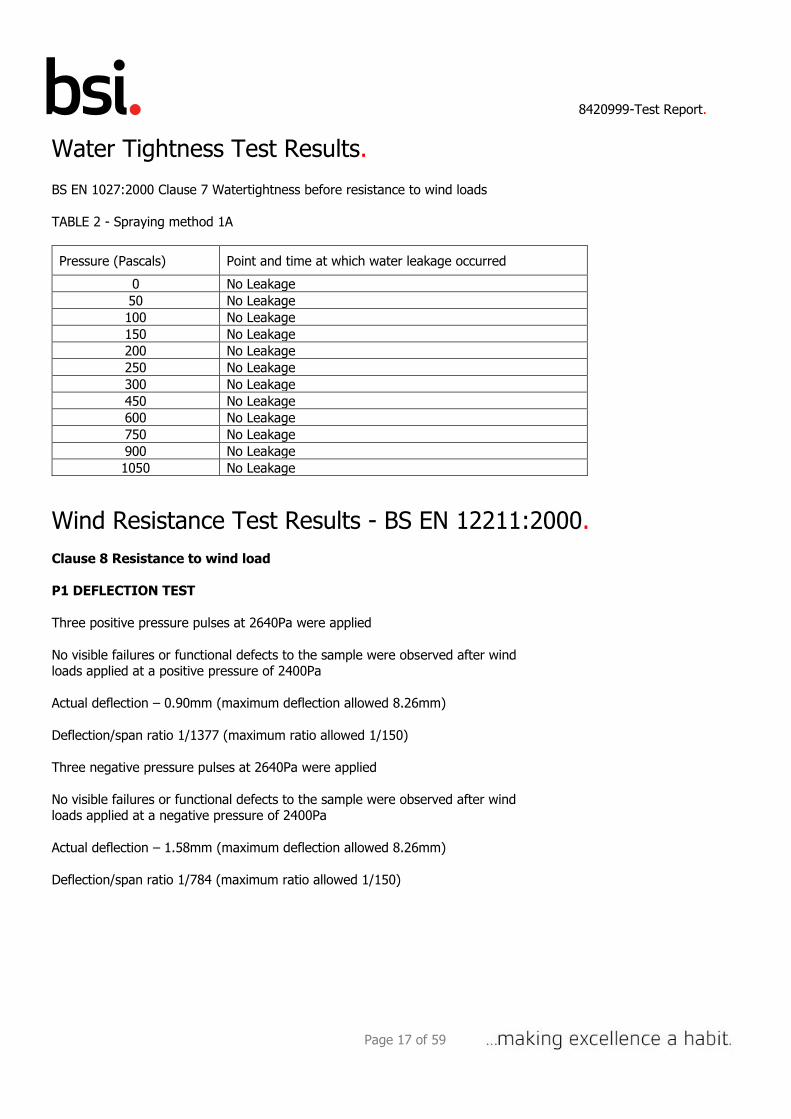
Water Tightness Test Results. BS EN 1027:2000 Clause 7 Watertightness before resistance to wind loads
TABLE 2 - Spraying method 1A
Pressure (Pascals) Point and time at which water leakage occurred
0 No Leakage
50 No Leakage
100 No Leakage
150 No Leakage
200 No Leakage
250 No Leakage
300 No Leakage
450 No Leakage
600 No Leakage
750 No Leakage
900 No Leakage
1050 No Leakage
Wind Resistance Test Results - BS EN 12211:2000.
Clause 8 Resistance to wind load
P1 DEFLECTION TEST
Three positive pressure pulses at 2640Pa were applied
No visible failures or functional defects to the sample were observed after wind loads applied at a positive pressure of 2400Pa
Actual deflection – 0.90mm (maximum deflection allowed 8.26mm)
Deflection/span ratio 1/1377 (maximum ratio allowed 1/150)
Three negative pressure pulses at 2640Pa were applied
No visible failures or functional defects to the sample were observed after wind loads applied at a negative pressure of 2400Pa
Actual deflection – 1.58mm (maximum deflection allowed 8.26mm)
Deflection/span ratio 1/784 (maximum ratio allowed 1/150)

8420999-Test Report.
Page 18 of 59
Wind Resistance Test Results - BS EN 12211:2000. (Continued) P2 REPEATED PRESSURE TEST
No visible failures or functional defects to the sample were observed after 50 cycles of repeated wind loads applied at a positive pressure of 1200Pa
No visible failures or functional defects to the sample were observed after 50 cycles of repeated wind loads applied at a negative pressure of 1200Pa
In accordance with BS 6375-1:2015 Clause 6.5, as the classification after the resistance to wind
load tests is the same as the classification before the resistance to wind load tests, the resulting classification for the sample is Class 2.

8420999-Test Report.
Page 19 of 59
Graph of Air Permeability After Gusting.
1
10
100
10 100 1000
Air p
erm
eabili
ty [m
³/h.m
² of overa
ll are
a]
Differential pressure [Pa]
Air p
erm
eabili
ty [m
³/h.m
of openin
g jo
ints
]
Class 1
Class 4
Class 2
Class 3
5 300 600
90
0.50
0.75
1.00
1.25
1.50
1.75
2.00
2.25
5.0
7.5
10.0
12.5
15.0
17.5
20.0
22.5
2.50
25.0
0.25
80
70
60
50
40
30
20
9
8
7
6
5
4
3
2 Infiltration [m³/h.m]
Infiltration [m³/h.m²]
Exfiltration [m³/h.m]
Exfiltration
[m³/h.m²]

8420999-Test Report.
Page 20 of 59
Table of Average Air Permeability After Gusting.
Clause 6 After resistance to wind tests
Three positive pressure pulses of 660Pa were applied prior to testing
Table 4
Air Pressure
[Pa]
Average rate of air leakage
[m³/h]
Average rate of air leakage per meter length of opening joint [m³/h.m]
Average rate of air leakage relative to area
of sample [m³/h.m²]
50 1.1 0.13 0.46
100 0.9 0.10 0.38
150 1.5 0.17 0.60
200 2.2 0.25 0.90
250 2.4 0.27 0.98
300 5.4 0.60 2.17
450 4.9 0.55 1.97
600 6.1 0.67 2.43 Note: The figures in the table above give the leakage as an average of the leakage at positive pressure and
the leakage at negative pressure
Total opening perimeter = 9m
Overall area = 2.49m²
BS 6375-1:2015 Clause 6.5 - Joint class = 4
BS 6375-1:2015 Clause 6.5 - Area class = 4
BS 6375-1:2015 Clause 6.5 - Overall class = 4
In accordance with BS 6375-1:2015 Clause 6.5, as the classification after the resistance to wind load tests is the same as the classification before the resistance to wind load tests, the resulting classification for the sample is Class 4.

8420999-Test Report.
Page 21 of 59
Average Graph of Air Permeability After Gusting.
1
10
100
10 100 1000
Air p
erm
eabili
ty [m
³/h.m
² of overa
ll are
a]
Differential pressure [Pa]
Air p
erm
eabili
ty [m
³/h.m
of openin
g jo
ints
]
Class 1
Class 4
Class 2
Class 3
5 30 600
90
0.50
0.75
1.00
1.25
1.50
1.75
2.00
2.25
5.0
7.5
10.0
12.5
15.0
17.5
20.0 22.5
2.50
25.0
0.25
80
70
60
50
40
30
20
9
8
7
6
5
4
3
2
Average leakage [m³/h.m]
Average leakage [m³/h.m²]

8420999-Test Report.
Page 22 of 59
Average Graph of Air Permeability After Gusting Including +20% Lines For Each Class.
1
10
100
10 100 1000
Air p
erm
eabili
ty [m
³/h.m
² of overa
ll are
a]
Differential pressure [Pa]
Air p
erm
eabili
ty [m
³/h.m
of openin
g jo
ints
]
Class 1
Class 4
Class 2
Class 3
5 30 600
90
0.50
0.75
1.00
1.25
1.50
1.75
2.00
2.25
5.0
7.5
10.0
12.5
15.0
17.5
20.0 22.5
2.50
25.0
0.25
80
70
60
50
40
30
20
9
8
7
6
5
4
3
2
Infiltration
[m³/h.m]
Infiltration [m³/h.m²]
Exfiltration [m³/h.m]
Exfiltration [m³/h.m²]

8420999-Test Report.
Page 23 of 59
Wind Load Resistance Test Results - BS EN 12211:2000. P3 SAFETY TEST
No parts of the test sample became detached and the test sample remained closed after a wind load safety test applied at
a positive air pressure of 3600Pa.
No parts of the test sample became detached and the test sample remained closed after a wind load safety test applied at
a negative air pressure of 3600Pa.

8420999-Test Report.
Page 24 of 59
Operation and Strength. (BS 6375-2:2009)
Clause 5 Performance characteristics and requirements for windows Assessment
Clause 5.1 Operating Forces: EN13115 and EN12046
The sample was tested three times; operating the key, handle opening, sash closing, handle closing, then key to lock, and average of the three results were then recorded.
Key Unlock – 0.10Nm (maximum 5Nm) Pass
Handle opening – 40.20N (maximum 100N) Pass
Sash opening – 30.50N (maximum 100N) Pass
Sash closing – 26.60N (maximum 100N) Pass
Handle closing – 26.85N (maximum 100N) Pass
Key lock – 0.25Nm (maximum 5Nm) Pass
Clause 5 Performance characteristics and requirements for windows
Clause 5.2.1 Resistance to static torsion BS EN 14609 and BS EN 13115
The sample was open and closed 5 times before the test; all loads were applied in accordance with BS EN 14609:2004, maximum increments of 100N in minimum 1 second intervals.
The window was opened 90 or its maximum opening position and blocked, and the 30N pre load applied for 60 seconds.
300(N) was applied in 1second min intervals, for 5 minutes, measuring the max deformation and finally the Residual
deformation after 1 min rest
Maximum deformation – 45.50mm
Residual deformation – 1.15mm
After Resistance to static torsion the Performance characteristics were tested again

8420999-Test Report.
Page 25 of 59
Operation and Strength. (BS 6375-2:2009)
Clause 5 Performance characteristics and requirements for windows Assessment
Clause 5.1 Operating Forces: EN13115 and EN12046
The sample was tested three times, operating the key, handle opening, sash closing, handle closing, then key to lock, and
average of the three results were then recorded.
Key Unlock – 0.25Nm (maximum 5Nm) Pass
Handle opening – 42.65N (maximum 100N) Pass
Sash opening – 31.10N (maximum 100N) Pass
Sash closing – 32.45N (maximum 100N) Pass
Handle closing – 26.50N (maximum 100N) Pass
Key lock – 0.30Nm (maximum 5Nm) Pass
Clause 5.2.2 Racking BS EN 14608 and BS EN 13115
The sample was opened and closed 5 times before the test, the loads were applied in accordance with BS EN
14608:2004, maximum increments of 100N in minimum 1 second intervals.
The window was opened at an angle of 90 or its maximum opening position, and a 60N pre load was applied for 60
second.
600(N) was applied in 1second min intervals for 5 minutes, measuring the max deformation, then finally the Residual
deformation after 1 min rest.
Maximum deformation – 21.00mm
Residual deformation – 1.00mm

8420999-Test Report.
Page 26 of 59
Operation and Strength. (BS 6375-2:2009)
Clause 5 Performance characteristics and requirements for windows Assessment
Clause 5.1 Operating Forces: EN13115 and EN12046
After Resistance to static torsion the Performance characteristics were tested again.
The sample was tested three times, operating the key, handle opening, sash closing, handle closing, then key to lock, and average of the three results were then recorded.
Key Unlock – 0.30Nm (maximum 5Nm) Pass
Handle opening – 45.50N (maximum 100N) Pass
Sash opening – 33.60N (maximum 100N) Pass
Sash closing – 34.65N (maximum 100N) Pass
Handle closing – 26.90N (maximum 100N) Pass
Key lock – 0.30Nm (maximum 5Nm) Pass
Clause 5.3 Load bearing capacity of safety devices
Not applicable
Clause 5.4 Impact resistance BS EN 13049 and BS EN 13115
The sample was opened and closed 5 times before the test, the testing was carried out accordance with BS EN 13049.
The BS EN 12600 Impactor was used for the impact, and only one impact was carried out on one sample.
The maximum particle weight of any part of the sample that comes away may not be more than 50g, the sash, casement,
hardware or infill retaining components may not disconnect, or become dislodged in a dangerous manner.
Impact height achieved: 200mm
Direction of impact: From outside
Point of impact: Centre of sample
Details of damage: None Pass

8420999-Test Report.
Page 27 of 59
Basic security (Annex A). BS 6375: Part 3: 2009 - Performance of Windows. The objective of this test is to establish from if from the outside entry can be gained by defeating the glazing or locking
system.
The force used did not result in permanent set or plastic deformation of any tool.
Damaged tools shall be replaced and the test did not exceed the maximum 3 minute time period.
The screwdriver was used to no effect
No entry could be effected Pass

8420999-Test Report.
Page 28 of 59
Photograph of Sample.(sample 1)

8420999-Test Report.
Page 29 of 59
Description of Sample. (Sample 2)
Manufacturer - Smart Systems
Window type - Projecting top hung
Material - Aluminium
Finish - White
Construction - Outerframe: Cleated Sash: Cleated
Fittings - Hinge: 22” Securistyle top hung stays
Locking: A six point locking (six mushroom bolt) ERA locking system
operated by a key locking handle 6 off run up blocks
2 of pairs of Vector hinge protectors
Glass - Double glazed, 6-18-6mm toughened glass sealed unit
Glazing system - Internal beads and gaskets
Sample dimensions - For information only (nominal sizes)
Overall size
Length: 1480mm Height: 2530mm
Sash size
Length: 1440mm Height: 2500mm
Date of test - 18 December 2015
Laboratory temperature - 19.2C
Laboratory humidity - 45.6%
Atmospheric pressure: 100.3kPa

8420999-Test Report.
Page 30 of 59
Elevation Drawing Showing Position of Hardware.
- Hinge
Water Leakage - Hinge Protector
- Mushroom Bolt
- Handle
- transducer
- Run Up Block

8420999-Test Report.
Page 31 of 59
Graph of Air Permeability Before Gusting.
1
10
100
10 100 1000
Air p
erm
eabili
ty [m
³/h.m
² of overa
ll are
a]
Differential pressure [Pa]
Air p
erm
eabili
ty [m
³/h.m
of openin
g jo
ints
]
Class 1
Class 4
Class 2
Class 3
5 30 600
90
0.50
0.75
1.00
1.25
1.50
1.75
2.00
2.25
5.0
7.5
10.0
12.5
15.0
17.5
20.0
22.5
2.50
25.0
0.25
80
70
60
50
40
30
20
9
8
7
6
5
4
3
2
Infiltration [m³/h.m]
Infiltration [m³/h.m²]
Exfiltration [m³/h.m]
Exfiltration [m³/h.m²]

8420999-Test Report.
Page 32 of 59
Table of Average Air Permeability Before Gusting.
Clause 6 Before resistance to wind tests
Three positive pressure pulses of 660Pa were applied prior to testing
Table 4
Air Pressure
[Pa]
Average rate of air leakage
[m³/h]
Average rate of air leakage per meter length of opening joint [m³/h.m]
Average rate of air leakage relative to area
of sample [m³/h.m²]
50 1.0 0.13 0.28
100 4.6 0.58 1.22
150 3.1 0.40 0.84
200 15.8 2.00 4.22
250 39.8 5.05 10.65
300 - - -
450 - - -
600 - - - Note: The figures in the table above give the leakage as an average of the leakage at positive pressure and
the leakage at negative pressure
Total opening perimeter = 7.88m
Overall area = 3.74m²
BS 6375-1:2015 Clause 6.2 - Joint class = 2
BS 6375-1:2015 Clause 6.2 - Area class = 2
BS 6375-1:2015 Clause 6.2 - Overall class = 2

8420999-Test Report.
Page 33 of 59
Graph of Average Air Permeability Before Gusting.
1
10
100
10 100 1000
Air p
erm
eabili
ty [m
³/h.m
² of overa
ll are
a]
Differential pressure [Pa]
Air p
erm
eabili
ty [m
³/h.m
of openin
g jo
ints
]
Class 1
Class 4
Class 2
Class 3
Average leakage [m³/h.m]
Average leakage [m³/h.m²]
5 300 600
90
0.50
0.75
1.00
1.25
1.50
1.75
2.00
2.25
5.0
7.5
10.0
12.5
15.0
17.5
20.0 22.5
2.50
25.0
0.25
80
70
60
50
40
30
20
9
8
7
6
5
4
3
2

8420999-Test Report.
Page 34 of 59
Water Tightness Test Results. BS EN 1027:2000 Clause 7 Watertightness before resistance to wind loads
TABLE 2 - Spraying method 1A
Pressure (Pascals) Point and time at which water leakage occurred
0 No Leakage
50 No Leakage
100 No Leakage
150 No Leakage
200 No Leakage
250 No Leakage
300 No Leakage
450 No Leakage
600 Water leaked from sill opening joint at 2 minutes 31
seconds.
750 -
900 -
1050 -
Wind Resistance Test Results - BS EN 12211:2000.
Clause 8 Resistance to wind load
P1 DEFLECTION TEST
Three positive pressure pulses at 2200Pa were applied
No visible failures or functional defects to the sample were observed after wind
loads applied at a positive pressure of 2000Pa
Actual deflection – 12.54mm (maximum deflection allowed 16.10mm)
Deflection/span ratio 1/192 (maximum ratio allowed 1/150)
Three negative pressure pulses at 2200Pa were applied
No visible failures or functional defects to the sample were observed after wind
loads applied at a negative pressure of 2000Pa
Actual deflection – 16.08mm (maximum deflection allowed 16.10mm)
Deflection/span ratio 1/150 (maximum ratio allowed 1/150)

8420999-Test Report.
Page 35 of 59
Wind Resistance Test Results - BS EN 12211:2000. (Continued) P2 REPEATED PRESSURE TEST
No visible failures or functional defects to the sample were observed after 50 cycles of repeated wind loads applied at a positive pressure of 1000Pa
No visible failures or functional defects to the sample were observed after 50 cycles of repeated wind loads applied at a negative pressure of 1000Pa
In accordance with BS 6375-1:2015 Clause 6.5, as the classification after the resistance to wind
load tests is the same as the classification before the resistance to wind load tests, the resulting classification for the sample is Class 2.

8420999-Test Report.
Page 36 of 59
Graph of Air Permeability After Gusting.
1
10
100
10 100 1000
Air p
erm
eabili
ty [m
³/h.m
² of overa
ll are
a]
Differential pressure [Pa]
Air p
erm
eabili
ty [m
³/h.m
of openin
g jo
ints
]
Class 1
Class 4
Class 2
Class 3
5 300 600
90
0.50
0.75
1.00
1.25
1.50
1.75
2.00
2.25
5.0
7.5
10.0
12.5
15.0
17.5
20.0
22.5
2.50
25.0
0.25
80
70
60
50
40
30
20
9
8
7
6
5
4
3
2
Infiltration [m³/h.m]
Infiltration [m³/h.m²]
Exfiltration [m³/h.m]
Exfiltration [m³/h.m²]
8420999-Test Report.
Page 37 of 59
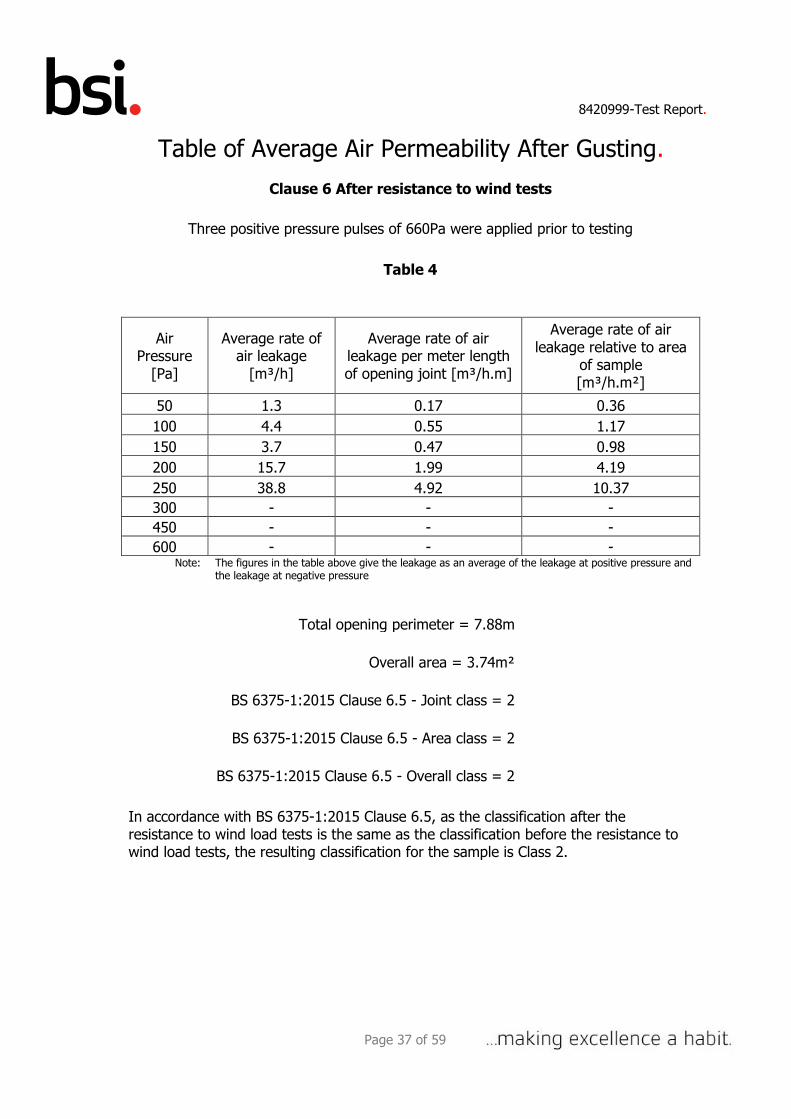
Table of Average Air Permeability After Gusting.
Clause 6 After resistance to wind tests
Three positive pressure pulses of 660Pa were applied prior to testing
Table 4
Air Pressure
[Pa]
Average rate of air leakage
[m³/h]
Average rate of air leakage per meter length of opening joint [m³/h.m]
Average rate of air leakage relative to area
of sample [m³/h.m²]
50 1.3 0.17 0.36
100 4.4 0.55 1.17
150 3.7 0.47 0.98
200 15.7 1.99 4.19
250 38.8 4.92 10.37
300 - - -
450 - - -
600 - - - Note: The figures in the table above give the leakage as an average of the leakage at positive pressure and
the leakage at negative pressure
Total opening perimeter = 7.88m
Overall area = 3.74m²
BS 6375-1:2015 Clause 6.5 - Joint class = 2
BS 6375-1:2015 Clause 6.5 - Area class = 2
BS 6375-1:2015 Clause 6.5 - Overall class = 2
In accordance with BS 6375-1:2015 Clause 6.5, as the classification after the resistance to wind load tests is the same as the classification before the resistance to wind load tests, the resulting classification for the sample is Class 2.

8420999-Test Report.
Page 38 of 59
Graph of Average Air Permeability After Gusting.
1
10
100
10 100 1000
Air p
erm
eabili
ty [m
³/h.m
² of overa
ll are
a]
Differential pressure [Pa]
Air p
erm
eabili
ty [m
³/h.m
of openin
g jo
ints
]
Class 1
Class 4
Class 2
Class 3
5 30 600
90
0.50
0.75
1.00
1.25
1.50
1.75
2.00
2.25
5.0
7.5
10.0
12.5
15.0
17.5
20.0 22.5
2.50
25.0
0.25
80
70
60
50
40
30
20
9
8
7
6
5
4
3
2
Average leakage [m³/h.m]
Average leakage [m³/h.m²]

8420999-Test Report.
Page 39 of 59
Average Graph of Air Permeability After Gusting Including +20% Lines For Each Class.
1
10
100
10 100 1000
Air p
erm
eabili
ty [m
³/h.m
² of overa
ll are
a]
Differential pressure [Pa]
Air p
erm
eabili
ty [m
³/h.m
of openin
g jo
ints
]
Class 1
Class 4
Class 2
Class 3
5 30 600
90
0.50
0.75
1.00
1.25
1.50
1.75
2.00
2.25
5.0
7.5
10.0
12.5
15.0
17.5
20.0 22.5
2.50
25.0
0.25
80
70
60
50
40
30
20
9
8
7
6
5
4
3
2
Infiltration [m³/h.m]
Infiltration [m³/h.m²]
Exfiltration [m³/h.m]
Exfiltration [m³/h.m²]

8420999-Test Report.
Page 40 of 59
Wind Load Resistance Test Results - BS EN 12211:2000. P3 SAFETY TEST
No parts of the test sample became detached and the test sample remained closed after a wind load safety test applied at
a positive air pressure of 3000Pa.
No parts of the test sample became detached and the test sample remained closed after a wind load safety test applied at
a negative air pressure of 3000Pa.

8420999-Test Report.
Page 41 of 59
Basic security (Annex A). BS 6375: Part 3: 2009 - Performance of Windows. The objective of this test is to establish from if from the outside entry can be gained by defeating the glazing or locking
system.
The force used did not result in permanent set or plastic deformation of any tool.
Damaged tools shall be replaced and the test did not exceed the maximum 3 minute time period.
The screwdriver was used to no effect
No entry could be effected Pass

8420999-Test Report.
Page 42 of 59
BS EN 1191:2012. (Sample 2) Clause 5 Performance characteristics and requirements Assessment
for windows
Clause 5.5 Repeated opening and closing
The sample was opened and closed 5 times before testing started
A procedure was followed
Key rotation of key to unlock: 90 degrees
Clause 6.2 Operating Forces: EN12046-1 and EN12217 (pre-test operation)
The sample was tested three times, unlocking the key, handle opening force, sash opening force, sash closing force,
handle closing force, key force to lock, and average of the three results were then recorded.
Active sash tested for 10,000 cycles
Key toque to unlock – 0.78Nm (maximum 20Nm) Pass
Handle opening force – 20.35N (maximum 100N) Pass
Sash opening force – 61.80N (maximum 100N) Pass
Sash closing force – 23.40N (maximum 100N) Pass
Handle closing force – 42.45N (maximum 100N) Pass
Key toque to unlock – 0.66Nm (maximum 20Nm) Pass
Key torque to unlock – 0.78Nm (maximum 50Nm) Pass
Handle opening force – 20.90N (maximum 100N) Pass
Sash opening force – 59.60N (maximum 100N) Pass
Sash closing force – 25.95N (maximum 100N) Pass
Handle closing force – 44.50N (maximum 100N) Pass
Key toque to unlock – 0.72Nm (maximum 50Nm) Pass
At 100% of the complete cycles the Operating forces were taken again
The sample met the requirements of the standard and remained within the forces for 10,000 cycles

8420999-Test Report.
Page 43 of 59
Photograph of Sample.(sample 2)

8420999-Test Report.
Page 44 of 59
Description of Sample. (Sample 3)
Manufacturer - Smart Systems
Window type - Projecting side hung next to fixed window
Material - Aluminium
Finish - White
Construction - Outerframe: Cleated Sash: Cleated
Fittings - Hinge: 16” Securistyle side hung stays
Locking: A six point locking (six mushroom bolt) ERA locking system
operated by a key locking handle
Glass - Double glazed, 6-18-6mm toughened glass sealed unit
Glazing system - Internal beads and gaskets
Sample dimensions - For information only (nominal sizes)
Overall size
Length: 2400mm Height: 1405mm
Sash size
Length: 840mm Height: 1345mm
Date of test - 19 December 2015
Laboratory temperature - 18.6C
Laboratory humidity - 44.7%
Atmospheric pressure: 99.9kPa

8420999-Test Report.
Page 45 of 59
Elevation Drawing Showing Position of Hardware.
- Hinge
- Mushroom Bolt
- Handle
- transducer

8420999-Test Report.
Page 46 of 59
Graph of Air Permeability Before Gusting.
1
10
100
10 100 1000
Air p
erm
eabili
ty [m
³/h.m
² of overa
ll are
a]
Differential pressure [Pa]
Air p
erm
eabili
ty [m
³/h.m
of openin
g jo
ints
]
Class 1
Class 4
Class 2
Class 3
5 30 600
90
0.50
0.75
1.00
1.25
1.50
1.75
2.00
2.25
5.0
7.5
10.0
12.5
15.0
17.5
20.0
22.5
2.50
25.0
0.25
80
70
60
50
40
30
20
9
8
7
6
5
4
3
2
Infiltration [m³/h.m]
Infiltration [m³/h.m²]
Exfiltration [m³/h.m]
Exfiltration [m³/h.m²]

8420999-Test Report.
Page 47 of 59
Table of Average Air Permeability Before Gusting.
Clause 6 Before resistance to wind tests
Three positive pressure pulses of 660Pa were applied prior to testing
Table 4
Air Pressure
[Pa]
Average rate of air leakage
[m³/h]
Average rate of air leakage per meter length of opening joint [m³/h.m]
Average rate of air leakage relative to area
of sample [m³/h.m²]
50 0.4 0.10 0.13
100 0.6 0.14 0.18
150 0.7 0.16 0.21
200 0.7 0.17 0.22
250 0.7 0.17 0.22
300 0.9 0.22 0.28
450 1.3 0.31 0.40
600 1.2 0.28 0.37 Note: The figures in the table above give the leakage as an average of the leakage at positive pressure and
the leakage at negative pressure
Total opening perimeter = 4.37m
Overall area = 3.37m²
BS 6375-1:2015 Clause 6.2 - Joint class = 4
BS 6375-1:2015 Clause 6.2 - Area class = 4
BS 6375-1:2015 Clause 6.2 - Overall class = 4

8420999-Test Report.
Page 48 of 59
Graph of Average Air Permeability Before Gusting.
1
10
100
10 100 1000
Air p
erm
eabili
ty [m
³/h.m
² of overa
ll are
a]
Differential pressure [Pa]
Air p
erm
eabili
ty [m
³/h.m
of openin
g jo
ints
]
Class 1
Class 4
Class 2
Class 3
Average leakage [m³/h.m]
Average leakage [m³/h.m²]
5 300 600
90
0.50
0.75
1.00
1.25
1.50
1.75
2.00
2.25
5.0
7.5
10.0
12.5
15.0
17.5
20.0 22.5
2.50
25.0
0.25
80
70
60
50
40
30
20
9
8
7
6
5
4
3
2

8420999-Test Report.
Page 49 of 59
Water Tightness Test Results. BS EN 1027:2000 Clause 7 Watertightness before resistance to wind loads
TABLE 2 - Spraying method 1A
Pressure (Pascals) Point and time at which water leakage occurred
0 No Leakage
50 No Leakage
100 No Leakage
150 No Leakage
200 No Leakage
250 No Leakage
300 No Leakage
450 No Leakage
600 No Leakage
750 No Leakage
900 No Leakage
1050 No Leakage
Wind Resistance Test Results - BS EN 12211:2000.
Clause 8 Resistance to wind load
P1 DEFLECTION TEST
Three positive pressure pulses at 2640Pa were applied
No visible failures or functional defects to the sample were observed after wind loads applied at a positive pressure of 2400Pa
Actual deflection – 1.92mm (maximum deflection allowed 8.90mm)
Deflection/span ratio 1/700 (maximum ratio allowed 1/150)
Three negative pressure pulses at 2640Pa were applied
No visible failures or functional defects to the sample were observed after wind loads applied at a negative pressure of 2400Pa
Actual deflection – 1.12mm (maximum deflection allowed 8.90mm)
Deflection/span ratio 1/1200 (maximum ratio allowed 1/150)

8420999-Test Report.
Page 50 of 59
Wind Resistance Test Results - BS EN 12211:2000. (Continued) P2 REPEATED PRESSURE TEST
No visible failures or functional defects to the sample were observed after 50 cycles of repeated wind loads applied at a positive pressure of 1200Pa
No visible failures or functional defects to the sample were observed after 50 cycles of repeated wind loads applied at a negative pressure of 1200Pa
In accordance with BS 6375-1:2015 Clause 6.5, as the classification after the resistance to wind
load tests is the same as the classification before the resistance to wind load tests, the resulting classification for the sample is Class 2.

8420999-Test Report.
Page 51 of 59
Graph of Air Permeability After Gusting.
1
10
100
10 100 1000
Air p
erm
eabili
ty [m
³/h.m
² of overa
ll are
a]
Differential pressure [Pa]
Air p
erm
eabili
ty [m
³/h.m
of openin
g jo
ints
]
Class 1
Class 4
Class 2
Class 3
5 300 600
90
0.50
0.75
1.00
1.25
1.50
1.75
2.00
2.25
5.0
7.5
10.0
12.5
15.0
17.5
20.0
22.5
2.50
25.0
0.25
80
70
60
50
40
30
20
9
8
7
6
5
4
3
2
Infiltration [m³/h.m] Infiltration
[m³/h.m²]
Exfiltration [m³/h.m]
Exfiltration [m³/h.m²]
8420999-Test Report.
Page 52 of 59
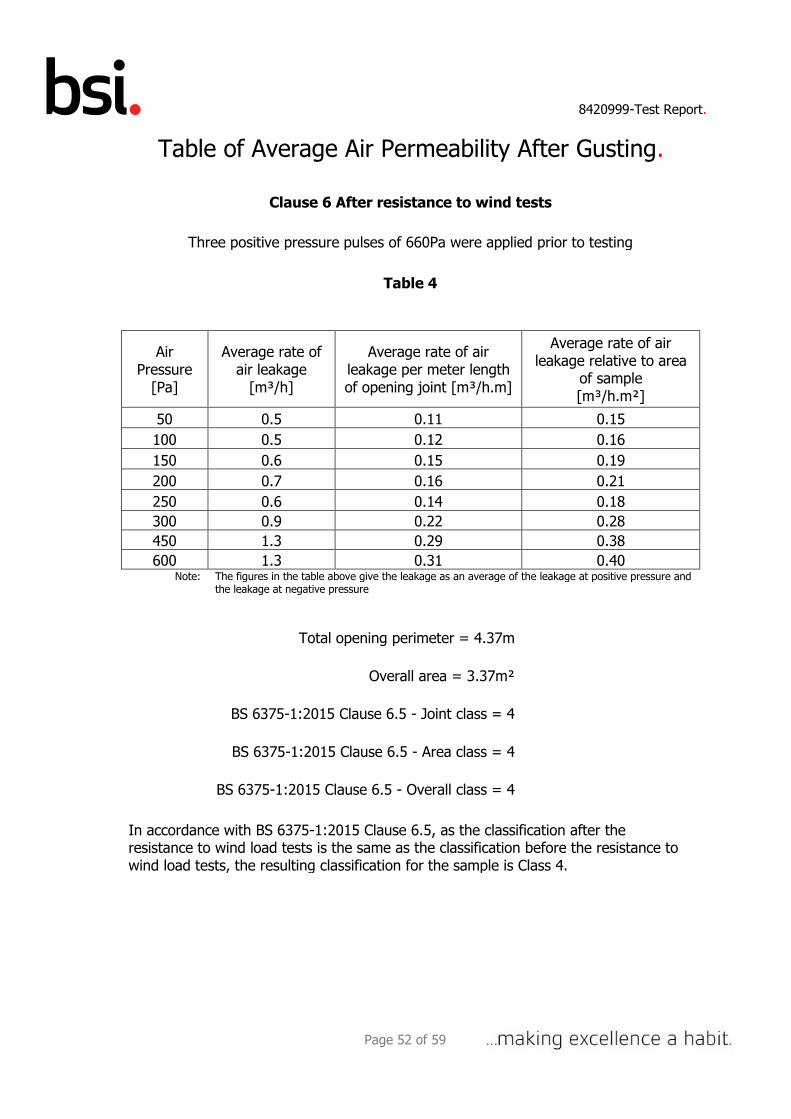
Table of Average Air Permeability After Gusting.
Clause 6 After resistance to wind tests
Three positive pressure pulses of 660Pa were applied prior to testing
Table 4
Air Pressure
[Pa]
Average rate of air leakage
[m³/h]
Average rate of air leakage per meter length of opening joint [m³/h.m]
Average rate of air leakage relative to area
of sample [m³/h.m²]
50 0.5 0.11 0.15
100 0.5 0.12 0.16
150 0.6 0.15 0.19
200 0.7 0.16 0.21
250 0.6 0.14 0.18
300 0.9 0.22 0.28
450 1.3 0.29 0.38
600 1.3 0.31 0.40 Note: The figures in the table above give the leakage as an average of the leakage at positive pressure and
the leakage at negative pressure
Total opening perimeter = 4.37m
Overall area = 3.37m²
BS 6375-1:2015 Clause 6.5 - Joint class = 4
BS 6375-1:2015 Clause 6.5 - Area class = 4
BS 6375-1:2015 Clause 6.5 - Overall class = 4
In accordance with BS 6375-1:2015 Clause 6.5, as the classification after the resistance to wind load tests is the same as the classification before the resistance to wind load tests, the resulting classification for the sample is Class 4.

8420999-Test Report.
Page 53 of 59
Graph of Average Air Permeability After Gusting.
1
10
100
10 100 1000
Air p
erm
eabili
ty [m
³/h.m
² of overa
ll are
a]
Differential pressure [Pa]
Air p
erm
eabili
ty [m
³/h.m
of openin
g jo
ints
]
Class 1
Class 4
Class 2
Class 3
5 30 600
90
0.50
0.75
1.00
1.25
1.50
1.75
2.00
2.25
5.0
7.5
10.0
12.5
15.0
17.5
20.0 22.5
2.50
25.0
0.25
80
70
60
50
40
30
20
9
8
7
6
5
4
3
2
Average leakage [m³/h.m] Average
leakage [m³/h.m²]

8420999-Test Report.
Page 54 of 59
Average Graph of Air Permeability After Gusting Including +20% Lines For Each Class.
1
10
100
10 100 1000
Air p
erm
eabili
ty [m
³/h.m
² of overa
ll are
a]
Differential pressure [Pa]
Air p
erm
eabili
ty [m
³/h.m
of openin
g jo
ints
]
Class 1
Class 4
Class 2
Class 3
5 30 600
90
0.50
0.75
1.00
1.25
1.50
1.75
2.00
2.25
5.0
7.5
10.0
12.5
15.0
17.5
20.0 22.5
2.50
25.0
0.25
80
70
60
50
40
30
20
9
8
7 6
5
4
3
2
Infiltration [m³/h.m] Infiltration
[m³/h.m²]
Exfiltration
[m³/h.m]
Exfiltration
[m³/h.m²]

8420999-Test Report.
Page 55 of 59
Wind Load Resistance Test Results - BS EN 12211:2000. P3 SAFETY TEST
No parts of the test sample became detached and the test sample remained closed after a wind load safety test applied at
a positive air pressure of 3600Pa.
No parts of the test sample became detached and the test sample remained closed after a wind load safety test applied at
a negative air pressure of 3600Pa.

8420999-Test Report.
Page 56 of 59
Basic security (Annex A). BS 6375: Part 3: 2009 - Performance of Windows. The objective of this test is to establish from if from the outside entry can be gained by defeating the glazing or locking
system.
The force used did not result in permanent set or plastic deformation of any tool.
Damaged tools shall be replaced and the test did not exceed the maximum 3 minute time period.
The screwdriver was used to no effect
No entry could be effected Pass

8420999-Test Report.
Page 57 of 59
Photograph of Sample.(sample 3)

8420999-Test Report.
Page 58 of 59
Test Samples. Sample Id ER Number Description
1 10158566 Aluminium Alloy Windows
Description of Test Samples. Sample Description
1 off projecting side hung next to projecting side hung window
1 off projecting top hung window
1 off projecting side hung next to fixed window
Test Requirements.
BS4873 Type Test
Clause Requirements
As required Test and assessment
See Table A – BS4873 Type Test
Summary of Test Comments.
Clause Comments
Glossary of Terms.
PASS: Complies. Tested by BSI engineers at BSI laboratories.
PASS1: Complies. Witnessed by BSI engineers in manufacturers laboratory.
PASS2: Complies. Tests carried out by third party lab; results accepted by BSI.
PASS*: Report resulted in uncertainty and states that Compliance is more probable than non-compliance.
FAIL: Non compliance – Product does not meet the requirements of this clause.
FAIL*: Report resulted in uncertainty and states that Non-compliance is more probable than compliance.
N/A: Not applicable to design under consideration.
N/T: Not tested due to similarity to previously tested item; reference earlier test report.

8420999-Test Report.
Page 59 of 59
Conditions of Issue.
This Test Report is issued subject to the conditions stated in current issue of 'BSI Terms of Service'. The results contained herein
apply only to the particular sample(s) tested and to the specific tests carried out, as detailed in this Test Report. The issuing of this
Test Report does not indicate any measure of Approval, Certification, Supervision, Control or Surveillance by BSI of any product. No
extract, abridgement or abstraction from a Test Report may be published or used to advertise a product without the written consent
of BSI, who reserve the absolute right to agree or reject all or any of the details of any items or publicity for which consent may be
sought.
Should you wish to speak with BSI in relation to this report, please contact Customer Services on +44 (0)8450 80 9000.
BSI
Kitemark House
Maylands Avenue
Hemel Hempstead
Hertfordshire
HP2 4SQ
Opinions and Interpretations expressed herein are outside the scope of our UKAS accreditation.
Unless otherwise stated, any results not obtained from testing in a BSI laboratory are outside the scope of our UKAS accreditation.
*** End of Report ***