test methods to predict moisture sensitivity of hot-mix asphalt
TRANSCRIPT
TOPIC 3
Test Methods to Predict Moisture Sensitivity of
Hot-Mix Asphalt Pavements
77
TOPIC 3
Test Methods to Predict Moisture Sensitivity of Hot-Mix Asphalt Pavements
MANSOUR SOLAIMANIAN Pennsylvania State University
JOHN HARVEY University of California, Davis
MAGHSOUD TAHMORESSI
PaveTex Engineering and Testing
VIVEK TANDON University of Texas at El Paso
The work conducted through the years toward development of moisture damage tests issummarized in this paper. Moisture damage has been a major concern to asphalt technologistsfor many years. Attempts to develop laboratory tests to distinguish between good- and poor-performing mixes in regard to stripping date back to the 1920s.
The tests for identifying the moisture damage potential of an asphalt–aggregate mixturecan be classified into two major categories: those on loose mixtures and those on compactedmixtures. The static immersion and the boil test, both conducted on loose mixtures, were amongthe first tests introduced to the paving industry. This was followed by introduction of theimmersion–compression test in the late 1940s. This test was conducted on compacted specimensand was the first test to become an ASTM standard in the mid-1950s. Research in the 1960sbrought considerable awareness to asphalt pavement technologists of the significant effects ofclimate and traffic on moisture damage. The significance of these factors was emphasizedthrough the work of researchers such as Johnson (1969), Schmidt and Graf (1972), Jiminez(1974), and Lottman (1978).
The work by Jiminez resulted in a laboratory test simulating the effect of repeated waterpressure on the behavior of saturated hot-mix asphalt. Extensive work by Lottman resulted in thelaboratory test that currently has the widest acceptance in the paving industry. This test wasfurther modified through the work of Tunnicliff and Root (1982). Wheel tracking of asphaltmixes submerged under water gained popularity for determination of moisture damage in the1990s. The Hamburg wheel-tracking device and the asphalt pavement analyzer are among thetests of this type. It was also during this period that the environmental conditioning system wasintroduced to the industry at the completion of the Strategic Highway Research Program (SHRP)in 1993.
The Superpave system, the product of SHRP, adopted the standard test method AASHTOT283 as the required test for determination of the risk of moisture damage. This test procedure issimilar to the Lottman test procedure with some modification. With the Superpave system beingadopted by most state highway agencies, AASHTO T283 became the most widely used test
78 Moisture Sensitivity of Asphalt Pavements: A National Seminar
procedure within the industry. Some agencies have reported problems with this test in terms of correlation between the laboratory results and field observations. Today, it remains a challenge to asphalt pavement technologists to develop a highly reliable and practical test procedure for determination of moisture damage. An important consideration in development and acceptance of a test procedure for moisture damage should be calibration of the test to the conditions for which it will be applied. Some tests have been calibrated and implemented on a local basis (a region within a state). No test has been successfully calibrated and implemented across a wide spectrum of conditions. Reasons for this have been lack of correlation with field performance, a lack of good field performance databases, and problems with the tests such as variability and difficulty of operation.
INTRODUCTION
Historical Development The performance of hot-mix asphalt (HMA) in the presence of water is a complex issue and has been the subject of numerous research studies during the past six decades. During this period, asphalt technologists and state highway agencies have been in pursuit of a reliable laboratory test protocol to predict the asphalt pavement behavior in the field with regard to moisture sensitivity. The facts that the adhesion between asphalt and aggregate is reduced in the presence of water (stripping) and that the cohesion within the asphalt binder itself deteriorates have been known to practitioners for a long time and date back to at least the 1920s. Early work on this problem was performed by Nicholson (1932), Riedel and Weber (1934), McLeod (1937), Hubbard (1938), Powers (1938), Winterkorn et al. (1937), Saville and Axon (1937), Winterkorn (1937; 1938; 1939), Krchma and Nevitt (1942), Krchma and Loomis (1943), and Hveem (1943), among others. An extensive bibliography covering work performed prior to 1959 is given by Rice (1958).
Examination of the 1937 Proceedings of the Association of Asphalt Paving Technologists (AAPT) shows two papers on asphalt–aggregate adhesion and problems with moisture sensitivity and references to previous work. For example, a paper by Saville and Axon discusses the search for a usable laboratory test and presents results from boiling tests and soaking tests and compares them with the field stripping performance of mixes with different types of aggregate. That paper also contains photographs of stripped mixes that would all be recognized from pavements today (as a note, this indicates that stripping problems did not begin because of changes in asphalt composition in the early 1980s). In an update on asphalt test development in the 1943 AAPT Proceedings, Hveem commented on the problem and stated:
A complete solution to this entire problem may readily appear from another source. That is to say, that there are now many methods of treatment being advocated or in process of development which should improve the capacity of any asphalt to stick to virtually all aggregates under the most adverse conditions. When an agent is commercially available that can be added to the asphalt at the refinery, this entire problem may largely disappear, although it is likely that accurate test methods will always be needed in order to compare the effectiveness of competing forms of treatment.
Solaimanian, Harvey, Tahmoressi, and Tandon 79
The immersion–compression test was introduced in 1950s as the first moisture damage test on compacted specimens under ASTM standard. In that decade, some work was also conducted on the surface energy of asphalt and aggregate and its relationship to bonding properties (Thelen 1958). Andersland and Goetz (1956) also introduced the sonic test for evaluation of stripping resistance in compacted bituminous mixtures. More recent attempts toward development of tests to predict asphalt mixture moisture sensitivity started in the 1960s and 1970s with the work of Johnson (1969), Schmidt and Graf (1972), Jimenez (1974), and Lottman (1978). All recognized the importance of simulating field conditions through accelerating test conditioning in the laboratory. Jimenez used vacuum saturation followed by cyclic pore pressure application to achieve this purpose, while Lottman used vacuum saturation followed by freezing and hot water bath conditioning. Lottman’s laboratory test protocol, presented to the industry in 1978, was a breakthrough in regard to a coherent test procedure for predicting moisture-induced damage to asphalt concrete. The protocol introduced by Lottman was later modified and standardized as AASHTO Test Procedure T283. Root and Tunnicliff presented their version of the Lottman procedure in the early 1980s during an extensive evaluation of antistripping additives. At the same time, Kennedy, Roberts, Anagnos, and Lee at the University of Texas at Austin introduced two test procedures to the industry: Texas freeze–thaw pedestal test (1982) and Texas boiling test (1984). The boiling test was developed on the basis of work that had been conducted in departments of transportation in Louisiana, Texas, and Virginia between 1975 and 1980 and is very similar to the test used by Saville and Axon in 1937. The freeze–thaw pedestal test was a modification of the procedure introduced earlier by Plancher et al. (1980) at the Western Research Institute. Ensley et al. (1984) worked toward development of techniques for measuring the bonding energy of the asphalt–aggregate system. This was also a time for some researchers to evaluate the test methods available for moisture damage. As example is the work by Gharaybeh (1987). Afterwards, there was no significant development in moisture damage test procedures until the Strategic Highway Research Program (SHRP) sponsored research toward development of new moisture sensitivity tests. The result of this research was the environmental conditioning system (ECS) (Al-Swailmi and Terrel 1992). At the same time, the Hamburg wheel-tracking device (HWTD) was introduced into the United States (Aschenbrener and Currier 1993). Colorado, Texas, and Utah were among the first states to explore the HWTD (Aschenbrener 1995). The search for new reliable test procedures for determination of moisture sensitivity continues. Western Research Institute (WRI) has undertaken in-depth research on asphalt chemistry and its relationship to moisture damage. WRI has determined that displacement of asphalt polars from aggregate by water varies by asphalt source. Currently, WRI is developing a rapid centrifugation method to simulate displacement of polars by water. The hypothesis being tested is the following: asphalt–aggregate mixtures that form insoluble calcium salts of asphalt components are the least prone to moisture damage. On another front, the concept of surface energy has reemerged as a potential tool for determining the adhesion of asphalt–aggregate systems. While these recent research developments can contribute significantly toward determination of compatible and moisture-resistant asphalt–aggregate mixtures, they do not address the effect of the interaction between traffic and water on moisture damage in pavements. Hence, a new test procedure on compacted samples is being investigated under National
80 Moisture Sensitivity of Asphalt Pavements: A National Seminar
Cooperative Highway Research Program (NCHRP) Project 9-34 aimed at proper simulation ofenvironment/traffic factors in regard to moisture damage.
Types of Moisture Sensitivity Tests In general, the tests that have been developed can be divided into two main categories:qualitative and quantitative. Qualitative tests provide a subjective evaluation of the strippingpotential and include
• Boiling water test, • Freeze–thaw pedestal test, • Quick bottle test, • Rolling bottle method, and • Many others.
The quantitative tests provide a value for a specific parameter such as strength before andafter conditioning. These tests include
• Immersion–compression test, • Indirect tensile test, • Marshall immersion test, • Double punch method, • Resilient modulus tests, and • Many others.
Alternatively, the tests can be categorized into those aimed at checking the compatibilitybetween aggregate and asphalt on the basis of conditioning of the loose mix and those used todetermine moisture sensitivity of the compacted mix structure. The latter can be divided intothose that look at water conditioning and those that include the interaction of traffic and water.The first type of test helps to determine whether an asphalt–aggregate system is compatible andwhether it is resistant enough against debonding in the presence of water without any attempt toevaluate the mechanical behavior of the mixture under applied loads and water. In the secondgroup of tests, attempts are made to take the effect of the compacted mix structure as well astraffic and environment into consideration when the mix behavior is evaluated in the presence ofwater. These tests typically give a result that is interpreted as pass or does not pass. At this time,none of these tests provide information that can be used in a mechanistic-empirical designframework by providing information on the effect of water on stiffness, and fatigue and ruttingtransfer functions.
The complexity of developing test methods to predict moisture damage in the field isevident from the variables that interact in this phenomenon, including the following:
• The great number of aggregate sources and their highly varied mineralogies, crystalstructures, and surface textures;
• The numerous types of unmodified and modified asphalt binders used across theUnited States; and
• The varied environmental conditions, traffic, and construction practices.
Solaimanian, Harvey, Tahmoressi, and Tandon 81
It has remained a challenge to the pavement industry to improve the current moisturedamage tests to provide a more reliable distinction between poor and good performers and torelate the numbers from any test to performance on a given project with its unique combinationof variables.
For a moisture susceptibility test procedure to be successful for mix design and fieldquality control, certain criteria must be satisfied:
1. It must be representative of the mechanisms that cause moisture damage in the fieldand produce results that match those occurring in the field under similar conditions, or it mustmeasure some property that determines the performance of the mix in the field without actuallysimulating field conditions in the laboratory.
2. It must be capable of discriminating between poor and good performers in regard tostripping. If the first criterion (above) cannot be satisfied, then some discriminator of this type isuseful; however, the results must still be tied to field performance.
3. It must be repeatable and reproducible, with the allowable variance depending on theconstraint of the fourth criterion.
4. It must be feasible, practical, and economical enough that it can be included in routinemix design practice.
These four criteria are the key items to the success of any test procedure selected foridentification of asphalt concrete moisture susceptibility.
SIGNIFICANCE OF MOISTURE-SENSITIVITY TESTS Implementation of any laboratory test for moisture sensitivity or stripping will always requirecalibration of the results that the test generates with observed field performance. If the test resultsare not calibrated with field performance, the test runs a larger risk of eliminating mixes thatwould perform well in the field or permitting mixes that have a high probability of having ashortened life due to moisture damage.
Review of the literature, including laboratory experiments and field studies, indicates thatwhile moisture damage susceptibility is highly correlated with aggregate source, other variablescan significantly increase or decrease the risk of moisture susceptibility for a given mix used on agiven project. These variables include (Harvey et al. 2002)
• Drainage and the condition of the drainage system; • Pavement structure, including lack of bonding between asphalt concrete layers, which
can permit lateral movement of water; the presence of cracks, which permit water to enter; thepresence of open-graded or seal coat materials below the surface, which can trap water below thesurface; and the presence of fabrics or interlayers that can trap water below the surface;
• Mix design, including binder content, gradation, and dust-to-asphalt ratio, which candetermine the film thickness on the aggregates and the permeability of the mix; binder selection,which determines the stiffness of the binder and the susceptibility to penetration of the asphaltfilm by water; and the use of additives, which can reduce the overall susceptibility of the mix;
• Construction variability, including segregation, which can create areas with high airvoid contents and low binder contents, which permit water to enter and are more susceptible tomoisture damage; variance from the job mix formula, which can create susceptible areas with
82 Moisture Sensitivity of Asphalt Pavements: A National Seminar
less dense gradation and lower binder contents; and compaction, which can create areas withhigh air voids and therefore high permeability and low strength;
• Climate, which determines the presence of water (unless there is a nearby irrigation orsprinkler system that is creating an artificial climate), the amount of freeze–thaw action, and thetemperature of the asphalt and the water when it is being subjected to traffic; and
• Traffic, which applies stresses to the mix while it is in a weakened condition frommoisture and has been shown in several studies to determine whether moisture damage andstripping occur by comparison of cores from the wheelpath with those from outside thewheelpath.
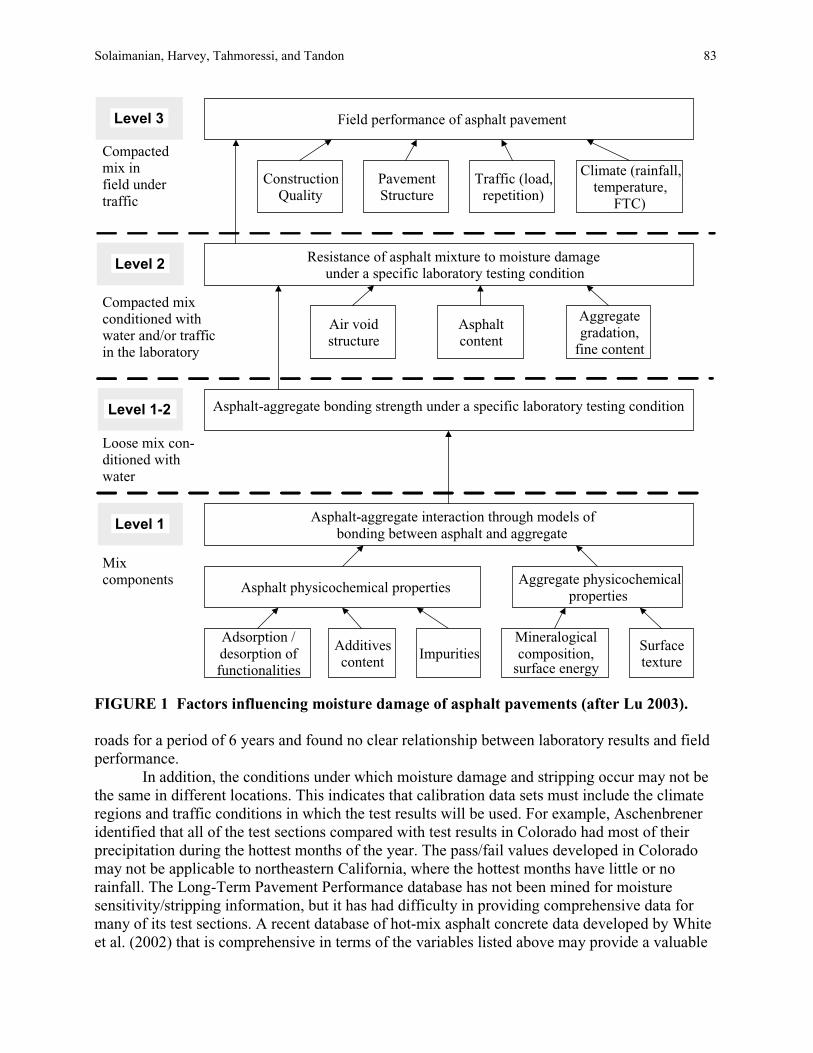
The interactions of these variables and the different level of interaction at whichlaboratory test methods can measure relevant properties or simulated performance are shown inFigure 1.
With regard to the last item in the list, the influence of traffic loading on moisturedamage was recognized early when a forensic analysis was conducted after one of the loadingcycles at the Penn State Test Track. The HMA in the base course was completely stripped ofbinder in the wheel tracks but was undamaged between the wheel tracks, as reported byAnderson and Shamon (1984). Bejarano and Harvey (2002) found that an asphalt-treatedpermeable base material stripped completely in the wheelpath in a full-scale pavement subjectedto subsurface water infiltration under heavy vehicle simulator loading but had no stripping justoutside the wheelpath. Some reduction in stiffness and strength was observed in the materialoutside the wheelpath.
The preceding list of variables suggests that a “one size fits all” approach in terms ofpassing and failing results from laboratory tests will be difficult to implement because a givenmix may perform well under one set of circumstances and poorly under a different set.Implementation of laboratory tests will be less difficult and the risk of eliminating usable mixesand permitting susceptible mixes will be reduced if the field calibration is as comprehensive as possible in terms of consideration of these variables. This should be achieved in the light of acommon test calibrated to local conditions. Some researchers such as Philips and Marek (1986)have emphasized the need for a moisture damage test via a common procedure. There are three primary difficulties in performing a comprehensive field calibration:
• Obtaining comprehensive data for the independent variables listed above; • Quantifying the dependent variable, performance; and • Relating results from laboratory- and field-compacted test specimens.
In regard to obtaining comprehensive data for the independent variables, most states havea great deal of difficulty in compiling good data for the independent variables listed above torelate to observed field performance. In particular, only a few state pavement managementsystem databases include mix information, construction quality data, or information on theunderlying pavement structure. Very few agencies have information on maintenance activitiesthat have been performed, which may significantly affect the performance of the pavement withrespect to moisture sensitivity and stripping. The most recent comprehensive efforts at fieldcalibration have typically included fewer than 25 test sections (Aschenbrener et al. 1995;Busching et al. 1986) and have not considered the full range of variables shown above.Solaimanian et al. (1993) evaluated long-term stripping performance of 46 test sections on 9
Solaimanian, Harvey, Tahmoressi, and Tandon 83
FIGURE 1 Factors influencing moisture damage of asphalt pavements (after Lu 2003). roads for a period of 6 years and found no clear relationship between laboratory results and fieldperformance. In addition, the conditions under which moisture damage and stripping occur may not bethe same in different locations. This indicates that calibration data sets must include the climateregions and traffic conditions in which the test results will be used. For example, Aschenbreneridentified that all of the test sections compared with test results in Colorado had most of theirprecipitation during the hottest months of the year. The pass/fail values developed in Coloradomay not be applicable to northeastern California, where the hottest months have little or norainfall. The Long-Term Pavement Performance database has not been mined for moisturesensitivity/stripping information, but it has had difficulty in providing comprehensive data formany of its test sections. A recent database of hot-mix asphalt concrete data developed by Whiteet al. (2002) that is comprehensive in terms of the variables listed above may provide a valuable
Field performance of asphalt pavement
ConstructionQuality
PavementStructure
Traffic (load,repetition)
Climate (rainfall,temperature,
FTC)
Resistance of asphalt mixture to moisture damage under a specific laboratory testing condition
Asphalt-aggregate bonding strength under a specific laboratory testing condition
Air void structure
Asphalt content
Aggregate gradation,
fine content
Asphalt-aggregate interaction through models of bonding between asphalt and aggregate
Asphalt physicochemical propertiesAggregate physicochemical
properties
Adsorption / desorption offunctionalities
Additives content Impurities
Mineralogical composition,
surface energy
Surfacetexture
Level 3
Level 2
Level 1-2
Level 1
Compactedmix infield undertraffic
Compacted mixconditioned withwater and/or trafficin the laboratory
Loose mix con-ditioned withwater
Mix components
84 Moisture Sensitivity of Asphalt Pavements: A National Seminar
source of information for calibration in the future. Development of better databases forcalibration of laboratory results with field data is vital for development of better laboratory testsfor moisture sensitivity/stripping and other distress mechanisms.
With regard to quantifying performance, identification of stripping can be difficultwithout coring if it occurs below the surface, and moisture damage that does not proceed tostripping is very difficult to identify without information about mix performance in the absenceof water. For example, Aschenbrener et al. (1995) identified pavements as being “good,” “highmaintenance,” “complete rehabilitation,” or “disintegrators.” Pavements were placed in thesecategories on the basis of years to failure versus design life and coring to find stripping. Otherresearchers use different criteria for all but the “good” pavements. Stripping is seldom formallyidentified and entered into a database on field projects when they fail, and the stripping itself isvisually identified and therefore somewhat subjective unless most of the asphalt has disappearedfrom the aggregate. This is also the case for laboratory tests that rely on visual identification.
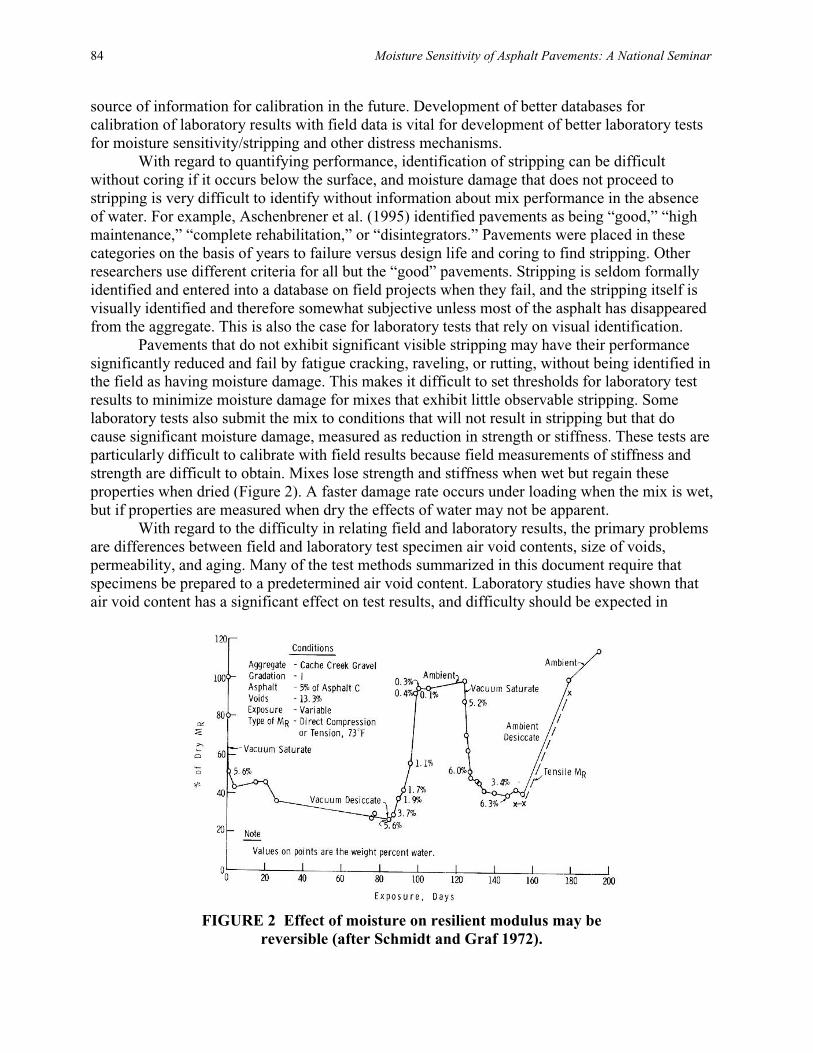
Pavements that do not exhibit significant visible stripping may have their performancesignificantly reduced and fail by fatigue cracking, raveling, or rutting, without being identified inthe field as having moisture damage. This makes it difficult to set thresholds for laboratory testresults to minimize moisture damage for mixes that exhibit little observable stripping. Somelaboratory tests also submit the mix to conditions that will not result in stripping but that docause significant moisture damage, measured as reduction in strength or stiffness. These tests areparticularly difficult to calibrate with field results because field measurements of stiffness andstrength are difficult to obtain. Mixes lose strength and stiffness when wet but regain theseproperties when dried (Figure 2). A faster damage rate occurs under loading when the mix is wet,but if properties are measured when dry the effects of water may not be apparent.
With regard to the difficulty in relating field and laboratory results, the primary problemsare differences between field and laboratory test specimen air void contents, size of voids,permeability, and aging. Many of the test methods summarized in this document require thatspecimens be prepared to a predetermined air void content. Laboratory studies have shown thatair void content has a significant effect on test results, and difficulty should be expected in
FIGURE 2 Effect of moisture on resilient modulus may be reversible (after Schmidt and Graf 1972).
Solaimanian, Harvey, Tahmoressi, and Tandon 85
correlating laboratory test results with field performance if laboratory specimens are notcompacted to the same air void contents as occurred or are expected to occur in the field for agiven project. Even when air void contents are matched between the laboratory and field, theresults may vary between the two for the reasons described above, as was identified byAschenbrener (1995). These differences will largely depend on the laboratory compaction deviceused, because different compaction methods can create very different aggregate and voidstructures in the specimen even though the total air void content is the same. The results alsodepend on the laboratory aging procedures used.
If a method can be calibrated with field results, the next criteria it must pass to beimplementable concern repeatability and reproducibility and cost in terms of staff, time,materials, and equipment. To some degree, inherent higher variance can be overcome withadditional replicate specimens. However, bias and variance caused by differences amongoperators and laboratories are difficult to overcome with more replicates because the ability to“tweak” the results is placed in doubt, whether intentionally or unintentionally. These factorsmust be considered and be acceptable for a test to be implementable. However, it can be arguedthat having a test that is easy and inexpensive to perform but that cannot be calibrated with fieldresults is of no use.
In addition to an ability to correlate with field performance, laboratory tests are oftenrequired to be able to measure the effects of moisture sensitivity mitigation measures,particularly additives and modified binders. The effects of mitigation must be correlated withfield performance. Again, the mechanism used in the laboratory to evaluate a mix and its relationto the mechanism that causes moisture susceptibility/stripping in the field may not be the same,and as noted previously the field mechanism may vary between different projects.
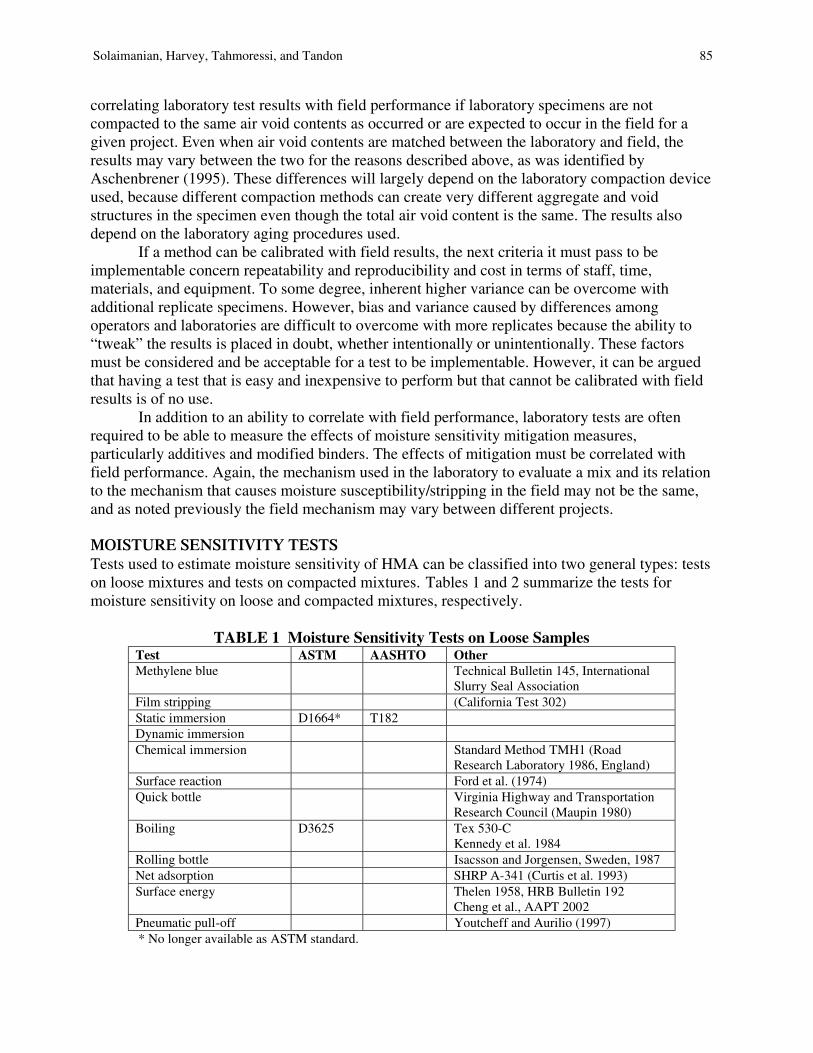
MOISTURE SENSITIVITY TESTS Tests used to estimate moisture sensitivity of HMA can be classified into two general types: testson loose mixtures and tests on compacted mixtures. Tables 1 and 2 summarize the tests formoisture sensitivity on loose and compacted mixtures, respectively.
TABLE 1 Moisture Sensitivity Tests on Loose Samples Test ASTM AASHTO Other Methylene blue Technical Bulletin 145, International
Slurry Seal AssociationFilm stripping (California Test 302) Static immersion D1664* T182 Dynamic immersion Chemical immersion Standard Method TMH1 (Road
Research Laboratory 1986, England) Surface reaction Ford et al. (1974) Quick bottle Virginia Highway and Transportation
Research Council (Maupin 1980) Boiling D3625 Tex 530-C
Kennedy et al. 1984 Rolling bottle Isacsson and Jorgensen, Sweden, 1987 Net adsorption SHRP A-341 (Curtis et al. 1993) Surface energy Thelen 1958, HRB Bulletin 192
Cheng et al., AAPT 2002 Pneumatic pull-off Youtcheff and Aurilio (1997) * No longer available as ASTM standard.
86 Moisture Sensitivity of Asphalt Pavements: A National Seminar
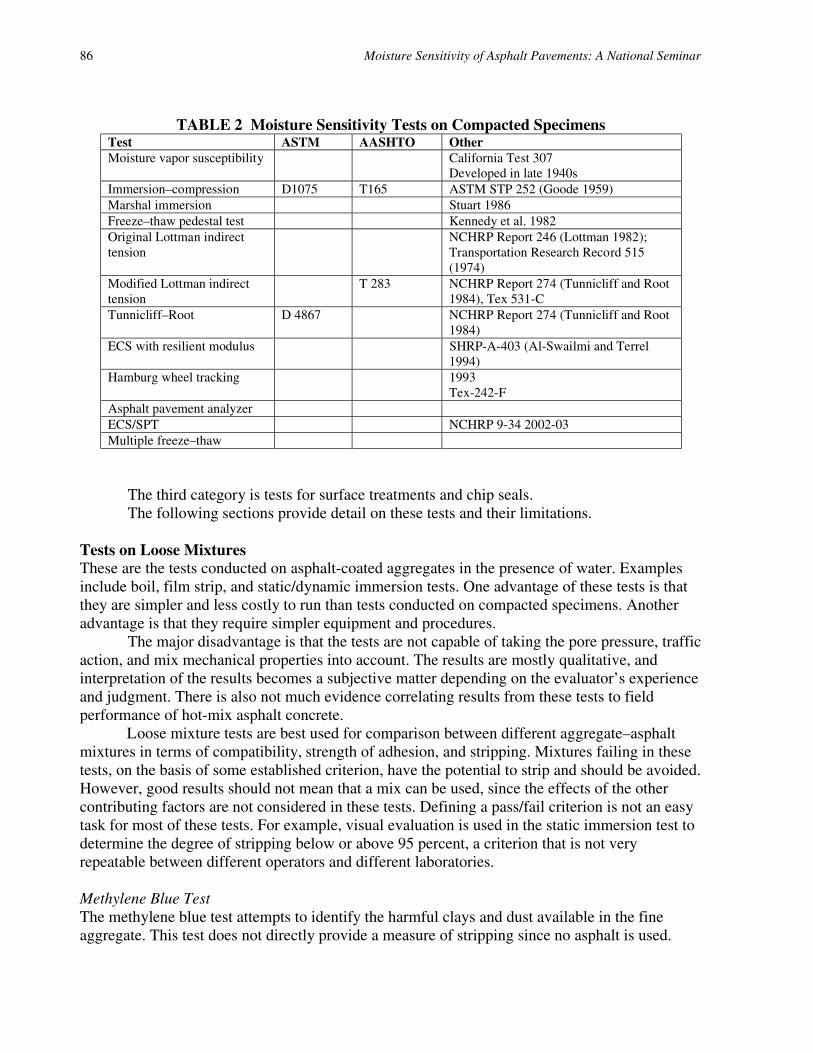
TABLE 2 Moisture Sensitivity Tests on Compacted Specimens Test ASTM AASHTO Other Moisture vapor susceptibility California Test 307
Developed in late 1940s Immersion–compression D1075 T165 ASTM STP 252 (Goode 1959) Marshal immersion Stuart 1986 Freeze–thaw pedestal test Kennedy et al. 1982 Original Lottman indirect tension
NCHRP Report 246 (Lottman 1982); Transportation Research Record 515 (1974)
Modified Lottman indirect tension
T 283 NCHRP Report 274 (Tunnicliff and Root 1984), Tex 531-C
Tunnicliff–Root D 4867 NCHRP Report 274 (Tunnicliff and Root 1984)
ECS with resilient modulus SHRP-A-403 (Al-Swailmi and Terrel 1994)
Hamburg wheel tracking 1993 Tex-242-F
Asphalt pavement analyzer ECS/SPT NCHRP 9-34 2002-03 Multiple freeze–thaw
The third category is tests for surface treatments and chip seals.The following sections provide detail on these tests and their limitations.
Tests on Loose Mixtures These are the tests conducted on asphalt-coated aggregates in the presence of water. Examplesinclude boil, film strip, and static/dynamic immersion tests. One advantage of these tests is thatthey are simpler and less costly to run than tests conducted on compacted specimens. Anotheradvantage is that they require simpler equipment and procedures.
The major disadvantage is that the tests are not capable of taking the pore pressure, trafficaction, and mix mechanical properties into account. The results are mostly qualitative, andinterpretation of the results becomes a subjective matter depending on the evaluator’s experienceand judgment. There is also not much evidence correlating results from these tests to fieldperformance of hot-mix asphalt concrete.
Loose mixture tests are best used for comparison between different aggregate–asphaltmixtures in terms of compatibility, strength of adhesion, and stripping. Mixtures failing in thesetests, on the basis of some established criterion, have the potential to strip and should be avoided.However, good results should not mean that a mix can be used, since the effects of the othercontributing factors are not considered in these tests. Defining a pass/fail criterion is not an easytask for most of these tests. For example, visual evaluation is used in the static immersion test todetermine the degree of stripping below or above 95 percent, a criterion that is not very repeatable between different operators and different laboratories.
Methylene Blue Test The methylene blue test attempts to identify the harmful clays and dust available in the fineaggregate. This test does not directly provide a measure of stripping since no asphalt is used.
Solaimanian, Harvey, Tahmoressi, and Tandon 87
However, the results can be used to decide whether potential for stripping exists because ifaggregates are coated with montmorillonite-type clay, proper coating will not take place betweenthe aggregate and asphalt.
The methylene blue test was developed in France and was recommended by theInternational Slurry Seal Association (ISSA) to quantify the amount of harmful clays of thesmectite (montmorillonite) group, organic matter and iron hydroxides present in fine aggregates.The test method titled “Determination of Methylene Blue Adsorption Value (MBV) of MineralAggregate Fillers and Fines” was contained in Technical Bulletin 145 of ISSA (1989). In thetest, methylene blue (MB) is dissolved in distilled water with a known concentration. A knownweight of the filler finer than 75 microns is also uniformly stirred and dispersed in a separatebeaker. Drops of MB solution, 0.5 mL each, are added to the solution with a burette one at a timewhile stirring. After each drop of MB, one drop of the solution is removed using a stirring rodand placed on filter paper. The test is continued until a light blue halo is formed around the drop.The absorption of MB by clay is used to determine the amount of harmful clay, with greaterabsorption indicating larger amounts of harmful clays. Research by Kandhal et al. (1998) hasindicated that larger MB values correspond to lower tensile strength ratios from AASHTO T283.
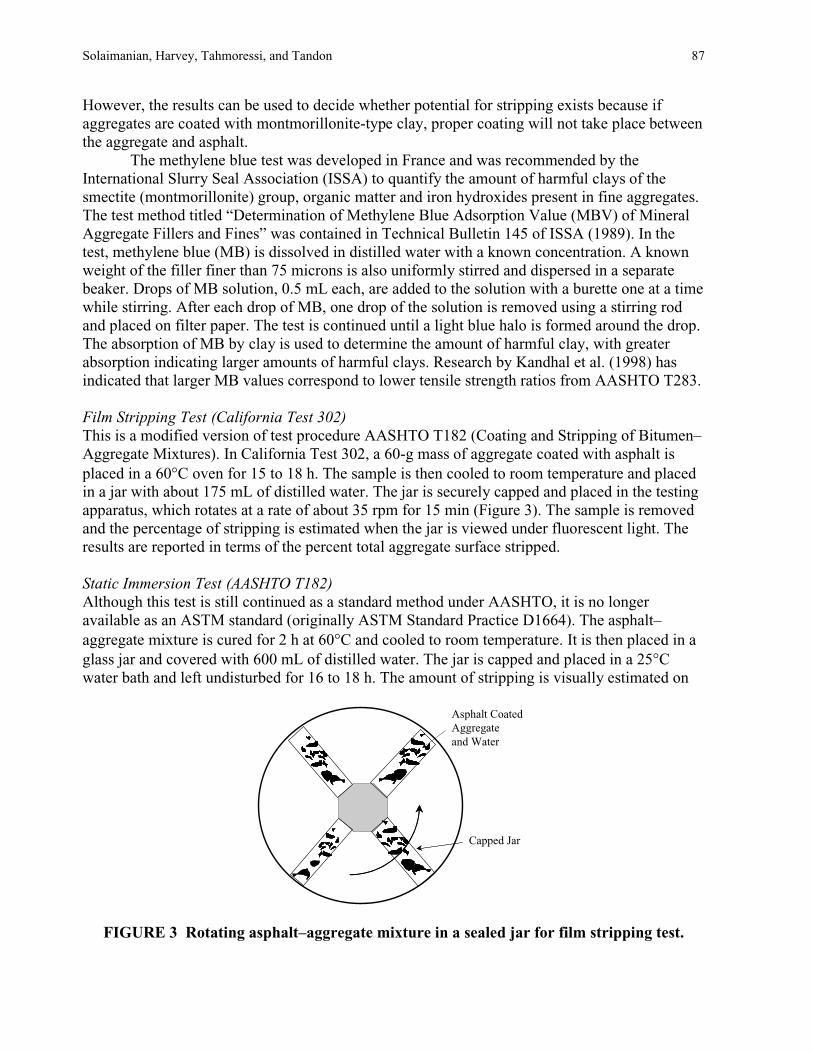
Film Stripping Test (California Test 302) This is a modified version of test procedure AASHTO T182 (Coating and Stripping of Bitumen–Aggregate Mixtures). In California Test 302, a 60-g mass of aggregate coated with asphalt isplaced in a 60°C oven for 15 to 18 h. The sample is then cooled to room temperature and placedin a jar with about 175 mL of distilled water. The jar is securely capped and placed in the testingapparatus, which rotates at a rate of about 35 rpm for 15 min (Figure 3). The sample is removedand the percentage of stripping is estimated when the jar is viewed under fluorescent light. Theresults are reported in terms of the percent total aggregate surface stripped.
Static Immersion Test (AASHTO T182) Although this test is still continued as a standard method under AASHTO, it is no longeravailable as an ASTM standard (originally ASTM Standard Practice D1664). The asphalt–aggregate mixture is cured for 2 h at 60°C and cooled to room temperature. It is then placed in aglass jar and covered with 600 mL of distilled water. The jar is capped and placed in a 25°Cwater bath and left undisturbed for 16 to 18 h. The amount of stripping is visually estimated on
Asphalt Coated Aggregate and Water
Capped Jar
FIGURE 3 Rotating asphalt–aggregate mixture in a sealed jar for film stripping test.
88 Moisture Sensitivity of Asphalt Pavements: A National Seminar
the basis of the established criteria. The total visible area of the aggregate is estimated as eitherless than or greater than 95%. This is a major limitation of the test because the results aredecided purely on the basis of a subjective estimate of less than or greater than 95%. Test resultshave indicated that placing samples at 60° C bath rather than 25° C for 18 h increases the amountof stripping.
Dynamic Immersion Test The dynamic immersion test is used to accelerate the stripping effect compared with the staticimmersion test. The test has not been standardized and is not widely used. Samples of asphalt–aggregate mixtures are prepared the same way as for the static immersion test but are subjected to 4 h of agitation. As the period of agitation increases, the degree of stripping increases. Bothstatic and dynamic immersion tests, however, fail to take into account the pore pressure effectand traffic action, as is the case for all tests on loose mixtures.
Chemical Immersion Test The chemical immersion test method covers the determination of the adhesion of bitumen tostone aggregate by means of boiling asphalt-coated aggregate successively in distilled water.Increasing concentrations of sodium carbonate (Na2CO3) are used, numbered 0 to 9 and referredto as the Riedel and Weber (R&W) number. Zero refers to distilled water, 1 implies 0.41 g ofsodium carbonate in 1 L of water, and 9 refers to the highest concentration, which is 106 g ofNa2CO3 in 1 L of water. Between 1 and 9, for every doubling of concentration the R&W numberis increased by one. The number of the concentration at which the bitumen strips to such anextent that it is no longer a film but only specks or droplets is called the stripping value.
An asphalt–aggregate test sample of 100 g is dried in an oven at 110°C. The aggregate ismixed with binder at high temperature and left to cool to room temperature. Solutions of sodiumcarbonate in distilled water are prepared at different concentrations. About 50 mL of distilledwater is brought to boiling in a 200-mL glass beaker. Afterwards, 10 g of the preparedaggregate–binder mix is placed into the boiling water. After 1 min of boiling, the water isdrained and the sample is placed on filter paper. The sample is examined for stripping after it isdry. The stripping value of the aggregate is the R&W number of the lowest concentration atwhich stripping occurs. If the sample does not strip at number 9, a stripping value of 10 is givento the aggregate. If no stripping is observed, the procedure is repeated, starting with the weakestconcentration of sodium carbonate.
Surface Reaction Test Test procedures have been developed at different times to quantify the level of stripping forloose asphalt–aggregate mixtures. Quantifying the degree of stripping eliminates problemsencountered with visual rating. One of these procedures, developed by Ford et al. (1974), iscalled the surface reaction test. This test is based on the principle that calcareous or siliceousminerals will react with a suitable reagent and create a gas as part of the chemical reactionproducts. This generated gas, in a sealed container, will create a certain pressure that can beconsidered proportional to the mineral surface area exposed to the reagent. The reagent istypically an acid. The test is conducted on the asphalt–aggregate mixture after it has beensubjected to the stripping effects of water. Different levels of stripping result in different exposedsurface areas of aggregate particles. A larger exposed surface area will generate higher gas
Solaimanian, Harvey, Tahmoressi, and Tandon 89
pressure. The advantages of the test are that it is simple and reproducible and takes less than 10min to perform. A disadvantage is that the test requires use of highly corrosive and toxic acids.
Texas Boiling Test The Texas boiling test procedure was developed by Kennedy et al. (1982; 1984) on the basis ofthe earlier work. The procedure requires adding asphalt–aggregate mixture to boiling water andbringing the water back to boiling after this addition. After 10 min, the mixture is allowed to coolwhile the stripped asphalt is skimmed away. The water is drained, and the wet mixture is placedon a paper towel and allowed to dry. Visual rating is conducted to assess the level of stripping.This test procedure is a quick method for evaluating the moisture sensitivity of an asphalt–aggregate mixture. However, it does not account for mechanical properties of the mix, and itdoes not include the effects of traffic action. The test is also subjective and qualitative, andresults are judged on the basis of a visual rating. A useful application of the test could be forquick evaluation of various asphalt–aggregate combinations as a relative measure of the bondquality and stripping resistance. The procedure has been standardized as ASTM D3625 (Effect ofWater on Bituminous-Coated Aggregate Using Boiling Water).
Rolling Bottle Test The test was developed by Isacsson and Jorgensen of Sweden (1987). Aggregate chips are coatedwith binder and covered with water in glass jars. The jars are rotated so that the contents areagitated. Periodically, the coating of the stones is estimated visually.
Net Adsorption Test The net adsorption test (NAT) was developed under SHRP in the early 1990s and is documentedin SHRP Report A-341 (Curtis et al. 1993). The test is used to determine the affinity and compatibility of an asphalt–aggregate pair and the sensitivity of the system to water. Therefore, itcan be considered a screening test.
The test comprises two steps. First, asphalt is adsorbed onto aggregate from a toluenesolution, the amount of asphalt remaining in solution is measured, and the amount of asphaltadsorbed to the aggregate is determined. Second, water is introduced into the system, asphalt isdesorbed from the aggregate surface, the asphalt present in the solution is measured, and theamount remaining on the aggregate surface is calculated. The amount of asphalt remaining onthe surface after desorption is termed net adsorption.
The net adsorption test offers a direct means of comparing the affinity of differentasphalt–aggregate pairs. The test is relatively fast and easily performed. However, SHRP ReportA-341 provides mixed conclusions in terms of correlation between NAT results and moisturesensitivity results from indirect tension tests on compacted specimens. The NAT procedure wasmodified by researchers at the University of Nevada at Reno, and the test results were correlatedwith the ECS (Scholz et al. 1994). The study by Scholz et al. (SHRP-A-402, 1994) indicates thatpredictions of the water sensitivity of the binder as proposed by NAT show little or nocorrelation to wheel-tracking tests on the mixes.
Wilhelmy Plate Test and Universal Sorption Device for Surface Free Energy In recent years, asphalt technologists have performed research into the relationship betweensurface free energy and moisture damage potential. Most of the surface energy research for
90 Moisture Sensitivity of Asphalt Pavements: A National Seminar
asphalt–aggregate mixture combinations has been conducted at Texas A&M University(Elphingstone 1997; Cheng et al. 2001; Cheng et al. 2002).
The principle behind using the concept of surface free energy is that the cohesive bondingwithin asphalt and the adhesive bonding between asphalt and aggregate are related to the surfacefree energy of the asphalt and aggregate. Researchers at Texas A&M University demonstratedthe effectiveness of this concept by using three different aggregates (one granite and twolimestone aggregates) and two of the SHRP asphalts (AAM and AAD). The permanentdeformation on compacted specimens using compressive testing correlated well with measuredvalues of surface free energy of the asphalts and aggregates used in the research when tested indry and wet conditions. The asphalt surface free energy is determined by using a Wilhelmy platetest, where the dynamic contact angle between asphalt and a liquid solvent is measured. Thesurface free energy of aggregate is measured by using a universal sorption device developed atTexas A&M University.
Pneumatic Pull-Off Test The pneumatic pull-off test provides a rapid and reproducible means of evaluating moisturesusceptibility of asphalt binders. The experimental procedure measures the tensile and bondingstrength of asphalt binder applied to a glass plate as a function of time while exposed to water.Asphalt binder, containing 1.0% by weight of glass beads, is applied to a porous disk, which isthen pressed onto a glass plate. The glass beads are used to control the thickness of the asphaltfilm and do not appear to have any effect on the results. The pressure necessary to debond theconditioned specimen at 25° C is measured with a pneumatic adhesion tester. The typical pullingrate is about 66 kPa/s, and asphalt film thickness is around 200 microns. The test has indicatedthat, as expected, soak time is an important factor. This means that longer exposure to waterincreases stripping damage if the mixture is susceptible to debonding. A study by Youtcheff andAurilio (1997) has indicated that the viscosity building structure provided by asphaltenes isdisrupted by the presence of water, and the resistance to moisture damage of the binder appearsto depend on the properties of the maltenes.
Tests on Compacted Mixtures These tests are conducted on laboratory-compacted specimens or field cores or slabs. Examplesinclude indirect tensile freeze–thaw cyclic with modulus and strength measurement, immersion–compression, abrasion weight loss, and sonic vibration tests. This last test is also conducted onloose mixtures and is currently under investigation by the Western Research Institute. The majoradvantage of these tests is that the mix physical and mechanical properties, water/traffic action,and pore pressure effects can be taken into account. The results can be measured quantitatively,which minimizes subjective evaluation of test results. The drawback of these tests is that moreelaborate testing equipment, longer testing times, and more laborious test procedures are needed.
Immersion–Compression Test ASTM D1075 (1949 and 1954) and AASHTO T165-55 (Effect ofWater on Compressive Strength of Compacted Bituminous Mixtures) The immersion–compression procedure was originally published as ASTM D1075-49.Therefore, the test is among the first to be used for evaluation of moisture sensitivity. Revisionswere made to the procedure in 1996. Goode (1959) explains the test in detail in ASTM SpecialTechnical Publication 252.
Solaimanian, Harvey, Tahmoressi, and Tandon 91
Two groups of compacted specimens are used in this test method. One group issubmerged in a 120° F water bath for 4 days for conditioning, and the other group is maintaineddry. An alternative approach to conditioning is to immerse the test specimens in water for 24 h at140° F. Compressive strength is measured on specimens of both groups at 77° F at a deformationrate of 0.05 in./min per inch of height. For a 4-in.-tall specimen, the rate would be 0.2 in./min.The average strength of conditioned specimens over that of dry specimens is used as a measureof moisture sensitivity of the mix. Most agencies have used a 70% ratio as a passing limit.
Marshall Immersion Test The conditioning phase of this test is identical to the one used for the immersion–compressiontest. However, Marshall stability is used as a strength parameter rather than compressivestrength.
Moisture Vapor Susceptibility The moisture vapor susceptibility procedure was developed and has been used by the CaliforniaDepartment of Transportation (California Test Method 307). Two specimens are prepared andcompacted using the kneading compactor, as for mix design testing, except that they are preparedin stainless steel molds. The compacted surface of each specimen is covered with an aluminumseal cap, and a silicone sealant is applied around the edges to prevent the escape of moisturevapor. An assembly with a felt pad, seal cap, and strip wick is prepared to make water vaporavailable to the specimen by placing the free ends of the strip wick in water. After the assemblyis left in an oven at 60° C with the assembly suspended over water for 75 h, the specimen isremoved and tested immediately in the Hveem stabilometer. A minimum Hveem stabilometervalue is required, which is less than that required for the dry specimens used for mix design.
Repeated Pore Water Pressure Stressing and Double-Punch Method This test procedure was developed by Jimenez at the University of Arizona (1974). The test fallsin the category of those that include measurement of mix mechanical properties and those thattake traffic dynamic loading into account. To capture the water pore pressure effect, compactedspecimens undergo a cyclic stressing under water. The load is not directly in contact with thespecimen. This stressing is accomplished through generating cyclic pressure within water at arate of 580 rpm. The generated water pressure is between 35 and 217 kPa, which, according toJimenez, is within a range comparable with pressure expected in saturated pavements undertraffic. Once cyclic water pressure inducement is complete, the tensile strength of the specimensis determined by using the double-punch equipment. Compacted specimens are tested throughsteel rods placed at either end of the specimen in a punching configuration. Jimenezdemonstrated the severity of this test by comparing predictions on similar mixtures using theimmersion–compression test.
Original Lottman Indirect Tension Test The original Lottman procedure was developed by Lottman at the University of Idaho in the late1970s (Lottman 1978). The procedure requires one group of dry specimens and one group ofconditioned specimens. The specimens are 4 in. in diameter and about 2.5 in. thick. Conditioningincludes vacuum saturation of specimens under 26 in. of mercury vacuum for 30 min followedby 30 min at atmospheric pressure. The partially saturated specimens are frozen at 0° F for 15 hfollowed by 24 h in a 140° F water bath. This is considered accelerated freeze–thaw conditioning.
92 Moisture Sensitivity of Asphalt Pavements: A National Seminar
Lottman proposed thermal cyclic conditioning as an alternative. For each cycle, after 4 hof freeze at 0° F, the temperature is changed to 120° F and maintained for 4 h before being changed back to 0° F. Therefore, a complete thermal cycle lasts 8 h. The specimens go through18 thermal cycles of this type. Lottman concluded that thermal cycling was somewhat moresevere than the accelerated freeze–thaw conditioning with water bath. Conditioned and dryspecimens are both tested for tensile resilient modulus and tensile strength using indirect tensileequipment. The loading rate is 0.065 in./min for testing at 55° F or 0.150 in./min for testing at73° F. The severity of moisture sensitivity is judged on the basis of the ratio of test values forconditioned and dry specimens.
AASHTO T283 (Modified Lottman Indirect Tension Test Procedure) The AASHTO Standard Method of Test T283, “Resistance of Compacted Bituminous Mixture toMoisture Induced Damage,” is one of the most commonly used procedures for determiningHMA moisture susceptibility. The test is similar to the original Lottman with a few exceptions.One of the modifications is that the vacuum saturation is continued until a saturation levelbetween 70% and 80% is achieved, compared with the original Lottman procedure that requireda set time of 30 min. Another change is in the test temperature and loading rate for the strengthtest. The modified procedure requires a rate of 2 in./min at 77° F rather than 0.065 in./min at55° F. A higher rate of loading and a higher temperature were selected to allow testing ofspecimens with a Marshall stability tester, available in most asphalt laboratories. The highertemperature also eliminates the need for a cooling system.
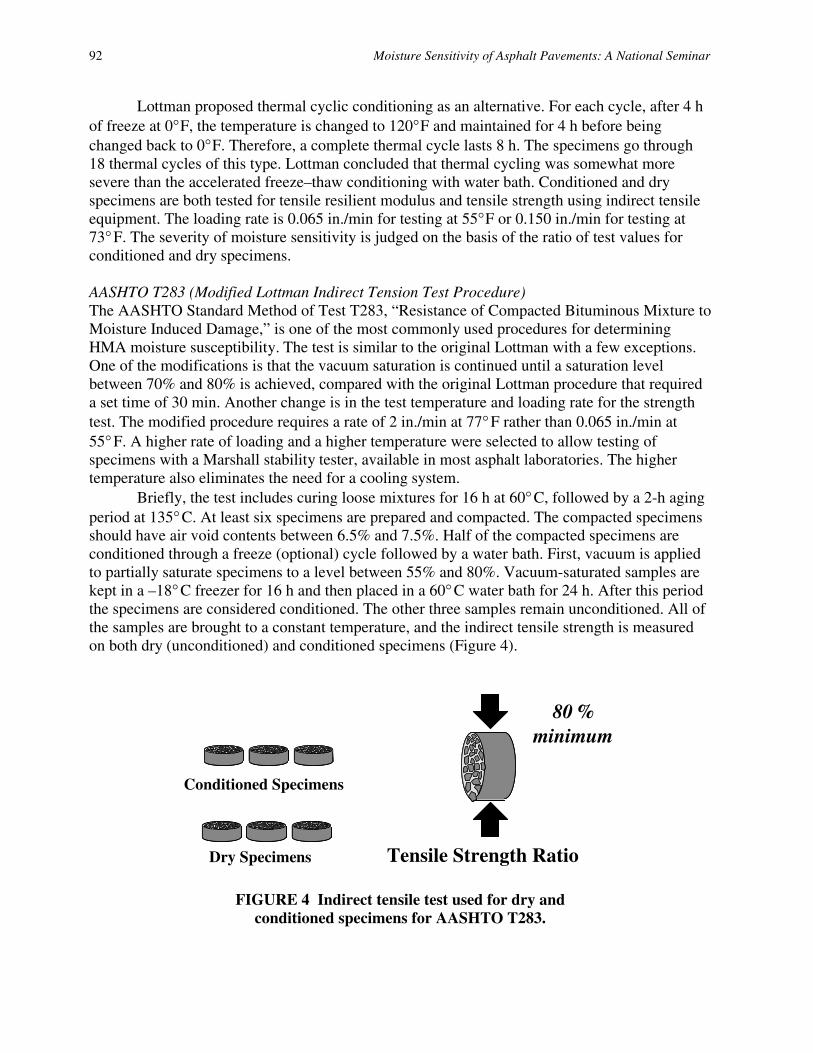
Briefly, the test includes curing loose mixtures for 16 h at 60° C, followed by a 2-h agingperiod at 135° C. At least six specimens are prepared and compacted. The compacted specimensshould have air void contents between 6.5% and 7.5%. Half of the compacted specimens areconditioned through a freeze (optional) cycle followed by a water bath. First, vacuum is appliedto partially saturate specimens to a level between 55% and 80%. Vacuum-saturated samples arekept in a –18° C freezer for 16 h and then placed in a 60° C water bath for 24 h. After this period the specimens are considered conditioned. The other three samples remain unconditioned. All ofthe samples are brought to a constant temperature, and the indirect tensile strength is measuredon both dry (unconditioned) and conditioned specimens (Figure 4).
Tensile Strength Ratio
80 %minimum
Conditioned Specimens
Dry Specimens
80 %minimum
FIGURE 4 Indirect tensile test used for dry and
conditioned specimens for AASHTO T283.
Solaimanian, Harvey, Tahmoressi, and Tandon 93
State highway agencies report mixed success with this method. Several research projectshave dealt with the method’s shortcomings, resulting in suggested “fixes,” but the test remainsempirical and liable to give either false positives or false negatives in the prediction of moisturesusceptibility. Major concerns with this test are its reproducibility and its ability to predictmoisture susceptibility with reasonable confidence (Solaimanian and Kennedy 2000a).
AASHTO T283 was adopted by the Superpave system as the required test fordetermination of moisture damage. Following this adoption, state highway agencies made this test the most widely used procedure for determination of moisture damage potential. Later, Eppset al. (2000) investigated this test extensively under NCHRP Project 9-13. The project,“Evaluation of Water Sensitivity Tests,” was completed in 1999 and provided recommendedchanges to AASHTO T283 to better accommodate its use in the Superpave system. Theresearchers investigated the effect of a number of factors on the test results, including differentcompaction types, diameter of the specimen, degree of saturation, and the freeze–thaw cycle.They used five aggregates, two considered good performers in terms of moisture resistance andthe other three considered to have low to moderate resistance to moisture damage. Binders werespecific to each mix and included PG 58-28, 64-22, 64-28, and 70-22. In summary, the followingconclusions were drawn from that study, as reported by Epps et al. (2000):
• In general, resilient modulus had no effect on tensile strength of dry specimens,conditioned specimens with no freeze–thaw, or conditioned specimens with freeze–thaw.
• Dry strength of 100-mm-diameter Superpave gyratory compactor (SGC) specimensand 100-mm Hveem specimens was larger than that of 150-mm SGC specimens.
• Dry strength of 100-mm Marshall specimens was the same as that of the 150-mmSGC specimens.
• Dry strength of 100-mm-diameter SGC specimens was similar to the dry strength of100-mm Hveem specimens.
• Dry strength increased as the aging time for the loose mix increased. • The freeze–thaw tensile strength was the same as the no freeze–thaw tensile strength.• The level of saturation had little effect on the no freeze–thaw and freeze–thaw tensile
strengths. The levels of saturation used in the study were 50%, 75%, and 95%. • The tensile strength ratio of 150-mm SGC specimens was larger than the tensile
strength ratio of 100-mm-diameter SGC specimens or 100-mm Hveem specimens. • The tensile strength ratio of 150-mm SGC specimens was similar to the tensile
strength ratio of 100-mm Marshall specimens.
The results obtained in this study indicated that the water sensitivities of the mixtures asdescribed by the state departments of transportation did not satisfactorily match the observedbehavior of the mixtures for a number of data groups.
ASTM D4867 (Tunnicliff–Root Test Procedure) ASTM D4867, “Standard Test Method for Effect of Moisture on Asphalt Concrete PavingMixtures,” is comparable with AASHTO T283. In both methods, the freeze cycle is optional.However, curing of the loose mixture in a 60°C oven for 16 h is eliminated in the ASTM D4867procedure.
94 Moisture Sensitivity of Asphalt Pavements: A National Seminar
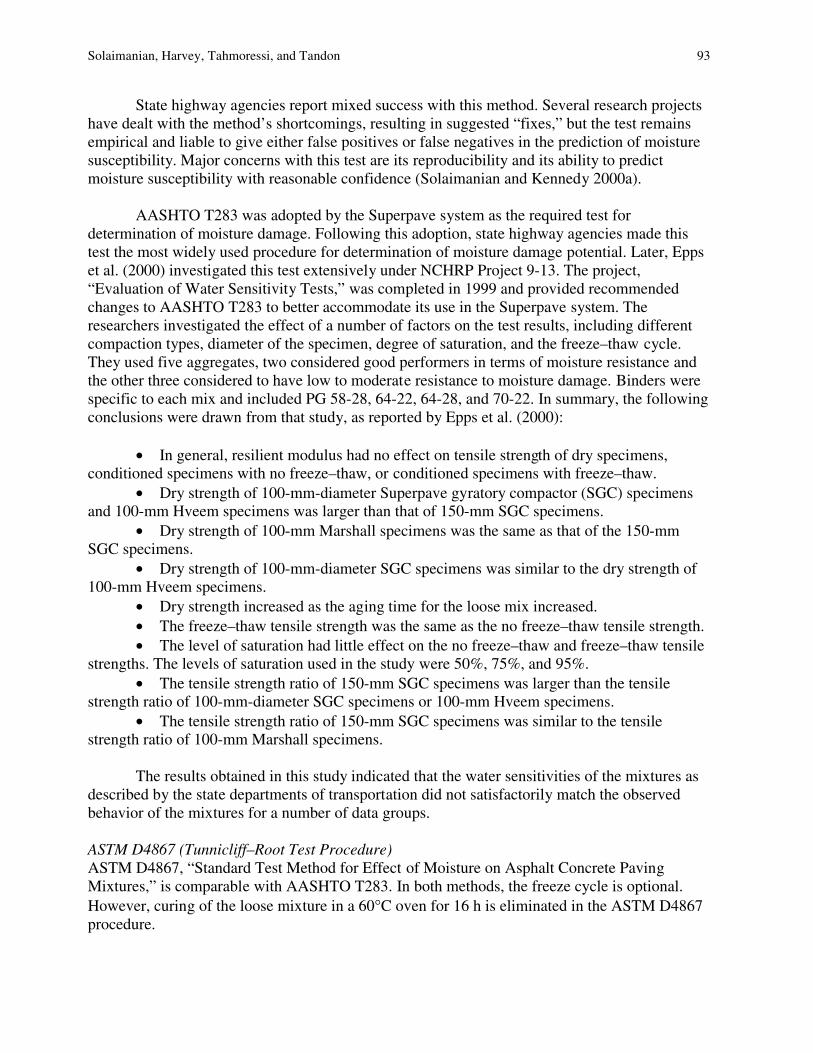
Texas Freeze–Thaw Pedestal Test The Texas freeze–thaw pedestal test was proposed by Kennedy et al. (1982) as a modification ofthe water susceptibility test procedure proposed by Plancher et al. (1980) at the WesternResearch Institute. The test is in the category of those evaluating the compatibility betweenasphalt binder and aggregate and the corresponding adhesiveness.
The test is designed to minimize the effect of mechanical properties of the mix by using auniform-sized aggregate. It prescribes the preparation of hot mix using a fine fraction ofaggregate [passing the No. 20 (0.85-mm) and retained on the No. 35 (0.50-mm) sieve] andasphalt at a temperature of 150° C. The hot mix so prepared is kept in the oven at 150° C for 2 h and stirred for uniformity of temperature every hour. At the end of 2 h, the mix is removed fromthe oven and cooled to room temperature, reheated to 150° C, and compacted with a load of about28 kN for 15 min to form a briquette 41 mm in diameter by 19 mm in height (the procedure doesnot prescribe any tolerance for the dimensions). The briquette is cured for 3 days at roomtemperature and placed on a pedestal in a covered jar of distilled water (Figure 5). It is thensubjected to thermal cycling of 15 h at –12° C, followed by 9 h at 49° C. After each cycle, the briquette surface is checked for cracks. The number of cycles required to induce cracking is ameasure of water susceptibility (typically 10 freeze–thaw cycles).
Pedestal test specimens are prepared from a narrow range of uniformly sized aggregateparticles coated with 5% asphalt. This formulation reduces aggregate particle interactions in themixture matrix, and the thin asphalt coating between aggregate particles produces a testspecimen that is highly permeable and thus allows easy penetration of water into the intersticesfound between aggregate particles. Therefore, moisture-induced damage in the specimen caneasily arise either from bond failure at the asphalt–aggregate interface region (stripping) or fromthe fracture of the thin asphalt–cement films bonding aggregate particles (cohesive failure) byformation of ice crystals.
FIGURE 5 Freeze–thaw pedestal test: compacted specimen in a water jar ready for thermal cycling.
Specimen (Briquette)
Stress Pedestal
Jar
Cap
Water
Solaimanian, Harvey, Tahmoressi, and Tandon 95
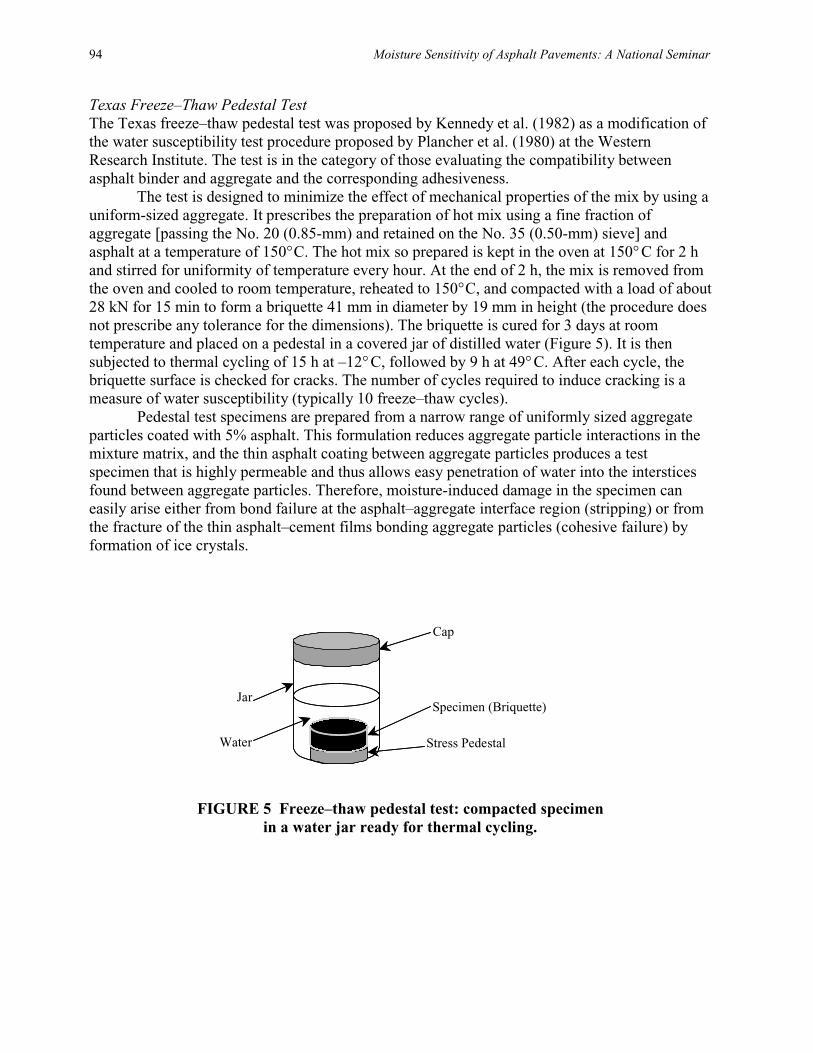
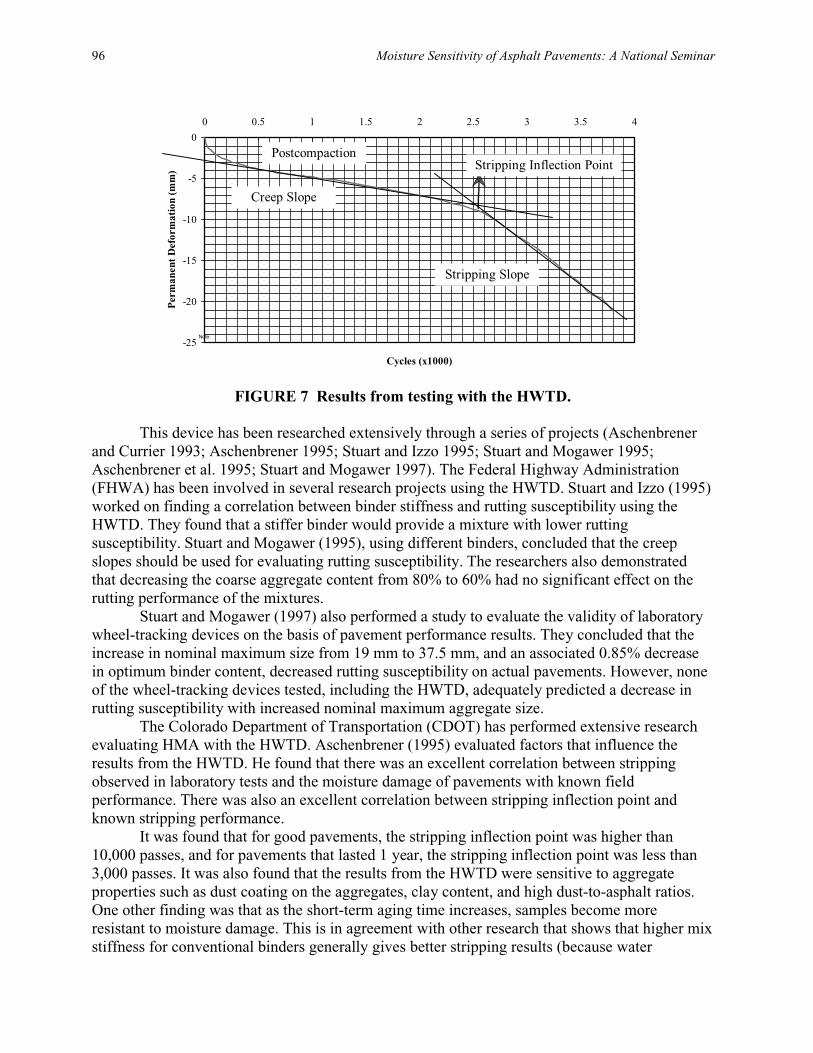
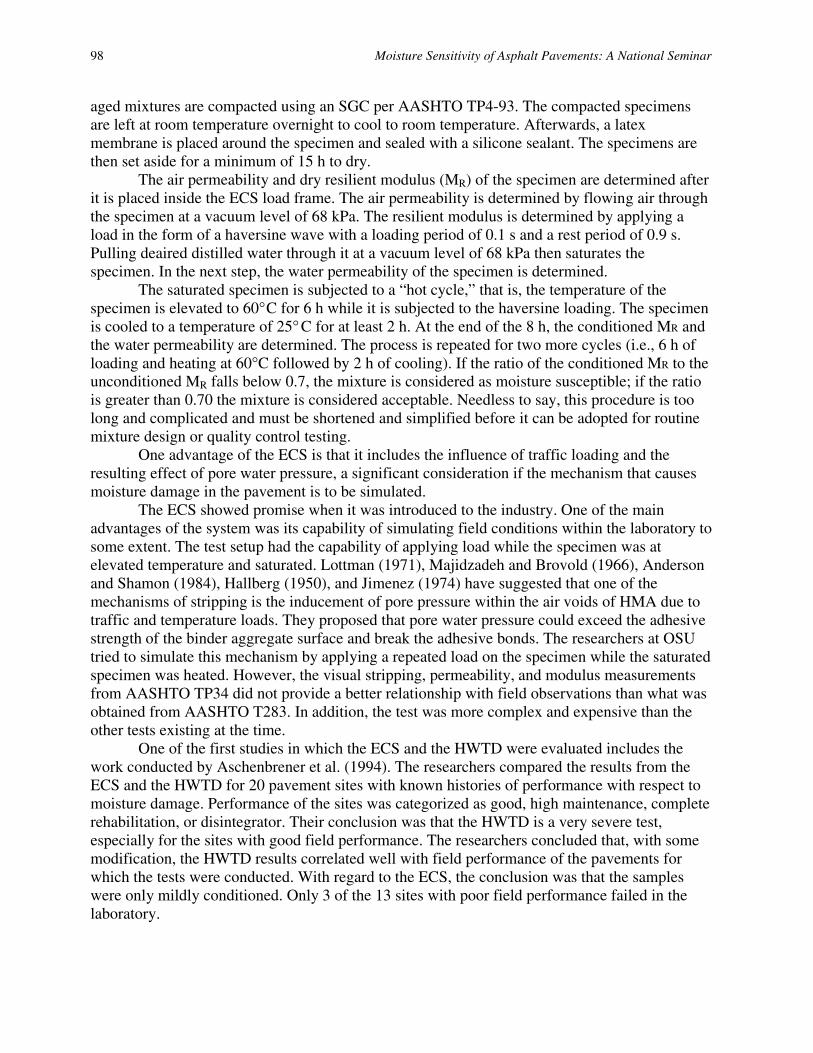
Hamburg Wheel-Tracking Device The HWTD was developed by Esso A.G. in the 1970s in Hamburg, Germany (Romero andStuart 1998). This device measures the combined effects of rutting and moisture damage byrolling a steel wheel across the surface of an asphalt concrete specimen that is immersed in hotwater. The wheel rolls back and forth on the submerged specimen. Originally, a pair of cubicalor beam test specimens were used. However, with the increasing use of the SGC, the TexasDepartment of Transportation (TxDOT) and others have adopted a testing protocol usingcylindrical specimens compacted in the SGC (Figure 6). Typically, gyratory-compactedspecimens are arranged in a series to provide the required path length for the wheels. Each steelwheel passes 20,000 times or until 20 mm of deformation is reached. The measurements arecustomarily reported versus wheel passes.
The results from the HWTD are the postcompaction consolidation, creep slope, strippingslope, and stripping inflection point (Figure 7). The postcompaction consolidation is thedeformation measured at 1,000 passes, assuming that the wheel is densifying the mixture withinthe first 1,000 wheel passes. The creep slope is the number of repetitions or wheel passes tocreate a 1-mm rut depth due to viscous flow. The stripping slope is represented by the inverse ofthe rate of deformation in the linear region of the deformation curve, after stripping begins anduntil the end of the test. The stripping slope can be quantified as the number of passes required tocreate a 1-mm impression from stripping. The stripping inflection point is the number of passesat the intersection of the creep slope and the stripping slope. It represents the moisture damage resistance of the HMA and is assumed to be the initiation of stripping (Aschenbrener and Currier1993).
FIGURE 6 HWTD with cylindrical specimens.
96 Moisture Sensitivity of Asphalt Pavements: A National Seminar
-25
-20
-15
-10
-5
0
0 0.5 1 1.5 2 2.5 3 3.5 4
Cycles (x1000)
Per
man
ent
Def
orm
atio
n (m
m)
Note:
Postcompaction
Creep Slope
Stripping Slope
Stripping Inflection Point
FIGURE 7 Results from testing with the HWTD.
This device has been researched extensively through a series of projects (Aschenbrener and Currier 1993; Aschenbrener 1995; Stuart and Izzo 1995; Stuart and Mogawer 1995; Aschenbrener et al. 1995; Stuart and Mogawer 1997). The Federal Highway Administration (FHWA) has been involved in several research projects using the HWTD. Stuart and Izzo (1995) worked on finding a correlation between binder stiffness and rutting susceptibility using the HWTD. They found that a stiffer binder would provide a mixture with lower rutting susceptibility. Stuart and Mogawer (1995), using different binders, concluded that the creep slopes should be used for evaluating rutting susceptibility. The researchers also demonstrated that decreasing the coarse aggregate content from 80% to 60% had no significant effect on the rutting performance of the mixtures.
Stuart and Mogawer (1997) also performed a study to evaluate the validity of laboratory wheel-tracking devices on the basis of pavement performance results. They concluded that the increase in nominal maximum size from 19 mm to 37.5 mm, and an associated 0.85% decrease in optimum binder content, decreased rutting susceptibility on actual pavements. However, none of the wheel-tracking devices tested, including the HWTD, adequately predicted a decrease in rutting susceptibility with increased nominal maximum aggregate size.
The Colorado Department of Transportation (CDOT) has performed extensive research evaluating HMA with the HWTD. Aschenbrener (1995) evaluated factors that influence the results from the HWTD. He found that there was an excellent correlation between stripping observed in laboratory tests and the moisture damage of pavements with known field performance. There was also an excellent correlation between stripping inflection point and known stripping performance.
It was found that for good pavements, the stripping inflection point was higher than 10,000 passes, and for pavements that lasted 1 year, the stripping inflection point was less than 3,000 passes. It was also found that the results from the HWTD were sensitive to aggregate properties such as dust coating on the aggregates, clay content, and high dust-to-asphalt ratios. One other finding was that as the short-term aging time increases, samples become more resistant to moisture damage. This is in agreement with other research that shows that higher mix stiffness for conventional binders generally gives better stripping results (because water
Solaimanian, Harvey, Tahmoressi, and Tandon 97
penetration will be more difficult). Aschenbrener recommended that testing temperatures for theHWTD be selected on the basis of the high temperature environment the pavement willexperience.
Although it is used in the asphalt industry primarily as a screening test for moisturesensitivity, the HWTD test has also shown promise in providing information on aggregateproperties (Solaimanian and Kennedy 2000b). In spite of its utility as a screening test, a disadvantage is that this test does not provide a fundamental property that can be used formodeling purposes. Recommended values for specific climates and traffic levels are also notavailable. The test also simulates the stripping mechanism that takes place when rainfall occursduring the hot time of the year, hence Aschenbrener’s recommendation that test temperaturesshould be selected from the hottest time of the year. This recommendation may not be applicableto locations where water primarily enters the asphalt concrete during the cooler time of the year.
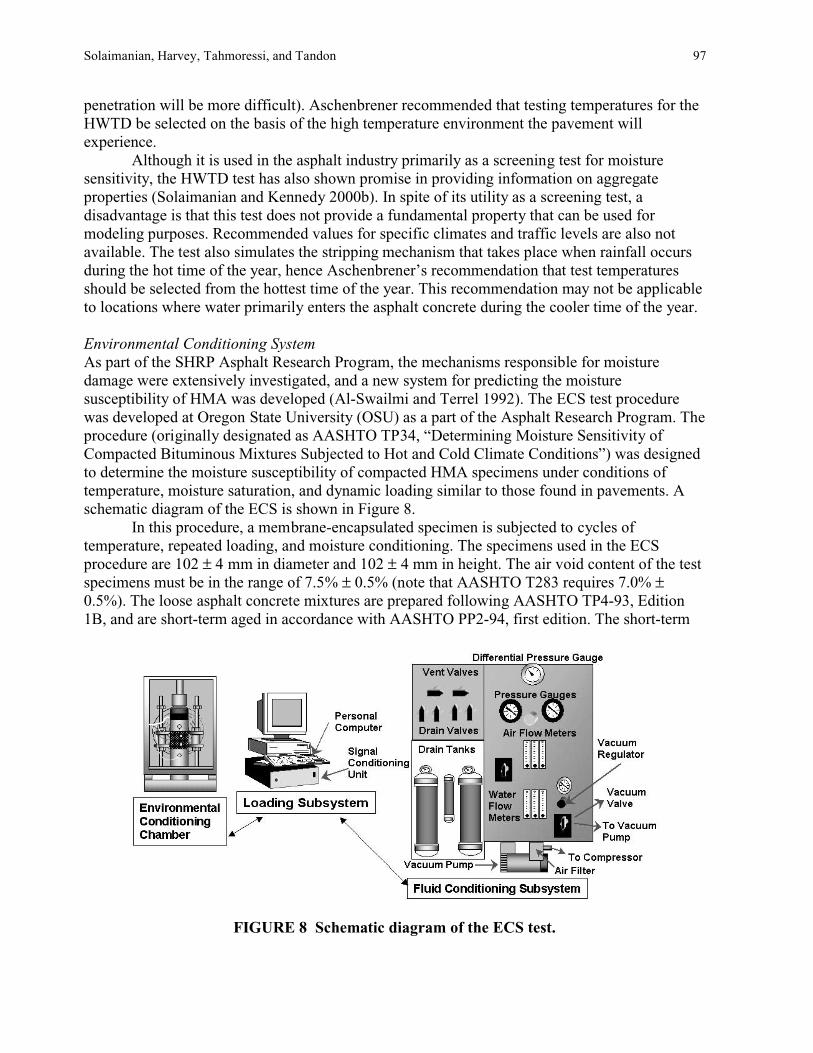
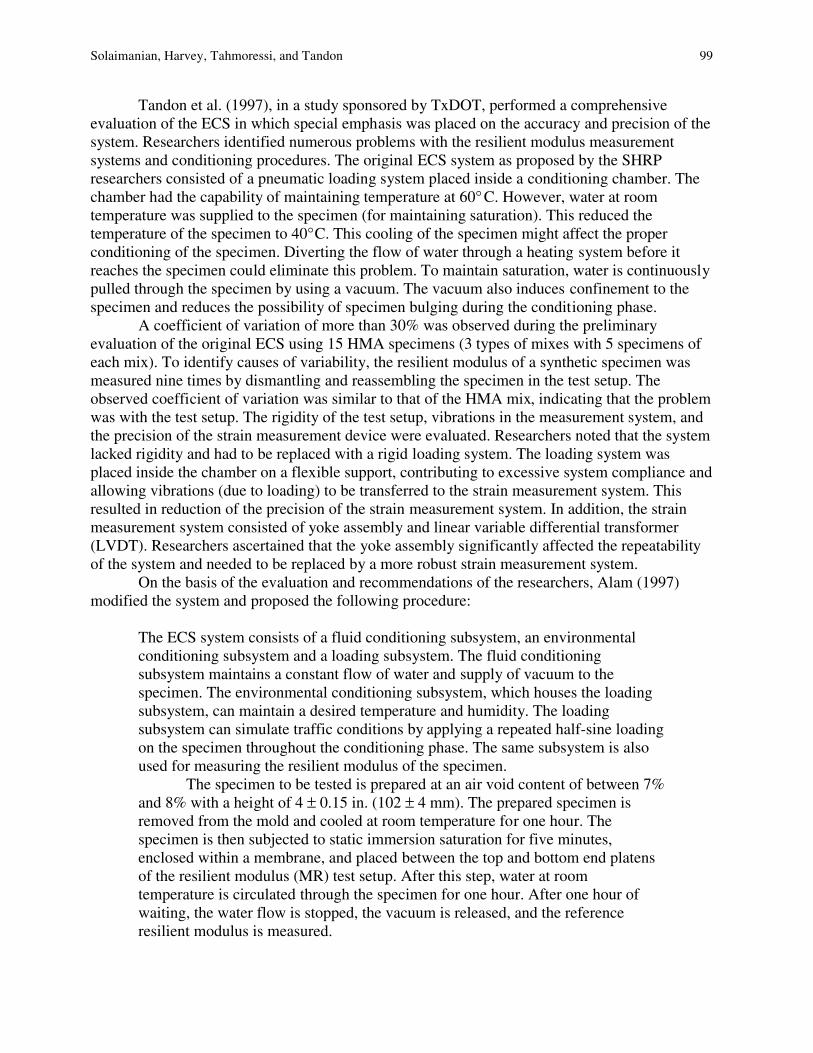
Environmental Conditioning System As part of the SHRP Asphalt Research Program, the mechanisms responsible for moisturedamage were extensively investigated, and a new system for predicting the moisturesusceptibility of HMA was developed (Al-Swailmi and Terrel 1992). The ECS test procedurewas developed at Oregon State University (OSU) as a part of the Asphalt Research Program. Theprocedure (originally designated as AASHTO TP34, “Determining Moisture Sensitivity ofCompacted Bituminous Mixtures Subjected to Hot and Cold Climate Conditions”) was designedto determine the moisture susceptibility of compacted HMA specimens under conditions oftemperature, moisture saturation, and dynamic loading similar to those found in pavements. Aschematic diagram of the ECS is shown in Figure 8.
In this procedure, a membrane-encapsulated specimen is subjected to cycles oftemperature, repeated loading, and moisture conditioning. The specimens used in the ECSprocedure are 102 ± 4 mm in diameter and 102 ± 4 mm in height. The air void content of the testspecimens must be in the range of 7.5% ± 0.5% (note that AASHTO T283 requires 7.0% ±0.5%). The loose asphalt concrete mixtures are prepared following AASHTO TP4-93, Edition1B, and are short-term aged in accordance with AASHTO PP2-94, first edition. The short-term
FIGURE 8 Schematic diagram of the ECS test.
98 Moisture Sensitivity of Asphalt Pavements: A National Seminar
aged mixtures are compacted using an SGC per AASHTO TP4-93. The compacted specimensare left at room temperature overnight to cool to room temperature. Afterwards, a latexmembrane is placed around the specimen and sealed with a silicone sealant. The specimens arethen set aside for a minimum of 15 h to dry.
The air permeability and dry resilient modulus (MR) of the specimen are determined afterit is placed inside the ECS load frame. The air permeability is determined by flowing air throughthe specimen at a vacuum level of 68 kPa. The resilient modulus is determined by applying aload in the form of a haversine wave with a loading period of 0.1 s and a rest period of 0.9 s.Pulling deaired distilled water through it at a vacuum level of 68 kPa then saturates thespecimen. In the next step, the water permeability of the specimen is determined.
The saturated specimen is subjected to a “hot cycle,” that is, the temperature of thespecimen is elevated to 60° C for 6 h while it is subjected to the haversine loading. The specimenis cooled to a temperature of 25° C for at least 2 h. At the end of the 8 h, the conditioned MR and the water permeability are determined. The process is repeated for two more cycles (i.e., 6 h ofloading and heating at 60°C followed by 2 h of cooling). If the ratio of the conditioned MR to theunconditioned MR falls below 0.7, the mixture is considered as moisture susceptible; if the ratiois greater than 0.70 the mixture is considered acceptable. Needless to say, this procedure is toolong and complicated and must be shortened and simplified before it can be adopted for routinemixture design or quality control testing.
One advantage of the ECS is that it includes the influence of traffic loading and theresulting effect of pore water pressure, a significant consideration if the mechanism that causesmoisture damage in the pavement is to be simulated.
The ECS showed promise when it was introduced to the industry. One of the mainadvantages of the system was its capability of simulating field conditions within the laboratory tosome extent. The test setup had the capability of applying load while the specimen was atelevated temperature and saturated. Lottman (1971), Majidzadeh and Brovold (1966), Andersonand Shamon (1984), Hallberg (1950), and Jimenez (1974) have suggested that one of themechanisms of stripping is the inducement of pore pressure within the air voids of HMA due totraffic and temperature loads. They proposed that pore water pressure could exceed the adhesivestrength of the binder aggregate surface and break the adhesive bonds. The researchers at OSUtried to simulate this mechanism by applying a repeated load on the specimen while the saturatedspecimen was heated. However, the visual stripping, permeability, and modulus measurementsfrom AASHTO TP34 did not provide a better relationship with field observations than what wasobtained from AASHTO T283. In addition, the test was more complex and expensive than theother tests existing at the time.
One of the first studies in which the ECS and the HWTD were evaluated includes thework conducted by Aschenbrener et al. (1994). The researchers compared the results from theECS and the HWTD for 20 pavement sites with known histories of performance with respect tomoisture damage. Performance of the sites was categorized as good, high maintenance, completerehabilitation, or disintegrator. Their conclusion was that the HWTD is a very severe test,especially for the sites with good field performance. The researchers concluded that, with somemodification, the HWTD results correlated well with field performance of the pavements forwhich the tests were conducted. With regard to the ECS, the conclusion was that the sampleswere only mildly conditioned. Only 3 of the 13 sites with poor field performance failed in thelaboratory.
Solaimanian, Harvey, Tahmoressi, and Tandon 99
Tandon et al. (1997), in a study sponsored by TxDOT, performed a comprehensiveevaluation of the ECS in which special emphasis was placed on the accuracy and precision of thesystem. Researchers identified numerous problems with the resilient modulus measurementsystems and conditioning procedures. The original ECS system as proposed by the SHRPresearchers consisted of a pneumatic loading system placed inside a conditioning chamber. Thechamber had the capability of maintaining temperature at 60° C. However, water at room temperature was supplied to the specimen (for maintaining saturation). This reduced thetemperature of the specimen to 40° C. This cooling of the specimen might affect the properconditioning of the specimen. Diverting the flow of water through a heating system before itreaches the specimen could eliminate this problem. To maintain saturation, water is continuouslypulled through the specimen by using a vacuum. The vacuum also induces confinement to thespecimen and reduces the possibility of specimen bulging during the conditioning phase.
A coefficient of variation of more than 30% was observed during the preliminaryevaluation of the original ECS using 15 HMA specimens (3 types of mixes with 5 specimens ofeach mix). To identify causes of variability, the resilient modulus of a synthetic specimen wasmeasured nine times by dismantling and reassembling the specimen in the test setup. Theobserved coefficient of variation was similar to that of the HMA mix, indicating that the problemwas with the test setup. The rigidity of the test setup, vibrations in the measurement system, andthe precision of the strain measurement device were evaluated. Researchers noted that the systemlacked rigidity and had to be replaced with a rigid loading system. The loading system wasplaced inside the chamber on a flexible support, contributing to excessive system compliance andallowing vibrations (due to loading) to be transferred to the strain measurement system. Thisresulted in reduction of the precision of the strain measurement system. In addition, the strainmeasurement system consisted of yoke assembly and linear variable differential transformer(LVDT). Researchers ascertained that the yoke assembly significantly affected the repeatabilityof the system and needed to be replaced by a more robust strain measurement system.
On the basis of the evaluation and recommendations of the researchers, Alam (1997)modified the system and proposed the following procedure:
The ECS system consists of a fluid conditioning subsystem, an environmentalconditioning subsystem and a loading subsystem. The fluid conditioningsubsystem maintains a constant flow of water and supply of vacuum to thespecimen. The environmental conditioning subsystem, which houses the loadingsubsystem, can maintain a desired temperature and humidity. The loadingsubsystem can simulate traffic conditions by applying a repeated half-sine loadingon the specimen throughout the conditioning phase. The same subsystem is alsoused for measuring the resilient modulus of the specimen.
The specimen to be tested is prepared at an air void content of between 7%and 8% with a height of 4 ± 0.15 in. (102 ± 4 mm). The prepared specimen isremoved from the mold and cooled at room temperature for one hour. Thespecimen is then subjected to static immersion saturation for five minutes,enclosed within a membrane, and placed between the top and bottom end platensof the resilient modulus (MR) test setup. After this step, water at roomtemperature is circulated through the specimen for one hour. After one hour ofwaiting, the water flow is stopped, the vacuum is released, and the referenceresilient modulus is measured.
100 Moisture Sensitivity of Asphalt Pavements: A National Seminar
The specimen is then conditioned either for six or eighteen hours. Duringthe conditioning, a flow of water at 140° F (60°° C) is maintained while a cyclic load is applied to the specimen. After six hours of conditioning, the chamber dooris opened, conditioning is stopped and the circumference of the specimen ismeasured. If the circumference of the specimen increases by more than 2%, thematerial will be considered as moisture-susceptible. At this point, the conditioningprocess is stopped, and the specimen is removed from the setup. Otherwise, thespecimen is conditioned for twelve additional hours. After the specimen is cooled,the resilient modulus of the specimen is measured again and is considered as theconditioned resilient modulus. If the MR ratio (ratio of the conditioned andunconditioned resilient moduli) falls below 0.8, the mixture will be considered asmarginal. If the MR ratio is equal to or above 0.8, the mixture will be consideredas a well-performing mix.
Tandon and Nazarian (2001) tested three different types of mixes with the ECS: wellperforming, poor performing, and marginal performing. The new test setup and protocol wereevaluated by using blind mixes (Tandon and Nazarian 2001). The predicted behavior from themodified ECS procedure matched field performance in some cases, and in other cases it did not.A postmortem study indicated that the gradation used in specimen production did not consistently match the job mix formula. New specimens were prepared as per job mix formula,and the results matched the anticipated field performance.
This validation study indicates one of the limitations of any moisture susceptibilitylaboratory test that relies on mechanical properties. Since the modulus or strength of a material isdependent on parameters such as the gradation, asphalt concrete content, and air void content,any deviation from the job mix formula during construction or laboratory testing may favorablyor unfavorably affect the moisture susceptibility of the mixture.
Flexural Fatigue Beams Test with Moisture Conditioning To evaluate the effects of moisture damage on the fatigue cracking performance of asphaltconcrete mixes, experimentation on moisture conditioning of flexural fatigue beams was done byShatnawi et al. (1995). Fatigue beams were cut from field sections that had exhibited differentlevels of moisture-related damage. Raw materials from these projects were also used to createlaboratory-compacted fatigue beams, including some with lime treatment added.
The conditioned beams were partially saturated to 60% to 80% by using a vacuum andthen subjected to three repeated 5-h cycles of 60° C followed by 4 h at 25° C while remaining submerged, and one 5-h cycle at –18° C. They were then removed from the water bath and testedfor fatigue following AASHTO TP-8. The results showed that the conditioning had a significanteffect on the initial stiffness and on the fatigue performance in the laboratory. For the laboratory-compacted specimens asphalt content and air void content were not independently controlled,and the results showed that binder contents reduced by 0.5% produced higher air void contentsunder standard compaction, which together increased the moisture susceptibility of both initialstiffness and fatigue life.
Some of the specimens obtained from the field had air void contents greater than 12%,which indicated that their moisture susceptibility in the field was highly related to constructioncompaction control. The results also showed that lime marination treatment improved theperformance of the fatigue beams. Two potential reasons for the benefits of the lime treatment
Solaimanian, Harvey, Tahmoressi, and Tandon 101
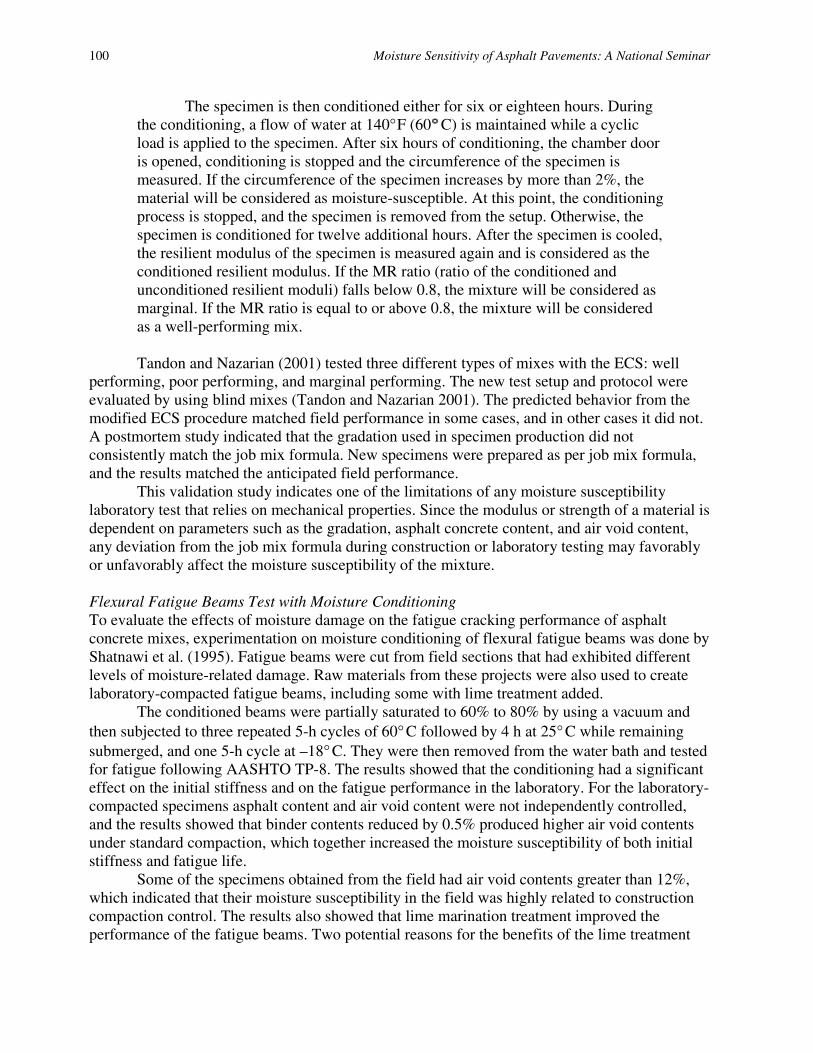
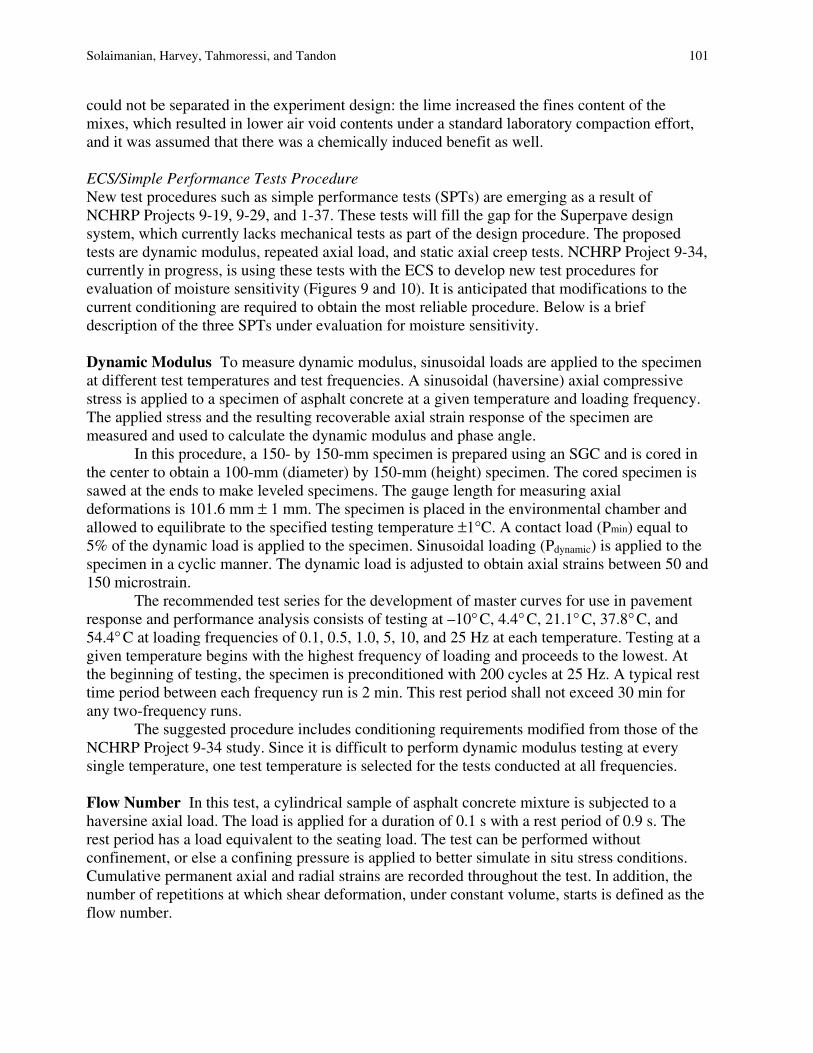
could not be separated in the experiment design: the lime increased the fines content of themixes, which resulted in lower air void contents under a standard laboratory compaction effort,and it was assumed that there was a chemically induced benefit as well. ECS/Simple Performance Tests Procedure New test procedures such as simple performance tests (SPTs) are emerging as a result ofNCHRP Projects 9-19, 9-29, and 1-37. These tests will fill the gap for the Superpave designsystem, which currently lacks mechanical tests as part of the design procedure. The proposedtests are dynamic modulus, repeated axial load, and static axial creep tests. NCHRP Project 9-34,currently in progress, is using these tests with the ECS to develop new test procedures forevaluation of moisture sensitivity (Figures 9 and 10). It is anticipated that modifications to thecurrent conditioning are required to obtain the most reliable procedure. Below is a briefdescription of the three SPTs under evaluation for moisture sensitivity. Dynamic Modulus To measure dynamic modulus, sinusoidal loads are applied to the specimenat different test temperatures and test frequencies. A sinusoidal (haversine) axial compressivestress is applied to a specimen of asphalt concrete at a given temperature and loading frequency.The applied stress and the resulting recoverable axial strain response of the specimen aremeasured and used to calculate the dynamic modulus and phase angle. In this procedure, a 150- by 150-mm specimen is prepared using an SGC and is cored inthe center to obtain a 100-mm (diameter) by 150-mm (height) specimen. The cored specimen is sawed at the ends to make leveled specimens. The gauge length for measuring axial deformations is 101.6 mm ± 1 mm. The specimen is placed in the environmental chamber andallowed to equilibrate to the specified testing temperature ±1°C. A contact load (Pmin) equal to5% of the dynamic load is applied to the specimen. Sinusoidal loading (Pdynamic) is applied to thespecimen in a cyclic manner. The dynamic load is adjusted to obtain axial strains between 50 and150 microstrain. The recommended test series for the development of master curves for use in pavementresponse and performance analysis consists of testing at –10° C, 4.4° C, 21.1° C, 37.8° C, and54.4° C at loading frequencies of 0.1, 0.5, 1.0, 5, 10, and 25 Hz at each temperature. Testing at agiven temperature begins with the highest frequency of loading and proceeds to the lowest. Atthe beginning of testing, the specimen is preconditioned with 200 cycles at 25 Hz. A typical resttime period between each frequency run is 2 min. This rest period shall not exceed 30 min forany two-frequency runs. The suggested procedure includes conditioning requirements modified from those of theNCHRP Project 9-34 study. Since it is difficult to perform dynamic modulus testing at everysingle temperature, one test temperature is selected for the tests conducted at all frequencies. Flow Number In this test, a cylindrical sample of asphalt concrete mixture is subjected to ahaversine axial load. The load is applied for a duration of 0.1 s with a rest period of 0.9 s. Therest period has a load equivalent to the seating load. The test can be performed without confinement, or else a confining pressure is applied to better simulate in situ stress conditions.Cumulative permanent axial and radial strains are recorded throughout the test. In addition, thenumber of repetitions at which shear deformation, under constant volume, starts is defined as theflow number.
102 Moisture Sensitivity of Asphalt Pavements: A National Seminar
(a) (b) FIGURE 9 Specimen setup for (a) conditioning and (b) testing.
(a) (b) FIGURE 10 (a) Testing chamber and (b) environmental
conditioning subsystem for ECS/SPT setup.
Solaimanian, Harvey, Tahmoressi, and Tandon 103
The specimen preparation, size requirements, and placement in the machine are similar tothose of the dynamic modulus test. The only difference is that radial LVDTs are also attached tothe specimen.
The recommended test protocol for the SPT for use in the Superpave volumetric mixdesign consists of testing the asphalt mix at one effective pavement temperature Teff and onedesign stress level selected by the design engineer. The effective pavement temperature Teff
covers approximately the temperature range of 25° C to 60° C. The design stress levels cover therange from 69 to 207 kPa for the unconfined tests and from 483 to 966 kPa for the confined tests.Typical confinement levels range between 35 and 207 kPa. For the NCHRP Project 9-34research, the test temperature and required stress level are selected within the range specified by the test procedure.
Flow Time In this test, a cylindrical sample of asphalt concrete mixture is subjected to a staticaxial load. The test can be performed without confinement, or a confining pressure may beapplied to better simulate in situ stress conditions. The flow time is defined as the postulatedtime when shear deformation, under constant volume, starts. The applied stress and the resultingpermanent or axial strain response of the specimen are measured and used to calculate the flowtime.
Tests Methods to Evaluate Asphalt–Aggregate Adhesion for Surface Treatments and ChipSeals Several tests are used particularly to evaluate the adhesion between aggregates and binder in achip seal or surface treatment application. The immersion tray, plate, and sand mix tests areexamples.
Immersion Tray Test In the immersion tray test, a film of binder is placed in a shallow tray and covered with water.Afterwards, aggregate chips are pressed into the surface of the binder. The chips are removedafter a specified time, and the coverage of the face in contact with binder is estimated visually.The test provides a general and rough estimate of adhesion strength between asphalt andaggregate. The rate and magnitude of pressing and pulling force can affect the results.
Plate Methods In the plate method test, a film of binder is placed on a metal plate. Wet or dry aggregate chipsare pressed or rolled into the surface. The plate may be immersed in water. The adhesion of thechips is determined by blows to the back of the plate. Chips that fall off are weighed or counted,or the chips are removed by pliers and the coating determined. The use of wet chips gives ameasure of active adhesion.
Sand Mix Method Wet sand is mixed or shaken with a solution of binder in solvent. The color and cohesion of thesand are determined. A black agglomerated sand is a positive result.
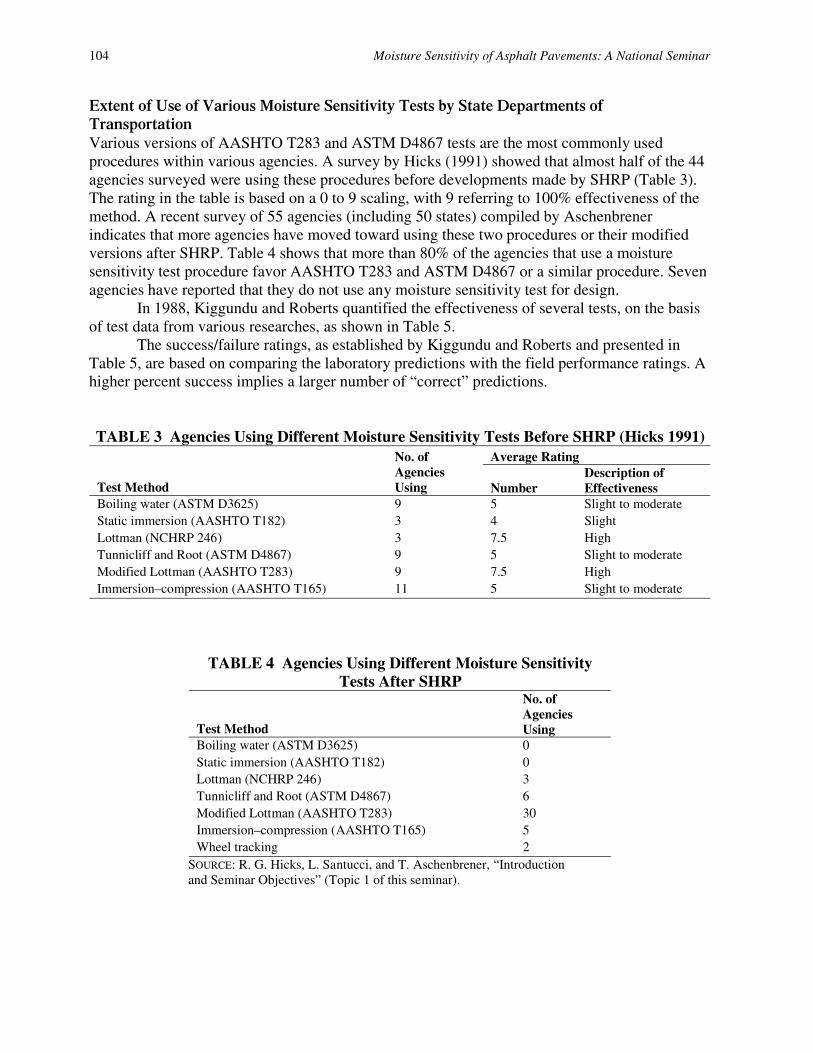
104 Moisture Sensitivity of Asphalt Pavements: A National Seminar
Extent of Use of Various Moisture Sensitivity Tests by State Departments of Transportation Various versions of AASHTO T283 and ASTM D4867 tests are the most commonly used procedures within various agencies. A survey by Hicks (1991) showed that almost half of the 44 agencies surveyed were using these procedures before developments made by SHRP (Table 3). The rating in the table is based on a 0 to 9 scaling, with 9 referring to 100% effectiveness of the method. A recent survey of 55 agencies (including 50 states) compiled by Aschenbrener indicates that more agencies have moved toward using these two procedures or their modified versions after SHRP. Table 4 shows that more than 80% of the agencies that use a moisture sensitivity test procedure favor AASHTO T283 and ASTM D4867 or a similar procedure. Seven agencies have reported that they do not use any moisture sensitivity test for design.
In 1988, Kiggundu and Roberts quantified the effectiveness of several tests, on the basis of test data from various researches, as shown in Table 5.
The success/failure ratings, as established by Kiggundu and Roberts and presented in Table 5, are based on comparing the laboratory predictions with the field performance ratings. A higher percent success implies a larger number of “correct” predictions.
TABLE 3 Agencies Using Different Moisture Sensitivity Tests Before SHRP (Hicks 1991) Average Rating
Test Method
No. of Agencies Using Number
Description of Effectiveness
Boiling water (ASTM D3625) 9 5 Slight to moderate Static immersion (AASHTO T182) 3 4 Slight Lottman (NCHRP 246) 3 7.5 High Tunnicliff and Root (ASTM D4867) 9 5 Slight to moderate Modified Lottman (AASHTO T283) 9 7.5 High Immersion–compression (AASHTO T165) 11 5 Slight to moderate
TABLE 4 Agencies Using Different Moisture Sensitivity Tests After SHRP
Test Method
No. of Agencies Using
Boiling water (ASTM D3625) 0 Static immersion (AASHTO T182) 0 Lottman (NCHRP 246) 3 Tunnicliff and Root (ASTM D4867) 6 Modified Lottman (AASHTO T283) 30 Immersion–compression (AASHTO T165) 5 Wheel tracking 2
SOURCE: R. G. Hicks, L. Santucci, and T. Aschenbrener, “Introduction and Seminar Objectives” (Topic 1 of this seminar).
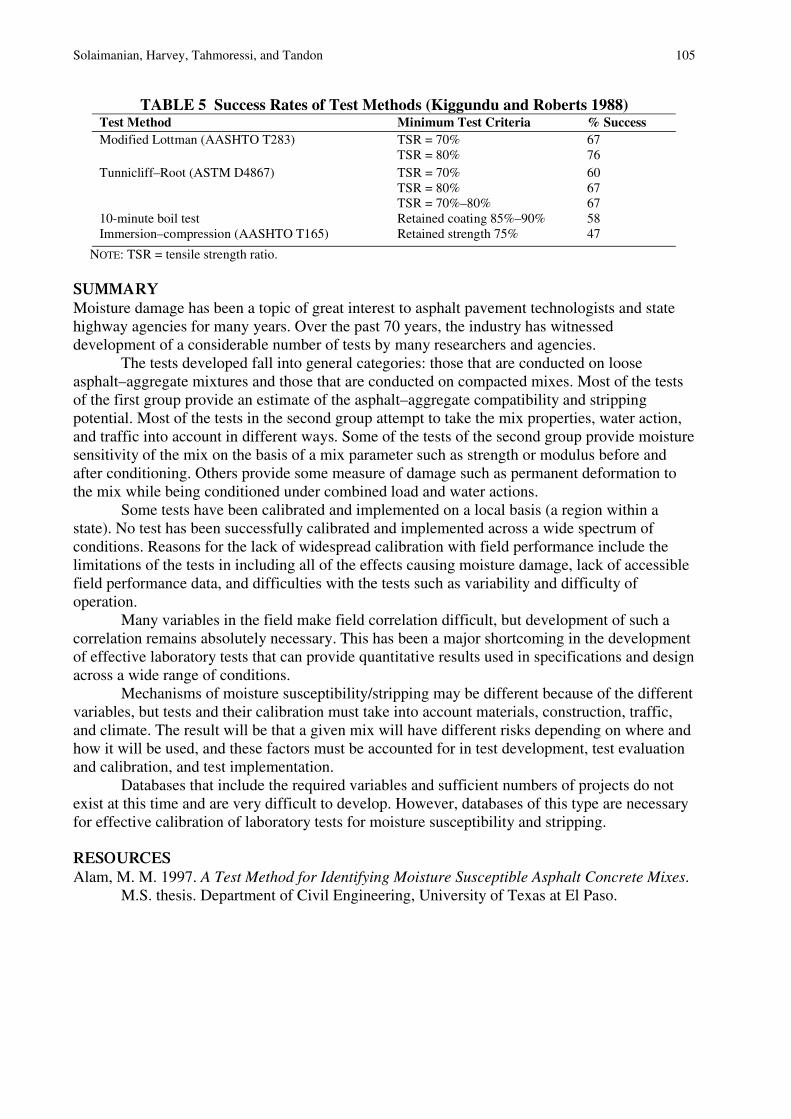
Solaimanian, Harvey, Tahmoressi, and Tandon 105
TABLE 5 Success Rates of Test Methods (Kiggundu and Roberts 1988) Test Method Minimum Test Criteria % Success Modified Lottman (AASHTO T283) TSR = 70%
TSR = 80% 67 76
Tunnicliff–Root (ASTM D4867) TSR = 70% TSR = 80% TSR = 70%–80%
60 67 67
10-minute boil test Retained coating 85%–90% 58 Immersion–compression (AASHTO T165) Retained strength 75% 47
NOTE: TSR = tensile strength ratio.
SUMMARY Moisture damage has been a topic of great interest to asphalt pavement technologists and statehighway agencies for many years. Over the past 70 years, the industry has witnesseddevelopment of a considerable number of tests by many researchers and agencies.
The tests developed fall into general categories: those that are conducted on looseasphalt–aggregate mixtures and those that are conducted on compacted mixes. Most of the testsof the first group provide an estimate of the asphalt–aggregate compatibility and strippingpotential. Most of the tests in the second group attempt to take the mix properties, water action,and traffic into account in different ways. Some of the tests of the second group provide moisturesensitivity of the mix on the basis of a mix parameter such as strength or modulus before andafter conditioning. Others provide some measure of damage such as permanent deformation tothe mix while being conditioned under combined load and water actions.
Some tests have been calibrated and implemented on a local basis (a region within astate). No test has been successfully calibrated and implemented across a wide spectrum ofconditions. Reasons for the lack of widespread calibration with field performance include thelimitations of the tests in including all of the effects causing moisture damage, lack of accessiblefield performance data, and difficulties with the tests such as variability and difficulty ofoperation.
Many variables in the field make field correlation difficult, but development of such acorrelation remains absolutely necessary. This has been a major shortcoming in the developmentof effective laboratory tests that can provide quantitative results used in specifications and designacross a wide range of conditions.
Mechanisms of moisture susceptibility/stripping may be different because of the differentvariables, but tests and their calibration must take into account materials, construction, traffic,and climate. The result will be that a given mix will have different risks depending on where andhow it will be used, and these factors must be accounted for in test development, test evaluationand calibration, and test implementation.
Databases that include the required variables and sufficient numbers of projects do notexist at this time and are very difficult to develop. However, databases of this type are necessaryfor effective calibration of laboratory tests for moisture susceptibility and stripping.
RESOURCES Alam, M. M. 1997. A Test Method for Identifying Moisture Susceptible Asphalt Concrete Mixes.
M.S. thesis. Department of Civil Engineering, University of Texas at El Paso.
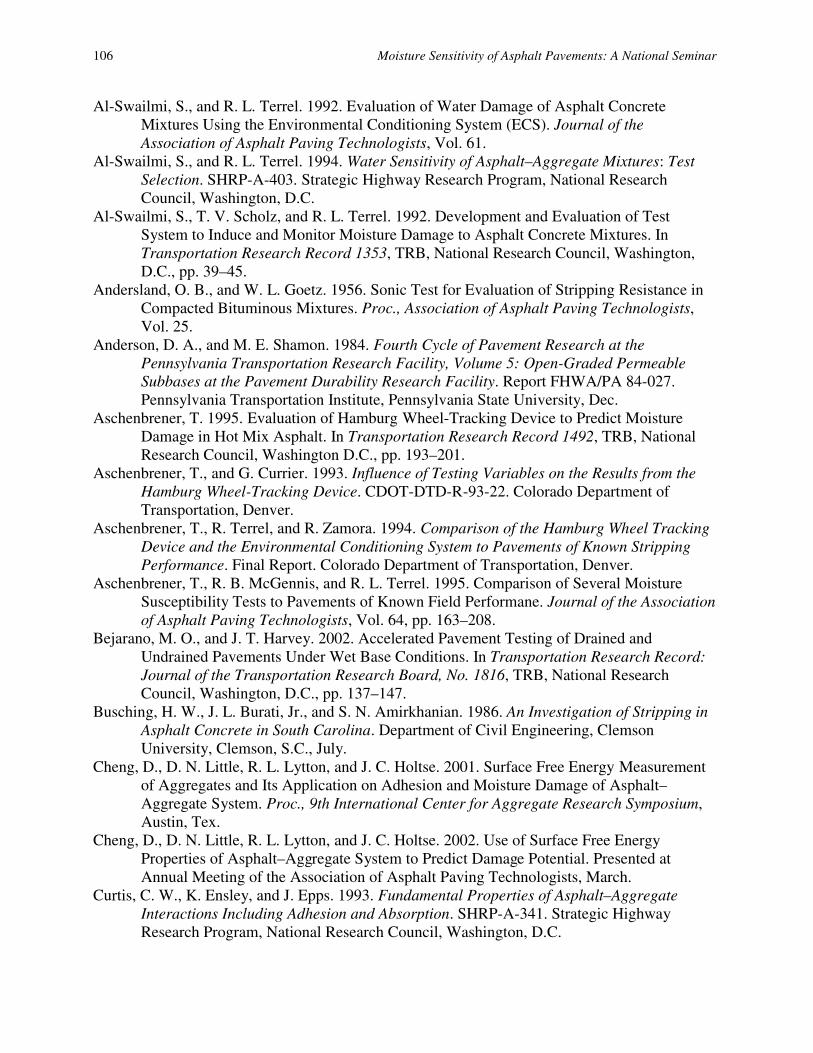
106 Moisture Sensitivity of Asphalt Pavements: A National Seminar
Al-Swailmi, S., and R. L. Terrel. 1992. Evaluation of Water Damage of Asphalt ConcreteMixtures Using the Environmental Conditioning System (ECS). Journal of theAssociation of Asphalt Paving Technologists, Vol. 61.
Al-Swailmi, S., and R. L. Terrel. 1994. Water Sensitivity of Asphalt–Aggregate Mixtures: TestSelection. SHRP-A-403. Strategic Highway Research Program, National ResearchCouncil, Washington, D.C.
Al-Swailmi, S., T. V. Scholz, and R. L. Terrel. 1992. Development and Evaluation of TestSystem to Induce and Monitor Moisture Damage to Asphalt Concrete Mixtures. InTransportation Research Record 1353, TRB, National Research Council, Washington,D.C., pp. 39–45.
Andersland, O. B., and W. L. Goetz. 1956. Sonic Test for Evaluation of Stripping Resistance inCompacted Bituminous Mixtures. Proc., Association of Asphalt Paving Technologists,Vol. 25.
Anderson, D. A., and M. E. Shamon. 1984. Fourth Cycle of Pavement Research at thePennsylvania Transportation Research Facility, Volume 5: Open-Graded PermeableSubbases at the Pavement Durability Research Facility. Report FHWA/PA 84-027.Pennsylvania Transportation Institute, Pennsylvania State University, Dec.
Aschenbrener, T. 1995. Evaluation of Hamburg Wheel-Tracking Device to Predict MoistureDamage in Hot Mix Asphalt. In Transportation Research Record 1492, TRB, NationalResearch Council, Washington D.C., pp. 193–201.
Aschenbrener, T., and G. Currier. 1993. Influence of Testing Variables on the Results from theHamburg Wheel-Tracking Device. CDOT-DTD-R-93-22. Colorado Department ofTransportation, Denver.
Aschenbrener, T., R. Terrel, and R. Zamora. 1994. Comparison of the Hamburg Wheel TrackingDevice and the Environmental Conditioning System to Pavements of Known StrippingPerformance. Final Report. Colorado Department of Transportation, Denver.
Aschenbrener, T., R. B. McGennis, and R. L. Terrel. 1995. Comparison of Several MoistureSusceptibility Tests to Pavements of Known Field Performane. Journal of the Associationof Asphalt Paving Technologists, Vol. 64, pp. 163–208.
Bejarano, M. O., and J. T. Harvey. 2002. Accelerated Pavement Testing of Drained andUndrained Pavements Under Wet Base Conditions. In Transportation Research Record:Journal of the Transportation Research Board, No. 1816, TRB, National ResearchCouncil, Washington, D.C., pp. 137–147.
Busching, H. W., J. L. Burati, Jr., and S. N. Amirkhanian. 1986. An Investigation of Stripping inAsphalt Concrete in South Carolina. Department of Civil Engineering, ClemsonUniversity, Clemson, S.C., July.
Cheng, D., D. N. Little, R. L. Lytton, and J. C. Holtse. 2001. Surface Free Energy Measurementof Aggregates and Its Application on Adhesion and Moisture Damage of Asphalt–Aggregate System. Proc., 9th International Center for Aggregate Research Symposium, Austin, Tex.
Cheng, D., D. N. Little, R. L. Lytton, and J. C. Holtse. 2002. Use of Surface Free Energy Properties of Asphalt–Aggregate System to Predict Damage Potential. Presented atAnnual Meeting of the Association of Asphalt Paving Technologists, March.
Curtis, C. W., K. Ensley, and J. Epps. 1993. Fundamental Properties of Asphalt–AggregateInteractions Including Adhesion and Absorption. SHRP-A-341. Strategic HighwayResearch Program, National Research Council, Washington, D.C.
Solaimanian, Harvey, Tahmoressi, and Tandon 107
Elphingstone, G. M. 1997. Adhesion and Cohesion in Asphalt–Aggregate Systems. Ph.D. dissertation. Texas A&M University.
Ensley, E. K., J. C. Petersen, and R. E. Robertson. 1984. Asphalt–Aggregate Bonding Energy Measurements by Microcalorimetric Methods. Thermochimica Acta, Vol. 77, p. 95.
Epps, J. A., P. E. Sebaaly, J. Penaranda, M. R. Maher, M. B. McCann, and A. J. Hand. 2000. NCHRP Report 444: Compatibility of a Test for Moisture-Induced Damage with Superpave Volumetric Mix Design. TRB, National Research Council, Washington, D.C.
Ford, M. C., Jr., P. G. Manke, and C. E. O’Bannon. 1974. Quantitative Evaluation of Stripping by the Surface Reaction Test. In Transportation Research Record 515, TRB, National Research Council, Washington, D.C., pp. 40–54.
Gharaybeh, F. A. 1987. Evaluation of Tests to Assess Stripping Potential for Asphalt Concrete Mixtures. Dissertation. Department of Civil Engineering, Auburn University, Ala., Aug.
Goode, F. F. 1959. Use of Immersion Compression Test in Evaluating and Designing Bituminous Paving Mixtures. In ASTM STP 252, pp. 113–126.
Hallberg, S. 1950. The Adhesion of Bituminous Binders and Aggregates in the Presence of Water. Statens Vaginstitut, Stockholm, Sweden.
Harvey, J., C. Monismith, and Q. Lu. 2002. Moisture Sensitivity (MS) Identification Flowchart. Draft memorandum. Prepared for Caltrans/Industry subcommittee, March.
Hicks, R. G. 1991. NCHRP Synthesis of Highway Practice 175: Moisture Damage in Asphalt Concrete. TRB, National Research Council, Washington, D.C.
Hubbard, P. 1938. Adhesion of Asphalt to Aggregate in Presence of Water. Highway Research Board Proceedings, Vol. 18, Part 1, pp. 238–249.
Hveem, F. 1943. Quality Tests for Asphalt: A Progress Report. Proc., Association of Asphalt Paving Technologists, Vol. 15, pp. 111–152.
International Slurry Seal Association. 1989. A Test Method for Determination of Methylene Blue Absorption Value (MBV) of Mineral Aggregate Fillers and Fines. ISSA Bulletin 145.
Isacsson, W., and T. Jorgensen. 1987. Laboratory Methods for Determination of the Water Susceptibility of Bituminous Pavements. VIT report, Swedish Road and Traffic Research Institute, No. 324A.
Jimenez, R. A. 1974. Testing for Debonding of Asphalt from Aggregates. In Transportation Research Record 515, TRB, National Research Council, Washington, D.C., pp. 1–17.
Johnson, D. L. 1969. Debonding of Water-Saturated Asphaltic Concrete Caused by Thermally Induced Pore Pressure. MSCE thesis. University of Idaho, Moscow.
Kandhal, P. S., C. Y. Lynn, and F. Parker. 1998. Tests for Plastic Fines in Aggregates Related to Stripping in Asphalt Paving Mixtures. Journal of the Association of Asphalt Paving Technologists, Vol. 67.
Kennedy, T. W., F. L. Roberts, and K. W. Lee. 1982. Evaluation of Moisture Susceptibility of Asphalt Mixtures Using the Texas Freeze–Thaw Pedestal Test. Proc., Association of Asphalt Paving Technologists, Vol. 51, pp. 327–341.
Kennedy, T. W., F. L. Roberts, K. W. Lee, and J. N. Anagnos. 1982. Texas Freeze–Thaw Pedestal Test for Evaluating Moisture Susceptibility for Asphalt Mixtures. Research Report 253-3. Center for Transportation Research, University of Texas at Austin, Feb.
Kennedy, T. W., F. L. Roberts, and J. N. Anagnos. 1984. Texas Boiling Test for Evaluating Moisture Susceptibility of Asphalt Mixtures. Research Report 253-5. Center for Transportation Research, University of Texas at Austin, Jan.
108 Moisture Sensitivity of Asphalt Pavements: A National Seminar Kennedy, T. W., F. L. Roberts, and K. W. Lee. 1984. Evaluating Moisture Susceptibility of
Asphalt Mixtures Using the Texas Boiling Test. In Transportation Research Record 968,TRB, National Research Council, Washington, D.C., pp. 45–54.
Kennedy, T. W., and J. N. Anagnos. 1984. Modified Test Procedure for Texas Freeze–Thaw Pedestal Test. CTR 3-O-79-253-7. University of Texas at Austin, Nov.
Kennedy, T. W., and J. N. Anagnos. 1984. Wet–Dry Indirect Tensile Test for Evaluating Moisture Susceptibility of Asphalt Mixtures. Research Report 253-8. Center for Transportation Research, University of Texas at Austin, Nov.
Kiggundu, B. M., and F. L. Roberts. 1988. Stripping in HMA Mixtures: State-of-the-Art and Critical Review of Test Methods. NCAT Report 88-2. National Center for Asphalt Technology.
Kiggundu, B. M., and F. L. Roberts. 1988. The Success/Failure of Methods Used to Predict the Stripping Potential in the Performance of Bituminous Pavement Mixtures. Submitted to TRB.
Krchma, L. C., and R. J. Loomis. 1943. Bituminous–Aggregate Water Resistance Studies. Proc., Association of Asphalt Paving Technologists, Vol. 15, pp. 153–187.
Krchma, L. C., and H. G. Nevitt. 1942. Absorption of Liquid Bituminous Cement by Aggregates. Proc., Association of Asphalt Paving Technologists, Vol. 13.
Lottman, R. P. 1971. The Moisture Mechanism That Causes Asphalt Stripping in Asphaltic Pavement Mixtures. Final Report R-47. Engineering Experimental Station, Department of Civil Engineering, University of Idaho, Moscow, Feb.
Lottman, R. P. 1978. NCHRP Report 192: Predicting Moisture-Induced Damage to Asphaltic Concrete. TRB, National Research Council, Washington, D.C.
Lottman, R. P. 1982. NCHRP Report 246: Predicting Moisture-Induced Damage to Asphaltic Concrete: Field Evaluation. TRB, National Research Council, Washington, D.C.
Lu, Q. 2003. Investigation of Conditions for Moisture Damage in Asphalt Concrete and Appropriate Laboratory Test Methods. Proposal for doctoral thesis. Department of Civil and Environmental Engineering, University of California, Berkeley.
Majidzadeh, K., and F. N. Brovold. 1966. Effect of Water on Bitumen–Aggregate Mixtures. Report CE-1. University of Florida.
Maupin, G. W., Jr. 1980. Detection of Antistripping Additives with Quick Bottle Test. Final Report. Virginia Highway and Transportation Research Council, Charlottesville, Oct.
McLeod, N. 1937. Applications of Surface Chemistry and Physics to Bituminous Mixtures. Proc., Association of Asphalt Paving Technologists, pp. 1–62.
Nicholson, V. 1932. Proc., Association of Asphalt Paving Technologists, pp. 30–31. Philips, P. S., and C. R. Marek. 1986. HMA Moisture Susceptibility Problems: The Need to Test
and Specify via a Common Procedure. Symposium presentation, ASTM, New Orleans, La., Dec.
Plancher, H., G. Miyake, R. L. Venable, and J. C. Petersen. 1980. A Simple Laboratory Test to Indicate Moisture Susceptibility of Asphalt–Aggregate Mixtures to Moisture Damage During Repeated Freeze–Thaw Cycling. Canadian Technical Asphalt Association Proceedings, Vol. 25, pp. 247–262.
Powers. 1938. Proc., Montana National Bituminous Conference, pp. 321–338. Rice, J. M. 1958. Relationship of Aggregate Characteristics to the Effect of Water on Bituminous
Paving Mixtures. Symposium on Effect of Water on Bituminous Paving Mixtures. In ASTM STP 240, pp. 17–34.
Solaimanian, Harvey, Tahmoressi, and Tandon 109
Riedel, W., and H. Weber. 1934. Asphalt und Teer. Road Research Laboratory. 1986. TMH1: Standard Methods of Testing Road Construction
Materials. Method B11: The Determination of the Adhesion of Bituminous Binder to Stone Aggregate by Means of the Chemical Immersion Test (Riedel Weber). England.
Romero, F. L., and K. D. Stuart. 1998. Evaluating Accelerated Rut Testers. Public Roads, Vol. 62, No. 1, July–Aug., pp. 50–54.
Saville, V., and E. Axon. 1937. Adhesion of Asphaltic Binders to Mineral Aggregates. Association of Asphalt Paving Technologists, Proceedings of the Technical Sessions, Dec., pp. 87–101.
Schmidt, R. J., and P. E. Graf. 1972. The Effect of Water on the Resilient Modulus of Asphalt Treated Mixes. Proc., Association of Asphalt Paving Technologists, Vol. 41, pp. 118–162.
Scholz, T. V., R. L. Terrel, A. Al-Joaib, and J. Bea. 1994. Water Sensitivity: Binder Validation. SHRP-A-402. Strategic Highway Research Program, National Research Council, Washington, D.C.
Shatnawi, S., M. Nagarajaiah, and J. Harvey. 1995. Moisture Sensitivity Evaluation of Binder–Aggregate Mixtures. In Transportation Research Record 1492, TRB, National Research Council, Washington, D.C., pp. 71–84.
Solaimanian, M., and T. W. Kennedy. 2000a. Precision of the Moisture Susceptibility Test Method Tex 531-C. Research Report 4909-1F. Center for Transportation Research, University of Texas at Austin.
Solaimanian, M., and T. W. Kennedy. 2000b. Relationship Between Aggregate Properties and Hamburg Wheel Tracking Results. Research Report 4977-1F. Center for Transportation Research, University of Texas at Austin.
Solaimanian, M., T. W. Kennedy, and W. E. Elmore. 1993. Long-Term Evaluation of Stripping and Moisture Damage in Asphalt Pavements Treated with Lime and Antistripping Agents. Texas Department of Transportation Report CTR 0-1286-1F. Center for Transportation Research, University of Texas at Austin.
Stuart, K. D. 1986. Evaluation of Procedures Used to Predict Moisture Damage in Asphalt Mixtures. FHWA/RD-86/091. Draft report, March.
Stuart, K. D., and R. P. Izzo. 1995. Correlation of Superpave G*/sin δ with Rutting Susceptibility from Laboratory Mixture Tests. In Transportation Research Record 1492, TRB, National Research Council, Washington, D.C., pp. 176–183.
Stuart, K. D., and W. S. Mogawer. 1995. Effect of Coarse Aggregate Content on Stone Matrix Asphalt Durability and Low-Temperature Cracking. In Transportation Research Record 1492, TRB, National Research Council, Washington, D.C., pp. 26–35.
Stuart, K. D., and W. S. Mogawer. 1997. Validation of Asphalt Binder and Mixture Tests That Predict Rutting Susceptibility Using the Federal Highway Administration’s Accelerated Loading Facility. Presented at 1997 Annual Meeting of the Association of Asphalt Paving Technologists, Salt Lake City, Utah.
Tandon, V., N. Vemuri, S. Nazarian, and M. Tahmoressi. 1997. A Comprehensive Evaluation of Environmental Conditioning System. Journal of the Association of Asphalt Paving Technologists, Vol. 66.
Tandon, V., and S. Nazarian. 2001. Modified Environmental Conditioning System: Validation and Optimization. Research Report TX-01/1826-1F. Center for Highway Materials Research, University of Texas at El Paso.
110 Moisture Sensitivity of Asphalt Pavements: A National Seminar Thelen, E. 1958. Surface Energy and Adhesion Properties in Asphalt–Aggregate Systems.
Bulletin 192, HRB, National Research Council, pp. 63–74. Tunnicliff, D. G., and R. Root. 1982. Antistripping Additives in Asphalt Concrete: State-of-the-
Art. Proc., Association of Asphalt Paving Technologists, Vol. 51. Tunnicliff, D. G., and R. E. Root. 1984. NCHRP Report 274: Use of Antistripping Additives in
Asphaltic Concrete Mixtures. Laboratory phase. TRB, National Research Council, Washington, D.C.
White, G. C., J. P. Mahoney, G. M. Turkiyyah, K. A. Willoughby, and E. R. Brown. 2002. Online Tools for Hot-Mix Asphalt Monitoring. In Transportation Research Record:Journal of the Transportation Research Board, No. 1813, TRB, National Research Council, Washington, D.C., pp. 124–132.
Winterkorn, H. 1937. Proc., Montana National Bituminous Conference, pp. 190–214. Winterkorn, H. 1938. Proc., Montana National Bituminous Conference, pp. 136–143. Winterkorn, H. 1939. Proc., Montana National Bituminous Conference, pp. 118–134. Winterkorn, H., G. Eckert, and E. Shipley. 1937. Testing the Adhesion Between Bitumen and
Mineral Surfaces with Alkaline Solutions. Proc., Association of Asphalt Paving Technologists, pp. 63–85.
Youtcheff, J., and V. Aurilio. 1997. Pneumatic Pull-Off Test. 42nd Canadian Technical AsphaltAssociation Proceedings.
111
TOPIC 3
Questions and Answers
MANSOUR SOLAIMANIAN
Pennsylvania State University, Speaker
Q1—John D’Angelo, Federal Highway Administration I will agree with you. I think one of the big things we have to do in any of this testing is try andsimulate what’s happening in the field. But as I went through all the testing you showed here,you always talked about making specimens in the 7% range, plus or minus. I am really abeliever that we’re not even close to what’s going on in the field. I think a lot of what we see inthe field is actually much higher air voids, and that’s a big problem in that it’s not beingrecognized yet. How can we get a lab test to correlate to the field when the lab voids aren’t evenclose to what’s going on in the field? Have you looked at all at trying to address some of theseissues, particularly about what’s really happening in the field and what level of compaction wereally have out there? I’ll let you go from there.
A—Mansour Solaimanian Thank you, John. I do agree with you. The construction air void has a major effect, and thatneeds to be looked at very closely. It’s not just a matter of stripping when you talk about the airvoid effect. It’s also considering the effect of air voids on rutting. You do your mix design, andthen you make your specimens at 7% air voids, for example, for performance testing. Then youmake your prediction of the performance of the mix and you wonder how this correlates with thefield air voids. So that is a very general question. It’s not just for stripping, it’s for rutting andfatigue and other properties that you try to simulate or predict in the laboratory. So as part of thisproject, one of the things that we plan to do is to consider the air void effects in these tests andget them to the typical acceptable levels in the field. I think most states don’t accept a mix if thedensity is under 90%. Maybe we should take the air voids to the lowest acceptable level eventhough a penalty might be applied. We should then see how the results compare in terms of yourfailure and success with a 7% or any other air void level we are currently working on. Right now,we have only been looking at a typical level of air voids that has been used in T283 and other testprocedures.
Q2—Dale Rand, Texas Department of Transportation On the slide that showed the percentage of success, can you elaborate on the criteria used on thepercentage of success? Was that an opinion or was that based on something else? It kind ofimplies that the test correlates with something.
A—Mansour Solaimanian You notice that at the bottom of the slide, I had Kiggundu and Roberts. I took the data directlyfrom their interpretation of failure and success, and I believe they looked at the mixes that hadstripped and the mixes that did not strip or were considered good. I do not know what exactlytheir criteria have been on deciding which one had been a stripping mix in the field and whichone not. They looked at the laboratory results and made a comparison against the field data.
112 Moisture Sensitivity of Asphalt Pavements: A National Seminar
They decided which ones correlated well with the stripping ones and which ones did not. This way, they came up with percentages to indicate rate of success in prediction. For example, if a material is stripped in the field, and the lab criterion is 70% on TSR while we get 60%, then we consider this a successful prediction. On the other hand, if a mix had stripped and we had a TSR of 90%, then the prediction was not successful.
Q3—Gayle King, Koch Pavement Solutions Mansour, great presentation. I find it interesting that you emphasize the methylene blue test but don’t talk about sand equivalency. My own prejudice lies in that same direction. A French sabbatical gave me a strong appreciation for the surface activity of fines, particularly as related to moisture damage in mixes. Of course methylene blue is now part of ISSA microsurfacing specifications, because fines also have a strong impact on emulsion break. Studies by Tim Aschenbrener and Ken Kandhal showed similar correlations between methylene blue and Hamburg. Although correlations weren’t perfect, Hamburg consistently failed when methylene blue was high. The entire experimental scatter fell in the region where methylene blue was low, because mixes will strip in the Hamburg for reasons other than surface-active fines. The message was clear, mixes consistently stripped when methylene blue was high. Do we get that same information from sand equivalency? Or should we replace sand equivalency with methylene blue?
A—Mansour Solaimanian I am not sure I can answer your question but I will try. I do agree with you that methylene blue is a very good test. In terms of how good the r2 was in every case, I was just reporting what I noticed from Ken’s work. I suppose the r2 values were around 70%. But again, this is just based on his data. On replacing SE with MB, I am not sure you will be capturing the same thing because when you do the methylene blue, you are doing it on –200 material in the mix, and when you do your sand equivalency, you are basically doing it on material passing the No. 4 sieve. You do have an amount of fines in your mix that you need to watch out, regardless of your testing. You might have 4% of –200 material, but you should watch out that this material might contain a lot of bad clay. You still need to look at your sand equivalency to make sure your material passing the No. 4 sieve is OK. I may not have answered your question very clearly.
Q4—Jack Van Kirk, Basic Resources, Inc. I have two questions. One is that after SHRP, you said a lot of the states switched over, and a total of 30 are now using T283. The first question is, Why did a lot of those states change over? What convinced them? The second question is, How much variability is in the parameters or the criteria they are using to run the test? Everything from voids in the specimens to saturation levels to compaction method can introduce differences between states and variability within a state.
A—Mansour Solaimanian Why so many states picked it up, you want to answer that, Gary? I don’t know. I guess because it became a part of the Superpave Design System. With regard to your second question on variability, there is variability between technicians in a given state, and between different states depending on where you are in terms of your air voids and your testing procedures. It is a big deal.
Solaimanian, Harvey, Tahmoressi, and Tandon 113
Q5—Dick Root, Root Pavement Technology, Inc. Maybe a couple of comments on the procedure itself and maybe why it was adopted indirectly. Iwas a little bit confused by a couple of your comments, so maybe you can help clear me up onthis. First of all, T283 and ASTM D4867 are the same test. One was performed or put togetherby a research team, and the other was put together by a committee, so they got a little bit deviantin the committee aspect of it. The control of air voids and saturation levels, you made anindication, or at least I perceive, that would affect the test results or maybe cause errors in it.There were several studies done during the original research and follow-up studies by Irv Dukatzat Vulcan Materials that showed that with a range of air voids at 6–8 and with the saturationlevels of 55–80, you essentially get the same results for a ratio of strengths, not individualstrength. Obviously, the PSI would be different at 6% voids than 8%, but when you start lookingat ratios, that narrowed the data down to very, very close. I think the reason for the adoption of itis simple. It can be run in the field and it was reasonably an advancement over what we wererunning previous to that, boiling water tests and emergent compression tests.
A—Mansour Solaimanian Yes, ASTM D4876 and AASHTO T283 I think are essentially the same, but if you look at theprocedures, there is a 16-hour curing in AASHTO T283 that does not exist in ASTM D4867.Other than that, you are right. Curing is very different between the two procedures. I would beinterested in seeing that data that you mentioned in terms of essentially getting the same ratio andsee how big the database or what kind of data has been used in there.
Q6—Carl Monismith, University of California, Berkeley I think that your answer why T283 was adopted is correct because many states, immediately afterthe completion of SHRP, adopted the Superpave method of mix design, and T283 is a part of themethodology. The other thing I wanted to mention is this matter of the sand equivalent andmethylene blue tests. The sand equivalent test was developed circa 1950; information regardingthe test was published by the Highway (now Transportation) Research Board by F. N. Hveem in1952. The primary purpose of the test is to eliminate the potential for detrimental clay coatingson aggregate particles, coatings that could result from improper processing of aggregatesobtained from alluvial deposits. I would argue that it would be extremely imprudent to replacethe sand equivalent test with the methylene blue test; the sand equivalent test is a very importanttest for the control of fines. If pavement technologists want to look at the nature of these fines,methylene blue is a useful additional test. As noted above, to replace one with the other would beunwise.
A—Mansour SolaimanianI agree, Carl.