test methods for mineral filler used in hma · test methods for mineral filler used in hma ahmed f....
TRANSCRIPT

NCHRP 9-45
Test Methods for Mineral Filler Used in HMA
Ahmed F. FaheemBloom Companies LLC.
Hussain U. Bahia University of Wisconsin – Madison
International Workshop on AsphaltBinders and Mastics
September 16th and 17th, 2010Madison-Wisconsin

NCHRP 9-45
Research Team – NCHRP Project 9-45• MTE
–Stacy Glidden, Gerry Reinke and Erv Dukatz
• UIUC–Imad Al Qadi
• UW-Madison–Hussain Bahia and Ahmed Faheem

NCHRP 9-45
Objectives of the Study
(1)Identify or develop test methods for mineral filler that characterize its mechanical and chemical effects on the performance of :(a) mastics and (b) hot mix asphalt (HMA)
(2) Recommend specification criteria for mineral filler that optimize HMA performance

NCHRP 9-45
Basic Concept of Study: Fillers’ Interaction with Binders(Tunnicliff in 1960)
Important Properties: Geometry & Composition
Fillers’Effects Vary
1. Filler 2. Asphalt adsorbed layer 3. Asphalt layer affected by adsorption
Gradient of stiffening

NCHRP 9-45
Fillers Collected
No. Code Filler Type1 LH1 Hard Limestone
2,3 LS1, LS2 Soft Limestone4,5 DH1, DH2 Hard Dolomite6,7 DS1, DS2 Soft Dolomite8, 9 GH1, GH2 Hard Granite10 GHB1 Hard Granite
11,12 GS1, GS2 Soft Granite13,14 BH1,BH2 Hard Basalt
15 BV1 Vesicular Basalt
16, 17 GRQ1, GRQ2 Siliceous Gravel Quartzite
18, 19 CA1, CA2 Soft Caliches20 AN1 Andesite
21, 22 FAC1, FAC2 Fly Ash Type C23 FAF1 Fly Ash Type F
24, 25 FAN1, FAN2 Fly Ash Non Spec26, 27 HL1, HL2 Hydrated Lime
28 CM1 Cement29, 30 FS1, FS2 Steel Furnace Slag
31 CBC1 Carbon Black Coarse32 CBF1 Carbon Black Fine
•Natural & Imported •Soft and Hard
• LA = 25%• Many from 2 sources

NCHRP 9-45
NCHRP 9-45
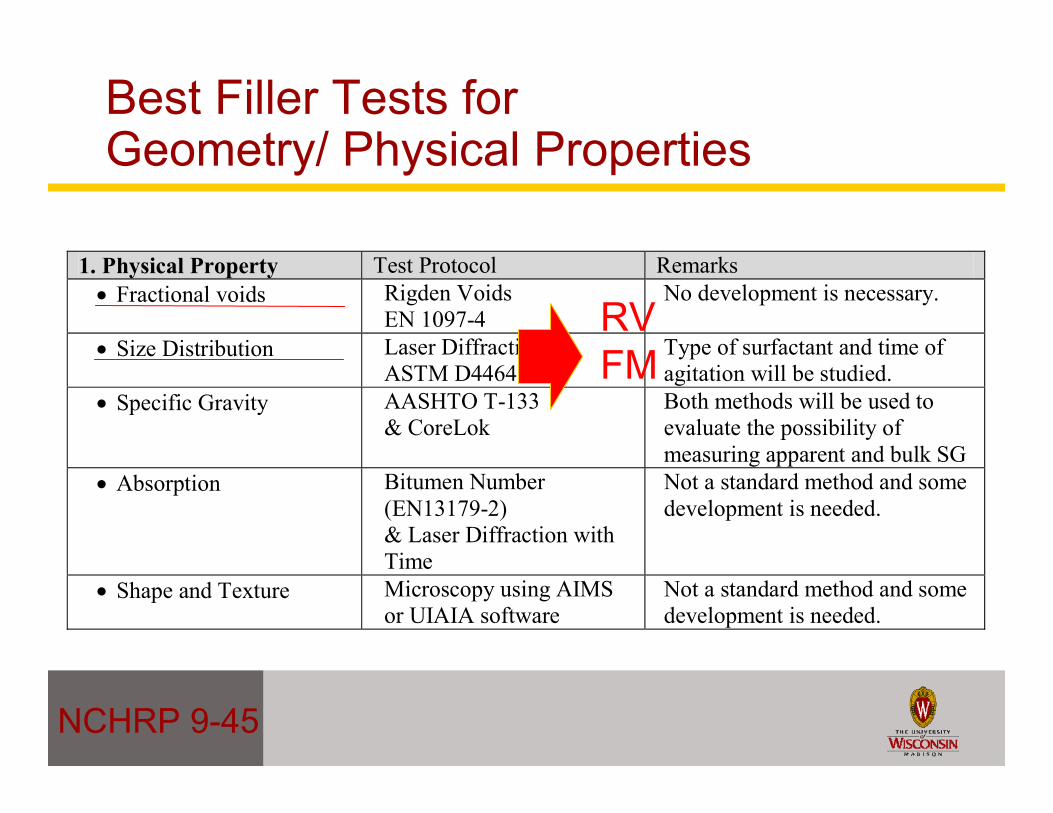
Best Filler Tests for Geometry/ Physical Properties
1. Physical Property Test Protocol Remarks Fractional voids Rigden Voids
EN 1097-4 No development is necessary.
Size Distribution Laser Diffraction ASTM D4464
Type of surfactant and time of agitation will be studied.
Specific Gravity AASHTO T-133 & CoreLok
Both methods will be used to evaluate the possibility of measuring apparent and bulk SG
Absorption Bitumen Number (EN13179-2) & Laser Diffraction with Time
Not a standard method and some development is needed.
Shape and Texture Microscopy using AIMS or UIAIA software
Not a standard method and some development is needed.
RVFM

NCHRP 9-45
Best Filler Tests for Composition/Chemical Properties
2. Chemical Property Test Protocol Remarks Calcium Compounds X-ray Fluorescence,
EN 196-21, EN 495-2 ASTM D3042 MN/DOT
Initial testing is needed to determine the appropriate test.
Water Solubility EN 1744-1:1998 No development is necessary. Methylene Blue /
Plasticity Index AASHTO TP57 AASHTO T90
Limited development for TP 57 will be needed.
Organic Content- Loss on Ignition
EN 1744-1:1998 C17, AASHTO 267-86
Need to determine testing temperature.
CaO
MBV

NCHRP 9-45
Range in Filler Properties
RV FM CaO MBV SG*
Fillers Max 49.1 6.3 50.3 31.6 2.402
Fillers Min 26.2 3.0 1.0 0.0 2.787
RV: Rigden Voids FM: Fineness ModulusCaO: Calcium Oxide MBV: Methylene Blue Value * Natural Fillers only

NCHRP 9-45
Mastic TestingWorkability:
Rutting:
Fatigue:
Low Temp:
Moisture Damage
Mastic: Viscosity - 135°C &20RPM.
Mastic: Jnr - 58°C &3.2,10kPa.
Mastic: G*.Sinδ, and Time Sweep, 25°C and 10Hz.
Mastic: S, m, at -12°C, Cracking temperature (ABCD)
Mastic: Pull Off Test, 24hr moisture conditioning at 60°C

NCHRP 9-45
Mastic Testing and Results
4 binders x 17 fillers

NCHRP 9-45
Viscosity

NCHRP 9-45
Distribution of Relative Viscosity @ 135°C
0
2
4
6
8
10
12AN1
BH1
BH2
CA2
DH1
DS2
GH1
GH2
GRQ
2
GS1
GS2
LH1
LS2
FAC2
FAF1 FS2
HL2
Relative
Viscosity
Flint Hills (Vis: 604cP) PPA (Vis: 991cP)SBS (Vis: 1326cP) Valero (Vis: 617cP)Average
Natural Manufactured

NCHRP 9-45
Effect of Filler on Mastic ViscosityMastic Viscosity = - 12891 + 148xRigden Voids
+ 25653xVolume Fraction + 4.23xBinder Viscosity
Predictor T P Constant -4.54 0.000 Rigden Voids 6.89 0.000 Volume Fraction 2.79 0.007 Binder Viscosity 10.29 0.000 S = 964.614 R-Sq = 71.7% R-Sq(adj) = 70.3%

NCHRP 9-45
Permanent Deformation
NCHRP 9-45
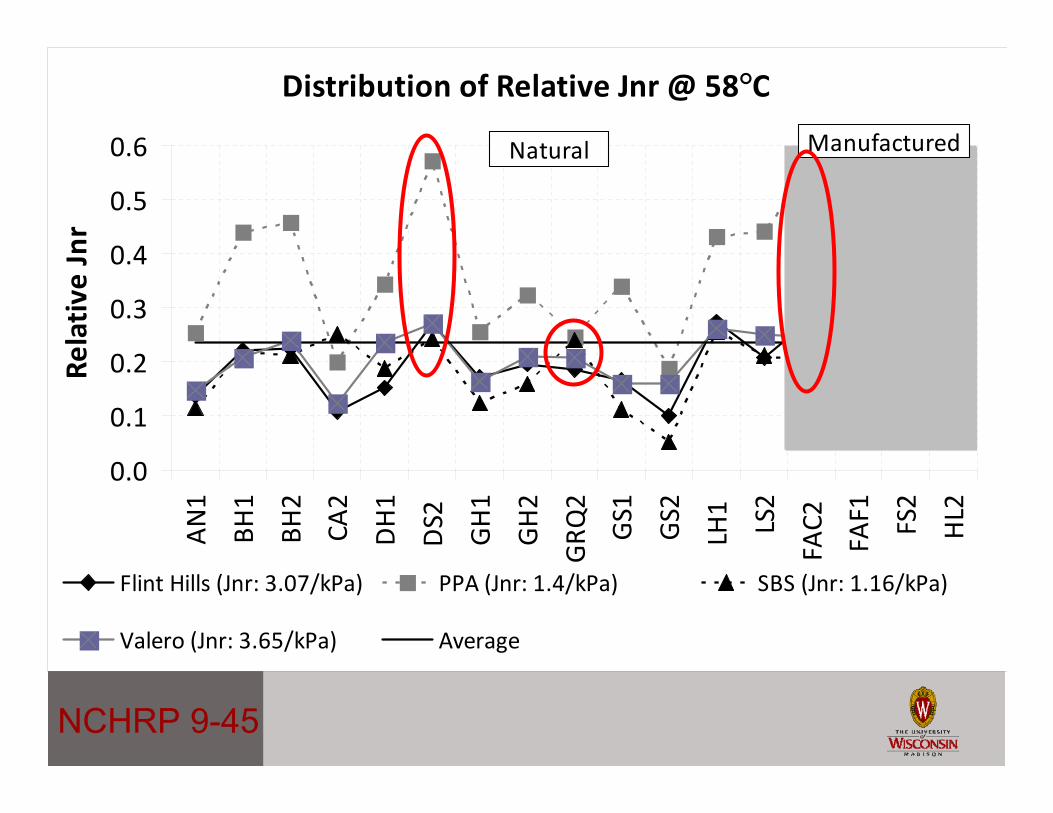
Distribution of Relative Jnr @ 58°C
0.0
0.1
0.2
0.3
0.4
0.5
0.6
AN1
BH1
BH2
CA2
DH1
DS2
GH1
GH2
GRQ
2
GS1
GS2
LH1
LS2
FAC2
FAF1 FS2
HL2
Relative
Jnr
Flint Hills (Jnr: 3.07/kPa) PPA (Jnr: 1.4/kPa) SBS (Jnr: 1.16/kPa)
Valero (Jnr: 3.65/kPa) Average
Natural Manufactured

NCHRP 9-45
Effect of Filler on Mastic Jnr
Jnr = 2.05 + 0.166 Binder Jnr - 0.0162 Rigden Voids - 4.67 Volume Fraction
Predictor T P Constant 5.38 0.000 Binder Jnr 10.71 0.000 Rigden Voids -5.97 0.000 Volume Fraction -3.84 0.000 S = 0.136097 R-Sq = 70.9% R-Sq(adj) = 69.5%

NCHRP 9-45
Mastic Fatigue Resistance

NCHRP 9-45
Distribution of Relative G*·sinδ
0.0
0.5
1.0
1.5
2.0
2.5
3.0
3.5
4.0
4.5
AN1
BH1
BH2
CA2
DH1
DS2
GH1
GH2
GRQ
2
GS1
GS2
LH1
LS2
FAC2
FAF1 FS2
HL2
Relative
G*∙sinδ
Flint Hills (G*sinD: 1409kPa) PPA (G*sinD: 973kPa)SBS (G*sinD: 875kPa) Valero (G*sinD: 1488kPa)Average
Natural Manufactured

NCHRP 9-45
Distribution of Relative Fatigue Life
0.0
0.5
1.0
1.5
2.0
2.5
AN1
BH1
BH2
CA2
DH1
DS2
GH1
GH2
GRQ
2
GS1
GS2
LH1
LS2
FAC2
FAF1 FS2
HL2
Relative
Fatigue
Life (Nf)
Flint Hills (Nf=49,139) PPA (Nf=169,595) SBS (Nf=12,328*)
Valero (Nf=46,326) Average
Natural Manufactured

NCHRP 9-45
Mastic Low Temperature Performance

NCHRP 9-45
Distribution of Relative Low Temperature Stiffness
2.0
2.5
3.0
3.5
4.0
4.5
5.0
5.5
6.0
AN1
BH1
BH2
CA2
DH1
DS2
GH1
GH2
GRQ
2
GS1
GS2
LH1
LS2
FAC2
FAF1 FS2
HL2
Relative
Stiffne
ss
Flint Hills (Stiff.: 165MPa) PPA (Stiff.: 123MPa)
SBS (Stiff.: 121MPa) Valero (Stiff.: 171MPa)
Average
Natural Manufactured
Pol Mod.Vs. Neat

NCHRP 9-45
Distribution of Relative m‐value
0.70
0.75
0.80
0.85
0.90
0.95
1.00
1.05
1.10
AN1
BH1
BH2
CA2
DH1
DS2
GH1
GH2
GRQ
2
GS1
GS2
LH1
LS2
FAC2
FAF1 FS2
HL2
Relative m‐value
Flint Hills (m‐value: 0.346) PPA (m‐value: 0.298) SBS (m‐value: 0.348)
Valero (m‐value: 0.310) Average
Natural Manufactured

NCHRP 9-45
Distribution of delta Crack Temperature
‐12
‐10
‐8
‐6
‐4
‐2
0
2
4
6
8AN1
BH1
BH2
CA2
DH1
DS2
GH1
GH2
GRQ
2
GS1
GS2
LH1
LS2
FAC2
FAF1 FS2
HL2
∆ Crack Tempe
rature
Flint Hills (Crack Temp: ‐27.9C) PPA (Crack Temp: ‐30.0C) SBS (Crack Temp: ‐31.2C)
Valero (Crack Temp: ‐27.4C) Average
Natural Manufactured

NCHRP 9-45
Mastic Moisture Damage Resistance

NCHRP 9-45
Change in Moisture Damage Ratio (Mastic ‐ Binder)
‐0.8
‐0.6
‐0.4
‐0.2
0.0
0.2
0.4
0.6
0.8
AN1
BH1
BH2
CA2
DH1
DS2
GH1
GH2
GRQ
2
GS1
GS2
LH1
LS2
FAC2
FAF1 FS2
HL2
∆ M
DR
Flint Hills (MDR=0.90) PPA (MDR=1.14) SBS (MDR=0.74)
Valero (MDR=1.14) Average
Natural Manufactured
Light PG 64-22
Heavy PG 64-22
Hyd
rate
d Li
me

NCHRP 9-45
Mixture Testing and Results

NCHRP 9-45
Mixture TestingWorkability:
Rutting:
Fatigue:
Low Temp:
Moisture Damage
Mixture: Gyrations to 92%Gmm
Mixture: Flow Number, 200kPa, 58°C
Mixture: IDT, Oscillatory load of 3.25kN , 25°C, and 10 Hz.
Mixture: Fracture Strength, -12°C
Mixture: Hamburg Wheel (discontinued)

NCHRP 9-45
Mixture Workability

NCHRP 9-45
Mixture WorkabilityDistribution of the Number of Gyrations to 92% Gmm
0.05.010.015.020.025.030.035.040.045.050.055.0
FDH1
FGH2
FGS2
FLH1
PFAC2
PGRQ
2
PGS1
PHL2
SAN1
SCA2
SDS2
SFS2
VBH2
VCA2
VGRQ
2
VGS1
Num
ber of Gyrations to
92%
Gmm
Coarse
Fine
Flint Hills + PPA PG 70‐22
Flint Hills + SBS PG 70‐22
Valero PG 64‐22
Flint HillsPG 64‐22
NCHRP 9-45
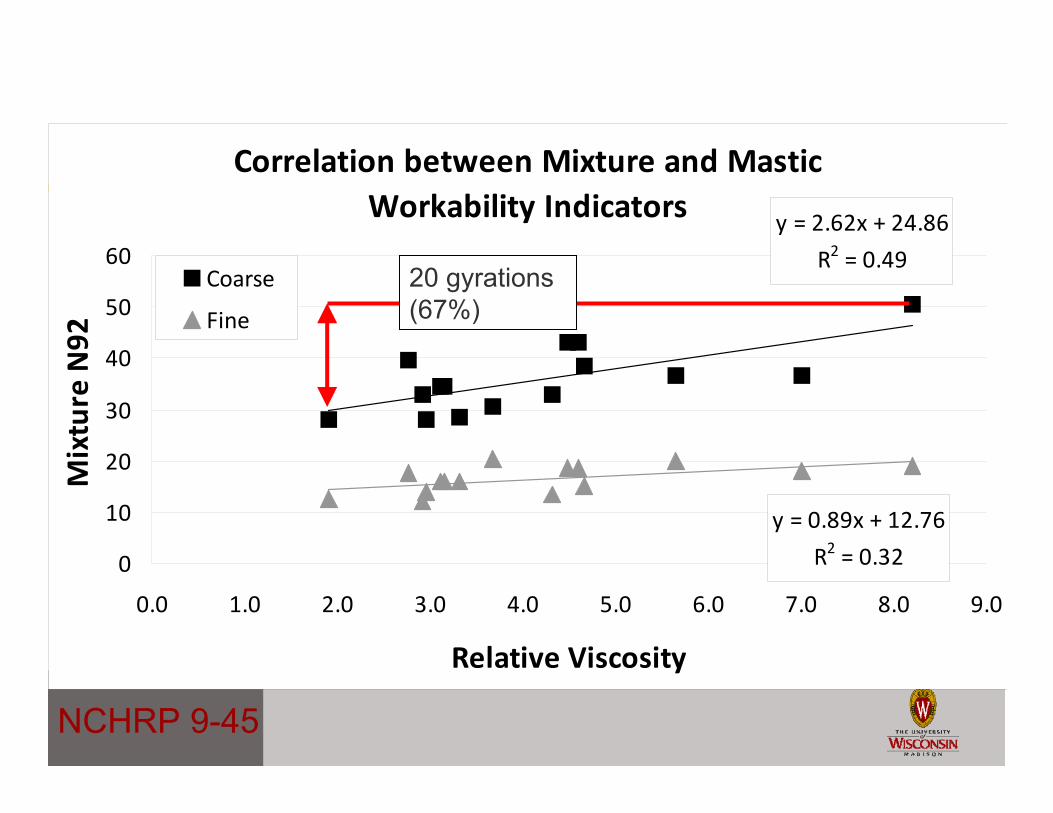
Correlation between Mixture and Mastic Workability Indicators y = 2.62x + 24.86
R2 = 0.49
y = 0.89x + 12.76
R2 = 0.320
10
20
30
40
50
60
0.0 1.0 2.0 3.0 4.0 5.0 6.0 7.0 8.0 9.0
Relative Viscosity
Mixture N92
Coarse
Fine
20 gyrations (67%)

NCHRP 9-45
Factors Affecting Mixture Workability
• Gradation is the most influential factor.• For Binders of the same grade, the source have
significant influence on the workability
Variable F-Value P-ValueGradation 454.34 0.000
Binder Source 7.39 0.009
Binder Modification 15.12 0.000
Filler Mineralogy 1.87 0.072

NCHRP 9-45
Mixture Permanent Deformation
NCHRP 9-45
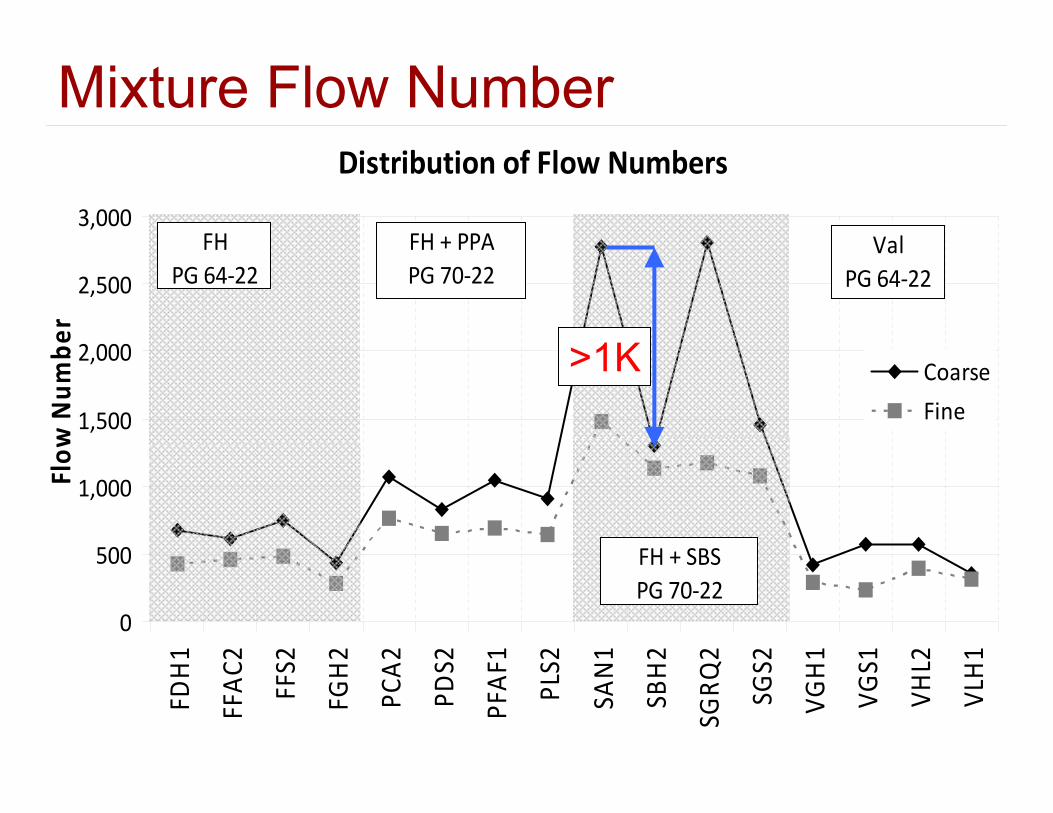
Mixture Flow NumberDistribution of Flow Numbers
0
500
1,000
1,500
2,000
2,500
3,000FD
H1
FFAC2
FFS2
FGH2
PCA2
PDS2
PFAF1
PLS2
SAN1
SBH2
SGRQ
2
SGS2
VGH1
VGS1
VHL2
VLH1
Flow
Num
ber
Coarse
Fine
FH + PPA PG 70‐22
FH + SBS PG 70‐22
ValPG 64‐22
FHPG 64‐22
>1K

NCHRP 9-45
Correlation between Mixture and Mastic Rutting Indicators
y = ‐1,037.12x + 1,379.88
R2 = 0.65
y = ‐1,064.93x + 1,218.79
R2 = 0.610
200400600800
1000120014001600
0.00 0.20 0.40 0.60 0.80 1.00 1.20
Mastic Jnr (1/Pa)
Mixture Flow Num
ber
Coarse
Fine

NCHRP 9-45
Factors Affecting Mixture Flow Number
• Binder Modification and Gradation are equally as influential.
Variable F-Value P-Value Gradation 21.9 0.000 Binder Source 0.09 0.765 Binder Modification 22.63 0.000 Filler Mineralogy 2.25 0.038
NCHRP 9-45
Other Mixture Properties
NCHRP 9-45
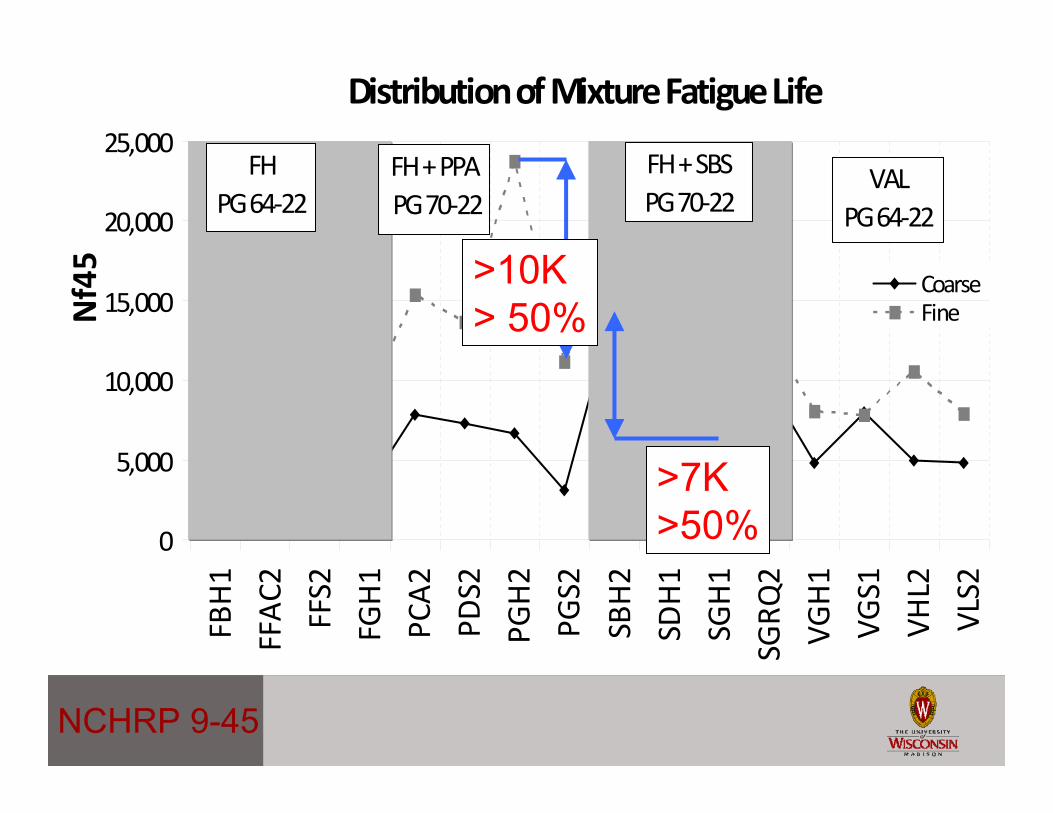
Distribution of Mixture Fatigue Life
0
5,000
10,000
15,000
20,000
25,000
FBH1
FFAC2
FFS2
FGH1
PCA2
PDS2
PGH2
PGS2
SBH2
SDH1
SGH1
SGRQ
2
VGH1
VGS1
VHL2
VLS2
Nf45
CoarseFine
FH + PPA PG 70‐22
FH + SBS PG 70‐22
VAL PG 64‐22
FHPG 64‐22
>10K> 50%
>7K>50%

NCHRP 9-45
Distribution of Mixture Low Temperature Strength
2.0
2.5
3.0
3.5
4.0
4.5
5.0
5.5
FFAC2
FGH1
FGS1
FGS2
PFS2
PGH2
PGRQ
2
PLS2
SAN1
SDS2
SGH1
SHL2
VBH2
VCA2
VGS2
VLH1
Strength (M
pa)
CoarseFine
FH + PPA PG 70‐22
FH + SBS PG 70‐22
VAL PG 64‐22
FHPG 64‐22
Sof
t Gra
nite
2
Sof
t Gra
nite
2
Sof
t Gra
nite
1

NCHRP 9-45
Summary of Other Mixture Properties
Variable F-Value P-Value Gradation 5.84 0.019 Binder Source 1.38 0.246 Binder Modification 5.08 0.010 Filler Mineralogy 1.96 0.065
Mixture Fatigue Life
Mixture Low Temperature
Variable F-Value P-Value Gradation 37.73 0.000 Binder Source 2.99 0.090 Binder Modification 9.99 0.000 Filler Mineralogy 2.05 0.067
Although filler mineralogy is significant, results could not quantify the filler/ mastic influence at this point.

NCHRP 9-45
Conclusions• Fillers show influence on all mastic and mixture
performance.• The influence of some binder modification is
highly dependent on fillers used Mix design. • Mixture workability and permanent deformation
could be predicted in terms of filler Rigden Voids and Volume Fraction.

NCHRP 9-45
Many Thanks ! • Project NCHRP 9-45 Panel.• Dr. Ed Harrigan – Project Officer• Suppliers of fillers and binders.
• Contact: –[email protected]–[email protected]

NCHRP 9-45

NCHRP 9-45

NCHRP 9-45
RIGDEN VOIDS (BS 812, EN 1097-4)

NCHRP 9-45
Distribution of Mastic Viscosity @ 135°C
0
2,000
4,000
6,000
8,000
10,000
12,000
14,000
16,000
AN1
BH1
BH2
CA2
DH1
DS2
GH1
GH2
GRQ
2
GS1
GS2
LH1
LS2
FAC2
FAF1 FS2
HL2
Viscosity (cP)
Flint Hills (Vis: 604cP) PPA (Vis: 991cP) SBS (Vis: 1326cP)
Valero (Vis: 617cP) Average
Natural Manufactured

NCHRP 9-45
Distribution of Mastic Jnr @ 58°C
0.0
0.2
0.4
0.6
0.8
1.0
1.2
AN1
BH1
BH2
CA2
DH1
DS2
GH1
GH2
GRQ
2
GS1
GS2
LH1
LS2
FAC2
FAF1 FS2
HL2
Jnr (1/kPa)
Flint Hills (Jnr: 3.07/kPa) PPA (Jnr: 1.4/kPa) SBS (Jnr: 1.16/kPa)
Valero (Jnr: 3.65/kPa) Average
Natural Manufactur
NCHRP 9-45
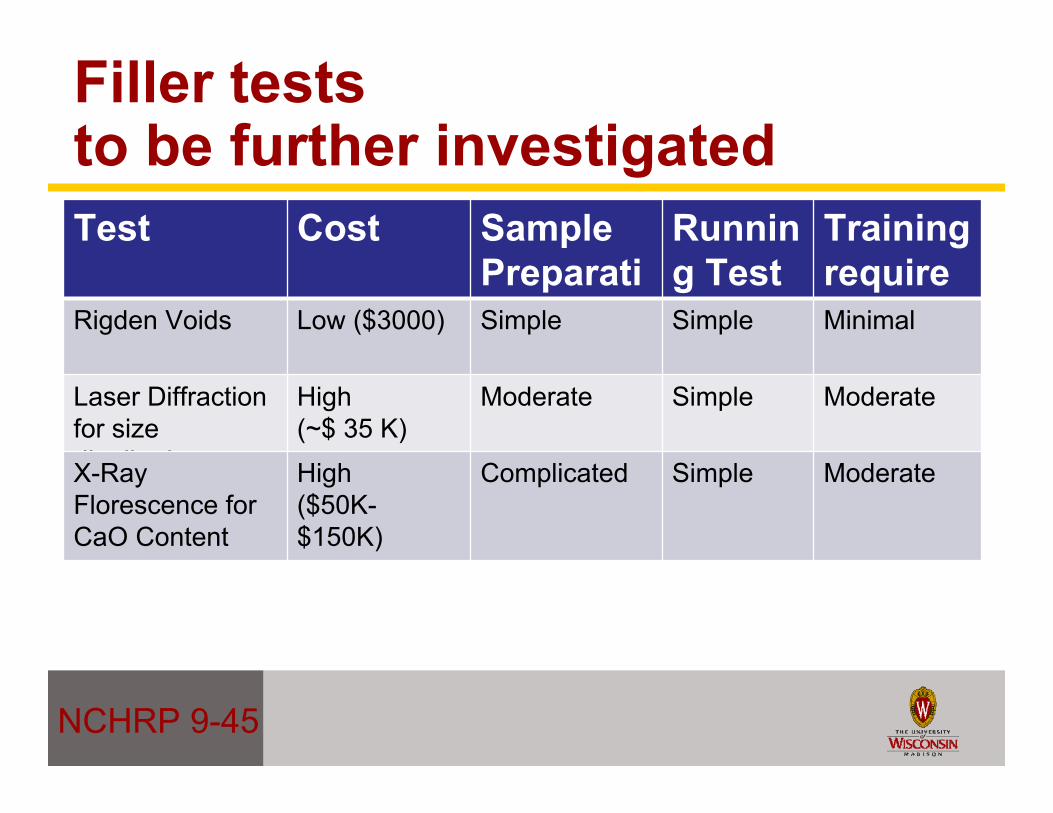
Filler tests to be further investigatedTest Cost Sample
Preparation
Running Test
Training required Rigden Voids Low ($3000) Simple Simple Minimal
Laser Diffraction for size distribution
High (~$ 35 K)
Moderate Simple Moderate
X-Ray Florescence for CaO Content
High ($50K-$150K)
Complicated Simple Moderate

NCHRP 9-45
Overall Testing Plan 1. Collect 32 fillers, 2 sources for each filler type.
2. Test the 32 fillers using filler tests. Select 16 fillers to cover High and Low values for each of 8 filler characteristics (2)^4 .
3. Mix the 16 selected fillers with 4 binders and test the resulting 64 mastics using mastic tests. Analyze results and select 16 mastics.
4. Mix 16 mastics with two aggregate gradations and test resulting HMA using HMA tests listed in Table 8.
5. Based on analysis of mastic and HMA testing, identify filler characteristics that have significant effect on HMA workability and performance.
PART 1
PART2
PART3
Selected 17
Tested 68 Mastics

NCHRP 9-45
Asphalt Binders for Producing Mastics • PG 64-22 with low asphaltenes
– (from a light crude source) • PG 64-22 with high asphaltenes
– (from a heavy crude source)• Binder (a) modified with PPA to a PG
76-22• Binder (a) modified with SBS to a PG
76-22

NCHRP 9-45
BinderBinder Viscosity
Relative Viscosity
Max 8.20Min 2.78Max 6.41Min 1.91Max 9.05Min 3.05Max 10.01Min 2.66
603.575
991.200
1326.325
616.500
FH (heavy)
FH + PPA
FH + SBS
Val (light)
Effect of Filler vs. Effect of Binder on Mastics
Widest range (7.35)
Narrowest range (4.5)

NCHRP 9-45
Effect of Filler vs. Effect of Binder on Mastics
• The relative values of the Jnr for the PPA indicate that the fillers may counter the effect of the acid modification
• Relative results are similar for the other binders
BinderBinder Jnr
Relative Jnr
Max 0.28Min 0.10Max 0.57Min 0.19Max 0.26Min 0.05Max 0.27Min 0.12
3.07
1.40
1.16
3.65
FH (Heavy)
FH + PPA
FH + SBS
Val (Light)

NCHRP 9-45
Effect of Filler vs. Effect of Binder on Mastics
Binder MasticsRelative
Fatigue LifeRelative |G*|·sinδ
Max 1.33 3.31Min 0.10 1.41Max 0.41 3.44Min 0.23 2.15Max 2.10 4.22Min 0.85 2.88Max 1.06 2.89Min 0.09 1.64
FH
FH + PPA
FH + SBS
Val
• G*sinδ increased for all mastics
• Some fillers reduce fatigue life of the mastics
• PPA relative fatigue life is consistently < 1.0
• Could not quantify the influence of fillers in terms of measured properties

NCHRP 9-45
Effect of Filler vs. Effect of Binder
Binder Range Mastic
Relative Stiffness
Mastic Relative m-Value
∆ Cracking Temp. (°C)
Min 2.93 0.79 -6.95 FH Max 4.74 0.90 4.25 Min 4.16 0.79 -3.35 FH + SBS Max 5.63 0.90 5.55 Min 3.94 0.92 -10.55 FH + PPA Max 5.61 1.06 5.15 Min 3.12 0.78 -7.15 VAL Max 5.18 0.98 -2.85
• PPA relative m-value is hovering around 1.0
• The relative values for the other binders are very similar
• Fillers improved cracking temp. for all VAL mastics
• Could not quantify the influence of fillers in terms of measured properties

NCHRP 9-45
Effect of Filler vs. Effect of Binder
Binder Mastics∆ Moisture
Damage Ratio
Max 0.58Min -0.31Max 0.14Min -0.41Max 0.37Min -0.02Max 0.16Min -0.64
Val (Light Neat)
FH (Heavy Neat)
FH + PPA
FH + SBS
• All but one SBS mastics improved the MDR.
• Val Masics show less moisture damage resistance (except for Hydrated Limemastic).
• Could not quantify the influence of fillers in terms of measured properties