test: a validation study
TRANSCRIPT

THE MEASUREMENT OF SOCIAL COMPETENCE IN
CHILDREN USING THE RORSCHACH INKBLOT
TEST: A VALIDATION STUDY
by
SANDRA ANN SOENNING, B.S.
A DISSERTATION
IN
CLINICAL PSYCHOLOGY
Submitted to the Graduate Faculty of Texas Tech University in
Partial Fulfillment of the Requirements for
the Degree of
DOCTOR OF PHILOSOPHY
Approved
James Clopton Co-Chairperson of the Committee
Gary Fireman Co-Chairperson of the Committee
Sheila Garos
Steven Richards
Accepted
John Borrelli Dean of the Graduate School
AUGUST 2005

© 2005, Sandra Ann Soenning
ii

ACKNOWLEDGEMENTS
“Miracles happen all around us; we only have to pay attention.” --Max Lucado
Completing my dissertation and graduate school has seemed like a journey, a journey in which I have encountered both obstacles but also miracles. Sometimes the miracles were unexpected and more appreciated than others might realize. I especially want to thank Dr. Jim Clopton and Dr. Gary Fireman for all their support and encouragement and for being such a positive and unforgettable influence on my training. I also want to thank Dr. Steven Richards and Dr. Sheila Garos for their hard work and for agreeing to be on my dissertation committee. Special thanks to Jennifer Rigsby, Kim Crosby, and Melissa Santos who generously helped me collect data. Finally, I am thankful for my family and friends who gave me their continued support and love throughout the journey.
iii

TABLE OF CONTENTS
ABSTRACT……………………………………………………………………………..v
LIST OF TABLES………………………………………………………………………vi
CHAPTER
1. INTRODUCTION………………………………………………………6
2. METHOD……………………………………………………………….23
3. RESULTS...……………………………………………………………..28
4. DISCUSSION...…………………………………………………………40
REFERENCES.…………………………………………………………………………52
APPENDICES
A. EXTENDED LITERATURE REVIEW
1. The Rorschach Comprehensive System Debate…………………….59
2. Development of the Human Representational Response Variable….72
3. Peer Nomination and Sociometric Status…………………………...83
B. CRITERIA FOR GOOD AND POOR HUMAN RESPONSE
VARIABLES………………………………………………………………..93
C. STEPS FOR SCORING THE GOOD AND POOR HUMAN
RESPONSE VARIABLES…………………………………………...……94
D. PEER NOMINATION QUESTIONNAIRE….....................……………….95
E. OTHER RORSHACH COMPREHENSIVE SYSTEM
VARIABLES RELEVANT TO THE CURRENT STUDY………………...97
TABLES……………………………………………………………………...………...100
iv

ABSTRACT
The use of the Rorschach Comprehensive System (CS) has been a source of much
controversy in the research literature. Proponents of the CS have called for additional
research to address difficulties that remain with Rorschach CS norms and validity. One
such CS variable that needs additional validation is the human representational variable
(HRV). The current study found some validity for the HRV among children in fourth,
fifth, and sixth grade who fall into three different sociometric groups: rejected aggressive,
rejected nonaggressive, and popular. In particular, children in the rejected aggressive
group had a greater number of poor human responses (PHR) than children in the rejected
nonaggressive group and showed a trend toward having a greater percentage of PHR than
children in the popular group. In addition, children in the popular group showed a trend
toward having a greater percentage of good human responses (GHR) than children in the
rejected aggressive group. Additional CS variables (i.e., COP, AG, S, CF, C, Afr,
isolation index, passive and active movement) that indicated some aspect of social
competence according to Exner were examined among the three groups to assess the
degree of overlap with the HRV. Children in the rejected aggressive group were found to
have more AG and more dominant color responses than children in the popular and
rejected nonaggressive groups. Additionally, children in the rejected nonaggressive
group showed a trend toward having a significantly higher isolation index than children
in the popular group.
v

LIST OF TABLES
1. Group frequencies
2. Means, standard deviations, and ANOVAs of the Rorschach variables for children tested at home or at school
3. Mean ranks and chi-squares on the Rorschach variables for
children tested at home or at school 4. Means, standard deviations, and ANOVAs of the Rorschach variables for children in the fifth and sixth grade 5. Mean ranks and chi-squares on the Rorschach variables for children in the fifth and sixth grade 6. Means, standard deviations, and ANOVAs of the Rorschach variables for the three groups of participants 7. Mean ranks and chi-squares of the Rorschach variables for the three groups of participants
vi

CHAPTER 1
INTRODUCTION
The Rorschach Inkblot Test, a projective measure of personality functioning, has
been widely used in clinical and research settings since its publication in 1921 by
Hermann Rorschach (Exner, 1993). Indeed, the Rorschach is one of the most frequently
administered psychological tests used in assessing children (Mooney & Harrison, 1987).
For instance, in Mooney and Harrison’s survey, approximately 31 percent of clinicians
used the Rorschach in assessing children in a variety of settings. Recently, critics have
called into question the use of the Rorschach and Exner’s Comprehensive System (CS) in
adult and child assessment based on lack of solid validity and reliability data for several
variables (e.g., Wood et al., 2001a; 2001b). (See Appendix E for a list of CS variables
relevant to the current study.) In 2000, Exner introduced a variable that examines the
quality of human content responses and purportedly measures the degree of an
individual’s social competence, the human representational variable (HRV). Assessing
social competence is viewed as an integral part of evaluating a person’s functioning in
various settings and of formulating treatment plans. The meaning of the HRV,
previously called the human experience variable (HEV) by Perry and Viglione (1991), is
a source of concern for Wood et al. (1999). The current CS debate and the research on
the HRV will be highlighted. Then, a validation study will be proposed to examine the
validity of the HRV with children in elementary school and address some of the
limitations of previous studies.

2
The Rorschach CS Debate
The opponents of the Rorschach CS cite several flaws with the CS, including
difficulties with norms and issues with reliability and validity (Wood & Lilienfeld, 1999;
Wood et al., 2001a; 2001b) (see Appendix A). First, the opponents of the CS challenged
the normative sample. Wood and Lilienfeld (1999) and Wood et al. (2001b) noted that
the child CS norms were collected in the 1970s to 1980s and are therefore probably not
representative of children today, especially considering the loss of children in the
normative sample of individuals who produced protocols with less than 14 responses.
Protocols of less than 14 responses were found to be invalid by Exner (Exner, 1993) and
were removed from the normative base. They concluded that the current CS norms have
probably never adequately represented the general population, including children. The
findings of the study led Wood and colleagues (2001b) to close by saying that the CS
norms should not be used in clinical or forensic settings for ethical reasons. If CS norms
continue to be used, they suggested that clinicians “forthrightly describe the limitations of
the CS norms” (p. 363).
As a result of the findings of the review on the nonpatient studies, Wood et al.
(2001b) questioned the validity of some of the research findings that were based on
comparisons to the CS norms. For example, in two studies on the Rorschach protocols of
children with a history of severe burns that used the CS norms as the comparison group
(Holaday, 1998; Holaday & Whittenberg, 1994), investigators found that a large
percentage of children with a history of burns elevated the Schizophrenia Index and
exhibited elevation on CS variables indicative of disordered thinking. According to
3
Wood et al. (2001b), these results would likely be greatly attenuated if Holaday
(Holaday, 1998; Holaday & Whittenberg, 1994) had used a nonclinical control group.
The opponents of the Rorschach CS concluded that the interrater and test-retest
reliabilities of the CS have yet to be established adequately by researchers, calling into
question whether the CS should be used at all in clinical and forensic settings. Interrater
reliability is the degree of agreement between two independent raters scoring the same
protocol. McDowell and Acklin (1996) and Wood and Lilienfeld (1999) noted that the
interrater reliability estimates reported by Exner in 1978 were inflated due to Exner’s use
of percentages to calculate the reliability estimates, which do not take into account
unequal base rates. When interclass correlation coefficients were computed for the
Rorschach CS variables (Acklin, et al., 2000), the coefficients ranged from low (i.e., less
than .20) to excellent (i.e., 1.0), indicating that the interrater reliabilities differed widely
for different variables in the CS.
With regard to test-retest reliability, Wood and Lilienfeld (1999) noted that
approximately 85 (68 percent) of the Rorschach CS variables do not have reported test-
retest reliability scores, including SCZI, DEPI, CDI, and HVI scores. Aronow,
Reznikoff, and Moreland (1995) also reported that test-retest reliabilities using the same
test form (i.e., the same stimulus cards) might also inflate estimates of test-retest
reliability due to the increased likelihood of memory effects (i.e., individuals
remembering the responses they gave from the previous test administration). Because the
Rorschach inkblot test has only one set of cards, the test-retest reliability scores for
variables that have been reported by Exner and colleagues may be overestimates.

4
Proponents of the Rorschach CS have attempted to address the criticisms by
publishing counterpoints and producing further research that corrected some of the errors
made in past studies. They have made several arguments for improving research done on
the CS. First, Acklin, McDowell, and Orndoff (1992) found that the research using the
CS was more statistically powerful than research using other systems and that overall, the
Rorschach research across all systems has similar power for small, medium, and large
effect sizes relative to research in other areas of behavioral science. To increase power,
they suggested using larger sample sizes, parametric versus nonparametric statistics, error
variance reduction, and accurate reporting of procedure and results. In addition, Viglione
(1997) set forth several guidelines to avoid potential but common pitfalls in conducting
Rorschach research. For example, he noted that researchers should be aware of the
properties of the variables being studied, use graphs to depict relationships among data,
and use descriptive statistics to justify the tests they are using. Rival hypotheses should
be ruled out, the norms are not an appropriate control group, and interrater reliability
should be accurately established. Finally, researchers should take care not to equate a
variable with a construct the variable is purported to measure.
To address the findings concerning nonpatient data collected by Shaffer, Erdberg
and Haroian (1999), Weiner (2001) cautioned against making premature conclusions that
the CS is unreliable or invalid. First, Weiner noted that the high Lambdas, indicative of
high frequency of pure form responses, could be the result of inexperienced graduate
students who are beginning to learn the skill of inquiry that can lead to other than pure
form responses. He explained the elevated X-% and WSum6 by comparing the medians
of WSum6 scores in the CS norms and in Shaffer et al.’s sample, showing that they were

5
virtually identical. Weiner suggested that the data might contain outliers or participants
who did not respond in a serious manner in the Shaffer et al. sample. He also pointed out
that the volunteers in the Shaffer et al. sample may have been more open to reporting
strange or inaccurate responses than typical because they had no reason to censor their
answers. Weiner stated that one way to prevent volunteer participants from taking the
test lightly is to emphasize the important contribution they are making to research.
Weiner (2001) then provided some guidelines for conducting future normative
research. He wrote that experienced examiners who can conduct inquiry well should
collect the normative data. The normative sample volunteers should be informed of the
serious nature of their participation and should contain a representative group of
individuals. Third, he stated that multiple normative groups with varying ranges of
psychopathology (i.e., mild to severe symptomatology) should be utilized. In fact, Exner
(2002) has begun a project to collect new normative data that is more representative of
the population.
Wood et al. (2001a, 2001b) have critiqued several areas of the Rorschach
literature, and Rorschach proponents have rebutted with a more optimistic view. For
instance, Ganellen (2001) discussed criticisms by Wood et al. (1996) of his findings
regarding the Depression Index (DEPI) (Ganellen, 1996). Ganellen reported that many of
the studies that were used by Wood et al. as evidence against the DEPI were based on the
original version of the DEPI, which did not discriminate well between depressed and
nondepressed individuals (e.g., Viglione, Brager, & Haller, 1988) while the revised DEPI
has several different variables (Exner, 1993). Ganellen (2001) agreed with Wood et al.
(1996) that more studies should be conducted on the utility of the revised DEPI but
6
stressed that current positive data should not be ignored (e.g., Archer & Krishnamurthy,
1997).
In addition to rebuttals by proponents of the Rorschach CS, Exner (1993) and
others (e.g., Gacono, Loving, & Bodholdt, 2001) have maintained that the use of the
Rorschach CS is not diagnosis and that the Rorschach CS’s purpose is not for testing but
for assessment of the individual’s personality functioning. Gacono (2000) asserted that
“assessment is a multi-faceted, ongoing, interactive process, and as such, often blends
imperceivably with treatment, staff education, and program evaluation and development.
One cannot advocate for testing and expect to achieve assessment” (pp.194-195). On the
other hand, testing is merely the administration, scoring, and interpretation of a particular
test without the integration of other information about the person. In other words, the
results of the Rorschach CS can be integrated with other sources of information on an
individual to formulate a diagnosis but also determine how he or she is functioning in the
environment with his or her specific personality structure. The Rorschach was never
intended solely to be a diagnostic tool. Thus, the validity of the Rorschach CS should not
be evaluated based solely on single variables utilized in a categorical fashion but should
be based on multiple variables across the Rorschach protocol that take into account the
multi-dimensional nature of psychiatric disorders.
To ensure proper interrater reliability, Weiner (1991) set forth a general rule for
acceptable interrater reliability procedures in Rorschach research. He stated that “at least
20 protocols in a study should be scored by two or more examiners to monitor scoring
reliability” (p.1) and must achieve a reliability rate of at least .80 on the variables relevant
to the study. In addition, in a review of 16 studies, Meyer (1997) found that the

7
Rorschach CS can be scored in a reliable fashion by multiple raters. However, with
regard to the opposing findings by Acklin et al. (2000), future research should be
conducted to determine whether the CS variables can be reliably scored by multiple
raters. Most recently, Viglione & Taylor (2003) examined 84 Rorschach protocols that
were each scored twice. The sample included 43 nonpatient children and adults, 20
battered women, and 21 adolescents and adults from clinical forensic settings. Results
indicated that for most of the variables that occurred frequently among individuals, the
interclass coefficients were above .80. They noted that variables that had lower
reliabilities in other studies with fewer participants had higher reliabilities when
examined in a large sample. The authors suggested that to examine the interrater
reliability of less frequently occurring variables, researchers should incorporate large
samples. They concluded that the Rorschach CS variables can be reliably coded when
scored by individuals who are well-trained in the CS.
With regard to test-retest reliability, several researchers have conducted studies in
which the Rorschach has been used as a treatment outcome measure and have found that
the Rorschach is useful for detecting change over time (Gerstle, 1988; Exner &
Andronikof-Sanglade, 1992; Abraham, et al., 1994). If Rorschach variables are sensitive
measures of change, they may indeed lack the temporal stability that would lead to high
test-retest reliability.
Although throwing out the use of the Rorschach CS is premature, the criticisms
should not be ignored and should be used to improve future validity and reliability studies
on Rorschach CS variables with children, adolescents, and adults. (For more extended
information on the Rorschach CS controversy, see Appendix A.)
8
The Human Experience Variable (HEV)
Two new Rorschach variables were created by Perry and Viglione (1991): good
human experience (GHE) and poor human experience (PHE) (see Appendix A and B).
The human experience variable (HEV) was calculated by subtracting the standardized
sum of GHE responses from the standardized sum of PHE responses. The authors noted
that the GHE and PHE variables represented an individual’s internalized “object
relations” (p. 490) or how a person perceives interactions with others in his or her
environment. The HEV, GHE, and PHE variables were one set of variables comprising
the Ego Impairment Index (EII), which contained variables that examined cognitive
distortion, object relations, reality testing, and defenses.
Perry and Viglione (1991) examined the level of “ego impairment” (p. 492) (i.e.,
how well an individual can manage stressors and demands both internally and externally)
with the EII in adults (17 males, 32 females) with a diagnosis of major depression,
melancholic type in an outpatient university clinic. The Rorschach and self-report
measures were administered prior to and nine weeks after treatment with one of several
tricyclic antidepressant medications. Results indicated that adults with low scores on the
EII, indicative of less ego impairment, reported significantly fewer somatic symptoms of
depression than those with high scores on the EII at nine-week follow-up. In addition,
the EII was stable over time; the mean score on the EII did not change from the first
Rorschach testing to the second. The authors concluded that the EII was measuring a
stable personality characteristic. Notably, the GHE and PHE variable accounted for most
of the variance in the EII. They were cautious in interpreting this finding and asserted
that further research to determine the meaning of the HEV should be conducted.

9
Perry, McDougall, and Viglione (1995) conducted a five-year follow-up study on
the same group of adults with major depression (n = 17) to examine the temporal stability
of the EII. The correlation between the initial HEV scores and the follow-up HEV scores
was significant (r = .57, p < .025) as was the correlation between the initial GHE scores
and follow-up GHE scores (r = .48, p < .025). However, the correlation between the
initial PHE and follow-up PHE scores was not statistically significant (r = .37, p > .025),
indicating that scores on the PHE variable were not stable over time.
A handful of other studies have examined the use of the EII in other groups. In
1992, Perry, Viglione, and Braff decided to validate the use of the EII with a group of 28
adults with schizophrenia. Seventeen were being treated in an inpatient facility while 11
were being treated in an outpatient facility or were not currently being treated. They
found that the factor structure of the EII was similar among adults with schizophrenia and
adults with major depression from the previous study. Adrian and Kaser-Boyd (1995)
examined the utility of the EII in a heterogeneous group of adults (41 males and 44
females) in outpatient and inpatient treatment. The adults were also grouped into
psychotic and non-psychotic groups. They found that although the EII did not distinguish
between psychotic and non-psychotic groups, the EII significantly distinguished inpatient
from outpatient groups with the outpatient group scoring significantly lower on the EII
than the inpatient group. Scores on the GHE variable significantly differentiated the
psychotic and non-psychotic groups with the psychotic group having a significantly
lower mean score on the GHE variable. The authors concluded that the HEV,
particularly the GHE, is particularly important in the assessment of ego functioning.

10
Building on the previous research that highlighted the strength of the HEV, Burns
and Viglione (1996) conducted a study to determine if the HEV was actually associated
with “the quality of an individual’s interpersonal relationships” among adult, female non-
patients (n = 70) (p. 92). The participants were divided into high and low interpersonal
relationship quality groups based on a composite score of self- and spouse-report
measures of attitudes toward others and actual interpersonal behaviors. Results suggested
that the HEV made a statistically significant contribution to predicting whether an
individual would belong to the high or low interpersonal relationship quality group
beyond the contributions by demographic variables, by nonhuman representational
responses, and by other Rorschach indicators of pathology (e.g., WSUM6 and X-%).
They also conducted goodness-of-fit tests to determine how well the predictors fit the
current data and found that the HEV was better at differentiating groups than the other
variables (e.g., WSUM6, nonhuman representational responses, medication stability),
indicating that the relation between HEV and quality of interpersonal relationships was
“practically meaningful” (p. 97).
Despite the seeming initial support for the validity of the HEV, GHE, and PHE,
Wood et al. (1999) expressed concern about the Burns and Viglione (1996) study. First,
they noted that one of the self-report measures used to establish two interpersonal
relatedness groups was not a statistical or face valid indicator of interpersonal
relationship quality. In addition, they stated that the authors combined self-report
questionnaires that measure different constructs to establish a score of interpersonal
relatedness, creating a variable that was “nearly impossible to interpret” (p. 118). Third,
Wood et al. said that Burns and Viglione’s two equivalent methods (i.e., z-score and
11
weighting methods) for calculating the HEV did not, in fact, produce equivalent results.
A fourth criticism of Burns and Viglione’s study was that they dropped the participants
who scored in the middle-range of interpersonal relatedness on the self- and other-report
measures in creating the groups. If the middle group was dropped and the relationship
between the HEV variable and interpersonal relatedness were nonlinear, then, the form of
the relationship could not be detected. Additionally, the size of the effects could not be
determined by dropping the participants who scored in the middle on interpersonal
relatedness. Wood et al. also pointed out that the authors did not correct for the use of
multiple predictors in their regression analyses. Finally, they criticized Burns and
Viglione’s use of logistic regression analyses with backward elimination, which “appears
to be an unusual combination of two different procedures” (Wood et al., 1999, p. 122)
that “have entirely different purposes and interpretations” (p. 121). Wood et al. re-
interpreted the results by examining the data published by Burns and Viglione and
determined that the results did not support the authors’ hypothesis that the HEV provides
a useful predictor for human relationship quality.
Although Wood and colleagues (1999) expressed concerns about the HEV, GHE,
and PHE variables, Exner (2000) introduced the GHE and PHE into the CS. He changed
the calculation of the variables, eliminating the weighting of the raw scores and altering
the variable names to good human response (GHR) and poor human response (PHR) (see
Appendix C). Exner (2003) noted that the two variables are best interpreted in terms of
their relationship to one another, rather than as a raw score difference. In addition, they
are best interpreted if a person has at least three human responses in his or her protocol.
With regard to interpretation, Exner explained that when individuals have several GHR

12
responses in their protocols, it is likely that they are “well regarded by others and their
interpersonal activities tend to be relatively free of chaos” (p. 511). Although low
numbers of responses coded GHR generally appear in protocols of individuals with
severe psychopathology, individuals with disorders that have less impact on interpersonal
relationships may have several answers coded GHR (Exner, 2000). People who give
multiple responses coded PHR tend to have “patterns of interpersonal behavior that are
ineffective or maladaptive” and “interpersonal histories that are marked by conflict
and/or failure” (Exner, 2003, p. 511). Exner explained that although responses coded
PHR may occur in low numbers among nonpatient groups, multiple PHR answers may be
found in groups with severe psychopathology. If an individual gives relatively more
GHR responses than PHR responses, Exner states, “It can be assumed that the individual
generally engages in forms of interpersonal behaviors that are likely to be adaptive for the
situation” (p. 512). On the other hand, if the individual gives more PHR responses than
GHR, “the individual is prone to engage in forms of interpersonal behaviors that are
likely to be less adaptive for the situation than might be desirable” (p. 512). (For more
information on the background and development of the human representational response,
see Appendix A.)
Current Study
The current study examined the relationship between social
competence/interpersonal relatedness as measured by sociometric status in a sample of
nonclinical, elementary school-aged children and the human representational variables,
GHR and PHR, in the Rorschach CS. Children who had a peer nomination status that
placed them in the popular, rejected aggressive, and rejected non-aggressive groups were

13
studied. If the GHR and PHR significantly differentiated the three groups, some support
for the incremental validity of the HRV would be established.
The study also addressed several of the criticisms of the Burns and Viglione
(1996) study as noted by Wood et al. (1999). First, the comparison groups were not two
extreme groups on a self-report and other-report measure. Instead, the groups were
determined using a well-established means of predicting children’s social adjustment
(Crick & Grotpeter, 1995) (see Appendix D). Research has shown children in the
different sociometric groups differ in their responses to conflict with others, in the goals
they establish and how they perceive those goals in attempting to solve the conflicts, and
how they communicate in their interactions with others (Black & Hazen, 1990; Buzzelli,
1992; Erdley & Asher, 1996; Kemple, Speranza, & Hazen, 1992; Price & Dodge, 1989).
The three groups used in the current study were popular, rejected aggressive, and rejected
non-aggressive.
Children in the popular group are children who receive a high number of positive
nominations and a small number of negative nominations from their peers in the
classroom and are perceived as social leaders by their peers (Coie, Dodge, & Coppotelli,
1982). Children in the rejected group are those who receive a small number of positive
nominations and a large number of negative nominations from their classroom peers.
The rejected group is subdivided into aggressive and non-aggressive subtypes based on
research that shows that the two groups differ in reasons for their rejection (Parkhurst &
Asher, 1992; Wentzel & Asher, 1995). Aggression level within the popular group was
not considered in the current study. Research has shown that popular children have lower
levels of aggression than average children, and rejected children have higher levels of

14
aggression than average children (Newcomb, Bukowski, & Pattee, 1993). Rejected
aggressive boys also have been shown to display significantly more disruptive and
impulsive behavior than popular boys (Cillessen et al., 1992).
In addition, extreme groups were utilized in the present study (i.e., rejected
aggressive and rejected non-aggressive). Originally, children who fell in the middle
range (i.e., the average children) were going to be used as a control group so that the
relationship between sociometric status and GHR and PHR scores could be determined
with greater accuracy, so effect sizes could be calculated, and so more practical
generalizations could be made. However, although research has shown that children with
a rejected sociometric status tend to remain rejected, they may shift over time to an
average status or neglected status, and if shifted to average status, may easily shift back
to being rejected among groups of unfamiliar children (Coie & Dodge, 1983; Coie &
Kupersmidt, 1983). In addition, Cillessen et al. (1992) wrote that “. . . considerable
numbers of children change over time from being disliked to being sociometrically
‘average’; greater changes occur, too (e.g., from being disliked to being well-liked), but
are relatively rare” (pp. 893-894). Therefore, average children may include a subset of
children who have moved in and out of rejected and average sociometric groups over
time. Average children are the children who do not meet criteria for the rejected,
neglected, popular, or controversial status groups (Coie, Dodge, & Copotelli, 1982).
Because rejected children are less likely to achieve a popular sociometric status, popular
children were chosen as the control group in the current study. Although popular
children could be considered an extreme group, they still represent children in a
community sample and were chosen to be the control group for the current study.

15
Finally, McDowell and Acklin (1996) and Wood and Lilienfeld (1999) noted that
the interrater reliability estimates reported by Exner in 1978 were inflated due to Exner’s
use of percentages to calculate the reliability estimates, which do not take into account
unequal base rates. To adequately assess interrater reliability, Weiner (1991) suggested
that two or more examiners should each score at least 20 protocols in a study to monitor
scoring reliability. Thus, two researchers in the current study re-scored 20 random
protocols to ensure that Rorschach CS coding was accurate, and the kappa statistic, which
takes into account chance agreement between coders, was used to measure interrater
reliability.
Two main hypotheses were examined. First, children with a sociometric status of
rejected aggressive and rejected non-aggressive were predicted to produce significantly
more PHR than children with a popular sociometric status. Additionally, the children
with a sociometric status of rejected aggressive and rejected non-aggressive were
expected to produce fewer GHR than children with a popular sociometric status.
Research has shown that relative to average children, children who are rejected
aggressive and children who are rejected nonaggressive tend to have difficulties with
peers and display less social competence (Parkhurst & Asher, 1992; Wentzel & Asher,
1995). Relative to average children, popular children have been found to show more
prosocial skills (e.g., helping others) (Wentzel & Asher, 1995) and have greater social
problem-solving skills, positive social actions and traits, and friendships (Newcomb,
Bukowski, & Pattee, 1993).
Four ancillary hypotheses were examined, involving other Rorschach CS
variables that have been indicated by Exner (2003) to relate to social competence.

16
Because children’s sociometric status has been found to relate to social competence in
children, there should be differences among rejected aggressive, rejected nonaggressive,
and popular groups on the Rorschach CS variables if the CS variables are measuring what
they are purported to measure. Additionally, examining CS variables similar to the HRV
is important because researchers (Exner, 1993; Gacano, 2000; Gacono, et al., 2001) have
noted that the validity of Rorschach CS variables should not be evaluated solely on the
basis of single variables but should also include variables across the Rorschach protocol
that take into account the multidimensionality of personality functioning. Lastly,
examining other CS variables outside the HRV is important to ascertain if the GHR and
PHR are the most sensitive indicators of social competence among the three groups of
children.
Given that research has shown that the rejected aggressive group tends to start
more fights and attempt to prevail over peers (Parkhurst & Asher, 1992; Wentzel &
Asher, 1995), children in the rejected aggressive group were predicted to produce more
AG and fewer COP responses than children in the popular and rejected non-aggressive
groups.
Given that children who are rejected and non-aggressive tend to be submissive
and withdrawn (Parkhurst & Asher, 1992), children in this group were expected to
produce more passive movement responses than children in the rejected aggressive and
popular groups while those in the rejected aggressive group were predicted to produce
more active movement responses than those in the rejected non-aggressive group.
Given that rejected aggressive children tend to start more fights and have more
conflicts with their peers (Parkhurst & Asher, 1992), they were expected to produce more

17
white space responses (S), more color responses with dominate color (CF and C), and
more responses to the color cards (Afr) than children in the other two groups.
Finally, because research has established that children in the rejected non-
aggressive group tend to be withdrawn, submissive, and anxious (Inderbitzen, Walters, &
Bukowski, 1997; Parkhurst & Asher, 1992), children in this group were predicted to
produce a higher mean isolation index score than children in the rejected aggressive and
popular groups.
18
CHAPTER 2
METHOD
Participants
Participants were 56 children in fourth, fifth, and sixth grade from nine
elementary schools in the Lubbock Independent School District (L.I.S.D.). For medium
effect sizes at a .05 level of significance with three groups, 52 subjects are recommended
(Cohen, 1992). All third, fourth, and fifth grade students from these schools were
administered the Peer Assessment of Relational Aggression and Other Aspects of Social
Adjustment (Crick & Grotpeter, 1995). Based on the results of this measure, the children
were classified into three groups relevant for the current study: 1) rejected aggressive, 2)
rejected non-aggressive, and 3) popular. Parents of children from each group were
mailed consent forms to participate in the current study. When parents mailed consent
forms back to the researcher, they were contacted about scheduling a time for their child
to complete the Rorschach Inkblot Test. After completion of the Rorschach, children
were paid five dollars for their participation.
Materials
Peer Assessment of Relational Aggression and Other Aspects of Social Adjustment
Sociometric status was determined using the Peer Assessment of Relational
Aggression and Other Aspects of Social Adjustment (Crick & Grotpeter, 1995) with
alterations made by Pope, Bierman, and Mumma (1991) (see Appendix D). The measure
included 20 items that require children in a given classroom to nominate three children
for each item. Using a technique by Coie, Dodge, and Coppotelli (1982), children were

19
identified as average, popular, neglected, controversial and rejected. Children in the
popular and rejected categories were included in the current study. Children in the
rejected group were further divided into aggressive and non-aggressive sub-groups using
a technique advocated by Crick and Grotpeter’s (1995) method for measuring relational
and overt aggression in children. Children who do not meet criteria for the aggressive
sub-group were placed in the rejected non-aggressive group.
The 12-month test-retest reliability of the peer nomination measure was found to
range from .55 to .70 (Fireman et al., 2002). Crick and Grotpeter (1995) found that the
Cronbach’s alpha reliability scores of the subscales used to determine the rejected
aggressive subtype ranged from .83 to .94.
Rorschach Inkblot Test (RIT)
The RIT is a measure of personality functioning and was administered and scored
using Exner’s Comprehensive System (CS) (Exner, 2003). The average interrater
reliability of variables on the Rorschach CS has been found to be .90 (Meyer et al., 2002).
Many of the variables in the Rorschach CS have been found to have test-retest
correlations of greater than .75 (Weiner, Spielberger, & Abeles, 2002). Four trained
graduate students administered the RIT. The time required to administer the Rorschach
to each child was approximately one hour. Children’s responses were recorded verbatim
by hand. For each variable relevant to the study, 20 protocols were randomly chosen and
re-coded to establish interrater reliability. The GHR/PHR variables were scored, using
the method suggested by Exner (2003) (see Appendix C). Other Rorschach CS variables
relevant to the current study are described in Appendix E.

20
Procedure
After children were classified into rejected aggressive, rejected nonaggressive,
and average groups, consent forms were mailed to all the children available from each
group. Once the parent returned the signed consent form in the mail, the parent was
contacted about arranging a time for his or her child to complete the Rorschach either at
home or school after school hours. In the meeting with the child, the examiner
administered the Rorschach according to the standardized instructions in the Rorschach
administration and scoring workbook (Exner, 1995). The child received five dollars upon
completion of any portion of the Rorschach as incentive to participate.
The Rorschach was administered by upper level graduate students who had
completed a course on the administration and scoring of the Rorschach using the CS. To
further ensure that the student administrators were competent at Rorschach administration
and coding, each graduate student practiced administering the Rorschach on a child from
the participant pool and practiced coding prior to administering the Rorschach to children
whose data were included in the current study. The primary investigator scored the
Rorschach responses according to the standardized rules for scoring found in the
Rorschach administration and scoring workbook (Exner, 1995). To assess interrater
reliability of Rorschach scoring, 20 randomly selected protocols were scored by the
primary investigator and her research advisor to ensure that the scorers achieve a
reliability coefficient of at least .80 on the variables used in the analyses as per Weiner’s
(1991) suggestion. Additionally, Cohen’s kappa coefficient to establish reliability was
used because it has been shown to control for chance agreement between coders and has
21
been recommended as a standard for calculating interrater reliability of Rorschach
variables (McDowell & Acklin, 1996).
Analyses
To determine whether children responded differently to the Rorschach at home or
at school, a series of one-way analysis of variance (ANOVAs) compared the Rorschach
variables pertinent to the current study for these two groups (home vs. school).
Additionally, to assess for developmental differences across grade levels, an ANOVA
was conducted to determine whether children in the three grade levels (fourth, fifth, and
sixth) responded differently on the Rorschach variables pertinent to the current study.
The hypotheses about the PHR and GHR variables were tested with two
ANOVAs. An ANOVA was used to examine whether the frequency of the PHR differed
among rejected aggressive, rejected nonaggressive, and popular children. Additionally,
because Exner noted that the GHR and PHR should be considered in relationship to one
another in interpretation, the number of GHR and PHR were each divided by the total
number of responses receiving an HRV code [i.e., GHR/(GHR+PHR) and
PHR/(GHR+PHR)]. By dividing the number of GHR and PHR by the total number of
human responses made in a given protocol, GHR and PHR can be examined in
relationship to one another. For instance, if an individual has 30 percent GHR in his or
her protocol, he or she has 70 percent PHR. ANOVAs were conducted to determine if
rejected-aggressive, rejected-nonaggressive, and popular children differed on the
percentage of HRV scores that are coded GHR and PHR.
Because children who were rejected and aggressive were expected to produce
more AG and fewer COP responses than the other two groups, ANOVAs were conducted

22
to examine whether the three groups differed in the mean number of AG and of COP
scores.
Because children who are rejected and nonaggressive were predicted to produce
more passive movement responses than children in the rejected nonaggressive and
popular groups, an ANOVA was used to determine if the three groups differed in the
mean number of passive movement responses. In addition, because children who were
rejected and aggressive were expected to produce more active movement responses than
children in the rejected nonaggressive group, an ANOVA was conducted to determine if
the three groups differ in the mean number of active responses.
Because the CS variables of S and C are not normally distributed, Kruskal-Wallis
chi-square tests were conducted to determine if the rejected aggressive children produced
more white space responses (S) and more responses with dominate color (CF and C).
Additional ANOVAs were conducted to determine if the rejected aggressive,
rejected nonaggressive, and popular groups differed in mean affective ratio scores (Afr)
and mean isolation index scores.

23
CHAPTER 3
RESULTS
Participants
Fifty-seven children participated in the current study. During test administration,
one child gave fewer than 14 Rorschach responses, the minimum number of responses
required to produce a valid profile. A second child was given the Rorschach twice
because he became ill during the first test administration and had to end early. He was
re-tested at a later date. Therefore, a total of 56 participants’ Rorschach profiles were
included in the current study (see Table 1; the tables are at the end of the dissertation).
Twenty-seven children were in the popular group, 20 were in the rejected nonaggressive
group, and 9 were in the rejected aggressive group. Although the original plan was to
have 20 children in each group, only 12 parents of rejected aggressive children completed
the consent forms for participation in the current study. Of those 12 potential
participants, two had disconnected phones, and one child’s parent did not return phone
calls and hung up on the researcher. Because there were only 9 children in the rejected
aggressive group, a decision was made to include additional popular children to increase
the overall number of participants in the study as well as the study’s overall power.
Within the popular group (n = 27), one was tested at home, 11 were boys and 16
were girls, 17 were in fifth grade, and 10 were in sixth grade. Within the rejected
nonaggressive group (n = 20), none were tested at home, 10 were girls and 10 were boys,
11 were in fifth grade, and nine were in sixth grade. Within the rejected aggressive group
(n = 9), three were tested at home, six were boys and three were girls, one was in fourth
grade, five were in fifth grade, and three were in sixth grade. With regard to ethnicity,
24
89.3 percent of the participants were Caucasian (n = 50), 5.4 percent were Hispanic (n =
3), and 5.4 percent were mixed (n = 3). Within the mixed group, two had an Asian and
Caucasian background, and one had a Hispanic and Caucasian background. Among the
six minority children, three were in the popular group, two were in the rejected
nonaggressive group, and one was in the rejected aggressive group.
Preliminary Analyses
Interrater Reliability
Based on Weiner’s (1991) suggestion, 20 of the Rorschach protocols were
randomly selected and scored by the primary investigator and by Gary Fireman, an
educator and researcher with several years experience with the Exner CS. The protocols
that were re-scored included 10 popular children, five rejected aggressive children, and
five rejected nonaggressive children. The interrater reliability of the study variables was
then calculated using the kappa coefficient, which takes into account any agreement
obtained by the two raters that was due to chance. The kappa statistic for the human
representation response variables (i.e., GHR, PHR) was calculated based on 102
observations and was .85 (T = 8.82, p < .001), which fell in the excellent range of
agreement (Simon, 2005). The kappa statistic for the active and passive movement
variables was based on 142 observations and was .63 (T = 9.47, p < .001), which fell in
the good range of agreement. The kappa statistic for white space variable (S) was based
on 102 observations and was .87 (T = 9.70, p < .001), which fell within the excellent
range of agreement. The kappa statistic for color variables (i.e., C, CF, FC) was based on
72 observations and was .56 (T = 5.88, p < .001), which fell within the fair range of
agreement. The kappa statistic for variables making up the isolation index (i.e., Bt, Cl,
25
Ge, Na, Ls) was also based on 72 observations and was .96 (T = 14.13, p < .001), which
fell within the excellent range of agreement. Two sets of variables, the movement and
color variables, did not meet Weiner’s (1991) suggestion that interrater reliability should
be at least .80 for study variables. However, Weiner’s suggestion was not based on the
kappa statistic, which takes into account chance agreement.
The kappa coefficient was not needed to calculate the interrater reliability of the
affective ratio variable (Afr) because the Afr is simply the total number of responses to
cards VIII, IX, and X of the Rorschach divided by the total number of responses in the
protocol. The kappa coefficient was also not calculated for the aggressive variable (AG)
because only 10 observations of AG occurred over 20 protocols. The two raters agreed
on 70 percent of the observations (7 out of 10). In addition, the kappa coefficient was not
calculated for the cooperative variable (COP) because only 14 observations of COP
occurred over 20 protocols. The two raters agreed on 85.71 percent of the observations
(12 of the 14). However, the percent agreement on AG and COP was based on a limited
number of observations and should be viewed with caution as accurate indicators of
interrater reliability.
On the 20 protocols, the two raters discussed and reached a consensus on any
differences regarding the coding of each of the study variables. The consensus coding
was used in the remainder of the analyses.
Assumptions for the ANOVA
Because several ANOVAs were planned, the dependent variables were analyzed
to determine if the normal distribution and homogeneity of variance assumptions were
met. Several of the variables violated one or both of these assumptions. The GHR

26
variable was not normally distributed in the rejected nonaggressive group. The PHR
variable was not normally distributed in the popular, rejected aggressive and rejected
nonaggressive groups, and the homogeneity of variance assumption was violated (Levene
statistic = 4.62, p < .01). The aggressive movement variable (AG) was not normally
distributed in the three groups, and the homogeneity of variance assumption was violated
(Levene statistic = 3.79, p < .05). The cooperative movement variable (COP) was not
normally distributed in the three groups. The passive movement variable was not
normally distributed in the popular and rejected nonaggressive groups, and the active
movement variable was not normally distributed in the popular and rejected
nonaggressive groups. The affective ratio variable was not normally distributed in the
popular group. The white space variable (S) was not normally distributed in the popular
and rejected aggressive groups as was expected. The pure color and dominate color/form
variable (CFC) was not normally distributed in the popular and the rejected
nonaggressive groups. The percentage of dominate color and pure color response
variable (percent CFC) was not normally distributed in the popular and rejected
nonaggressive groups.
According to the results of the attempted data transformation, not enough
statistical power was available for data transformation to be effective in readjusting the
distributions for each variable that violated the normal distribution assumption (Becker,
1999). Therefore, in addition to the ANOVAs, the Kruskal-Wallis chi-square test was
used to test the hypotheses involving the variables that violated ANOVA assumptions.

27
Location of Rorschach Administration.
To determine if children responded differently to the Rorschach depending on
whether it was administered at home or at school, a one-way ANOVA was conducted to
examine if the two groups (home versus school) differed on the Rorschach variables
pertinent to the current study. Four children were tested at home, and 52 were tested at
school. Children tested at home were found to have significantly more PHR (F = 12.34,
p < .001), S (F = 18.06, p < .001), AG (F = 9.48, p < .01), and CFC (F = 4.29, p < .05)
(see Table 2).
There were too few children tested at home to test the normal distribution
assumption for that group. Furthermore, all variables except active movement were not
normally distributed among the group of children tested at school. Therefore, the
Kruskal-Wallis chi-square was used as a nonparametric follow-up test to determine
whether the place where children were tested (home versus school) produced different
Rorschach protocols.
The results of this chi-square test were similar to those of the ANOVAs (see
Table 3). Compared to children tested at school, children tested at home were found to
have a significantly higher frequency of PHR (χ2 = 5.18, p < .05), S (χ2 = 6.04, p < .01),
and CFC (χ2 = 4.38, p < .05). There are a couple of possible explanations for these
differences. First, there were only four children who were tested at home, which could
restrict the variance within this group. Additionally, of the four children tested at home,
three were in the rejected aggressive group and only one was in the popular group.
Because of the small number of children tested at home and the disproportionate number
28
of those children who were in the rejected aggressive group, the main analyses on the
study variables were continued as planned.
Grade Level of the Participants
To determine if children responded differently to the Rorschach if they were in
different grades, a one-way ANOVA was conducted to determine whether children in
two grades (fifth and sixth) differed on the Rorschach variables pertinent to the current
study. Because only one child in the fourth grade participated in the study, his data were
not included in the analysis. The results of the one-way ANOVA indicated that children
in the fifth and sixth grade did not differ on any of the study variables, except for the
affective ratio (Afr) (F = 6.35, p < .05) (see Table 4). Children in the sixth grade had a
significantly higher Afr than children in the fifth grade.
Because the tests for normal distribution found that most of the study variables
were not normally distributed within each grade, the Kruskal-Wallis chi-square was used
as a nonparametric follow-up test to assess whether children in the fifth versus sixth
grade produced different Rorschach protocols. Children in the sixth grade had a
significantly higher Afr than children in the fifth grade (χ2 = 6.93, p < .01) (see Table 5).
The two grades did not differ in the number of participants from the rejected aggressive,
rejected nonaggressive, and popular groups (χ2 = .33, p > .05).
Tests of the Hypotheses
PHR and Percent PHR
To determine whether children in the rejected aggressive and rejected
nonaggressive groups produced more PHR than children in the popular group, a one-way
analysis of variance (ANOVA) was conducted with the number of PHR as the dependent

29
variable. Results of the ANOVA indicated that there was a significant difference in the
number of PHR produced by the three groups (F = 4.92, p < .01) (see Table 6). The
estimate of omega squared indicated that the effect size is a medium one. Because the
homogeneity of variance assumption was violated for PHR, a nonparametric test, the
Kruskal-Wallis chi-square, was also computed. Similar results were found (χ2 = 9.15, p
< .01) (See Table 7). Tukey HSD pairwise comparisons were used to determine where
the significant difference occurred among the three groups. Children in the rejected
aggressive group (M = 5.11) had significantly more PHR than children in the rejected
nonaggressive group (M = 1.70, p < .01). However, there was no significant difference
between the popular and rejected aggressive groups, or between the popular and rejected
nonaggressive groups.
A one-way ANOVA was also conducted to determine if the percentage of PHR,
the number of PHR divided by the total number of human response codes in a given
protocol, differed among the three groups. Results indicated that there was trend toward
a statistically significant difference among the three groups (F = 2.81, p < .07) (see Table
6). The estimate of omega squared indicated that the effect size is a medium one. Tukey
HSD pairwise comparisons showed a trend toward children in the rejected aggressive
group (M = .72) to have a higher percentage of PHR than children in the popular group
(M = .34, p < .07). However, there was no significant difference or trend toward
significance between the rejected aggressive and rejected nonaggressive children, or
between the popular and rejected nonaggressive children. Because the homogeneity of
variance assumption was violated for PHR, a nonparametric test, the Kruskal-Wallis chi-

30
square, was also computed using percent PHR as the dependent variable. Similar results
were found (χ2 = 5.05, p < .08) (See Table 7).
GHR and Percent GHR
To assess the hypothesis that children in the rejected aggressive and rejected
nonaggressive groups produced fewer GHR than children in the popular group, a one-
way ANOVA was conducted with the number of GHR as the dependent variable.
Results of the ANOVA revealed that children in the three groups did not differ
significantly in the number of GHR produced (F = .84, p > .05) (see Table 6). Because
the GHR variable was not normally distributed in the three groups, the Kruskal-Wallis
chi-square was used. Again, similar results were found (χ2 = 1.63, p > .05) (see Table 7).
An ANOVA was also conducted to determine if the percentage of total human
responses coded as a GHR (percent GHR) differed among the three groups. As with
percent PHR, results indicated that there was a trend toward a significant difference
among the three groups on percent GHR (F = 2.81, p < .07) (see Table 6). The estimate
of omega squared indicated that the effect size is a medium one. Tukey HSD pairwise
comparisons were used to determine where the trend occurred among the three groups.
Children in the popular group (M = .57) produced a higher percentage of GHR than
children in the rejected aggressive group (mean = .28, p < .05). There was no significant
difference between the children in the popular and rejected nonaggressive groups, or
between the children in the rejected aggressive and rejected nonaggressive groups.
Because the homogeneity of variance assumption was violated for GHR, a nonparametric
test, the Kruskal-Wallis chi-square, was also computed using percent GHR as the
dependent variable. Similar results were found (χ2 = 5.05, p < .08) (See Table 7).
31
AG and COP
A one-way ANOVA was then conducted to examine the hypothesis that children
in the rejected aggressive group produced more AG responses than children in the
popular and rejected nonaggressive groups. The ANOVA results indicated that children
in the three groups differed significantly in the number of AG responses (F = 4.40, p <
.05) (see Table 6). The estimate of omega squared indicated that the effect size is a
medium one. Because the AG variable was not normally distributed in the three groups,
the Kruskal-Wallis chi-square was used. Similar results were found with the chi-square
(χ2 = 6.54, p < .05) (see Table 7). Tukey HSD pairwise comparisons were used to
determine where the significant difference occurred among the three groups. Children in
the rejected aggressive group (M = .89) produced significantly more AG responses than
children in the popular group (M = .19, p < .05) and children in the rejected
nonaggressive group (M = .20, p < .05).
Another one-way ANOVA was completed to determine whether children in the
rejected aggressive group had fewer COP responses than children in the popular and
rejected nonaggressive group. Results of the ANOVA indicated that there was no
significant difference in the number of COP responses among the three groups (F = 1.88,
p > .05) (see Table 6). Because the ANOVA homogeneity of variance and normal
distributions assumptions were violated, the Kruskal-Wallis chi-square was also used,
and it too showed that the three groups did not differ significantly (χ2 = 2.01, p > .05)
(see Table 7).

32
Passive and Active Movement
A one-way ANOVA was then conducted to examine the hypothesis that children
in the rejected nonaggressive group would produce more passive movement responses
than children in the popular and rejected aggressive groups. Results of the ANOVA
showed that the three groups did not differ in the number of passive movement responses
produced (F = .18, p > .05) (see Table 6). Because the normal distribution assumption
was violated, the Kruskal-Wallis chi-square was used. As expected, the chi-square was
nonsignificant (χ2 = .31, p > .05) (see Table 7). Children in the rejected aggressive group
were also expected to have more active movement responses than children in the other
two groups, but a one-way ANOVA revealed that the number of active movement
responses did not differ significantly among the three groups (F = 2.23, p > .05) (see
Table 6). Because the normal distribution assumption was violated, the Kruskal-Wallis
chi-square was computed. Again, the chi-square was nonsignificant (χ2 = 3.04, p > .05)
(see Table 7).
Exner (2003) recommended examining the relationship of passive movement to
active movement responses within a Rorschach protocol, particularly the difference
between the frequency of passive movement responses and active movement responses.
Therefore, a one-way ANOVA was conducted on the number of passive movement
responses in a protocol minus the number of active movement responses to determine if
the three groups differed in the relationship of the passive and active movement variables.
The results of the ANOVA indicated the lack of a significant difference among the three
groups (F = 1.66, p > .05) (see Table 6). Because the normal distribution assumption was

33
violated on the active and passive movement variables, the Kruskal-Wallis chi-square
was used. The chi-square was nonsignificant (χ2 = 1.91, p > .05) (see Table 7).
S, CFC, and Percent CFC
Because the S, C, and FC variables are not normally distributed, the Kruskal-
Wallis chi-square was used. The hypothesis that children in the rejected aggressive group
would produce more S responses than children in the other two groups was assessed, and
the chi-square was nonsignificant (χ2 = 1.83, p > .05) (see Table 7).
A chi-square was also conducted to assess the hypothesis that children in the
rejected aggressive group would produce more dominant color responses. The results
were significant (χ2 = 9.55, p < .01), indicating a difference among the three groups on
the CFC variable (see Table 7). Additional chi-squares were conducted to determine
which groups were significantly different from one another on the CFC variable.
Children in the rejected aggressive group were found to have produced significantly more
dominant color responses than the children in the popular group (χ2 = 9.09, p < .01) and
children in the rejected nonaggressive group (χ2 = 4.14, p < .05).
The data were also analyzed using a Kruskal-Wallis chi-square to determine if
children in the popular, rejected aggressive, and rejected nonaggressive groups differed
on the percentage of pure and dominate color responses (percent CFC), which was
calculated as the frequency of pure and dominate color responses divided by the total
number of color responses in a given protocol. The results were again significant (χ2 =
11.00, p < .01), indicating a difference among the three groups (see Table 7). Additional
chi-squares were conducted to determine which groups were different on the percent CFC
variable. Children in the rejected aggressive group produced a significantly higher
34
percent CFC than children in the popular group (χ2 = 10.95, p < .001) and the rejected
nonaggressive group (χ2 = 5.84, p < .05).
Afr and Isolation Index
Exploratory one-way ANOVAs were conducted to determine if there were any
difference among the three groups on the mean affective ratio (Afr) and isolation index
scores. With regard to the Afr, no significant group differences were found when the
effects of grade were co-varied out (F = .14, p > .05) and even when the effects of grade
were not co-varied out (F = .36, p > .05) (see Table 6).
The one-way ANOVA examining the isolation index was significant (F = 3.16, p
< .05) (see Table 6). The estimate of omega squared indicated that the effect size is a
medium one. Tukey HSD pairwise comparisons were used to determine where the
significant difference occurred among the three groups. Children in the rejected
nonaggressive group (M = .27) showed a trend toward having a significantly higher
isolation index scores than children in the popular group (M = .16, p < .055). Although
the mean isolation index score for children in the rejected aggressive group (M = .26) was
similar to the mean isolation index score for children in the rejected nonaggressive group,
the children in the rejected aggressive group did not have a significantly higher isolation
index score than children in the popular group (p > .05).
35
CHAPTER 4
DISCUSSION
The purpose of the current study was to examine the relationship between social
competence as measured by sociometric status among nonclinical, elementary school-
aged children and the human representational variables (i.e., GHR and PHR) that were
recently added to the Rorschach Comprehensive system (CS; Exner, 2000). Most
research in support of the human representation variable (HRV) was conducted on the
human experience variable (HEV), an early version of the HRV, using adult participants
(e.g., Adrian & Kaser-Boyd, 1995; Burns & Viglione, 1996; Perry & Braff, 1994; Perry,
McDougall, & Viglione, 1995; Perry, Moore, & Braff, 1995; Perry &Viglione, 1991).
Only one study examined the validity of the HEV in an adult nonclinical sample (Burns
& Viglione, 1996). The current study found some support for the validity of the HRV in
a nonclinical sample of fourth, fifth, and sixth graders.
Main Hypotheses
The first hypothesis was that children with a sociometric status of rejected
aggressive or rejected non-aggressive would produce significantly greater numbers of
PHR than children with a popular sociometric status. The results of the current study
indicated that children in the rejected aggressive group gave significantly more poor
human representation responses than children in the rejected non-aggressive group.
However, no significant differences in the numbers of PHR responses were found for
other comparisons among the three groups.

36
These findings were somewhat different than expected but may be partially
explained by the sociometric literature. For instance, in a study by Erdley and Asher
(1996), children who responded aggressively to ambiguous provocation were found to
focus on punishing the provoker and on self-defense while children who respond by
withdrawing or using prosocial skills are more concerned about preserving the
relationship. Children who were nonaggressive were found to have more prosocial goals
but tended to withdraw and avoid confronting the fictional provoker, whereas children
who were more prosocial used a direct problem solving approach to preserve the
relationship with the provoker. Children who are rejected and aggressive may approach
ambiguous tasks, such as the Rorschach inkblot test, in a self-defensive and hostile
manner, which may distort the human representations they see on the blots. Because
children who are rejected and nonaggressive approach similar ambiguous tasks with basic
prosocial goals, their human representation responses may be less distorted and similar to
those of popular children.
Therefore, the finding that the rejected aggressive group had a significantly higher
frequency of PHR responses than the rejected nonaggressive group lends some support to
the validity of the PHR variable. Exner (2003) wrote, “. . . PHR responses correlate
highly with patterns of interpersonal behavior that are ineffective or maladaptive” (p.
511). Additionally, other studies have found similar results. For example, Perry and
Braff (1994) found that the human experience variable (HEV), especially the poor human
experience variable (PHE), had a significant negative relationship with information
processing tasks administered to 52 adults diagnosed with schizophrenia. The authors
noted that the HEV and PHE were likely measures of “how a subject uses internal

37
constructs to interpret. . . stimuli” (p. 366) in the environment. One such set of stimuli
could be ambiguous interpersonal situations.
The second hypothesis was that children with a sociometric status of rejected
aggressive or rejected non-aggressive would produce significantly fewer GHR responses
than children with a popular sociometric status. When frequency of GHR was examined,
no significant differences were found among the rejected aggressive, rejected non-
aggressive, and popular groups.
However, Exner (2003) recommended examining the relationship of GHR to PHR
in interpreting and studying the human representational variable. When this relationship
was taken into account by examining group difference on the percentage of poor and
good human responses, a trend was found for children in the rejected aggressive group to
have a higher percentage of PHR than children in the popular group. Similarly, a trend
was found for children in the popular group to have a higher percentage of GHR
compared with children in the rejected aggressive group. These trends complement
findings by Burns and Viglione (1996) who showed that the human experience variable
(HEV) significantly predicted whether adult nonpatient women belonged in a high or low
interpersonal quality group. At the same time, the current study also extends Burns and
Viglione’s work by utilizing Exner’s (2000) revised version of the HEV and addressing
several concerns expressed by Wood et al. (1999). For example, the study was conducted
on a community sample using groups determined using a well-established means of
predicting children’s social adjustment (Crick & Grotpeter, 1995). Thus, the current
study establishes some validity for the utility of the human representation variable as a
measure of social adjustment and competence.
38
The third hypothesis was that children in the rejected aggressive group would give
more aggressive (AG) and fewer cooperative (COP) responses than children in the
popular or rejected nonaggressive groups. This hypothesis was partially supported by the
results because children in the rejected aggressive group produced more AG responses
than children in the popular group and children in the rejected nonaggressive group.
Children who are rejected and aggressive tend to start more fights and attempt to prevail
over their peers (Parkhurst & Asher, 1992; Wentzel & Asher, 1995). Research has also
shown that boys who are aggressive are reinforced for aggressive behavior and think that
aggressive behavior leads to positive outcomes (Zakriski, Jacobs, & Coie, 1997). This
finding lends support to Exner’s (2003) assertion that increased numbers of aggressive
responses on a Rorschach protocol indicate a greater propensity for anticipating negative
interactions and perceiving aggression in interpersonal relationships. However, children
in the rejected aggressive group did not differ from children in the rejected nonaggressive
and popular groups on the number of COP responses.
The fourth hypothesis predicted that children in the rejected aggressive group
would produce more active movement responses than children in the rejected
nonaggressive group and that children in the rejected nonaggressive group would have
more passive movement responses than children in the popular or the rejected aggressive
group. However, this finding was not supported in the current study even when the
passive and active movement variables were considered in relationship to one another.
One reason the finding was not supported in the current study is that the children
included in the study were nonpatient participants. The research cited by Exner in
support of the validity of the active and passive movement CS variables was conducted

39
on patient populations. The current study does not provide support for the validity of
interpretations of the active and passive movement variables among children who are not
currently receiving psychological treatment.
According to the fifth hypothesis, children in the rejected aggressive group were
expected to produce more S and more color responses with dominant color (CFC and
percent CFC) than children in the popular or rejected nonaggressive group. This was
predicted because rejected aggressive children tend to start more fights, have more
conflicts with their peers, and be more uncooperative (Cillessen, van Ijzendoorn, van
Lieshout, & Hartup, 1992; Parkhurst & Asher, 1992).
The white space portion of the hypothesis was not supported in the current study.
Weiner (1998) indicated that an excess of white space responses indicates that a person
may have oppositional inclinations coupled with underlying anger and resentment,
especially if the number of white space responses in a particular protocol exceeds one or
two. In the current study, children in the rejected aggressive group had a mean number of
white space responses greater than children in the other two groups, but the difference
was nonsignificant. Interestingly, several children across the three groups gave answers
that included more than two white space responses. For instance, 48.15 percent of the
children in the popular group, 55 percent of children in the rejected nonaggressive group,
and 66.67 percent of children in the rejected aggressive group gave three or more white
space responses. Aside from the number of white space responses, Exner (2003)
indicated that the timing of the white space responses is important in interpretation as
well. For instance, if there are more than three white space responses and they occur on
the first two cards, then, the respondent may have been unprepared to take the test and

40
may be responding in a situation-based, negative manner. On the other hand, if the
number of white space responses is greater than three and they occur after the second
card, then, the individual may have a more oppositional, negative, angry approach to the
world. Therefore, examining the location and number of white space responses might be
useful in future research.
As predicted, the three groups did differ in the frequency of color responses with
dominant color (CF, C) even when taking into account the frequency of color responses
with dominant form (FC). Children in the rejected aggressive group produced
significantly more color-dominated color responses than children in the popular and
rejected nonaggressive groups. Weiner (1998) wrote that FC, CF, and C are indicators of
how well an individual modulates emotion. Color responses dominated by form are
indicators of well-modulated emotion and are largely characteristic of adults who are
emotionally mature. Children have more of a propensity to have spontaneous and less
modulated emotions and are more likely to give color responses that are mostly driven by
color on the blots. Indeed, Weiner pointed out that as children become first adolescents
and then adults, the number of color-dominated responses is likely to stay the same, while
the number of form-dominated color responses increases. Despite being naturally
emotionally spontaneous, children can still give an excessive amount of color-dominated
responses relative to form-dominated color responses. In the current study, children in
the rejected aggressive group produced more color-dominated responses relative to form-
dominated color responses than children in the other two groups, providing some validity
for the CF, C and FC variables in a nonpatient sample of children.

41
Exploratory Hypotheses
Children who are rejected and aggressive tend to be more impulsive, disruptive,
and noncooperative than children who are rejected and nonaggressive (Cillessen, van
Ijzendoorn, van Lieshout; & Hartup, 1992) and children who are popular (Newcomb,
Bukowski, & Pattee, 1993). According to Exner (2003), the Afr is an indicator of an
individual’s openness to stimuli that incite emotion. Although the Afr is not necessarily
related in a direct manner to emotional control, the ratio may have an indirect association.
An elevated Afr may indicate overresponsiveness to emotionally provocative stimuli,
while a low Afr may suggest withdrawal or avoidance of similar stimuli. As an
exploratory hypothesis, children in the rejected aggressive group were predicted to have
higher affective ratios than children in the rejected nonaggressive and popular groups.
That is, children who were rejected and aggressive were expected to produce more
responses to the cards that were completely composed of chromatic color (i.e., cards VIII,
IX, and X).
However, this exploratory hypothesis was not supported in the current study.
Children in the rejected aggressive group, the rejected nonaggressive group, and the
popular group did not differ in the percentage of responses produced on the chromatic
color cards. In his explanation for interpretation of Afr, Exner (1993) noted that a low
Afr may be indicative of an individual’s awareness of difficulties with affective control.
In response to the color on the Rorschach cards, individuals may attempt to overly
control their natural inclination toward overresponsiveness by not producing many
responses to the last three cards. Additionally, Weiner (1998) suggested that an affective
ratio of less than .50 should be interpreted cautiously as this level of Afr is obtained more
42
often among nonpatient children than among nonpatient adults. In the current study,
children in the rejected aggressive group actually had the lowest average Afr (mean =
.46) relative to the children in the rejected nonaggressive (mean = .51) and popular (mean
= .50) groups. Exner (2003) also suggested that the Afr may be better understood when
examined along with other variables in the CS structural summary. For instance,
research on the CS variable EB, which indicates an individual’s preferential response
style, suggests that the Afr may vary as a function of response style as well as treatment
status (Exner, 2003). Weiner (1998) noted that children with high levels of dominant
chromatic color responses may recognize that their natural tendency to be emotionally
expansive is inappropriate in certain interpersonal situations. They may then be more
restrictive in their expression of emotion and produce lower Afr’s. In the current study,
the rejected aggressive children produced higher percentages of dominant color responses
than children in the popular and rejected nonaggressive groups, and the rejected
aggressive children’s average Afr was lower (i.e., mean = .46), although not significantly
lower, than children’s average Afr in the other groups. Therefore, the Afr is likely a
complicated variable that should be examined in terms of an individual’s overall
Rorschach protocol. Perhaps future research could further tease apart the effects of other
CS variables on the interpretation of the Afr.
Research has also established that children who are both rejected and
nonaggressive tend to be withdrawn, submissive, and anxious (Inderbitzen, Walters, &
Bukowski, 1997; Parkhurst & Asher, 1992). Therefore, children in the rejected
nonaggressive group were predicted to have a higher mean isolation index than children
in the rejected aggressive and popular groups. As predicted, results revealed that children

43
who were rejected and nonaggressive had higher isolation index scores than children in
the popular group but not the rejected aggressive group.
Exner (2003) stated that approximately 15 percent of patients and nonpatients
have an isolation index score that falls between .26 and .32, suggesting that the individual
“tends to be less active in social interaction than might be expected” but not indicating
that the person has conflicted social interactions (p. 504). An isolation index score of .33
or greater indicates that the individual is probably more socially secluded and may have
difficulty forming and maintaining close interpersonal relationships. The average
isolation index scores for the rejected nonaggressive group and for the rejected aggressive
group were .28 and .26, respectively, and the average isolation index score was .16 for
the popular group. Because children with a rejected sociometric status tend to have
difficulties in social relationships (Parkhurst & Asher, 1992), the findings from the
current study lend some support to the validity of the isolation index variable.
Utility of Results
The findings of the current study support the validity of the human representation
variable (HRV) with a nonclinical sample of children that were divided into groups based
on a well-established method of predicting children’s social adjustment (Crick &
Grotpeter, 1995). The PHR variable successfully differentiated rejected aggressive and
rejected nonaggressive children, and the percentage of GHR successfully differentiated
popular and rejected aggressive children. Three other variables successfully
differentiated the three groups as expected. Children in the rejected aggressive group
produced significantly more AG responses than children in the popular group and
children in the rejected nonaggressive group. In addition, children in the rejected
44
aggressive group gave significantly more color dominated color/form responses and pure
color responses than children in the other two groups even when color responses with
dominant form were taken into account. Finally, children in the rejected nonaggressive
group had significantly higher isolation index scores than children in the rejected
aggressive group and children in the popular group. Therefore, in the current study,
support was found for the validity of the AG, C, CF, FC, and isolation index CS
variables. Thus, there is some support for using these variables as well as the HRV as
indicators of a child’s social adjustment.
Other variables in the current study did not differentiate the rejected aggressive,
rejected nonaggressive, and popular groups. The number of GHR responses did not
differentiate the three groups when considered in isolation. The COP, active and passive
movement, white space, and Afr variables also did not differ among the three groups. In
the case of the Afr variable, group differences may be difficult to tease apart because
factors such as response style and treatment status may influence an individual’s Afr
score (Exner, 1993; Weiner, 1998).
Limitations and Recommendations for Future Research
There are several limitations to the current study. One of the main drawbacks of
the current study was the nonclinical nature of the participants. Although whether they
had received or were currently receiving psychological treatment was not assessed, all the
participants were enrolled in public elementary schools at the time of the study. On the
other hand, using extreme clinical groups has been a criticism of other studies on the
Rorschach CS (Exner, 2003; Wood, et al., 1999). A larger validation study could be done

45
in the future to compare the Rorschach responses of clinical and nonclinical groups of
children.
A second limitation was that only nine children with a rejected aggressive
sociometric status were available for the study. Only 12 parents of children in the
rejected aggressive group returned the consent forms, and of the 12, only nine were
willing to schedule a time for the researcher to meet with their child. Future researchers
should attempt to recruit more aggressive individuals to increase statistical power so that
smaller effect sizes can be found. Some of the findings in the current study were trends
(e.g., percent GHR and percent PHR) that could have reached a significant level if more
participants had been included in the rejected aggressive group.
Another limitation of the current study is the lack of ethnic diversity among
participants (i.e., participants were 89% Caucasian). Although ethnic differences were
not a focus of the current study, the Rorschach literature has been criticized for its lack of
consideration of the possible ethnic differences on Roschach CS variables (Frank, 1992;
Frank, 1993). However, in a review of the literature, Meyer (2002) found that ethnicity
did not differentiate adults’ responses on the Rorschach. In the current study, ethnic
diversity was limited because most of the returned parental consent forms were from
elementary schools whose students were predominantly Caucasian. Future studies should
examine the relationship between ethnicity and Rorschach CS variables in children.
A fourth limitation of the present study is that several of the Rorschach CS
variables violated the assumptions of normal distribution and homogeneity of variance.
Of the variables examined in the current study, only the CF, C, and S variables are not
normally distributed in the CS norms (Exner, 2003). The lack of normal distribution and

46
homogeneity problems may be due to the low number of participants in the three study
groups. Future studies should include more participants.
Summary
In the current study, some preliminary support was found for the validity of the
HRV with children in a nonclinical sample, particularly when GHR and PHR were
considered in relationship with one another. Evidence was also found for the validity of
several other established CS variables, including AG, the isolation index, and color-
dominated/pure color responses. Future research should examine the validity of the HRV
with larger, more diverse samples of children, adolescents, and adults.

47
REFERENCES
Abraham, P. P., Lepisto, B. L., Lewis, M. G., Schultz, L., & Finkelberg, S. (1994). An outcome study: Changes in Rorschach variables of adolescents in residential treatment. Journal of Personality Assessment, 62, 505-514.
Acklin, M. W., McDowell, C. J., & Orndoff, S. (1992). Statistical power and the Rorschach: 1975-1991. Journal of Personality Assessment, 59, 366-379.
Acklin, M. W., McDowell, C. J., Verschell, M. S., & Chan, D. (2000). Interobserver agreement, intraobserver reliability, and the Rorschach Comprehensive System. Journal of Personality Assessment, 74, 15-47.
Adrian, C., & Kaser-Boyd, N. (1995). The Rorschach Ego Impairment Index in heterogeneous psychiatric patients. Journal of Personality Assessment, 65, 408-414.
Aranow, E., Reznikoff, M., & Moreland, K. L. (1995). The Rorschach: Projective technique or psychometric test? Journal of Personality Assessment, 64, 213-228.
Archer, R. P., & Krishnamurthy, R. (1997). MMPI-A and Rorschach indices related to depression and conduct disorder: An evaluation of the incremental validity hypothesis. Journal of Personality Assessment, 69, 517-533.
Becker, L. A. (1999). 01010.1 Explore: Assumption testing for ANOVA. Retrieved June 4, 2005, from University of Colorado at Colorado Springs Web site: http://web.uccs.edu/lbecker/spss80/explore2.htm
Berg, J. L., Packer, A., & Nunno, V. J. (1993). A Rorschach analysis: Parallel disturbance in thought and in self/object representation. Journal of Personality Assessment, 61, 311-323.
Black, B., & Hazen, N. L. (1990). Social status and patterns of communication in acquainted and unacquainted preschool children. Developmental Psychology, 26, 379-387.
Blatt, S. J., Brenneis, C. B., Schimek, J. G., & Glick, M. (1976). Normal development and psychopathological impairment of the concept of object on the Rorschach. Journal of Abnormal Psychology, 85, 364-373.
Brown-Cheatham, M. (1993). The Rorschach Mutuality of Autonomy Scale in the assessment of black father-absent male children. Journal of Personality Assessment, 61, 524-530.

48
Burns, B., & Viglione, D. J., Jr. (1996). The Rorschach Human Experience Variable, interpersonal relatedness, and object representation in nonpatients. Psychological Assessment, 8, 92-99.
Buzzelli, C. A. (1992). Popular and rejected children’s social reasoning: Linking social status and social knowledge. Journal of Genetic Psychology, 153, 331-342.
Carter, C. L., & Dacey, C. M. (1996). Validity of the Beck Depression Inventory, MMPI, and Rorschach in assessing adolescent depression. Journal of Adolescence, 19, 223-231.
Cillessen, A. H. N., & Bukowski, W. M. (2000). Conceptualizing and measuring peer acceptance and rejection. In A. H. N. Cillessen & W. M. Bukowski (Eds.), Recent advances in the measurement of acceptance and rejection in the peer system (pp. 3-10). San Francisco: Jossey-Bass.
Cillessen, A. H. N., van Ijzendoorn, H. W., van Lieshout, C. F. M., & Hartup, W. W. (1992). Heterogeneity among peer-rejected boys: Subtypes and stabilities. Child Development, 63, 893-905.
Cohen, J. (1992). A power primer. Psychological Bulletin, 112, 155-159. Coie, J. D., Dodge, K. A., & Coppotelli, H. (1982). Dimensions and types of social
status: A cross-age perspective. Developmental Psychology, 18, 557-570.
Coie, J. D., & Kupersmidt, J. B. (1983). A behavioral analysis of emerging social status in boys’ groups. Child Development, 54, 1400-1416.
Crick, N., & Grotpeter, J. (1995). Relational aggression, gender, and social- psychological adjustment. Child Development, 66, 710-722.
Erdley, C., & Asher, S. (1996). Children’s social goals and self-efficacy perceptions as influences on their responses to ambiguous provocation. Child Development, 67, 1329-1344.
Exner, J. E., Jr. (1993). The Rorschach: A comprehensive system: Volume 1: Basic foundations (3rd ed.). New York: John Wiley & Sons, Inc.
Exner, J. E., Jr. (1995). A Rorschach Workbook for the Comprehensive System (4th ed.). Asheville, NC: Rorschach Workshops.
Exner, J. E., Jr. (2000). New research—Additions, changes, and deletions. Alumni Newsletter, 1-5.
Exner, J. E., Jr. (2002). A new nonpatient sample for the Rorschach Comprehensive System: A progress report. Journal of Personality Assessment, 78, 391-404.

49
Exner, J. E., Jr. (2003). The Rorschach: A comprehensive system: Volume 1: Basic
foundations (4th ed.). Hoboken, NJ: John Wiley & Sons, Inc.
Exner, J. E., Jr., & Andronikof-Sanglade. (1992). Rorschach changes following brief and short-term therapy. Journal of Personality Assessment, 59, 59-71.
Exner, J. E., Jr., & Weiner, I. B. (1995). The Rorschach: A comprehensive system: Volume 3: Assessment of children and adolescents (2nd ed.). New York: John Wiley & Sons, Inc.
Fireman, G., Hutcherson, S., Chilton, A., & Wang, E. (2002). Predicting school disciplinary problems: The validity of peer nomination measures. Lubbock, TX: Texas Tech University (ERIC Document Reproduction Service No. CG032044).
Frank, G. (1992). The response of African-Americans to the Rorschach: A review of the research. Journal of Personality Assessment, 59, 317-325.
Frank, G. (1993). The use of the Rorschach with Hispanic-Americans. Psychological Reports, 72, 276-278.
Gacono, C. B. (2000). Suggestions for the implementation and use of the Psychopathy Checklist in forensic and clinical practice. In C. B. Gacono (Ed.), The clinical and forensic assessment of psychopathy: A practitioner’s guide (pp. 175-202). Mahwah, NJ: Lawrence Erlbaum Associates, Inc.
Gacono, C. B., Loving, J. L., Jr., & Bodholdt, R. H. (2001). The Rorschach and psychopathy: Toward a more accurate understanding of the research findings. Journal of Personality Assessment, 77, 16-38.
Ganellen, R. J. (1996). Comparing the diagnostic efficiency of the MMPI, MCMI-II, and Rorschach: A review. Journal of Personality Assessment, 67, 219-243.
Ganellen, R. J. (2001). Weighing evidence for the Rorschach’s validity: A response to Wood et al. (1999). Journal of Personality Assessment, 77, 1-15.
George, T. P., & Hartmann, D. P. (1996). Friendship networks of unpopular, average, and popular children. Child Development, 67, 2301-2316.
Gerstle, R. M., Geary, D. C., Himelstein, P., & Reller-Geary, L. (1988). Rorschach predictors of therapeutic outcome for inpatient treatment of children: A proactive study. Journal of Clinical Psychology, 44, 277-280.
Gest, S. D., Graham-Bermann, S. A., & Hartup, W. W. (2001). Peer experience: Common and unique features of friendships, social network centrality, and sociometric status. Social Development, 10, 23-40.

50
Holaday, M. (1998). Rorschach protocols of children and adolescents with severe burns:
A follow-up study. Journal of Personality Assessment, 71, 306-321.
Holaday, M., & Whittenberg, T. (1994). Rorschach responding in children and adolescents who have been severely burned. Journal of Personality Assessment, 62, 269-279.
Inderbitzen, H. M., Walters, K. S., & Bukowski, A. L. (1997). The role of social anxiety in adolescent peer relations: Differences among sociometric status groups and rejected subgroups. Journal of Clinical Child Psychology, 26, 338-348.
Kemple, K., Speranza, H., & Hazen, N. (1992). Cohesive discourse and peer acceptance: Longitudinal relations in the preschool years. Merrill-Palmer Quarterly, 38, 364-381.
Keppel, G. (1991). Design and analysis: A researcher’s handbook (3rd ed.). Englewood Cliffs, NJ: Prentice-Hall, Inc.
McDowell, C., & Acklin, M. W. (1996). Standardizing procedures for calculating Rorschach interrater reliability. Journal of Personality Assessment, 66, 308-320.
Meyer, G. J. (1996). The Rorschach and MMPI: Toward a more scientifically differentiated understanding of cross-method assessment. Journal of Personality Assessment, 67, 558-578.
Meyer, G. J. (1997). Assessing reliability: Critical correlations for a critical examination of the Rorschach Comprehensive System. Psychological Assessment, 9, 480-489.
Meyer, G. J. (2002). Exploring possible ethnic differences and bias in the Rorschach Comprehensive System. Journal of Personality Assessment, 78, 104-129.
Meyer, G. J., Hilsenroth, M. J., Baxter, D., Exner, J. E., Jr., Fowler, J. C., Piers, C. C., & Resnick, J. (2002). An examination of interrater reliability for scoring the Rorschach comprehensive system in eight data sets. Journal of Personality Assessment, 78, 219-274.
Mooney, K. C., & Harrison, A. J. (1987). A content analysis of child psychological evaluations. Journal of Child and Adolescent Psychotherapy, 4, 275-282.
Newcomb, A. F., Bukowski, W. M., & Pattee, L. (1993). Children’s peer relations: A meta-analytic review of popular, rejected, neglected, controversial, and average sociometric status. Psychological Bulletin, 113, 99-128.
51
Parkhurst, J., & Asher, S. (1992). Peer rejection in middle school: Subgroup differences in behavior, loneliness, and interpersonal concerns. Developmental Psychology, 28, 231-241.
Perry, W. P., & Braff, D. L. (1994). Information-processing deficits and thought disorder in schizophrenia. American Journal of Psychiatry, 151, 363-367.
Perry, W., McDougall, A., & Viglione, D.V., Jr. (1995). A five-year follow-up on the temporal stability of the Ego Impairment Index. Journal of Personality Assessment, 64, 112-118.
Perry, W., Moore, D., & Braff, D. (1995). Gender differences on thought disturbance measures among schizophrenic patients. American Journal of Psychiatry, 152, 1298-1301.
Perry, W., & Viglione, D.V., Jr. (1991). The Ego Impairment Index as a predictor of outcome in melancholic depressed patients treated with tricyclic antidepressants. Journal of Personality Assessment, 56, 487-501.
Perry, W., Viglione, D., Jr., & Braff, D. (1992). The Ego Impairment Index and schizophrenia: A validation study. Journal of Personality Assessment, 59, 165-175.
Peterson, C. C., & Siegal, M. (2002). Mindreading and moral awareness in popular and rejected preschoolers. British Journal of Developmental Psychology, 20, 205-224.
Pope, A., Bierman, K., & Mumma, G. (1991). Aggression, hyperactivity, and inattention immaturity: Behavior dimensions associated with peer rejection in elementary school boys. Developmental Psychology, 29, 353-374.
Price, J. M., & Dodge, K. A. (1989). Reactive and proactive aggression in childhood: Relations to peer status and social context dimensions. Journal of Abnormal Child Psychology, 17, 455-471.
Ryan, R. M., Avery, R. R., & Grolnick, W. S. (1985). A Rorschach assessment of children’s mutuality of autonomy. Journal of Personality Assessment, 49, 6-12.
Shaffer, T. W., Erdberg, P., & Haroian, J. (1999). Current nonpatient data for the Rorschach, WAIS-R, and MMPI-2. Journal of Personality Assessment, 73, 305-316.
Simon, S. (2005). Definitions of important terms. Retrieved June 28, 2005, from Children’s Mercy Hospital and Clinics Web site: http://www.cmh.edu/stats/definitions.asp

52
Tuber, S. (1992). Empirical and clinical assessments of children’s object relations and object representations. Journal of Personality Assessment, 58, 179-197.
Urist, J. (1977). The Rorschach test and the assessment of object relations. Journal of Personality Assessment, 41, 3-9.
Urist, J., & Shill, M. (1982). Validity of the Rorschach Mutuality of Autonomy Scale: A replication using excerpted responses. Journal of Personality Assessment, 46, 450-454.
Viglione, D. J., Jr. (1999). A review of recent research addressing the utility of the Rorschach. Psychological Assessment, 11, 251-265.
Viglione, D. J., Jr. (1997). Problems in Rorschach research and what to do about them. Journal of Personality Assessment, 68, 590-599.
Viglione, D. J., Jr., Brager, R. C., & Haller, N. (1988). Usefulness of structural Rorschach data in identifying inpatients with depressive symptoms: A preliminary study. Journal of Personality Assessment, 52, 524-529.
Viglione, D. J., & Taylor, N. (2003). Empirical support for interrater reliability of Rorschach Comprehensive System coding. Journal of Clinical Psychology, 59, 111-121.
Walker, S., Berthelsen, D., & Irving, K. (2001). Temperament and peer acceptance in early childhood: Sex and social status differences. Child Study Journal, 31, 177-192.
Weiner, I. B. (2001). Considerations in collecting Rorschach reference data. Journal of Personality Assessment, 77, 122-127.
Weiner, I. B. (1991). Editor’s note: Interscorer agreement in Rorschach research. Journal of Personality Assessment, 56, 1.
Weiner, I. B. (1998). Principles of Rorschach Interpretation. Mahwah, NJ: Lawrence Erlbaum Associates, Inc.
Wentzel, K. R., & Asher, S. R. (1995). The academic lives of neglected, rejected, popular, and controversial children. Child Development, 66, 754-763.
Wood, J. M., & Lilienfeld, S. O. (1999). The Rorschach Inkblot Test: A case of overstatement? Assessment, 6, 341-349.
Wood, J. M., Lilienfeld, S. O., Garb, H. N., & Nezworski, M. T. (2000). The Rorschach Test in clinical diagnosis: A critical review with a backward look at Garfield (1947). Journal of Clinical Psychology, 56, 395-430.

53
Wood, J. M., Lilienfeld, S. O., Nezworski, M. T., & Garb, H. N. (2001a). Coming to
grips with negative evidence for the Comprehensive System for the Rorschach: A comment on Gacano, Loving, and Bodholdt; Ganellen; and Bornstein. Journal of Personality Assessment, 77, 48-70.
Wood, J. M., Nezworski, M. T., Garb, H. N., & Lilienfeld, S. O. (2001b). The misperception of psychopathology: Problems with the norms of the Comprehensive System for the Rorschach. Clinical Psychology: Science and Practice, 8, 350-373.
Wood, J. M., Nexworski, M. T., Stejskal, W. J., Garven, S., & West, S.G. (1999). Methodological issues in evaluating Rorschach validity: A comment on Burns and Viglione (1996), Weiner (1996), and Ganellen (1996). Assessment, 6, 115-129.
Wood, J. M., Nezworski, M. R., & Stejskal, W. J. (1996). The Comprehensive System for the Rorschach: A critical examination. Psychological Science, 7, 3-10.
Zakriski, A., Jacobs, M., & Coie, J. (1997). Coping with childhood peer rejection. In S. A. Wolchik & I. N. Sandler (Eds.), Handbook of children’s coping: Linking theory and intervention (pp. 423-451). New York: Plenum Press.

54
APPENDIX A
EXTENDED LITERATURE REVIEW: THE RORSCACH COMPREHENSIVE
SYSTEM DEBATE, THE DEVELOPMENT OF THE HUMAN
REPRESENTATIONAL RESPONSE VARIABLE, AND PEER NOMINATION AND
SOCIOMETRIC STATUS
The Rorschach Comprehensive System (Exner, 2003) has been the source of
much controversy among various researchers and clinicians, especially regarding the
norms, validity, and reliability of the CS variables. The controversy is important to
review given that the present study attempted to find support for the validity of one of the
CS variables, the human representational response (HRV) (Exner, 2000). In addition,
because the current study examined the validity of the HRV, the literature related to the
HRV and its development will be further explored. Therefore, first the controversy
regarding the use of the CS will be discussed followed by a review of the literature
related to the HRV.
The Rorschach Comprehensive System Debate
Because the Rorschach and the scoring systems used with the test have been
under such scrutiny and the source of much debate in the past, the controversy
surrounding the Comprehensive System (Exner, 2003) is not surprising. Several issues
have been debated in the literature, including the issue of reporting results,
methodological issues in regard to research, problems with the normative base, validity
issues, and reliability problems. Each of these topics will be covered in the following
section, addressing the ideas of both opponents and proponents of the CS.

55
Opponents of the Comprehensive System
Difficulties with Rorschach norms
Wood and Lilienfeld (1999) and Wood et al. (2001b) suggested that several
difficulties with Rorschach CS norms call into question the use of the CS. First, Wood
and colleagues maintained that the adult norms are based on a small sample of 700 adults,
which contrasts with the norms of other psychological tests (i.e., intelligence tests), which
are based on thousands of participants. Additionally, they noted that the child norms
were collected in the 1970s to 1980s and are therefore probably not representative of
children today, especially considering the loss of children in the normative sample of
individuals who produced protocols with less than 14 responses. Protocols of less than
14 responses were found to be invalid by Exner (Exner, 2003) and were removed from
the normative base. Finally, the opponents of the CS pointed out that there are no norms
for different ethnic groups. They assert that members of different ethnic groups would
likely respond differently to the Rorschach and that few research studies have been
completed on the use of the Rorschach CS with various cultural groups. Indeed, Frank
(1992) noted that only a handful of studies have been conducted on the use of the
Rorschach with African-American individuals since the test’s introduction in 1921.
Wood and colleagues argued that other psychological tests, such as intelligence tests,
often include cross-cultural norms and have studies indicating that ethnic groups score
differently on certain variables. In addition, Frank (1993) reported that only three studies
have been conducted on the use of the Rorschach with Hispanic-Americans, all prior to
the development of the CS.

56
Shaffer, Erdberg, and Haroian (1999) conducted a study to obtain normative
nonpatient data on the Rorschach, WAIS-R, and MMPI-2, using 123 nonpatient adults.
Because the study showed that several Rorschach variables, such as the SCZI and
reflection responses, differed in a pathological direction from previous nonpatient CS
norms, Wood et al. (2000) decided to conduct a review of the literature on nonpatient CS
norms. Wood and colleagues found that by combining the data from 32 studies, the
nonpatient data was significantly different from Exner’s nonpatient norms in several
ways, including “a) a higher proportion of ambitent protocols than the CS norms, b) a
greater number of Reflection responses, c) lower X+%, d) higher X-%, e) lower Afr, f)
lower FC, g) fewer Popular responses, h) higher Sum Y, i) lower Sum T, j) lower
WsumC, k) higher MOR, l) higher Wsum6, m) higher Lambda, and n) lower Pure H” (p.
356). A normal adult would appear to be highly pathological if a clinician used CS
norms to interpret these results.
Wood et al. (2001b) gave several explanations for these results but discounted
each: 1) administration/scoring of the Rorschach records was inaccurate, 2) the samples
in the studies reviewed did not represent the American general population of normal
adults, 3) the dissertations chosen for the study biased the sample, and 4) Rorschach
scores have changed over time in the general population. They concluded that the current
CS norms have probably never adequately represented the general population. The
findings of the study led Wood and colleagues to close by saying that the CS norms
should not be used in clinical or forensic settings for ethical reasons. If CS norms
continue to be used, they suggested that clinicians “forthrightly describe the limitations of
the CS norms” (p. 363). They also maintained that studies that used the CS norms as a

57
comparison group should be conducted a second time with appropriate control groups
and that adequate local and national norms need to be established.
Validity issues
As a result of the findings of the review on the nonpatient studies, Wood et al.
(2001b) questioned the validity of some of the research findings that were based on
comparisons to the CS norms. For example, studies by Holaday and colleagues on the
Rorschach protocols of children with a history of severe burns used the CS norms as the
comparison group (Holaday, 1998; Holaday & Whittenberg, 1994). They found that a
large percentage of children with a history of burns elevated the Schizophrenia Index and
exhibited elevation on CS variables indicative of disordered thinking. These results
would likely be greatly attenuated if Holaday et al. used a nonclinical control group.
In addition, Wood and Lilienfeld (1999) wrote, “Very few Rorschach scores bear
a well-demonstrated relationship to psychiatric diagnoses” (p. 348). Meyer (1996) noted
that the research literature indicates that there is a lack of consistent convergence between
MMPI and Rorschach variables and that the Rorschach does not consistently measure
self-reported characteristics. Wood et al. (2000) added that the Rorschach CS has shown
little diagnostic utility, citing research that shows that poor form quality and deviant
verbalizations seem to be found consistently in the Rorschach protocols of individuals
with psychotic disorders, bipolar disorder, and schizotypal personality and that deviant
verbalizations appear consistently in protocols of individuals with borderline personality
disorder. They concluded that the Rorschach has little validity as a diagnostic tool.

58
Reliability issues
Interrater reliability is the degree of agreement between two independent raters
scoring the same protocol. McDowell and Acklin (1996) and Wood and Lilienfeld
(1999) noted that the interrater reliability estimates reported by Exner in 1978 were
inflated due to Exner’s use of percentages to calculate the reliability estimates, which do
not take into account unequal base rates. When interclass correlation coefficients were
computed for the Rorschach CS variables (Acklin, et al., 2000), the coefficients ranged
from less than .20 to 1.0 even thought the median reliability estimate was in the low .80s.
For example, the interrater reliability of the SCZI was found to be between .45 and .56.
With regard to test-retest reliability, Wood and Lilienfeld (1999) noted that
approximately 85 (68 percent) of the Rorschach CS variables do not have reported test-
retest reliability scores, including SCZI, DEPI, CDI, and HVI scores. Aronow,
Reznikoff, and Moreland (1995) also reported that test-retest reliabilities using the same
test form (i.e., the same stimulus cards) might also inflate estimates of test-retest
reliability due to the increased likelihood of memory effects (i.e., individuals
remembering the responses they gave from the previous test administration). Because the
Rorschach inkblot test has only one set of cards, the test-retest reliability scores for
variables that have been reported by Exner and colleagues may be overestimates.
These opponents concluded that the interrater and test-retest reliabilities of the
Rorschach CS have yet to be established adequately by researchers, calling into question
whether the CS should be used at all in clinical and forensic settings.

59
Proponents of the Comprehensive System
Proponents of the Rorschach CS cite several counterpoints to the arguments
proposed against the CS. They provide counterpoints in the areas of research methods,
the normative sample, validity issues, and reliability issues.
Methodological issues in research
Proponents of the CS have made several arguments for improving research done
on the CS. First, Acklin, McDowell, and Orndoff (1992) conducted a survey of the
power in studies using the Rorschach between 1975 and 1991. They found that the
research using the CS was more statistically powerful than research using other systems
and that overall, the Rorschach research across all systems has similar power for small,
medium, and large effect sizes relative to research in other areas of behavioral science.
To increase power, they suggested using larger sample sizes, parametric versus
nonparametric statistics, error variance reduction, and accurate reporting of procedures
and results.
In addition, Viglione (1997) set forth several guidelines to avoid potential but
common pitfalls in conducting Rorschach research. First, he suggested that researchers
be aware of the properties of the variables being studied, that they use graphs to depict
relationships among data, and that they use descriptive statistics to justify the tests they
are using. He gave the example that while X+% may be normally distributed among
nonpatients, inanimate movement (m) has a restricted range and slightly skewed
distribution, making the variable inappropriate for parametric tests. Second, rival
hypotheses should be ruled out. For instance, when comparing a group with a particular
disorder to a normal control group, are group differences related to the nature of the

60
disorder or to severe psychopathology in general? He maintained that one should be
careful not to make confounded comparisons such as the one described above.
Additionally, even if scorers agree on scores in a particular study, their scores may still
be inaccurate; therefore, comparing data in the study to the CS norms is not appropriate.
Researchers should be careful with scoring CS variables and take steps to ensure
adequate interrater reliability. Finally, researchers should take care not to equate a
variable with a construct the variable is purported to measure. For example, researchers
should not assume that the elevations on the SCZI indicates the presence of a psychotic
disorder in all groups. He suggested using independent validity criteria.
Norms
To address the findings concerning nonpatient data collected by Shaffer, Erdberg
and Haroian (1999), Weiner (2001) cautioned against making premature conclusions that
the CS is unreliable or invalid. First, Weiner noted that the high Lambdas, indicative of
high frequency of pure form responses, could be the result of inexperienced graduate
students who are beginning to learn the skill of inquiry that can lead to other than pure
form responses. He explained the elevated X-% and WSum6 by comparing the medians
of WSum6 scores in the CS norms and in Shaffer et al.’s sample, showing that they were
virtually identical. Weiner suggested the presence of an outlier or participants who did
not respond in a serious manner in the Shaffer et al. sample. He also pointed out that the
volunteers in the Shaffer et al. sample may have been more open to reporting strange or
inaccurate responses than normal because they had no reason to censor their answers.
Weiner stated that one way to prevent volunteer participants from taking the test lightly is
to emphasize the important contribution they are making to research.

61
Weiner (2001) then provided some guidelines for conducting future normative
research. He wrote that experienced examiners who can conduct inquiry well should
collect the normative data. The normative sample volunteers should be informed of the
serious nature of their participation and should contain a representative group of
individuals. Third, he stated that multiple normative groups with varying ranges of
psychopathology (i.e., mild to severe symptomatology) should be utilized.
Meyer (2002) countered Wood and Lilienfeld’s (1999) statement that the
Rorschach CS should not be used with minorities because several studies indicate that
ethnic minorities respond differently. Meyer noted that only six of the eleven studies that
Wood presented as evidence against the use of the CS norms with minorities used the CS
for administration and scoring. In addition, he argued that if Wood et al. (2001b)
criticized the use of CS norms in studies, saying that results from those studies should be
considered invalid, then, they could not use studies that compare samples to the CS
norms as evidence against the CS. Meyer examined slope bias, intercept bias, and the
Rorschach factor structure and not mean differences to determine whether test bias was
occurring among 432 inpatients who were European-American, African-American,
Hispanic-American, Asian-American, or Native American. After matching participants
on key demographic variables or controlling for them statistically, ethnicity was not
associated with any of the 188 CS variables studied. No slope bias was found; however,
for SCZI, X+%, X-%, and WSum6, an intercept bias was found, meaning that majority
and minority groups had different intercepts on these variables and that the minorities’
psychotic symptoms would be underestimated when using minority data as a comparison.
Meyer (2002) concluded that the CS could be used with minorities without fear of bias.

62
Recently, Exner (2002) published data on a preliminary set of new nonpatient
norms. He found that the data was highly similar to the original normative sample
collected over 20 years ago and drew a tentative conclusion that the old normative sample
is likely representative of nonpatient adults. New normative data that better represent the
demographics of the population continue to be collected.
Validity issues
Wood et al. (1999) has critiqued several areas of the Rorschach literature, and
Rorschach proponents have rebutted with a more optimistic view. For instance, Ganellen
(2001) discussed criticisms by Wood et al. (1996) of his findings regarding the
Depression Index (DEPI) (Ganellen, 1996). Ganellen reported that many of the studies
that were used by Wood et al. as evidence against the DEPI were based on the original
version of the DEPI and not the revised DEPI. Studies on the original DEPI did show
poor discrimination between samples of depressed and nondepressed individuals (e.g.,
Viglione, Brager, & Haller, 1988). The revised DEPI is a different and separate scale
from the original DEPI because several new variables were added (i.e., FD, S, COP,
Isolation Index, Intellectualization index). Second, Ganellen noted that of the three
recent articles that had findings against the use of the revised DEPI, one used the original
DEPI (Carter & Dacey, 1996) and another used no comparison group. In addition, the
third study (Archer & Krishnamurthy, 1997) found that the revised DEPI was equally as
sensitive to the presence of depression in a heterogeneous sample of adolescents as the
MMPI-A Scale 2. The sensitivity was low for both measures, but Ganellen attributed this
finding to the sample being atypical. For instance, the adolescents produced Rorschach
protocols with unusually high Lambdas, and the adolescents in the depression group

63
scored higher on Scale 4 than adolescents in the conduct disorder group. Ganellen agreed
with Wood et al. that more studies should be conducted on the utility of the revised DEPI
but stressed that current positive data should not be ignored.
In addition to rebuttals by proponents of the Rorschach CS, Exner (1993) and
others (e.g., Gacono, Loving, & Bodholdt, 2001) have maintained that the use of the
Rorschach CS is not diagnosis and that the Rorschach CS’s purpose is not for testing but
for assessment of the individual’s personality functioning. Gacono (2000) asserted that
“assessment is a multi-faceted, ongoing, interactive process, and as such, often blends
imperceivably with treatment, staff education, and program evaluation and development.
One cannot advocate for testing and expect to achieve assessment” (p.194-195). In other
words, the results of the Rorschach CS can be integrated with other sources of
information on an individual to formulate a diagnosis but also determine how he or she is
functioning in the environment with his or her specific personality structure. The
Rorschach was never intended solely to be a diagnostic tool. Thus, the validity of the
Rorschach CS should not be evaluated based solely on single variables used in a
categorical fashion but should be based on multiple variables across the Rorschach
protocol that take into account the multi-dimensional nature of psychiatric disorders.
Reliability issues
Weiner (1991) set forth a general rule for acceptable interrater reliability
procedures in Rorschach research. He stated that “at least 20 protocols in a study should
be scored by two or more examiners to monitor scoring reliability” (p. 1) and a reliability
rate of at least .80 should be achieved for the variables relevant to the study. In addition,
in a review of 16 studies, Meyer (1997) found that the Rorschach CS can be scored in a

64
reliable fashion by multiple raters. However, with regard to the opposing findings by
Acklin et al. (2000), future research should be conducted to determine whether the CS
variables can be reliably scored by multiple raters. Most recently, Viglione and Taylor
(2003) examined 84 Rorschach protocols that were each scored twice. The sample
included 43 nonpatient children and adults, 20 battered women, and 21 adolescents and
adults from clinical forensic settings. Fifteen trained, graduate students scored the
Rorschach protocols so that each protocol was coded twice. Results indicated that for
most of the variables that occurred frequently among individuals, the interclass
coefficients were above .80. Variables that had lower reliabilities in other studies with
fewer participants had higher reliabilities when examined in a larger sample. The authors
suggested that to examine the interrater reliability of less frequently occurring variables,
researchers should incorporate large samples. They concluded that the Rorschach CS
variables can be reliably coded when scored by individuals who are well-trained in the
CS.
With regard to test-retest reliability, several researchers have conducted studies in
which the Rorschach has been utilized as a treatment outcome measure. Gerstle et al.
(1988) examined pre- and post-treatment Rorschach protocols in 12 male children with
affective disorders, psychotic disorders, or a conduct disorder who were in inpatient
treatment for an average of 12 months. Two Rorschach variables thought to be sensitive
to change over time decreased significantly at post-treatment: Lambda and es, indicating
that children who were being discharged were more open to psychological data, were
able to expand upon stimuli they were perceiving, and were experiencing lower stress
levels.

65
In a study on change in short-term therapy, Exner and Andronikof-Sanglade
(1992) compared the Rorschach protocols of adults in brief therapy (i.e., approximately
14 sessions) and those of adults in short-term therapy (i.e., approximately 47 sessions) at
the beginning of therapy, at therapy termination, and 8 to 12 months after treatment to
examine whether the Rorschach CS detected treatment change. They found that stress
levels decreased at termination (i.e., fewer adults had D scores that were lower than their
Adjusted D scores), which was supported by similar findings on a self-report measure of
adjustment. In addition, fewer participants were susceptible to depressive symptoms (i.e.,
DEPI > 4), fewer were distressed (i.e., Sum Shading > FM + m), fewer had difficulties
modulating their emotions (i.e., CF+C > FC+1), and fewer were unable to process
emotion (i.e., Afr < .50).
Similarly, Abraham et al. (1994) found that 50 adolescents in inpatient treatment
for two years improved significantly on several CS variables following treatment. For
example, the adolescents showed an increase in more conventional thinking (i.e., more
Popular responses), were less disengaged from their surroundings (i.e., fewer FV, lower
Isolation Index), and had more energy (i.e., greater FM and active movement responses).
The authors concluded that the findings supported the usefulness of the Rorschach CS in
treatment outcome assessment.
Future Research and Clinical Considerations
Although Wood and colleagues (2001b) called for a complete termination of the Rorschach in clinical or forensic settings based on unusual nonpatient data collected
by Shaffer et al. (1999), this conclusion is premature and extreme. Weiner (2001)
pointed out that the sample may have had some flaws, including inexperienced

66
Rorschach administrators, the possibility of outliers, and lack of volunteer investment in
the assessment.
The Rorschach should not be used by itself for diagnostic and assessment
purposes but should always be used in the context of other assessment instruments, a
clinical interview, behavioral observations, and other sources of information. When
using the Rorschach, clinicians should be aware of the limitations of the CS in regard to
norms, validity, and reliability and should note these in the Rorschach CS results section
in reports that are written for assessment and diagnostic purposes.
Future research should be conducted in several areas, including interrater
reliability (i.e., with large samples), test-retest reliability (i.e., outside of the treatment
outcome), and validity (i.e., construct validity). Precautions should be taken to ensure
adequate coding of CS variables by examiners (at least .80 on relevant variables) and
should use independent control groups and not the CS normative sample. More research
is needed to examine the utility of the CS normative sample. Should the CS normative
sample be thrown out as Wood and colleagues suggest, or should it be re-evaluated with
additional nonpatient data? A cautious approach suggests re-evaluating the CS normative
sample with additional data, preferably data representative of racial and ethnic groups,
socioeconomic status, and other relevant demographic variables. As stated earlier, Exner
(2002) published initial findings with regard to a new normative data set that is currently
being collected and that is more representative of the population. Further precautions
should be taken in research to be aware of the properties of the data, rule out alternative
hypotheses, and take care not to equate a variable with a construct (Viglione, 1997).
67
One new variable on the Rorschach CS that has been studied in an attempt to
meet some of the challenges set forth by the opponents of the Rorschach CS is the human
representational variable (HRV) (Exner, 2000). Research on the development on the
HRV and the HRV itself will be reviewed in the next section.
Development of the Human Representational Variable
The human representational variable (HRV) (Exner, 2000) is rooted in research
on assessing object relations on the Rorschach. Assessing object relations is important in
various clinical and forensic settings to determine an individual’s level of functioning and
to aid in treatment planning. One of the main areas of research that strongly influenced
the development of the HRV is the series of studies on the mutuality of autonomy index
(MOA). The research on the MOA will be reviewed in the next section followed by a
review of the research on the HRV.
The Mutuality of Autonomy Scale
In 1977, Urist developed a set of criteria to measure the autonomy of self from
others in a person’s environment. He assumed that the relationship among objects,
human and otherwise, in an individual’s Rorschach protocol was directly reflective of his
or her perception of human relationships. Seven criteria were developed to assess the
level of mutuality and autonomy among objects in Rorschach responses and were
subsequently called the mutuality of autonomy scale (MOA). The criteria included
percepts in which objects were in a mutual but separate relationship to one another,
objects were engaged in a relationship or similar action but in which the action is not
stated to be mutual, objects were leaning or hanging on one another, an object is a
reflection or extended version of another, one object is controlling another in a negative

68
way, one object is destructive toward another object, and objects are consumed by
uncontrollable influences. In a subsequent study (Urist & Shill, 1982), the researchers
named the criteria respectively as Reciprocity-Mutuality, Collaboration-Cooperation,
Simple Interaction, Anaclitic-Dependent, Reflection-Mirroring, Magical Control-
Coercion, and Envelopment-Incorporation.
Research with adults
After developing the scale, Urist (1977) then administered the Rorschach to 40
adult inpatients (18 men and 22 women) with a variety of severe psychological
difficulties. The participants also completed an autobiographical task in which they
talked about the most important relationships in their life in the past and present. Staff
members at the hospital also completed ratings on their perceptions of each participant’s
relationship with the staff and other patients. Using the criteria for mutuality of
autonomy, researchers then rated each participant’s Rorschach response and
autobiographical task as well as staff members’ perceptions of the participants’
relationships. On the Rorschach, each participant received a high, low, and overall score
for mutuality of autonomy. Results suggested that the mutuality of autonomy in a given
individual’s relationships was similar across measures (i.e., Rorschach responses,
autobiographical task, staff perceptions). Interestingly, the more pathological Rorschach
responses were found to correlate more strongly across the three measures than the
healthier responses. The authors concluded that the MOA was a useful measure for
assessing the quality of an individual’s relationships.
Berg, Packer, and Nunno (1993) conducted a more recent study of the utility of
the MOA with adults who were diagnosed with borderline personality disorder,

69
narcissistic personality disorder, or schizophrenia and who had been referred for
diagnostic assessment between 1979 and 1991. The researchers were particularly
interested in the relationship between specific MOA scores and Rorschach CS (Exner,
1993) special scores as an indication of a positive relationship between object relations
difficulties and thought difficulties. Results suggested that across groups, MOA scores
indicative of highly disturbed object relations were significantly correlated with
Rorschach special scores indicative of thought difficulties (i.e., INCOM, FABCOM,
ALOG, CONTAM, and WSum6). Additionally, higher MOA scores were also
significantly and positively associated with Rorschach responses containing aggressive
content (AG). However, the authors noted that criteria for AG responses and the more
pathological scores on the MOA were highly overlapping. Additionally, COP scores
were significantly and positively correlated with the Reciprocity-Mutuality scores on the
MOA. They specifically noted that even within disturbed individuals, a range of MOA
scores was found in that some of their object responses were nonpathological. Neither
the Rorschach CS special scores nor high levels of pathological MOA scores were able to
distinguish among the groups with different disorders; however, the authors concluded
that the MOA would likely be useful in distinguishing nonpatient individuals from those
with severe psychopathology.
Research with adolescents and children
Urist and Shill (1982) conducted a study to examine the applicability of the MOA
with adolescents in an inpatient facility or an outpatient facility with a variety of
psychological difficulties. Instead of an autobiographical task and staff ratings, the
researchers rated the adolescents’ clinical records in addition to their Rorschach

70
responses using the MOA. Similar to the previous study (Urist, 1977), researchers found
the MOA scores for Rorschach responses correlated positively and significantly with the
MOA scores for the clinical records. The authors wrote that the MOA likely measures a
person’s internal perceptions of relationships with others.
To expand on the research and examine how the MOA scale works among
children, Ryan, Avery, and Grolnick (1985) examined the utility of the MOA with 60
children in grades four through six. The children were administered the Rorschach and a
self-report measure of perception of control in everyday events. Teachers rated the
children on achievement, intelligence, classroom attention, social competency, self-
esteem, and collaborative behavior with others. The researchers also examined children’s
grades and achievement test scores. Low MOA scores were significantly related to
teacher’s ratings of children’s self-esteem and ability to work well with other children
while they were not correlated significantly with teacher’s ratings of achievement and
intelligence. High MOA scores were significantly related to children’s perceptions that
others had more power than them and that other, unknown sources of power were
affecting them in social areas. The authors concluded that children with lower MOA
scores were likely to have object relations that show greater development and were likely
to be perceived by others as more socially competent than children with higher MOA
scores. Interestingly, children with higher MOA scores also were more likely to believe
that more powerful others or unknown forces were controlling the outcomes of their
social relationships.
Brown-Cheatham (1993) studied the utility of the MOA with two groups of
African-American children in which their fathers were either voluntarily or involuntarily
71
absent. As predicted, the children whose father was involuntarily absent had a
significantly lower level of object relations as measured by the MOA than children whose
father had left voluntarily. Additionally, children whose father had never lived with the
child had a significantly lower MOA than children whose father lived with them prior to
leaving the family unit.
In a review of studies examining the MOA, Tuber (1992) concluded that the
MOA is useful for assessing object relations among children in a variety of different
situations, such as inpatient treatment and in nonpatient settings.
The Human Representational Variable
Perry and Viglione (1991) noted that previous methods of assessing object
relations on the Rorschach were limited. They suggested that one limitation was that
people who used the methods developed by Blatt et al. (1976) and Urist (1977) to assess
object relations often drew inaccurate conclusions that a “direct relationship between
internalized processes and projected percepts exist[s]” (p. 490) (Perry & Viglione, 1991).
Additionally, the authors suggested that ignoring percepts that involve animals engaging
in human activity and percepts that involve only part of a human (e.g., leg, head) would
dismiss possible valuable data about an individual’s object relations.
To remedy their concerns, Perry and Viglione (1991) created two new Rorschach
variables to assess object relations: good human experience (GHE) and poor human
experience (PHE). The human experience variable (HEV) was calculated by subtracting
the standardized sum of GHE responses from the standardized sum of PHE responses.
The authors noted that the GHE and PHE variables represented an individual’s
internalized “object relations” (p. 490) or how a person perceives interactions with others

72
in his or her environment. The HEV, GHE, and PHE variables were one set of variables
comprising the Ego Impairment Index (EII), which contains variables that examine
cognitive distortion, object relations, reality testing, and defenses.
Perry and Viglione (1991) examined the level of “ego impairment” (p. 492) (i.e.,
how limited an individual is in managing stressors and demands both internally and
externally) with the EII in adults (17 men and 32 women) with a diagnosis of major
depression, melancholic type in an outpatient university clinic. The Rorschach and self-
report measures were administered prior to and nine weeks after treatment with one of
several tricyclic antidepressant medications. Results indicated that adults with low scores
on the EII, indicative of less ego impairment, reported significantly fewer somatic
symptoms of depression than those with high scores on the EII at nine-week follow-up.
In addition, the EII was stable over time; the mean score on the EII did not change from
the first Rorschach testing to the second. The authors concluded that the EII was
measuring a stable personality characteristic. Notably, the GHE and PHE variable
accounted for most of the variance in the EII. They were cautious in interpreting this
finding and asserted that further research to determine the meaning of the HEV should be
conducted.
Perry, McDougall, and Viglione (1995) conducted a five-year follow-up study on
the same group of adults with major depression (n = 17) to examine the temporal stability
of the EII. The correlation between the initial HEV scores and the follow-up HEV scores
was significant (r = .57, p < .025) as was the correlation between the initial GHE scores
and follow-up GHE scores (r = .48, p < .025). However, the correlation between the

73
initial PHE and follow-up PHE scores was not statistically significant (r = .37, p > .025),
indicating that scores on the PHE variable were not stable over time.
A handful of other studies have examined the use of the EII in other groups. In
1992, Perry, Viglione, and Braff decided to validate the use of the EII with a group of 28
adults with schizophrenia. Seventeen were being treated in an inpatient facility while 11
were being treated in an outpatient facility or were not currently being treated. They
found that the factor structure of the EII was similar among adults with schizophrenia and
adults with major depression from the previous study.
Perry & Braff (1994) studied the relation between thought disorder symptoms and
information-processing distortions in a group of 52 adults diagnosed with schizophrenia
(34 men and 18 women). Thirty-three were being treated in an inpatient facility, and 19
were being treated on an outpatient basis or were not currently in treatment. Only seven
were not taking any form of anti-psychotic medication. The authors used EII,
particularly the HEV, and three other measures to assess thought disorder and used three
measures to assess information-processing difficulties, a “visual masking backward task
and the prepulse inhibition of acoustic and tactile stimuli” (p. 364). The results suggested
that the PHE variable of the HEV correlated significantly and negatively with
performance on the three information-processing tasks. In addition, the overall HEV was
significantly and negatively correlated with the visual backward masking task. In
explaining the results, the authors noted that the nature of the task on the Rorschach
Inkblot Test involves an individual having to encode ambiguous stimuli, process them,
and produce a response to the stimuli. They inferred that because the HEV variable,
particularly the PHE, had a significant, negative relationship with the information-

74
processing tasks in the study, the EII, especially the HEV, is likely a measure of “how a
subject uses internal constructs to interpret. . . stimuli” (p. 366) in the environment. They
added that the HEV might be useful in detecting information-processing difficulties in
individuals with schizophrenia.
Perry, Moore, and Braff (1995) wanted to determine if gender differences could
be found on the EII among adults with schizophrenia. Eighty-seven adults (34 women
and 53 men) in an acute or long-term inpatient facility were administered measures that
tapped thought disturbance and social competency. Men with schizophrenia were found
to have significantly greater thought disturbance than women with schizophrenia as
measured by the EII. Interestingly, the EII was significantly correlated with the measure
of social competence (r = -.42), indicating that thought disturbance and social
competency are highly and negatively correlated. This finding indirectly supports the
earlier findings that suggested that the HEV is measuring how an individual uses internal
constructs in making sense of ambiguous stimuli in the environment and possibly the
quality of the individual’s interpersonal relationships (Burns & Viglione, 1996; Perry &
Braff, 1994).
Adrian and Kaser-Boyd (1995) examined the utility of the EII in a heterogeneous
group of adults (41 men and 44 women) in outpatient and inpatient treatment. The adults
were also grouped into psychotic and non-psychotic groups. They found that although
the EII did not distinguish between psychotic and non-psychotic groups, the EII
significantly distinguished inpatient from outpatient groups with the outpatient group
scoring significantly lower on the EII than the inpatient group. Scores on the GHE
variable significantly differentiated the psychotic and non-psychotic groups with the
75
psychotic group having a significantly lower mean score on the GHE variable. The
authors concluded that the HEV, particularly the GHE, is particularly important in the
assessment of ego functioning.
Building on the previous research that highlighted the strength of the HEV, Burns
and Viglione (1996) conducted a study to determine if the HEV was actually associated
with “the quality of an individual’s interpersonal relationships” (p. 92) among adult,
female nonpatients (n = 70). The participants were divided into high and low
interpersonal relationship quality groups based on a composite score of self- and spouse-
report measures of attitudes toward others and actual interpersonal behaviors. Results
suggested that the HEV made a statistically significant contribution to predicting whether
an individual would belong to the high or low interpersonal relationship quality group
beyond the contributions made by demographic variables, by nonhuman representational
responses, and by other Rorschach indicators of pathology (e.g., WSUM6 and X-%).
They also conducted goodness-of-fit tests to determine how well the predictors fit the
current data and found that the HEV was better at differentiating groups than the other
variables (e.g., WSUM6, nonhuman representational responses, medication stability),
indicating that the relation between HEV and quality of interpersonal relationships was
“practically meaningful” (p. 97).
Despite the initial support for the validity of the HEV, GHE, and PHE, Wood et
al. (1999) expressed concern about the Burns and Viglione (1996) study. First, they
noted that one of the self-report measures used to establish two interpersonal relatedness
groups was not a statistical or face valid indicator of interpersonal relationship quality. In
addition, they stated that the authors combined self-report questionnaires that measure
76
different constructs to establish a score of interpersonal relatedness, creating a variable
that was “nearly impossible to interpret” (p. 118). Third, Wood et al. stated that Burns
and Viglione’s two equivalent methods (i.e., z-score and weighting methods) for
calculating the HEV did not, in fact, produce equivalent results. A fourth criticism of
Burns and Viglione’s study was that they dropped the participants who scored in the
middle-range of interpersonal relatedness on the self- and other-report measures in
creating the groups. If the middle group was dropped and the relationship between the
HEV variable and interpersonal relatedness were nonlinear, then, the form of the
relationship could not be detected. Additionally, the size of the effects could not be
determined by dropping the participants who scored in the middle on interpersonal
relatedness. Wood et al. also pointed out that the authors did not correct for the use of
multiple predictors in their regression analyses. Finally, they criticized Burns and
Viglione’s use of logistic regression analyses with backward elimination, which “appears
to be an unusual combination of two different procedures” (Wood et al., 1999, p. 122)
that “have entirely different purposes and interpretations” (p. 121). Wood et al. re-
interpreted the results by examining the data published by Burns and Viglione and
determined that the results did not support the authors’ hypothesis that the HEV provides
a useful predictor for human relationship quality.
Although Wood and colleagues (1999) expressed concerns about the HEV, GHE,
and PHE variables, Exner (2000) introduced the GHE and PHE into the CS. He changed
the calculation of the variables, eliminating the weighting of the raw scores and altering
the variable names to good human response (GHR) and poor human response (PHR) (see
Appendix B). Exner (2003) noted that the two variables are best interpreted in terms of
77
their relationship to one another, rather than as a raw score difference. In addition, they
are best interpreted if a person has at least three human responses in his or her protocol.
With regard to interpretation, Exner explained that the presence of several GHR
responses in a protocol indicates that individuals are likely “well regarded by others and
their interpersonal activities tend to be relatively free of chaos” (p. 511). Although low
numbers of responses coded GHR generally appear in protocols of individuals with
severe psychopathology, individuals with disorders that have less influence on
interpersonal relationships may have several answers coded GHR (Exner, 2000). People
who give multiple responses coded PHR tend to have “patterns of interpersonal behavior
that are ineffective or maladaptive” and “interpersonal histories that are marked by
conflict and/or failure” (Exner, 2003, p. 511). Exner explained that although responses
coded PHR may occur in low numbers among nonpatient groups, multiple PHR answers
may be found in groups with severe psychopathology. If an individual gives relatively
more GHR responses than PHR responses, Exner states, “It can be assumed that the
individual generally engages in forms of interpersonal behaviors that are likely to be
adaptive for the situation” (p. 512). On the other hand, if the individual gives more PHR
responses than GHR, “the individual is prone to engage in forms of interpersonal
behaviors that are likely to be less adaptive for the situation than might be desirable” (p.
512).
Future Research and Clinical Considerations
The HRV is a variable that developed out of previous research using the
Rorschach to assess object relations, particularly the MOA (Urist, 1977). The variable is
also rooted in research on the EII (Perry & Viglione, 1991). When the human experience
78
variable of the EII emerged as a strong variable for assessing social difficulties in various
groups, Exner added the variable to the CS, changing the criteria for GHR and PHR
(Exner, 2000). Based on initial research findings, the HRV seems to have some utility in
assessing individual’s object relations. However, the research on this new CS variable is
scant, especially since Exner revised the scoring criteria for GHR and PHR (Exner,
2000). In addition, the one study (Burns & Viglione, 1996) that focused solely on the
variable had several methodological limitations as discussed by Wood et al. (1999).
Research should be done in a variety of different settings with adults, adolescents and
children and should be conducted attempting to correct for some of the previous
methodological problems of the previous studies. Importantly, if researchers study
clinical groups, they should not use the CS norms as a control group but should include a
matched control group. The interrater and test-retest reliability of the HRV needs to be
established as does construct validity.
Peer Nomination and Sociometric Status
Over the last few decades, the use of sociometrics has been a focus of research on
peer relations and how peer relations affect the social and emotional development of
children (Newcomb, Bukowski, & Pattee, 1993). Typically, a two-dimensional model of
sociometric classification has been utilized. One of the most used two-dimensional
models is the model developed by Coie, Dodge, and Coppotelli (1982). In their model,
children nominate their peers as “most liked” and “least liked.” Then, the nominations
are examined for social preference and social impact (Newcomb, Bukowski, & Pattee,
1993). Social preference is the likeability of a particular child and is determined by the
number of “most liked” nominations minus the number of “least liked” nominations.
79
Social impact is the social visibility of a given child and is determined by the number of
“most liked” nominations plus the number of “least liked” nominations.
Children are then assigned to sociometric groups based on their social preference
and social impact scores (Cillessen & Bukowski, 2000). Children who attain very few
negative nominations from their peers and several positive nominations have a high
impact and high preference and are given a popular status. Children who get several
negative nominations and few positive ones have a high impact and low preference and
are given a rejected status. Controversial children receive several positive and negative
nominations, having a high impact and average preference, while neglected children
receive few positive and negative nominations, having a low impact and preference.
Children who receive an average number of positive and negative nominations are
considered average.
Considerable research has been done on the different sociometric status groups to
determine the behavioral, emotional, and social correlates of each status group. Some of
the research on the popular and rejected status groups will be reviewed in order to give an
overview of the correlates pertinent to the current study.
Review of the Recent Literature on Popular and Rejected Children
In 1993, Newcomb, Bukowski, and Pattee conducted a meta-analysis on 41
studies using the two-dimensional sociometric models. They wanted to examine the
behavioral patterns associated with the different sociometric status groups at both a broad
behavioral level (e.g., aggression, withdrawal, sociability, cognitive abilities) and more
specific behaviors associated with each broad level (e.g., types of behavior associated
with aggression). Compared with children in the average status group, children in the

80
popular status group were found to have “higher levels of sociability and cognitive
abilities and lower levels of aggression and withdrawal” (p. 118). The popular children
also showed greater positive social actions and traits, greater social problem solving
skills, and more friendships relative to average children. The authors concluded that
popular children’s greater levels of positive social and problem-solving skills and lower
levels of aggressive behavior made “them ideal candidates for status as a preferred peer”
(p. 119).
With regard to children with a rejected sociometric status, Newcomb, Bukowski,
and Pattee (1993) found that rejected children have lower cognitive abilities and
sociability and greater levels of aggression and withdrawal than average children. In
terms of aggression, rejected children showed higher levels of physical aggression,
disruptive aggression, and negative behavior than average children without positive
social traits, actions, and friendships to balance them out. In addition, rejected children
had higher levels of depression and anxiety than average children. The authors
summarized by saying that rejected children’s social behaviors may be more
unpredictable than average children’s whether due to social anxiety, social ineptness,
and/or aggression.
Other researchers studied two different types of rejected children: children who
were rejected and aggressive and children who were rejected and nonaggressive. For
instance, Cillessen, vanIjzendoorn, Lieshout, and Hartup (1992) studied rejected boys and
popular boys who were in kindergarten and first grade. They identified several subtypes
of rejected boys based on play observations, peer ratings, and teacher judgments. One
subtype (n = 47) included boys that were more aggressive, had fewer relationships and

81
did not believe they were rejected relative to popular boys. Another subtype (n = 13)
involved boys who were shy, had few friendships, and perceived themselves as rejected
relative to popular boys. Two other less rejected subtypes included a more antisocial
subgroup of rejected children and a subgroup whose members scored more moderately on
the variables of aggressiveness, shyness, and perceived rejection. Additionally, the
aggressive rejected boys and the shy rejected boys were found to be less cooperative than
the popular boys. The aggressive rejected boys were also more disruptive, impulsive,
hypersensitive, imbalanced, and dishonest than popular boys. The shy rejected boys were
also more hypersensitive and imbalanced than popular boys. The authors found that the
two less rejected subtypes were similar to the popular boys on most variables. They
concluded that boys classified as rejected were heterogeneous in terms of their social
behavior.
Wentzel and Asher (1995) examined children’s social adjustment in the school
environment to determine if sixth and seventh grade children from the five sociometric
statuses differed. In addition, the authors wanted to build on research that was done by
Parkhurst and Asher (1992) that found there were two distinct types of rejected children:
rejected aggressive and rejected submissive. Relative to average children, popular
children were found to be seen as more helpful to other children and were nominated
more often as good students by their peers. On the other hand, rejected aggressive
children were perceived by teachers as impulsive and non-independent learners, reported
that they were less interested in schoolwork, and were seen by others as more likely to
start fights and as less considerate than average children. They were less likely to be

82
nominated as a good student by their peers. Interestingly, rejected nonaggressive
children did not differ from average children on any variables.
In an attempt to further delineate differences between rejected aggressive and
rejected nonaggressive youth, Inderbitzen, Walters, and Bukowski (1997) studied the role
social anxiety played in differentiating the different sociometric status groups in
adolescents in the sixth and ninth grade. The authors controlled for gender differences
because girls reported higher levels of social anxiety than boys on the self-report measure
of social anxiety used in the study. Even controlling for gender differences, adolescents
who were rejected reported having higher social anxiety than adolescents with a
sociometric status of popular, average, or controversial. Rejected adolescents also
reported greater fear of negative evaluation relative to adolescents who were popular,
average, or controversial and had greater general social distress and avoidance than
popular children. In examining the differences between the rejected aggressive and
rejected submissive subgroups, the investigators found that the rejected submissive
adolescents reported a greater fear of negative evaluation than the average adolescents.
The rejected aggressive adolescents had more moderate fear of negative evaluation scores
but did not show a statistically significant difference from the rejected submissive
adolescents. However, the rejected submissive adolescents indicated greater general
social distress and avoidance than rejected aggressive and average adolescents. When
sociometric nominations were investigated, rejected aggressive adolescents were
perceived as fighting more often than average, neglected, and rejected submissive
adolescents while rejected submissive adolescents were perceived as more easily taken
advantage of than neglected, average, and rejected aggressive adolescents. The authors

83
believed that the differences among subtypes of rejected adolescents showed that
adolescents and children are rejected for differing reasons that should be targeted in
interventions tailored for rejected children. For instance, they suggested that rejected
submissive children might benefit from learning to cope with and ease social anxiety and
withdrawal in addition to basic social skills training.
Duncan and Cohen (1995) studied how children with different social statuses in
first through sixth grade rated liking their peers. They found that sociometric status did
affect children’s “liking” ratings. Popular children rated their peers higher in likeability
than average children, and average children rated their peers higher than rejected
children. The authors believed that the findings corroborated data from other research
that showed popular children receive and give positive social behaviors more often than
other children.
George and Hartmann (1996) hypothesized that fifth and sixth grade children who
had a popular sociometric status would have more reciprocal friends and would be more
likely to have at least one reciprocal friend than children who were unpopular. Although
all children in the study reported having at least one friend, results confirmed the
hypothesis that unpopular children were less likely to have a reciprocal friend while
popular children were more likely to have a reciprocal friend. Other characteristics of the
children’s friendship networks were also explored. Unpopular children were also found
to have one-third of the reciprocal friendships that popular children had. The
investigators then controlled for the differences in percentage of friendship networks and
found similar results. Both unpopular and average children had fewer reciprocal friends
than popular children. Children who were unpopular were also found to have fewer

84
same-age friends relative to popular and average children and had a greater number of
friends who were younger relative to popular children. Unpopular children reported
having more friends outside their school than popular and average children. With regard
to the status of their friends, children who were unpopular reported having fewer popular
friends, more unpopular friends, and fewer friends of the opposite sex than children who
were popular. The authors suggested that a broader view of children’s friendship
networks be considered in future research and interventions, emphasizing that unpopular
children do have friendships that could be built upon.
Gest, Graham-Bermann, and Hartup (2001) also studied children’s number of
friends, social network centrality, and sociometric status in a sample of second and third
graders. A child’s network centrality was described as the number of times that peers in
the classroom wrote down the name of that child as a member of an informal peer group
through free recall. Children who were frequently listed by their classmates were seen as
“socially salient” (p. 25) while children who were rarely listed were seen as less salient.
Social network isolation was defined as the total number of times that a child was named
as not having a group. The authors hypothesized that network centrality, number of
friendships, and number of “liked” nominations would be related to peer leadership and
aggression. Results indicated that popular children were more likely to have high
network centrality while rejected children were more likely to have low network
centrality. Additionally, popular children had the highest level of reciprocal friendships
while rejected and neglected children had the lowest. Network centrality and network
isolation were positively associated with aggression and disruptiveness but in different
ways. Network centrality was associated with the teasing, showing off, and bossing
85
aspects of aggressiveness while network isolation was more associated with the losing
temper and getting into fights aspects of aggressiveness. The authors speculated that the
aggressiveness associated with network centrality might be part of the context of children
vying for social dominance in the classroom.
In a study on temperament and social status, Walker, Berthelsen, and Irving
(2001) predicted that popular children in preschool would exhibit fewer difficult
temperamental characteristics (e.g., high activity level, negative mood, and high
distractibility) relative to rejected children. Compared with popular children, rejected
children showed higher overall task distractibility, including more specific behaviors of
lower task persistence, higher activity rates, and higher distractibility. Additionally,
rejected children showed greater overall personal and social inflexibility relative to
popular children. In terms of the inflexibility, rejected children exhibited a more negative
mood and lower adaptability compared to popular children. The investigators concluded
that children’s temperamental characteristics likely play a significant part in their
interactions with their peers at a young age and in the future. For instance, a rejected
child might be rejected for temperamental reasons and not develop the social skills
needed to develop peer relationships as the child grows older. Like previous researchers,
they called for interventions to help children who are rejected develop the social skills
needed to have healthy peer relationships as they get older.
Peterson and Siegal (2002) also studied rejected and popular preschool-aged
children with a focus on how children perceive the difference between lying and someone
making a mistake, their peer relationships, and their theory of how the mind develops.
Results indicated that compared with popular children, children who were rejected and

86
did not have stable friendships had more difficulty distinguishing between a lie and a
mistake. If rejected children had a reciprocated, long-term friendships, they were able to
distinguish between a lie and mistake just as readily as popular children. The authors’
findings are consistent with the findings of George and Hartmann (1996) who found that
not all unpopular children are devoid of friendships and that these friendships may serve
as a protective factor in rejected children’s peer relationships.
Summary
Overall, research on popular and rejected children has shown that the groups are
uniquely different from one another. Popular children have more reciprocal, stable
friendships, more positive social skills and actions, and better problem-solving skills
(Cillessen et al., 1992; Newcomb et al., 1993). They are more often perceived as helpers
and good students, rate their peers as higher in likeability, are more flexible and less
distractible, and are less socially anxious than rejected children (Duncan & Cohen, 1995;
Inderbitzen et al., 1997; Walker et al., 2001; Wentzel and Asher, 1995).
Rejected children have lower levels of sociability and cognitive abilities, rate their
peers lower in likeability, are less likely to have reciprocal and long-term friendships with
same-aged peers, have higher social isolation, have lower network centrality, show more
distractibility, have lower flexibility, and have a more difficult time distinguishing lies
from mistakes at a young age (Duncan & Cohen, 1995; George & Hartmann, 1996; Gest
et al., 2001; Newcomb et al., 1993; Peterson & Siegal, 2002; Walker et al., 2001).
Research has also shown that rejected children can also be divided into two subgroups:
aggressive and nonaggressive (Cillessen et al., 1992; Inderbitzen et al., 1997; Wentzel &
Asher, 1995). Rejected aggressive children have been shown to be more aggressive,

87
disruptive, impulsive, hypersensitive, and dishonest. Teachers perceive them as less
interested in schoolwork, more likely to start fights, and less considerate of others.
Rejected nonaggressive children are characterized as being shy, withdrawn,
hypersensitive, and socially anxious. They are similar to their average status peers in that
they have similar levels of interest in schoolwork and are not as likely to start fights.

88
APPENDIX B
CRITERIA FOR THE GOOD HUMAN EXPERIENCE (GHE) AND POOR HUMAN
EXPERIENCE (PHE) VARIABLES (PERRY & VIGLIONE, 1991)
Criteria for GHE:
1. Full human responses with a form quality (FQ) score of ordinary or plus and that
do not have an aggressive movement (AG) score or a cognitive slippage special
score (other than a DV).
2. Human responses that are partial or fictitious and that are perceptually accurate
popular responses. They cannot contain cognitive slippage special scores or AG
scores.
3. Animal (FM) or human (M) movement responses that contain cooperative
movement (COP). Level 1 special scores can be included but level 2 special
scores are not acceptable to score a response as a GHE.
Criteria for PHE:
1. All responses that include M and/or human content, which have a FQ score of
minus.
2. Human responses that are partial or fictitious and that are not popular responses.
3. A M response that does not involve a whole human response (unless it is scored
COP).
4. An AG response.
5. Any human content response that is scored popular and/or COP and that also has
a level 2 special score.
89
APPENDIX C
STEPS FOR SCORING THE GOOD HUMAN RESPONSE (GHR) AND POOR
HUMAN RESPONSE (PHR) VARIABLES (EXNER, 2003)
1. Score GHR for answers with Pure H content that also contain:
a) Form Quality of FQ+, FQo, or FQu.
b) No cognitive special scores (except DV).
c) No aggressive movement (AG) or morbid (MOR) special scores.
2. Score PHR for answers with either:
a) FQ- or Fqnone (no form) OR
b) FQ+, FQo, or FQu and have an ALOG, CONTAM or a level 2 special
score.
3. Score GHR for any other responses containing human content that have a
cooperative movement (COP) score but not AG.
4. Score PHR for any other response containing human content that has either:
a) FABCOM or MOR special scores OR
b) A content code of anatomy (An).
5. Score GHR for any other human content responses to cards III, IV, VII, and IX
that have a Popular code.
6. Score PHR for any other human content responses that have any of the following:
a) Special scores of AG, INCOM, or DR.
b) A content code of Hd, not including (Hd) codes.
7. Score GHR for any human content responses that remain.

90
APPENDIX D
PEER NOMINATION QUESTIONNAIRE (CRICK & GROTPETER, 1995; POPE,
BIERMAN, & MUMMA, 1991)
1. Which of the people in your class do you like to play with or do activities with the
most?
2. Which of the kids in your class do you like to play with or do activities with the
least?
3. Find the number of three kids who you think would make good leaders if you
were playing a game.
4. Find the number of three kids who try to make other kids not like a certain person
by spreading rumors about them or talking behind their backs.
5. Find the numbers of three kids who hit, kick, or punch other kids at school.
6. Find the numbers of three kids who say or do nice things for other kids.
7. Find the numbers of three kids who, when they are mad at a person, get even by
keeping that person from being in their group of friends.
8. Find the numbers of three kids who say mean things to other kids to insult them or
put them down.
9. Find the numbers of three kids who help out others when they need it.
10. Find the numbers of three kids who, when they are mad at a person, ignore the
person or stop talking to them.
11. Find the numbers of three kids who push and shove other kids around.

91
12. Find the numbers of three kids who tell their friends that they will stop liking
them unless the friends do what they say.
13. Find the numbers of three kids who try to cheer up other kids who are upset or sad
about something. They try to make the kids feel happy again.
14. Find the numbers of three kids who tell others that they will beat them up unless
the kids do what they say.
15. Find the numbers of three kids who try to keep certain people from being in their
group when it’s time to play or do an activity.
16. Find the numbers of three kids who call others mean names.
17. Find the numbers of three kids who are out of their seat a lot.
18. Find the numbers of three kids who play the clown and try to get others to laugh.
19. Find the numbers of three kids who act like babies.
20. Find the numbers of three kids who get upset when they are called on to answer
questions in class.

92
APPENDIX E
OTHER RORSCHACH VARIABLES RELEVANT TO THE CURRENT STUDY
(EXNER , 2003)
1. The aggressive movement (AG) special score is assigned when any type of
movement (i.e., human, animal, inanimate object movement) is present in a
response that involves aggressive action (e.g., yelling, glaring, fighting).
According to Exner (1993), increases in the number of AG responses are
indicative of greater likelihood of nonverbal and verbal aggression and more
negative or hostile attitudes toward others.
2. The cooperative movement (COP) special score is assigned when any type of
movement (i.e., human, animal, inanimate object movement) is present in a
response that involves two or more objects/animals/people who are engaging
in a positive or cooperative interaction (e.g., two women lifting a pot, two
bears dancing). According to Exner (1993), increases in the number of COP
responses are indicative of greater social competence and positive interactions
with others.
3. A movement response is scored active if the movement involves dynamic
activity (e.g., running, dancing, carrying, quivering) and passive if the
movement involves inert activity (e.g., hanging, lying down, leaning, waiting).
According to Exner (1993), individuals who produce more passive than active
movement responses tend to be more passive in relationships with others.

93
4. A response is coded with white space (S) if a person incorporates white space
on a card into his or her response (e.g., white eyes). According to Exner
(1993), S responses are indicative of hostility and anger in regard to
interpersonal relationships.
5. Color responses in which chromatic color is the primary justification for a
response may or may not involve form (i.e., CF and C versus FC). C is scored
when a response does not involve form while CF is scored when the
justification for a response is primarily chromatic color but also uses form.
According to Exner (1993), CF and C scores represent less control over
emotional states relative to FC scores. If a person displays more CF and C
scores, then he or she may tend to be overwhelmed by feelings.
6. The affective ratio (Afr) is calculated by dividing the number of responses
given to cards VIII, IX, and X by the number of responses given to cards I, II,
III, IV, V, IV, and VII. According to Exner (1993), a high Afr is indicative of
“overresponsiveness” (p. 497) to stimuli that are emotion-laden while a low
Afr is indicative of avoidance of emotion-laden stimuli.
7. The isolation index (Isolate/R) is calculated by summing the number of
responses with content codes of botany (Bt), clouds (Cl) (multiplied by two),
geology (Ge), landscape (Ls), and nature (Na) (multiplied by two) and
dividing that sum by the total number of responses on a protocol. According
to Exner (1993), when the isolation index is between .25 and .32, a person is
likely less involved in interactions with others. If the isolation index is .33 or
above, he or she is likely isolated from others. Exner suggested that elevated

94
isolation index scores are not necessarily indicative of social conflict or
difficulties.

95
Table 1. Group frequencies
Group Grade Sex _______________ _________________ 4 5 6 Male Female
Popular 0 17 10 11 16
Rejected nonaggressive 0 11 9 10 10
Rejected aggressive 1 5 3 6 3
Total 1 33 22 27 29

96
Table 2. Means, standard deviations, and ANOVAs of the Rorschach variables for children tested at home or at school ________________________________________________________________________________________________
Group
______________________________________
Home (n = 4) School (n = 52) ANOVA
Rorschach ______________ _______________ __________________________
Variable M SD M SD F df ω2
________________________________________________________________________________________________
PHR 7.25 5.06 2.44 2.42 12.34a 1, 54 .17
GHR 1.75 1.71 2.37 1.80 .44 1, 54 .01
Percent PHR .82 .17 .50 .33 3.60 1, 53 .05
Percent GHR .18 .17 .50 .33 3.60 1, 53 .05
AG 1.25 1.89 .23 .47 9.48b 1, 54 .13
COP 1.25 1.26 .50 .75 3.34 1, 54 .04
_________________________________________________________________________________________________
(continued)

97
Table 2. Continued
_________________________________________________________________________________________________
Passive 2.75 .96 1.62 1.46 2.33 1, 54 .02
Active 6.50 5.20 4.13 2.64 2.58 1, 54 .03
P minus A -3.25 5.68 -2.27 2.84 .38 1, 54 .01
S 8.00 4.55 3.15 1.97 18.06a 1, 54 .23
CFC 2.50 1.29 1.08 1.33 4.29c 1, 54 .06
Percent CFC .56 .31 .34 .34 1.58 1, 46 .01
Afr .43 .22 .51 .14 .92 1, 54 .00
Isolate/R .28 .26 .21 .15 .75 1, 54 .01
_______________________________________________________________________________________________
Note. PHR = Poor Human Representation responses; GHR = Good Human Representation responses; AG = Aggressive Movement
responses; COP = Cooperative Movement responses; Passive = Passive Movement responses; Active = Active Movement responses;
P minus A = Passive minus Active Movement responses; S = White Space responses; CFC = Pure C + Color-Form responses; Percent
CFC = Percentage of Color responses that are Dominant Color responses; Afr = Affective Ratio; Isolate/R = Isolation Index. ω2 is the
proportion of the variability in scores produced by differences among the groups (Keppel, 1991, pp. 63-68).
ap < .001, bp < .01, cp < .05.

98
Table 3. Mean ranks and chi-squares on the Rorschach variables for children tested at home or at school
________________________________________________________________________________________________
Group
______________________________________
Home (n = 4) School (n = 52) Kruskal-Wallis
Rorschach ______________ _______________ __________________________
Variable Mean rank Mean rank χ2 df
________________________________________________________________________________________________
PHR 46.13 27.14 5.18a 1
GHR 23.75 28.87 .38 1
Percent PHR 42.63 26.85 3.64 1
Percent GHR 13.38 29.15 3.64 1
AG 37.25 27.83 2.30 1
COP 39.25 27.67 2.47 1
_________________________________________________________________________________________________
(continued)

99
Table 3. Continued
_________________________________________________________________________________________________
Passive 42.75 27.40 3.48 1
Active 36.13 27.91 .96 1
P minus A 29.25 28.44 .01 1
S 47.50 27.04 6.04b 1
CFC 44.13 27.30 4.38a 1
Percent CFC 32.50 23.77 1.49 1
Afr 20.13 29.14 1.15 1
Isolate/R 31.63 28.26 .16 1
_______________________________________________________________________________________________
Note. PHR = Poor Human Representation responses; GHR = Good Human Representation responses; AG = Aggressive Movement
responses; COP = Cooperative Movement responses; Passive = Passive Movement responses; Active = Active Movement responses;
P minus A = Passive minus Active Movement responses; S = White Space responses; CFC = Pure C + Color-Form responses; Percent
CFC = Percentage of Color responses that are Dominant Color responses; Afr = Affective Ratio; Isolate/R = Isolation Index.
ap < .05, bp < .01.
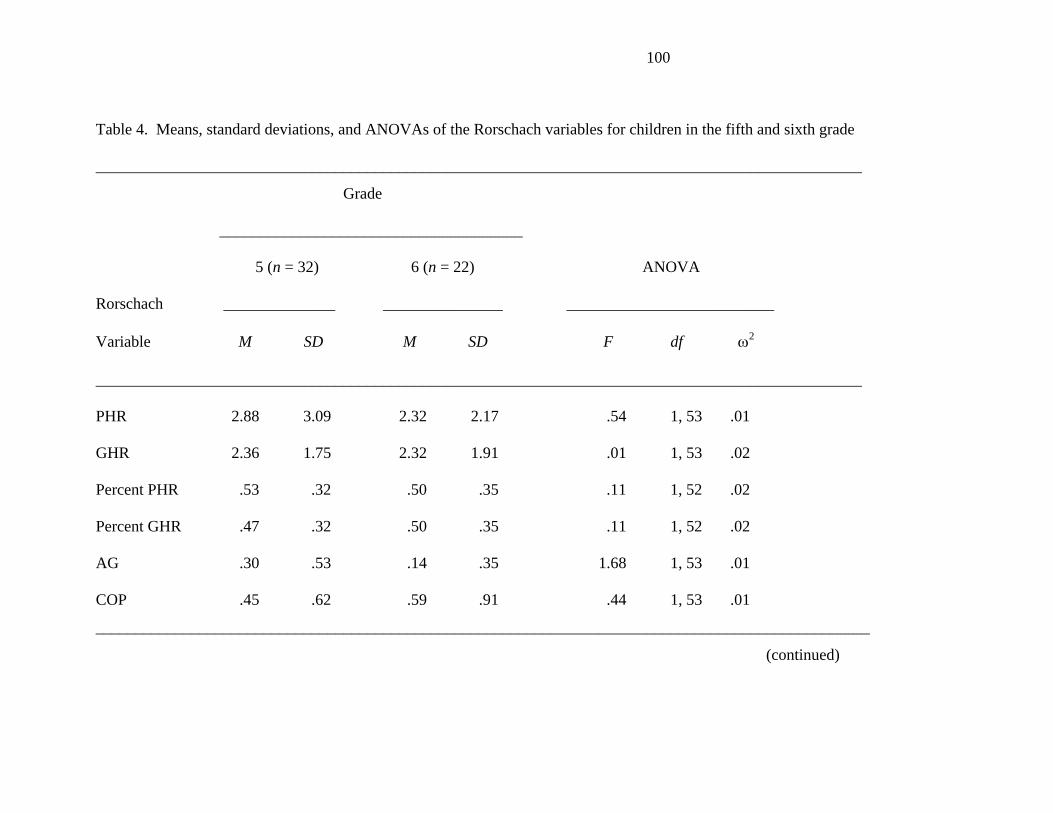
100
Table 4. Means, standard deviations, and ANOVAs of the Rorschach variables for children in the fifth and sixth grade
________________________________________________________________________________________________
Grade
______________________________________
5 (n = 32) 6 (n = 22) ANOVA
Rorschach ______________ _______________ __________________________
Variable M SD M SD F df ω2
________________________________________________________________________________________________
PHR 2.88 3.09 2.32 2.17 .54 1, 53 .01
GHR 2.36 1.75 2.32 1.91 .01 1, 53 .02
Percent PHR .53 .32 .50 .35 .11 1, 52 .02
Percent GHR .47 .32 .50 .35 .11 1, 52 .02
AG .30 .53 .14 .35 1.68 1, 53 .01
COP .45 .62 .59 .91 .44 1, 53 .01
_________________________________________________________________________________________________
(continued)

101
Table 4. Continued
_________________________________________________________________________________________________
Passive 1.61 1.52 1.73 1.32 .09 1, 53 .02
Active 4.06 3.07 4.27 1.91 .08 1, 53 .02
P minus A -2.24 2.83 -2.09 2.93 .04 1, 53 .02
S 3.61 2.87 3.36 1.99 .12 1, 53 .02
CFC 1.03 1.26 1.27 1.42 .44 1, 53 .01
Percent CFC .37 .33 .32 .33 .21 1, 45 .02
Afr .47 .13 .56 .15 6.35a 1, 53 .09
Isolate/R .21 .16 .21 .15 .00 1, 53 .02
_______________________________________________________________________________________________
Note. PHR = Poor Human Representation responses; GHR = Good Human Representation responses; AG = Aggressive Movement
responses; COP = Cooperative Movement responses; Passive = Passive Movement responses; Active = Active Movement responses;
P minus A = Passive minus Active Movement responses; S = White Space responses; CFC = Pure C + Color-Form responses; Percent
CFC = Percentage of Color responses that are Dominant Color responses; Afr = Affective Ratio; Isolate/R = Isolation Index. ω2 is the
proportion of the variability in scores produced by differences among the groups (Keppel, 1991, pp. 63-68).
ap < .05.
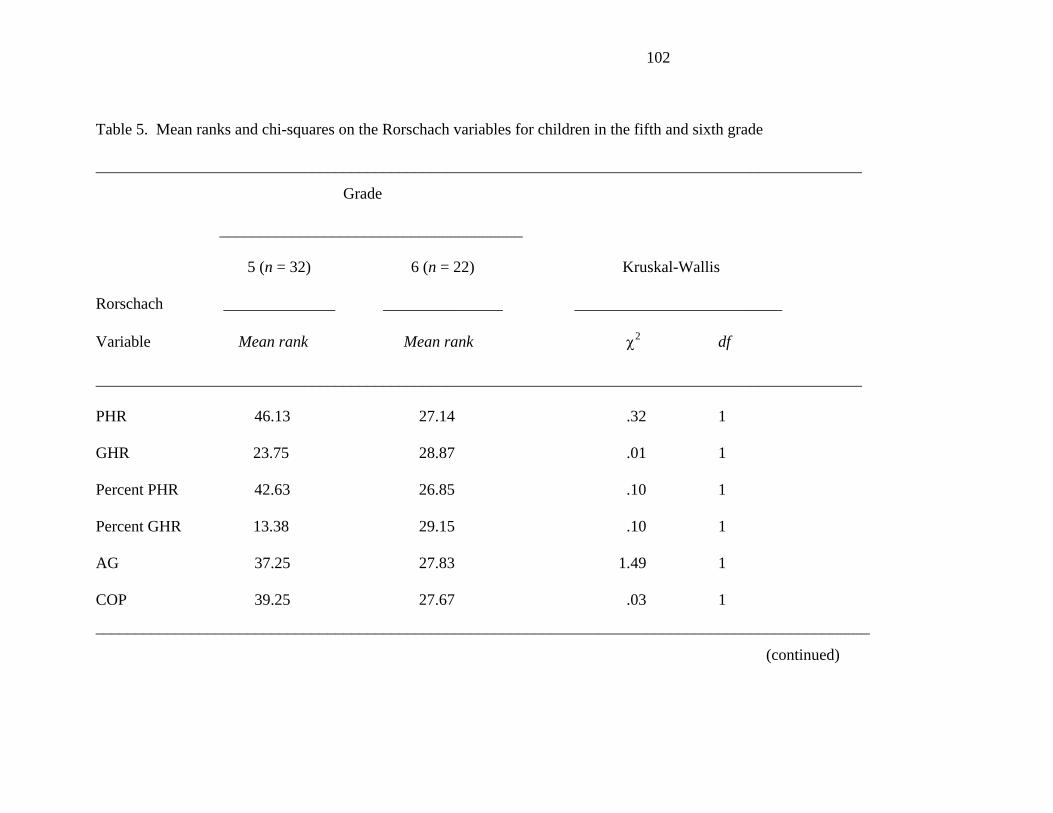
102
Table 5. Mean ranks and chi-squares on the Rorschach variables for children in the fifth and sixth grade
________________________________________________________________________________________________
Grade
______________________________________
5 (n = 32) 6 (n = 22) Kruskal-Wallis
Rorschach ______________ _______________ __________________________
Variable Mean rank Mean rank χ2 df
________________________________________________________________________________________________
PHR 46.13 27.14 .32 1
GHR 23.75 28.87 .01 1
Percent PHR 42.63 26.85 .10 1
Percent GHR 13.38 29.15 .10 1
AG 37.25 27.83 1.49 1
COP 39.25 27.67 .03 1
_________________________________________________________________________________________________
(continued)

103
Table 5. Continued
_________________________________________________________________________________________________
Passive 42.75 27.40 .17 1
Active 36.13 27.91 .27 1
P minus A 29.25 28.44 .06 1
S 47.50 27.04 .01 1
CFC 44.13 27.30 .30 1
Percent CFC 32.50 23.77 .26 1
Afr 20.13 29.14 6.93a 1
Isolate/R 31.63 28.26 .01 1
_______________________________________________________________________________________________
Note. PHR = Poor Human Representation responses; GHR = Good Human Representation responses; AG = Aggressive Movement
responses; COP = Cooperative Movement responses; Passive = Passive Movement responses; Active = Active Movement responses;
P minus A = Passive minus Active Movement responses; S = White Space responses; CFC = Pure C + Color-Form responses; Percent
CFC = Percentage of Color responses that are Dominant Color responses; Afr = Affective Ratio; Isolate/R = Isolation Index.
ap < .01.

104
Table 6. Means, standard deviations, and ANOVAs of the Rorschach variables for the three groups of participants
_______________________________________________________________________________________________________
Group
______________________________________________________________
Rejected Rejected
Popular (n = 27) Aggressive (n = 9) Nonaggressive (n = 20) ANOVA
Rorschach ______________ _______________ ___________________ _____________________
Variable M SD M SD M SD df F ω2
________________________________________________________________________________________________________
PHR 2.81 3.03 5.11 3.79 1.70 1.38 (2,53) 4.92a .12
GHR 2.63 1.80 2.22 2.05 1.95 1.67 (2,53) .84 .01
Percent PHR .43 .34 .72 .25 .56 .32 (2,52) 2.81 .06
Percent GHR .57 .34 .28 .25 .44 .32 (2,52) 2.81 .06
AG .19 .48 .89 1.27 .20 .41 (2,53) 4.40b .11
________________________________________________________________________________________________________
(continued)

105
Table 6. Continued
________________________________________________________________________________________________________
COP .41 .64 1.00 1.23 .55 .76 (2,53) 1.88 .03
Passive 1.38 1.37 1.44 1.42 1.80 1.61 (2,53) .18 .03
Active 3.89 2.49 6.11 3.86 4.05 2.72 (2,53) 2.23 .04
P minus A -1.92 2.50 -4.00 4.36 -2.15 2.98 (2,53) 1.66 .02
Afr .50 .16 .46 .19 .51 .11 (2,53) .36 .02
Isolate/R .16 .12 .26 .16 .27 .18 (2,53) 3.16b .08
________________________________________________________________________________________________________
Note. PHR = Poor Human Representation responses; GHR = Good Human Representation responses; AG = Aggressive Movement
responses; COP = Cooperative Movement responses; Passive = Passive Movement responses; Active = Active Movement responses;
P minus A = Passive minus Active Movement responses; Afr = Affective Ratio; Isolate/R = Isolation Index. ω2 is the proportion of
the variability in scores produced by differences among the groups (Keppel, 1991, pp. 63-68).
ap < .01, bp < .05.

106
Table 7. Mean ranks and chi-squares of the Rorschach variables for the three groups of participants
_____________________________________________________________________________________________________
Group
______________________________________________________________
Rejected Rejected Kruskal-
Popular (n = 27) Aggressive (n = 9) Nonaggressive (n = 20) Wallis
Rorschach ______________ _______________ ___________________ __________________
Variable mean rank mean rank mean rank df χ2
_____________________________________________________________________________________________________
PHR 28.20 42.22 22.73 2 9.15a
GHR 31.26 27.28 25.33 2 1.63
Percent PHR 23.67 37.11 29.53 2 5.05
Percent GHR 32.33 18.89 26.48 2 5.05
AG 26.22 37.78 27.40 2 6.54b
_____________________________________________________________________________________________________
(continued)

107
Table 7. Continued
____________________________________________________________________________________________________
COP 26.41 34.11 28.80 2 2.01
Passive 28.91 25.83 29.15 2 .31
Active 26.78 37.11 26.95 2 3.04
P minus A 30.56 21.94 28.68 2 1.91
S 27.65 35.06 26.70 2 1.83
CFC 23.48 41.83 29.28 2 9.55a
Percent CFC 19.77 38.50 24.06 2 11.00a
_______________________________________________________________________________________________________
Note. PHR = Poor Human Representation responses; GHR = Good Human Representation responses; AG = Aggressive Movement
responses; COP = Cooperative Movement responses; Passive = Passive Movement responses; Active = Active Movement responses;
P minus A = Passive minus Active Movement responses; S = White Space responses; CFC = Pure C + Color-Form responses; Percent
CFC = Percentage of Color responses that are Dominant Color responses.
ap < .01, bp < .05.