tesla motors research report - akhilesh agarwal
TRANSCRIPT
NASDAQ: TSLA
Tesla Motors Report as of December 6, 2015
Securities rated “BUY” are expected to perform better than the S&P 500 Index over the next 12 months (after adjusting for risk)
Securities rated “HOLD” are expected to perform similarly to the S&P 500 Index
Securities rated “SELL” are expected to perform worse than the S&P 500 Index
RW Recommends:
SELL HOLD BUY
SELL HOLD BUY
UNDERWEIGHT
MARKET WEIGHT
OVER WEIGHT
12 Month
5 Year
Sector
TSLA Statistics
Tesla designs and manufactures electric vehicles, electric vehicle (EV) powertrain units, and batteries. Products include the Roadster, Model S, and Model X consumer cars. Tesla also operates Tesla Energy which offers Powerwall consumer batteries and Powerpack commercial batteries. Tesla has revenues in range of 45%-50% for the United States, 12%-15% for China, and 10%-15% for Norway, and 25%-30% for elsewhere in the world.
0
100
200
300
400
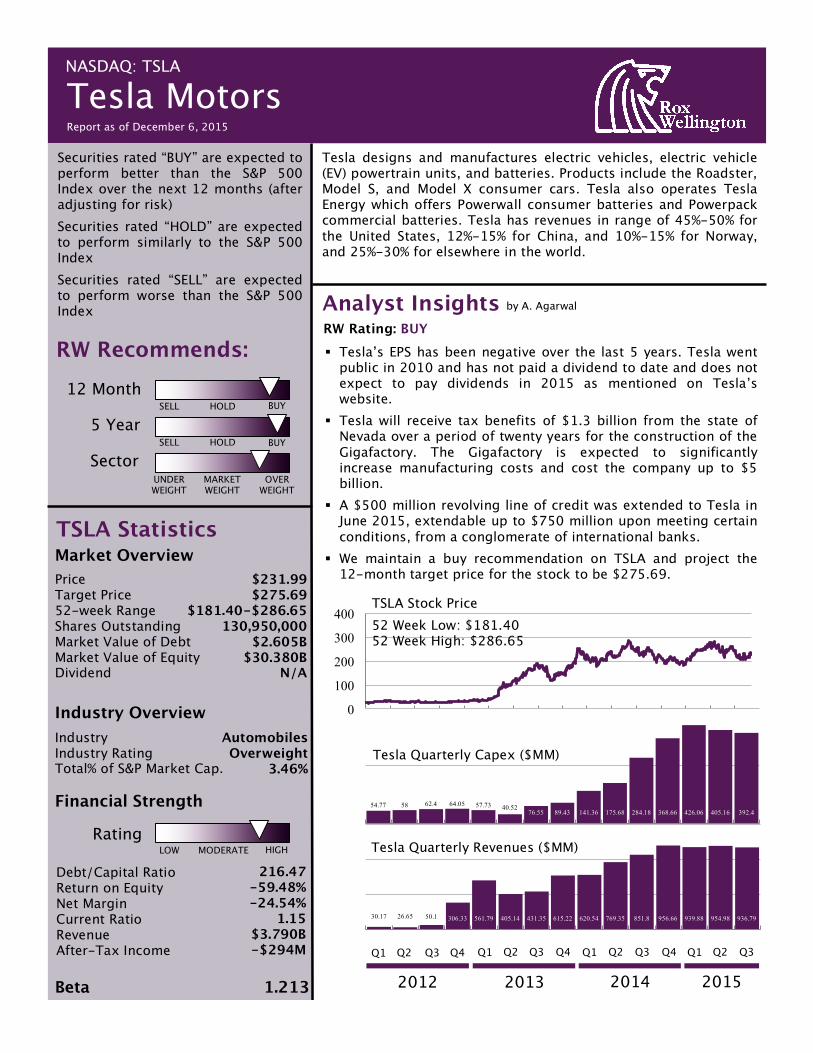
54.77 58 62.4 64.05 57.73 40.5276.55 89.43 141.36 175.68 284.18 368.66 426.06 405.16 392.4
30.17 26.65 50.1 306.33 561.79 405.14 431.35 615.22 620.54 769.35 851.8 956.66 939.88 954.98 936.79
Q1 Q2 Q3 Q4 Q1 Q2 Q3 Q4 Q1 Q2 Q3 Q4 Q1 Q2 Q3
2012 2013 2014 2015
Analyst Insights by A. Agarwal
RW Rating: BUY § Tesla’s EPS has been negative over the last 5 years. Tesla went
public in 2010 and has not paid a dividend to date and does not expect to pay dividends in 2015 as mentioned on Tesla’s website.
§ Tesla will receive tax benefits of $1.3 billion from the state of Nevada over a period of twenty years for the construction of the Gigafactory. The Gigafactory is expected to significantly increase manufacturing costs and cost the company up to $5 billion.
§ A $500 million revolving line of credit was extended to Tesla in June 2015, extendable up to $750 million upon meeting certain conditions, from a conglomerate of international banks.
§ We maintain a buy recommendation on TSLA and project the 12-month target price for the stock to be $275.69.
Price Target Price 52-week Range Shares Outstanding Market Value of Debt Market Value of Equity Dividend
Market Overview $231.99 $275.69
$181.40-$286.65 130,950,000
$2.605B $30.380B
N/A
Industry Overview Industry Industry Rating Total% of S&P Market Cap.
Automobiles Overweight
3.46%
Financial Strength
LOW MODERATE HIGH Rating
Debt/Capital Ratio Return on Equity Net Margin Current Ratio Revenue After-Tax Income
216.47 -59.48% -24.54%
1.15 $3.790B -$294M
Beta 1.213
TSLA Stock Price
52 Week Low: $181.40 52 Week High: $286.65
Tesla Quarterly Capex ($MM)
Tesla Quarterly Revenues ($MM)
NASDAQ: TSLA
Tesla Motors Report as of December 6, 2015
($millions) 2011 2012 2013 2014 2015
Revenue 204.24 413.26 2,103.50 3,198.36 5,404.38
COGS 142.65 383.19 1557.23 2316.68
Gross Profit 61.60 30.07 456.26 881.67 1,325.37
SG&A 104.10 150.37 285.57 603.66
R&D 208.98 273.98 231.98 464.70
Operating Income
-251.49
-394.28
-61.28 -186.69
Interest Expense 0.04 0.25 32.93 100.89 115
Pretax Income -253.92
-396.08
-46.22 -284.64 -235.36
Income Taxes 0.49 0.14 2.59 9.40
Net Income -254.41
-396.21
-57.63 -294.04 -165.77
EPS -2.53 -3.69 -0.48 -2.36 -1.18
Revenue 204.24 413.26 2013.50 3198.36 5404.38
Operating Income
-251.49
-394.28
-61.28 -186.69
Net Income -254.41
-396.21
-57.63 -294.04 -165.77
EPS -2.53 -3.69 -0.48 -2.36 -1.18
in % 2012 2013 2014 2015 2016
Tesla 7.28 22.66 27.57 25.52 25.02
Competitor Avg. 14.57 16.80 16.55 18.22 18.09
Ford 13.07 12.84 12.40 15.18 13.48
GM 7.89 13.19 11.45 15.40 15.75
Honda 25.52 25.64 23.31 22.49 22.70
Toyota 11.81 15.51 19.04 19.80 20.44
Analysis of Growth and Valuation Growth Analysis
Growth Rates (%)
Gross Margin Analysis
Tesla’s gross margin from 2013 to now has been higher than competitors’ average. We believe that Tesla’s gross margin of 25.02% in 2016 will continue to be higher than the competitor’s average of 18.09% and also higher than all of the identified competitors individually.
Interest rates at Tesla are subject to several upward biases from several recent developments. Deepak Ahuja - Tesla CFO since the company’s inception - retired November 30, 2015. Despite hiring Jason Wheeler (13 year Google Vice President of Finance) as Ahuja’s replacement, companies that lose top-level, long-term executives tend to endure negative impacts on rates. Tesla has also faced difficulties with satiating sales orders, and will continue to have inventory shortages until the company’s production facility expansion is complete. Finally, Faraday Futures, a new rival EV manufacturer with $1.2 billion in funding (based in Gardena, CA), has successfully poached top-level talent from Tesla (including their Director of Vehicle & Chassis Engineering, Director of Manufacturing, Director of Purchasing, and Director of Human Resources).
A high number of positive developments indicate evidence of downwards pressures dominating upwards pressures (in reference to interest rates). Hiring Jon McNeill - who had grown his previous company Enservio at a rate of 40% per year - as Head of Global Sales and Service was received positively by investors and analysts. Tesla has also announced internal margin targets at 15% which should have overall positive impacts.
Analyst Insights (continued) Recent Developments
Further downwards rate biases include NA, EU, and APAC sales increases of 50% year-over-year, plus supplier sourcing risk reduction by moving all seat manufacturing in-house.
All of the above factors have been accounted for in the equity risk premium (discussed in “Valuation”).
NASDAQ: TSLA
Tesla Motors Report as of December 6, 2015
Analyst Insights (continued)
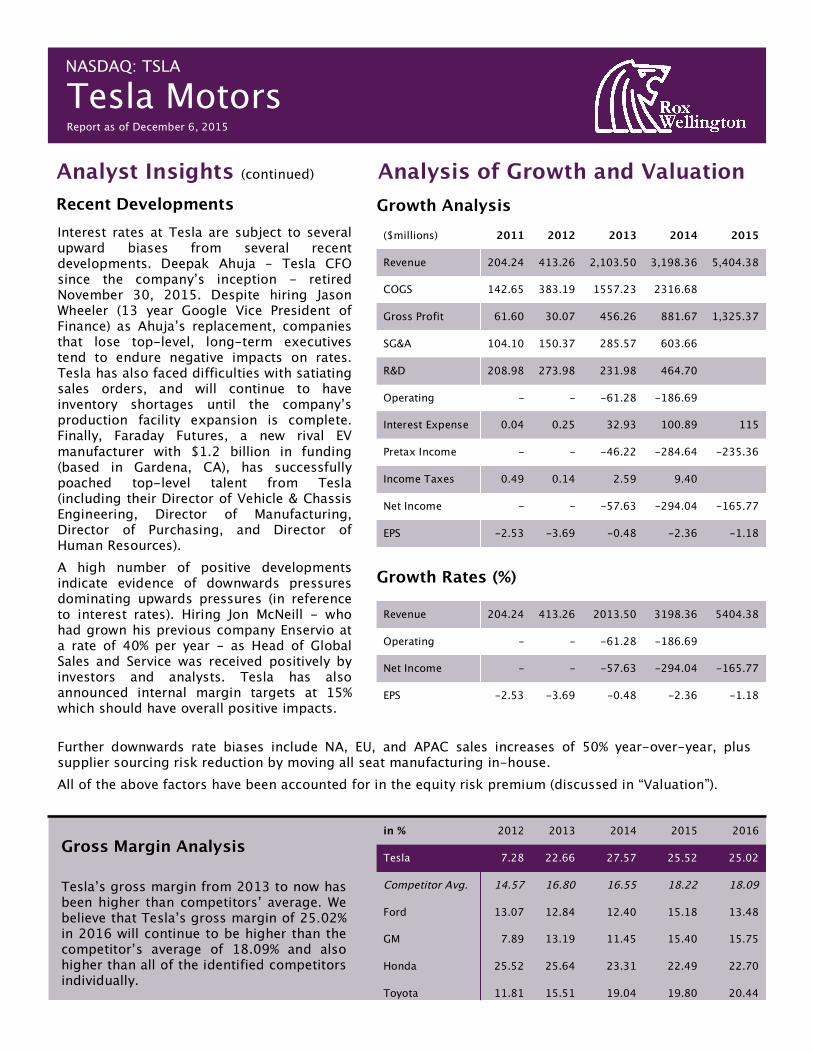
0.41 0.590.85 1.21 1.73 2.48
2016 2017 2018 2019 2020 2021+
Valuation
0.00 0.53 0.68 0.87 1.12 35.50
Tesla is young company in the automobile industry when compared to giants like Honda, Toyota and General Motors. We suggest a 20-year Treasury rate as the risk free rate to normalize Tesla against the rest of the industry. The risk free rate used is 2.65% as on December 4th, 2015.
A market risk premium of 7.82% has been estimated considering Tesla’s inherent risk. This is analogous to the equity risk premium calculated as the excess of market portfolio return in the equity market over the risk free rate.
Tesla is an unconventional company in terms of investments and cash flows. As the company went public just 5 years ago and has massive investments in the Gigafactory, we have used an internal model to compute the estimated free cash flows. Depreciation has been added back to the Net Income along with Working Capital and Capex. Interest Expense has been added back into Net Income in wake of steadily increasing bond issues. The systematic risk (beta) for Tesla has been internally computed at RW since betas provided by other sources take into account multiple unknown variable. A regression analysis was conducted against the S&P 500 with data covering 12 months and 5 years. The beta for 5 years was calculated to be 1.215 and the 12-month beta was 1.213. A 12-month time horizon has been chosen because some of the major activities of Tesla motors occurred within this time frame and using earlier data would include obsolete risk. Based on the linear regression between daily returns on the S&P 500 and Tesla, our implied beta is 1.213. We believe that this value of risk covers all relevant risks of Tesla going into the future.
Market Estimates Risk Free Rate 2.65% Market Risk Premium 7.82%
Firm Forecasts Firm Value $32,985,170,00
0 WACC 11.51% Initial FCF $1,248,450,799 Short-term Growth 27.00% Terminal Growth 3.00%
Equity Estimates Beta 1.213 Cost of Equity 12.14% MV of Equity $30,380,000,000 Weight of Equity
92.10%
Debt Estimates
Pre-Tax Cost of Debt 4.10% Effective Tax Rate -3.46% After-Tax Cost of Debt
4.24%
MV of Debt $2,605,170,000
Weight of Debt 7.90%
Return on Equity Analysis
2012 2013 2014 2015
Tesla -317.93 -11.09 -32.25 -49.67
Competitor Avg. 15.56 15.49 11.17 12.86
Ford 36.58 34.15 12.52 17.80
GM 18.14 11.54 7.48 12.15
Honda 4.78 7.78 10.99 7.58
Toyota 2.72 8.48 13.70 13.91
The ROE range of Tesla’s competitors is 11.17 to 15.56 from 2012 to 2015. Tesla’s ROE has not been positive since its IPO in 2010. However, Tesla’s ROE in 2016 is expected to be 11.54, a significant change from third quarter in 2015 value of -49.67. Despite a low ROE, Tesla’s common shareholders have been realizing gains through appreciated stock ($17/share at IPO vs. close to $230/share in December 2015.)
Diagonal Section = Terminal Value ($58.74B)
FCF
Gro
wth
PV
Gro
wth
(all values in $billions)
Short-term growth rate = 43% Terminal growth rate = 7%
(2021+ represents perpetuity)
Firm value = $38.71B Shares outstanding = 130,950,000
NASDAQ: TSLA
Tesla Motors Report as of December 6, 2015
Investment Ideology
RW has estimated a growth rate of 43%, calculated as an average of the change in free cash flows generated by Tesla over the last five years. We believe that this growth rate is indicative of investments and returns that will be generated by the Gigafactory. This growth rate also takes into account the potential upscale in production of the Model S over the next three months and the eventual release of the Model III.
A terminal growth rate of 7% has been estimated for Tesla as visibility for the company extends over the next 4 to 5 years after which the industry is expected to catch up with Tesla’s technology.
Debt and Taxation
Normally, we would use an average of all YTM’s of long term bonds (bonds with maturity of 25+ years) to determine the pre-tax cost of debt, but as Tesla does not have a significant number of long term bond issues, we have used a forecasted interest expense to calculate a cost of debt.
Tesla’s interest expense is estimated to culminate at $115 million by the end of 2015 and the company’s market value of debt is projected to be $2,805.17 million, up from $2,605.17 million on December 4th, 2015. Expressing interest expense as a percentage of the total market value of debt represents an approximate pre-tax cost of debt of 4.10%.
The state of Nevada granted Tesla a $1.3 billion tax benefit over 20 years, hence the corporate tax rate for Tesla is -3.46%. We weigh Tesla’s cost of debt at 7.90% which leads to the after-tax cost of debt being 4.24%.
02468
10
-0.5 0 0.5 1 1.5 2 2.5 3 3.5
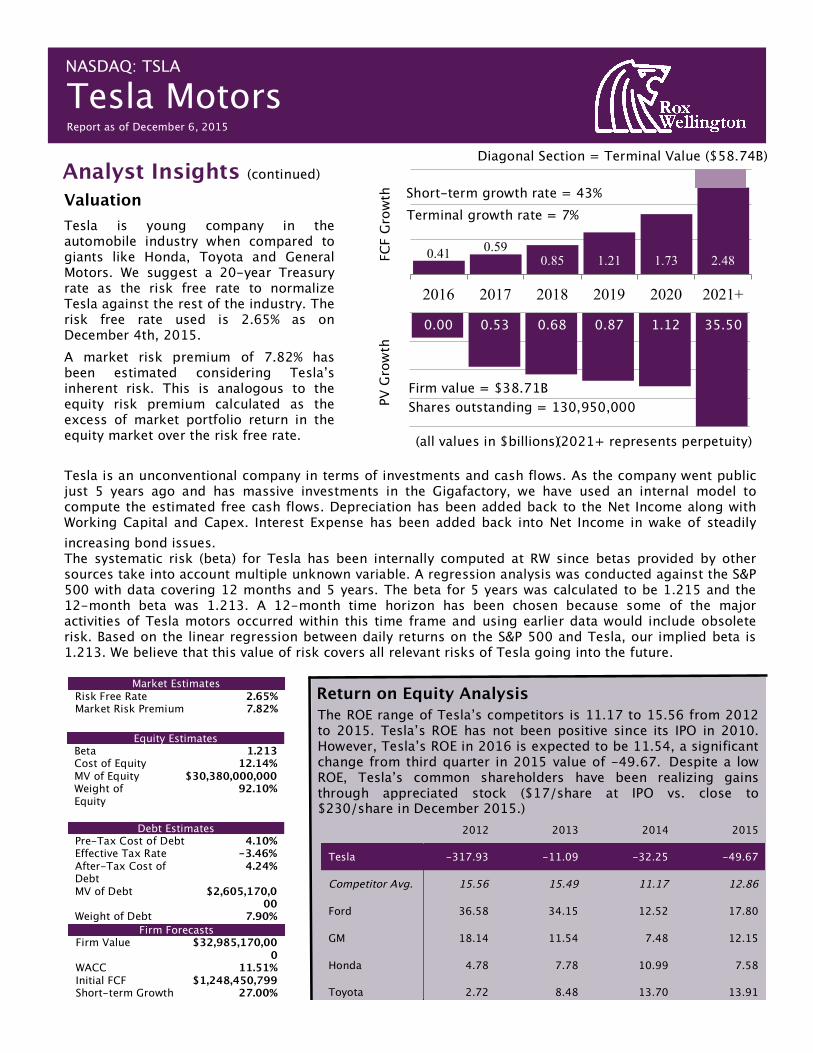
TeslaCompetitors' Avg
FordGM
HondaToyota
Tax Burden Interest Burden Profit Margin Total Asset Turnover
Since Tesla’s ROE is relatively low to those of its competitors, we conduct the DuPont analysis. This breaks down the return on equity ratio into five components: tax burden, interest burden, profit margin, total asset turnover and financial leverage. We then examine how Tesla can increase its return for investors. Comparing Tesla’s 2014 figures to the competitors’ average, we notice that Tesla has underperformed the competitors’ average in all five components. Tesla’s tax burden and interest burden are both higher than the competitors’ average, which result in lower ROE. Tesla’s profit margin and total turnover rate are both lower than the competitors’ average, contributing to a lower ROE. Tesla’s financial leverage is higher than the competitors’ average, which indicates higher risk pertaining to more debt service costs.
DuPont Analysis
(comparison of Financial Leverage)
NASDAQ: TSLA
Tesla Motors Report as of December 6, 2015
Analyst Insights (continued)
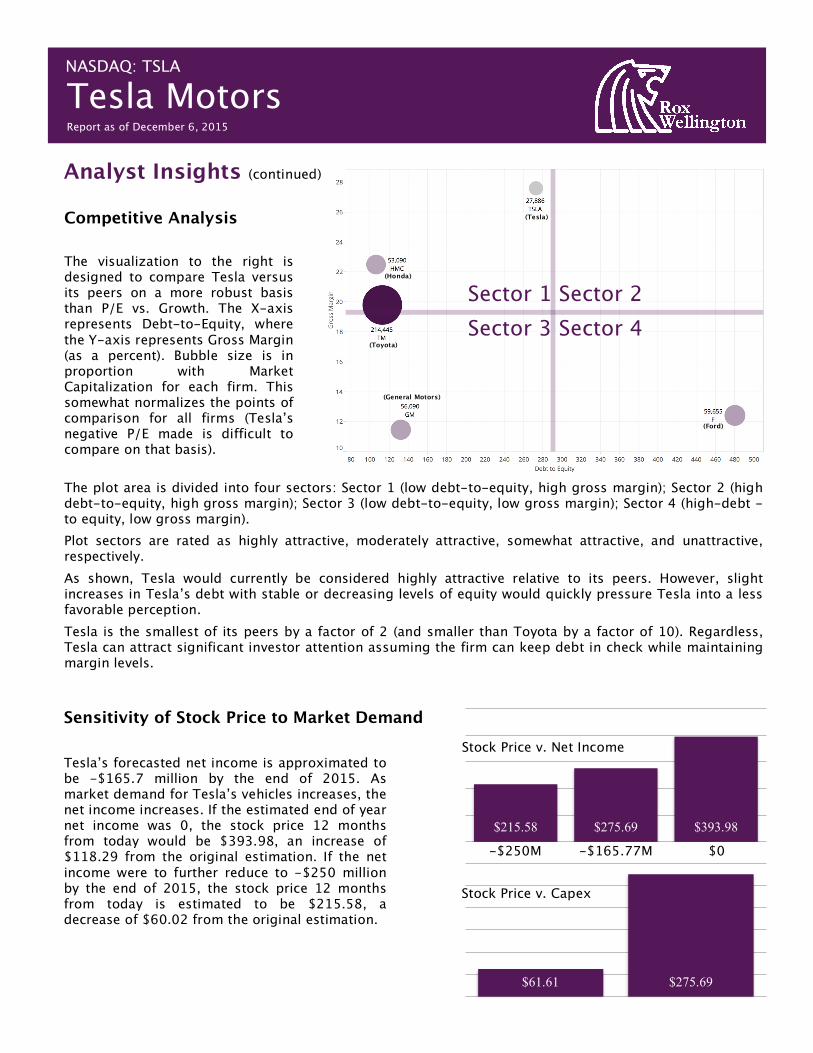
Competitive Analysis
Sector 1 Sector 2 Sector 3 Sector 4
(Tesla)
(Honda)
(Toyota)
(General Motors)
(Ford)
The visualization to the right is designed to compare Tesla versus its peers on a more robust basis than P/E vs. Growth. The X-axis represents Debt-to-Equity, where the Y-axis represents Gross Margin (as a percent). Bubble size is in proportion with Market Capitalization for each firm. This somewhat normalizes the points of comparison for all firms (Tesla’s negative P/E made is difficult to compare on that basis).
The plot area is divided into four sectors: Sector 1 (low debt-to-equity, high gross margin); Sector 2 (high debt-to-equity, high gross margin); Sector 3 (low debt-to-equity, low gross margin); Sector 4 (high-debt -to equity, low gross margin).
Plot sectors are rated as highly attractive, moderately attractive, somewhat attractive, and unattractive, respectively.
As shown, Tesla would currently be considered highly attractive relative to its peers. However, slight increases in Tesla’s debt with stable or decreasing levels of equity would quickly pressure Tesla into a less favorable perception.
Tesla is the smallest of its peers by a factor of 2 (and smaller than Toyota by a factor of 10). Regardless, Tesla can attract significant investor attention assuming the firm can keep debt in check while maintaining margin levels.
$61.61 $275.69
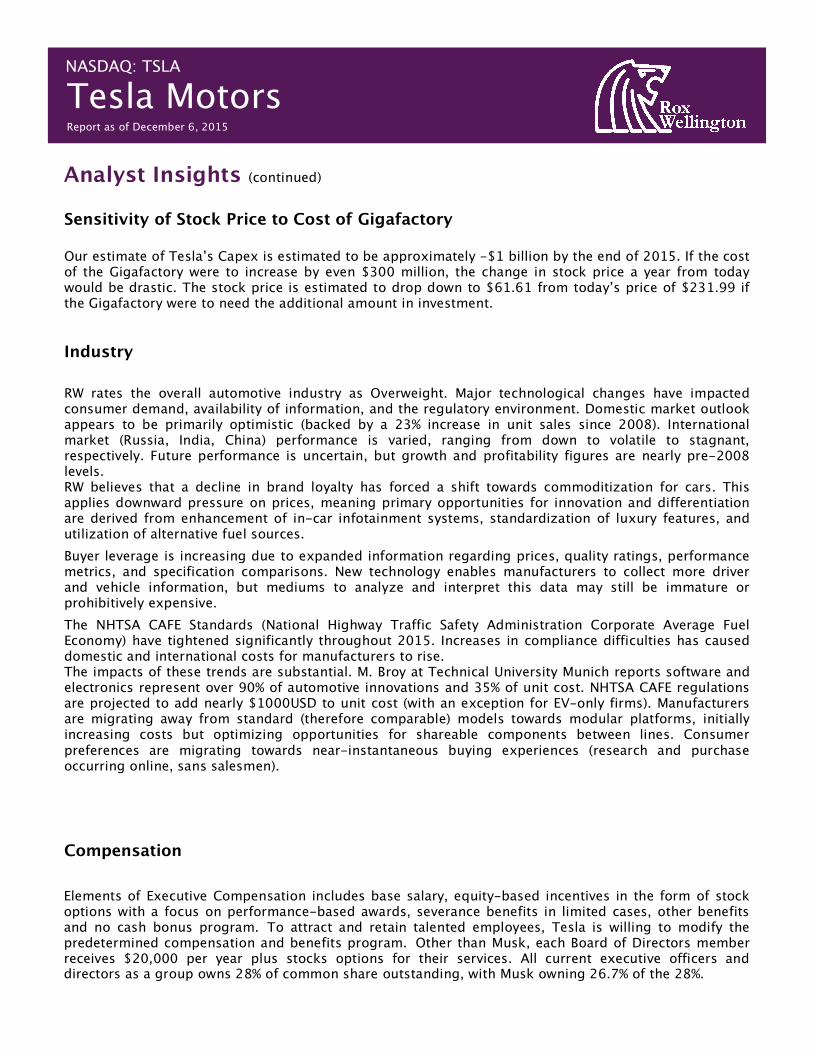
$215.58 $275.69 $393.98
Sensitivity of Stock Price to Market Demand
Tesla’s forecasted net income is approximated to be -$165.7 million by the end of 2015. As market demand for Tesla’s vehicles increases, the net income increases. If the estimated end of year net income was 0, the stock price 12 months from today would be $393.98, an increase of $118.29 from the original estimation. If the net income were to further reduce to -$250 million by the end of 2015, the stock price 12 months from today is estimated to be $215.58, a decrease of $60.02 from the original estimation.
Stock Price v. Net Income
Stock Price v. Capex
-$250M -$165.77M $0
-$1.3B -$1.0B
NASDAQ: TSLA
Tesla Motors Report as of December 6, 2015
Analyst Insights (continued)
Industry
RW rates the overall automotive industry as Overweight. Major technological changes have impacted consumer demand, availability of information, and the regulatory environment. Domestic market outlook appears to be primarily optimistic (backed by a 23% increase in unit sales since 2008). International market (Russia, India, China) performance is varied, ranging from down to volatile to stagnant, respectively. Future performance is uncertain, but growth and profitability figures are nearly pre-2008 levels. RW believes that a decline in brand loyalty has forced a shift towards commoditization for cars. This applies downward pressure on prices, meaning primary opportunities for innovation and differentiation are derived from enhancement of in-car infotainment systems, standardization of luxury features, and utilization of alternative fuel sources.
Buyer leverage is increasing due to expanded information regarding prices, quality ratings, performance metrics, and specification comparisons. New technology enables manufacturers to collect more driver and vehicle information, but mediums to analyze and interpret this data may still be immature or prohibitively expensive.
The NHTSA CAFE Standards (National Highway Traffic Safety Administration Corporate Average Fuel Economy) have tightened significantly throughout 2015. Increases in compliance difficulties has caused domestic and international costs for manufacturers to rise. The impacts of these trends are substantial. M. Broy at Technical University Munich reports software and electronics represent over 90% of automotive innovations and 35% of unit cost. NHTSA CAFE regulations are projected to add nearly $1000USD to unit cost (with an exception for EV-only firms). Manufacturers are migrating away from standard (therefore comparable) models towards modular platforms, initially increasing costs but optimizing opportunities for shareable components between lines. Consumer preferences are migrating towards near-instantaneous buying experiences (research and purchase occurring online, sans salesmen).
Compensation
Elements of Executive Compensation includes base salary, equity-based incentives in the form of stock options with a focus on performance-based awards, severance benefits in limited cases, other benefits and no cash bonus program. To attract and retain talented employees, Tesla is willing to modify the predetermined compensation and benefits program. Other than Musk, each Board of Directors member receives $20,000 per year plus stocks options for their services. All current executive officers and directors as a group owns 28% of common share outstanding, with Musk owning 26.7% of the 28%.
Sensitivity of Stock Price to Cost of Gigafactory
Our estimate of Tesla’s Capex is estimated to be approximately -$1 billion by the end of 2015. If the cost of the Gigafactory were to increase by even $300 million, the change in stock price a year from today would be drastic. The stock price is estimated to drop down to $61.61 from today’s price of $231.99 if the Gigafactory were to need the additional amount in investment.
NASDAQ: TSLA
Tesla Motors Report as of December 6, 2015
About RW
Disclaimers Rox Wellington (RW) is a fictitious, independent investment researcher. RW has no affiliation with FINRA, SIPC, or any other financial or regulatory institution. RW is not registered as broker dealer or any other type of financial representative. The RW trademark, service mark and logo are based on the Singapore Merlion Monument; as such, RW makes no claim over the intellectual property of such assets. The information contained in this report is produced, but not copyrighted, by RW. Any use, duplication, redistribution or disclosure is permitted assuming RW is referenced as the original source. Report content may be derived from RW research reports, notes, or analyses – it may also be derived from third parties (including Bloomberg L.P.). The information contained herein are based on sources deemed reliable; however, RW is a fictitious company and makes no representation as to timeliness, accuracy, completeness, fitness, are any performance metric for any given purpose. Please do not contact RW with solicitations to buy or sell TSLA or any other security. The information presented in this report are for academic purposes only and do not address individual investment objectives, financial situations or any particular needs of any specific person who may view this report. This report does not encourage or discourage investment of any kind. RW shall not and cannot accept liability for any loss arising from the use of this report (as RW does not exist as a real company), nor shall RW treat any recipients of this report as customers (as only real companies can have customers). Investments are risky an investors may experience either profits or losses – RW is not responsible for either case. Past performance should never be used to gauge future performance. RW has fictitiously provided independent research since 1951. RW’s main sources of third party data are Bloomberg and Yahoo! Finance. RW’s officers (listed above) could potentially have positions in TSLA.
Rox Wellington (fictitious) was founded by Robert A. Wellington and Dr. William Rox in 1951. RW has a half-century old track record of success in research and analysis and pioneered the RW Integrated Fundamental Equity Survey (RWIFES). The RW Rating Systems classifies securities into one of three categories relative to the S&P benchmark. Securities rated “BUY” are expected to perform better than the S&P 500 Index over the next 12 months (after adjusting for risk). Securities rated “HOLD” are expected to perform similarly to the S&P 500 Index. Securities rated “SELL” are expected to perform worse than the S&P 500 Index.