tesla 47700 kato road and 1055 page avenue improvements
TRANSCRIPT

City of Fremont Tesla 47700 Kato/1055 Page Project MND
Tesla 47700 Kato Road and 1055 Page Avenue Improvements Project
Attachment 1.17: Traffic and Transportation
A. Transportation Evaluation, Kimley-Horn, March 2020
B. Tesla Transportation Demand Management Plan

March 2020 197286102 Copyright © Kimley-Horn and Associates, Inc.
TRANSPORTATION EVALUATION - FINAL
TESLA REDEVELOPMENT PROJECT 47700 Kato Road and 1055 Page Avenue
FREMONT, CALIFORNIA
Prepared for:
Prepared by:
TRANSPORTATION IMPACT ANALYSIS - FINAL
FOR
TESLA REDEVELOPMENT PROJECT
Prepared for: Tesla Transportation Department
Prepared by: Kimley-Horn and Associates, Inc. 100 West San Fernando Street, Suite 250 San Jose, California 95113 669-800-1979
This document, together with the concepts and designs presented herein, as an instrument of service, is intended only for the specific purpose and client for which it was prepared. Reuse of and improper reliance on this document without written authorization and adaptation by Kimley-Horn and Associates, Inc. shall be without liability to Kimley-Horn and Associates, Inc.
March 2020 197165001

197286102 Transportation Evaluation Tesla Redevelopment Project March 2020
Page i
Contents 1. INTRODUCTION ....................................................................................................................... 1
2. TRIP GENERATION ................................................................................................................. 4
Existing Conditions ................................................................................................................ 4
Proposed 47700 Kato Road and 1055 Page Avenue Project Conditions .............................. 4
3. VEHICLE MILES TRAVELED ................................................................................................... 7
Methodology and Assumptions .............................................................................................. 7
Figures Figure 1 – Vicinity Map ................................................................................................................. 2
Figure 2 – Project Site Plan .......................................................................................................... 3
Figure 3 – Visual Distribution of Employee Residences ............................................................... 8
Figure 4 – Distribution of Employment Trips ................................................................................. 9
Tables Table 1 – Weekday Existing and Proposed Project Trip Generation ............................................ 6
Table 2 – VMT Estimate for Daily Employee Commute Only ..................................................... 10
Tesla Redevelopment Project – Transportation Evaluation Page 1
1. INTRODUCTION
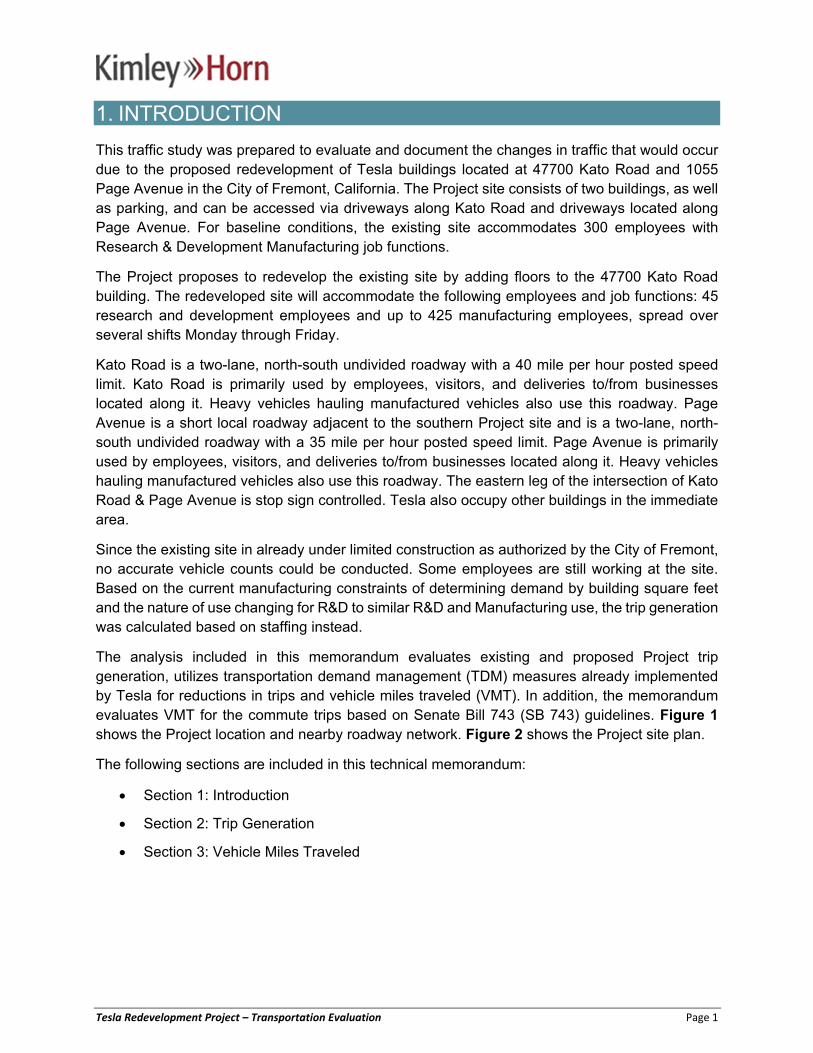
This traffic study was prepared to evaluate and document the changes in traffic that would occur due to the proposed redevelopment of Tesla buildings located at 47700 Kato Road and 1055 Page Avenue in the City of Fremont, California. The Project site consists of two buildings, as well as parking, and can be accessed via driveways along Kato Road and driveways located along Page Avenue. For baseline conditions, the existing site accommodates 300 employees with Research & Development Manufacturing job functions.
The Project proposes to redevelop the existing site by adding floors to the 47700 Kato Road building. The redeveloped site will accommodate the following employees and job functions: 45 research and development employees and up to 425 manufacturing employees, spread over several shifts Monday through Friday.
Kato Road is a two-lane, north-south undivided roadway with a 40 mile per hour posted speed limit. Kato Road is primarily used by employees, visitors, and deliveries to/from businesses located along it. Heavy vehicles hauling manufactured vehicles also use this roadway. Page Avenue is a short local roadway adjacent to the southern Project site and is a two-lane, north-south undivided roadway with a 35 mile per hour posted speed limit. Page Avenue is primarily used by employees, visitors, and deliveries to/from businesses located along it. Heavy vehicles hauling manufactured vehicles also use this roadway. The eastern leg of the intersection of Kato Road & Page Avenue is stop sign controlled. Tesla also occupy other buildings in the immediate area.
Since the existing site in already under limited construction as authorized by the City of Fremont, no accurate vehicle counts could be conducted. Some employees are still working at the site. Based on the current manufacturing constraints of determining demand by building square feet and the nature of use changing for R&D to similar R&D and Manufacturing use, the trip generation was calculated based on staffing instead.
The analysis included in this memorandum evaluates existing and proposed Project trip generation, utilizes transportation demand management (TDM) measures already implemented by Tesla for reductions in trips and vehicle miles traveled (VMT). In addition, the memorandum evaluates VMT for the commute trips based on Senate Bill 743 (SB 743) guidelines. Figure 1 shows the Project location and nearby roadway network. Figure 2 shows the Project site plan.
The following sections are included in this technical memorandum:
Section 1: Introduction
Section 2: Trip Generation
Section 3: Vehicle Miles Traveled
197286102
MAP DATA: GOOGLE EARTH
FIGURE 1
Tesla Redevelopment Project
VICINITY MAP
Project Location
Kato R
d
Mim
ont Dr
Page Ave

EXISTING PARKING
C
C
C
C
C
CCCCCCCC
C
CCC
C
C
C
C
C
C
CC
C
C
EXISTING FENCE ALONG NORTH PROPERTY
1055 PAGE AVE
EXISTING MONUMENT SIGN
CHARGING GC ASTATIONOS A
KA
TO
RO
AD
(8
0' R
OW
)
C
C
C
C
C
C
C
C
C
C
C
C
C
C
C
C
C
CC
CC
C
C
C
C
C
C
C
C
C
C
C
C
C
C
C
C
C
C
C
C
C
C
C
C
C
C
C
C
C
C
C
C
C
C
C
C
C
C
C
C
C
C
C
C
C
C
C
C
C
C
C
C
C
C
C
C
C
C
C
C
C
C
C
C
C
C
C
C
C
C
C
C
C
C
AV EV
PAGE AVE (64' ROW)
USE: MANUFACTURING R&DOCCUPANCY: MIXED USE (H-5, H-2, H-4, S-1)CONSTRUCTION TYPE: III-A
PROPOSED:
FIRST FLOOR 96,976 SFSECOND FLOOR 50,821 SFTHIRD FLOOR 8,260 SFTOTAL 156,057 SF
FF
S 2
0°
36
' 3
2"
E 5
49
.17'
20
°3
6'3
2"
E5
49
17'
AL=31.66'
ACCESSIBLE AAACCC
USE: MANUFACTURING R&DOCCUPANCY: MIXED USE
(S-2, F-1, B, H-4)CONSTRUCTION TYPE: III-B
EXISTING TOTAL 58,568 SFEV
C
47700 KATO EXISTING BUILDING = 126,312
BIKE STORAGE ROOM (10 BIKES)
ES
MT
EXISTING FIRE LANE
EXISTING PARKING STRIPING
ACCESSIBLE PARKING
ACCESSIBLE VAN PARKING
CLEAN AIR/ VAN POOL PARKING
COMPACT PARKING
MOTORCYCLE PARKING
A
AV
EV
C
M
FH
PROPERTY LINE
SETBACK
EXISTING FIRE HYDRANT
EXISTING TREES
1/9
/20
20
11:
12:2
4 A
M
EK000B-A-2REF SCALE: 1" = 40'-0"EK000B-A-7EK000B-A-2 REF:
1 SITE PLAN - PERMIT
PARKING COUNTPARKING PROVIDED: 366
HANDICAPPED: 6HANDICAPPED VAN: 3ELECTRIC VEHICLE: 2MOTORCYCLE: 8 (COUNTED AS .5 EA)COMPACT: 126REGULAR : 223
BIKE PARKING PROVIDED: 18 (EACH 8 COUNTS AS 1 CAR SPOT PROVIDED)
INDOOR STORAGE: 10OUTDOOR RACKS: 8
LEGEND
FLOOR AREA RATIOGROSS FLOOR AREA / LOT AREA = 0.45 MAX PER ZONING ORDINANCE
FLOOR AREA:LOT AREA:
155,984 ft2 + 58,568 ft2 = 214, 552 ft2
= 405,543 ft2 = 0.53
REQUESTING 0.60 MAX AS PART OF THIS APPLICATION
GENERAL NOTESNO CHANGES TO EXISTING BUILDING FOOT PRINT AS PART OF THIS APPLICATION.
NO CHANGES TO EXISTING LANDSCAPING AS PART OF THIS APPLICATION.
NO CHANGES TO EXISTING PARKING AS PART OF THIS APPLICATION.
NO CHANGES TO ANY EXISTING PROPERTY EASEMENTS (IF ANY) AS PART OF THIS APPLICATION.
NO CHANGES TO ANY ADJACENT STREET RIGHT-OF-WAY AS PART OF THIS APPLICATION.
NO CHANGES TO EXISTING PEDESTRIAN WAYS AND RECREATION AREAS.
NO. ISSUED FOR DATE
197286102
FIGURE 2
Tesla Redevelopment Project
PROJECT SITE PLAN

Tesla Redevelopment Project – Transportation Evaluation Page 4
2. TRIP GENERATION
Trip generation for the existing site and the proposed Project was calculated using the rates from the Institute of Transportation Engineer’s (ITE) publication Trip Generation 10th Edition (2017), which is a standard reference used by the City of Fremont for the estimation of trip generation potential. For the purposes of determining the worst-case weekday effects of Project traffic on the surrounding street network, the trips generated by the existing site and proposed Project are estimated for one AM peak analysis hour between the hours of 5:30-9:00 AM and one PM peak analysis hour between 4:00-7:00 PM. Daily weekday trips are also estimated in the analysis below. Arrivals and departures for the various shifts are anticipated to stagger trips in such a way that the project effect on the adjacent street network would be minimized.
Existing Conditions The existing site, which includes two buildings (126,312 square feet [SQFT] + 58,568 SQFT = 184,880 SQFT), accommodates up to 300 employees per day for baseline conditions. These employees’ job classifications include research and development, as well as manufacturing. ITE land use codes 760 (Research & Development Center) and 140 (Manufacturing) closely match the existing employee description and is assumed in this analysis for base conditions.
ITE data indicates that weekday trip generation rates for land use code 760 (Research & Development Center) are 3.29 daily trips per employee, 0.51 AM peak hour trips per employee, and 0.52 PM peak hour trips per employee. ITE data also indicates that weekday trip generation rates for land use code 140 (Manufacturing) are 2.47 daily trips per employee, 0.37 AM peak hour trips per employee, and 0.33 PM peak hour trips per employee.
Assuming the ITE rates and employee breakdown described above for trip generation estimation results in approximately 906 daily trips, 139 AM peak hour trips, and 137 PM peak hour trips. These trips are assumed as existing trip credits and are summarized in Table 1 below.
Proposed 47700 Kato Road and 1055 Page Avenue Project Conditions The proposed Project, which redevelops/repurposes the two existing buildings and adds additional floors for primarily manufacturing purposes to the 47700 Kato Road building (156,057 SQFT + 58,568 SQFT = 214,625 SQFT), will accommodate up to 470 employees. It is anticipated that on typical weekdays far fewer employees will be onsite, but for the purposes of this conservative trip generation analysis 470 employees are analyzed. Manufacturing as well as Research and Development employees will be accommodated at the Project site.
Note that manufacturing employees will work in shifts, which may result in a lower peak trip generation than analyzed in this analysis. Therefore, this analysis presents a “worst case” traffic generation potential.
ITE data indicates weekday trip generation rates for land use code 760 of 3.29 daily trips per employee, 0.51 AM peak hour trips per employee, and 0.52 PM peak hour trips per employee. ITE data indicates weekday trip generation rates for land use code 140 of 2.47 daily trips per employee, 0.37 AM peak hour trips per employee, and 0.33 PM peak hour trips per employee.

Tesla Redevelopment Project – Transportation Evaluation Page 5
Based on the ITE data and Project description, the proposed Project would generate approximately 1,200 gross daily trips, 180 gross AM peak hour trips, and 163 gross PM peak hour trips during weekdays.
Tesla provides TDM options for its employees and has a robust program that includes several alternative commute options. The close proximity of the new Warm Springs BART station further encourages employees to shift travel mode to more sustainable options. Shuttles provide primary trip services, last mile services and service for commuting between the various Tesla campuses in the Innovation District. Of the 470 employees, it is anticipated that at least 75 will participate in Tesla’s shuttle program, at least 78 employees will participate in the Scoop carpool program, and at least 21 will bike to/from work. The Shuttle program and bike trips include the last mile service from the ACE train station and Warm Springs BART station.
Since the Scoop service is internal to Tesla (i.e. only Tesla employees will drive or ride together), it is conservatively estimated that a maximum of 39 employees will continue to drive to the Project site while participating in the program and each will only carry one carpool passenger. Therefore, the TDM trip reduction assumed in this trip generation analysis would be (at a minimum) (75 + 78/2 + 21) / (470) = 28.7%, rounded down to 28%. Applying this TDM reduction to the gross existing trips results 336 fewer daily trips, 50 fewer AM peak hour trips, and 46 fewer PM peak hour trips.
Total weekday external trips for the proposed Project would therefore be approximately 864 daily trips, 130 AM peak hour trips, and 117 PM peak hour trips. Applying trip credits for the existing site, the Project would therefore result in -42 net new daily trips, -9 net new AM peak hour trips, and -20 net new PM peak hour trips. Therefore, implementation of the proposed Project would result in less traffic on the transportation network compared to the baseline condition. The trip generation analysis is shown in Table 1 below.

Tesla Redevelopment Project – Transportation Evaluation Page 6
Table 1 – Weekday Existing and Proposed Project Trip Generation
Land Use
ITE Land Use
Code
Size Unit
Daily AM Peak Hour PM Peak Hour
Rate Trips Rate In Out Total Rate In Out Total
Existing Conditions
Research & Development Center1,2 760 200 EMPLOYEES 3.29 658 0.51 73 29 102 0.52 15 89 104
Manufacturing2,5 140 100 EMPLOYEES 2.47 248 0.37 27 10 37 0.33 13 20 33
Existing Trips 906 100 39 139 28 109 137
Proposed Project
Research & Development Center3 760 45 EMPLOYEES 3.29 150 0.51 17 6 23 0.52 3 20 23
Manufacturing4,5 140 425 EMPLOYEES 2.47 1050 0.37 116 41 157 0.33 55 85 140
Gross Project Trips 1,200 133 47 180 58 105 163
Transportation Demand Management (TDM) Adjusted Reduction: 28%6,7 -336 -37 -13 -50 -16 -30 -46
Project Trips after TDM Reduction 864 96 34 130 42 75 117
Net New Project Trips
Net New Project Trips (Project Trips after TDM - Existing) -42 -4 -5 -9 14 -34 -20
Notes:
1. ITE (LU 760) Research & Development Center average assumed. Daily, AM and PM peak average rates assumed. Adjacent street peak rates used.
2. Baseline staff schedule is estimated to be a typical workday. Data provided by Tesla for previous use - solar panel: R&D and Manufacturing
3. Research & Development staff schedule is a typical daytime work hours. Data provided by Tesla.
4. Proposed manufacturing staff schedule occurs in shifts. For worst case analysis purposes, all the trips were calculated as arriving on a daily basis. 470 is the total work force at the project site. Daily attendnace is lower. Data provided by Tesla.
5. ITE (LU 140) Manufacturing average assumed. Daily, AM and PM peak average rates assumed. Adjacent street peak rates used.
6. Transportation Demand Management data for proposed staff provided in Tesla Transportation Department TDM report dated February 19, 2020.
7. Tesla TDM report estimates 78 scoop carpool participants. Scoop participants can be the driver or rider when carpooling. So TDM reduction for carpooling conservatively reduced to account for this. Calculation is: (78 scoop participates)x(0.5) = 39. TDM reduction = (75 shuttle participants + 39 scoop carpoolers + 21 bikes) / (470 total employees) = 28.7% adjusted TDM reduction. Conservatively assume 28% adjusted TDM reduction. Scoop service is internal to Tesla.
Source: Institute of Transportation Engineers (ITE) Trip Generation 10th Edition, 2017.

Tesla Redevelopment Project – Transportation Evaluation Page 7
3. VEHICLE MILES TRAVELED
With the passage of SB 743, VMT has become an important indicator for determining if a project will result in a “significant transportation impact”. While jurisdictions (lead agencies) have until July 1, 2020 to adopt thresholds of significance and fully implement the requirements of SB 743, VMT analysis was conducted for this project for informational purposes and per CEQA requirements. The City of Fremont has not adopted VMT thresholds yet.
Section 15064.3 of the revised CEQA Guidelines was adopted by OPR on December 28, 2018, and states that VMT is the appropriate measure of transportation impacts. Sections 15064.3(c) and 15007 also states that the provisions of this section shall apply prospectively, i.e. new requirements in CEQA Guidelines amendments will apply to steps in the CEQA process not yet undertaken by the date when agencies must comply with the amendments. Section 15064.3(c)further states that VMT analyses must be implemented statewide by July 1, 2020. Although not required, a VMT analysis consistent with CEQA Guidelines Section 15064.3 requirements is provided in this section for informational purposes only. The analysis reviews the Project pursuant to the screening criteria and suggested significance thresholds in OPR’s Technical Advisory. As noted in the advisory, the suggested screening criteria and significance thresholds are not binding, and lead agencies have the discretion to set or apply their own thresholds of significance. OPR’s Technical Advisory provides screening criteria for land use projects, transportation projects, and land use plans. For land use projects (such as the proposed Project), the Technical Advisory and Section 15065.3 subdivision (b)(1) states that “generally, projects within ½ mile of an existing major transit stop or an existing stop along a high-quality transit corridor should be presumed to have a less-than-significant impact on VMT.” The presumption of a less than significant impact would not apply, however, if project-specific or location-specific information indicates that the project will still generate significant levels of VMT.
Methodology and Assumptions While travel demand models (TDMs) are broadly considered to be amongst the most accurate of available tools to assess VMT, their use is not always an ideal fit depending on the unique characteristics of the project being evaluated and the data available. This was determined to be the case for the VMT evaluation of employee commute trips for the Tesla Research facility for two principal reasons: (1) based on employee address data provided, the extent of commute trip distribution extends beyond Alameda County. As such, the service area is well beyond the extent of the TDM maintained by the Alameda County Transportation Commission (ACTC); and (2) the complexity of the proposed TDM measures in terms of their trip-making impact cannot be accurately modeled using only the ACTC TDM.
In lieu of using a TDM, other data sources and assumptions were used as the basis for estimating the VMT for the conditions outlined in the introduction. The following presents the VMT analysis techniques for baseline (existing employee commute VMT) and the resultant VMT specific to the project are applied.
Tesla Redevelopment Project – Transportation Evaluation Page 8
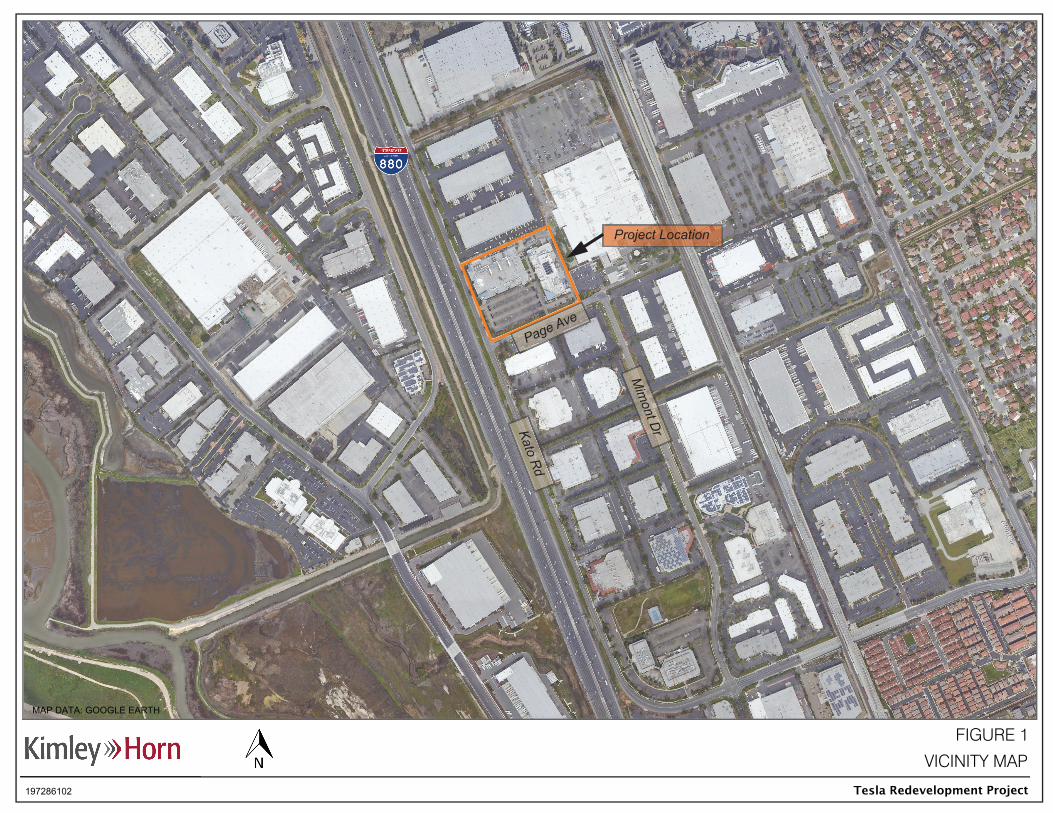
To calculate the average commute trip length, current employee address data provided by Tesla was mapped using the Geographical Information System (GIS) functions in the TransCAD software modeling package. TransCAD is the most used travel demand modeling/routing software package used by Metropolitan Planning Organizations (MPOs) in the United States. The complete data set was observed to include addresses that were significantly outside of a reasonable employee daily commute trip length (likely they were given during the application process and/or initial employment period and do not reflect the employees current address). Thus, the analysis was limited to an approximately 50-mile buffer around the Tesla Research facility to account for reasonable commute trip lengths, which excluded a small number of employee addresses. Two types of addresses were excluded from the analysis, those not located during address matching and addresses identified as not being reasonable locations for the basis of commute. This dataset was used as the basis for a multi-path analysis utilizing TransCAD to identify logical paths and estimate trip lengths for calculating VMT. Figure 3 shows a visual distribution of employee residences and the associated with the approximately 50-mile buffer.
Figure 3 – Visual Distribution of Employee Residences
It should be noted that this analysis considers only length as the basis of impedance (rather than time) so inherently it may not perfectly reflect actual route choices. However, given the size of the dataset and the likelihood of work schedules that correspond to differing time-of-day travel, it was determined that length was a reasonable proxy for route determinations. Figure 4 displays the distribution of the length of one-way employment trips to the site. Note that because the radius

Tesla Redevelopment Project – Transportation Evaluation Page 9
captured the 50-mile distance as a straight line, actual trip lengths of more than 50 miles (representing actual routes) were possible, but insignificant to the results.
Figure 4 – Distribution of Employment Trips
As shown, the majority of one-way employment trips are 45 miles or less. Based on an assumed employee presence of 300 employees per day for the No Project condition and 270 employees for the Project conditions, and based on the Transportation Demand Strategies provided, the total weekday employee commute VMT is estimated to be 14,124 vehicle-miles (Auto Only/Roundtrip) for the No Project and 9,478 vehicle-miles for the Project.
Note that for the purposes of this analysis the active transportation trips (“Bike”) reductions were taken from trips less than 10-miles in length based on a weighting of trip length (a 4% total auto trip reduction was assumed for the Project conditions). The 4% was provided as an actual mode split percentage based on Tesla employee bicycle travel and national bike travel data. The auto trip reduction related to bike also recognizes that some last mile bike trips from the Warm Springs BART station occur to the site, an approximate 3-mile one-way bike ride. Note that the introduction of bike trips has the net effect of lengthening overall weighted average auto trip length for the Project (in response to some short trips being converted from auto to bike), although total auto VMT is still reduced. Also note that the employee commute VMT estimate does not include any other off-site trips an employee might make that is not related to the commute to/from their residence (lunch off-site, errands, workday related trips, etc.).
Table 2 summarizes the data, assumptions, and findings in a tabular format. On a daily basis, no more than 270 employees are expected at the project site. Subsequently the VMT analysis

Tesla Redevelopment Project – Transportation Evaluation Page 10
assumes a daily commute trip generation and VMT. With Tesla TDM, the VMT for the Project would be less compared to the baseline VMT conditions.
Table 2 – VMT Estimate for Daily Employee Commute Only
Auto Percent EmployeesVehicle
Occupancy
One‐Way
Vehicle Trips
Auto (Drive Alone) 100% 300 1 300
Total Employees 300 Total 300
600
23.54
Total Auto VMT 14,124
Employees 300
47.08
Mode Split Percent EmployeesVehicle
Occupancy
One‐Way
Vehicle Trips
Auto (Drive Alone) 63% 170 1 170
Shuttle 16% 43 20 2
Scoop/Car Share 17% 46 2 23
Bike 4% 11 0 0
Total TDM 37%
Total Employees 270 Total 195
390
24.28
Total Auto VMT 9,478
Employees 270
35.10
‐210
0.74
Total Auto VMT ‐4,647
Employees ‐30
‐11.98Auto VMT/Employee
No Project
Project
Auto VMT/Employee
Delta (Project minus No Project)
Total Auto Trips (One‐Way times 2)
Average Auto Trip Length
Total Auto Trips (One‐Way times 2)
Average Auto Trip Length
Total Auto Trips (One‐Way times 2)
Average Auto Trip Length
Auto VMT/Employee

Transportation Department March 5, 2020

TDM Plan Fremont Energy
CONTENTS
1
Contents …………………..………………………………………………………………………....................1
Introduction & Goals ……………………………………………………………………………………………2
Tesla Shuttle …………………………………………………………………………………………………….3
Shuttle Time Table……………………………………………………………………………………………4-6
Bike Program……….……………………………………………………………………………………………7
Commuter Options………………………………………………………………………………………………8
Public Transit ……………………………………………………………………………………………...........9
Scoop Carpool Program ...……………………………………………………………………………………10
Flexible Alternative Commute Engagement ……... ……………………………………………………….11
Parking ………………………………………………………………………………………………..………..12
Transportation Management Hierarchy …………………………………………………………………….13
Conclusion ……………………………………………………………………………………………...….14-15

Transportation Demand Management
TDM Plan Fremont Energy
2
There are 366 parking stalls located at 47700 Kato Road and 1055 Page Avenue facilities in Fremont, collectively referred to as “Fremont Energy Facility,” and will be referred to as such throughout this study. Fremont Energy lies near public transit hubs such as Warm Springs BART, which is 2.9 miles away and the Fremont ACE Train, which is 9.6 miles away.
Fremont Energy is conveniently located 2 miles south of our main Fremont Factory and neighbors our seats production factory. This allows us to leverage our robust Transportation Demand Management (TDM) programs to and from this site. These programs include bicycle infrastructure and incentives, free Tesla commuter and last mile shuttles, public transit and Vanpool subsidy of $130/month, and discounted Scoop carpool matching services. We will describe each program in the following section.
Goals and Objectives: Based on surrounding building participation in the area, we can assume a 63% population drive-alone rate as headcount increases to similar population size. We expect the remaining 37% population to commute alternatively (43% Shuttles, 45% Scoop Carpool, and 12% bike). We hope to reduce the SOV rate by 5% throughout 2020. Tesla will deploy a competitive mix of alternative commute programs to reduce the reliance on single occupancy vehicles from its employees. This shift would not only reduce roadway congestion but would also support many environment, and sustainability goals that are true to Tesla’s mission. At full capacity, there could be up to 470 employees working during the week at Fremont Energy. If we assume the same commuting trends as our larger sites in the area, we anticipate that 37% of employees (174) would commute alternatively at the site and we would have an average of 63% (296) single-occupant vehicles at capacity.
Tesla, Inc.

Transportation Demand Management
TDM Plan Fremont Energy
3
Tesla prides itself with being a thought leader within the world of sustainability. With an operating fleet of over 120 vehicles, managing an efficient operation is paramount to achieving our corporate objectives.
In the Bay Area, we currently provide over 10,000 employee shuttle movements daily. We have over 350 active riders on our last mile shuttles.
Tesla shuttles are outfitted with many amenities to ensure our riders have a safe, efficient, and productive commute experience. With streaming, downloading, and conference calling capabilities on board, our employees can stay highly productive while commuting in our shuttles. We provide bike racks/bike storage on all commuter and last mile shuttles, each with the capacity to hold between 6-8 bikes. We actively seek opportunities to partner with other corporations or organizations to share shuttle resources and offer more robust program. Tesla tracks utilization across all of its current shuttle programs and will continue with this practice as we move forward. Dedicating a new fleet of vehicles for additional employee headcount, Tesla will have a combined capacity of 700 available seats connecting its campus across 15 surrounding cities.
Based on recent survey data that was sent out to Tesla employees regarding their commute modes and recorded ridership, we project roughly 75 of its 470 employees will utilize the shuttle services for their daily commute to Fremont Energy. Tesla plans to send future surveys to monitor.
Tesla Shuttle

TRANSPORTATION
TDM Plan Fremont Energy
4
Shuttles: Interoffice Connection
SF North Beach - Fremont Stop Mon-Fri
Shuttle Stop Location
SF - North Point St & Mason 6:45 AM SF- Van Ness & Lombard St 6:55 AM SF - Gough & Geary 7:00 AM SF - Gough St & Grove St. 7:04 AM
Inbound N Admin 8:30 AM 901 Page Ave Back 8:40 AM
Outbound 901 Page Ave Back 5:20 PM N Admin 5:30 PM
Shuttle Stop Location
SF - Franklin & Golden Gate 7:00 PM SF - Franklin & Bush St 7:05 PM SF - Van Ness & Filbert - PM 7:15 PM SF - North Point St & Mason 7:25 PM
SF Haight/Ashbury - Fremont Stop Mon-Fri
Shuttle Stop Location
SF - Stanyan & Waller 7:00 AM SF - 16th & Mission 7:17 AM SF - Cesar Chavez & Valencia 7:29 AM SF - Cesar Chavez & Florida 7:32 AM
Inbound N Admin 8:45 AM 901 Page Ave Back 8:55 AM
Outbound 901 Page Ave Back 5:20 PM N Admin 5:30 PM
Shuttle Stop Location
SF - Cesar Chavez & Florida - PM 6:45 PM SF - Cesar Chavez & Valencia - PM 6:49 PM SF - Van Ness & 16th 7:02 PM SF - Fell & Masonic - PM 7:18 PM SF - Stanyan & Waller 7:25 PM
Tesla’s Fremont Energy facility is accessed via shuttle routes that run directly to our 901 Page facility, which neighbors Fremont Energy site. The following schedules run directly from San Francisco, which then service Fremont Energy via transfer. There are also multiple routes from San Jose, East Bay, and the Central Valley. These offerings service our production employees across various shifts. All schedules are available via the commute planning app Tripshot. *901 Page shuttle stop is adjacent to and services Fremont Energy.

TRANSPORTATION
TDM Plan Fremont Energy
5
Shuttles: Interoffice Connection
We provide direct shuttle service for employees traveling between Palo Alto Headquarters and the Fremont Factory. They can access Fremont Energy via transfer. We also transport employees between the Fremont Factory, 901 Page, 1055 Page, and 47700 Kato facilities on a constant loop. This allows employees to travel amongst Bay Area sites in a shuttle, taking vehicles off the road and out of our parking lots.
TRANSPORTATION
TDM Plan Fremont Energy
6
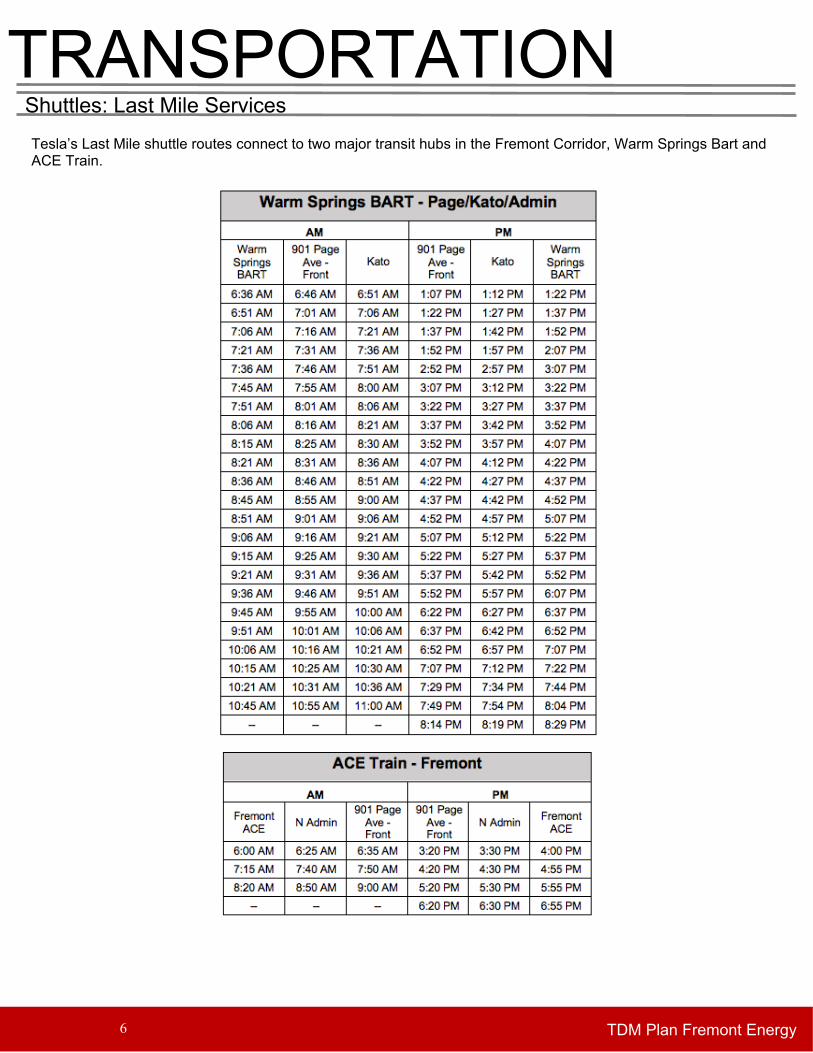
Shuttles: Last Mile Services
Tesla’s Last Mile shuttle routes connect to two major transit hubs in the Fremont Corridor, Warm Springs Bart and ACE Train.

Transportation Demand Management
TDM Plan Fremont Energy
7
Tesla supports and encourages employees to commute via bicycle. We work with internal teams on bike marketing and promotional events such as "Bike to Work Day" and outreach to new hires. We partnered with neighboring companies in Fremont to host 2019’s Bike to Work Day featuring an energizer station at Warm Springs Bart. We offer secure indoor bike rooms at multiple facilities where employees who take a Bike Pledge are granted access to use. When employees fill out the Bike Pledge, they promise to adhere to the California Vehicle Code, wear a helmet, and respect the rights of all road users.
We also provide bike racks/bike storage on all commuter and last mile shuttles, which is over 120 vehicles, each with the capacity to hold between 6-8 bikes. In the Bike to Tesla program, bicyclists can earn $5 for each day they commute to work via bike. The program is administered through DeroZap, an automated commuter tracking system which utilizes RFID (radio-frequency identification) technology.
Over 2,400 employees registered in the Bike to Tesla program since the program's inception. In the most recent month of January, 2020, close to 200 employees biked to work. We plan to have a Tesla survey sent in March, 2020 to have more inference on current population that will bike to Fremont Energy. Based on other Fremont offices in the area, we expected approximately 21 employees to commute to work via bicycle at Fremont Energy. To support the bicycle commuter population at the new site, we have indoor and outdoor bike racks that can hold up to 18 bicycles. We are adding additional bike racks. We also have multiple Fix-It Stations and tire pumps located onsite. Moreover, employees at Fremont Energy could have access to schedule mobile repairs through our partner Espresa.
We also offer resources on our internal site with links to the Fremont Bikeway Map and sent internal communications with information on how to navigate South Fremont. We are also are running an electric bicycle pilot at another bay area location to encourage bicyclists who need to commute farther distances or have challenging topography. If successful, we will look to expand the pilot to Fremont Energy and other Fremont offices.
Bike Program
TRANSPORTATION
TDM Plan Fremont Energy
8

TRANSPORTATION
TDM Plan Fremont Energy
9
Tesla offers each employee $255 pre-tax funds for commuter expenses; $130 is provided by Tesla. Employees are able to contribute up to $95/month as Tesla subsidizes $130/month for public transit, Vanpool, UberPOOL/Lyft Line through WageWorks. For the December 2019 benefit month, over 5,300 employees have already enrolled in their commuter benefits. Our last mile shuttle ridership numbers show that there are approximately 40 daily riders coming from ACE train, 65 riders daily from Caltrain, and over 300 daily riders from BART.
Tesla has strategically aligned last mile resources for Fremont Energy, bridging the gap between Bart, and AC Transit. Based on facilities in the area, Tesla is projecting over 75 employees will frequent public transit as their primary form of transportation to and from Fremont Energy.
Public Transit

TRANSPORTATION
TDM Plan Fremont Energy
10
Tesla highly encourages employees to carpool. We created a Carpool Interest Form and online database to help employees find others who work/live near them for traditional carpooling.
We also partner with Scoop to provide discounted on-demand ride matching carpooling services. Employees can carpool as often or as seldom as they like and choose between being a passenger or a driver. Being a passenger as a Tesla employee allows employees to book $0 rides and drivers get paid $8-$12 per passenger they pick up.
Since program launch in October 2016, we have seen 13% historic growth rate month over month. In 2019, Tesla saw 16,412 registered users which resulted in a monthly high of 47,344 matched one-way trips. We estimate this program takes over 653 cars out of our parking today. Since October, 2016 we had a total of 503,923 matched one-way trips and an estimated 9,739,037 pounds of CO2 saved. We are seeing hundreds of new employees register in Scoop each month, so we only anticipate this to grow as more headcount resides in Fremont Energy. We plan to have designated parking spaces for Scoop users at the new site. Tesla estimates a total of 78 employees of final headcount to commute through Scoop carpool.
Scoop Carpool Program
TRANSPORTATION
TDM Plan Fremont Energy
11
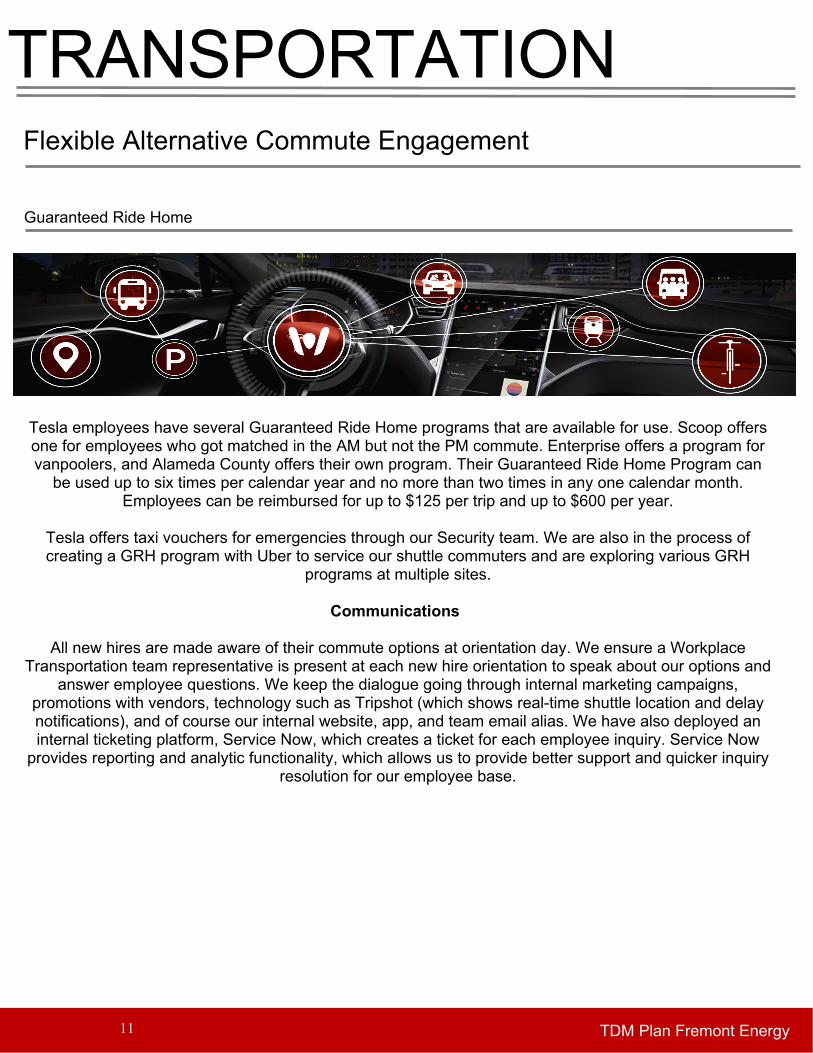
Guaranteed Ride Home
Tesla employees have several Guaranteed Ride Home programs that are available for use. Scoop offers one for employees who got matched in the AM but not the PM commute. Enterprise offers a program for vanpoolers, and Alameda County offers their own program. Their Guaranteed Ride Home Program can
be used up to six times per calendar year and no more than two times in any one calendar month. Employees can be reimbursed for up to $125 per trip and up to $600 per year.
Tesla offers taxi vouchers for emergencies through our Security team. We are also in the process of creating a GRH program with Uber to service our shuttle commuters and are exploring various GRH
programs at multiple sites.
Communications
All new hires are made aware of their commute options at orientation day. We ensure a Workplace Transportation team representative is present at each new hire orientation to speak about our options and
answer employee questions. We keep the dialogue going through internal marketing campaigns, promotions with vendors, technology such as Tripshot (which shows real-time shuttle location and delay notifications), and of course our internal website, app, and team email alias. We have also deployed an internal ticketing platform, Service Now, which creates a ticket for each employee inquiry. Service Now
provides reporting and analytic functionality, which allows us to provide better support and quicker inquiry resolution for our employee base.
Flexible Alternative Commute Engagement

TRANSPORTATION
TDM Plan Fremont Energy
12
Parking Tesla continues to grow and create more suitable products that helps keep the world in motion daily. We encourage our employees to commute in their electric vehicles (EV’s) when possible and create incentives for them to do so easily. We are expanding our onsite parking resources to increase our charging capacity at every site. With a growing infrastructure to support EV’s, it is imperative to create an alternative for our employees who chooses to commute with gas vehicles. We provide 366 parking stalls at Fremont Energy and 2 electric chargers. We provide 8 motorcycle parking stalls and 18 bike parking stalls. Additional EV Chargers are located at 901 Page, which neighbors Fremont Energy.

TRANSPORTATION
TDM Plan Fremont Energy
13
Henry Pinnix is responsible for overseeing the TDM implementation and all its programs,
ensuring/increasing adoption, tracking utilization, and measuring performance. Henry has over seven years’ experience in the Transportation industry, including two years running the Transportation
department at Tesla globally.

TRANSPORTATION
TDM Plan Fremont Energy
14
Offering various commute options allow for our modes to be accessible to the all of our employees. We distribute annual surveys to track our performance across all modes and use these results to determine how and where we should adjust our mix to meet the developing demand. Our surveys provide us with action driven results and make for a very strategic approach. The critical data that we are able to extract from our findings makes for a strong forecasting model, informing us of places where future demand could potentially increase. An effective TDM program requires participation and cooperation from all contributing parties. Tesla’s ability to improve surface street traffic surrounding its facilities has shown to be strategic and beneficial to its neighbors. Operating a site-specific mix of alternative commute modes, Tesla’s solutions will lead to many direct and indirect reductions in single occupancy vehicles. Tesla is the leader in sustainable mobility and is constantly working to develop new commute solutions to shape the future of transportation. At this time, 37% of our employees commute alternatively, with 63% commuting via single occupancy vehicles. Overview below:
Employees Working at Fremont Energy
Existing Conditions 300
Future Conditions 470
Net Employee Growth 170
Parking Type Stall Count Vehicle Parking Stalls 366 Motorcycle Parking 8
Bicycle Parking 18 Total Stall 392
Baseline trip generation Total Net Employees 63% SOV Rate 37% Commute Alternative Previously 300 189 111
Future Headcount 470 296 174Total Impact 470 296 174
Conclusion

TRANSPORTATION
TDM Plan Fremont Energy
15
Tesla will continue to launch, monitor and report metrics that highlight our success with our transportation demand management programs. The monitoring and reporting will commence on the anniversary of the program and will include the following:
• Employee surveys • Data collected from the employee surveys and Service Now tickets • Quantitative information on the mode choice.
a. Shuttle ridership: Analyzed monthly to track adoption and efficiencies b. Bike ridership c. # of employee using various incentives d. Any changes implemented to the TDM. e. Plans for the subsequent year.
Mode Anticipated Participation Percentage of Commute Alternative
(of the 37%)Shuttle 75 43%Scoop 78 45%Bike 21 12%Total 174 100%