territorial units in russia, ukraine, belarus and moldova...
TRANSCRIPT

0
Territorial units in Russia,
Ukraine, Belarus and
Moldova and NUTS classification
CONTENT
In the parts 1, 2 and 3, this technical report
depicts the territorial division history in
Russia, Ukraine and Belarus. This document
is especially useful for defining similar to
NUTS regions (SNUTS) for these countries.
In the fourth part, the post-soviet
demographic trends are analyzed by main
components (fertility, mortality,
migrations)
39 pages
JUNE 2013

1
LIST OF AUTHORS
Kolosov Vladimir, National Academy of Science of Russia, Moscow

2
TABLE OF CONTENT
1 Russian federation territorial divisions ........................... 3
1.1 The late Soviet period: from 1975 to 1991 ....................................... 3
1.2 The early post-Soviet period: the 1990s .......................................... 6
1.3 The post-Soviet period: the 2000s .................................................. 9
1.4 The merging of Russia’s regions. ..................................................... 9
1.5 The municipal reform ................................................................... 12
1.6 The post-Soviet period: the 2010s ................................................. 13
2 Ukraine territorial divisions ........................................... 15
3 Belarus territorial divisions ........................................... 20
4 The post-soviet dynamics of population in Russian Federation, Ukraine, Belarus and Moldova ......................... 22
4.1 Russia ........................................................................................ 22
4.2 Ukraine....................................................................................... 30
4.3 Belarus ....................................................................................... 33
4.4 Moldova ...................................................................................... 36
Bibliography....................................................................... 38

3
1 Russian federation territorial divisions
During the 20th century Russia’s hierarchy of territorial administration and the composition of territorial units were changed considerably many times, but
since the 1960s the system remained more or less stable. The political-territorial organization of the country is to a large extent inherited from the
Soviet past, i.e. from Russian Soviet Federal Socialist Republic, the main part of the former Soviet Union in terms of area, population and economic
potential. However, even if the territorial pattern of administrative-territorial units was not changed much, the status and the functions of territorial units
were considerably modified.
1.1 The late Soviet period: from 1975 to 1991
The RSFSR accounted for three-fourths of the former USSR’s territory, more
than a half of population, two-thirds of the industrial output, and roughly a half of the agricultural output. Its area made up 17,075,400 sq. km, and the
population – 133,741,000 (Jan. 1, 1975).
The RSFSR included 16 autonomous republics (ASSR), 5 autonomous oblasts
(AO), 6 krais, 49 oblasts, and 10 autonomous okrugs (AOk). As a rule the oblasts and krais beard the names of their capitals, and the autonomous
territorial units – the names of the titular ethnic group which was supposed to receive the right to self-determination within its limits. In case when two ethnic
groups were reunited within the same administrative units both names
composed the unit’s denomination (for instance, the Karachai-Cherkesian Autonomous Oblast).
Autonomous republics had their own constitutions, parliaments (Supreme Soviets) and governments (Councils of Ministers). Each autonomous republic
was represented in the Presidium of the Supreme Soviet of RSFSR by its deputy Chair. Autonomous republics also had some special rights – for
instance, they had a research institute which studied history, culture, literature and art of the titular ethnic group(s). In only four autonomous republics these
group(s) was dominant by number.
Autonomous oblasts (AO) had a lower status than ASSR, but they were also
ethnic state formations and were enjoying a positive discrimination and certain independence in local affairs. The Adygei AO was an enclave in Krasnodarsky
krai, and Karachai-Cherkess AO – in Stavropolsky krai. Titular group(s) did not have a majority in all of them.
Autonomous okrugs were the subordinated parts of the krais or oblasts, and
provided with an ethno-cultural autonomy small compact minorities living in the regions dominantly populated by Russians. Their population enjoyed a
positive discrimination having a privileged access to education and had unofficial quotas in representative bodies (Soviets).

4
ASSR and AO could be considered as NUTS1. But their “autonomy” and
“federalism” had a rather decorative character, with the exception for the right
to cultural representation. So, the ASSR and AO have to be rather included into NUTS2, as well as such territorial units as AOs, oblasts and krais.
There is also another possibility to represent the NUTS1 level in the former RSFSR. Centralized economic governance and planning in the country with the
huge territory and important gaps in the number of population and the level of economic development and specialization between different provinces needed
the use of planning regions. To satisfy these needs, the macro-territorial zoning of Russia’s territory was proposed in the late 1920s. It was argued that
economic macro-regions had been formed “naturally” under economic logic regardless of the ethnic composition or political raisons and they were the
“real”, and not imagined, “socially constructed” territorial units created around leading industrial centres and areas and including economically mutually
complementing territories, not depending on the ethnic composition of their population. The scheme of economic regionalization was for several times
modified, and at the late 1950s RSFSR was divided into ten economic macro-
regions. For the last time their boundaries were changed in 1966. Planning regions did not have any political or administrative authorities, except for a
short period between 1957 and 1962 when Nikita Khrushchev, the then First Secretary of the PCUS Central Committee and at the same time Chair of the
Council of Ministers of the USSR, proclaimed the policy of decentralization and created the so called Council of National Economy (sovnarkhozy). On the last
years of his rule, in 1962-1964, they were fragmented, and practically each oblast possessed its own sovnarkhoz. Large planning, or economic regions
were widely used by economists and geographers in their analysis until the end of the USSR. They are also known under the name of Gosplan regions (Gosplan
is the Russian abbreviation of the State Planning Committee). The list of the economic macro-regions was the following: 1) North-West, 2) Centre, 3)
Volga-Viatka economic regions, 4) Centre-Black Soils, 5) Volga, 6) North Caucasus, 7) Ural, 8) West Siberia, 9) East Siberia and 10) Far East (table 1).
In 1986, the eleventh economic region – the North - was separated from the
North-West. It included Karelia ASSR, Komi ASSR, Nenetz AO, Arkhangelskaya oblast, Vologodskaya oblast and Murmanskaya oblast. The boundaries of
economic macro-regions matched the external boundaries of oblasts, krais or other NUTS2 which made part of them.
The NUTS3 level in RSFSR time was represented by rayons and cities (the largest cities had their internal administrative division by city’s rayons). At the
end of the Soviet era the NUTS3 level of RSFSR consisted from 1830 rayon and 1030 cities with 400 urban rayons. The most important cities in each NUTS2
constituted territorial-administrative units on their own and were directly subordinated to the authorities of an oblast, krai, autonomous republic, etc.
Small towns made a part of regular rayons.

5
Table 1 - Nomenclature of territorial units for statistics.
NUTS1, NUTS2 and NUTS3 level in the former RSFSR (1975) NUTS1 NUTS2 NUTS3
Name Territory
(sq.km)
Population
(thous.)
Cities (number) Rayons
(number)
RSFSR 17,075,400 133,741 1,775 986
North-Western Economic Region 1,662,800 12,749 138 115
Arkhangelsk oblast 587,400 1,430 19 11
Nenets Autonomous Okrug 176,700 40, — 1
Leningrad Oblast 85,900 5,806 16 35
Murmansk Oblast 144,900 905 4 11
Novgorod Oblast 55,300 718 21 10
Pskov Oblast 55,300 857 24 14
Vologda Oblast 145,700 1,284 26 15
Karelian ASSR 172,400 726 15 12
Komi ASSR 415,900 1,023 13 7
Central Economic Region 485,100 28,255 286 236
Briansk Oblast 34,900 1,527 23 15
Ivanovo Oblast 23,900 1,319 19 17
Kalinin Oblast 84,100 1,684 36 22
Kaluga Oblast 29,900 987 23 17
Kostroma Oblast 60,100 806 24 11
Moscow Oblast 47,000 13,708 39 71
Orel Oblast 24,700 890 19 7
Riazan’ Oblast 39,600 1,369 24 11
Smolensk Oblast 49,800 1,087 23 14
Tula Oblast 25,700 1,932 23 21
Vladimir Oblast 29,000 1,545 16 20
Yaroslavl Oblast 36,400 1,401 17 10
Volga and Viatka Region 263,300 8,261 142 64
Gorky Oblast 74,800 3,652 47 25
Kirov Oblast 120,800 1,661 39 19
Chuvash ASS 18,300 1,263 21 9
Mari ASSR 23,200 694 14 4
Mordovian ASSR 26,200 991 21 7
Central Chernozemny Region 167,700 7,787 113 48
Belgorod Oblast 27,100 1,258 18 9
Kursk Oblast 29,800 1,411 25 9
Lipetsk Oblast 24,100 1,209 18 8
Tambov Oblas 34,300 1,419 22 8
Voronezh Oblas 52,400 2,490 30 14
Volga Region 680,000 18,960 254 102
Astrakhan Oblast 44,100 904 10 4
Kiubyshev Oblast 53,600 3,005 25 10
Penza Oblast 43,200 1,498 27 10
Saratov Oblast 100,200 2,505 37 17
Ul’ianovsk Oblast 37,300 1,229 20 6
Volgograd Oblast 114,100 2,420 32 18
Bashkir ASSR 143,600 3,825 54 17
Kalmyk ASSR 75,900 275 12 3
Tatar ASSR 68,000 3,299 37 17
Northern Caucasus Region 355,100 15,003 180 94
Krasnodar Krai 83,600 4,687 39 27
Adygei AO 7,600 401 6 1
Stavropol’Krai 80,600 2,421 33 19
Karachai and Cherkess AO 14,100 358 7 3
Rostov Oblast 100,800 3,992 39 22
Tchechen and Ingush ASSR 19,300 1,137 14 5
Dagestan ASSR 50,300 1,539 39 8
Kabardin and Balkar ASSR 12,500 643 8 7

6
North Osetiya ASSR 8,000 584 8 6
Ural Region 680,400 15,306 173 121
Cheliabinsk Oblast 87,900 3,368 24 27
Kurgan Oblast 71,000 1,062 23 9
Orenburg Oblast 124,000 2,071 34 10
Perm’ Oblast 160,600 2,979 37 25
Komi-Permiak AO 32,900 184 6 1
Sverdlovsk Oblast 194,800 4,383 30 44
Udmurt ASSR 42,100 1,443 25 6
Western Siberian Region 2,427,200 12,379 193 64
Altai Krai 261,700 2,643 64 10
Gornyi Altai AO 92,600 166 8 1
Kemerovo Oblast 95,500 2,918 16 19
Novosibirsk Oblast 178,200 2,543 30 14
Omsk Oblast 139,700 1,871 31 6
Tomsk Oblast 316,900 824 16 3
Tiumen’ Oblast 1,435,200 1,580 36 12
Khanty and Mansi AO 523,100 390 7 5
Yamal-Nenets AO 750,300 118 7 2
Eastern Siberian Region 4,122,800 7,827 142 61
Krasnoiarsk Krai 2,401,600 3,065 55 20
Khakass AO 61,900 462 8 4
Evenki AO 767,600 14 3 —
Taimyr (Dolgan and Nenets)
AO
862,100 42 3 1
Chita Oblast 431,500 1,207 28 10
Aga-Buriat AO 19,000 69 3 —
Irkutsk Oblast 767,900 2,452 4 —
Ust’-Orda Buriat AO 22,300 138 28 10
Buriat ASSR 351,300 852 19 5
Tuva ASSR 170,500 251 12 5
Far East Region 6,215,900 6,435 141 59
Khabarovsk Krai 824,600 1,483 21 9
Jew AO 36,000 187 5 2
Primorskiy Krai 165,900 1,902 24 9
Amur Oblast 363,700 869 20 8
Kamchatka Oblast 472,300 346 11 1
Koriak Autonomous Okrug 301,500 33 4 —
Magadan Oblast 1,199,100 426 16 4
Chukchi AO 737,700 122 8 2
Sakhalin Oblast 87,100 653 17 19
Yakut ASSR 3,103,200 756 32 9
*Kaliningrad oblast was a part
of Baltic Economic Region
together with Estonia, Latvia
and Lithuania
15,100 779 13 22
1.2 The early post-Soviet period: the 1990s
The period of 1989-1991 was turbulent. Regional and ethnic conflicts were
escalating, political and economic difficulties quickly aggravated and undermined the entire political and economic basis of the USSR. In these
conditions, RSFSR was the first Soviet Republic to declare its sovereignty and the supremacy of its legislation over the laws of the USSR. Other Soviet
Republics followed its example and issued declarations of sovereignty which

7
put under question the very existence of the USSR. The “parade of
sovereignties” had the destructive political nature. The “parade of
sovereignties” concerned not only Soviet Republics, but also autonomous republics, autonomous oblasts and okrugs of RSFSR. All autonomous oblasts
but one (the Jewish Autonomous oblast in the Far East) raised their status to the rank of autonomous republics. Soviet central authorities saw in it a
counter-balance to the ambitions of Baltic, Georgian and Moldovan national/secessionist movements and a tool to prevent the realization of their
plans. It became obvious that sooner or later Soviet republics would apply the provision of the USSR Constitution that granted them with the right to live the
Union. To prevent it, Soviet politicians looked for different ways to save the integrity of the USSR; their hopes were backed by the results of the
referendum held on 17 March 1991: more than 75% of voters were in favour of the continuation of the USSR’s existence. Different versions of the new
Union Treaty were widely discussed in spring and summer 1991. Its objective was to create a new federation of the post-Soviet republics with a common
political and economic space, but greater autonomy. Finally, after long
negotiations, most republics except for Estonia, Latvia, Lithuania, Moldavia and Georgia agreed to sign the new Federation Treaty on August 19, 1991. But the
coup d’état organized by a group of conservative politicians on the same day led to the collapse of the Soviet Union. These events had a big impact on later
Russian approaches to federalism and territorial administration.
The new Constitution of the new Russian state – Russian Federation was
adopted at the referendum held on 12 December 1993. Prior to this date, the administrative-territorial structure of Russia was regulated by the Decree of
the Presidium of the Supreme Soviet of the RSFSR on August 17, 1982. The newly constituted entities of the Russian Federation (the Subjects of
Federation) were republics (21), autonomous oblast (1), autonomous okrugs (4), oblasts (46), federal cities (2 – Moscow and St.-Petersburg), and leased
territory of Baikonur (fig. 1). Moscow, the capital of the USSR, has always had the status of an oblast (NUTS2 level) and was administratively separated from
the oblast it was the centre; since that time, St. Petersburg got the same
status. From the statistical perspective, the subjects of Federation are at the same level of hierarchy (NUTS2), but their competences were different,
especially until the arrival to power of President Putin (2000). Unlike the Soviet time, some “ethnic” territorial entities, particularly the most populated and
economically important of them like Tatarstan, Bashkiria or Yakutia, developed their own legislation and systems of power. Their leaders bargained with
central authorities claiming more competences, speculating on the threat of the strengthening of radical nationalist movements and political destabilization.
Their special rights were fixed in the treaties on the separation of competences between them and the federal centre. The republics were followed by a
number of “Russian” regions. In total, Moscow signed 46 such treaties with the subjects of federation. So, the real political status of republics or even some
“Russian” regions significantly differed from the others. As a result, the situation of the so called “asymmetric federation” was created. The supremacy
of the federal legislation was restored only in the early 2000s, as well as the
unification of the fiscal system and political status of the subjects of federation.
The treaties on the separation of competences were not extended.

8
The turmoil of the early 1990s provoked the de-facto secession of Chechnia
and the partition of the Republic of Checheno-Ingushetia (Ingushetia preferred
to remain a part of Russian Federation), and then two local wars against separatists. In 1992, the army had to intervene for stopping the bloody conflict
between the republics of Ingushetia and North Ossetia over the boundaries between them. In the same period, the federal parliament adopted the
decision to freeze for a while the boundaries between the subjects of federation for avoiding such conflicts. Apparently, the delimitation of the
boundaries in North Caucasus is not anymore a political priority or at least it is a latent problem. In other parts of Russia, population accepts the boundaries
between the subjects of federation most of which were established long time ago (in some cases, in the late 18th century).
The 1993 Constitution did not include the provisions on the local administrative-territorial division at the level NUTS3. It was considered as a
joint responsibility of the federal government and the subjects of federation. But in the 1990s it was interpreted by regional and republican authorities as
their exclusive competence. As a result, the change in territorial pattern of
administration was used by them as a political tool for self-assertion and for the replacement of local elites. At the level of NUTS3 a number of large cities
including St.-Petersburg extended their territories to the neighboring suburban rayons comprising small cities and rural areas. In different oblasts some
rayons were merged. However, this modifications did not significantly change the system.
The only exception in this period was the radical reform of the territorial administration in the city of Moscow in 1993, which made incompatible Soviet
and Russian statistical data. The two-level system (city + 34 city’s rayons) was replaced by a three-level system (city + 10 administrative okrugs called
“prefectures” + 125 city’s rayons called “municipalities”). The administrative boundaries were completely redrawn. Nine administrative okrugs are in
properly Moscow while the tenth one, is formed by the city of Zelenograd located in 45 km northwest from Moscow. Okrugs are not self-governing units
while municipalities have elected local councils. Since 1993, the number of
city’s rayons (municipalities) slightly changed but the administrative boundaries were not modified.
Figure 1 – National Repubics
and Autonomous Regions of the Russian Federation
before December 1, 2005

9
1.3 The post-Soviet period: the 2000s
In 2000 V. Putin proposed to create seven federal okrugs (FO) “in order to
ensure the implementation of the President’s constitutional competences”: 1) the Central FO, 2) the North-Western FO, 3) the Volga FO, 4) the Southern FO,
5) the Ural FO, 6) the Siberia FO and 7)the Far Eastern FO. The institute of Plenipotentiary Representative of the President in Federal Okrugs was also
established.
The main objective of new institutions was to restore the control of federal
authorities over republics and regions, the “harmonization” of regional laws with the federal constitutional norms and legislation, and the coordination of
federal programs. The reform also restored the control of central authorities
over the law enforcement system (police, courts, etc.), the fiscal system and the spending of federal money. There are no provisions on federal okrugs in
the Constitution or in any law. Their boundaries closely matched the boundaries of military districts (abolished few years ago). At the same time,
the administration of Putin changed the ratio between the federal and local budgets in the consolidated public budget in favour of the centre.
The boundaries of federal okrugs have little to do with natural, economic, social or cultural delimitations. Nevertheless, they may be useful for a
statistical analysis at the NUTS1 level because they represent a territorial framework for a number of federal programmes. President’s representatives in
the okrugs sometime play an important role in the resolution of conflicts between regional elites. The creation of federal okrugs creation was positively
perceived by public opinion because it helped to put the end to the “asymmetry” of the federation, to improve regional governance and to remove
from power some odious republican “princes”.
In January 2010 the Southern FO was split into two parts called the Southern FO and the North Caucasian FO. Thus, the number of Federals Okrugs
increased to eight.
1.4 The merging of Russia’s regions.
The idea to reduce the number of the subjects of federation, to downgrade the role of “ethnic” republics and to get rid of enormous differences in territory,
population and economic potential between the regions has been widely discussed since the disintegration of the Soviet Union. In 2003 federal
authorities started the campaign of the regions’ merging (ukrupnenie regionov”) which should amalgamate a number of the subjects of federation
into integrated large and economically viable political-territorial units. The
officially objective of this reform was to improve the economic situation in poor regions vis-à-vis their wealthier neighbours. The first attempt to realize this
idea was undertook at 2003 by the administrations of Perm oblast and Komi-Permyak Autonomous Okrug. After the referendum held in 2004 these two
Subjects of Federation were merged within the newly created territorial entity called Permsky krai which officially exists since 1 December 2005. Komi-

10
Permyak Okrug kept its autonomous status within Perm Krai during the
transitional period of 2006–2008. It also kept a separated budget, saving
federal transfers. Since 2009, Komi-Permyak Okrug's budget became subject to the budgeting law of Permsky Krai.
In 2007 another two new territorial entities were created. Kamchatka krai is a result of the merging of Kamchatka oblast with Koriak Autonomous Okrug.
Krasnoyarsky kept its name but it incorporated weakly populated Dolgan and Nenets Autonomous Okrug and Evenki Autonomous Okrug (table 2).
The disappearance of some Autonomous Okrugs’ from the political map of Russia did not meet strong opposition of their elites. The loss of the status and
political power was partly compensated by transfers from the federal budget. State-controlled media, along with other governmental media resources, were
mobilized to persuade public opinion that the merging of regions would lead to greater economic performance; countervailing opinions were excluded from the
discussion. For example, the governor of Krasnoyarsky krai stated that the merging of krai with two neighboring autonomous okrugs would lead to a “new
industrialization of Siberia.”
The attempts of a further application of this practice obviously risked to provoke important conflicts and met the resistance of the “ethnic” entities.
Nevertheless, in 2008 the next two subjects were created by the same way. Under federal pressure and despite of the growing local protests Irkutskaya
oblast absorbed the Ust’-Orda Buriat Autonomous Okrug, and the Zabaiykalsky krai was created as a result of the merging of Chita oblast and Aga-Buriat
Autonomous Okrug.
Table 2 - The merging of the subjects of Russian Federation, 2003-2007 Referendum date Merger date Merged subjects New subjects
December 7, 2003 December 1, 2005 Permskaya Oblast + Komi-
Permyak Autonomous Okrug
Permsky Krai
April 17, 2005 January 1, 2007 Krasnoyarsky Krai + Evenk
Autonomous Okrug + Taymyr
(Dolgano-Nenets) Autonomous
Okrug
Krasnoyarsky Krai
October 23, 2005 July 1, 2007 Kamchatskaya Oblast + Koryak
Autonomous Okrug
Kamchatsky Krai
April 16, 2006 January 1, 2008 Irkutsk Oblast + Ust-Orda
Autonomous Okrug
Irkutskaya Oblast
March 11, 2007 March 1, 2008 Chita Oblast + Agin-Buryat
Autonomous Okrug
Zabaykal’sky Krai

11
Table 3 - Russia’s territorial units (NUTS1 and NUTS2). NUTS1 Territory,
sq.km. Population (2010)
NUTS2 NUTS2 (Subject of Federation)
Central FO 652,800 38,438,600 18 Oblasts: 1) Belgorodskaya, 2) Bryanskaya, 3) Vladimirskaya 4) Voronezhskaya, 5) Ivanovskaya, 6) Kaluzhskaya, 7) Kostromskaya, 8) Kurskaya, 9) Lipetskaya, 10) Moskovskaya, 11) Orlovskaya, 12) Ryazanskaya, 13) Smolenskaya, 14) Tambovskaya, 15) Tverskaya, 16) Tulskaya, 17) Yaroslavskaya, Federal City: 18) Moscow
North-Western FO 1,677,900 13,583,800 11 Republics: 1) Karelia, 2) Komi AO: 3) Nenets AO Oblasts: 4) Arkhangelskaya, 5) Vologodskaya, 6) Kaliningradskaya, 7) Leningradskaya, 8) Murmanskaya, 9) Novgorodskaya, 10) Pskovskaya Federal City: 11) Sankt-Peterburg
Volga FO 1,038,000 29,900,400 14 Republics: 1) Bashkiria, 2) Mariy El, 3)Mordovia, 4) Tatarstan, 5) Udmurtia, 6) Chuvashia Krais: 7) Permsky krai Oblasts: 8) Kirovskay, 9) Nizhegorodskaya, 10) Orenburgskaya, 11) Penzenskaya, 12) Samarskaya, 13) Saratovskaya, 14) Ulianovskaya
Southern FO 418,500 13,856,700 6 Republics: 1) Adygea, 2) Kalmykia Oblasts: 3) Astrakhanskaya, 4) Rostovskaya, 5) Volgogradskaya Krais: 6) Krasnodarsky krai
North Caucasus FO 170,700 9,496,800 7 Republics: 1) Dagestan, 2) Ingushetia, 3) Kabardino-Balkar, 4) Karachai-Cherkess, 5) Northen Osetia-Alania, 6) Tchechen, Krais: 7) Stavropolsky kray
Ural FO 1,788,900 12,082,700 6 Oblasts: 1) Kurganskaya, 2) Sverdlovskaya, 3) Tcheliabinskaya, 4) Tyumenskaya, including AO: 5) Khanty-Mansi AO, and 6) Yamalo-Nenets AO
Siberia FO 5,114,800 19,254,300 12 Republics: 1) Altai, 2) Buriatya, 3) Tyva, 4) Khakassia Krais: 5) Altaisky, 6) Zabaikal’sky, 7) Krasnoiarsky Oblasts: 8) Irkutskaya, 9) Kemerovskaya, 10) Novosibirskaya, 11) Omskaya, 12) Tomskaya
Far Eastern FO 6,215,900 6,291,900 9 Republics: 1) Saha (Yakutia) AO: 2) Chukotsky AO, 3) Jewish AO Krais: 4) Kamchatsky, 5) Primorsky, 6) Khabarovsky Oblasts: 7) Amurskaya, 8) Magadanskaya, 9) Sahalinskaya
After 2008 none regions have been merged. Thus, the total number of the
subjects of Russian Federation (NUTS2) decreased from 89 to 83, far from the declared goal of 50, 40 or even 30. The current composition of NUTS1 and
NUTS2 looks as following (table 3).

12
1.5 The municipal reform
Besides the creation of federal okrugs and of the regions’ merging, the early
2000s were marked by the adoption in 2003 of the important federal law N° 131 “On the General Principles of Local Self-Government”. It has radically
changed the structure and the hierarchy of local governments and their relations with the administrative-territorial division at the NUTS3 level. The
period of transition to the full implementation of this law lasted from 2003 till 2006. Russia switched to a two-levels model of local governance (fig. 3). As a
result of transition from a one- to a two-levels model of local governance the number of municipal entities in Russia increased from 11,733 to 24,372.
Figure 2 - The hierarchy of local governments and NUTS in Russia
The first level consists of urban and rural settlements, the second includes
municipal rayons and urban districts (okrugs). Urban settlements can comprise only one town or urban type settlement but may also embrace neighbouring
rural settlements (villages). A municipal rayon includes a number of urban
and/or rural settlements and the territories between them. An urban district is a town endeavoured with the same status as a municipal rayon (NUTS3).
Usually, municipal rayons are created in an administrative rayon. But in 49 cases municipal rayons include two and more administrative rayon. In other
words, few administrative rayons do not have local governments (are not territorial collectives). All of such rayons are located in Kaliningrad, Sverdlovsk
and Sakhalin oblasts.
The relation between towns and urban districts is more complicated. Some
“administrative” cities can comprise both urban and rural settlements, while urban districts – only rural settlements. In other terms, an urban district can
consist of only one town. The number of urban districts is 17% less than the number of the cities submitted directly to regional administrations. Only 90%
of towns and urban settlements making part of administrative rayons are territorial collectives, i.e. form urban districts.

13
The new approach provoked important changes both in the structure and the
organization of the budget system. Now municipalities of all levels have their
own budgets, so the system became much more complicated.
The key issue discussed by experts and local communities was whether the
municipal reform has provided local governments (NUTS3) with more economic independence from arbitrary decisions taken by regional administrations
(NUTS2). In practice, despite of the constant increase of municipal budgets the real economic and financial autonomy of municipalities has been
constrained considerably because first of all of the change in the sources of their incomes. Local governments got the right for taxes which for many
objective reasons are difficult to collect (for instance, the real estate tax in the countryside and small towns). The list of local taxes was shortened and their
share in total tax incomes of aggregated local budgets dropped to only 10%. As a result, the dependence of local governments on the transfers from the
regional level increased substantially.
The budget provision of different types of municipalities varies within a wide
range. Cities have the best financial provision, but the share of such
municipalities is only 8.7%. The share of municipal rayons with the same level of local budget revenues is 27.9%. The share of rural settlements with the
highest level of dependence on regional transfers accounts for 56.9%. So, the cities and municipal rayons concentrate the main part of tax revenues, while
small urban-type settlements and villages are deprived of the real autonomy, do not have enough skilled staff and have to delegate their rights and duties to
municipal rayons or even to regions (subjects of federation). Thus, the municipal reform of 2003-2006 led to the creation of numerous small and
weak municipal units.
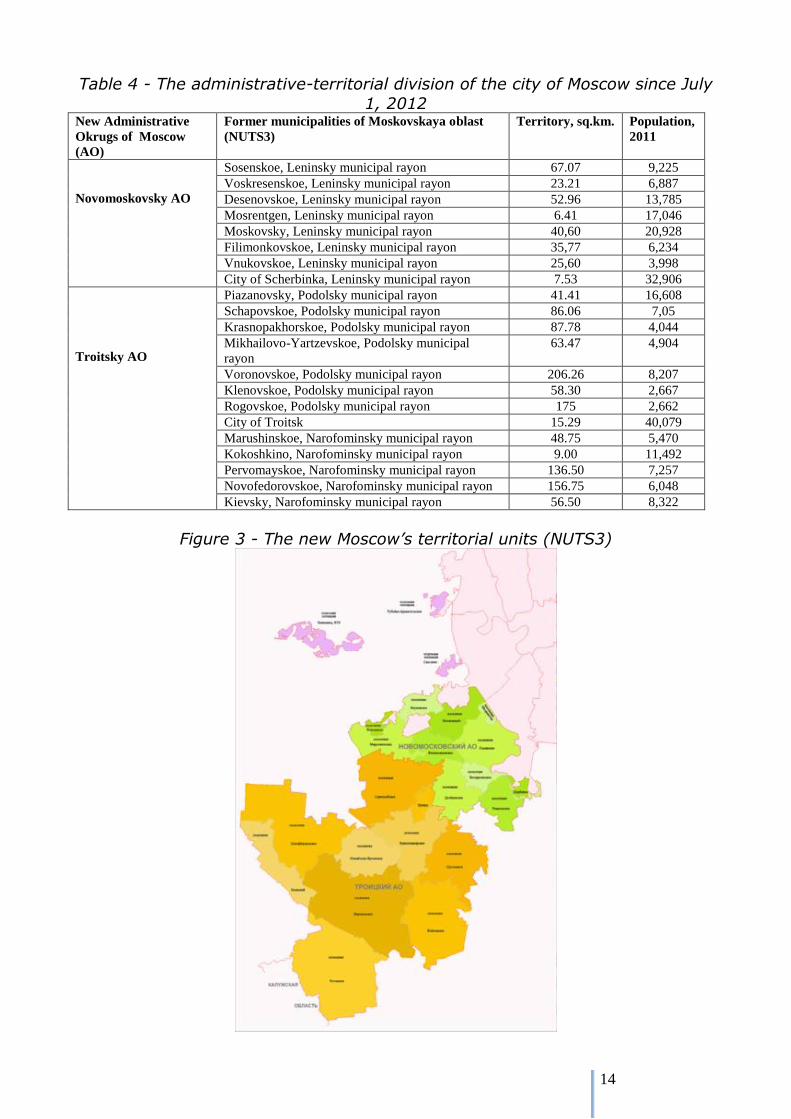
1.6 The post-Soviet period: the 2010s
At the St. Petersburg International Economic Forum in June 2011 D. Medvedev
– the then President of Russian Federation, proposed to create the Metropolitan federal okrug and to extend the territory of Moscow beyond
the “traditional boundaries”. A new federal okrug was not created, but the enlargement of Moscow territory was approved by first by Moscow Duma
(city’s parliament) and later by the State Duma. As a result the territory of Moscow doubled: it grew up from 1,070 sq. km. to 2,560 sq km. The so called
New Moscow incorporated two towns (Troitsk and Shcherbinka) and 19 municipal units previously belonging to Moskovskaya oblast. But the population
of the capital increased only by 250,000 inhabitants1. Two new administrative okrugs were created on the new territory - Novomoskovsky and Troitskiy
(table 4. fig.3). The distance between the city center and its peripheral areas now exceeds 100 km.
1 For the reasons of this decision and its critics, see, for example
14
Table 4 - The administrative-territorial division of the city of Moscow since July
1, 2012 New Administrative
Okrugs of Moscow
(AO)
Former municipalities of Moskovskaya oblast
(NUTS3)
Territory, sq.km. Population,
2011
Novomoskovsky AO
Sosenskoe, Leninsky municipal rayon 67.07 9,225
Voskresenskoe, Leninsky municipal rayon 23.21 6,887
Desenovskoe, Leninsky municipal rayon 52.96 13,785
Mosrentgen, Leninsky municipal rayon 6.41 17,046
Moskovsky, Leninsky municipal rayon 40,60 20,928
Filimonkovskoe, Leninsky municipal rayon 35,77 6,234
Vnukovskoe, Leninsky municipal rayon 25,60 3,998
City of Scherbinka, Leninsky municipal rayon 7.53 32,906
Troitsky AO
Piazanovsky, Podolsky municipal rayon 41.41 16,608
Schapovskoe, Podolsky municipal rayon 86.06 7,05
Krasnopakhorskoe, Podolsky municipal rayon 87.78 4,044
Mikhailovo-Yartzevskoe, Podolsky municipal
rayon
63.47 4,904
Voronovskoe, Podolsky municipal rayon 206.26 8,207
Klenovskoe, Podolsky municipal rayon 58.30 2,667
Rogovskoe, Podolsky municipal rayon 175 2,662
City of Troitsk 15.29 40,079
Marushinskoe, Narofominsky municipal rayon 48.75 5,470
Kokoshkino, Narofominsky municipal rayon 9.00 11,492
Pervomayskoe, Narofominsky municipal rayon 136.50 7,257
Novofedorovskoe, Narofominsky municipal rayon 156.75 6,048
Kievsky, Narofominsky municipal rayon 56.50 8,322
Figure 3 - The new Moscow’s territorial units (NUTS3)

15
2 Ukraine territorial divisions
Ukraine as an independent state exists only since 1991 and like Russia still
keeps to a large extent the administrative structure inherited from the Soviet past. The pattern of Ukrainian boundaries is a result of numerous historical
changes. Its territory can be divided into at least six historical parts which were incorporated in the past into different states. Their population has a
different collective historical experience and regional identities.
1. Galicia, partly Bukovina and Transcarpathia (Ruthenia) regions were a part
of the former Austro-Hungarian Empire. After the Habsburg Empire breakup their eastern provinces were divided between Poland, Czechoslovakia and
Romania. In 1939 and then at the end of WW2, they were included to the Soviet Union under the pretext that they were populated mostly by Ukrainians.
Though there are significant historical and cultural differences between western and south-western part of this territory, the fact that they have never been a
part of Russian Empire plays an important role in their identity and the local
political agenda. These rural, underdeveloped and weakly urbanized territories have been a transitional peripheral zone for both Russian and Austro-
Hungarian Empires.
2. Volhynia – the north-west of Ukraine. Volhynia was incorporated into
Russian Empire as a result of Poland partitions in the late 18th century. The western part of the region was returned to Poland after WW I and remained
under the Polish control during the interwar period. The bloody conflict (the so call Volhynia Murder) between Poles and Ukrainians marked the period of
Nazi’s occupation in course of WW II and led to the massive exchange of population between neighbouring Polish regions and Volhynia after its end.
Since 1944 Volhynia was incorporated again to the former Soviet Union as a part of Soviet Ukraine together with former Habsburg’s territories. In the
following difficult years of “Sovietisation” their population survived massive deportations to Siberia and the Far East.
3. The regions at the situated eastward from the Dnieper are known as the
Left-Bank Ukraine, or Malorossia – the core area of Ancient Rus’, the historical ancestor for both Russia and Ukraine. Historically the terms “Malorossia” and
“Malorussians” were used both as an ethnonym and a toponym, and the terms “Ukraine” and “Ukrainian” – as a toponym. Nowadays the situation is opposite:
the term “Ukrainian” means an ethnic and territorial belonging, while the term “Malorussian” becomes archaic and defines a historical area an and a regional
identity). The former Malorossia includes Kyivskaya, Kharkivskaya, Poltavskaya, Chernihivska and Cherkaska oblasts. After a long period of
separation from Great Russia, or Velikorossia (the area colonized by the Slavic population from the Ancient Rus’ eastward and northward from it, especially
after the Tatar-Mongol invasion), most of its territory was reunified in 1654 with Muscovy (Great Russia) according to the Pereyaslav Treaty. The results of
this Treaty are interpreted by Russian and contemporary Ukrainian historians in different ways.

16
4. Pravoberezhnaya (Right-Bank) Ukraine. The regions westward from the
Dnieper mostly populated by Ukrainians except for Kyiv and its surroundings
remained under the Polish control until the late 18th century – the partitions of Poland. The Polish cultural and economic influence remained strong during a
long time after the inclusion of these regions into Russian Empire as Polish landlords were incorporated in Russian aristocracy.
5. Novorossia (New Russia)– the “wild step” and the Black Sea shore have remained for a long time under the Ottoman rule. This territory covers roughly
the today territory of Eastern and Southern Ukraine and southern Russia. After Russian conquests in the mid-of-18th century this area was colonized by
Ukrainian and Russian settlers, developed and urbanized. In the 19th century its population increased by the ratio of seven. In 1922 Novorossia was divided
between RSFSR and Ukrainian SSR. Its Ukrainian part encompasses Donetsk, Luhansk, Dnipropetrovsk, Zaporizhya, Kherson and Odesa oblasts. For the
urban population of this area Russian is the mother tongue. In the Soviet years an important part of industry in such cities of Eastern and Southern Ukraine
like Kharkiv, Donetsk or Odesa was subordinated directly to Moscow rather
than to Kyiv.
6. Crimea is a special case. Dating its history from antic times, the peninsula
populated by Turkic-speaking inhabitants (called now Crimean Tatars) has been for centuries under control of the Ottoman Empire. Incorporated into
Russian Empire after a series of wars, Crimea was considered as a “diamond of the Russian crown” and a symbol of Russian military glory. Known for its
vineyards and the resorts around Yalta, Crimea was a favoured vacations’ destination for all Soviet Union. Tatars blamed by the Stalin regime in
collaborationism during the Nazi occupation were expelled from Crimea in 1944 and were allowed coming back from their exile only on the last Soviet years.
Populated mostly by Russians, Crimea was a part of RSFSR until 1954 when it was “passed on” to Ukraine to celebrate 300 years since the reunification of
Russia and Ukraine.
In independent Ukraine cultural, linguistic and economic diversity of the
country is considered as a serious political challenge for nation- and state-
building and to a large extent explains the choice of the unitary model. Since the Soviet time the system of territorial administration is highly centralised.
Even the heads of rayons’ administrations are appointed and dismissed by a decree of the President.

17
Figure 4 - Ukraine: the Soviet hierarchical pyramid of territorial administration
Figure 5 - Ukraine: map of the territorial units for administration (NUTS2)

18
At the eve of the Soviet Union’s disintegration Ukraine reached the peak in its
demographic and economic development. The collapse of the USSR had a
strong negative impact on its population and economy; the country did not fully overcome yet the crisis of transition.
At the oblast (NUTS2) level no administrative boundaries were changed. The administrative-territorial division matches the principles of a unitary state
organization with the same status of all units. Only Crimea keeps the status of an Autonomous Republic it restored just before the disintegration of the Soviet
Union under the pressure of the separatist movement. But this autonomy is quite limited, particularly after a short period in 1994 when separatists were at
power. A number of political organizations in Transcarpathia also claim autonomy but with no results so far. The discourse about a possible
federalization of the country re-emerges in the periods of political crises.
So, at the level of NUTS2 Ukraine is divided into 24 oblasts and the
Autonomous Republic of Crimea (table 5, fig. 4-6). Besides, the cities of Kiev and of Sevastopol – the main base for both Russian and Ukrainian Black sea
navy have a special legal status equal to the status of NUTS2. The oblasts and
Crimea are, on their turn, divided into 490 rayons (NUTS3). The average area of a Ukrainian rayon is 1,200 sq. km, and its average population makes up
52,000 inhabitants. The cities, with the above mentioned exceptions of Kiev and Sevastopol, can be subordinated either to the respective oblast’s
administration or to the rayon, depending on their population and economic importance. The lowest level of administrative units includes rural communities
and urban-type settlements distinguished by a high ratio of active population engaged in non-agricultural activities.
Figure 6 - Ukraine: the pyramid of territorial administrations, 2012

19
Table 5- Ukraine: NUTS2 NUTS2: Republic, Oblasts, Cities Population,
2009 Territory,
sq. km. NUTS3
(the number of
rayons)
NUTS3 (the
number of cities)
Autonomous Republic of Crimea 2,134,700 26,100 14 16
Vinnytsza oblast 1,753,900 26,500 27 18
Volhynia oblast 1,054,700 20,200 16 11
Dnipropetrovsk oblast 3,532,800 31,900 22 20
Donetsk oblast 4,774,400 26,500 18 52
Zhytomyr oblast 1,373,900 29 ,00 23 11
Zakarpattie oblast 1,253,900 12,800 13 11
Zaporizhya oblast 1,909,300 27,200 20 14
Ivano-Frankivs'k oblast 1,403,700 13,900 14 15
Kyiv oblast 1,808,300 28,100 25 26
Kirovohrad oblast 1,115,700 24,600 21 12
Luhans'k oblast 2,507,300 26,700 18 37
L'viv oblast 2,611,000 21,800 20 44
Mykolayiv oblast 1,251,500 24,600 19 9
Odesa oblast 2,448,200 33,300 26 19
Poltava oblast 1,609,400 28,800 25 15
Rivne oblast 1,168,300 20,100 16 11
Sumy oblast 1,279,900 23,800 18 15
Ternopil' oblast 1,134,200 13,800 17 18
Kharkiv oblast 2,887,900 31,400 27 17
Kherson oblast 1,161,400 28,500 18 9
Khmelnytsky oblast 1,414,900 20,600 20 13
Cherkasy oblast 1,386,600 20,900 20 16
Chernivtsi oblast 1,225,200 31,900 11 11
Chernihiv oblast 918,500 8,100 22 16
City of Kyiv 2,621,700 800 - -
City of Sevastopol 378,500 900 - -

20
3 Belarus territorial divisions
Founded on 1 January 1919, the Socialist Soviet Republic of Belarus (SSRB) was included some days later to the RSFSR. In February 1919, the remaining
part of the SSRB and the Socialist Soviet Republic of Lithuania were reunited to form the Soviet Socialist Republic of Lithuania and Belarus (Litbel). In late
summer 1919 its territory was almost entirely occupied by Polish troops and the Republic de facto ceased to exist.
As a result of the Soviet-Polish War of 1920, western territories of Belarus (Western Belarus) were occupied by Poland. On 31 July 1920 the Belarusian
Republic was re-established under the name of Belarussian Soviet Socialist Republic (BSSR). According to the Riga Peace Treaty concluded on 18 March
1921, the western part of Belarus was passed under the control of Poland. In March 1924 and in December 1926 the territory of BSSR was increased at the
expense of RSFSR: it received the parts of Gomel oblast (with the city of Gomel), of Vitebsk oblast (with the city of Vitebsk) and Smolensk oblast (with
the city of Orsha) with predominantly Belarusian population. In July 1924, a
new type of administrative territorial units (okrug) were established in Belarus, whith further subdivision into rayons. All in all, first ten and later 12
okrugs comprising 118 rayons were created.
In the early 1930s the system of administrative territorial units was changed
again. In 1930 the okrugs were abolished, But in February 1935 15 districts were re-established again. In January 1938 the system of okrugs was
definitively abolished and replaced by five oblasts. In early 1938 they were subdivided into 90 rayons.
As a result of the Molotov-Ribbentrop pact in September 1939 Western Belarus was re-integrated to BSSR. The city of Vilno (Vilnius) and its hinterland were
joined to Lithuania.
In September 1944, after the liberation of Belarus, three rayons of the Brest
oblast and 17 rayons of the oblast incuding the city of Bialystok were returned to Poland. The short-lived Bialystok oblast created in 1939 ceased to exist.
Between the mid-1950s and the mid-1960s the administrative division in the
Belarusian SSR was re-organized: some oblasts were abolished, and the new one created. Since that time the system of territorial units remains stable and
comprises six oblasts (NUTS2) and 118 rayons (NUTS3). At 2000s it was slightly modified. The status of the city of Minsk as the national capital was
raised to the level of NUTS2; this, it was separated from its oblast (table 6). Nine cities received the status equal to the status of rayons (NUTS3).

21
Table 6 - Belarus: NUTS2 and NUTS3 NUTS1 NUTS2 NUTS3
Name Territory, sq.km Population,
thous.
The number of
cities
The number of
rayons
1989
Belarus 207,600 10,200 126 118
Brest oblast 32,200 1,458 12 16
Vitebsk oblast 40,100 1,413 15 21
Gomel oblast 40,400 1,674 10 21
Grodno oblast 25,000 1,171 9 17
Minsk oblast 40,800 3,199 15 22
Mogilev oblast 29,000 1,285 13 21
2009
Belarus 207,756 9,671 126 127
Brest oblast 32,800 1,433 12 16
Vitebsk oblast 40,100 1,265 15 21
Gomel oblast 40,400 1,464 10 21
Grodno oblast 25,000 1,102 9 17
Minsk oblast 40,200 1,454 15 22
Mogilev oblast 29,000 1,123 13 21
City of Minsk 256 1,829 - 9

22
4 The post-soviet dynamics of population in
Russian Federation, Ukraine, Belarus and
Moldova
4.1 Russia
4.1.1 Global demographic dynamics
On 1 January 2012 Russian population accounted for 143 million: 1.2 million more than the number of the country’s inhabitants registered by the 2010
census (141.9 million). With 2.05% of the global population Russia ranks the eighths among the countries of the world. The average population density is
about 8.4 persons per square kilometer, but its territorial distribution is highly
unequal: 80% live in the European part of the country while 75% of its territory is located eastward from Ural.
The positive dynamics of population observed last two years is explained rather by the change in statistical records and long-term demographic waves
provoked by the consequences of two world wars and other social disasters than by a real improvement of the demographic situation. Since 2011, in
accordance with international recommendations, statistical accounting of long-term migrations includes the persons registered at the place of temporary
residence for a period of 9 months and more. Despite of optimistic statements of Russian officials a long-term trend of population decline is observed since
the early 1990s, accompanied by its progressive ageing, alarming mortality rate statistics, falling fertility rates, and the brain drain.
Since 1964-1965 Russian population ceased to reproduce itself and Russian demographic situation entered the phase of the latent (hidden) depopulation:
the population was not declining yet but the fertility rate was already below the
replacement level. The population keeps on growing for some time because of a favorable age structure. The cohorts in reproductive ages were more sizeable
than the number of elderly people. This negative trend was observed for almost 30 years of the late eighties. In 1986–1988 it was broken by the anti-
alcohol campaign and pro-nativity policy. Since 1989 the country came back to the latent depopulation and since 1992 population began to decline. From
1992 to 2010 the natural decrease in Russia reached 13.1 million, but the positive balance of migrations with the post-Soviet countries compensated the
loss of 6.4 million people. As a result, the Russian population decrease was less dramatic and the population shrank by “only” 6.7 million (fig. 7).

23
Figure 7 - Dynamics of the birth rate and death Rate in Russia (1990-2012)
During the post-Soviet period the population decrease touched 71 of 83 Russian regions, and only in 12 of them population was increasing: the city of
Moscow, Moscow oblast, Republic of Altai, Belgorod oblast, Dagestan, Ingushetia, Kabardino-Balkaria, Tyumen oblast, Republic of Tuva, Khanty-
Mansi autonomous district, Yamalo-Nenets autonomous district, and Chechnya.
The estimates of the future dynamics of Russian population diverge. According
to the UN Population Division it will dramatically decline and by 2025 make up between 121 million and 130 million. The U.S. Census Bureau estimated that
Russian population would be 128 million in that year. However, Russian state
statistical authorities say that the 2025 population could be not much lower than at present. This difference in forecasts is due to the initial assumptions of
population bases. Rosstat (Russian state statistical agency) uses the basis of about 142 million in 2010, while the U.S. Census Bureau grounds its forecast
on the basis of only about 139 million.
Figure 8 - Forecasts of population dynamics in Russia

24
Not depending on the nature of forecasts, most experts agree that in the near
future the most important demographic problems for Russia will be:
a progressive aging of population:
an extraordinarily high male death rates and a low male life expectancy.
Women outlive men in Russia by 11-12 years;
the decline of population in the working age. Russian experts estimate a
labor shortage of 14 million workers by 2020.
4.1.2 Life expectancy Life expectancy in Russia currently makes up 69 years, but it is significantly lower for working-age men. The difference between lifespan of women and
men was 11.9 year in 2009. Almost 30% of deaths are those of persons are the able-bodied age (more than 560 thousand people per year), and 80% of
them are men.
There is a significant regional variation in the life expectance. Its highest level
is observed in the republics of North Caucasus and Moscow, where it exceeds 69 years for men and 77 years for women. The lowest figures are recorded in
the Republic of Tuva and in Chukotka autonomous district (less than 55 years
for men and 66 years for women).
4.1.3 Fertility
Russia’s fertility rate decreased from about 6.5-7.0 births per woman in the
turn of the 20th century to 1.85-1.90 births per woman by the 1960-1970s. Since then, the birth rate has dropped to about 1.3 births per woman in 1998.
From the mid-2000s some positive trends were registered. In the beginning of the 2000s, to counteract the country's depopulation, the demographic policy
focusing on fertility stimulation was adopted: young families received some affordable housing opportunities and families with more than three children – a
special allowance of 7,000 rubles ($250) per child monthly. In order to encourage women to have more children, a new program of family’s support
known as the maternity capital program started in 2007. According to the new law, women that give birth to or adopt a second or a consecutive child are
entitled to special financial assistance. This assistance comes in the form of a
certificate that entitles its holder to receive funds in the amount of approximately $11; 000-13,000 at any time after the child reaches the age of
three. The money can be used for: 1) acquiring housing, 2) paying for a children education, or 3) investing in the mother’s retirement fund. Women
can apply for funds only once. In consequence of pro-nativity policies fertility rates have increased from about 1.3 children per woman in 2002 to
approximately 1.6 in 2011 (1.5-1.7 up to 2030), but those numbers are still short of the level to sustain the population – 2.15. Experts also stress that
family policy focusing on fertility stimulation mostly has tempo rather than quantum effects.
Russian demographers are drawing attention to the correlation between a country’s development and its low fertility rate as the result of modernization,
25
improved education, and greater gender equity. A. Vishevskiy stresses that
family modernization is an important aspect of general modernization. The
rapid destruction of the peasant family in the late 1920s, as well as mass rural-urban migration, resulted in a break with the traditional family and its
demographic behavior and in an accelerated demographic transition. The evolution of the family in Russia was almost the same as in Europe or North
America, but with a delay and with certain special features. These include the maintenance of traditionally early and almost universal marriages, relatively
early fertility, the predominance of abortion as a main method of family planning, etc. In spite of rapid modernization, family relations and family
behavior of a large part of the population maintained archaic features and, as a consequence, the level of fertility in Russia was higher and the population was
younger than in the West. Nevertheless, the postwar decades became a period of increased convergence in the evolution of the family and demographic
behavior across Russia and the West. This is confirmed by the various indicators of family size and composition, family cycle, nuptiality, divorces,
fertility, living arrangements, etc. Despite of the government attempts to
stimulate the birth rate materially (housing program, “maternity capital”, benefits, compensations, grants, etc.), few-children preferences of Russian
families keep unchanged, which coincides with the experience of the other countries that took the similar material measures (table 7).
Table 7 - Intentions of having the next child, respondents aged 25-35, %
Number of children Survey, 2004, Survey, 2007 Survey, 2011
0 91 85 87
1 71 74 72
2 29 32 32
3 22 30 20
All 64 66 67
* Institute of Demography (IDEM), Higher School of Economics, Moscow
4.1.4 The ageing of russian population
The decline in fertility is contributing to a rapid aging of the Russian
population. Between 1959 and 1990, the number of persons aged 60 and over doubled. As a result, at the beginning of the 1990s, the proportion of the
population aged 60 or over reached 16%. This figure will reach 20% by 2015.
By that year, nearly one out of every three people over 60 will be 75 or older. The trends of population growth and ageing in Russia have been profoundly
affected by catastrophic events, such as two world wars, the civil war of 1917-1922, and famines in the early 1920s and '30s. These catastrophes have
distorted the population pyramid--the typical age distribution and balance between male and female in the population. For example, huge losses during
World War II have caused Russia to have the lowest overall male-to-female ratio in the world, especially among the elderly. The irregularities of this
pyramid will continue to have an impact on the number of births and the rate of population growth and ageing for several decades. This pattern affects such
vital spheres as school enrollment, employment, and retirement (fig. 9).

26
Figure 9 – Russian age structure, 2011.
4.1.5 Mortality
Mortality rate in Russia increased from 10 per thousand to 16 per thousand in
1989-94 and stayed at this level until 2006, then it decreased to 13.5 per thousand in 2011. In 2011, 56% of all deaths in Russia were caused by cardio-
vascular disease. The second leading cause of death was cancer (14.3 percent), and the third – external causes of death (10.2 percent) such as
suicide (1.7%), road accidents (1.4%), murders (0.9%), alcohol poisoning (0.7%), and drowning (0.5%). Other major causes of death were diseases of
the digestive system (4.5%), respiratory disease (3.6%), infectious and parasitic diseases (1.6%), and tuberculosis (1.1%). The infant mortality in
2011 was 7.3 deaths per 1,000 (down from 8.2 in 2009 and 16.9 in 1999). Аalthough infant mortality rate has been decreasing in Russia, it has not yet
caught up to rapid decreases of other countries in Europe.
The high rate of mortality, especially increase in deaths from preventable
causes, points to problems not only in alcohol and drugs consumption but also in degradation of Russia's health-care system. Until now there are no clearly
defined federal and local health-protection policies, no effective programs for
monitoring outcomes, and no openly declared systems of control and delegation of responsibilities for state and public health institutions. Moreover,
the incidence of destructive behaviors, such as violence and alcohol consumption, has increased. Heavy tobacco use (second place in the world
after China) contributes to a high rate of mortality from lung cancer, which occurs 60% more frequently in Russia than in the United States.
All Russian experts agreed that decreasing the current mortality rate in Russia was a categorical imperative. The prerequisites to reach this goal are: 1) a

27
sustained historical downward trend in infant and child mortality, 2) increased
effort to fight alcohol consumption, 3) substantially increased public
investment in health and programs on hypertension control which seem to have garnered positive results, and 4) implementation of new medical
technology. At the same time there are the critical points such as 1) stagnation of life expectancy in the elderly population, and 2) deterioration of the public
health system.
4.1.6 Migration Migration is one of the most important topics in Russian political discourse. Russia is getting migrants from almost all post-Soviet countries but Belarusia,
and has a negative balance of migrations with the countries beyond the boundaries of the former Soviet Union, and became a country of transit
migration. The discourse on a “brain drain” is widely spread. It is true for such sectors like information technologies. However, Russia is gaining a lot of
educated people from former Soviet republics. The importance of the situation in Russian economy for post-Soviet states is undeniable. A great number of
migrants are working and living in Russia at least during part of the year.
Estimations of the number of migrants residing in Russia vary within a large range but most experts agree that it is between 4 and 7 million.
Immigration. In terms of both stock and flow of immigrants, Russian
Federation is second world pole of their attraction after the USA. According to the UN definition of a migrant as somebody who lives outside his/her country
of birth, in the mid-2000s, the number of international migrants was 35 million in the US, 13 million in Russia, 7 million in Germany, and 6 million in France,
India, and Canada. But one should not forget that about 10% of population in the former Soviet Union live outside of their republic of birth, so they had
migrated within one country. Also, the people have been migrating outward from the European part of Russia (Central Russia) for centuries, in line with the
Russian state expansion. In 1975 that pattern changed, and since then a net-positive balance of migrations back to Russia was observed, mostly from the
republics of the former Soviet Union. According to the Russian 2002 census,
11.0 million people migrated to Russia since the previous census of 1989 (the net immigration was 5.6 million), 99.5% were from former Soviet Union
countries, mostly repatriating ethnic Russians. So, Russia is not a new migration destination in terms of directions but it is a new destination in terms
of flows’ magnitude and composition.
By the time of the collapse of the Soviet system about 25 million ethnic
Russians lived in outside Russian Federation. Over 3 million ethnic Russians resettled to Russia between 1991 and 1998. In general, two third of
immigrants in 1998-2010 were ethnic Russians and about 12% represented other ethnic groups originating from Russia. According to these data, the most
important destinations of migrations in Russia were Moscow and Moscow oblast, St. Petersburg and Krasnodar krai. Because of unregistered
migrations, official data underestimate the real scale of migrations. Kazakhstan is the most significant country of origin of new immigrants (about 2 million in
1989-2010). A comparable number of people came in 2002-2010 from other

28
countries of Central Asia (Kirgizia, Tajikistan, Turkmenistan, Uzbekistan). The
countries of South Caucasus (Armenia, Azerbaijan and Georgia) were the third
most significant source of immigrants with about 1.2 million people who came to Russia between 1989 and 2010.
Figure 10 - Net-Migration to Russia, 1961-2010, in thousand
In the 1990s, the issue of Chinese migrants moving to Russia’s Far East received a great deal of attention in Russian media. The inflow of Chinese
migrants combined with the significant outflow of Russians from Siberia and
the Far East to the European part of the country led to fears that Russia would “lose” the Far East. According to a 1998 public opinion poll in Primorsky krai (a
region bordering China), almost 50% of respondents were sure that Chinese migration posed a threat to Russian sovereignty in the East. Another poll
showed that Russian citizens believed the number of Chinese migrants entering Russia to be about 885 times higher than it actually was (Alekseev,
2006). In reality the number of Chinese citizens in Chinese-Russian border regions is relatively small and Russian citizens are more active than Chinese in
moving across the border.
In 2011 the net-migration into Russia made up 356,500. This is a great
number, but Russia needs approximately 500,000 migrants per year to compensate the natural decrease of population. Central Asia, Kazakhstan and
Azerbaijan can provide Russia with human recourses but at a limited scale. They will keep relatively high birth rates until 2030, but they are expected to
decrease as the these countries continue to develop (fig. 10).
Temporary labour migrants. 1.3 million foreigners of 9,5 million living in Russia in 2011 were registered and documented labour migrants, students and
specialists; 4.4 million were partly documented labour migrants, and 3.8 million came as temporary visitors and tourists. A high number of irregular
migrants is partly caused by a complicated registration system. The residence permit system was officially abolished in 1993, but it continued to exist in
another incarnation: the “residence registration system”. All Russian citizens have to be registered at local police departments. There are two kinds of

29
registration for Russian citizens: permanent and temporary. The first one is
mandatory for all Russian citizens. If they leave their place of permanent
residence and stay in another Russian city/town/village for more than 14 days, they have to get the temporary registration. All foreign citizens have to be
registered in regional branches of the Federal Migration Service during three working days after their arrival to Russia. In 2007 the procedure of registration
became easier, but for many migrants it still is complicated. As a result, most labour migrants work in the shadow economy. They do not have the
opportunity to get a legal job (a legal status) and cannot protect their rights, including basic human rights.
Transit migrants from Afghanistan, China, Angola, Pakistan, India, Sri Lanka, Turkey, Ethiopia and other countries wishing to get to Western Europe make
up another significant group of irregular migrants. Instead of moving on as planned, many end up staying in Russia.
Temporary labour migrants became common in the 2000s. According to official data, 40% of construction workers, 19% of workers in the trade sector, and 7
% both in agriculture and production are immigrants. Most labour migrants in
the construction sector are citizens of Ukraine, Tajikistan, Uzbekistan and Turkey. Among migrants from Moldova, drivers and construction workers
predominate. Half of labour migrants in Russia have no professional training and can be employed only as unskilled workers. A specific feature of Russian
economic system is a significant informal and shadow economy, which demands cheap and legally unprotected labour. According to official data, in
2010 53% of legal labour migrants worked in the shadow economy. Rights’ violations by employers, such as the confiscation of a migrant’s passport in
order to increase control over employees, incomplete wage payment, limitation of freedom of movement, absence of social guarantees and involuntary work
occur among both legal and irregular migrants. According to Russian official estimates, elements of forced labour can be observed in case of 10 to 30% of
migrants. Only 9% of labour migrants have never faced any form of coercion. Experts note that almost all victims of forced labour do not believe in the
authorities’ ability to assist them and show little interest in bringing their
exploiters to justice.
Emigration. Emigration from Russia to the FSU countries decreased from 690,000 people in 1989 to 40,000 in 2004 and since that time remains at the
same level. In 2011, according to official data, 36,478 persons emigrated from Russia: 21,830 to the CIS countries and 46,016 – worldwide. Russian experts
say that emigration from Russia is underestimated. Many people leave Russia with tourist or student’ visas without declaring their intention to emigrate.
Large numbers of highly-skilled Russian emigrants moved to the USA, Norway and Germany following the collapse of the Soviet Union. In 1993, every fifth
emigrant from Russia had post-secondary education. This “brain drain” continued. In 2005 it was estimated that 30,000 Russian scientists were
working abroad. Currently, the United Kingdom, Germany, Greece, the Netherlands and Cyprus are considered to be favoured destinations for highly-
skilled Russians seeking employment abroad. The majority of emigration to

30
Germany, Israel and Greece has taken place in the course of ethnic
repatriation programs. The peak of migration from Russia to Germany was in
1995 (about 80,000). Relative exhaustion of the migration potential as well as increasing restrictions in Germany’s policy reduced these flows drastically.
Ethnically-based emigration to Israel has varied in response to socio-economic and political conditions in both countries. Following the financial crises in
Russia in 1998, the number of emigrants to Israel doubled; with tensions increasing between Palestine and Israel in recent years, it has declined by
75%. The volume of emigrants to Israel was in 2007 about 1,200. The emigration to the USA has gradually decreased from 4,000 in 2004 to 2,000 in
2007. The current world financial crises led to a considerable shrinkage of labour market in Western countries and restrained emigration from Russia.
Internal migration. Internal migration in Russia is greater than external-one.
In 2011 the annual migration “turnover” of whose who moved permanently to another Russian region or city was 3,08 million in 2011 (the net-migration with
outside was only 319,8 thousand).
During the Soviet era, a significant number of people moved from the Central-European part of Russia to northern regions, Siberia and the Russian Far East.
But the vector of migration changed in the second half of the 1980s, with more people moving westward and southward. In the post-Soviet era, the
movement from the eastern and north-eastern regions westward intensified. As a result, between 1990 and 2005 the Far East lost 14% of its population.
The main reason was the degradation of the economic situation. The Soviet planned economy together with state-regulated migration created and
maintained large populations in these regions. Their residents enjoyed a number of privileges, such as the so-called “northern wage increments” –
extra-money for working in remote regions with a harsh climate. The state also provided special support for migration, paying for the costs of travel,
transportation of belongings, accommodation, etc. Many people took advantage of these incentives to work in these regions temporarily for earning
money. The population of the North, Siberia and the Far East was not constant,
as migrants generally engaged in circular migration instead of settling permanently. Once these incentives disappeared, so did the supply of new
migrants. In the wake of the planned economy, several “ghost towns” emerged in outlying regions. These are generally former “monotowns” – towns with one
factory providing employment to the majority of the inhabitants– which could not sustain their populations once the major employer went bankrupt. The key
receiving region in Russian migration is Moscow. According to the Moscow government, there were almost 1.3 million Russian citizens from other parts of
the country temporarily registered in the Russian capital in 2010.
4.2 Ukraine
Ukraine is the fifth country in Europe in terms of population after Germany,
Italy, Great Britain, and France and ranks the 21st in the world (7.3% of the total European population and 1% of the world population). As compared with

31
Russia, Ukraine has a relatively high population density (80 people per sq.
km). The lowest population density is in the Chernihiv oblast (39 people/sq.
km), and the highest density is registered in the highly urbanized Donetsk oblast (183 people per sq. km). Ukraine is an urbanized country: the urban
population accounts for 67.2%. Kyiv, the capital of Ukraine, has more than 2.6 million inhabitants. Regarding the ethnic structure of population, 77.8%
identified themselves as ethnic Ukrainians and 17.3% as Russians. The share of Russians is decreasing as a result of both the out-migration and self-
identification change.
In the post-Soviet years Ukraine demonstrated the stable trend to the
population decrease. After a short period of population growth in 1991-1994 (+ 0.5% of population) caused by return migrations from Russia and the other
post-Soviet states, Ukrainian population is declining. The number of population dropped from 51.7 million in January 1995 to 45.6 million in January 2012. In
other words, it decreased by 6.1 million or more than 12%. According to the official statistics, in 2011 the natural decrease of population made up -4.4 per
thousand. This trend is expected to continue, implying that the country’s
population will decline by another 10 million until 2050 and that nearly half of its citizens will be more than 45 years old.
Ageing is an inevitable result of the population decline. The share of Ukrainians aged 65 years and more is expected to increase from 14% in 2000
to 20.5%I in 2025. This trend will have an important impact on the labour market and the system of social protection.
The average life expectancy in Ukraine varies around 68-70 years, the male life expectancy (61.8 years) is as low as in Russia, and the female life
expectancy is 73.5 years – slightly lower than in Russia. Regarding urban-rural differences, life expectancy is always higher in urban areas, except for
Zakarpatska oblast.
There is a clear trend toward of the decrease of the fertility rate. Like Russia,
Ukraine entered the period of latent (hidden) depopulation in the 1970s, but population continued to grow up until 1993. If in 1970 the fertility rate was 2.1
per woman, in 2001 it dropped down to 1.1. Since that time, it stabilized at the
level of 1.4-1,5.
Unlike fertility, the mortality rate is increasing. According to official data it
grew up from 12.1 deaths per thousand in 1990 to 15.2 in 2010. In 2005 the death rate reached its maximum – 16.6 per thousand. The main mortality
causes are cardio-vascular diseases (63.8%), cancer (12.0%) and external causes (8.1%). While mortality due to chronic diseases is now prevailing, the
diffusion of infectious diseases remains rather high. This is especially true for the south-eastern regions. Diseases of cardio-vascular system as a cause of
death prevail in the North. Mortality from cancer is peculiar for the industrial zone of Donets coal basin (Donbas). However, the sharpest contrast between
eastern and western part is observed in the ratio of external causes of death related with lifestyle like smoking, alcohol and diet. Environmental conditions
also play a key role in the emergence of many diseases.
Migration. Unlike another demographic trend there is a considerable
difference in the dynamics of migration between Ukraine and Russia. In the

32
first post-Soviet years the balance of migrations with Russia was positive, but
since 1994 it became negative. In 1991-1992 about 40 percent of migrants
came to Ukraine from Russia. After 1994 the net losses of migrants in favour of Russia accounted for 10-20% of the Ukrainian annual net migration.
The 2001 census reports that 5.3 million residents of Ukraine were born abroad: 92% of them arrived from other former Soviet republics, and 85% -
before the USSR breakup. In other words, they were internal migrants. The main origin of immigration to Ukraine were Russia, Moldova, Uzbekistan,
Belarus, Georgia, Armenia, and Azerbaijan. The number of “real” immigrants registered by the Ukrainian Ministry of Internal Affairs accounted in 2010 for
about 198 thousands.
Emigration from Ukraine is much more significant. According to the statistical
data of destination countries, the total number of Ukrainian migrants abroad make up 6.5 million, or 14.4% of Ukrainian population. The main destinations
are Russian Federation (almost 40%), EU (22%), including Italy (14%), Czech Republic (12%), Poland (9%), Germany and Hungary. The United States and
Israel also host a considerable number of Ukrainian immigrants. Most of them
maintain the relations with their home. Around 3,000,000 ethnic Ukrainians live in Russia (not all of them are recent migrants); 1,700,000 – in USA;
1,300,000 – in Canada; 600,000 – in Moldova; 500,000 – in Kazakhstan.
Ukrainians labour migrants are usually employed in construction, especially
men (54%), and houskeeping, particularly women (17%t). It is estimated that approximately a quarter of all migrants working abroad do not have a legal
status. Labour migration is considered by Ukrainian experts as a social downshifting. Only few migrants manage to find jobs corresponding to their
skills and education. The extent of labour migration from Ukraine is of course explained by economic reasons - the gap in economic development between
Ukraine and neighboring countries, and between Ukrainian regions themselves. In 2011 the average per capita income in Donetsk oblast was USD 683, which
is 20% higher than the average income in Ukraine (USD 550), while in Chernivtsi oblast it was 37% lower as compared with the national average
(USD 352). In 2008 the average Ukrainian migrant’s wage was USD 820, i.e.
almost three times higher than the average salary in Ukraine (USD 281). However, income is not the only factor of emigration. Non-monetary factors
like personal life strategies, including education, preferences and cultural ties, the proximity to state borders, established migration networks also do matter.
Labour migration from Ukraine has a dual impact on national economy. In the long term, it means the wasting the human capital but in the short term it
contributes to social stability. Migrants’ remittances are nearly equivalent to foreign direct investments and are almost eight times higher than the official
unemployment assistance. The largest share of remittances is used for living expenses (73%) and purchase of consumer goods (26%), while only 3.3% -
for setting up a business. Experts believe that Ukrainian economy would have lost about 7% of its productive efficiency without the stimulating effect of
migrants’ remittences and that their per cpaita increase by 10% decreases poverty by 3.5%.

33
4.3 Belarus
In the mid-2012 the total population of Belarus accounted for 9,459 million.
Belarus is an urbanized country with 75% of urban population, but the process of urbanization started quite recently: according to the 1959 census, 70% of
population still was rural. In 1999, when the first national census of population wass held, the main ethnic groups were Belarusians (81.2%), Russians
(11.4%), Poles (3.9%) and Ukrainians (2.4%). As compared to Russia, Belarus is relatively densely populated – 46 inhabitants per sq. km., but the density of
population there is much lower than in most European countries. The population of Minsk, the capital of Belarus, in 2012 reached 1,901 million.
During World War II the population of Belarus has dramatically decline,
dropping from more than 9 million in 1940 to only 7.7 million in 1950. It increased to 10,189 million in 1999. After that the population began to
diminish steadily and felt down to 9,714 million in 2006 and to 9,543 million in 2011, and continues to decrease by the ratio of - 0.3 – -0.4% per year. The
natural decrease of population (-2.8 in 2011) is not covered by migrations (in 2011 their balance was negative - - 50,000).
But since 2002-2003 the demographic situation slightly ameliorated. The total fertility index increased from 1.2 per woman in 2002 to 1.5 per woman in
2011. While the birth rate is growing, the death rate did not change since 1999.
During the last half-century the mortality dynamics in Belarus has been very
unfavourable, especially for males. High mortality from cardio-vascular
diseases remains a major social problem. Because of a long-term negative
dynamics of these causes the epidemiologic situation in Belarus can be
characterized as a chronic health crisis. The non-contagious diseases
accounted for about 72% of all deaths in Belarus. In the past decade, the rates
of cancer have increased by one third which may be linked with the
consequences of the Chernobyl disaster, though this correlation is not
confirmed. There are scientific evidences of its relation only with the increase
of thyroid cancer. External reasons like the alcohol abuse, smoking, road
accidents, injuries and poisoning are the cause of 11.9% of deaths. The level
of the alcohol consumption in Belarus was 12.3 liters per capita in 2008 and
12.0 liters in 2009 (slightly less than in Russia but more than in Ukraine).
According to a World Bank report, the infant mortality rate accounted for 3.9
per thousand in 2011, in net decrease since 2002 (9.0). This index is the
lowest in post-Soviet space. Belarus was the first CIS country to adopt in 2002
the Demographic Security Law. Belarus is currently implementing the 2006-
2010 National Demographic Security Program and the presidential program
“Children of Belarus” (2006-2010 and beyond).
Between 2004 and 2011 life expectancy has also increased.(from 62.7 to
65.8 years for men and from 74.7 to 77.4 years for women). The number of

34
women in the age of over 65 is much higher than that of men: 0.46
male(s)/female.
Belarus is one of few former Soviet Union countries which have a positive
balance of migrations, and the only CIS country which has a positive balance
with Russia. Currently Belarus implements the policy aimed to attract
immigrants to certain sectors of its economy (especially construction and
agriculture). Migration is considered as a factor which could compensate the
natural population decrease, and it is expected to welcome at least 5,000
migrants from post-Soviet countries every year, especially from Central Asia.
In this field Belarus is competing with Russia.
According to the UN Population Division’s estimates, residents born abroad
represented in 2005 12.2% of population (1,191,000). But like in Russia and
Ukraine, this number results from the change of the country's status rather
than from immigration trends. Most long-term residents in Belarus
originated from other republics of the former USSR. Some of those who were
born before WWII originate from the countries which have been the
neighbours of the Soviet Union. Those who were born in Russian Federation
make up 62.4%, in Poland – 21.6% and in Ukraine – 13%.
The most active return migration was observed just after the breakup of the
Soviet Union in 1991. About 2 million of Belarusians were living outside their
republic. Most Belarussians who returned to Belarus fled from other former
Soviet republics because of ethnic tensions or civil wars. Between 1981 and
1995, 3,000 Belarusians repatriated from Azerbaijan, 3,000 – from Kyrgystan,
16,000 – from Kazakhstan, and 10,000 – from Tajikistan. In total, about
160,000 ethnic Belarusians came back to their historical motherland. In 2000
the net migration rate of Belarus was 1.5 per 1,000 inhabitants, in 2011 -
0.38.
The emigration trend is much more pronounced than immigration. According
to experts’ estimates, around 150,000 (3%) of economically active population
leave Belarus annually. This number significantly exceeds the official figures.
However, the real number of emigrants is difficult to assess because there are
neither visas nor border control between Belarus and Russia. The migration
out-flow from Belarus increased considerably after 2010 when the country
survived the worst economic crisis since the collapse of SU. Just before the
presidential elections in December 2010, the average wage in Belarus was
more than $500 but in December 2011 it dropped to $280. Belarusians can
work in Russia without visas or additional permissions. They also have the
same rights to education as Russian citizens – it is free from them if they
successfully pass the entrance exams. Most of those who are graduated from
Russian universities do not return to Belarus. According to the June 2012
national survey held by the Independent Institute of Socio-Economic and
35
Political Studies (IISEPS), 53.7% of respondents in Belarus expressed a desire
to work or to study abroad: 15.1% in Germany, 11.4% in the USA, 8.9% in
Russia, and 9.8% in any country, while 41.4% said they wanted to move
abroad forever.
Russia is the major destination for Belarusian emigrants and circular
migrants. The main attraction both for workers and for professionals is a
higher salary. The skills of migrants to Russia is higher than the average level
of the employed labor force in Belarus. The same concerns the level of
education. It is calculated that 50-60% of migrants have higher education
(complete or incomplete). Most often skilled migrants are physicians (around
12%), engineers (10%) and biologists (7%), while among the immigrants to
Belarus almost 30 percent are low skilled workers. Many workers who were
employed in construction, agriculture and petrochemical industry now moved
to Russia and visit their families only on vacations. In this case, both Russia
and Belarus have some benefits: Belarus escapes from the potential growth of
unemployment and receives remittances from Russia. However, Russia
benefits much more: for Russia, bringing the Russian-speaking skilled migrants
from the CIS is a part of Russian “Strategy 2020.” So, Belarusian workers and
students are welcome in Russia – in particular, because most of them are
native Russian speakers. Usually, Belarusians go to the regions in Russia
where the networks of labour migrants have been shaped (Moscow,
St.Petersburg and their oblasts, Tiumen, Khanty-Mansiysk and neighbouring
oblasts – Smolensk, Briansk). Thus, only during the first six months of 2012,
Belarusian industry lost almost 18,000 employees, construction – more than
17,000. Most of them found jobs in Russia (Belstat 2012).
Ukraine is a less popular destination. However, last years for both economic
and/or political reasons, some professionals (journalists, businessmen, etc.)
moved to Ukraine as they could find there a better job - in foreign firms, in the
private business, arts, etc. This flow is relatively small, but for Belarus it
means a loss of highly skilled and innovative individuals, as well as a loss of
possible foreign investments. Other CIS countries are not such important
destinations for Belarusian migrants so far.
Circular mobility to the EU is growing. According to the data on the EU visas
issued for Belarusian citizens in 2011, this number was higher than for any CIS
country, including Russia. The neighboring EU countries are the more
attractive destinations for Belarusian migrants. In 2011, almost every fifth visa
(55.200 of 299.300) was issued by Polish consulates in Belarus. Lithuania is a
second EU country by the number of visas issued for Belarusians. The targeted
group includes university professors and young well-educated scholars who
moved to Vilnius or regularly visit this city as they are employed at the
European Humanities University. Hundreds of students from Belarus either live

36
in Vilnius for the terms of education or regularly commute. Upon graduation,
only half of them return to Belarus. Some journalists and oppositional
politicians also shifted their offices to Vilnius and commute regularly in both
directions.
Due to its geopolitical location, Belarus remains a popular transit route for
irregular migrants. As in other Eastern European countries, trafficking in
persons, especially women, to the Russian Federation, the Middle East, and EU
countries is an important challenge for Belarus.
4.4 Moldova
By January 1, 2012 the total population of Moldavia was 4,072,9 thousand (in 1991 - 4,366,3 thousands). This number includes the population of the
properly Republic of Moldova, including Gagauzia that accounted in 2012 for 3,559,5 thousand (in 1991 - 3,654,0 thousand), and the non-recognized
Trasnistrian Moldovan Republic (in 2012 - 513,4 thousand, in 1991 - 705,2 thousand). Both parts of Moldova experienced the decrease of population during the whole post-Soviet period. The urban population in Moldova makes
up 41,4%, and the rural one – 58,6%. The sex structure is quite balanced:
male account for 48% and female – for 52%. The age structure clearly shows the ageing of population, namely the increase of the share of elderly and the
decrease of the share of children under 14. In the last 8 years the ratio of this age group dimisnished from 22.8 to 17.1%, and the ratio of population over 65
- from 9.5 to 10.2%. In this last group, women constitute more than 60%, which results from high mortality of working-age male. In 2008, the life
expectancy at birth was 69,4 years (65,6 years for male and 73.2 for female). Compared to 2001, it increased by a year for men and approximately
by half a year for women. On the same year, the natality rate was 10.9 per thousand (in 2001- 10.0). The total fertility rate dropped to 1.28. The
mortality rate increased to 11,8 per thousand and was higher in rural areas – 13.6 per thousand because of a higher ratio of elderly people and a lower level
of the health care system. The infant mortality, as compared with 2001, decreased from 16.3 to 12.2 per thousand. In the last 8 years, the marriage
rate increased from 5.8 to 7.5 and the rate of divorces – from 3 to 3,5 per
1000 inhabitants.
There are two main destinations for Moldovan immigrants – Russia and EU.
The estimated number of immigrants varies depending on a source. According to the 2004 Moldovan census, 273,000 persons (8.1% of the total population)
lived abroad and were temporarily absent from their household. Just about a half of them (47%) havebeen abroad for more than a year. Most were young
(38% in the age between 20 and 29, and a further 23% aged 30-39). The overwhelming majority (89%) was working abroad. However, two
representative national surveys carried out in Moldova specifically on migration painted contrasting pictures. On the one hand, a survey conducted in 2003 by
the Moldova Microfinance Alliance and the Soros Foundation found that 29.3% of the 4,500 surveyed households had at least one migrant family member

37
living abroad, leading to an estimate that 265-285,000 Moldovans were
working in foreign countries (Ghencea and Gudumac 2004: 41). On the
contrary, a study for UNDP conducted in late 2004 which applied a similar methodology estimated that 399,000 individuals were abroad by the time of
the survey, whilst a further 172,000 had been abroad during the previous year and had returned, making a ‘migrant contingent’ of around 571,000. When a
further 119,000 who expressed their intention to go abroad in the next six months were added, it was reported that over 650,000 Moldovans were
emigrants, more than twice as much as the census figure. A similar figure for the number of migrants abroad was also received by IOM on the basis of
reports from the embassies and from the Russian Ministry of Labour. Women go more often than men to Italy, while men are more likely to choose Russia.
This gender distribution is explained mainly by the sectors in which migrants are employed. For example, the construction sector in Russia and Ukraine (as
well as in Portugal) attracts men, whereas women are attracted by the services sector in Italy (catering, housekeeping, hotels). On the contrary, most
Moldovan migrants working in Greece and Cyprus are employed in agriculture.
Romania represents a special case. Under the pretext of the restoration of historical ties, the Romanian Citizenship Law approved in 1991 defined the
migration from Moldova as a form of repatriation, stipulating that the descendents of former Romanian citizens can “reacquire Romanian citizenship
by request even if they have another citizenship and they do not settle their domicile in Romania.” It is estimated that, as a consequence of this law alone,
more than 250,000 Moldovan citizens might have received Romanian citizenship during the 1990s. It seems that immigration from the Republic of
Moldova to Romania has not reached its end; a continuation of this movement (or even an increase in its volume) cannot be ruled out. In the context of its
accession to the EU, Romania introduced mandatory visas for Moldovan citizens. This has resulted in an exceptional increase in the number of
applications by Moldovan citizens for Romanian citizenship. 500,000 Moldovan citizens (with accompanying children, approximately 800,000 persons) have
applied for Romanian citizenship in 2007.

38
Bibliography
Annual Reports “Population dynamics in Russia”, M.: 17 volumes, 1993-2011
Artobolevsky S.S., Borodina T.L., Glezer O.B. The reform of local self-
government and the administrative-territorial organization of the subjects of Russian Federation. – Izvestia (Bulletin) of Russian Academy of Sciences,
Geographical Series, 2008, N° 5, p.85-91.
Pirozhkov S., Malinovska E., Khomra A. Labor migration in Ukraine. Socio-
economic view. Kyiv, 2003
Pirozhkov S. (Ed.) Migration and border regime: Belarus, Moldova, Russia,
Ukraine. Kyiv: Independent center for migration studies in CIS and Baltic countries, 2002.
Mocshniaga V. Population of Moldova and labor migration: state and current forms. Chişinaú, 2000
Molodikova I. and F. Duval. Transit migration and transit countries: theories, practices and policies. M.: University book, 2009.
Vishnevskiy A.G. Selected works in 2 volumes. M.: Nauka, 2009
Yeliseyeu, A. (2012). “How isolated is Belarus? Analysis of Schengen countries consular statistics (2007 – 2011)” in BISS SA (Belarusian Institute for
Strategic Studies) N 01/2012RU, 7 July 2012
Zayonchkovskaya J. A. (Ed.) Labor migration in CIS countries: social and
economic impact. M.: Center for migration studies, 2003
Zayonchkovskaya J. A. and G. S. Vitkovskaya (Ed.) Post-Soviet
transformation: reflection on migration. M.: Center for migration studies. Adamant. 2009
Internet Sources:
Russia Census, 2002, www.perepis2002.ru
Russia Census, 2010, www.perepis-2010.ru
Rosstat, www.gks.ru
Demoscope Weekly, http://demoscope.ru/weekly/ssp/rus_nac_79.php?reg
Federal Migration Service of Russia, http://www.fms.gov.ru/
New Eurasia Foundation “Migration Barometer in Russian Federation”http://www.baromig.ru/,http://www.neweurasia.ru/index.php?opti
on=com_content&task=view&id=543&Itemid=114
The Institute for Demographic Studies (Russia),
http://www.demographia.ru/articles_N/index.html?idR=44
Avseenko, N. (2010) Gosudarstvennaja Politika Respubliki Belarus v oblasti
trudovoy migracii (State Policy of Republic of Belarus in the field of labor

39
migration). http://do.gendocs.ru/download/docs-221777/221777.doc , on 25
July 2012.
Luchenok, A. & Kolesnikova, I. (2011). “Influence of migration flows on social-economic figures in Belarus.” (Vlijanie migracionnyh potokov na socialno-
ekonomicheskie pokazateli Belarusi). http://luchenok.blogspot.com/2011/09/normal-0-false-false-false-ru-x-
nonex.html , 5 August 2012.
IISEPS (Independent Institute of Socio-Economic and Political Studies) (2012).
Most important results of the nationwide public opinion poll (June). http:// www.iiseps.org/epress15.html , 2 August 2012
Government (2011). National Program on Demographic Security of the Republic of Belarus on 2011-2015 (Natsionalnaja Programma
Demograficheskoy Bezopasnosti Respubliki Belarus na 2011-2015). http://pravo.by, 5 August 2012.
National Statistical Committee of the Republic of Belarus, 2012. “Migration 1-6 months”.
http://belstat.gov.by/homep/ru/indicators/pressrel/employment1.php, 05
August 2012