terrain analysis and satellite imagery in madre de … · terrain analysis and satellite imagery in...
TRANSCRIPT
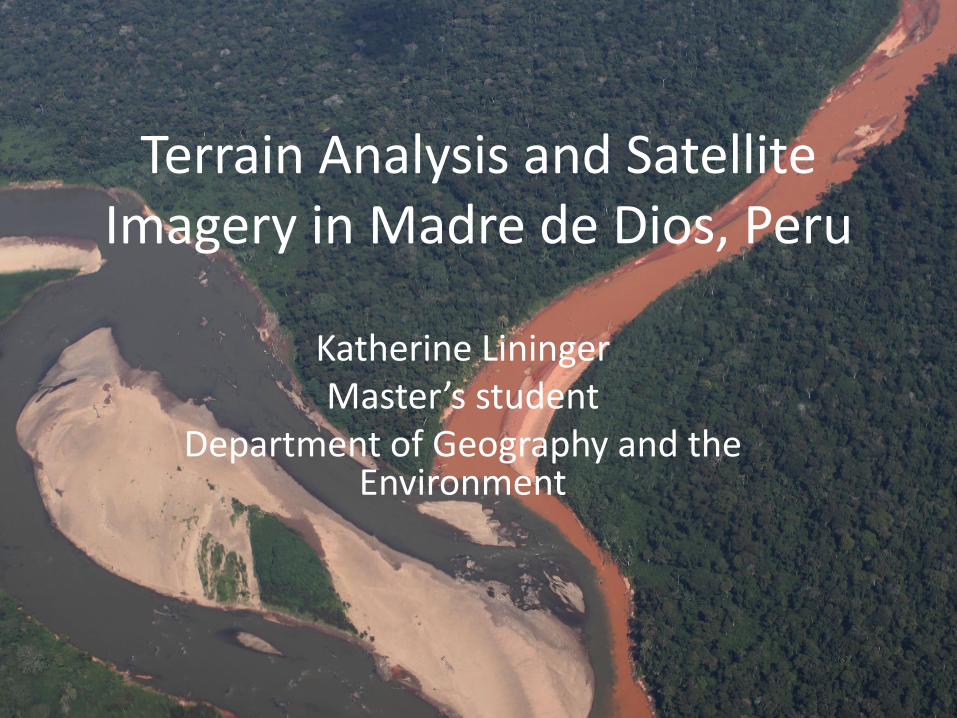
Terrain Analysis and Satellite Imagery in Madre de Dios, Peru
Katherine Lininger Master’s student
Department of Geography and the Environment
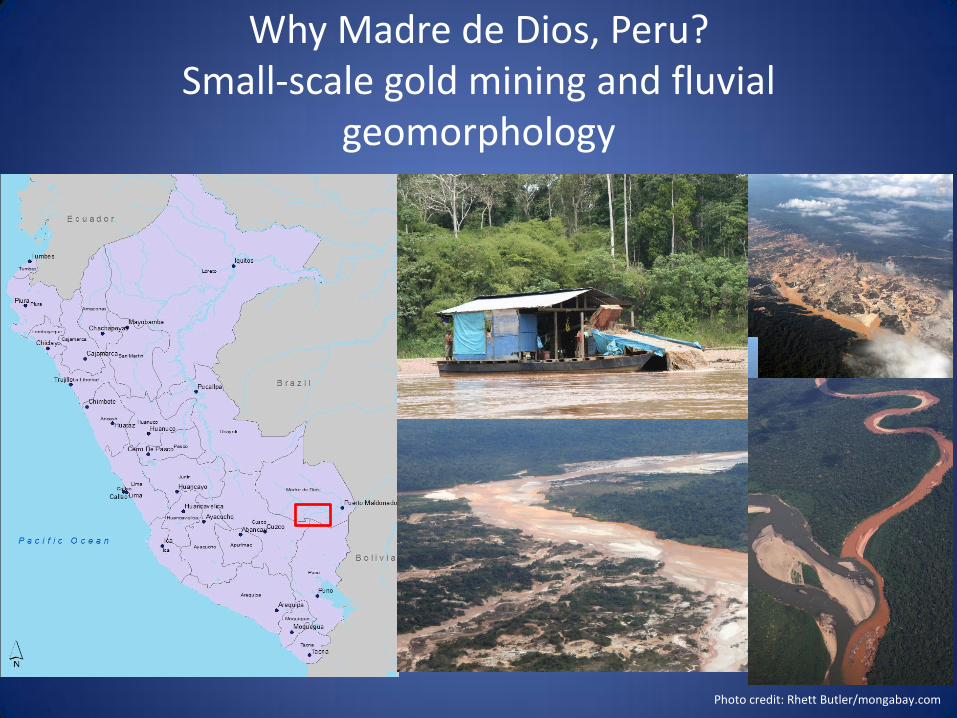
Why Madre de Dios, Peru? Small-scale gold mining and fluvial
geomorphology
Photo credit: Rhett Butler/mongabay.com
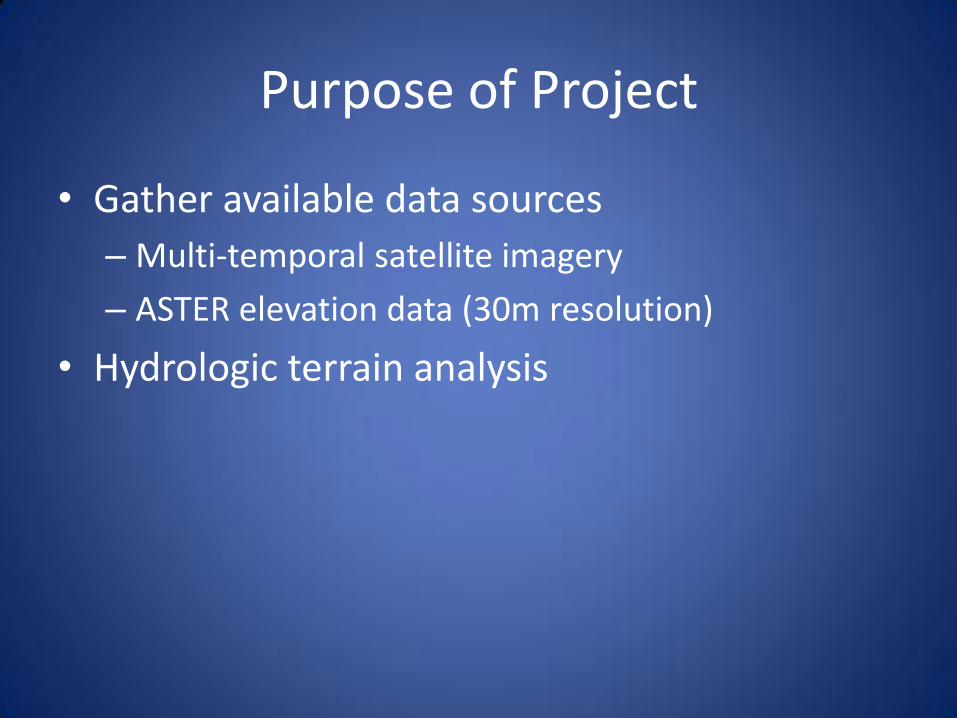
Purpose of Project
• Gather available data sources
– Multi-temporal satellite imagery
– ASTER elevation data (30m resolution)
• Hydrologic terrain analysis
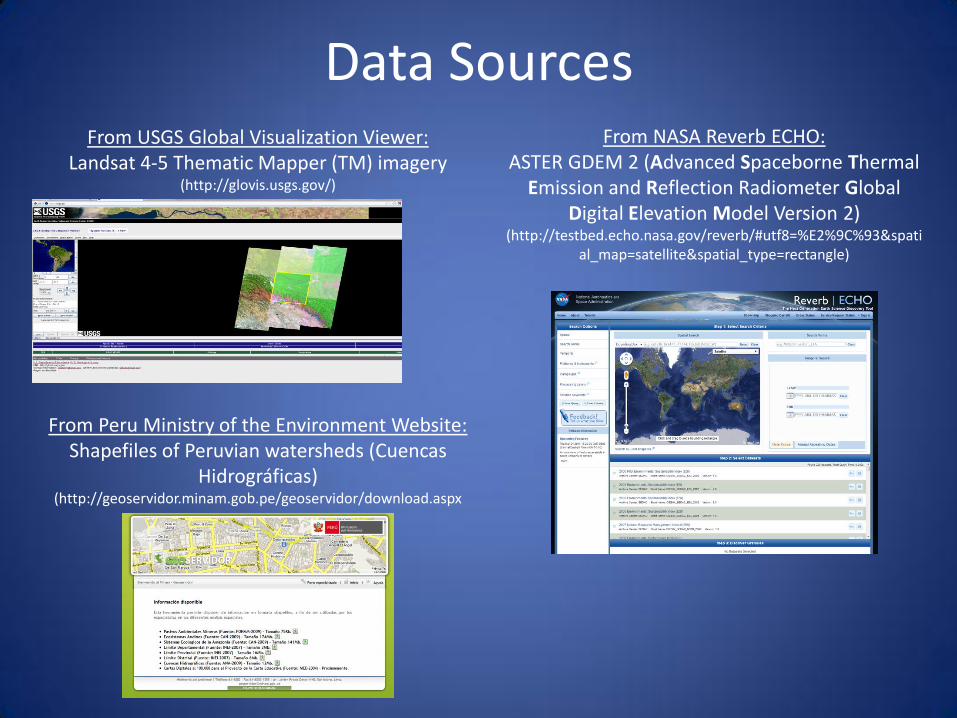
Data Sources From USGS Global Visualization Viewer:
Landsat 4-5 Thematic Mapper (TM) imagery (http://glovis.usgs.gov/)
From NASA Reverb ECHO: ASTER GDEM 2 (Advanced Spaceborne Thermal
Emission and Reflection Radiometer Global Digital Elevation Model Version 2)
(http://testbed.echo.nasa.gov/reverb/#utf8=%E2%9C%93&spatial_map=satellite&spatial_type=rectangle)
From Peru Ministry of the Environment Website: Shapefiles of Peruvian watersheds (Cuencas
Hidrográficas) (http://geoservidor.minam.gob.pe/geoservidor/download.aspx
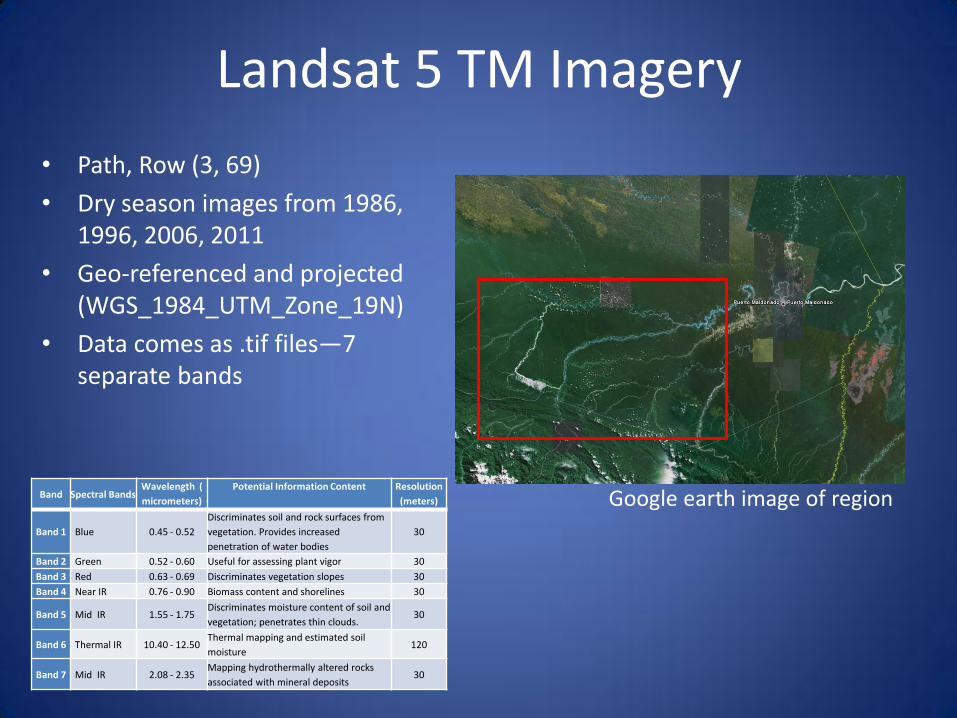
Landsat 5 TM Imagery
• Path, Row (3, 69)
• Dry season images from 1986, 1996, 2006, 2011
• Geo-referenced and projected (WGS_1984_UTM_Zone_19N)
• Data comes as .tif files—7 separate bands
Google earth image of region Band Spectral Bands Wavelength (
micrometers)
Potential Information Content Resolution
(meters)
Band 1 Blue 0.45 - 0.52
Discriminates soil and rock surfaces from
vegetation. Provides increased
penetration of water bodies
30
Band 2 Green 0.52 - 0.60 Useful for assessing plant vigor 30
Band 3 Red 0.63 - 0.69 Discriminates vegetation slopes 30
Band 4 Near IR 0.76 - 0.90 Biomass content and shorelines 30
Band 5 Mid IR 1.55 - 1.75 Discriminates moisture content of soil and
vegetation; penetrates thin clouds. 30
Band 6 Thermal IR 10.40 - 12.50 Thermal mapping and estimated soil
moisture 120
Band 7 Mid IR 2.08 - 2.35 Mapping hydrothermally altered rocks
associated with mineral deposits 30
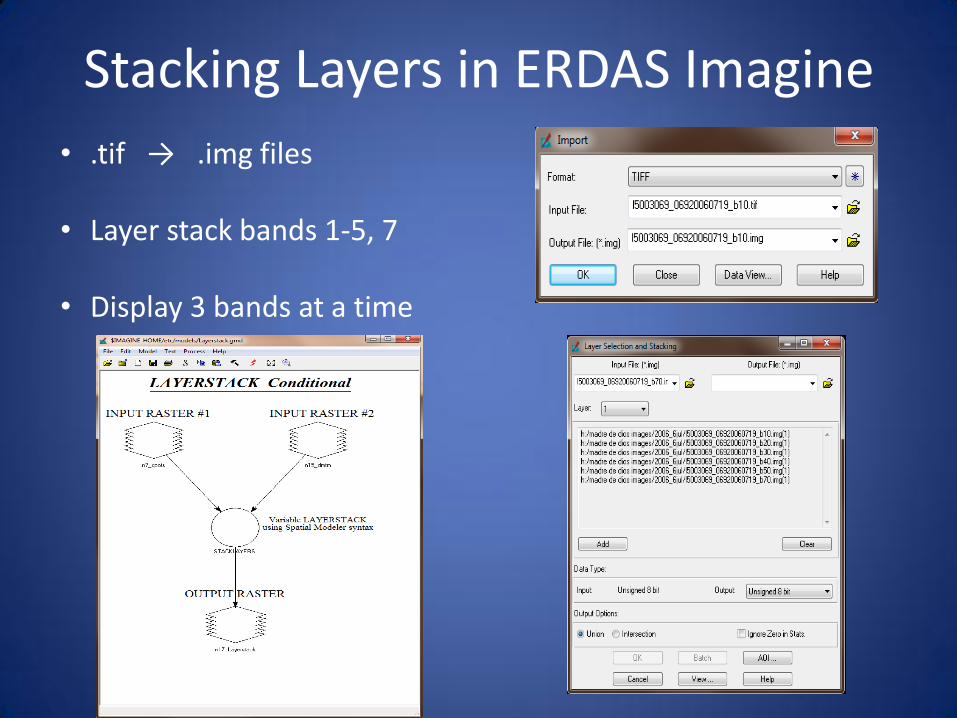
Stacking Layers in ERDAS Imagine
• .tif → .img files
• Layer stack bands 1-5, 7
• Display 3 bands at a time
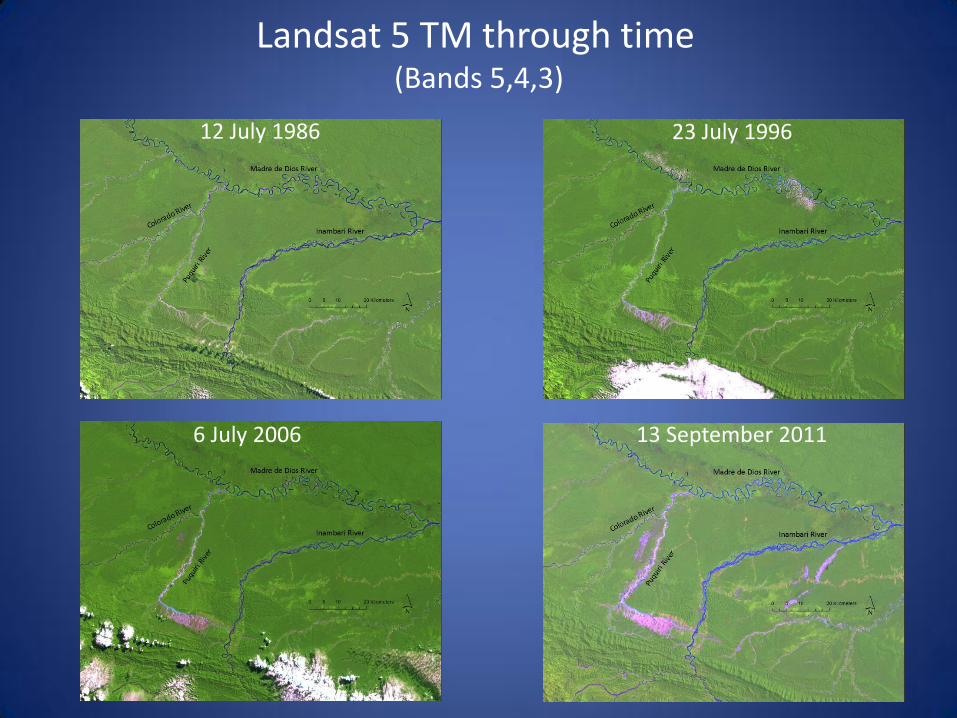
Landsat 5 TM through time (Bands 5,4,3)
12 July 1986 23 July 1996
6 July 2006 13 September 2011
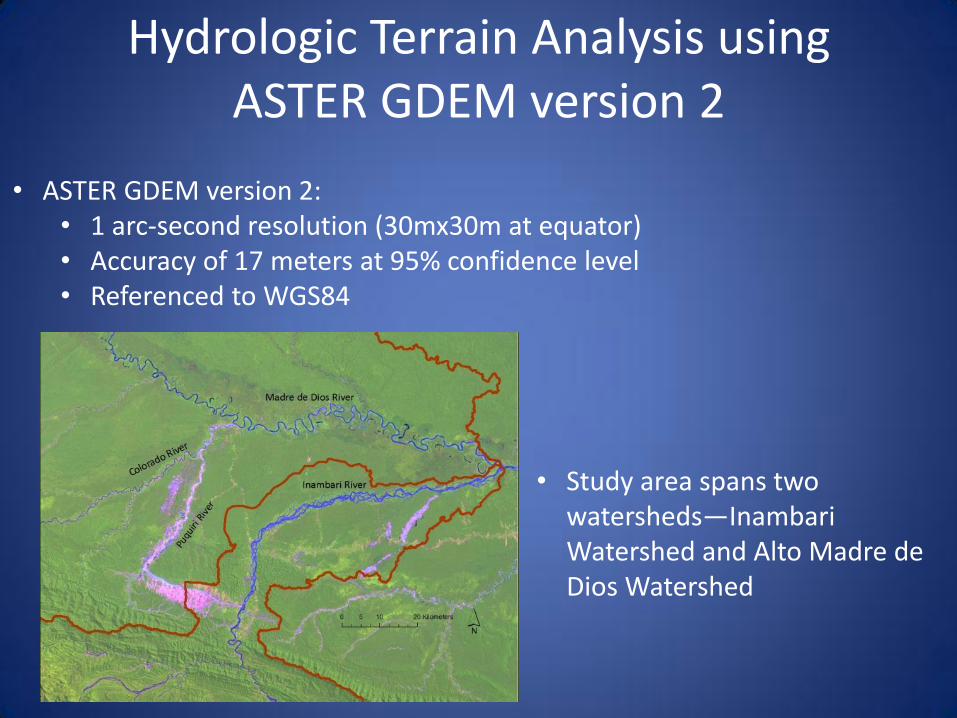
Hydrologic Terrain Analysis using ASTER GDEM version 2
• Study area spans two
watersheds—Inambari Watershed and Alto Madre de Dios Watershed
• ASTER GDEM version 2: • 1 arc-second resolution (30mx30m at equator) • Accuracy of 17 meters at 95% confidence level • Referenced to WGS84
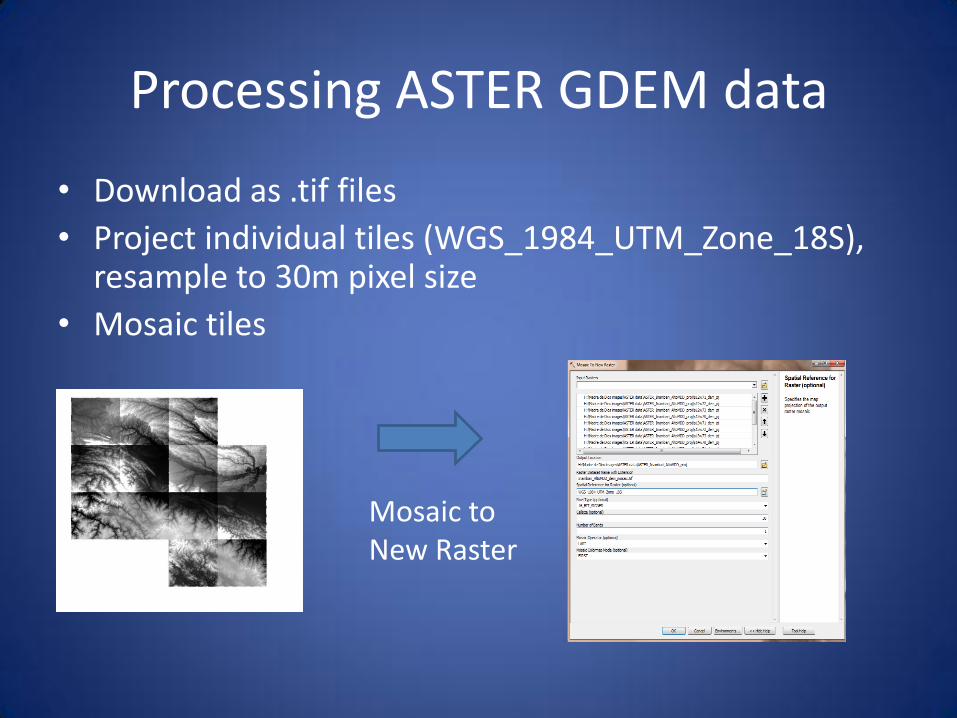
Processing ASTER GDEM data
• Download as .tif files
• Project individual tiles (WGS_1984_UTM_Zone_18S), resample to 30m pixel size
• Mosaic tiles
Mosaic to New Raster
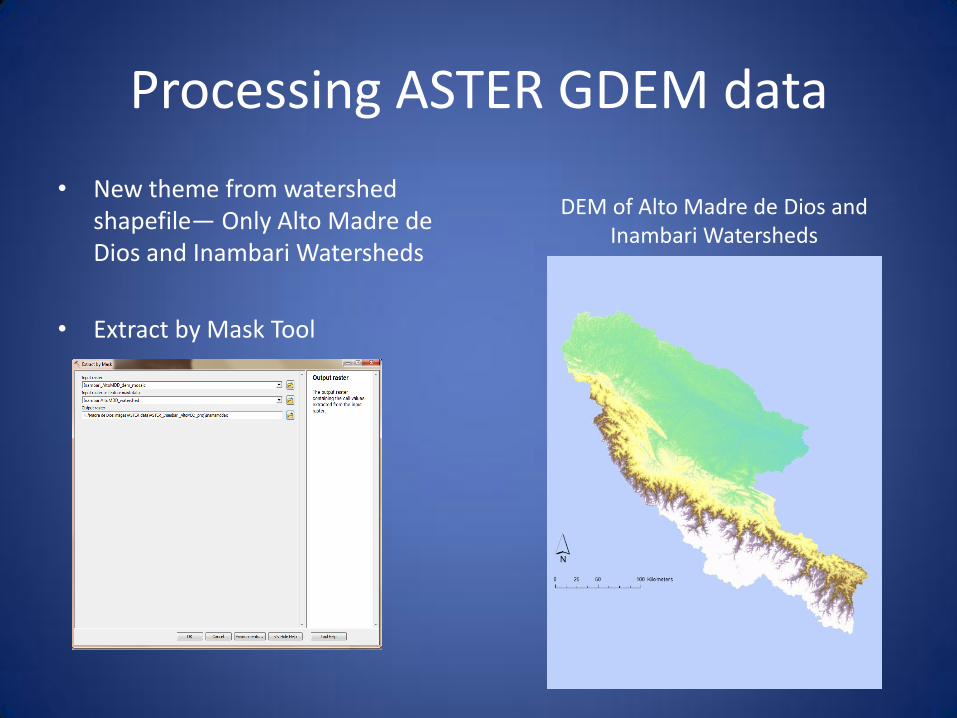
• New theme from watershed shapefile— Only Alto Madre de Dios and Inambari Watersheds
• Extract by Mask Tool
Processing ASTER GDEM data
DEM of Alto Madre de Dios and Inambari Watersheds
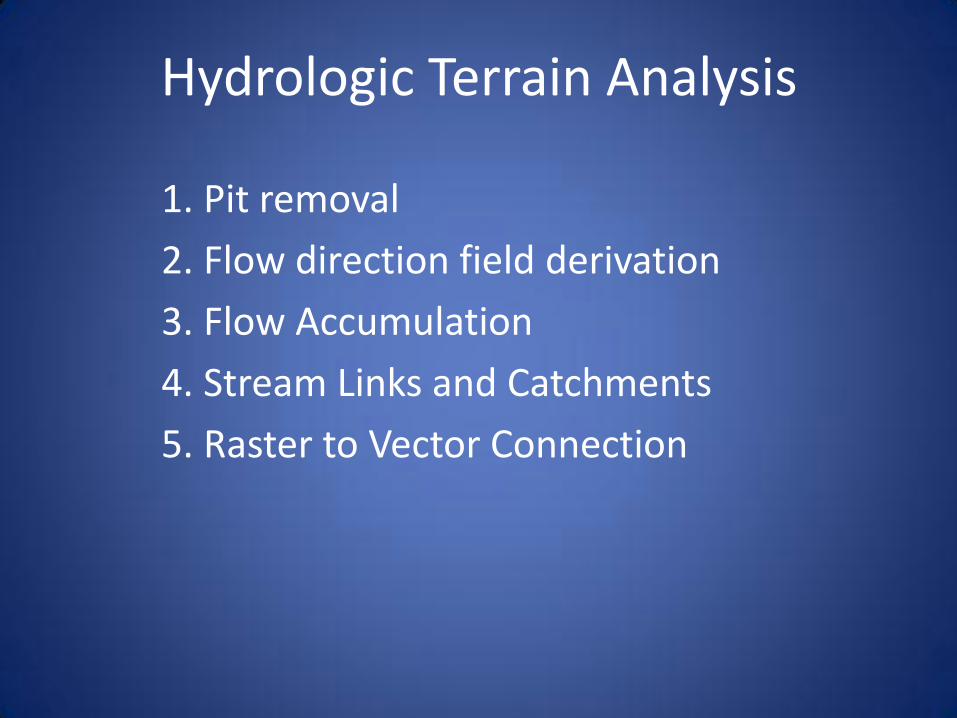
Hydrologic Terrain Analysis
1. Pit removal
2. Flow direction field derivation
3. Flow Accumulation
4. Stream Links and Catchments
5. Raster to Vector Connection
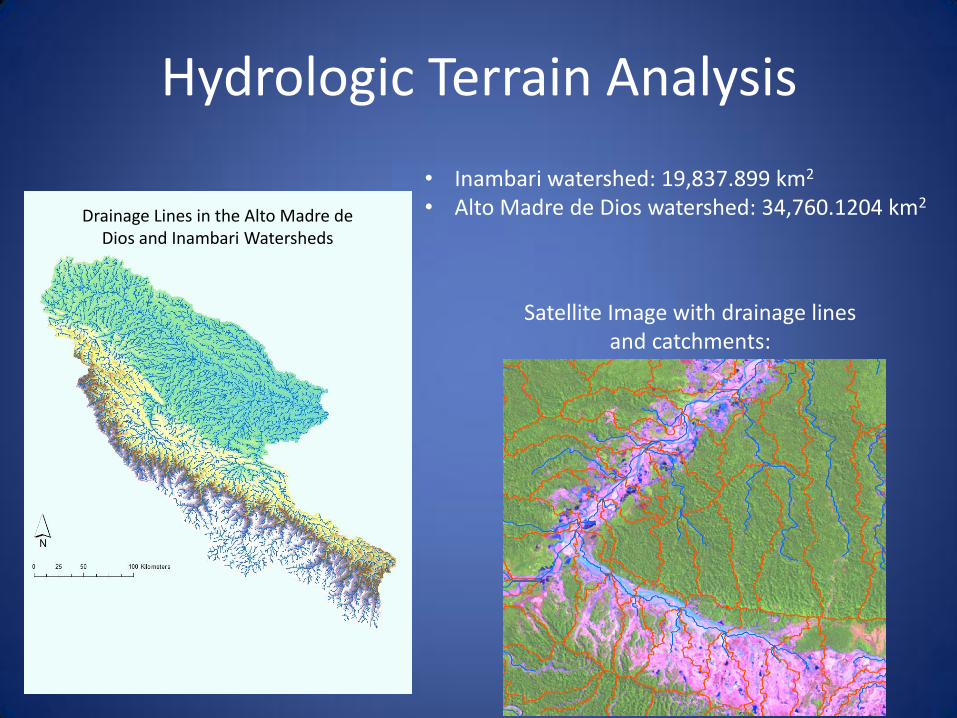
Hydrologic Terrain Analysis
• Inambari watershed: 19,837.899 km2 • Alto Madre de Dios watershed: 34,760.1204 km2
Drainage Lines in the Alto Madre de Dios and Inambari Watersheds
Satellite Image with drainage lines and catchments:
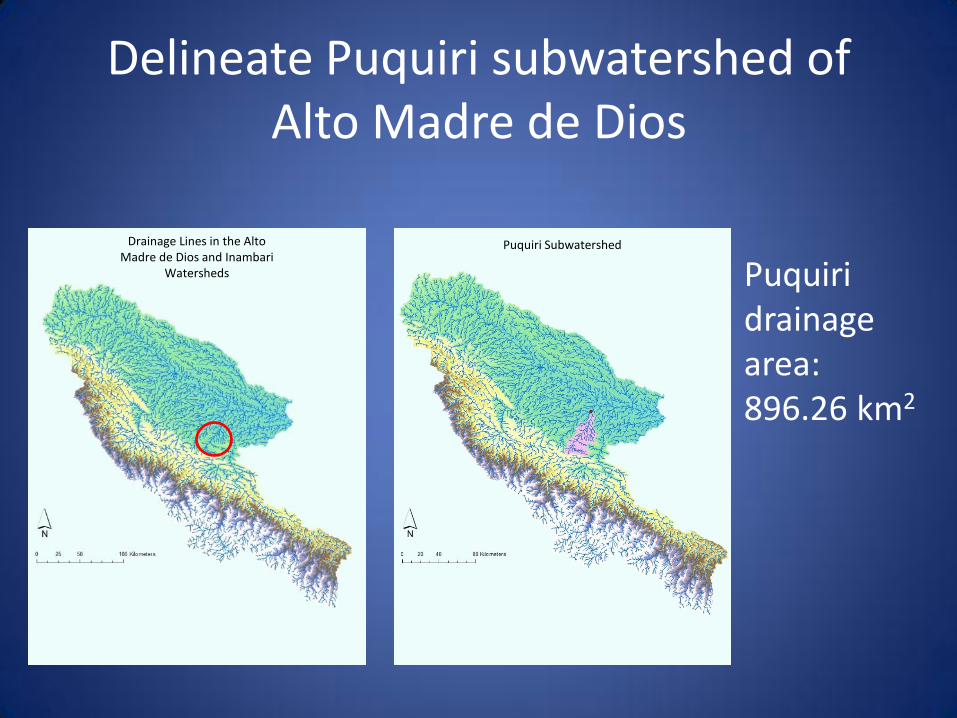
Delineate Puquiri subwatershed of Alto Madre de Dios
Drainage Lines in the Alto Madre de Dios and Inambari
Watersheds Puquiri drainage area: 896.26 km2
Puquiri Subwatershed
Future Master’s Research
• Classification of satellite imagery
• Creation of geomorphologic maps over time
• Identification of fieldwork sampling sites