terminology - californiadocs.cpuc.ca.gov/publisheddocs/published/g000/m040/… · web viewthese...
TRANSCRIPT

ALJ/DMG/sbf Date of Issuance 12/24/2012
Decision 12-12-010 December 20, 2012
BEFORE THE PUBLIC UTILITIES COMMISSION OF THE STATE OF CALIFORNIA
Order Instituting Rulemaking to Integrate and Refine Procurement Policies and Consider Long-Term Procurement Plans.
Rulemaking 12-03-014(March 22, 2012)
DECISION ADOPTING LONG-TERM PROCUREMENT PLANS TRACK 2 ASSUMPTIONS AND SCENARIOS
1. Summary
In this decision we adopt final Standardized Planning Assumptions and Scenarios for Track 2 of the 2012 Long-Term Procurement Plans, as shown in Attachment A. These assumptions will be used for forecasting system reliability needs for California’s electricity grid. Based on these forecasts, future decisions will determine specific procurement system and bundled need authorizations or requirements for California investor-owned utilities. System needs are the subject of Track 2 and bundled needs are the subject of Track 3 of this proceeding. The Commission formally requests that the California Independent System Operator use the Standardized Planning Assumptions and Scenarios in Attachment A to conduct operational flexibility modeling, which we expect will be filed at the Commission in Track 2 of this proceeding.2. Background
The 2012 Long Term Procurement Plan (LTPP) proceeding was initiated by an Order Instituting Rulemaking issued on March 27,
- 1 -40642804
R.12-03-014 ALJ/DMG/sbf
2012. The rulemaking’s stated purpose is “to continue our efforts through integration and refinement of a comprehensive set of procurement policies, practices, and procedures underlying long-term procurement plans.” (Rulemaking (R.) 12-03-014 et al.)
In R.06-02-013, the 2006 LTPP proceeding, the Commission directed the 2008 LTPP proceeding to focus on improvements to the planning process. This included making more assumptions public and focusing on a more analytically rigorous process through the public development of scenarios and assumptions. In the 2010 LTPP proceeding (R.10-05-006), this process resulted in Standardized Planning Assumptions determined by the assigned Commissioner in a December 2010 scoping ruling. These assumptions were then used as the basis for the modeling of renewable integration needs. However, neither the assumptions nor the models were adopted by the Commission, due to a settlement adopted by Decision (D.) 12-04-046 in that proceeding.
One important goal of the LTPP proceeding is to ensure a safe, reliable and cost-effective electricity supply in California. The May 17, 2012 Scoping Memo for this proceeding established three tracks for this proceeding. Track 1 is the local capacity requirements track. Track 2 addresses the overall long-term need for new system reliability resources, including the adoption of system resource plans. Track 3 is the procurement rules and bundled needs track. The Track 2 resource plans will allow the Commission to comprehensively assess the impacts of state energy policies on the need for new resources. Based on these system resource plans, the Commission will consider updates to the Investor-owned Utilities’ (IOUs) bundled procurement
- 2 -

R.12-03-014 ALJ/DMG/sbf
plans with a focus on the IOUs’ obligation to maintain electric supply procurement responsibilities on behalf of IOU customers.
We continue the process of developing assumptions and scenarios first, and then conducting the analysis in this LTPP proceeding. Over the course of several workshops, proposals, and comments, parties and Commission staff have help developed the Standardized Planning Assumptions and Scenarios. These materials reflect a broad range of potential future outcomes and help create points of connectivity between other planning processes in the state.
On May 10, 2012, the Commission’s Energy Division served its 2012 “Energy Division Straw Proposal on LTPP Planning Standards” (Straw Proposal) to the service list in this proceeding. A workshop was held on May 17, 2012 to discuss the Straw Proposal. Parties were given the opportunity to file comments on the Straw Proposal.
The assigned Commissioner issued a Ruling establishing Standardized Planning Assumptions on June 27, 2012.1 Those assumptions formed the building blocks for the LTPP scenarios set forth in the Energy Division Proposed Scenarios, served to parties on August 2, 2012. Energy Division conducted a workshop on August 24, 2012, and received informal technical comments from parties through September 11, 2012. On September 25, 2012, the assigned Commissioner issued planning scenarios (shown in the Attachment to 1 The June 27th Assigned Commissioner’s Ruling on Standardized Planning Assumptions stated an intent to use an estimate of expected renewable supply from the Renewables Portfolio Standards (RPS) proceeding (R.11-05-005). That ruling also stated that if no viable and appropriate renewable supply estimate emerged from the RPS proceeding in time for inclusion in the planning scenarios, that the 33% RPS Calculator would be used to develop portfolios instead. To date, parties have not proposed any alternative solution that meets all of these goals. Therefore, we continue the use of the 33% RPS Calculator.
- 3 -

R.12-03-014 ALJ/DMG/sbf
that Ruling) for formal comment. Parties filed comments on October 9, 2012 and reply comments on October 19, 2012.
Parties filing comments and/or replies were: Abengoa Solar, Inc.; Alliance for Nuclear Responsibility; California Cogeneration Council; California Environmental Justice Alliance; California Independent System Operator (CAISO or ISO); Center for Energy Efficiency and Renewable Technologies; City and County of San Francisco; Clean Coalition; Direct Access Customer Coalition; Distributed Energy Customer Advocates; Division of Ratepayer Advocates (DRA); Friends of the Earth; Green Power Institute; Large Scale Solar Association; L. Jan Reid; Natural Resources Defense Council and Community Environmental Council; Pacific Gas and Electric Company (PG&E); San Diego Gas & Electric Company (SDG&E); The City and County of San Francisco (CCSF); Sierra Club and Union of Concerned Scientists; Southern California Edison Company (SCE); The Utility Reform Network; Women’s Energy Matters; and Zephyr Power Transmission LLC and Pathfinder Renewable Wind Energy LLC. 3. Changes to Revised Scenarios in ACR
In this decision, we adopt final Standardized Planning Assumptions and Scenarios for Track 2 of the 2012 LTPP. There are several purposes for the assumptions and scenarios. First, the assumptions and scenarios are intended to inform the Commission of any procurement need to meet operating flexibility (also known as renewable integration). Second, the assumptions and scenarios analyze whether adequate resources exist to meet the planning reserve margin, after accounting for any local area and operating flexibility authorizations. Third, the assumptions and scenarios inform
- 4 -

R.12-03-014 ALJ/DMG/sbf
the three large IOU’s bundled procurement plans of the assumptions utilized in assessing their bundled load for the rolling five plus years, consistent with D.12-01-033.
While the assumptions and scenarios adopted in this decision provide valuable input to any forecasts and assessments of future need, we recognize that in modeling possible future outcomes additional assumptions may be necessary. In response to the California ISO’s request for clarification regarding resources that may be authorized by us shortly, these resources may be included in the Track 2 analysis to the extent time allows.2 If these resources cannot be modeled directly, then they should be included in any final recommendation of needs at the end of the Track 2 process. To the extent modelers use additional assumptions, such as for local area resources, they should be clearly documented and justified so as to maintain transparency consistent with the overall approach of this track of the proceeding. The final adopted assumptions and scenarios are similar to those in the September 25, 2012 Assigned Commissioner’s Ruling, and are set forth in Attachment A. Many parties filing comments were supportive of all or specified portions of the assumptions and scenarios in the Ruling. We make certain modifications based on comments. Below we discuss significant changes made based on comments from parties to the September 25 Assigned Commissioner’s Ruling.
3.1. Selection of a Base ScenarioSCE requested clarification on the extent to which scenarios and
assumptions will affect the IOUs’ bundled plans.3 The 2010 LTPP
2 California ISO Comments at 3-4.3 SCE Comments at 10.
- 5 -
R.12-03-014 ALJ/DMG/sbf
Bundled Track Decision (D.12-01-033) ordered the use of common assumptions for bundled plans. We therefore require that the assumptions selected for the Base Scenario in Attachment A shall be used by the IOUs in their ongoing bundled procurement, consistent with D.12-01-033. This does not preclude the IOUs from conducting other analyses for their bundled plans. The IOUs shall update their existing bundled plans utilizing assumptions consistent with the Base Scenario.
3.2. Permanent Load Shifting DRA indicated that the amount of permanent load shifting
embedded in the 2012-2022 Energy Commission California Energy Demand Forecast (CED), 29.262 Megawatts (MW), is smaller by about 20-40 MWs than the amount the Commission authorized in D.12-04-045, the Commission’s decision approving demand response programs for 2012-2014. In collaboration with California Energy Commission staff, Energy Division determined that the cumulative impact of PG&E’s permanent load shifting programs from 2007-2011 and 2012-2014 were included in the CED, while SCE and SDG&E’s permanent load shifting programs were omitted from the forecast. D.12-04-045 approved 24 MWs total for SCE and SDG&E (19 for SCE and five for SDG&E), none of which was included in the CED. Accordingly, we modify the California Energy Commission load forecast by this quantity to account for the permanent load shifting impacts, consistent with D.12-04-045.
3.3 Peak Time Rebate Program
The July 27, 2012 Ruling stated that event-based demand response (DR) assumptions come from the 2012 IOU load impact reports. With regards to the Peak Time Rebate (PTR) program, the
- 6 -

R.12-03-014 ALJ/DMG/sbf
Commission noted that PG&E’s PTR program is still pending before the Commission, and any required savings are still unclear. DRA argues for the Commission to assume that PG&E’s PTR program is implemented at the levels approved in D.09-03-026 on PG&E’s proposed upgrade to their SmartMeter Program. Based on 2008 PG&E testimony that led to D.09-03-026, DRA estimates the impact of PTR is 283 MW in 2022.
DRA points out that in PG&E’s comments on the standardized planning assumptions in May, PG&E initially recommended that the LTPP’s “mid” case should assume that PG&E’s PTR program is fully implemented by 2014. However, those PG&E comments also stated that the expected PTR impact is lower than the level approved in D.09-03-026, based on more recent data on program performance. In reply comments, PG&E modified its position and recommended that zero MWs be used for all cases to reflect the uncertainty of PTR program implementation; alternatively, PG&E believes a “high” assumption of 108 MW might be achieved by 2014 due to lower performance expectations compared to 2009.
Considering the vintage of the PTR estimates from D.09-03-026, and the uncertainty surrounding program implementation, we will assume a cautious outlook for PG&E’s PTR program, with the “low” and “mid” cases as zero, and the “high” as 108 MW of additional impact by 2014.
3.4. RPS RetirementsPG&E, SCE and DRA recommend assuming the replacement of
all renewable retirements, including geothermal and biomass, with RPS-eligible generation in order to maintain the 33% RPS trajectory.4
4 SCE Comments, at 8; DRA Reply Comments at 5-6.
- 7 -
R.12-03-014 ALJ/DMG/sbf
Since few, if any, of these baseload RPS-eligible resources appear poised to retire at this time, we adjust the assumptions in the final scenarios to use the “low” value assumption for renewable retirements, indicating that these resources remain online throughout the planning horizon or are repowered with electrically equivalent alternatives.
3.5. Nuclear Power Plants Retirement Assumption Label
The nuclear retirement assumption labels have been changed in the final scenarios to refine the analysis, given the heightened uncertainty surrounding the San Onofre Nuclear Generating Station (SONGS). The formerly-labeled “Modified High”—with SONGS retiring in 2015 and Diablo Canyon in 2024/2025—is now re-labeled as the “Mid” Scenario. The prior “Mid” Scenario, in which the plants would remain in operation until their current license expires and then retire, is omitted from the final assumptions.
3.6. Replicating the Transmission Planning ProcessThe CAISO suggests that there were differences in the
retirement assumptions currently used in their Transmission Planning Process (TPP) and the Replicating the TPP Scenario. In order to reconcile this difference, and consistent with our intent in developing the scenario, the retirement assumptions in the Replicating the TPP Scenario are set to “low,” with the exception of once-through cooling (OTC) plants and other announced retirements.
3.7. Planned Additions to Account for other Entities; OTC Plant Retirement Label
As part of our effort to streamline assumptions, planned additions from entities such as municipal utilities are also included in the “additions” value. Further, for clarification, the Final Scenario
- 8 -
R.12-03-014 ALJ/DMG/sbf
now has two OTC retirement labels: “base” and “alternate.” This reflects an effort to streamline assumptions from the prior “low,” “mid,” and “high” labels.
3.8. Demand Response (DR) Assumption for the High Distributed Generation (DG)/High Demand Side Management (DSM) Scenario
Several parties have suggested that the “high” DR assumption in the High DG/DSM Scenario and High DG/DSM with a 40% RPS in 2030 sensitivity be replaced with a “mid” DR assumption, pointing out that high levels of DR are not necessarily tied to high amounts of DG or other DSM programs. We make that change in the final scenarios.
3.9. Demand ResponseThe California ISO requested additional details on demand
response programs.5 The Energy Division will continue providing detailed demand response program information to the California ISO so they may properly model program impacts in their assessments.4. Next Steps for Track 2
With this decision, we will proceed to determine the IOUs’ long-term system needs. First, we now formally request that the CAISO use the Standardized Planning Assumptions and Scenarios in Attachment A to conduct operational flexibility modeling, to be filed in Track 2 of this proceeding. The purpose of this modeling is to evaluate the resources needed to maintain system reliability under various forecast conditions. This modeling will then be used to inform the Commission in our Track 2 determination of system needs. We expect the modeling result in the second quarter of 2013. The assigned Administrative Law Judge (ALJ) and/or assigned
5 California ISO Comments at 5.
- 9 -

R.12-03-014 ALJ/DMG/sbf
Commissioner will issue a Ruling setting the schedule for the remainder of Track 2 of this proceeding.
To the extent that the CAISO changes their assumptions in their TPP, Energy Division should update the “Replicating the TPP Scenario” in Attachment A to align with the CAISO’s assumptions.
Regarding prioritization for the operating flexibility modeling, we provide the following guidance. The Base Scenario is the first priority, followed by the Replicating the TPP, then assessing the impacts of the early SONGS retirement sensitivity, and lastly the High DG and High DSM scenario. If time and resources allow, the Stress Case sensitivity and High DG and High DSM with a 40% RPS by 2030 should be modeled.
Scenario
# Name
Modeling Priority
1 Base 1
2Replicating TPP 2
1A
Early SONGS Retirement 3
3High DG + High DSM 4
1C Stress Case
5 (if time
allows)
3A
High DG + High DSM, 40% RPS by 2030
6 (if time
allows)
- 10 -

R.12-03-014 ALJ/DMG/sbf
1B
Early Nuclear Retirement
7 (not at this
time)
1DEnvironmental
8 (not at this
time)Alliance for Nuclear Responsibility, Clean Coalition, California
Cogeneration Council, CCSF, DRA, Natural Resources Defense Council, PG&E, SCE, SDG&E, The Utility Reform Network all indicated in their comments on the proposed decision different assumptions or scenarios they would like the Commission to examine. However, as we have previously indicated, and reinforced by the California ISO’s comments regarding resource limitations, only a limited number of scenarios are able to be run.6 While we decline to change our scenarios, assumptions, and priorities unless otherwise indicated in this Decision, we will allow parties to submit alternative analyses. A sensitivity (changing just one or two variables), particularly to an assumption value already defined will receive higher weight than wholesale creation of new scenarios (changing multiple variables), or use of assumptions other than those defined in Attachment A.
5. Comments on Proposed DecisionThe Proposed Decision was mailed to parties on November 20,
2012. Comments on the Proposed Decision were filed on December 10, 2012 and replies were filed on December 17, 2012. The Decision and the Attachment have been modified to reflect comments received.6. Assignment of Proceeding
6 ISO Comments at 6.
- 11 -

R.12-03-014 ALJ/DMG/sbf
The assigned Commissioner is Michel Peter Florio. The assigned ALJ and presiding officer is David M. Gamson.
Findings of Fact1. The Standardized Planning Assumptions and Scenarios issued in an assigned Commissioner’s Ruling on September 25, 2012 for use in Track 2 (system needs track) of the 2012 long-term procurement planning process, as modified on the basis of parties’ comments and as shown in Attachment A, are reasonable. 2. The CAISO can use the Standardized Planning Scenarios and Assumptions in Attachment A to conduct operational flexibility modeling. The purpose of this modeling is to evaluate the resources needed to maintain system reliability under various forecast conditions. This modeling will then inform the Commission in our Track 2 determination of IOU system needs, through a CAISO filing and party comments.
Conclusions of Law1. The Standardized Planning Assumptions and Scenarios issued in an assigned Commissioner’s Ruling on September 25, 2012 for use in Track 2 (system needs track) of the 2012 long-term procurement planning process, as modified on the basis of parties’ comments and as shown in Attachment A, should be adopted. 2. The Commission should formally request that the CAISO use the Standardized Planning Scenarios and Assumptions in Attachment A to conduct operational flexibility modeling and file the results in Track 2 of this proceeding.
O R D E R
- 12 -

R.12-03-014 ALJ/DMG/sbf
IT IS ORDERED that:1. The Standardized Planning Assumptions and Scenarios issued in an assigned Commissioner’s Ruling on September 25, 2012 for use in Track 2 (system needs track) of the 2012 long-term procurement planning process, as modified on the basis of parties’ comments and as shown in Attachment A hereto, are adopted. 2. The Commission formally requests that the California Independent System Operator (CAISO) use the Standardized Planning Scenarios and Assumptions in Attachment A to conduct operational flexibility modeling. The CAISO should file the results of such modeling in Track 2 of this proceeding.3. Southern California Edison Company, San Diego Gas & Electric Company and Pacific Gas and Electric Company (collectively, the utilities) shall use the base scenario and assumptions in Attachment A for purposes of their bundled plan forecasts in this proceeding. The utilities may also provide additional information examining the impact of using other assumptions and scenarios.4. Rulemaking 12-03-014 shall remain open.
This order is effective today.Dated December 20, 2012, at San Francisco, California.
MICHAEL R. PEEVEY PresidentTIMOTHY ALAN SIMONMICHEL PETER FLORIOCATHERINE J.K. SANDOVALMARK J. FERRON
Commissioners
- 13 -

R.12-03-014 ALJ/DMG/sbf
ATTACHMENT A
Final Assumptions and Scenarios for use in R.12-03-014

R.12-03-014 ALJ/DMG/sbf
I. Table of Contents
Scenarios and Assumptions1. Terminology....................................................................................12. Definitions.......................................................................................2I. Background.....................................................................................3II. Introduction....................................................................................3
A. History of LTPP Planning Assumptions....................................5III. 2012 LTPP Roadmap.......................................................................6IV. Guiding Principles..........................................................................7V. Planning Scope: Area, Time Frame & Assumptions.......................8VI. Building Scenarios..........................................................................9VII. 2012 Scenarios.......................................................................10VIII. Scenarios................................................................................13
A. Base Scenario.........................................................................131. Early SONGS Retirement Sensitivity...............................142. Stress Peak Sensitivity....................................................15
B. Replicating Transmission Planning Process (TPP) Scenario..16C. High Distributed Generation, High Demand Side Management
Scenario.................................................................................171. High Distributed Generation, High Demand Side
Management, 40% RPS by 2030 Sensitivity....................19IX. 2012 LTPP Scenario Matrix..........................................................20X. 2012 LTPP Scenario Charts..........................................................21XI. Assumptions..................................................................................22
A. Load Forecast and Demand Side Assumptions......................221. Background.....................................................................222. Load Assumptions............................................................233. Incremental Energy Efficiency........................................23
a. Locational Impact..................................................................244. Non-Event Based Demand Response...............................245. Incremental Self-Generation, Demand Side....................24
a. Small Solar Photovoltaic (Behind the Meter).........................24b. Incremental Combined Heat and Power (Behind the Meter).25B. Supply-Side Assumptions.......................................................26
1. Background.....................................................................262. Generic Assumptions for Supply-Side Resources............263. Existing Resources..........................................................274. Imports............................................................................275. Resource Additions..........................................................28
- i -
R.12-03-014 ALJ/DMG/sbf
6. Deliverability...................................................................287. Event-Based Demand Response......................................29
a. Locational Impacts.................................................................298. Incremental Self-Generation, Supply-Side......................30
a. Incremental Combined Heat and Power (Exporting).............309. Renewable Resource Assumptions..................................30
a. 20 Year Forward Studies.......................................................3210. Resource Retirements.....................................................32
a. Hydroelectric Resources........................................................33b. Renewable Resources............................................................33c. Once Through Cooled (OTC) Power Plants............................34d. Nuclear Power Plants.............................................................34e. All Other Resources...............................................................35f. The Second Planning Period: Years 11-22.............................35g. Price Methodologies..............................................................36a. Natural Gas............................................................................36b. Greenhouse Gas.....................................................................36
I. Purpose...........................................................................................2II. Modeling Inputs Required by the ISO............................................3III.Critical Information Needed from CPUC-Jurisdictional Utilities....3
A. Rolled Up Modeling.................................................................4B. Customer Class Estimates of Peak Load..................................5
IV. Achieving Correspondence between IOU Load Bus Data and California ISO Power Flow Base Case Modeling Conventions.............61. Incremental Energy Efficiency Impacts..........................................7
B. 2009 IEPR-Cycle Incremental Energy Efficiency Impacts.......7V. Translating Service Area Impacts to Load Bus Impacts.................9VI. Preliminary Assessment of the Impacts of Incremental Energy Efficiency Load Reductions................................................................10I. Purpose...........................................................................................2II. Demand Response Impacts.............................................................2III.Critical Information Needed from CPUC-Jurisdictional Utilities....3IV. Translating Service Area Impacts to Load Bus Impacts.................4I. Base Scenario.................................................................................1
A. Early SONGS Retirement Sensitivity.......................................2B. Stress Peak Sensitivity.............................................................3
II. Replicating the TPP Scenario.........................................................4III.High Distributed Generation, High Demand Side Management Scenario...............................................................................................5
A. High Distributed Generation, High Demand Side Management Scenario, 40% RPS by 2030 Sensitivity...................................6
IV. Other Assumptions Common To All Scenarios...............................1
- ii -

R.12-03-014 ALJ/DMG/sbf
V. RPS Calculator Summary...............................................................2
- iii -

R.12-03-014 ALJ/DMG/sbf
1. TerminologyAcronym
Definition
CPUC California Public Utilities Commission
CEC California Energy CommissionCAISO California Independent System
OperatorARB Air Resources BoardSWRCB
State Water Resources Control Board
TEPPC Transmission Expansion Planning Policy Committee
IOU Investor Owned UtilitiesLSE Load Serving EntityPG&E Pacific Gas and ElectricSCE Southern California EdisonSDG&E San Diego Gas & Electric
1-in-10 1 in 10 year weather event (peak) forecast
1-in-51-in-2
1-in-5 year weather event (peak) forecast1 in 2 year weather event (peak) forecast
AB Assembly BillCEDDSM
California Energy Demand ForecastDemand Side Management
CHP Combined Heat and PowerGWh Gigawatt HourIEPR Integrated Energy Policy ReportLCA Local Capacity AreaLCR Local Capacity RequirementLTPP Long Term Procurement PlanMW MegawattNQC Net Qualifying CapacityOTC Once Through CooledPTO Participating Transmission OwnerRNS Renewable Net ShortRPS Renewable Portfolio Standard
- 1 -

R.12-03-014 ALJ/DMG/sbf
SGIP Self-Generation Incentive ProgramTPP Transmission Planning Process
2. DefinitionsAn Assumption is a statement about the future for a given resource or resource type. For example, future load conditions are an assumption.A Scenario is a complete set of assumptions defining a possible future world. Scenarios are driven by major factors with impacts across many aspects of loads and resources. For example, an increase or decrease in load would constitute a changed scenario since the impacts would potentially affect planning reserve margins, the amounts of renewables, and transmission needs.A Portfolio is an important component of scenarios. Portfolios are the mix of resources to be modeled, created as a result of applying the assumptions in a specific scenario. A high distributed generation scenario would have a different portfolio of resources than a low cost scenario. Sensitivities are variations on a scenario where one variable is modified to assess its impact on the overall scenario results. Different renewable portfolios, holding other assumptions constant, are an example of sensitivities. The Load Forecast refers to load levels, measured by both annual peak demand and annual energy consumption. Load forecasts are strongly influenced by economic and demographic factors.A Managed Forecast refers to a forecast that has been adjusted to account for programs or expectations not embedded into the forecast. An example is adjusting the California Energy Demand Forecast to account for energy efficiency programs not yet currently funded but with expectations for funding and specific programs in the future.The Probabilistic Load Level refers to the specific weather patterns assumed in the study year. For example a 1-in-10 Load Level indicates a high load event due to weather patterns expected to occur approximately once in every 10 years. The probabilistic load level primarily impacts annual peak demand (and other demand characteristics, such as variability) but does not significantly impact annual energy consumption. Resource Plans refers to the need to build new resources or maintain existing resources from an electrical reliability perspective.
- 2 -

R.12-03-014 ALJ/DMG/sbf
Bundled Plans refers to the three large Investor Owned Utilities’ procurement plans established in compliance with AB 57 to determine upfront and reasonable procurement standards.
I. Background
The Long Term Procurement Plan (LTPP) proceedings were established to ensure a safe, reliable and cost-effective electricity supply in California.7 Track 2 of the 2012 LTPP addresses the overall long-term need for new system reliability resources, including the adoption of system resource plans.8 These resource plans will allow the Commission to comprehensively assess the impacts of state energy policies on the need for new resources. Based on these system resource plans, the Commission shall consider updates to the Investor-Owned Utilities’ (IOUs) bundled procurement plans with a focus on the IOUs’ obligation to maintain electric supply procurement responsibilities on behalf of IOU customers.
II. Introduction
This LTPP proceeding was initiated by an Order Instituting Rulemaking issued on March 27, 2012.9 The rulemaking’s stated
7 Pursuant to AB 57 (Stats. 2002, ch. 850, Sec 3, Effective September 24, 2002), added Pub. Util. Code § 454.5., enabling resources to resume procurement of resources. See also OIR 3/27/2012, Scoping Memo 1.8 See Scoping Memo and Ruling of Assigned Commissioner and Administrative Law Judge, Rulemaking (R.)12-03-014, issued May 17, 2012.9 This proceeding follows R.10-05-006, R.08-02-007, R.06-02-013, R.04-04-003, and R.01-10-024, and the rulemakings initiated by the Commission to ensure that California’s major investor-owned utilities (IOUs) resume and maintain procurement responsibilities on behalf of their customers.
- 3 -

R.12-03-014 ALJ/DMG/sbf
purpose is “to continue our efforts through integration and refinement of a comprehensive set of procurement policies, practices, and procedures underlying long-term procurement plans.”10
On May 10, 2012, the Energy Division11 served its 2012 Energy Division Straw Proposal on LTPP Planning Standards (Straw Proposal) to the service list in this proceeding. A workshop was held on May 17, 2012 to discuss the Straw Proposal. That same day, the Scoping Memo was issued, defining the parameters of the 2012 LTPP proceeding.12 Parties were given the opportunity to file comments on the Straw Proposal on May 31, 2012 and reply comments on June 11, 2012.13
On June 27, 2012, the Assigned Commissioner’s Ruling introduced to parties the planning assumptions to be used in the 2012 LTPP proceeding.14 Those assumptions formed the building blocks for the LTPP scenarios set forth in the Energy Division Proposed Scenarios, served to parties on August 2, 2012. Energy Division conducted a workshop on August 24, 2012, and received technical comments from parties through September 11, 2012. On September 20, the Assigned
10 Order Instituting Rulemaking to Integrate and Refine Procurement Policies and Consider Long-Term Procurement Plans, R.12-03-014, issued March 27, 2012, p. 1.11 Throughout this document, “Energy Division”, “Energy Division Staff”, “ED”, “ED Staff”, and “Staff” all refer to the staff of the California Public Utilities Commission (CPUC) Energy Division.12 See Scoping Memo and Ruling of Assigned Commissioner and Administrative Law Judge, R.12-03-014, issued May 17, 2012.13 Id. 14 See Assigned Commissioner’s Ruling on Standardized Planning Assumptions, R.12-03-014, issued June 27, 2012.
- 4 -

R.12-03-014 ALJ/DMG/sbf
Commissioner’s Ruling laid forth the Revised Scenarios for comment.15 Parties provided comments on October 5, 2012 and reply comments on October 19, 2012.
A. History of LTPP Planning AssumptionsSince the 2006 LTPP, the Commission has worked to improve transparency, data access, and to streamline long term procurement planning processes. The main effort of the 2008 LTPP was the creation of the Energy Division Straw Proposal on LTPP Planning Standards. 16 The 2010 LTPP took strides towards implementing that proposal, with adjustments based on party comments. Energy Division held several workshops in the summer of 2010, and in December 2010 the 2010 LTPP Standardized Planning Assumptions were issued via a Joint Scoping Memo and Ruling.17 In this document, the Commission establishes LTPP planning assumptions for the 2012 LTPP that build upon the last four years of planning efforts to further improve the LTPP process.
15 See Assigned Commissioner’s Ruling setting forth Standardized Planning Scenarios, R.12-03-14, issued September 20, 2012.16 Energy Division Straw Proposal on LTPP Planning Standards, http://docs.cpuc.ca.gov/published/Graphics/103215.PDF17 See Assigned Commissioner and Administrative Law Judge’s Joint Scoping Memo and Ruling, issued December 3, 2012, http://docs.cpuc.ca.gov/EFILE/RULC/127542.htm
- 5 -

R.12-03-014 ALJ/DMG/sbf
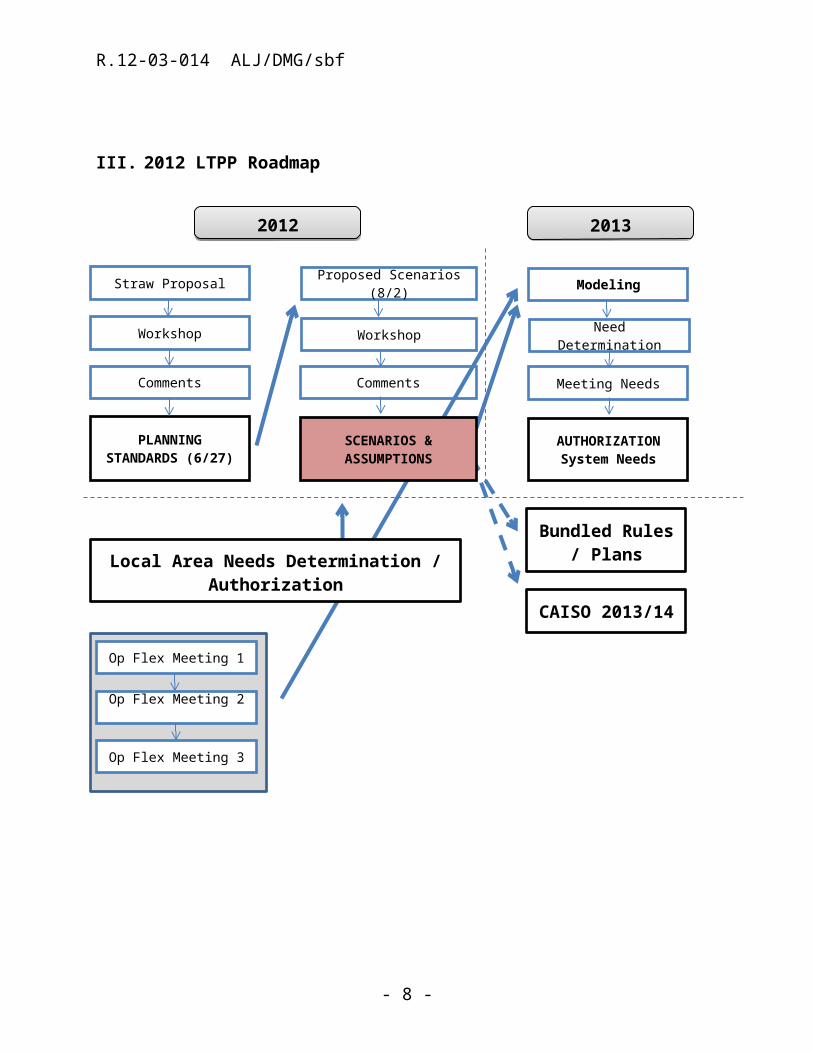
III. 2012 LTPP Roadmap
‘
IV. Guiding Principles
The Guiding Principles18 for the 2012 LTPP are:
18 See Assigned Commissioner’s Ruling on Standardized Planning Assumptions,
- 6 -
Comments
Workshop
Straw Proposal
PLANNING STANDARDS
(6/27)
SCENARIOS & ASSUMPTIONS
Comments
Workshop
Proposed Scenarios (8/2)
2012 2013
AUTHORIZATION
System Needs
Meeting Needs
Need Determination
Modeling
Bundled Rules / Plans
CAISO 2013/14 TPP
Op Flex Meeting 3
Op Flex Meeting 2
Op Flex Meeting 1
Local Area Needs Determination / Authorization
Based on 2011/12 CAISO TPP

R.12-03-014 ALJ/DMG/sbf
A. Assumptions should take a realistic view of expected policy-driven resource achievements in order to ensure reliability of electric service and track progress toward resource policy goals.
B. Assumptions should reflect real-world possibilities, including the stated positions or intentions of market participants.
C. Scenarios should be informed by an open and transparent process. An exception is confidential market price data, which may be reasonably submitted with publicly available engineering- or market-based price data checked against confidential market price data for accuracy.
D. Scenarios should inform the transmission planning process and the analysis of flexible resource requirements to reliably integrate and deliver new resources to loads.19
E. Scenarios should be designed to form useful policy information including tracking greenhouse gas reduction goals.
F. Resource portfolios should be substantially unique from each other.
G. Scenarios should inform bundled procurement plan limits and positions.
H. Scenarios should be limited in number based on the policy objectives that need to be understood in the current Long Term Procurement Plan cycle.
R.12-03-014, issued June 27, 2012.19 Scenarios used by the California ISO Transmission Planning Process must meet the requirements in Section 24.4.6.6 of the California ISO’s Tariff. Scenarios developed in the LTPP process may inform the development of the California ISO’s TPP scenarios to the extent feasible under their tariff and adopted by their organization.
- 7 -

R.12-03-014 ALJ/DMG/sbf
I. Agencies including CPUC, Energy Commission, and the California ISO should strive to reach common understandings and interpretations of planning assumptions.
V. Planning Scope: Area, Time Frame & Assumptions
The following scenarios are specifically created for the California ISO controlled transmission grid and the associated distribution systems. The planning period is established as twenty years in order to take into consideration the major impacts of infrastructure decisions now under consideration. While detailed planning assumptions are used to create an annual assessment in the first ten years (2013-2022), more generic long-term assumptions are utilized in the second period (2023-2034), reflecting the heightened uncertainties around future conditions. The second period is designed to inform resource choices made today as well as shape policy discussions, and not to make authorizations of need in those years.This document supersedes the previous versions of assumptions and scenarios in this proceeding.
VI. Building Scenarios
The LTPP scenarios are developed to help answer current resource planning questions before the Commission. The critical questions facing the 2012 LTPP include the following:
1. What new resources need to be authorized and procured to ensure adequate system reliability, both for local areas and the system generally, during the planning horizon?
- 8 -

R.12-03-014 ALJ/DMG/sbf
What is the need for flexible resources and how does that need change with different portfolios? What electrical characteristics (e.g. ramp rates, regulation speeds) are needed in what quantities? Are these needs location specific?
How does the potential retirement of major resources (e.g. once-through-cooling, nuclear) change the resource needs?
How can reliability needs be balanced against costs while also creating opportunities for achieving economically efficient outcomes?
2. What mix of resources minimizes cost to customers over the planning horizon?
Is there a preferred mix of energy-only, fully deliverable resources, and demand side resources? How does this mix vary depending on the operational characteristics of the resources?
Does increased distribution-level generation reduce overall costs?
What synergies exist between generation and transmission resources, and between different types of supply resources that can be used to limit overall costs?
VII. 2012 Scenarios
Resource limitations demand prioritization of scenario modeling in favor of scenarios that can provide actionable guidance to decision makers regarding realistic future outcomes. Furthermore, it is
- 9 -

R.12-03-014 ALJ/DMG/sbf
prudent for the Commission to establish a base scenario and set of assumptions for use by the IOUs in their bundled procurement plans. The Base Scenario and its assumptions shall serve that purpose for the IOUs in their longer-term planning.20
In the Energy Division Proposed Scenarios, served on August 2, 2012, Staff presented three unique scenarios with six distinct sensitivity analyses to evaluate potential futures. These scenarios and assumptions have been refined based on comments since the initial proposal as well as the September 20, 2012 assigned Commissioner’s Ruling.In the LTPP, scenarios and sensitivities have greater or lower priority based on the modeling purposes. For example, a sensitivity of different renewable generation resource locations may have a more significant impact in transmission planning (e.g. power-flow) studies than in operational flexibility studies. These different cases and priorities are also established based on the guiding principles for the LTPP.
For the operational flexibility studies, three scenarios and one sensitivity are identified high priority and a second tier of two sensitivities to be modeled if time and resources allow. The four high priority runs are: Base Scenario, Replicating the TPP Scenario, Early SONGS Retirement Sensitivity, and High Distributed Generation, High Demand Side Management Scenarios. The Base Scenario provides a modestly conservative “expected” case.21 The Replicating
20 See Decision approving modified Bundled Procurement Plans, D.12-01-033, starting at page 15.21 In this case, conservative means that some resources have been discounted in order to account for uncertainties that could impact
- 10 -

R.12-03-014 ALJ/DMG/sbf
TPP Scenario reflects a high unmanaged load future combined with 1-in-5 peak weather conditions.22 Accordingly, this scenario may stress operating flexibility by committing available resources for energy and thereby limiting their use for flexibility. Early SONGS Retirement explores a future without the significant energy contributions of a major baseload resource (SONGS) in the first planning period (2015) and the retirement of another (Diablo Canyon) in the second planning period (2024). This is designed to reflect a current uncertainty around the operation of the SONGS facility as well as understand the longer-term implications of retiring Diablo Canyon as some parties have proposed. The High Distributed Generation, High Demand Side Management Scenario, in contrast, explores a future with lower energy demand and higher production from variable distributed generation; this scenario may stress available flexibility in a different way, by presenting the highest percentage of variable resources relative to load. The second tier priority for modeling includes the Stress Peak sensitivity and the High Distributed Generation, High Demand Side Management, 40% RPS in 2030 sensitivity. The Stress Peak sensitivity replicates the Base Scenario but with a higher 1-in-5 peak weather condition. This scenario would provide a sense of the world between the Base Scenario, the CPUC’s expected future, and the
reliability.22 Energy Division Staff and several parties indicated in workshops that it is important to reiterate the importance of aligning scenario planning where possible between the Commission and the California ISO. The Replicating TPP Scenario is set up to align with the California ISO’s current processes and methods for transmission planning, providing a point of comparison between the two processes.
- 11 -

R.12-03-014 ALJ/DMG/sbf
Replicating TPP Scenario. The High Distributed Generation, High Demand Side Management, 40% RPS by 2030 Sensitivity, envisions the implications of a 40% RPS target upon the system, ratcheting up the stress on availability flexibility from the High Distributed Generation, High Demand Side Management Scenario in a longer-term period. A table of the proposed scenarios with the corresponding assumptions can be found in Section .Two sensitivities from the Proposed Scenarios, Early Nuclear Retirement23 and Environmental 24 are not recommended for modeling within the LTPP cycle at this time. However, the set of assumptions appropriate for examining these two alternatives is available in the Scenario Matrix in case there is use for them in other applications, such as transmission planning. The selected scenarios and sensitivities effectively capture a wide range in future variability that will provide a strong framework for analysis in the 2012 LTPP. In this way, these scenarios and sensitivities best reflect the LTPP proceeding’s ultimate goal of creating plans that ensure a safe, reliable and cost-effective electricity supply in California while also meeting the guiding principles.
23 The Early Nuclear Retirement sensitivity has both SONGS and Diablo Canyon nuclear facilities as retired starting 2015.24 The Environmental sensitivity changed the projected RPS build out from the current procurement path. However, as illustrated in the 2010 LTPP, there are only minor differences from a system flexibility perspective (as opposed to a transmission planning perspective) between the Commercial and Environmental RPS portfolios.
- 12 -
R.12-03-014 ALJ/DMG/sbf
VIII. Scenarios
A. Base ScenarioThe Base Scenario is the “control” for our analysis, designed to reflect a modestly conservative future world with little change from existing procurement policies. The Base serves as the point of reference for the rest of the scenarios.The Base Scenario starts with the California Energy Demand (CED) mid load,1-in-2 peak weather forecast. The forecast is then adjusted by the mid value for incremental EE. Similarly, the mid level of incremental demand side demand response is selected with no incremental adjustments assumed beyond those embedded in the 2011 CED, except as recommended by the Energy Commission.25 For incremental demand side small photovoltaics (PV) the mid value is also selected, as distinct from wholesale PV accounted for in the RPS portfolios.26 Lastly, the low value for incremental demand side combined heat and power (CHP) resources is selected.On the supply side, the low value for incremental supply-side CHP is selected. Resource Additions are treated in the analysis as incremental to existing generation. Both Known Additions and Planned Additions shall be used in all scenarios, while assumptions for renewable resources are addressed in their own section.27 For 25 The one exception to the demand side DR is regarding the impacts of the PG&E peak time rebate program.26 These resources are distinct from the RPS-eligible solar distributed generation selected in the RPS portfolios.27 Known additions are resources that have a contract in place, have been permitted, and have construction under way. Planned Additions are resources that have a contract, but have not yet begun construction, or are indicated by other entities such as municipalities as expected to come
- 13 -
R.12-03-014 ALJ/DMG/sbf
retirements, the base assumption for once-through-cooled (OTC) resources is selected, in combination with low retirement assumptions for renewable, hydroelectric, and nuclear resources, and mid assumptions for all other resources.Imports shall be based on the CAISO Available Import Capability for loads in their control area. This is equal to the CAISO Maximum Imports minus Existing Transmission Contracts (ETCs) outside their control area.28
For the 33% RPS portfolio, the Commercial Interest portfolio is selected. This portfolio is designed to be the best forecast of future RPS development using commercial interest as a key selection factor.How to Get There: The Base Scenario requires no change to the business as usual trajectory. All current policies are assumed as maintained or extended with little change in current practices. The Base presumes that these policies achieve results consistent with current achievement and forecast expectations.
1. Early SONGS Retirement SensitivityOne of the essential questions facing this LTPP is the long-term status of the nuclear generating facilities in California. Specifically, how can system reliability be maintained with the retirement and/or non-relicensing of some or all of these units? The acutely heightened uncertainty surrounding the San Onofre Nuclear Generating Station online.28 http://www.caiso.com/Documents/2013Assigned_UnassignedRAImportCapability_BranchGroups-AfterStep6.pdf. For resources outside of the California ISO, the Transmission Expansion Policy Planning Committee (TEPPC) data should be utilized, specifically the 2022 Common Case generation table. See Data/Surveys” at http://www.wecc.biz/committees/BOD/TEPPC/External/Forms/external.aspx .
- 14 -

R.12-03-014 ALJ/DMG/sbf
(SONGS) requires particular focus on understanding the long term planning implications of the state’s nuclear fleet.This sensitivity was developed to explore the implications of a key nuclear relicensing and retirement possibility facing the Commission. The Early SONGS Retirement sensitivity departs from the Base Scenario by applying the mid assumption, with SONGS retired on January 1, 2015 and Diablo Canyon retired at relicensing in 2024 (Unit 1) and 2025 (Unit 2). Note that in no way does this sensitivity intend to pre-judge Commission action on nuclear retirements; instead it seeks to inform Commission decision making in this area. How to Get There: The Early SONGS Retirement Sensitivity requires a policy change to realize the near-term retirement of SONGS in 2015, and Diablo Canyon upon the expiration of its license in 2024/2025.
2. Stress Peak SensitivityThis sensitivity is closely linked to both the Base Scenario and the Replicating Transmission Planning Process (TPP) Scenario. The Stress Peak sensitivity is identical to the Base Scenario, with one exception: it assumes a 1-in-5 peak weather year, as opposed to the Base Scenario’s 1-in-2 peak weather year. Unlike the Replicating TPP Scenario, the Stress Peak sensitivity includes the impacts of various demand side programs as well as a business as usual expectation of demand response programs. By creating a hybrid of these two scenarios, this sensitivity aims to capture a future with relatively higher peak loads and thus, increased system stress.How to Get There: Just as with the Base Scenario, the Stress Peak Sensitivity requires no change to the business as usual
- 15 -

R.12-03-014 ALJ/DMG/sbf
trajectory. All current policies are assumed be maintained or extended with little change in current practices. Policies are expected to achieve results consistent with current achievement and forecast expectations but are tested against a higher peak load condition.
B. Replicating Transmission Planning Process (TPP) Scenario
The Replicating the California ISO’s TPP Scenario, was created to form a point of convergence between the LTPP and the TPP by trying to match the assumptions that have been generally utilized by the California ISO in its TPP. By generally aligning the assumptions of the two planning processes in this way, this scenario analysis seeks to facilitate the exchange of information between the CPUC and California ISO with the ultimate goal of more effectively coordinating generation and transmission resource planning.29 The TPP is an annual process. In the most recent TPPs, the CPUC and CEC have provided renewable resource portfolios, a key assumption (e.g. a component of a scenario) to the TPP. Note that this scenario does not intend to modify the Memorandum of Understanding between the California ISO and CPUC on transmission planning assumptions. Under that Memorandum, CPUC will provide renewable resource portfolios to California ISO for use in the TPP.
29 As set forth in the June 27th Assigned Commissioner’s Ruling, the CPUC Staff has worked with the California ISO in recent years to develop consistency across the LTPP and TPP processes. Creating common points of reference between the CPUC and California ISO analyses may provide significant benefit to both agencies. For information on the California ISO Transmission Planning Process, including the tariff language adopted by the Federal Energy Regulatory Commission and the California ISO Planning Standards documents are available here: http://www.caiso.com/planning/Pages/TransmissionPlanning/Default.aspx.
- 16 -

R.12-03-014 ALJ/DMG/sbf
Replicating TPP differs from the Base in several key ways. First, it applies a 1-in 5 peak weather condition, versus the Base Scenario’s 1-in-2 peak weather condition. This change generally aligns with the TPP assumptions wherein a 1-in-5 peak weather forecast is used for the overall system while a local area is stressed with 1-in-10 peak weather conditions. Similar to the Base, the Mid forecast for energy consumption is used. There are limited to no impacts associated with future programs associated with energy efficiency or combined heat and power, and a low level of demand response. The RPS portfolio is the Commercial Interest case. Nuclear generation is assumed online throughout the planning horizon. Unlike the other scenarios, resource retirements are limited to those announced or to meet state OTC policy. All generation is otherwise assumed remaining online or repowered with an electrically equivalent resource. To the extent that the California ISO changes the core assumptions within the TPP through its stakeholder processes, this scenario should be realigned to match those assumptions.How to Get There: The Replicating TPP Scenario entails continuing RPS policy without significant change, while also terminating policies relating to preferred resources.
C. High Distributed Generation, High Demand Side Management Scenario
The Governor has made the adoption of distributed generation a priority.30 This scenario was created to project the general
30 See California’s Path to 12,000 Megawatts of Local Renewables, Governor’s Local Renewable Power Working Group Conference, Segmenting the Governor’s Localized Energy Goal Panel, Discussion Paper #1: http://gov.ca.gov/docs/ec/ConferencePaper_regional_target.pdf.
- 17 -

R.12-03-014 ALJ/DMG/sbf
implications of this state policy of promoting high amounts of distributed generation and demand side resources throughout the system and generally meeting the resource requirements of California’s load within the California ISO.31 This future represents a significant change to the pattern of generation and transmission development. Accordingly, this scenario may provide insight to policy makers into the resource needs associated with impacts of this shift in generation and transmission.The High Distributed Generation, High Demand Side Management Scenario applies the High assumption for small incremental PV. It projects a strong increase in the quantities of Incremental CHP on both supply and demand sides via high assumptions, a high level of incremental EE, and a mid-level of DR. RPS procurement is shifted to High Distributed Generation (from the Base Scenario’s Commercial case)32, while nuclear retirements apply the Low assumption with plants assumed online throughout the study horizon. How to Get There: The High Distributed Generation, High Demand Side Management Scenario assumes the aggressive pursuit of CHP and Incremental Small PV, while maintaining 31 The portion of the Governor’s 12,000 MW DG goals applicable to the LTPP analysis is 80%, or approximately 9,500 MW. A conservative assessment of DG capacity projected in the Base scenario is 6,059 MW by 2022, while in the High DG/DSM scenario it is 9,343 MW by 2022, not including CHP self-generation. If the assessment included CHP self-generation, then the DG capacity projected in the Base scenario is 9,091 MW by 2022, while in the High DG/DSM scenario it is 12,375 MW by 2022. CHP self-generation incremental to that embedded in the Energy Commission 2011 demand forecast is not included in these assessments since there is a separate goal for incremental new CHP by 2030.32 RPS-eligible distributed generation is distinct from other sources of distributed generation provided by other assumptions, such as the incremental small PV assumption.
- 18 -

R.12-03-014 ALJ/DMG/sbf
current DR policies. Also, it requires a change to RPS policy, moving away from central station generation by altering the procurement direction in favor of distributed generation resources.
1. High Distributed Generation, High Demand Side Management, 40% RPS by 2030 Sensitivity
This sensitivity differs from the High Distributed Generation, High Demand Side Management Scenario by considering the implications of ahypothetical adoption of a 40% RPS target by 2030. Since the 33% RPS Calculator does not create sufficiently detailed annual portfolios for this analysis, a renewables net short for 2030 is calculated via adjustments to the RPS calculator (see below in Section XI). The additional renewables in the resulting portfolio (i.e. with the higher 40% in 2030 renewables net short) relative to the High Distributed Generation, High Demand Side Management Scenario are assumed to be added in equal amounts each year from 2023 onward. This scenario marks an effort to begin creating a body of analysis around the operational impacts associated with a higher RPS target beyond 2020. This sensitivity otherwise is identical to the High Distributed Generation, High Demand Side Management Scenario.
How to Get There: The High Distributed Generation, High Demand Side Management 40% RPS by 2030 Sensitivity assumes a change in current RPS targets to attain a 40% RPS by 2030, in addition to the changes for the High Distributed Generation, High Demand Side Management Scenario.
- 19 -
R.12-03-014 ALJ/DMG/sbf
IX. 2012 LTPP Scenario Matrix The Priority Cases are: Base, Replicating TPP, Early SONGS Retirement, and High DG + High DSM. Note that the colors in this table correspond to the colors used in the graphs below in Section X.
- 20 -
#Na
me
OpFle
x Mo
delin
g Pri
ority
Load
Inc EE
Inc PV
Inc CH
PEx
isting
Additi
ons
Retir
emen
tsOT
C Re
tirem
ents
Rene
wable
+ Hy
dro
Retir
emen
tsNu
clear
Retir
emen
tRP
S Po
rtfoli
o
RPS N
et Sh
ort
Scena
rioIm
ports
Inc CH
PInc
DR1
Base
1Mi
dMi
dMi
dLo
wBa
seBa
seMi
dBa
seLo
wLo
wCo
mmerc
ialCo
mmerc
ialBa
seLo
wMi
d
2Re
plicati
ng TP
P2
Mid (
1-in-
5 pea
k we
ather)
None
None
None
Base
Base
Low
Base
Low
Low
Comm
ercial
Rep T
PPBa
seNo
neLo
w
1AEa
rly SO
NGS
Retir
emen
t3
Mid (
SONG
S 201
5, DC
PP 20
24/5)
3Hig
h DG +
High
DS
M4
Mid
High
High
High
Base
Base
Mid
Base
Low
Low
High D
GHig
h DG
Base
High
Mid
3A
High D
G + Hi
gh
DSM,
40%
RPS b
y 20
305 (
if time
all
ows)
High D
G 40
% RP
S by
2030
1CStr
ess C
ase6 (
if time
all
ows)
Mid (
1-in-
5 pea
k we
ather)
1BEa
rly Nu
clear
Retri
emen
t7 (
not a
t thi
s time
)Hig
h (20
15)
1DEn
viron
menta
l8 (
not a
t thi
s time
)En
viron
men
talEn
viron
men
tal
Same
as Ba
seSa
me as
Base
Same
as Ba
se
Same
as Hi
gh DG
+ High
DSM
Same
as Hi
gh DG
+ High
DSM
Same
as Hi
gh DG
+ High
DSM
Scen
ario
Dem
and
Supp
ly
Same
as Ba
seSa
me as
Base
Same
as Ba
se
Same
as Ba
seSa
me as
Base
Same
as Ba
seSa
me as
Base
Same
as Ba
se

R.12-03-014 ALJ/DMG/sbf
X. 2012 LTPP Scenario ChartsThese charts provide a graphic depiction of the net load and supply in the various scenarios proposed. Note that in some of the graphs, multiple scenarios appear as a single curve because they are identical in that particular context.
- 21 -

R.12-03-014 ALJ/DMG/sbf
XI. AssumptionsA description of assumptions is provided in this section. All values are reported in the Scenario Tool.33
A. Load Forecast and Demand Side Assumptions
1. BackgroundDemand side assumptions are either base values or incremental to a demand forecast. Base values, such as the California Energy Demand Forecasts (CED),34 are values that can be considered wholly in and of themselves without being tied to another forecast. Incremental values, such as utilized in assessing incremental uncommitted energy efficiency, are those not embedded in the underlying demand forecast. As an example, in the load forecast, some amount of energy efficiency is already “embedded” into the base forecast, representing current codes and standards and established energy efficiency programs. Any future expected energy or capacity savings, from goals but arising from not yet established or funded programs, would be considered incremental. Assumptions originated from other state agencies will not be re-litigated in this proceeding.
33 The latest version of the Scenario Tool is 4.0. The Scenario Tool is located at http://www.cpuc.ca.gov/PUC/energy/Procurement/LTPP/ltpp_history.htm34 See Adopted California Energy Commission Demand Forecast Report 2012-2022, adopted June 2012 and updated September 2012, http://www.energy.ca.gov/2012_energypolicy/documents/index.html
- 22 -

R.12-03-014 ALJ/DMG/sbf
2. Load AssumptionsThe California Energy Demand (CED) forecast serves as the base load forecast.35 The mid econ-demo load is used in all cases. There are also peak weather impacts, of which the 1-in-2 peak forecast is the base forecast. Sensitivities of alternative peak conditions, such as 1-in-10 weather, should be conducted around the medium load (GWh) values. For local area specific analyses, 1-in-10 peak forecasts shall be used as the base.
3. Incremental Energy EfficiencyThe Energy Commission also estimates incremental energy efficiency in three “savings scenarios”. The same approach is used for the 2012 LTPP, wherein the Energy Commission analyzes energy efficiency programs and creates a forecast that is incremental to the CED.In the 2010 LTPP, goals adopted in D.08-07-047 were based on the 2008 Goals Study. In order to account for more current information from the 2011 Potential Study,36 the Energy Commission updated the incremental uncommitted forecast in September 2012 after providing an initial forecast in July 2012. As the first phase of the Analysis to Update Potential Goals and Targets, the potential study provides a base case forecast of energy efficiency potential for traditional IOU incentives. The second phase of the study, which generates scenarios of forecasted savings that consider policy and market mechanisms as well as economic conditions, will not be completed until 2013. As part
35 A “managed forecast,” in this context, is a base demand forecast (including some embedded energy efficiency), plus adjustments to represent incremental impacts of all “cost effective, reliable and feasible” demand side resources.36 See The 2011 Potential Study at http://www.cpuc.ca.gov/PUC/energy/Energy+Efficiency/Energy+Efficiency+Goals+and+Potential+Studies.htm
- 23 -
R.12-03-014 ALJ/DMG/sbf
of the incremental uncommitted forecast, the Energy Commission conducted low, middle, and high analyses. The low and middle values are adopted as the low and mid assumptions for the 2012 LTPP. The high values are increased by a low level of Big Bold EE Strategies uptake as well as naturally occurring savings.
a. Locational Impact Appendix A – Assessing Impacts of Incremental Energy Efficiency Program Initiatives on Local Capacity Requirements appended provides the methodology for assigning incremental energy efficiency to specific busbars for use in power flow and other modeling needs that require greater granularity.
4. Non-Event Based Demand ResponseFor demand side demand response programs, the values embedded in the Energy Commission load forecasts will be utilized. The only adjustment to non-event based demand response is to account for programs not initially included in the Energy Commission load forecasts. Non-event-based demand response programs are included on the demand side of the assessment. Event-based programs are treated as supply resources.
5. Incremental Self-Generation, Demand Side
- 24 -

R.12-03-014 ALJ/DMG/sbf
a. Small Solar Photovoltaic (Behind the Meter)The impacts of initiatives, such as the California Solar Initiative, are embedded in the CED forecast. A further incremental adjustment to the CED forecast reflects further expansion of behind the meter programs, as separate from systems located on the distribution system or connected to the transmission system. Small photovoltaic are defined as up to 5 MW in alternating current nameplatecapacity. The incremental values for the mid and high assumptions are reflective of the increase in Net Energy Metering (NEM) from D.12-05-036.37
b. Incremental Combined Heat and Power (Behind the Meter)
Some combined heat and power resources are embedded in the CED forecast. Resources identified in this section are those that are serving on-site load and not exporting electricity to the grid. All MW values are attained by 2030, and linear growth is assumed. ICF International conducted a policy analysis of combined heat and power resources. The revised analysis from June 2012 (updated July 2012) serves as the basis for the mid and high values.38 The low value reflects no change in net CHP capacity. The mid value is the “ICF Base Case”, which reflects: cap and trade, self-generation incentive program expiration in January 2016, 33% RPS, AB 1613 CHP pricing for CHP under 20 MW, short run average cost export
37 For more information on Decision Regarding the Calculation of the Net Energy Metering Cap, D.12-05-036, see http://docs.cpuc.ca.gov/published/Final_decision/167591.htm38 See Combined Heat and Power: Policy Analysis and 2011-2030 Market Assessment – Consultant Report at http://www.energy.ca.gov/2012publications/CEC-200-2012-002/CEC-200-2012-002-REV.pdf
- 25 -

R.12-03-014 ALJ/DMG/sbf
pricing for CHP over 20 MW. The high value is the “ICF Mid Case”, which reflects: self-generation incentive program is extended past 2016, 33% RPS, stimulus for export projects larger than 20 MW, increased market participation due to removal of barriers and risk by 5-20%.
B. Supply-Side Assumptions
1. BackgroundAll supply-side resource assumptions are solely for planning purposes. Inclusion or exclusion of a specific project or resource in the planning cycle has no implications for existing or future contracts. To the extent a specific forecast resource is not available, the analysis assumes an electrically equivalent resource will be available.
2. Generic Assumptions for Supply-Side ResourcesAll supply-side resources should be categorized either as within a specific local area, as a generic system resource, or as out of state. Resources should be accounted for in terms of their most current net qualifying capacity (NQC) for purposes of constructing loads and resources tables. In the absence of a NQC, resources expected NQC should be accounted for in light of their actual or expected installed capacity. To the extent that accounting methodologies change in the future, those changes should be reflected in LTPPs subsequent to the current LTPP, but other methods such as Effective Load Carrying Capacity (ELCC) will not be utilized at this time. For variable resources, methods that can forecast production based on a variety of conditions are preferred to utilizing single point or year assumptions.
- 26 -

R.12-03-014 ALJ/DMG/sbf
3. Existing ResourcesLists with the most recent net qualifying capacity are published on the CPUC website.39 Variable resources shall include or utilize a generic production profile; there is significant value in choosing a specific data source (and historical year if stochastic modeling is not utilized) for these production profiles. Renewable resources are addressed separately below.
4. ImportsImports shall be based on the CAISO Available Import Capability for loads in their control area. This is equal to the CAISO Maximum Imports minus Existing Transmission Contracts (ETCs) outside their control area.40 For resources outside of the California ISO, the publicly available Transmission Expansion Policy Planning Committee (TEPPC) data should be utilized, specifically the 2022 Common Case generation table.41 An alternative assumption is the historical expected imports as calculated by the Energy Commission.42
39 See Resource Adequacy Compliance Materials at http://www.cpuc.ca.gov/PUC/energy/Procurement/RA/ra_compliance_materials.htm40 http://www.caiso.com/Documents/2013Assigned_UnassignedRAImportCapability_BranchGroups-AfterStep6.pdf41 For resources outside of the California ISO, the Transmission Expansion Policy Planning Committee (TEPPC) data should be utilized, specifically the 2022 Common Case generation table. See Data/Surveys” at http://www.wecc.biz/committees/BOD/TEPPC/External/Forms/external.aspx.42 As described in Appendix D, http://www.energy.ca.gov/2012publications/CEC-200-2012-003/CEC-200-2012-003.pdf
- 27 -

R.12-03-014 ALJ/DMG/sbf
5. Resource AdditionsResource additions are treated in the analysis as existing generation. 43 Known Additions are resources that meet the following criteria: (1) have a contract in place, (2) have been permitted, and (3) have construction under way. Criteria for Planned Additions are resources that have a contract, but have not yet begun construction, or are indicated by other entities such as municipalities as expected to come online. Additional renewable portfolio standard resources will be accounted for in their own category. Both Known Additions and Planned Additions shall be used in all scenarios. Assumptions for renewable resource additions are addressed in their own section.
6. DeliverabilityResources can be modeled as Energy-only or Deliverable. In order to better allow for analysis of options for providing additional generic capacity, any additional resources, including renewable resources, will only be assumed Deliverable if they meet one of two criteria:
(1) Fits on the existing transmission and distribution system,44 including minor upgrades,45 or new transmission approved by both California ISO and CPUC, or(2) Baseload or flexible resources.46
43 In developing this list, the primary data source is the power plant list maintained by Energy Commission here: http://www.energy.ca.gov/sitingcases/alphabetical.html44 For this purpose, “fits” refers to the simple transmission assumptions listed on tab g – TxInputs of the 33% RPS Calculator. Staff shall collaborate with the California ISO to update the assumptions and to apply these assumptions to the resource portfolios. 45 Minor upgrades do not require a new right of way; other factors such as cost are not considered.46 Flexibility currently does not have a standard definition, but a definition will be established either in this proceeding or in the Resource Adequacy
- 28 -

R.12-03-014 ALJ/DMG/sbf
New resources not meeting these criteria would be modeled as Energy Only. This assumption is only for study and planning purposes and does not prejudge any future CPUC decisions on transmission or resource approvals.
7. Event-Based Demand ResponseEvent-based demand response shall be accounted for as a supply-side resource. The most recent Load Impact reports filed with the Commission serve as the mid scenario.47 These values are increased by 10% for the high assumption, and decreased by 10% for the low assumption. The impact of PG&E’s pending Peak Time Rebate (PTR) program carries some uncertainty since the Commission has not made a final decision on whether to order PG&E to implement this program. The low and mid assumption assume that the PTR program will not be implemented while the high assumption assumes implementation.
a. Locational ImpactsAppendix B - Assessing Impacts of Demand Response on Local Capacity Requirements, provides a methodology for assigning demand response to specific busbars for use in power flow and other modeling needs that require greater granularity.
proceedings (the current proceeding is R.11-10-023). Generally speaking, baseload resources are those that provide a constant power output, such as a nuclear plant while flexible resources are those that can respond to dispatch instructions. There is some overlap between these two categories, for example a baseload design combined cycle plant could provide some flexibility.47 The most current Load Impact Reports are from June 1, 2012.
- 29 -
R.12-03-014 ALJ/DMG/sbf
8. Incremental Self-Generation, Supply-Side
a. Incremental Combined Heat and Power (Exporting)
Resources identified in this section are exporting electricity to the grid. Resources providing on-site energy are discussed under Load Forecast and Demand Side Assumptions. All assumptions here are identical to those presented under Load Forecast and Demand Side Assumptions for Incremental Combined Heat and Power.
9. Renewable Resource AssumptionsGiven this impasse, the only option is to return to using the 33% RPS Calculator and use simple, public data to develop a portfolio of resources to use for these planning studies. The resources that are assumed as very likely in the studies are referred to as the “Discounted Core.” The yes/no test to be included in the Discounted Core are that a project has met two milestones: (1) an executed Power Purchase Agreement, and (2) a complete (i.e. data adequate) application for a major environmental permit. This is the same test as used for the renewable resource portfolios in the 2010 LTPP, but reflects a change from the 2012-13 TPP RPS portfolios.48
For planning purposes, existing RPS generation in California with contracts expiring before the expected retirement age is assumed to remain in service until the retirement age.49 This supply will not count 48 For more information about the 33% RPS Calculator and past RPS portfolios, see: http://www.cpuc.ca.gov/PUC/energy/Procurement/LTPP/LTPP2010/2010+LTPP+Tools+and+Spreadsheets.htm and http://www.cpuc.ca.gov/PUC/energy/Procurement/LTPP/2012+LTPP+Tools+and+Spreadsheets.htm49 For the Renewable Net Short used in the 33% RPS Calculator, expiring contracts with out of state resources are assumed not to be renewed for purposes of meeting California’s RPS.
- 30 -

R.12-03-014 ALJ/DMG/sbf
towards any specific LSE, but will be included in the calculation of the expected renewable supply and will count toward filling the Renewable Net Short.
Staff has developed and published portfolios using the 33% RPS Calculator. Two versions of the 33% RPS Calculator are published, one that is used for most scenarios and another that is used to model scenarios with higher expected amounts of distributed photovoltaic generation. Each portfolio uses Discounted Core 1, as described above. All portfolios use the “Commercial Interest” score weighting which is 70% weight on the Commercial Interest score and 10% weight on each of the Environmental, Permitting, and Cost scores. The portfolio developed for each scenario uses a Renewable Net Short calculation based on the assumptions specified in the scenario. While the 33% RPS Calculator is by default calibrated to 2022, the Scenario Tool maintains an approximation of the 33% RPS throughout the planning horizon. To develop this approximation, the 33% RPS Calculator is run with a Renewable Net Short for 2030. The difference in the amount of NQC from the RPS portfolio in 2022 and 2030 is converted to a linear growth rate. The NQC from renewables is assumed to change by this fixed amount each year after 2022 until the end of the planning horizon.
Scenario(s) / Sensitivity Version of 33% RPS Calculator Renewable Net Short in 2022 (GWh/yr)
Base,
Early Songs Retirement
Regular 32,795
Replicating TPP Regular 39,957
- 31 -

R.12-03-014 ALJ/DMG/sbf
High DG + High DSM High DG 26,262
a. 20 Year Forward StudiesFor purposes of the 20 year forward analysis, the following assumptions will be used in establishing the renewable portfolios:
A 2030 Renewables Net Short is developed for the scenario, The 33% RPS Calculator is used to create a renewables portfolio
to meet that Renewables Net Short, Resources included in the 2030 portfolio but not in the 2022
portfolio are assumed to be added in equal increments each year (e.g. linear growth between 2022 and 2030),
This linear growth continues beyond 2030 to the end of the planning period.
10. Resource RetirementsParties are expected to provide current public information, particularly for retirement assumptions. Given the proposed expanded time horizon, and given recent uncertainties in the continuance of existing generation due to financial uncertainties, high, middle, and low retirement rate scenarios will be used. In order to provide some geographic consideration, resource retirements are largely based on vintage, but should be considered indicative, rather than expected, unless otherwise noted.Given broad differences between expected resource time frames, it is reasonable to have different “expected” retirement frameworks based on resource type. For example, many of the state’s hydroelectric facilities have been in place for decades, while a combined cycle power plant has an expected lifespan of approximately 40 years.
- 32 -

R.12-03-014 ALJ/DMG/sbf
More aggressive retirements can be considered a proxy to reflect retirements due to economic, rather than lifespan, considerations. Plant age will be taken from the California ISO Master Generating Capability List, Column O, with supplemental information taken as needed.50 For resources lacking a clear age, an alternative online date of 1/1/2000 will be utilized.
a. Hydroelectric ResourcesFor hydroelectric plants, the date of rewinding will reset the retirement timing. Staff will work with the IOUs and hydro owners to establish these dates. The low assumption will be repowering at the end of life, the mid assumption retirement at 70 years of age, and the high assumption retirement at 50 years of age.
b. Renewable ResourcesFor renewable resources, the low assumption is repowering at the end of life, the mid assumption is retirement at 25 years, and the high assumption is 20 years. There is no adjustment to production values associated with degradation of renewable resources due to age.51
c. Once Through Cooled (OTC) Power Plants
For non-nuclear resources subject to the Policy on the Use of Coastal and Estuarine Waters for Power Plant Cooling, two assumptions are available. Under the base assumption, OTC plants that do not already have firm plans for retirement or achieving Track 1 compliance are
50 http://www.caiso.com/Documents/GeneratingCapabilityList.xls51 There are some retirements due to different data sources between these assumptions and those used in the state-wide assessment of the RPS calculator. The RPS calculator assumes out of state resources with contracts ending by 2020 retire and that a few resources within the state retire.
- 33 -

R.12-03-014 ALJ/DMG/sbf
assumed retired based on the most recent information from the State Water Resources Control Board. Due to uncertainties with Track 2 compliance, any generators that have filed for Track 2 compliance will be assumed retired.Under the alternative retirement assumption, Track 2 compliance filings would be considered as firm, and those units that state intent to obtain compliance through Track 2 are assumed to remain in operation with their current characteristics unless otherwise noted. It is important to note that generators may need longer-term contracts to achieve Track 2 compliance. 52 Non-OTC units that are linked to OTC operation shall be grouped with OTC generation and fall under the same assumptions as their OTC units.
d. Nuclear Power PlantsFor the two large Investor Owned Utility owned nuclear power plants, three alternatives are proposed. Under the low retirement assumption, both San Onofre Nuclear Generating Station and Diablo Canyon are assumed to be online and remain in operation through the planning horizon. Under the mid retirement assumption, San Onofre Nuclear Generation Station is retired on January 1, 2015, and Diablo Canyon at its relicensing in 2024. Under a high retirement assumption, both plants would be retired effective January 1, 2015.
e. All Other ResourcesFor all other resources, assumptions about retirements not yet public are made purely based on facility age. The low value is no resource retirement, the mid value is retirement at 40 years unless indicated 52 D.12-04-046 (2010 LTPP), http://docs.cpuc.ca.gov/PUBLISHED/FINAL_DECISION/164799.htm
- 34 -

R.12-03-014 ALJ/DMG/sbf
for earlier retirement as noted in previous sections, and the high value is retirement at 25 years.
f. The Second Planning Period: Years 11-22The second planning period (2023-2034) will use simplified planning assumptions. Generally, these assumptions reflect extrapolation of the approaches of the first planning period.
Net load growth will be maintained as an average, annual compound growth rate from the prior period. The growth rate will be calculated based on net load (i.e. the forecast load, after demand side adjustments such as incremental EE, CHP, etc.), rather than extrapolating individual load or demand assumptions. The formula is:
Where Net Load is the gross load forecast minus: incremental energy efficiency, incremental small PV, and incremental demand side CHP. This annual growth rate is then applied to the 2022 Net Load to calculate the Net Load for 2023-2034.
Resource retirements will be calculated based on resource age or other characteristic, as described for the first planning period of each scenario.
Resource Additions (except renewables) will be calculated based on Known and Planned Additions for all scenarios.
Imports will be assumed to remain constant from the 2022 value through the second planning period.
- 35 -
1
201220221
2012
2022
NetLoadNetLoad
GrowthRate

R.12-03-014 ALJ/DMG/sbf
Event-based DR will be assumed to remain constant from the 2022 value through the second planning period.
RPS resource additions will be calculated using the 33% RPS Calculator based on an assumption of a continued 33% RPS target as follows. In order to calculate the Renewables Net Short for the second planning period, the growth rate in net load for the scenario is applied to the calculate a net load in 2030. For the purposes of the Scenario Tool, the incremental amount of RPS resources to reach the 2030 goal of 33% RPS is added in equal amounts each year from 2023 to 2030. Note that the planning area growth rate calculated in the Scenario Tool is applied to the statewide number in the Renewables Net Short calculation.
g. Price MethodologiesThe same methodologies as were used in the 2010 LTPP are to be used for the 2012 LTPP.
a. Natural GasThe Market Price Referent model should be used as the base for calculating natural gas prices with updated quote dates.
b. Greenhouse GasThe Market Price Referent model shall be used for calculating greenhouse gas prices with the same quote dates as used for natural gas prices. Price differentiation may occur, for example, specified imports shall be subtracted from production cost modeling and accounted for, then remaining imports would be assigned annual GHG values based on an implied market heat rate or other value.
- 36 -

R.12-03-014 ALJ/DMG/sbf
Appendix A - Assessing Impacts of Incremental Energy Efficiency Program Initiatives on Local Capacity Requirements
Mike Jaske, California Energy Commission53
53 Prepared November 4, 2011.
A-1

R.12-03-014 ALJ/DMG/sbf
I. PurposeThis paper documents the preparation of power flow modeling inputs for incremental energy efficiency program initiatives, and a preliminary assessment of the impacts of such initiatives on local capacity area (LCA) requirements. This work was undertaken jointly by the California Energy Commission (CEC) and the California Public Utilities Commission (CPUC), with the assistance of Navigant Consulting, to support the California Independent System Operator (California ISO) in ascertaining how such program impacts would reduce and/or modify LCA requirements.54
This work is an element of a broader assessment of the impact of demand side policy initiatives on local capacity requirements in the South Coast Air Basin as a critical input into assessing the need for offsets to support development of fossil power plants capacity being pursued by the Air Resources Board (ARB) with the support of the energy agencies (CEC, CPUC, and California ISO) in satisfaction of AB 1318 (V. Manuel Perez, Chapter 285, Statutes of 2009). A novel feature of the approach is allocation of the impacts of these prospective programs to specific transmission system busses on the basis of data from the distribution utilities about the mix of load on each bus by customer type. This approach contrasts with methods used previously, which simply reduces all load busses in a power flow
54 In order to accelerate the schedule for accomplishing this effort, ARB and the CEC entered into an inter-agency agreement (10-422/RMB800-10-002) provide funding to the CEC. This allowed a work authorization through a technical support contract with Aspen Environmental Group (400-07-032) to utilize Navigant Consulting’s power flow modeling expertise. The capabilities of Dave Larsen and his team at Navigant are acknowledged.
A-2
R.12-03-014 ALJ/DMG/sbf
base case uniformly across an entire Participating Transmission Owner / Investor Owned Utility (PTO/IOU) area.
II. Modeling Inputs Required by the ISOThe California ISO desired summer peak load adjustments by load bus for the PTO transmission systems for modeling by the California ISO and PTOs in LCA requirements assessments and other transmission studies. These studies are within the overall umbrella of the California ISO’s Transmission Planning Process (TPP). While the California ISO investigates transmission system impacts at various stereotypical types of system conditions, the focus for LCA requirements is 1-in-10 summer peak conditions. The California ISO provided a spreadsheet listing of load busses as modeled in the 2010/11 TPP cycle of assessments, and these listings were used in discussions with PTOs/IOUs. Since the ISO’s focus was on year 2021 that was the target year for incremental energy efficiency efforts.
III. Critical Information Needed from CPUC-Jurisdictional UtilitiesSince the project team included persons familiar with the CEC’s effort to develop incremental energy efficiency policy initiative energy and peak load reduction impacts for use by the CPUC in its 2010 Long-Term Procurement Plan (2010 LTPP) rulemaking, it was understood that the hypothetical programs assessed by the CEC were skewed toward residential and commercial customers and away from industrial and agricultural customers. A priori, it was believed that such programs would have non-uniform impacts on various load busses. The question was more the extent of these differences as opposed to their existence at all.
A-3
R.12-03-014 ALJ/DMG/sbf
In March 2011, CPUC and CEC staff developed a draft data request to collect data about loads and customer mix by bus for each PTO/IOU. This data request was initially issued to Southern California Edison (SCE), and later to San Diego Gas & Electric (SDG&E) and Pacific Gas & Electric (PG&E). The essence of the data request was to obtain, for each load bus, actual historic loads at summer peak conditions and the distribution of these loads by customer class, e.g. residential, commercial, industrial, agricultural and other.Discussions with SCE revealed two things:
1. The California ISO/SCE transmission modeling conventions for the SCE transmission system controlled by the California ISO were unknown to the SCE organizational units with access to individual customer usage data; and
2. No information was readily available about the composition of load by customer class at summer peak conditions.
A series of conference calls by CPUC and CEC staff with SCE pursued these concerns over the spring and summer months of 2011. Parallel discussions with SDG&E and PG&E revealed the same concerns to greater or lesser degree depending upon circumstances unique to each utility.
A. Rolled Up ModelingFor SCE and SDG&E, the convention apparently adopted by the PTO and California ISO is to aggregate load busses that are radial to the bulk power system, since transmission power flow assessments would be insensitive to the actual configuration of the transmission, sub-transmission and distribution system as long as the entire subsystem is radial to the bulk transmission system. This can result in load busses representing hundreds of megawatts of aggregate load even
A-4

R.12-03-014 ALJ/DMG/sbf
though actual substation busses carry smaller loads. Therefore one question is:
How did SCE/California ISO roll up hundreds of busses into the smaller set used for power flow modeling?
In total SCE/California ISO represents the SCE system with about 140 load busses. SDG&E/California ISO represent the SDG&E system with about 120 load busses. In contrast, PG&E and the California ISO have agreed to model the PG&E system much more like the actual physical system. The PG&E system is represented by about 1,400 load bus/circuit combinations with the load per bus rarely exceeding 10 MW.
B. Customer Class Estimates of Peak LoadFor all three IOUs, despite the deployment of interval metering systems to end-use customers, there is insufficient coverage of end-users to know the composition of load by customer class at system peak conditions for each bus. Each utility provided proportions of energy by customer class, developed by processing master file billing information on usage by customer. These energy proportions were applied to the measured bus loads to develop estimates of bus load by customer class.55
55 As interval metering systems are more fully deployed, it is expected that IOUs will be able to provide actual measured load by customer class for each bus at time of system peak, at time of peak load on each bus, or at other times relevant to specific studies.
A-5
R.12-03-014 ALJ/DMG/sbf
IV. Achieving Correspondence between IOU Load Bus Data and California ISO Power Flow Base Case Modeling Conventions
Once the PTO/IOUs had submitted load bus information to the CPUC and this was, in turn, forwarded to the CEC56, the load bus listings were compared to current power flow base cases used in the 2011/12 TPP posted to the California ISO’s secure website. Navigant Consulting was asked to compare the respective bus listings, identify discrepancies and offer suggestions for resolving discrepancies. In its review, Navigant found several kinds of discrepancies:
1. Some changes were discovered between the load bus listing provided by the California ISO in March 2011 based on the 2010/11 TPP cycle of studies compared to the 2011/12 TPP power flow base cases.
2. The power flow base cases sometimes include new load busses that do not exist today. This allows for load growth from the current system to the system planned for in 2021. Clearly there will be no historic information for a future load bus.
3. At least one instance was discovered for which some of the subsidiary load busses for an aggregate load bus are shifted to a different aggregated load bus by 2021. This shift is sufficiently pronounced that future loads on this aggregated load bus are lower in year 2021 than historic loads in 2009.
Navigant’s review and discussion with CEC staff led to a discrete set of adjustments.
56 The CEC and CPUC have existing inter-agency agreements governing treatment of confidential information.
A-6
R.12-03-014 ALJ/DMG/sbf
1. Incremental Energy Efficiency ImpactsAs part of the 2009 Integrated Energy Policy Report (IEPR) proceeding, CEC staff developed projections of the incremental impacts of energy efficiency initiatives that are not included within the 2009 IEPR adopted demand forecast. As noted above, the objective of this present effort is to allocate these earlier projected service area impacts to specific load busses to allow power flow modeling. Although the immediate need is for load reductions in year 2021, the assessment was prepared for each year 2013 to 2021, should the intermediate values be of interest in other studies.
B. 2009 IEPR-Cycle Incremental Energy Efficiency ImpactsAs an element of the 2009 IEPR proceeding, the CEC staff developed incremental energy efficiency impacts based upon the specific strategies that the CPUC had assessed as part of its 2008 Energy Efficiency Strategic Plan and in setting its goals for the three IOUs.57 The strategies making up the scenarios involved various hypothetical energy efficiency programs, some extensions of existing efforts and some that were new. The focus of these programs was on residential and commercial building customer classes, not industrial or agricultural. The CEC published its final estimates, along with recommendations for use in CPUC proceedings, in May 2010. The CPUC in the 2010 LTPP proceeding chose a specific scenario, with adjustments, that IOUs were required to use in the developing future resource plans for the common scenarios.58
57 CPUC D.08-07-047 requires that each IOU use 100 percent of the electricity goals in their procurement planning activities.58 CPUC R.10-05-006, ALJ’s Ruling Modifying System Track 1 Schedule and Setting Pre-Hearing Conference, Attachment 1: Standardized Assumptions for System Resource Plans, p. 46 of 49, 2/10/2011.
A-7
R.12-03-014 ALJ/DMG/sbf
For this effort, the CEC used the adjusted values for years 2013-2020 that were included by the CPUC in the Administrative Law Judge Ruling attachments of February 2011. These are savings, described in both annual energy and peak load reductions, for each IOU service area for each of the residential, commercial and industrial customer classes. For summer peak demand power flow modeling purposes, especially as the basis for 1-in-10 LCA requirements assessments, peak demand load reductions are the focus of interest. Annual energy savings are not utilized.Table 1 provides the 2020 values used for year 2021 as the IOU service area starting point for allocation to load busses. 2021 is the year of interest for California ISO power flow modeling, but 2020 was the final year of the assessment prepared by the CEC and adjusted by the CPUC, so values in year 2021 were assumed to be identical to values in year 2020.
A-8

R.12-03-014 ALJ/DMG/sbf
Table 1: Year 2021 Peak load Impacts of Incremental Energy Efficiency (MW)
2021 Peak Load Impacts (MW)
SectorPG&
ESCE
SDG&E
Residential 1512
1560 310
Commercial 540 733 168Industrial 223 168 17
Total 2275246
1 496@ customer meter w/o T&D losses.
V. Translating Service Area Impacts to Load Bus Impacts To translate service area peak load reductions by customer class shown in Table 1 to individual load bus reductions, the following steps were implemented:
1. Extract annual peak load results for each customer class from the CEC Incremental Uncommitted Energy Efficiency report59 for all years 2013 to 2020. Adjust each customer class’ incremental impacts in the same manner as adjusted by CPUC in the December 2010 LTPP Scoping Memo, assigning any adjustments not classified by customer class to a customer class in the same
59 CEC-200-2009-001-CTF, May 2010
A-9

R.12-03-014 ALJ/DMG/sbf
proportions as original load reductions for the three customer classes.
2. Obtain results of CPUC data request to each IOU (circa spring 2011) that identifies summer peak load by busbar and multiply total busbar peak load by customer sector proportions to get absolute value of load at peak for each customer sector. For each customer class, tabulate results of step 2 to determine the proportion that each busbar is of total IOU service area end-user demand for each customer sector, e.g. the results for each busbar is the value for each of the three customer sectors that is its share of IOU service area load at peak for that customer sector.
3. For each year 2013 to 2020, multiply the IOU service area peak load savings for each customer sector from step 1 by the customer sector proportion of each busbar from step 3, e.g. a matrix for each busbar that is N busbars by three customer sectors.
4. Add up the three customer sector values at each busbar of step 4 to compute the total program impacts at each busbar. Extend the same values from year 2020 to be savings for year 2021.
5. Verify that the sum of impacts across all busbars matches the service area starting peak load impacts of Step 1.
6. Save busbar program impacts in separate spreadsheet for forwarding to the California ISO to avoid sending any information considered by the IOUs to be confidential.
A-10

R.12-03-014 ALJ/DMG/sbf
This process was followed for each of the three PTO/IOU service areas, resulting in three spreadsheets that were forwarded to the California ISO for use in modifying power flow base cases.
VI. Preliminary Assessment of the Impacts of Incremental Energy Efficiency Load Reductions
In order to provide directly useable load impact reductions for use by the ISO in its assessment of LCA requirements under a moderate load scenario, Navigant
A-11
R.12-03-014 ALJ/DMG/sbf
Consulting modified existing power flow base cases for year 2021 using the incremental energy efficiency impacts described above, and ran these power flow base bases through various contingencies. This effort focused on the portions of the California ISO balancing authority that encompass SCE and SDG&E, since this effort focused on the portion of the balancing authority area with possible relevance to South Coast Air Basin offsets.60 As would be expected, load reductions in the range of many hundreds of megawatts in Western LA Basin and Eastern LA Basin had substantial impacts on the need for conventional capacity. Similarly, load reductions in the range of 500 MW in SDG&E service area have impacts on LCA requirements in San Diego. These are preliminary values to be replaced by assessments prepared by the California ISO as part of the 2011/12 TPP effort. However, Navigant Consulting did detect differences in power flow results when comparing cases with load impacts allocated to specific busses using customer class information compared to cases in which service area load reductions were distributed to all busses in proportion to the bus load forecast compared to the total load projection, e.g. the “peanut butter” method.
Appendix B - Assessing Impacts of Demand Response on Local Capacity RequirementsDonald Brooks, California Public Utilities Commission
60 In its 2010/2011 TPP assessments, the California ISO noted that there can be interactions between requirements in San Diego and resources in the LA Basin, and vice versa. Thus incremental energy efficiency impacts might be relevant to LCA requirements in the portion of the ISO Balancing Authority Area in the South Coast Air Basin.
A-12

R.12-03-014 ALJ/DMG/sbf
I. PurposeThis paper documents the preparation of inputs for Demand Response programs for use in assessing local capacity area (LCA) requirements in conjunction with efforts to assess incremental energy efficiency by California Energy Commission (CEC) and California Public Utilities Commission (CPUC) staff. To this end, CPUC staff created busbar level impacts for Demand Response resources in order to facilitate the inclusion of Demand Response in California Independent System Operator (California ISO) transmission studies. CPUC staff built upon the work done in relation to incremental energy efficiency impacts61, modifying the workbook created by CEC staff and detailed during the Demand Analysis Working Group meeting on April 10, 2012.62 CPUC staff split demand response program impacts to busbar, utilizing customer class definitions and data provided by the utilities and used in calculating energy efficiency impacts. However, assessing Demand Response impacts required other analytical steps.
II. Demand Response ImpactsDemand Response programs generally target more than one customer class. This means that load impacts need to be separated into customer class based on load data. Similar to incremental energy efficiency, long term forecasts include programs not currently in operation such as Advanced Metering Infrastructure enabled Demand Response. The CPUC’s load impact protocols have not yet been used
61 See Appendix A, Energy Division Straw Proposal in the 2012 LTPP.62 The Demand Analysis Working Group was formed by the Energy Commission to better improve energy forecasting in California. See http://www.demandanalysisworkinggroup.org
B-13

R.12-03-014 ALJ/DMG/sbf
for these types of programs and there is scant data on customer enrollment or customer impacts.
III. Critical Information Needed from CPUC-Jurisdictional Utilities
In order to split projected impacts from Demand Response programs into individual customer classes, CPUC staff sought data on enrollment or projections by customer class. This process was not uniform across utilities, or even across all programs within the same utility. For example, Pacific Gas & Electric (PG&E) filed a spreadsheet with the CPUC pursuant to the cost-effectiveness evaluations that gave enrollment percentages across rate classes for each program.63 The percentages only described current, not planned future, enrollment. Additionally, percentages were applied irregularly across all programs.64
In contrast to PG&E, data from Southern California Edison (SCE) and San Diego Gas & Electric (SDG&E) had to be requested entirely by CPUC staff. SDG&E was unable to provide data by customer class and instead provided information by customer size. SCE provided load impact filings with load impact by 2012 programs for customer classes. From a programmatic level, some assumptions had to be made regarding Advanced Metering Infrastructure -enabled Demand
63 PG&E LOLP spreadsheet from June 26, 2011, “rate schedule” tab. http://www.cpuc.ca.gov/PUC/energy/Demand+Response/Cost-Effectiveness.htmThis tab was not included in the workbooks the other two utilities submitted.64 In some cases there were more or less data, while in others it was provided in different formats.
B-14
R.12-03-014 ALJ/DMG/sbf
Response. CPUC staff assumed that the savings were accrued solely to residential customer classes. Better data regarding customer enrollment, load impact by customer class as well as by program, and more clarity as to how outreach is done for certain programs would enable a more robust analytical result.
IV. Translating Service Area Impacts to Load Bus Impacts To translate peak impacts of Demand Response programs, CPUC staff undertook the following steps:
1. Translate Demand Response programs into annual load impacts per customer class.
2. Calculate load impacts for all programs by each customer class.3. Extrapolate multiple-year forward forecasts of customer class
impacts, by program, based on their percentage breakdown by customer class.
4. Apply percentages derived from load data to apply load impacts, by customer class, to each busbar, by year.
This process was followed for each of the three Participating Transmission Owner / Investor Owned Utility (PTO/IOU) service areas, resulting in three spreadsheets that were forwarded to the California ISO for use in modifying power flow base cases.
B-15
R.12-03-014 ALJ/DMG/sbf
Appendix C – Assumption and Scenario Values
I. Base Scenario
C-1

R.12-03-014 ALJ/DMG/sbf
A. Early SONGS Retirement Sensitivity
C-2
R.12-03-014 ALJ/DMG/sbf
B. Stress Peak Sensitivity
C-3

R.12-03-014 ALJ/DMG/sbf
II. Replicating the TPP Scenario
C-4

R.12-03-014 ALJ/DMG/sbf
III. High Distributed Generation, High Demand Side Management Scenario
C-5

R.12-03-014 ALJ/DMG/sbf
A. High Distributed Generation, High Demand Side Management Scenario, 40% RPS by 2030 Sensitivity
C-6

IV. Other Assumptions Common To All Scenarios
Value Description1/1/2000 If Resource ID not found or
missing COD, use this value (mm/dd/yyyy)
2017 If no COD estimate for approved new facility, use this value (yyyy)
0.55 Inc small PV conversion factor for installed capacity to peak prod. MW (decimal)
0.19 Inc small PV capacity factor for installed capacity to annual energy GWh (decimal)
0.70 Inc D-CHP conversion factor for installed capacity to peak prod. MW (decimal)
0.70 Inc S-CHP conversion factor for installed capacity to peak prod. MW (decimal)
0.75 Inc D-CHP capacity factor for installed capacity to annual energy GWh (decimal)
0.75 Inc S-CHP capacity factor for installed capacity to annual energy GWh (decimal)

R.12-03-014 ALJ/DMG/sbf
V. RPS Calculator Summary
C-2

R.12-03-014 ALJ/DMG/sbf
(END OF ATTACHMENT A)
C-3