tephra from primary and rootless cones from the 1.9 ka
TRANSCRIPT
-
Tephra from Primary and Rootless Cones from the 1.9 ka Nesjahraun Eruption,
Þingvellir, SW Iceland: A Comparison
Sarah Tapscott
Faculty and Institute of Earth Science
University of Iceland
2018

Tephra from Primary and Rootless Cones from the 1.9 ka Nesjahraun Eruption,
Þingvellir, SW Iceland: A Comparison
Sarah Tapscott
60 ECTS thesis submitted in partial fulfilment of a Magister Scientiarum degree in Earth Science
MS Committee Þorvaldur Þórðarson
Maria Janebo
Master’s Examiner
Guðrún Larsen
Faculty and Institute of Earth Science School of Engineering and Natural Sciences
University of Iceland Reykjavik, December 2018
Tephra from Primary and Rootless Cones from the 1.9 ka Nesjahraun Eruption, Þingvellir,
SW Iceland: A Comparison
Primary and Rootless Cones: Nesjahraun, Iceland
60 ECTS thesis submitted in partial fulfilment of a Magister Scientiarum degree in Earth
Science
Copyright © 2018 Sarah Tapscott
All rights reserved
Faculty of Earth Science
School of Engineering and Natural Sciences
University of Iceland
Sturlugötu 7
101, Reykjavik
Iceland
Telephone: 525 4000
Bibliographic information:
Sarah Tapscott, 2018, Tephra from Primary and Rootless Cones from the 1.9 ka
Nesjahraun Eruption, Þingvellir, SW Iceland: A Comparison, Master’s thesis, Faculty of
Earth Science, University of Iceland, pp. 108.
Printing: Háskólaprent
Reykjavik, Iceland, 30 Jul 2018
iii
Abstract
The overall architecture of primary and rootless cones is similar in many respects and
therefore differentiation can be challenging. In this thesis, I compare microtextural
properties of primary and rootless cone tephra from the 1.9 ka Nesjahraun eruption to
investigate the physical properties that allow for robust distinctions between the two
volcanic constructs. Previous studies on the microtextural properties of rootless eruption
tephra are limited and therefore this type of a study is an ideal avenue to further the
knowledge on these multifaceted volcanic formations. The Nesjahraun eruption features
both tephra types and thus ideal for comparing the microtextural properties of their tephra
clasts. Results show that the primary vent tephra is characterised by narrow, low density
distributions. It features coalesced, oval to polygonal shaped vesicle population and an
order of magnitude higher vesicle number densities than the rootless cone tephra. These
characteristics are attributed to relatively rapid magma ascent during which the decoupling
of melt and bubbles resulted in vesicle coalescence. Conversely, the rootless cone tephra is
characterised by broad, high density distributions and exhibits a clast vesicularity that is
lower than the primary cone tephra by an approximate factor of two. Vesicles are oval to
spherical in shape and show minimal evidence of coalescence. The vesicle populations of
the rootless cone tephra suggest that the vesicles nucleated and grew during molten fuel-
coolant interactions, either due to temporary supersaturation of magmatic volatiles or
incorporation of external water into the molten magma.
Útdráttur
Upptakagígar og gervigígar hafa svipaða uppbyggingu og af þeim sökum getur of reynst
erfitt að greina þarna á milli. Í þessari ritgerð ber ég saman textúr upptaka- og
gervigígagjósku frá Nesjahraunsgosinu, sem var fyrir um 1900 árum síðan, til þess að
kanna hvaða einkenni gjóskunnar nýtist best til að greina á milli þessara tveggja
gígtegunda. Fyrri rannsóknir á textúr eiginleikum gervigígagjósku eru mjög afmarkaðar og
því er þessi rannsóknarvettvangur tilvalin til þess að bæta við þekkingu okkar á þessum
tveimur gjóskugerðum. Niðurstöðurnar sýna að gjóskukornin sem mynduðust við gos í
upptakagígunum hafa mjög þrönga eðlisþyngdardreifingu, innihalda blöðrur sem eru með
sporöskjulaga og kantaða lögun og háann blöðruþéttleika. Blöðrusamruni er algengur.
Þessi einkenni benda til þess að rishraði kvikunnar hafi verið mikill. Gjóskukornin frá
gervigígunum mynda breiða eðlisþyngdardreifingu sem gefur til kynna helmingi minna
blöðrumagn samanborið við gjóskukornin frá upptakagígunum. Hringlaga blöðrur eru
ráðandi og vitnisburður um samrunna blaðra fátíður. Gögnin benda til þess að blöðrurnar í
gervigígagjóskunni mynduðust í gervigígagosinu, annað hvort vegna útleysingar á
kvikugösum eða vegna innlimunar á utanaðkomandi vatni.

iv
v
Table of Contents
List of Figures .................................................................................................................... vii
List of Tables ........................................................................................................................ x
Abbreviations ...................................................................................................................... xi
Acknowledgements ........................................................................................................... xiv
1 Introduction ..................................................................................................................... 1
2 The Geology of Iceland ................................................................................................... 3 2.1 Spreading Ridge meets Mantle Plume .................................................................... 3 2.2 The Volcanic Systems of Iceland ............................................................................ 3 2.3 Eruptive Styles in Iceland........................................................................................ 5
2.3.1 Vesiculation ................................................................................................... 5 2.4 The Western Volcanic Zone .................................................................................... 6
3 Volcanic Rootless Cones ................................................................................................. 7 3.1 Formation Mechanisms of Rootless Cones ............................................................. 9
3.1.1 Explosive Fuel Coolant Interaction Theory ................................................... 9
3.1.2 Thermodynamic Theory............................................................................... 14
4 Nesjahraun .................................................................................................................... 17 4.1 Geological Setting ................................................................................................. 17 4.2 Lava Flow Morphology ......................................................................................... 19
5 Methodology .................................................................................................................. 21 5.1 Study Area ............................................................................................................. 21 5.2 Field Sampling ...................................................................................................... 21 5.3 Density and Bulk Vesicularity Measurements ...................................................... 22
5.4 Vesicularity Measurements ................................................................................... 23 5.4.1 Thin Sections and Observations................................................................... 23 5.4.2 Image Strategy and Acquisition ................................................................... 24
5.4.3 Image Rectification ...................................................................................... 24 5.4.4 ImageJ and Data Processing ........................................................................ 26
6 Results ............................................................................................................................ 29 6.1 Bulk Density .......................................................................................................... 29
6.1.1 Primary Fissure Vent Tephra ....................................................................... 29 6.1.2 Rootless Cone Tephra .................................................................................. 29 6.1.3 Componentry................................................................................................ 30
6.2 Clast Vesicularity .................................................................................................. 33 6.2.1 Primary Cone Tephra ................................................................................... 33
6.2.2 Rootless Cone Samples ................................................................................ 41 6.2.3 Comparison of Primary Cone and Rootless Cone Tephra ........................... 49
vi
7 Discussion ...................................................................................................................... 53 7.1 Data Quality .......................................................................................................... 53
7.1.1 Bulk Density Distributions .......................................................................... 53 7.1.2 Image Coverage ........................................................................................... 53
7.1.3 Lower Cut-off Limits ................................................................................... 56 7.1.4 Decoalesced Versus Non-decoalesced Datasets .......................................... 56 7.1.5 Crystallinity ................................................................................................. 58
7.2 Comparison of Primary and Rootless Cone Tephra .............................................. 60 7.2.1 Timing Relationships of the Primary cone and Rootless Eruptions ............ 60
7.2.2 Clast Density Distributions .......................................................................... 61 7.2.3 Clast Morphology ........................................................................................ 63 7.2.4 Textural Analysis ......................................................................................... 64 7.2.5 Vesicle Number and Volume Distributions ................................................. 66
8 Summary and Conclusions .......................................................................................... 75
References .......................................................................................................................... 77
Appendix A ........................................................................................................................ 85
Appendix B......................................................................................................................... 89
Appendix C ........................................................................................................................ 97
vii
List of Figures
Figure 2.1 Active volcanic systems, volcanic zones and belts in Iceland ............................. 4
Figure 3.1 Lava flow types and the resulting rootless cone archetypes ................................ 9
Figure 3.2 Conceptual model of rootless cone facies ............................................................ 8
Figure 3.3 Water jet penetration fragmentation................................................................... 12
Figure 3.4 Thermal detonation ............................................................................................ 12
Figure 4.1 Geological map of the WVZ .............................................................................. 18
Figure 4.2 Shaded relief map showing the lithofacies of Nesjahraun ................................. 20
Figure 5.1 Location of the study site ................................................................................... 21
Figure 5.2 Schematic outline of the nested image structure used in this study ................... 25
Figure 5.3 Schematic of the image rectification process ..................................................... 27
Figure 6.1 Clast density distributions samples: NV141016-01a and NV141016-01b ........ 30
Figure 6.2 Clast density distributions samples: NC141016-01 and NC141016-02a ........... 31
Figure 6.3 End-member clast types identified in this study ............................................... 32
Figure 6.4 Relative proportions of each end-member component ...................................... 33
Figure 6.5 Clast vesicularity at range of magnifications, primary cone tephra sample
NV141016-01b-91 ............................................................................................ 35
Figure 6.6 Clast vesicularity at range of magnifications, primary cone tephra sample
NV141016-01b-89 ............................................................................................ 36
Figure 6.7 Example of original and decoalesced vesicle size distribution, primary
cone tephra ........................................................................................................ 38
Figure 6.8 Vesicle volume distribution of original and decoalesced vesicle size
distribution, primary cone tephra ...................................................................... 39
Figure 6.9 Cumulative volume percent of original and decoalesced datasets from
clasts NV141016-01b-89 and NV141016-01b-91. ........................................... 39
Figure 6.10 Clast vesicularity at range of magnifications, rootless cone tephra sample
NC141016-02b-07. ........................................................................................... 42
viii
Figure 6.11 Clast vesicularity at range of magnifications, rootless cone tephra sample
NC141016-02b-93. ........................................................................................... 43
Figure 6.12 Example of original and decoalesced vesicle size distribution, rootless
cone tephra. ...................................................................................................... 45
Figure 6.13 Vesicle volume distribution of original and decoalesced datasets of clast
NC141016-02b-07 and NC141016-02b-93 ...................................................... 47
Figure 6.14 Cumulative volume percent of original and decoalesced datasets from
NC141016-02b-07 and NC141016-02b-93. ..................................................... 47
Figure 6.15 Primary and rootless cone modal density clasts at different magnification .... 48
Figure 6.16 Clast NV141016-01b-07 in cross-polarised light ............................................ 50
Figure 6.17 Armoured clast NV141016-01b-42 ................................................................. 51
Figure 6.18 Microphotographs showing the sites of chemical analyses by Scanning
Electron Microscope in clast NC141016-02b-86 ............................................. 52
Figure 7.1 Bulk density distribution histogram of the 100 clasts collected for
NV41016-01b with gaps in the data indicated by red brackets. ....................... 54
Figure 7.2 Thin section of NV141016-01b-91 indicating the image sampling
locations ............................................................................................................ 55
Figure 7.3 NVM as a function of minimum vesicle diameter ............................................... 56
Figure 7.4 Cumulative vesicle volume distributions of original and decoalesced
datasets of the primary cone clasts ................................................................... 57
Figure 7.5 Cumulative vesicle volume distributions of original and decoalesced
datasets of the rootless cone clasts ................................................................... 57
Figure 7.6 Timing of events in the 1.9 ka Nesjahraun eruption .......................................... 60
Figure 7.7 Comparison, clast density distributions of primary cone tephra from the
1969 Mauna Ulu and 1.9 ka Nesjahraun eruptions .......................................... 62
Figure 7.8 Comparison, clast density distributions of the rootless cone tephra from
5.7 ka Rauðhólar and 1.9 ka Nesjahraun rootless eruptions ............................ 63
Figure 7.9 Lacustrine sediment within 5.7 ka Rauðhólar and 1.9 ka Nesjahraun
rootless cone clasts ........................................................................................... 67
Figure 7.10 Vesicle volume distribution of primary and rootless cone tephra ................... 68
Figure 7.11 Cumulative vesicle volume distribution of primary and rootless cone
tephra ................................................................................................................ 68

ix
Figure 7.12 Cumulative vesicle number per unit volume plotted against vesicle size
for the decoalesced image of clast NV141016-01b-89..................................... 70
Figure 7.13 Cumulative vesicle number per unit volume plotted against vesicle size
for the decoalesced image of clast NV141016-01b-91..................................... 71
Figure 7.14 Cumulative vesicle number per unit volume plotted against vesicle size
for the decoalesced image of clast NC141016-02b-07 ..................................... 71
Figure 7.15 Cumulative vesicle number per unit volume plotted against vesicle size
for the decoalesced image of clast NC141016-02b-93 ..................................... 72
Figure 7.16 NVM from eruptions of various style and composition. .................................... 73
x
List of Tables
Table 3.1 Clast morphologies formed during iron-aluminium molten fuel-coolant
interaction experiments .................................................................................... 14
Table 5.1 Coordinates of sample locations. ........................................................................ 22
Table 6.1 Vesicle number and volume values for original and decoalesced datasets
from the primary cone tephra. .......................................................................... 40
Table 6.2 Vesicle number and volume values for the original and decoalesced
datasets from the rootless cone tephra. ............................................................. 46
Table 6.3 Summary of the main differences noted between the PC and RC tephra. .......... 49
Table 6.4 Results of chemical analysis of the armoured clast NC141016-02b-86. ............ 51
Table 7.1 Lower cut-off levels for vesicle size analyses. .................................................... 56
Table 7.2 NVM and NA compared with different crystal content ......................................... 59

xi
Abbreviations
µm: micrometre
Al: aluminium
atm: atmosphere
BP: before present
BSE: backscattered electron
CE: current era
cm: centimetre
CVVD: cumulative vesicle volume distribution
DC: decoalesced
dpi: dots per inch
DRE: dense rock equivalent
EVZ: East Volcanic Zone
ESP: eruption source parameters
Fe: iron
g: gram
GIMP: GNU Image Manipulation Program
H2O: water
IBP: Iceland Basalt Plateau
ka: kilo annum
kg: kilogram
km: kilometre
kV: kilovolt
m: mass
m: metre
xii
MFCI: molten fuel-coolant interactions
MIB: Mid-Iceland Belt
ml: millilitre
mm: millimetre
MPa: megapascal
N: north
NA: number of vesicles per unit area (cm-2
)
NE: north-east
nf: number of wax squares used on the clast
NV: number of vesicles per unit volume (cm-3
)
NVM: number of vesicles per unit volume, referenced to melt (cm-3
)
NVZ: North Volcanic Zone
ºC: degrees Celsius
ÖVB: Öræfajökull Volcanic Belt
PC: primary cone
PV: primary vent
pxl: pixel
RC: rootless cone
RVZ: Reykjanes Volcanic Zone
s: second
SEM: scanning electron microscope
SGc: specific gravity of the clast
SVB: Snæfellsnes Volcanic Belt
SW: south-west
TFZ: Tjörnes Fracture Zone
Ti: titanium
V: vesicularity (%)
xiii
v: volume
VND: vesicle number distribution
vol.: volume
VVD: vesicle volume distribution
wa: weight of the clast in air (g)
wb: weight of the ballast (g)
wf: weight of the wax (g)
wt: weight
WVZ: West Volcanic Zone
ww: weight of the clast in water (g)
yr: year
ρ: density
ρc: density of the clast (g cm-3
)
ρw: density of water (g cm-3
)
xiv
Acknowledgements
I’d like to take this opportunity to express my gratitude to the people who have been
instrumental in the successful completion of this project.
Firstly, I’d like to thank my two supervisors, Thor and Maria.
Thor – thank you for your overarching knowledge and enthusiasm! Your commitment to
helping me achieve the best work I could did not go unnoticed. I will be forever grateful to
you for allowing me to work on a project that encompassed so many different aspects of
volcanism that I have found interesting for years.
Maria – you saved the day… more than once! Not only did your passion for bubbles rub
off on me a little, it certainly kept me motivated. Thank you for your encouragement and
reassurance, it was such a pleasure to have you co-supervise this project.
Thank you to Guðrún for offering time out of your busy schedule to read through my thesis
and provide constructive feedback. Your comments for potential future research options
already have me excited!
Thank you to my fellow comrades and colleagues from The University of Iceland for both
your support and words of wisdom. To Alma, Ármann, Bryndís, Ingibjörg, Jónas, Kate,
Louis, Mark, Morgan and Will for helping with laboratory and fieldwork requirements and
the members of EldarAlda, Flóki & Folda (in particular, the Bandy/Frisbee crew) and the
staff basketball group for keeping me sane, active and distracted from the many hours of
work ahead of me colouring in bubbles. To Ash and Cat, for helping with edits in my final
days of writing- especially Ash, who pulled an all-nighter with me and dealt with multiple
thesis melt-downs during the first week of her holiday. Zack, for the ‘song of the day’
tradition that got me through the final months of writing. To my friends at The Cave
(Víðgelmir); again, for your support, and for also forcing me to work on this thesis during
those summer months while you were all having a whisky… or two.
To Bruce, Erin and Frances for their helpful and interesting discussions during the IAVCEI
Conference.
To my friends, both here in Iceland and from the land down under.
And lastly, but certainly not least – to my family. Thank you for your unconditional
support, even when I told you I was moving to the other side of the world to live in a land
of snow storms and exploding mountains (though I feel like you should be thanking me for
providing you with such an amazing holiday location). Now onto the next adventure!
1
1 Introduction
Basaltic eruptions are known to form both primary or rooted and secondary or rootless
cones. In recent events where both rooted and rootless cones are formed, the relative
positions and distinct geometry of the cone clusters make it relatively easy to distinguish
between these cone types. Primary cones form rows on linear vents or single cones on
circular vents, while rootless cones tend to be present as clusters with apparently random
distributions (Lanagan et al., 2001; Fagents and Thordarson, 2007; Fagents et al., 2003;
Bruno et al., 2004, 2006, Hamilton et al., 2010a, b). However, in certain circumstances,
differentiation can prove difficult as the overall architecture of primary and rootless cones
is similar in many respects. This is usually the case if the cones occur as stand-alone
constructs, if their exposure is in part obscured by later formations, or if stratigraphical
exposure into the cones is limited to a two-dimensional view, as is the case in most
outcrops. In fact, rootless cones have previously been mistaken for primary cones,
resulting in inaccurate depictions of vent system distributions within Basaltic Provinces
such as Iceland and the Columbia River Basalt Province (Thordarson and Self, 1998;
Thordarson et al., 1998; Reynolds et al., 2015).
Rootless cones and their deposits are relatively well studied, where the focus has been on
the overall geometry of rootless cone groups (Lanagan et al., 2001; Bruno et al., 2004;
Hamilton et al., 2010a, b; Noguchi et al., 2016), nature of the cone succession and its
implication for eruption processes (Hamilton et al., 2010a, b, c, 2017; Reynolds et al.,
2015) and physical properties of the ash as it is considered one of the main thermodynamic
drivers behind the explosive mechanisms of molten fuel coolant interactions (Fitch et al.,
2017). However, the microtextural properties of the lapilli fractions, such as vesicle
abundance, shapes and size distribution, have not been examined with desired rigour. By
the same token, these properties of the rootless clasts have not been adequately compared
to the lapilli fractions of primary cone tephra.
Comparison between the tephra that make up rootless cones versus the associated primary
or “rooted” cones is required to identify the physical properties that allow for robust
distinction between these geometrically similar volcanic formations. Such identification
will assist in developing a straightforward classification of rootless cone tephra in
comparison to primary tephra. The 1.9 ka Nesjahraun eruption in the Western Volcanic
Zone in Iceland is known to have produced primary and rootless cones (Sæmundsson,
1992; Stevenson et al., 2011, 2012), and therefore provides a suitable site for preliminary
comparative studies on this topic. In this study, I present a comparative analysis of the
density and vesicle size distributions of primary versus rootless cone tephra formed by the
Holocene Nesjahraun fissure eruption. This is achieved by comprehensive analysis of the
microtextural properties of primary and rootless cone lapilli with special focus on the
mechanisms of vesiculation. Furthermore, this data set is used to underpin a robust
identification scheme for rootless cone deposits.

3
2 The Geology of Iceland
Iceland is a unique geological setting as it features almost all volcano types and eruption
styles known on Earth (Thordarson and Larsen, 2007; Bjarnason, 2008). Approximately
91% of the total post glacial magma output is mafic magmatism (Thordarson and
Hoskuldsson, 2008), with effusive basaltic eruptions typifying the volcanism in Iceland. In
addition, mafic magmatism in Iceland is renowned for large, explosive subglacial
phreatomagmatic eruptions. Felsic eruptions are also more common in Iceland, compared
to similar geological settings, and are characterised by explosions of sub-Plinian and
Plinian intensities (Thordarson and Larsen, 2007).
2.1 Spreading Ridge meets Mantle Plume
The high magma output of Iceland and its presence above sea-level is due to the interaction
of the spreading Mid Atlantic Ridge with a mantle plume (e.g Thordarson and Larsen,
2007). Studies clearly show a mantle plume source in the upper mantle with a depth of at
least 450 km, noted as a seismic low velocity anomaly (e.g Bjarnason, 2008). Its current
centre is estimated to be in the mantle beneath 64º40’N and 18º10’W. This coincides with
the area of peak volcanic activity in Iceland and the most elevated part of the Icelandic
plateau, between Vatnajökull and Tungnafellsjökull (Fig. 2.1). Activity of the mantle
plume can be traced for the last 65 million years as it formed the ~2000 km long North
Atlantic Igneous Province, of which the Iceland Basalt Plateau (IBP) is the only part that
remains active. The IBP rises over 3000 m above the surrounding sea floor and has a
crustal thickness of 10–40 km. It covers an area of approximately 350,000 km², about 30%
of which is situated above sea level (Sinton et al., 2005; Thordarson and Larsen, 2007;
Bjarnason, 2008; Thordarson and Hoskuldsson, 2008).
2.2 The Volcanic Systems of Iceland
Discrete 15–50 km wide belts of active faulting and volcanism, known as neovolcanic
zones, cover approximately 30,000 km³ of Iceland. The zones are defined as the Reykjanes
Volcanic Zone (RVZ), the West Volcanic Zone (WVZ), the North Volcanic Zone (NVZ),
the East Volcanic Zone (EVZ), the Mid-Iceland Belt (MIB), the Tjörnes Fracture Zone
(TFZ), the Öræfajökull Volcanic Belt (ÖVB), and the Snæafellsnes Volcanic Belt (SVB)
(Fig. 2.1), and are outlined in detail by Thordarson and Hoskuldsson (2008).
The neovolcanic zones of Iceland can be further divided into volcanic systems, which are
viewed as the principal geological structures in Iceland. The volcanic systems are
volcanotectonic constructions that feature fissure swarms and/ or a central volcano with an
average duration of 0.5–1.5 million years. Generally, individual systems can range in size
between ~25 and 2500 km² and be 7–200 km long. There are ~30 active volcanic systems
in Iceland, of which 20 feature fissure swarms. Fissure swarms are defined as distinct
narrow and elongate structures 5–20 km wide and 50–200 km long that are usually aligned
4
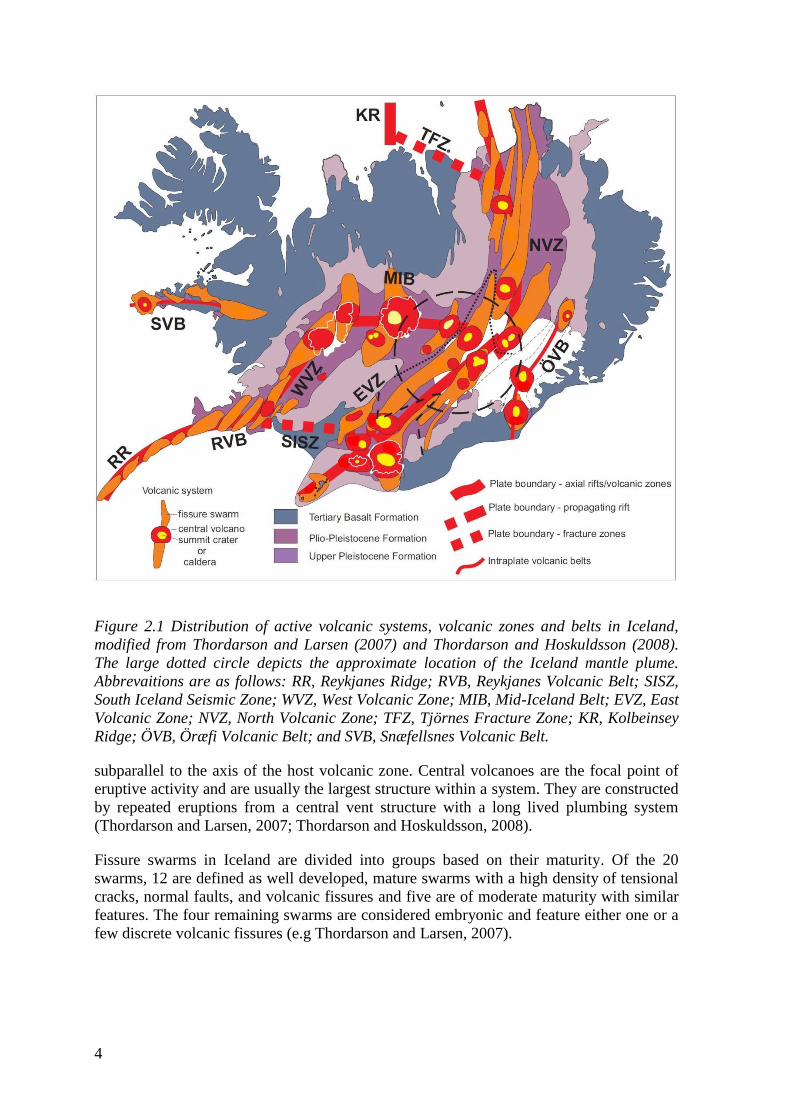
Figure 2.1 Distribution of active volcanic systems, volcanic zones and belts in Iceland,
modified from Thordarson and Larsen (2007) and Thordarson and Hoskuldsson (2008).
The large dotted circle depicts the approximate location of the Iceland mantle plume.
Abbrevaitions are as follows: RR, Reykjanes Ridge; RVB, Reykjanes Volcanic Belt; SISZ,
South Iceland Seismic Zone; WVZ, West Volcanic Zone; MIB, Mid-Iceland Belt; EVZ, East
Volcanic Zone; NVZ, North Volcanic Zone; TFZ, Tjörnes Fracture Zone; KR, Kolbeinsey
Ridge; ÖVB, Öræfi Volcanic Belt; and SVB, Snæfellsnes Volcanic Belt.
subparallel to the axis of the host volcanic zone. Central volcanoes are the focal point of
eruptive activity and are usually the largest structure within a system. They are constructed
by repeated eruptions from a central vent structure with a long lived plumbing system
(Thordarson and Larsen, 2007; Thordarson and Hoskuldsson, 2008).
Fissure swarms in Iceland are divided into groups based on their maturity. Of the 20
swarms, 12 are defined as well developed, mature swarms with a high density of tensional
cracks, normal faults, and volcanic fissures and five are of moderate maturity with similar
features. The four remaining swarms are considered embryonic and feature either one or a
few discrete volcanic fissures (e.g Thordarson and Larsen, 2007).
5
2.3 Eruptive Styles in Iceland
There is a dynamic array of volcanic landforms in Iceland, the most prominent being
magmatic linear vent systems or volcanic fissures. Commonly, these consist of delineating
rows of tightly packed cratered cones that are several to >100 m high and are made up of
spatter, scoria, or hybrid cone rows. They are constructed by lava producing, weak to
vigorous fountaining eruptions as well as volcanogenic chasms. Mixed cone rows are
complex vent systems comprising spatter and scoria cones or hybrids of both and are the
most common linear vent structure in Iceland (e.g Thordarson and Larsen, 2007).
Icelandic eruptions can be of single styles of activity, either explosive or effusive, however
many are mixed eruptions incorporating both styles. Effusive eruptions are classified as
those where the volume of lava is ≥95 % of the bulk volume of the erupted products,
whereas explosive eruptions have a dense rock equivalent (DRE) volume of tephra that is
≥95 % of the total eruptive volume (Thordarson and Larsen, 2007). The term hybrid,
instead of mixed, eruptions is used in this thesis when the respective volumes of lava and
tephra lie within the above stated end member values.
Basaltic effusive eruptions are classified into two groups by size. Small to medium
eruptions produce a volume of lava of <1 km³ and are the most common, with a typical
recurrence of a few decades. Large effusive events produce a volume of lava of >1 km³ and
have a recurrence period of several hundred years. Such eruptions are known as flood lava
eruptions. Both eruption types include low discharge events with flow rates of ≤100 m³ s-1
and high discharge events with flow rates of >500 m³ s-1
. Low discharge events during
small to medium eruptions are distinguished by weak lava fountaining and formation of
pāhoehoe, which are typified by thermally insulated transport systems. When the
topography is favourable, these flows can reach lengths of 20–30 km via lobe to lobe
emplacement and flow. In intermediate discharge events (100 – 500 m3 s
-1) where
fountaining activity is strong, inefficiently thermally insulated open-channels feed ‘a‘ā
flows with short flow lengths (≤10–13 km; e.g. Thordarson and Hoskuldsson, 2008). High
discharge linear vent system events are typified by long lava flow fields, 50 to 140 km long
in Iceland, that involve vigorous lava fountaining and thermally efficient transport systems.
These events initially form pāhoehoe lava flows that transform into rubbly pāhoehoe via
surges of lava through the transport system (Keszthelyi et al., 2000, 2004, 2006;
Thordarson et al., 2003).
2.3.1 Vesiculation
Due to the inability to directly observe magma ascent, properties of eruptive products
present the most reliable records of pre-eruptive conditions of a volcanic eruption
(Gonnermann and Houghton, 2012). In the case of explosive events, vesicles within
pyroclasts provide an insight into the conditions of magma ascent, because they provide a
record of the state of the magma at fragmentation (Cashman, 2004).
The most prominent volatiles in natural magmas are water and carbon dioxide, followed by
sulphur, chlorine, and fluorine. The melt becomes saturated in these volatiles while it
resides in shallow, upper crust storage regions by cooling and crystallising, adding
volatiles from a deep source, or by decompression. Magma ascent is, in part, affected by
the kinetics of vesiculation and crystallisation and their relationship with melt rheology
6
(Cashman, 2004). As the magma ascends, the solubility of magmatic volatiles decreases
with decreasing confining pressure. This causes the melt to become supersaturated in
volatiles which allows the volatiles to exsolve from the melt. Exsolution in this case occurs
by diffusion of volatiles into existing gas bubbles or by the nucleation of new bubbles
(Cashman, 2004; Gonnermann and Houghton, 2012) and bubbles continue to grow by
diffusion (dominant at depth in the Earth) or depressurization (dominant near the Earth’s
surface; Carey, 2005). Two mechanisms are known to initiate the nucleation of bubbles
within a melt:
Heterogeneous: bubbles will nucleate onto existing crystal phases at
supersaturations less than 20 MPa and will produce single populations controlled
by the number of crystal sites; and
Homogeneous: bubbles will nucleate within the melt at supersaturations around 100
MPa that increase with decreasing volatile content (Cashman, 2004; Carey, 2005)
In general, the number of vesicles within a melt will increase exponentially with
decreasing vesicle size. When there is both a sufficiently high-volume fraction of vesicles
and the thicknesses of bubble walls reaches <1 µm, spontaneous wall rupture and vesicle
coalescence will occur. This is controlled by rates of fluid drainage and capillary pressures.
In melts with low viscosity, such as basalt, bubbles can rise relative to the melt. In
response, portions of the magma become enriched in bubbles and the probability of
coalescence dramatically increases. Shape relaxation will then occur as vesicles aim to
deform back into a spherical shape (Cashman, 2004; Carey, 2005; Gonnermann and
Houghton, 2012).
2.4 The Western Volcanic Zone
Six volcanic systems make up the WVZ: Hengill, Hrómundartindur, Grímsnes, Geysir,
Prestahnjúkur, and Hveravellir. The nature of volcanic activity in the WVZ is dominated
by prominent lava shields and eruptive fissures (Thordarson and Hoskuldsson, 2008).
Recent eruptive vents are confined to a zone ~6 km wide, cross-axis, between 64º10’N and
64º20’N. South of this, the WVZ somewhat widens as it merges with the RVB and to the
north of 64º45’N, its width increases to ~25 km cross-axis.
Normal faults are common in volcanic zones and belts in Iceland, but most have a throw of
only a few meters. Unusually large normal faults of up to 150 m are noted within the
Þingvallavatn lake catchment, which is a deep, fault-bounded, asymmetrical graben within
the WVZ (Sinton et al., 2005; Einarsson, 2008). Large topographic relief in the region is
indicative of magma starvation in the rift, by which crustal stretching and normal faulting
accommodates plate divergence, rather than dyke intrusions and lava effusion (Einarsson,
2008).
7
3 Volcanic Rootless Cones
Lava-fountaining is the predominant form of explosive basaltic eruptions in Iceland.
Basaltic magma is disrupted into a spray of spatter bombs, lapilli and ash, and is ejected up
to >100 m above either a central vent or fissure (Carey, 2005). Generally, poor
fragmentation results in pyroclasts that remain molten during transport and coalesce to
form a lava flow on contact with the ground. Tephra deposits are formed during eruptions
with higher explosive intensity where finer pyroclasts are produced and may cool enough
to form an unconsolidated deposit (Houghton and Gonnermann, 2008; Houghton et al.,
2013; Moreland, 2017). The structure of these deposits are dependent on the direction and
speed of local winds and, when able to build up, take the form of spatter, scoria or mixed
cones (Bonadona and Houghton, 2005; Bonadona and Costa, 2012; Carey, 2005; Klawonn
et al., 2014a & b; Pyle, 1989; Thordarson and Larsen, 2007).
Terrestrial rootless cones are one of the most abundant subaerial phreatomagmatic
landforms in Iceland and most commonly are present as a distinct cluster or group of cones
in areas with low regional slope within their host lava flow field that have dimensions of
0.5 to >150 km2 (Greeley and Fagents, 2001; Thordarson and Hoskuldsson, 2008). Well
known examples include: the Mývatn cone group in the 2.2 ka Younger Laxárdalur lava
flow field; the Rauðhólar cone group in the ~5.2 ka BP Elliðaáhraun lava flow field; the
Þjórsardalur cone group in the 2.8 ka Búrfell lava flow field; the Innri Eyrar, Leiðólfsfell
and Hrossatungur cone groups in the 1783 CE Laki lava flow field; and the Álftaver and
Landbrot cone groups of the 934-9 CE Eldgjá lava flow field (Fagents and Thordarson,
2007; Hamilton et al., 2010a, b). The cones are produced by multiple, intermittent
explosions as opposed to a single, large explosion and range in size from 1–35 m in height
and 2–450 m in diameter (e.g. Hamilton et al., 2010a, 2017). Similar extraterrestrial
features have been recognised using remote sensing imagery and the Icelandic rootless
cone groups provide analogues to rootless cones at mid-latitudes on Mars (Hamilton et al.,
2010b).
Volcanic rootless cones form due to molten fuel-coolant interactions (MFCI) that take
place when lava flows over deformable water-bearing substrates such as marshes,
lacustrine basins, littoral environments, glacial outwash plains, snow, and ice (Hamilton et
al., 2017). Molten lava enters the substrate through cracks in the basal crust of the lava
flow, which are formed by differential subsidence and inflation (Fig. 3.1; Hamilton et al.,
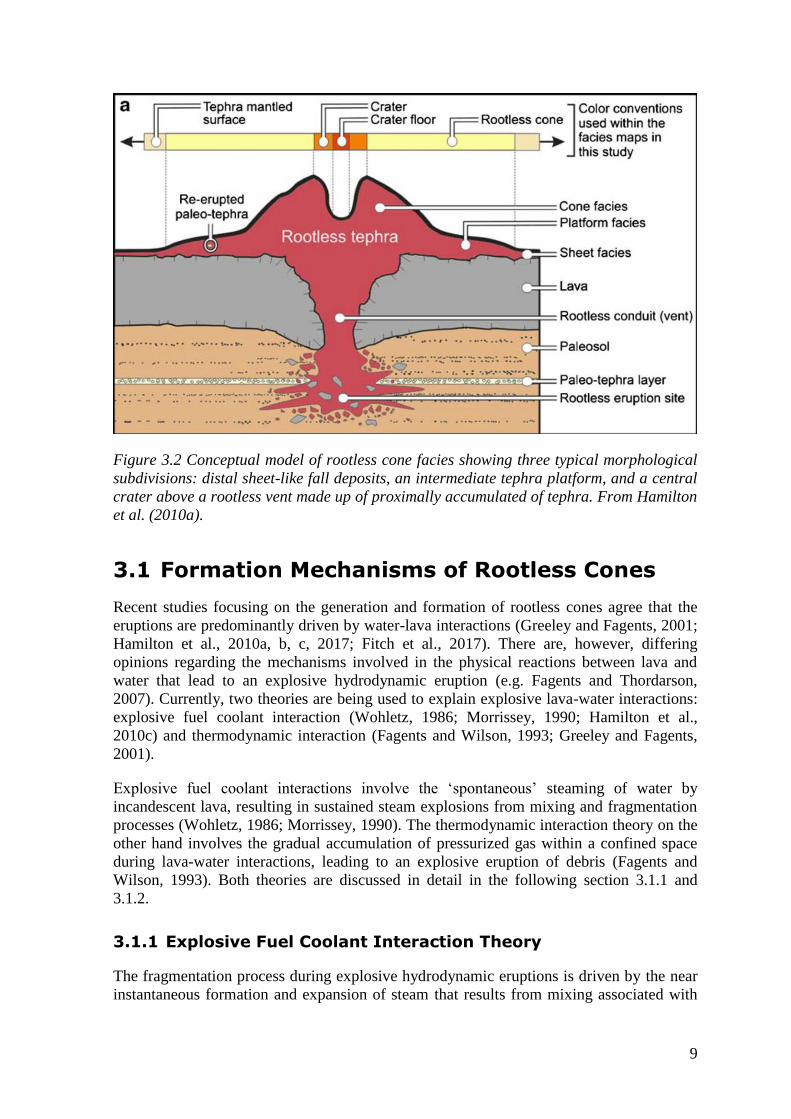
2010a, 2017). Eruptions initiate in a zone beneath the lava flow where MFCIs take place,
known as the rootless eruption site. This zone extends from the substrate, through the lava
flow and to the surface through a rootless conduit and vent (Fig. 3.2). Crater rims are
usually circular, however superimposed craters may form non-circular structures and there
may be one or more crater floors depending on the number of underlying eruption sites and
vent infill history (Hamilton et al., 2010a, b). Single cones with a summit crater; double
cones involving an inner cone within a summit crater; and multiple cones involving several
inner cones within a summit crater, have been identified as typical configurations for the
formations (Noguchi et al., 2016).
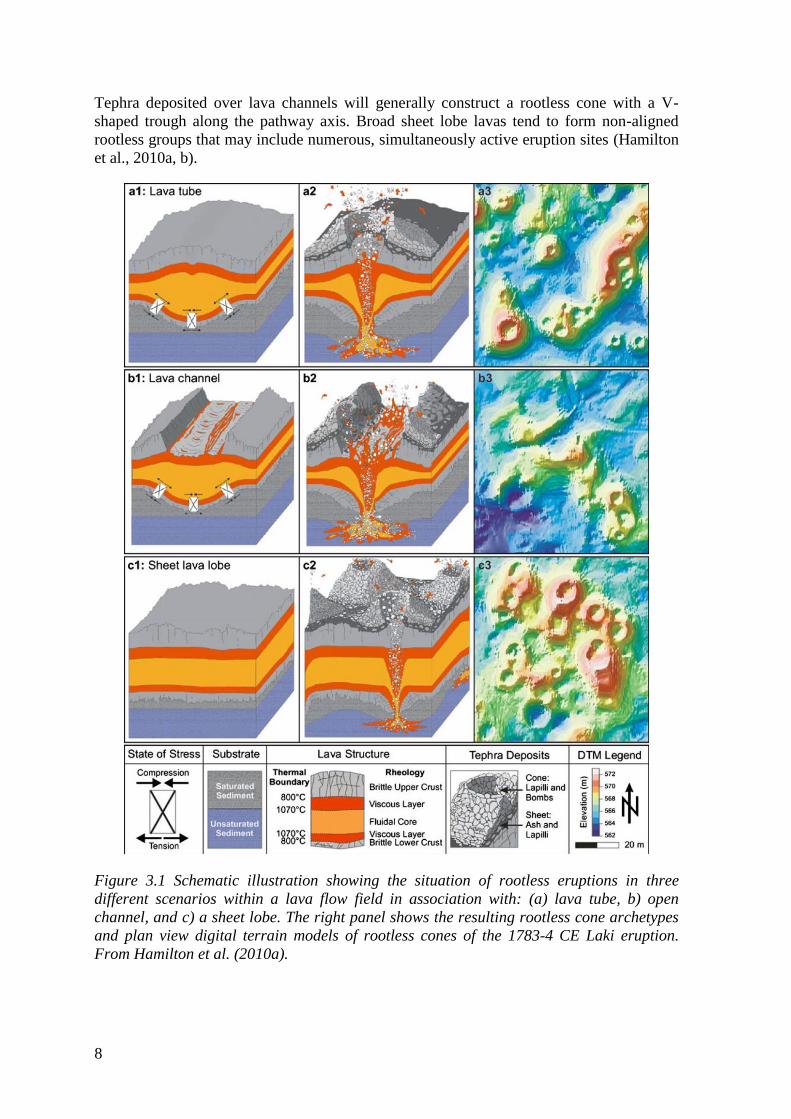
Cones can form tube-, channel- and sheet lobe-fed archetypes (Fig. 3.1). Tephra deposited
onto the stationary lava surface above a lava tube tend to form radially symetric cones.
8
Tephra deposited over lava channels will generally construct a rootless cone with a V-
shaped trough along the pathway axis. Broad sheet lobe lavas tend to form non-aligned
rootless groups that may include numerous, simultaneously active eruption sites (Hamilton
et al., 2010a, b).
Figure 3.1 Schematic illustration showing the situation of rootless eruptions in three
different scenarios within a lava flow field in association with: (a) lava tube, b) open
channel, and c) a sheet lobe. The right panel shows the resulting rootless cone archetypes
and plan view digital terrain models of rootless cones of the 1783-4 CE Laki eruption.
From Hamilton et al. (2010a).
9
Figure 3.2 Conceptual model of rootless cone facies showing three typical morphological
subdivisions: distal sheet-like fall deposits, an intermediate tephra platform, and a central
crater above a rootless vent made up of proximally accumulated of tephra. From Hamilton
et al. (2010a).
3.1 Formation Mechanisms of Rootless Cones
Recent studies focusing on the generation and formation of rootless cones agree that the
eruptions are predominantly driven by water-lava interactions (Greeley and Fagents, 2001;
Hamilton et al., 2010a, b, c, 2017; Fitch et al., 2017). There are, however, differing
opinions regarding the mechanisms involved in the physical reactions between lava and
water that lead to an explosive hydrodynamic eruption (e.g. Fagents and Thordarson,
2007). Currently, two theories are being used to explain explosive lava-water interactions:
explosive fuel coolant interaction (Wohletz, 1986; Morrissey, 1990; Hamilton et al.,
2010c) and thermodynamic interaction (Fagents and Wilson, 1993; Greeley and Fagents,
2001).
Explosive fuel coolant interactions involve the ‘spontaneous’ steaming of water by
incandescent lava, resulting in sustained steam explosions from mixing and fragmentation
processes (Wohletz, 1986; Morrissey, 1990). The thermodynamic interaction theory on the
other hand involves the gradual accumulation of pressurized gas within a confined space
during lava-water interactions, leading to an explosive eruption of debris (Fagents and
Wilson, 1993). Both theories are discussed in detail in the following section 3.1.1 and
3.1.2.
3.1.1 Explosive Fuel Coolant Interaction Theory
The fragmentation process during explosive hydrodynamic eruptions is driven by the near
instantaneous formation and expansion of steam that results from mixing associated with
10
water-magma interactions. This process is also known as molten fuel-coolant interactions
(MFCI). MFCIs involve heat transfer processes by which vapour is generated due to the
interaction between a relatively cold volatile fluid (coolant) and a hot fluid (fuel) (Wohletz,
1986; Morrissey, 1990; Wohletz et al., 1995; Zimanowski et al., 1997; Morrissey et al.,
2000; Zimanowski and Wohletz, 2000; Büttner et al., 2002; Zimanowski and Büttner,
2002). They can be explosive or non-explosive, depending on whether temporary local
over-pressurisation occurs (localised pressures rise sufficiently to a point that the system is
unable to relieve it). The water to melt ratio has to be optimal for powerful explosions to
take place, too little or too much water does not result in explosive activity. Hydrodynamic
mingling between the water and melt is very limited by the cooling rate of the system;
however, it is promoted if the contrast in viscosity is small between the two liquids
(Zimanowski and Büttner, 2002).
At present, there are two theories that sufficiently explain the processes that result in
explosive MFCIs:
1. The spontaneous nucleation (superheating) model by which the superheating of
water via contact with lava reaches the temperature of spontaneous vapour
nucleation.
2. The thermal detonation model by which an externally generated pressure wave
triggers fine fragmentation and collapse of insulating film barriers around
fragments, causing rapid heat transfer and vapour production.
Both models require, prior to explosion, a period of film boiling (Wohletz, 1986).
Spontaneous Nucleation Model
Spontaneous nucleation, or superheating, requires the temperature of the interface contact
between fuel and coolant to be above the spontaneous nucleation temperature of the
coolant, in this case, water. Thus, a metastable thermodynamic state occurs where water
remains in its liquid state above its boiling temperature for any given pressure. In this
condition, various forms of physical or chemical disturbances can trigger the water to
instantaneously turn to steam and initiate a boiling front that will propagate as a wave of
vapourisation (Wohletz, 1986; Zimanowski et al., 1997; Zimanowski and Wohletz, 2000).
A vapour film forms at the interface between fuel and coolant as the temperature of the
water escalates to its spontaneous nucleation temperature while remaining in a metastable
liquid state (Fig. 3.3). This metastable liquid will then flash into high pressure vapour once
the interfacial temperature exceeds the spontaneous nucleation temperature (Morrissey,
1990; Nouri-Borujerdi, 1985; Zimanowski and Wohletz, 2000).
Multiple small bubbles form along the interface and as the temperature increases, they
continue to grow until coalescence occurs and a vapour film forms. The rate of vapour
bubble nucleation increases as convection within the film changes from laminar to
turbulent. As the turbulence within the film increases and the temperature rises to critical,
film boiling moves to the homogeneous nucleation regime. Within this regime, both the
rate of bubble nucleation and the number of nucleation sites are at a maximum and the film
begins to oscillate in thickness. This film can remain hydrodynamically stable, providing
an insulation barrier between the coolant and fuel. However, if the thickness of the film
increases, both the interfacial temperature and the heat transfer rate may decrease and
11
cause the film to collapse onto the fuel surface (Wohletz, 1986; Morrissey, 1990). If the
collapse involves enough kinetic energy to deform the melt surface, intimate mixing of
water and lava will occur. If this occurs before conditions of superheating are reached,
large volumes of lava and water can result in explosions (Fig. 3.3; Wohletz, 1986;
Zimanowski and Wohletz, 2000). The vapour film can, however, be reformed and the
process repeats until superheating conditions are reached (Morrissey, 1990). In this case,
explosions can occur at the lava-water interface and only involve small amounts of fuel
and coolant (Wohletz, 1986; Zimanowski et al., 1997; Zimanowski and Wohletz, 2000;
Zimanowski and Büttner, 2002).
Experiments have shown that spontaneous nucleation conditions can be reached within a
relatively short time (Morrissey, 1990) and violent fuel-coolant interactions ensue
confining pressures that are larger than 35 MPa. Generally, superheating-type interactions
are limited to interactions of <1 kg whereas interactions of volcanic proportions lean
toward a ‘detonation’ style of interaction (Wohletz, 1986).
Thermal Detonation Model
Thermal detonation, also known as 'polymorphic detonation', refers to a rapid phase
change in which sudden vapourisation of a liquid occurs behind a propagating shock wave
(Wohletz, 1986). This model assumes that fragmentation and intermixing of the melt with
the water is controlled by rapidly changing pressure volume conditions that exist across a
shock wave moving through the melt-water mixture. As a shock wave passes through the
volatile fluid it causes a differential acceleration of melt particles relative to the water,
initiating a phase transformation within the area behind the shock wave front (Wohletz,
1986; Morrissey, 1990). This phase transformation is associated with rapid thermal
equilibrium that occurs due to the breakup of melt into finer particles (Wohletz, 1986;
Zimanowski et al., 1997; Zimanowski and Wohletz, 2000; Zimanowski and Büttner, 2002)
and, if the rate of heat transfer between fragments and coolant is sufficient, it results in an
increase in the temperature of the coolant which will pressurize the mixture at an explosive
rate (Fig. 3.4) (Wohletz, 1986; Morrissey, 1990; Zimanowski et al., 1997; Zimanowski and
Wohletz, 2000; Zimanowski and Büttner, 2002).
Although this theory is experimentally verified, the mechanism of fragmentation initiation
behind the shock wave is poorly understood. It may be that a large trigger, such as a
pressure wave, may be required to initiate the event (Morrissey, 1990) and where this is
lacking, a two stage explosion sequence may provide a sufficient explanation. During the
first stage, spontaneous nucleation vapourisation initiates where the ambient pressure is
less than the suppression limit (largely theoretical) during MFCI. Propagation of shock
waves from stage one then promotes the thermal detonation of the lava-water mixture
where ambient pressure is higher (Morrissey, 1990; Zimanowski and Wohletz, 2000).
Within the MFCI models, mechanisms that result in the direct contact of the external water
with incandescent, hot lava and the required contact period in order to produce a rootless
cone require further clarification.
12
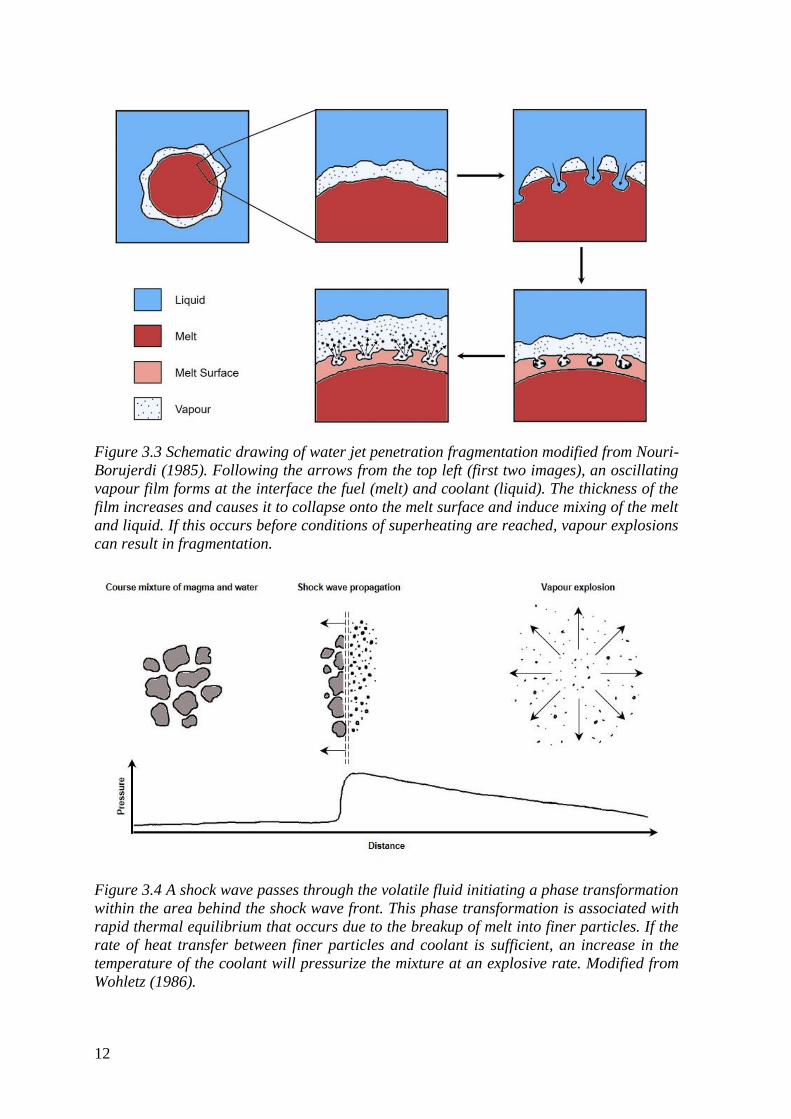
Figure 3.3 Schematic drawing of water jet penetration fragmentation modified from Nouri-
Borujerdi (1985). Following the arrows from the top left (first two images), an oscillating
vapour film forms at the interface the fuel (melt) and coolant (liquid). The thickness of the
film increases and causes it to collapse onto the melt surface and induce mixing of the melt
and liquid. If this occurs before conditions of superheating are reached, vapour explosions
can result in fragmentation.
Figure 3.4 A shock wave passes through the volatile fluid initiating a phase transformation
within the area behind the shock wave front. This phase transformation is associated with
rapid thermal equilibrium that occurs due to the breakup of melt into finer particles. If the
rate of heat transfer between finer particles and coolant is sufficient, an increase in the
temperature of the coolant will pressurize the mixture at an explosive rate. Modified from
Wohletz (1986).
13
Fe-Al Analogues
The dynamics of molten fuel coolant interactions have been investigated experimentally
using a thermitic iron (Fe) - aluminium (Al) melt analogue (Morrissey, 1990). Research
found that the explosions were initiated from complex wave structures surrounding the
water–melt mixtures. The degree of mixing between the melt and water was established by
three distinct pressurization histories: single explosions, double explosions and passive
steam generation pressure rises.
Morrissey (1990) noted that large, energetic explosions were associated with rapid
pressurisation events that involved larger water–melt contact surface areas. There are three
scenarios in which propagating stress waves occur in this situation. They are either induced
by the thermal stresses resulting from rapid quenching, by instability pressure waves, or by
the rarefaction waves that are generated by system decompression (Morrissey, 1990).
When induced by hydrodynamic instabilities, pressure waves can propagate into
detonation waves in scenarios of high confining strength.
The degree of physical interaction between water and melt is reflected in the shapes of the
explosive products. Clasts indicate the thermodynamic state of water in the chamber at the
time of decompression and the types correlate with both the expansion energy of ejecta and
the water to melt mass ratio at the time of decompression. Table 3.1 shows the clast types,
their morphology and the formation mechanisms that Morrissey (1990) identified in this
study.
A number of the clast morphologies can be likened to those identified by Fitch et al.,
(2017) from the Rauðhólar rootless cone deposits. The blocky clasts exhibit angular
surfaces and are associated with the most energetic phase of the explosion in which brittle
fragmentation, caused by the propagation of stress waves through both molten and
solidified lava, occurs under supercritical conditions. The fluidal clasts are attributed to
hydrodynamic fragmentation of melt from the ductile regime during the early expansion of
MFCIs under two-phase, vapour rich conditions (Morrissey, 1990; Zimanowski et al.,
1997; Büttner et al., 2002; Fitch et al., 2017), and the smooth surfaces form as a result of
surface tension effects. Mossy clast form similarly to the fluidal clasts, however involve
saturated vapour and supercritical interaction conditions, and the surface textures are
attributed to viscous effects instead (Morrissey, 1990; Fitch et al., 2017). Polygonal cracks
noted on the surfaces of clasts are related to enhanced cooling of the clast due to syn-
depositional interaction with water or steam (Büttner et al., 2002; Fitch et al., 2017).
14
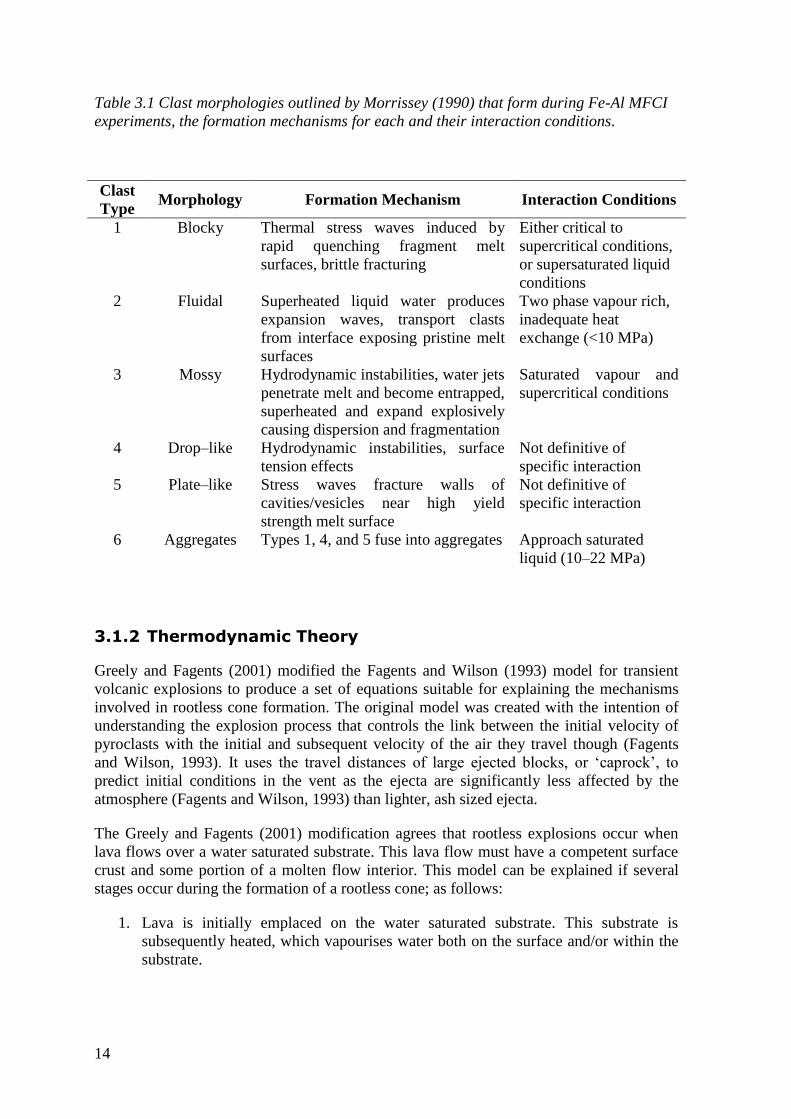
Table 3.1 Clast morphologies outlined by Morrissey (1990) that form during Fe-Al MFCI
experiments, the formation mechanisms for each and their interaction conditions.
3.1.2 Thermodynamic Theory
Greely and Fagents (2001) modified the Fagents and Wilson (1993) model for transient
volcanic explosions to produce a set of equations suitable for explaining the mechanisms
involved in rootless cone formation. The original model was created with the intention of
understanding the explosion process that controls the link between the initial velocity of
pyroclasts with the initial and subsequent velocity of the air they travel though (Fagents
and Wilson, 1993). It uses the travel distances of large ejected blocks, or ‘caprock’, to
predict initial conditions in the vent as the ejecta are significantly less affected by the
atmosphere (Fagents and Wilson, 1993) than lighter, ash sized ejecta.
The Greely and Fagents (2001) modification agrees that rootless explosions occur when
lava flows over a water saturated substrate. This lava flow must have a competent surface
crust and some portion of a molten flow interior. This model can be explained if several
stages occur during the formation of a rootless cone; as follows:
1. Lava is initially emplaced on the water saturated substrate. This substrate is
subsequently heated, which vapourises water both on the surface and/or within the
substrate.
Clast
Type Morphology Formation Mechanism Interaction Conditions
1 Blocky Thermal stress waves induced by
rapid quenching fragment melt
surfaces, brittle fracturing
Either critical to
supercritical conditions,
or supersaturated liquid
conditions
2 Fluidal Superheated liquid water produces
expansion waves, transport clasts
from interface exposing pristine melt
surfaces
Two phase vapour rich,
inadequate heat
exchange (<10 MPa)
3 Mossy Hydrodynamic instabilities, water jets
penetrate melt and become entrapped,
superheated and expand explosively
causing dispersion and fragmentation
Saturated vapour and
supercritical conditions
4 Drop–like Hydrodynamic instabilities, surface
tension effects
Not definitive of
specific interaction
5 Plate–like Stress waves fracture walls of
cavities/vesicles near high yield
strength melt surface
Not definitive of
specific interaction
6 Aggregates Types 1, 4, and 5 fuse into aggregates Approach saturated
liquid (10–22 MPa)
15
2. Vapourisation causes a pressure build up as gas accumulates in a space confined by
underlying country rock and the overlying lava flow and solid crust.
3. A combination of the weight and strength of the overlying lava determines a
threshold pressure which, if exceeded, results in a rapid expansion of gas that
excavates and entrains the overlying lava.
4. Lava from the flow interior enters the erupted space and, along with accumulation
of debris, seals the void.
5. Until available water is expended, repetition of stages 2–4 lead to the final rootless
cone morphology as tephra builds up around the eruption site.
The initial explosions are substantially energetic as they require a significant degree of
pressurized gas build up to overcome the confining pressure from the weight of the
overlying lava flow and the strength of the solid crust.
Assuming an instantaneously emplaced, stationary, cooling flow, heat transfer calculations
show that a thermal wave may penetrate the substrate and produce a water-vapour column
up to half the thickness of the lava flow. If the flow interior is mobile, the thermal
influence could be extended to greater depths due to prolonged heating time from
advective heat transfer. The initial thickness of the confining lava layer also has potential
for being much different than the subsequent explosions (Greeley and Fagents, 2001).
The amount of gas pressure and mass required to initiate an explosion is proportional to the
thickness of the overlying lava (Greeley and Fagents, 2001). Greater thicknesses require
much larger gas regions, and the resulting explosions are less capable of producing larger
cones. This is because they require more energy during gas expansion at the expense of
kinetic energy, hence maximum clast velocities and trajectories are much smaller. Lava
strength, determined by the thickness and development of yield or tensile strength in the
viscous/ visco-elastic portion of the flow (Hon et al., 1994), is independent of overall lava
thickness and plays a role in the resulting explosion intensities. When the lava strength is
greater, there is a greater range of potential cone sizes, however this requires sufficient
time between explosions for thermal interaction with water to attain additional
vapourisation and pressurization (Greeley and Fagents, 2001). Fagents et al. (2003)
concluded that the initial gas pressure needs to overcome a threshold pressure for
explosions to occur. The threshold pressure is determined by the mass of the overlying
lava, the yield strength of molten lava, the tensile strength of the viscoelastic and/or brittle
carapace, and the ambient atmospheric pressure.
The availability of water is ultimately what determines the size and morphology of
Icelandic rootless cones and water-magma mass ratios around 0.3–1.0 are determined by
Greeley and Fagents (2001) as optimal for explosive energy release.
This model is simple in that is disregards the way in which the vapour pressure is
generated, and focusses on the quantitative kinetics of the ejecta; whereas the MFCI
models focus on the vapour generation mechanisms and do not address the mechanics or
energetics of ejection. Disregarding the way in which the vapour pressure is generated
leads to a number of uncertainties in the thermodynamic model are discussed below:
16
1. The model requires the lava to be confined to a point that steam can build to a
sufficient degree, where time taken may allow steam to escape through flow to the
edges of the confined lava. Even when the thermal insulating effects of the basal
crust of the lava are ignored, the time it takes for heat transfer into the substrate is
too substantial for steam to build up. If the lava advances over significantly porous,
water-logged substrate, the generation of steam must also be fast enough to make
the outflow of steam via existing pores in the substrate insignificant.
2. Multiple layers identified in rootless cones also demonstrate that cones are formed
by sustained activity of declining intensity (Hamilton et al., 2017), indicating that
the pressure confining lid must be re-established following the initial explosion. To
do this the vent must either be, sealed by new lava and after a certain amount of
time the pressure may be high enough to produce a new explosion; or the steam
generation must be rapid enough to pressurise the system despite the lack of
confinement. In this case, extremely high rates of transfer of heat from the water to
the lava is required, which cannot be achieved by thermal conduction alone and
promotes conditions of spontaneous nucleation. Evidence of vent resealing has not
been noted in the field in these structures. Also, the confinement of the explosion to
the exact same location during the formation of a cone does not support the notion
of sustained activity and therefore refutes this model.
3. The model assumes that the gas pressure required to cause an explosion is
proportional to the thickness of the overlying lava. However, this seems to be
contradicted by the notion that the explosive intensity is also influenced by the lava
strength, which is independent of overall lava thickness. Instead, the gas pressure
required to cause an explosion may be proportional to the lava strength, rather than
thickness, and may affect calculations for the threshold pressure determined by
Fagents et al. (2003).
4. Even if the lava is initially incandescent, which is necessary for radiative heat
transfer to be an effective mechanism in heat exchange, it will develop a crust
relatively quickly that will result in surface temperatures on par with ambient
temperatures. In this case, heat is transferred across this crust via the low
conduction of basalt, decreasing with time as the crust thickens. Thus, it becomes
increasingly difficult to transfer heat to the external water and maintain steam
formation. Any steam present at the interface will face difficulties transferring
enough heat at speeds that maintain a growing steam to water interface, as it is a
very poor conductor of heat. This is, however, required to drive the ongoing
pressurisation of the system and contradicts the explosive aspect of this model.
Overall, these mechanisms work toward reducing the heat flux from the lava to the
external water and thus makes it less likely for steam to maintain steam generation,
which is not supportive of the thermodynamic model (Thorvaldur Thordarson,
personal communication).
17
4 Nesjahraun
4.1 Geological Setting
The Þingvallavatn lake catchment lies mostly within a graben produced by crustal
extension across the WVZ (Sinton et al., 2005; Stevenson et al., 2011, 2012). The graben
formation is caused by offset between the locus of tectonic subsidence and locus of
volcanic activity due to which a deep, fault-bounded depression was formed. Rates of SW–
NE trending crustal extension across the Þingvellir graben ranges between 3.2 and 8.2 mm
yr-1
whereas extension between Reykjanes and Langjökull accommodates a portion of the
~150 mm yr-1
spreading of the northern, subaerial Mid-Atlantic Ridge (Jeff Karson,
personal communication 2017; Stevenson et al., 2011).
The Nesjahraun (nsh) lava flow field is located on the southern shore of Þingvallavatn
(Fig. 4.1) and is the most recent volcanic event of the Þingvallavatn catchment. It is a
basaltic lava that erupted 1880 ± 65 years before present (BP) from the northern portion of
a 30 km-long linear vent system (Sæmundsson, 1992), which is comprised of two main
fissure segments separated by 9 km (Fig. 4.1), one to the southwest and another to the
northeast of the Hengill central volcano (Sinton et al., 2005). The Hengill volcanic system
is characterised by volumetrically small fissure eruptions, the loci of which have varied
over time to produce complex ridge systems (Sæmundsson, 1992). The Nesjahraun fissure
system trends 30º NE and the northern proximity is defined by the tuff cone, Sandey, that
was produced on the fissure segment that extended into the lake (Stevenson et al., 2011).
This study focuses on the subaerial portion of the northern segment, which features a vent
system defined by aligned spatter and scoria cones and a lava that the eruption takes its
name after, Nesjahraun (Fig. 4.1; Sæmundsson, 1992). This part of the lava flow field
covers an area of 13.8×10⁶ m², of which 4.0×10
6 m² extends approximately 1.5 km into
Þingvallavatn (Stevenson et al., 2012).
Stevenson et al. (2011, 2012) identified two emplacement phases for Nesjahraun. An initial
pāhoehoe phase that was produced by a series of vents along the erupting fissure segment
followed by a second ʻaʻā phase originating from vents on the central part of the fissure
segment. Both phases reached the shores of Þingvallavatn, resulting in explosive lava-
water interactions that generated the circular rootless cone Eldborg during the initial phase
and the half cone of Grámelur in the second phase (Fig. 4.2). Eldborg is 95 m in diameter
and 20 m tall. Grámelur is comprised of two kidney-shaped mounds sitting on the banks of
an open ʻaʻā channel. It is 600 m wide and 40 m tall.
18
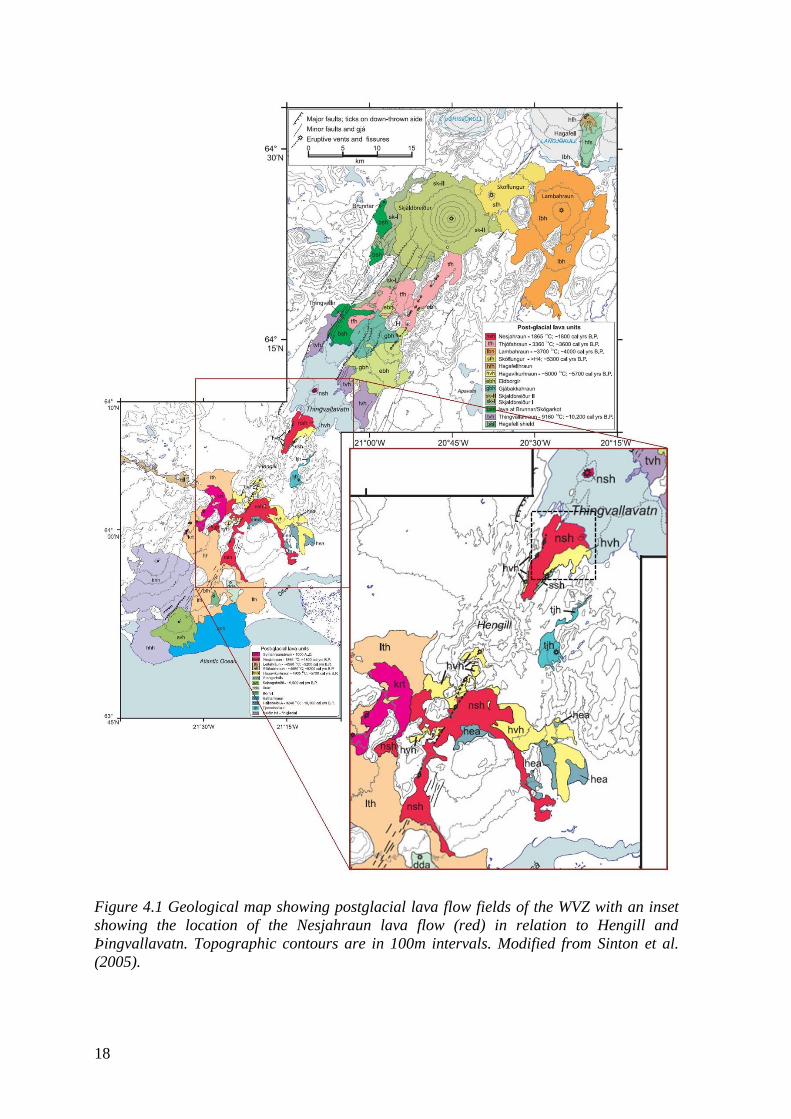
Figure 4.1 Geological map showing postglacial lava flow fields of the WVZ with an inset
showing the location of the Nesjahraun lava flow (red) in relation to Hengill and
Þingvallavatn. Topographic contours are in 100m intervals. Modified from Sinton et al.
(2005).
19
4.2 Lava Flow Morphology
The initial phase of Nesjahraun produced pāhoehoe, emplaced as a series of sheet lobes
(Fig. 4.2). It traversed the graben floor and spanned the distance between the vent and the
lake shore, covering an area of 1.86×10⁶ m
2 (Stevenson et al., 2012). They ascertain that
the lack of open channels in this part of the lava and the relatively low surface relief
indicates that the flow was fed endogenously. The relatively high effusion rates and
shallow topography allowed individual flow lobes to coalesce thus producing lava that has
the appearance of a single continuous sheet. Water confined below the lava flow,
penetrated the lava pathway at a location behind the active pāhoehoe flow front and
initiated the explosive lava-water interaction. This formed the prominent circular rootless
cone, Eldborg.
The interpretation of Eldborg as a rootless cone is attributed to its position within
Nesjahraun. The crater walls are comprised of outward-dipping scoria layers capped by
approximately 3 m of agglutinate and it contains a small pond in the crater centre. The
pond is hydraulically linked to Þingvallavatn, as noted by Stevenson et al. (2011),
indicating that the base of the rootless cone lies below the water table. Therefore, the
rootless eruption likely ceased due to lack of lava supply, rather than water exhaustion.
Stevenson et al. (2011) interpret the Eldborg MFCIs to have been generated by confined
mixing between water and lava because of the deposits of unconsolidated spatter that
underlie lavas exposed in the bay. Such deposits are indicative of weaker littoral lava
fountaining and bubble burst type explosions requiring a magma flux of >4 m3 s
-1.
After the initial stages of the eruption, the lava transport and dispersal became focussed on
an open 200–350 m wide channel originating from the central portion of the erupting
fissure feeding a rubbly pāhoehoe to ʻaʻā lava now partly superimposed on the initial phase
pāhoehoe (Fig. 4.2; Stevenson et al., 2011, 2012). The channelling allowed approximately
30–50 % (6×10⁷ m
2) of the second phase lava volume to drain into Þingvallavatn to the
east of Eldborg. A subsequent breakout channel to the east from the main channel (Fig.
4.2) initiated the explosive lava-water interactions that constructed the Grámelur rootless
cone. The total onshore area of the second lava phase is 2.14×10⁶ m
2 (Stevenson et al.,
2011).
The Grámelur rootless cone is composed of unconsolidated angular, black, scoriaceous
lapilli and ash with intermittent spatter clasts <10 cm in size and is located at a similar
distance from the original vent system to Eldborg. Grámelur is dissimilar to typical rootless
cone formations in Iceland such as those present within the 1783-4 CE Laki flow field or
the 5.2 ka BP Elliðaáhraun-Rauðhólar group. The large, kidney-shaped cone pairs are more
comparable to littoral cones formed when ʻaʻā lava in Hawai‘i enters the ocean (Fisher,
1968). Stevenson et al. (2011) therefore interpret the cone to have formed by the mixing of
lava and water-logged material, attributing the large size to sustained tephra-jet explosions
and a high lava flux of approximately 80–90 m3 s
-1. This also results in increasingly violent
explosions comparative to Eldborg, supported by the finer grained nature of the deposit.
The shape of Grámelur is owing to the lava channel, which flowed through the middle of
the forming cone, removing tephra as it landed on the moving lava flow. When the lava
flow diverted to the west, it is assumed the lava supply through the cone was cut off and
the explosions ceased (Stevenson et al., 2011).
20
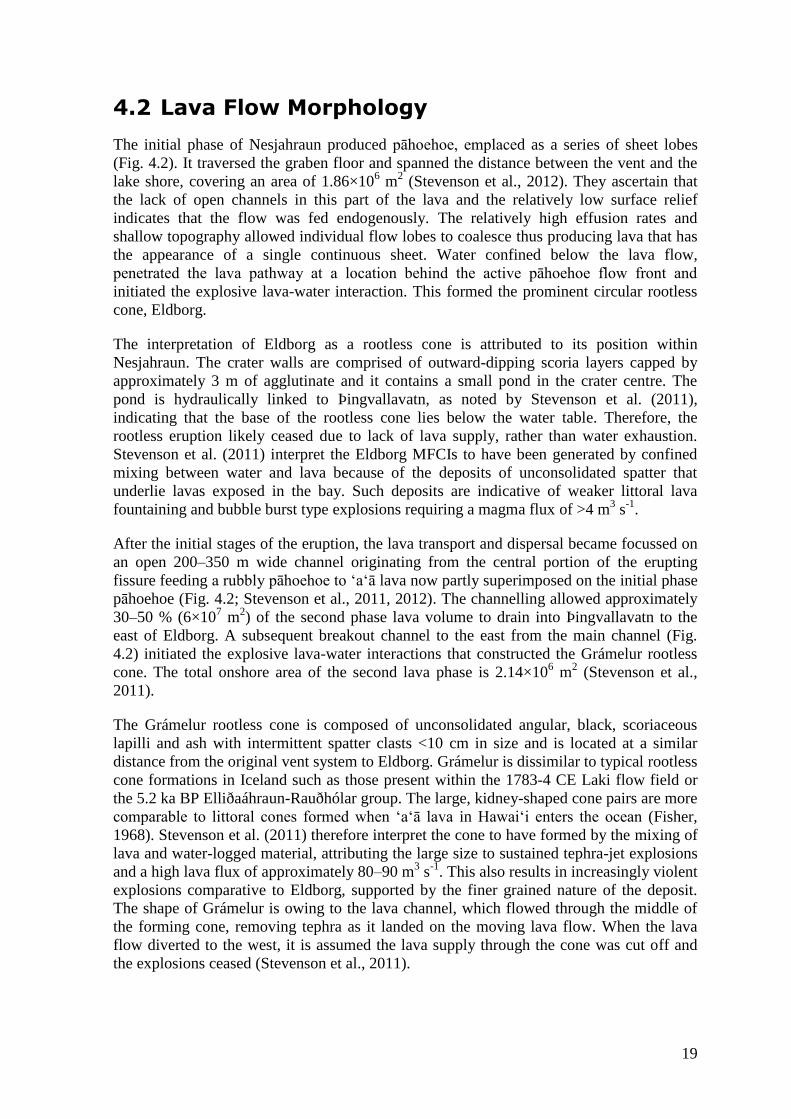
Figure 4.2 Shaded relief map showing the different lithofacies of Nesjahraun from
Stevenson et al. (2012). White numbers indicate the thickness of pāhoehoe slabs in
centimeters. Measurements in areas of ‘a‘ā lava were made on slabby clasts carried by the
flow (Stevenson et al., 2012).
21
5 Methodology
5.1 Study Area
Nesjahraun was selected as the focal lava field of this study due to its proximal location of
the rootless cones to the primary fissure vent (~3 km; Fig. 5.1). The rootless cone
formations of other such Icelandic eruptions as 1783-4 CE Laki and the 5.2 ka BP
Elliðaáhraun event, are located at distances from the primary source vent more than three
times that of Nesjahraun. Due to the close proximity of the primary fissure vent (PV; or PC
for primary cone henceforth) and the rootless cones (RC), external influences on the lava
flow are assumed to be minimal in comparison as the lava has traversed a lesser distance,
providing a good starting point for this type of study. The focal RC of this study is
Grámelur as the unconsolidated deposition material allows for easier and more reliable
sampling than that of the agglutinate material of Eldborg.
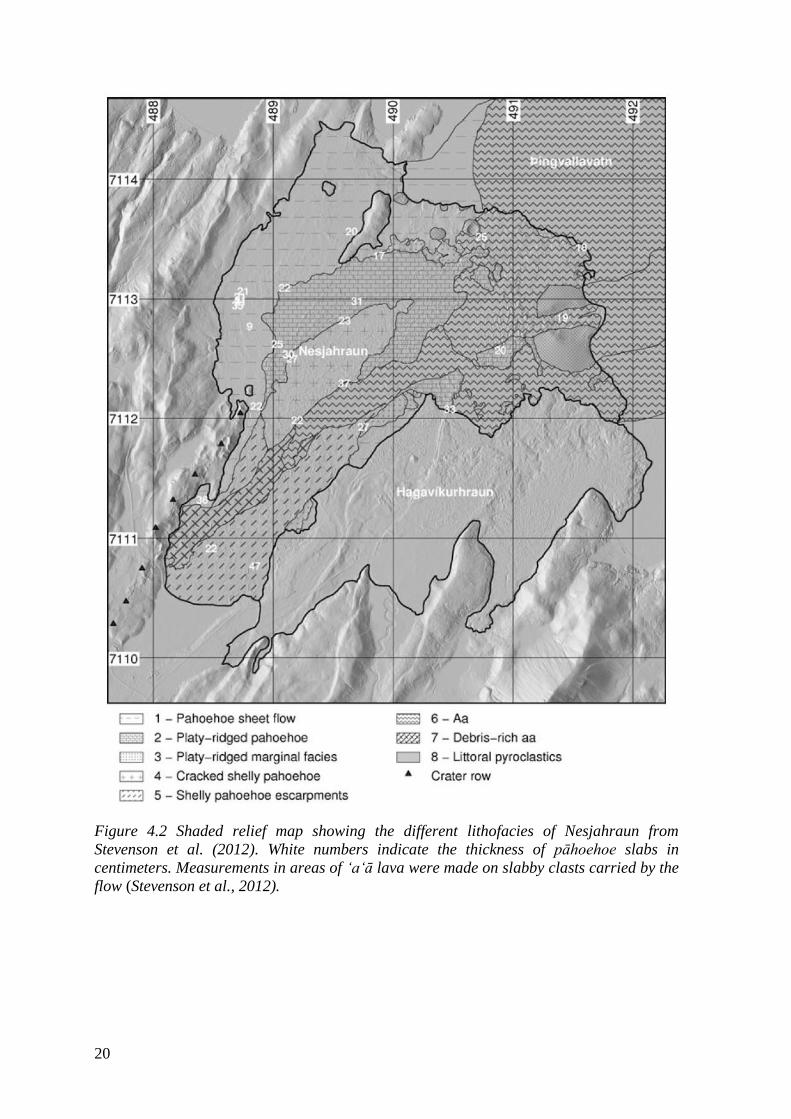
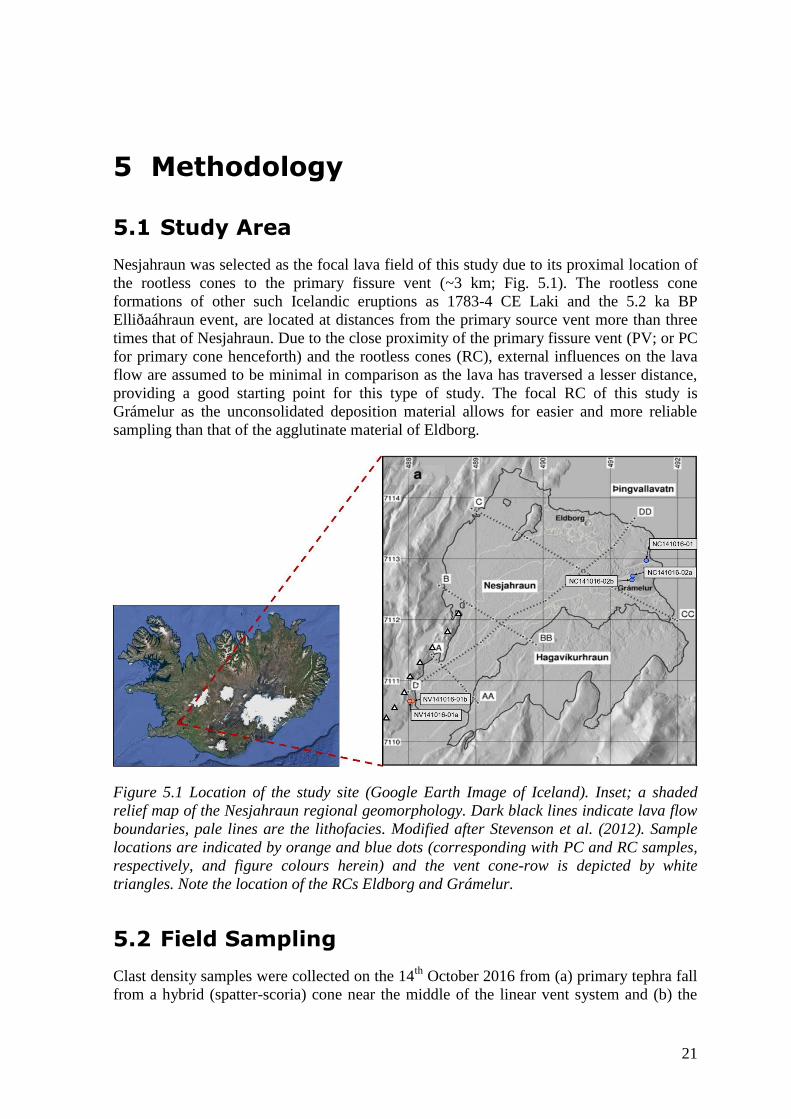
Figure 5.1 Location of the study site (Google Earth Image of Iceland). Inset; a shaded
relief map of the Nesjahraun regional geomorphology. Dark black lines indicate lava flow
boundaries, pale lines are the lithofacies. Modified after Stevenson et al. (2012). Sample
locations are indicated by orange and blue dots (corresponding with PC and RC samples,
respectively, and figure colours herein) and the vent cone-row is depicted by white
triangles. Note the location of the RCs Eldborg and Grámelur.
5.2 Field Sampling
Clast density samples were collected on the 14th
October 2016 from (a) primary tephra fall
from a hybrid (spatter-scoria) cone near the middle of the linear vent system and (b) the
22
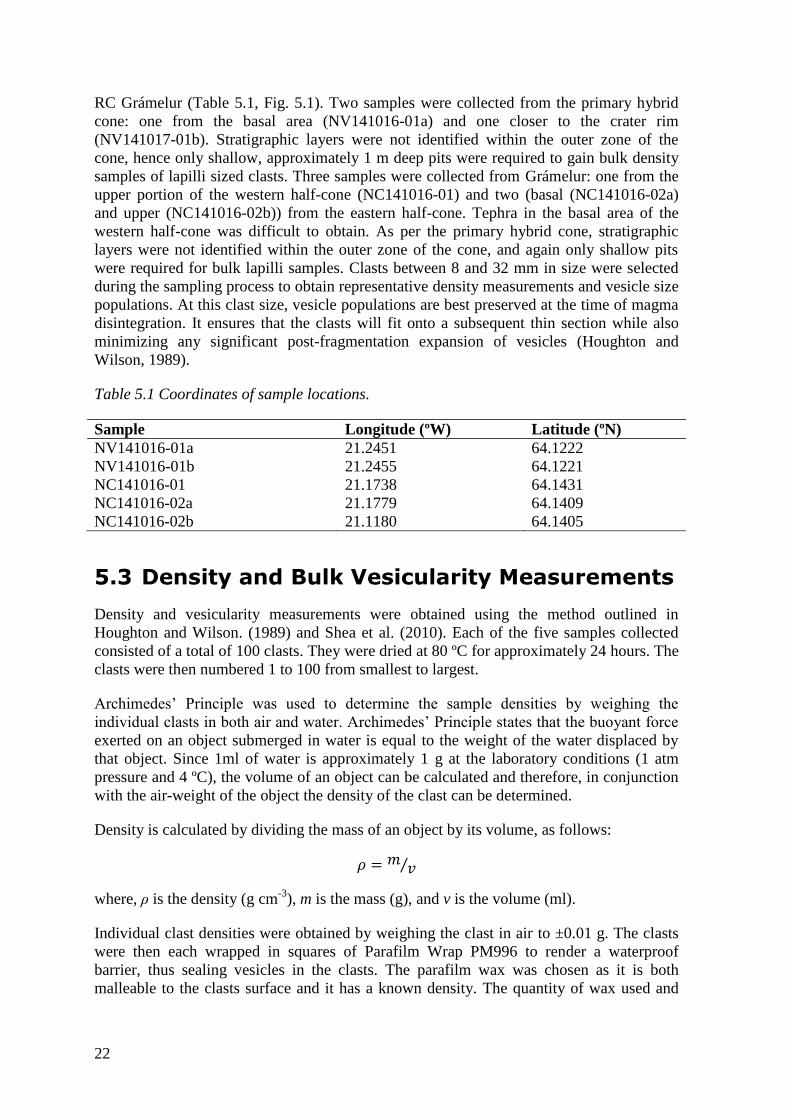
RC Grámelur (Table 5.1, Fig. 5.1). Two samples were collected from the primary hybrid
cone: one from the basal area (NV141016-01a) and one closer to the crater rim
(NV141017-01b). Stratigraphic layers were not identified within the outer zone of the
cone, hence only shallow, approximately 1 m deep pits were required to gain bulk density
samples of lapilli sized clasts. Three samples were collected from Grámelur: one from the
upper portion of the western half-cone (NC141016-01) and two (basal (NC141016-02a)
and upper (NC141016-02b)) from the eastern half-cone. Tephra in the basal area of the
western half-cone was difficult to obtain. As per the primary hybrid cone, stratigraphic
layers were not identified within the outer zone of the cone, and again only shallow pits
were required for bulk lapilli samples. Clasts between 8 and 32 mm in size were selected
during the sampling process to obtain representative density measurements and vesicle size
populations. At this clast size, vesicle populations are best preserved at the time of magma
disintegration. It ensures that the clasts will fit onto a subsequent thin section while also
minimizing any significant post-fragmentation expansion of vesicles (Houghton and
Wilson, 1989).
Table 5.1 Coordinates of sample locations.
Sample Longitude (ºW) Latitude (ºN)
NV141016-01a 21.2451 64.1222
NV141016-01b 21.2455 64.1221
NC141016-01 21.1738 64.1431
NC141016-02a 21.1779 64.1409
NC141016-02b 21.1180 64.1405
5.3 Density and Bulk Vesicularity Measurements
Density and vesicularity measurements were obtained using the method outlined in
Houghton and Wilson. (1989) and Shea et al. (2010). Each of the five samples collected
consisted of a total of 100 clasts. They were dried at 80 ºC for approximately 24 hours. The
clasts were then numbered 1 to 100 from smallest to largest.
Archimedes’ Principle was used to determine the sample densities by weighing the
individual clasts in both air and water. Archimedes’ Principle states that the buoyant force
exerted on an object submerged in water is equal to the weight of the water displaced by
that object. Since 1ml of water is approximately 1 g at the laboratory conditions (1 atm
pressure and 4 ºC), the volume of an object can be calculated and therefore, in conjunction
with the air-weight of the object the density of the clast can be determined.
Density is calculated by dividing the mass of an object by its volume, as follows:
𝜌 = 𝑚𝑣⁄
where, ρ is the density (g cm-3
), m is the mass (g), and v is the volume (ml).
Individual clast densities were obtained by weighing the clast in air to ±0.01 g. The clasts
were then each wrapped in squares of Parafilm Wrap PM996 to render a waterproof
barrier, thus sealing vesicles in the clasts. The parafilm wax was chosen as it is both
malleable to the clasts surface and it has a known density. The quantity of wax used and
23
the weight in water of each clast were recorded. If a clast floated, it was weighed down
with a small ballast, whose weight was also recorded and subsequently subtracted from the
measured weight.
The specific gravity of each clast was calculated using the following equation:
𝑆𝐺𝑐 =𝑤𝑎
𝑤𝑎 − [𝑤𝑤 − 𝑤𝑏 + (𝑤𝑓𝑛𝑓)]
where, SGc is the specific gravity of the clast, wa is the weight of the clast in air (g), ww is
the weight of the clast in water (g), wb is the weight of the ballast (g), wf is the weight of
the wax (g), and nf is the number of wax squares used on the clast.
Using the specific gravity (SGc), the density of each clast was calculated using the
equation:
𝜌𝑐 = 𝑆𝐺𝑐𝜌𝑤
where, ρc is the density of the clast (g cm-3
) and ρw is the density of water (g cm
-3).
Density was then converted to bulk vesicularity using:
𝑉 =100(𝜌𝐷𝑅𝐸 − 𝜌𝑐)
𝜌𝐷𝑅𝐸
where V is the vesicularity (%) and ρDRE is the dense rock equivalent value (g cm-3
).
The dense rock equivalent, or DRE, is based on a non-vesicular juvenile clast of tephra.
For this study, 2900 g cm-3
was used based on calculations (Silver et al., 1990) made from
the chemical components of the Nesjahraun sample from Sinton et al. (2005), assuming no
water content.
Uncertainty within the density measurements, and therefore bulk vesicularity calculations,
originate from the human error of measurement and recording, insufficient application of
wax wrapping, and weighing down floating clasts correctly. Such uncertainties were
minimized by careful arrangement of clasts in size order, attentive wrapping of the clasts in
wax to cover all vesicles, and by using a ballast of known weight to hold down any floating
clasts during measurement, respectively.
The density values of the total clasts per sample were binned to obtain density
measurement frequencies that were then graphed in histograms and used to select
representative clasts for subsequent vesicle size distribution analyses.
5.4 Vesicularity Measurements
5.4.1 Thin Sections and Observations
The representative clasts were sent to the Institute of Earth Science technician and polished
thin sections approximately 100 μm thick were made. Using a Zeiss Primotech binocular
24
microscope, the samples were examined for microscopic features such as composition,
texture, microstructure and other basic observations. Minor discrepancies in relation to the
mineral composition can be associated with the thickness of the thin sections. Observations
in polarised light are skewed in thicker samples, causing some minerals to reflect features
of others. From these thin sections, two clasts from the primary fissure vent and two clasts
from the RC samples were chosen for further analyses based on several factors. Firstly, to
obtain a reliable comparison between the PC tephra and RC tephra, clasts from the modal
density bins were chosen. Time constraints resulted in the selection of a high-density clast
from the PC sample and a low-density clast from the RC sample, to compare within the
separate sample groups. Clasts were also required to be large enough to obtain a
representative number of image nests and the clasts needed to be free of foreign, unrelated
material, which would skew results of the vesicle size analyses.
5.4.2 Image Strategy and Acquisition
Nested images of each thin section were acquired (Fig. 5.2) over five magnifications for
the primary hybrid cone samples and four magnifications for the RC samples using
methods outlined in Shea et al. (2010). Images at the first level of magnification (c. 5×)
were acquired using an HP Scanjet G4050 desktop scanner at 1200 dpi. Following this, the
thin sections were returned to the IES technician to be carbon coated for use in the
scanning electron microscope (SEM). The coating is necessary as it increases the electrical
conductivity of the sample, which is required for the imaging process. Using a Hitachi
TM3000 SEM with 15kV acceleration voltage at the University of Iceland, backscattered
electron (BSE) images were obtained in accordance with the exponential nested image
strategy outlined by Shea et al. (2010), with minor modifications. Images at 50×, 100×,
250×, and 500× magnification were acquired for both primary hybrid cone samples and the
modal-density Grámelur sample, and 50×, 100×, and 250× magnification images were
collected for the low-density Grámelur sample. This was to ensure an adequate coverage of
vesicles within each sample, while also keeping in mind time restraints for the study.
Considerations were made for the homogeneity of the individual clasts, the time needed to
acquire and rectify the images, the range of vesicle sizes, the acceptable error percentage,
the number of vesicles per image, and the overlap of vesicle sizes between images. The
primary hybrid samples showed more complex vesicle populations with an increase in
smaller vesicles compared to the Grámelur samples, and therefore required a larger number
of images to ensure adequate coverage (NV141016-01b-89: 49 images, NV141016-01b-
91: 43 images, NC141016-02b-07: 21 images, and NC141016-02b-93: 43 images).
5.4.3 Image Rectification
The BSE images were rectified using the free and open-source raster graphics editor GNU
Image Manipulation Program (GIMP). The images collected at 50× magnification level
were manually stitched to form a single image, covering approximately the area
representative of a single image at 25 magnification (henceforth referred to as 25×). The
greyscale images were then turned binary using the threshold tool where vesicles were
made black and melt films (vesicle walls) were made white (step 2, Fig. 5.3). This process
minimises the amount of processing time required per image. However, this process cannot
be used for the scanned images as they are too complex. These images are instead turned
binary by manually tracing the outlines of the clast and vesicles, then filling in areas with
either black or white depending on the feature. Subsequently, the images were ‘cleaned’ to
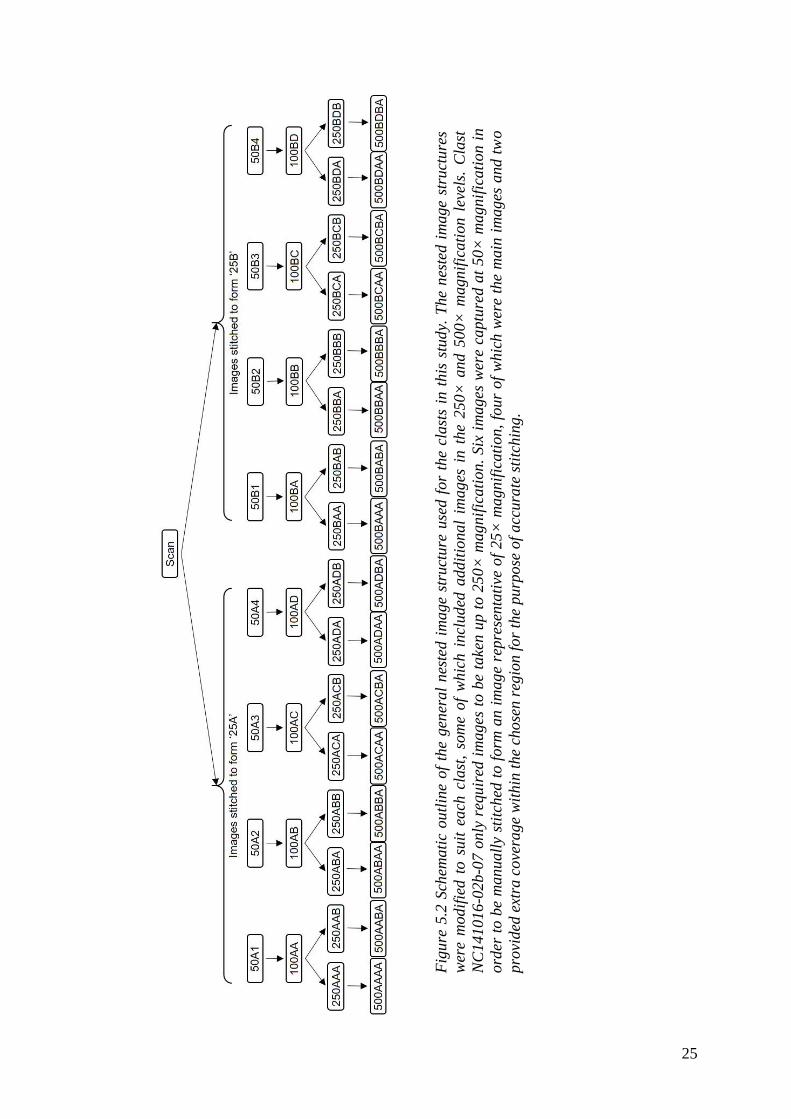
25
Fig
ure
5.2
Sch
emati
c ou
tlin
e of
the
gen
eral
nes
ted i
mage
stru
cture
use
d f
or
the
clast
s in
this
stu
dy.
The
nes
ted i
mage
stru
cture
s
wer
e m
odif
ied t
o s
uit
ea
ch c
last
, so
me
of
whic
h i
ncl
uded
addit
ional
images
in t
he
250×
and 5
00×
magnif
icati
on l
evel
s. C
last
NC
141016
-02b-0
7 o
nly
req
uir
ed i
mag
es t
o b
e ta
ken u
p t
o 2
50
× m
ag
nif
icati
on
. Six
im
ag
es w
ere
captu
red a
t 50
× m
ag
nif
icati
on
in
ord
er t
o b
e m
anuall
y st
itch
ed t
o f
orm
an i
mag
e re
pre
senta
tive
of
25
× m
agnif
icati
on,
four
of
whic
h w
ere
the
main
im
ages
and t
wo
pro
vided
ext
ra c
ove
rage
wit
hin
the
cho
sen
reg
ion
for
the
purp
ose
of
acc
ura
te s
titc
hin
g.
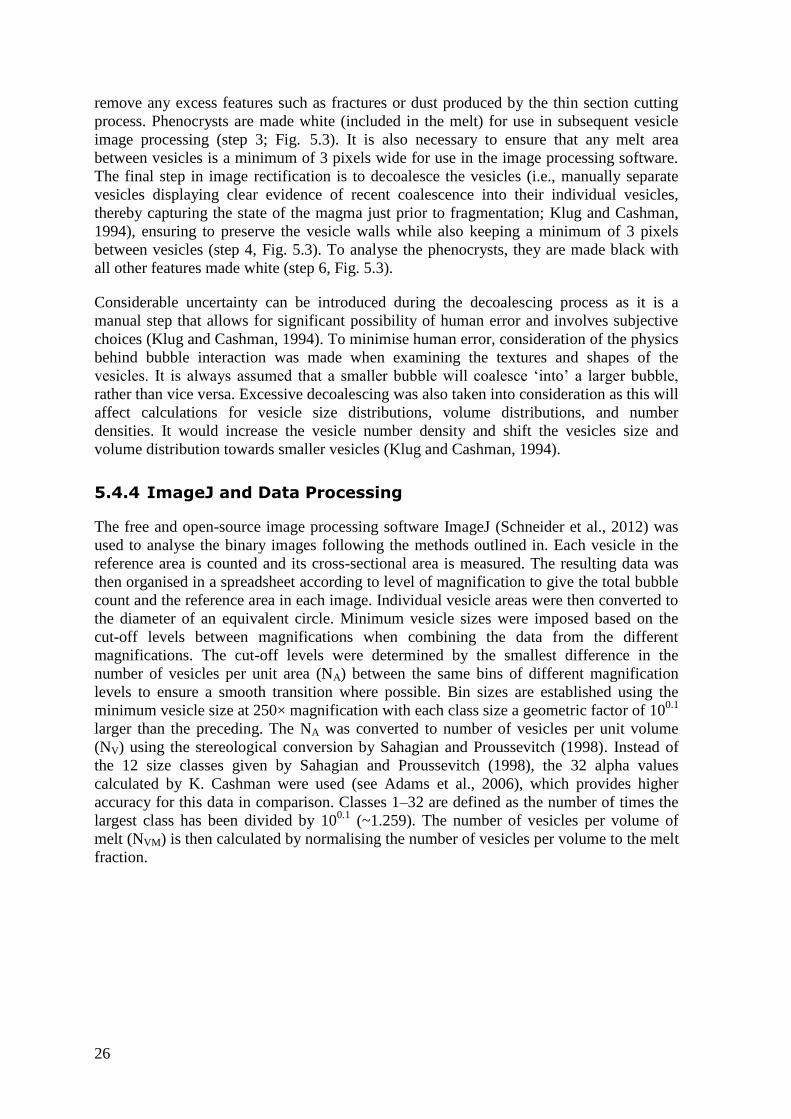
26
remove any excess features such as fractures or dust produced by the thin section cutting
process. Phenocrysts are made white (included in the melt) for use in subsequent vesicle
image processing (step 3; Fig. 5.3). It is also necessary to ensure that any melt area
between vesicles is a minimum of 3 pixels wide for use in the image processing software.
The final step in image rectification is to decoalesce the vesicles (i.e., manually separate
vesicles displaying clear evidence of recent coalescence into their individual vesicles,
thereby capturing the state of the magma just prior to fragmentation; Klug and Cashman,
1994), ensuring to preserve the vesicle walls while also keeping a minimum of 3 pixels
between vesicles (step 4, Fig. 5.3). To analyse the phenocrysts, they are made black with
all other features made white (step 6, Fig. 5.3).
Considerable uncertainty can be introduced during the decoalescing process as it is a
manual step that allows for significant possibility of human error and involves subjective
choices (Klug and Cashman, 1994). To minimise human error, consideration of the physics
behind bubble interaction was made when examining the textures and shapes of the
vesicles. It is always assumed that a smaller bubble will coalesce ‘into’ a larger bubble,
rather than vice versa. Excessive decoalescing was also taken into consideration as this will
affect calculations for vesicle size distributions, volume distributions, and number
densities. It would increase the vesicle number density and shift the vesicles size and
volume distribution towards smaller vesicles (Klug and Cashman, 1994).
5.4.4 ImageJ and Data Processing
The free and open-source image processing software ImageJ (Schneider et al., 2012) was
used to analyse the binary images following the methods outlined in. Each vesicle in the
reference area is counted and its cross-sectional area is measured. The resulting data was
then organised in a spreadsheet according to level of magnification to give the total bubble
count and the reference area in each image. Individual vesicle areas were then converted to
the diameter of an equivalent circle. Minimum vesicle sizes were imposed based on the
cut-off levels between magnifications when combining the data from the different
magnifications. The cut-off levels were determined by the smallest difference in the
number of vesicles per unit area (NA) between the same bins of different magnification
levels to ensure a smooth transition where possible. Bin sizes are established using the
minimum vesicle size at 250× magnification with each class size a geometric factor of 100.1
larger than the preceding. The NA was converted to number of vesicles per unit volume
(NV) using the stereological conversion by Sahagian and Proussevitch (1998). Instead of
the 12 size classes given by Sahagian and Proussevitch (1998), the 32 alpha values
calculated by K. Cashman were used (see Adams et al., 2006), which provides higher
accuracy for this data in comparison. Classes 1–32 are defined as the number of times the
largest class has been divided by 100.1
(~1.259). The number of vesicles per volume of
melt (NVM) is then calculated by normalising the number of vesicles per volume to the melt
fraction.
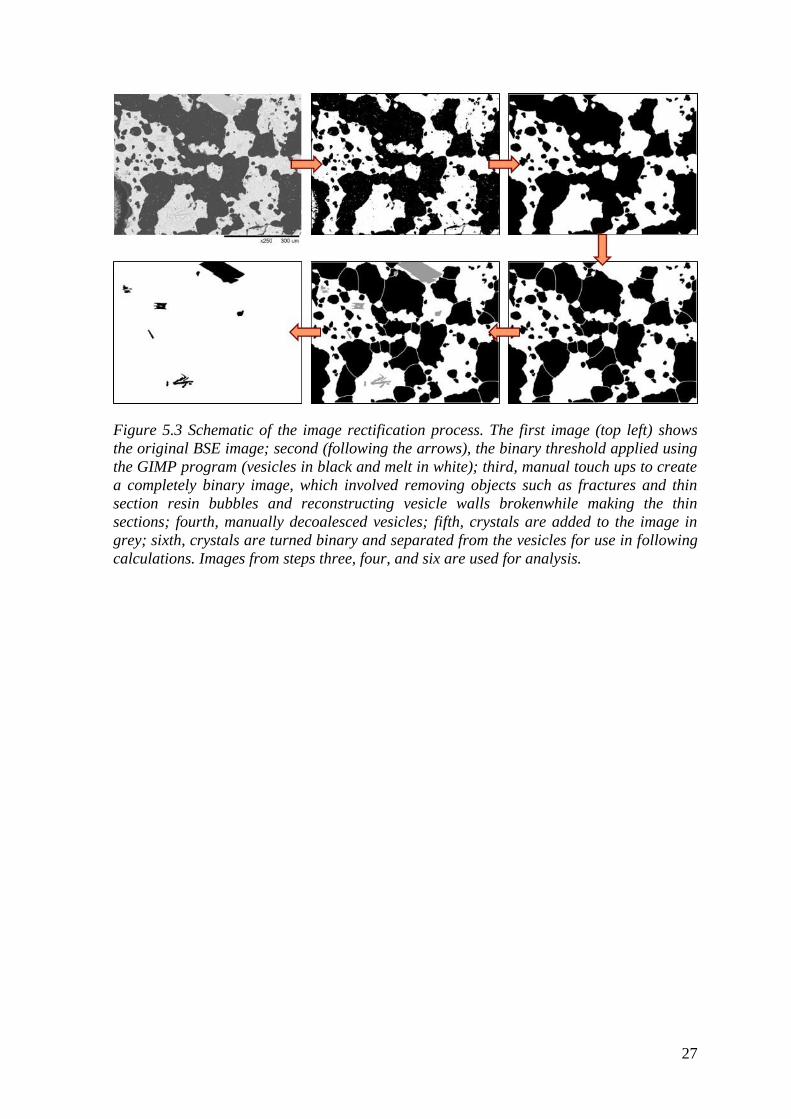
27
Figure 5.3 Schematic of the image rectification process. The first image (top left) shows
the original BSE image; second (following the arrows), the binary threshold applied using
the GIMP program (vesicles in black and melt in white); third, manual touch ups to create
a completely binary image, which involved removing objects such as fractures and thin
section resin bubbles and reconstructing vesicle walls brokenwhile making the thin
sections; fourth, manually decoalesced vesicles; fifth, crystals are added to the image in
grey; sixth, crystals are turned binary and separated from the vesicles for use in following
calculations. Images from steps three, four, and six are used for analysis.

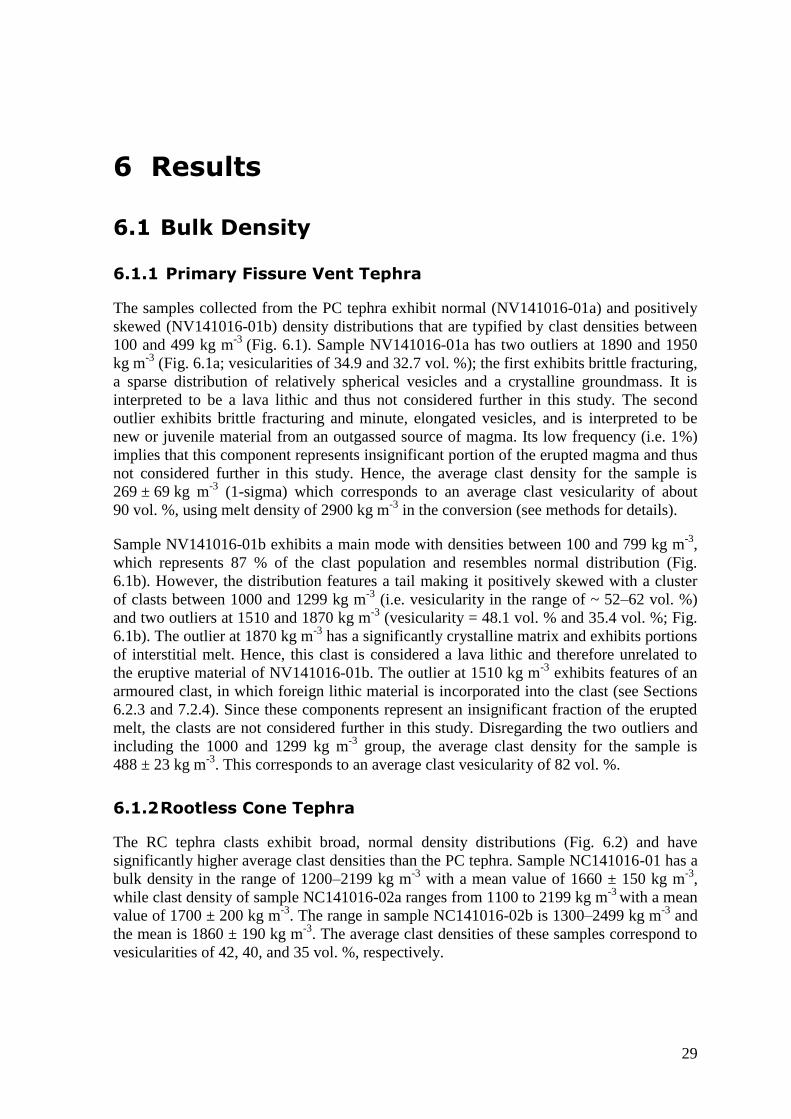
29
6 Results
6.1 Bulk Density
6.1.1 Primary Fissure Vent Tephra
The samples collected from the PC tephra exhibit normal (NV141016-01a) and positively
skewed (NV141016-01b) density distributions that are typified by clast densities between
100 and 499 kg m-3
(Fig. 6.1). Sample NV141016-01a has two outliers at 1890 and 1950
kg m-3
(Fig. 6.1a; vesicularities of 34.9 and 32.7 vol. %); the first exhibits brittle fracturing,
a sparse distribution of relatively spherical vesicles and a crystalline groundmass. It is
interpreted to be a lava lithic and thus not considered further in this study. The second
outlier exhibits brittle fracturing and minute, elongated vesicles, and is interpreted to be
new or juvenile material from an outgassed source of magma. Its low frequency (i.e. 1%)
implies that this component represents insignificant portion of the erupted magma and thus
not considered further in this study. Hence, the average clast density for the sample is
269 ± 69 kg m-3
(1-sigma) which corresponds to an average clast vesicularity of about
90 vol. %, using melt density of 2900 kg m-3
in the conversion (see methods for details).
Sample NV141016-01b exhibits a main mode with densities between 100 and 799 kg m-3
,
which represents 87 % of the clast population and resembles normal distribution (Fig.
6.1b). However, the distribution features a tail making it positively skewed with a cluster
of clasts between 1000 and 1299 kg m-3
(i.e. vesicularity in the range of ~ 52–62 vol. %)
and two outliers at 1510 and 1870 kg m-3
(vesicularity = 48.1 vol. % and 35.4 vol. %; Fig.
6.1b). The outlier at 1870 kg m-3
has a significantly crystalline matrix and exhibits portions
of interstitial melt. Hence, this clast is considered a lava lithic and therefore unrelated to
the eruptive material of NV141016-01b. The outlier at 1510 kg m-3
exhibits features of an
armoured clast, in which foreign lithic material is incorporated into the clast (see Sections
6.2.3 and 7.2.4). Since these components represent an insignificant fraction of the erupted
melt, the clasts are not considered further in this study. Disregarding the two outliers and
including the 1000 and 1299 kg m-3
group, the average clast density for the sample is
488 ± 23 kg m-3
. This corresponds to an average clast vesicularity of 82 vol. %.
6.1.2 Rootless Cone Tephra
The RC tephra clasts exhibit broad, normal density distributions (Fig. 6.2) and have
significantly higher average clast densities than the PC tephra. Sample NC141016-01 has a
bulk density in the range of 1200–2199 kg m-3
with a mean value of 1660 ± 150 kg m-3
,
while clast density of sample NC141016-02a ranges from 1100 to 2199 kg m-3
with a mean
value of 1700 ± 200 kg m-3
. The range in sample NC141016-02b is 1300–2499 kg m-3
and
the mean is 1860 ± 190 kg m-3
. The average clast densities of these samples correspond to
vesicularities of 42, 40, and 35 vol. %, respectively.
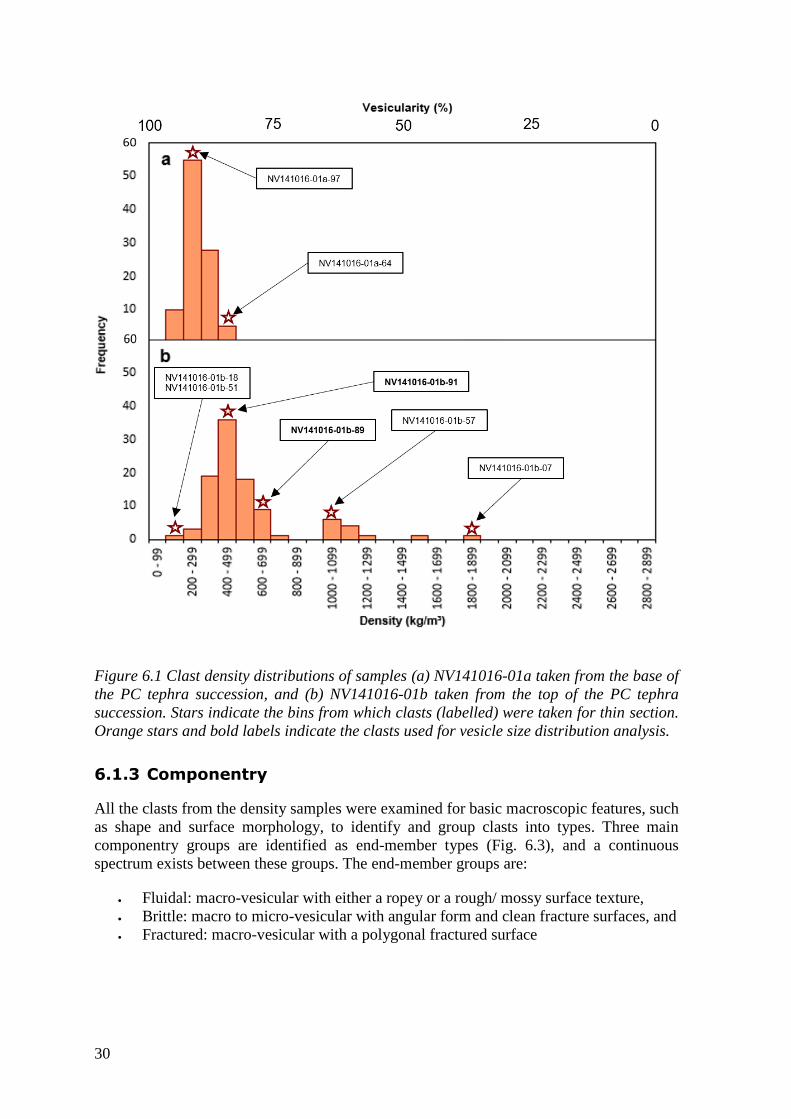
30
Figure 6.1 Clast density distributions of samples (a) NV141016-01a taken from the base of
the PC tephra succession, and (b) NV141016-01b taken from the top of the PC tephra
succession. Stars indicate the bins from which clasts (labelled) were taken for thin section.
Orange stars and bold labels indicate the clasts used for vesicle size distribution analysis.
6.1.3 Componentry
All the clasts from the density samples were examined for basic macroscopic features, such
as shape and surface morphology, to identify and group clasts into types. Three main
componentry groups are identified as end-member types (Fig. 6.3), and a continuous
spectrum exists between these groups. The end-member groups are:
Fluidal: macro-vesicular with either a ropey or a rough/ mossy surface texture,
Brittle: macro to micro-vesicular with angular form and clean fracture surfaces, and
Fractured: macro-vesicular with a polygonal fractured surface
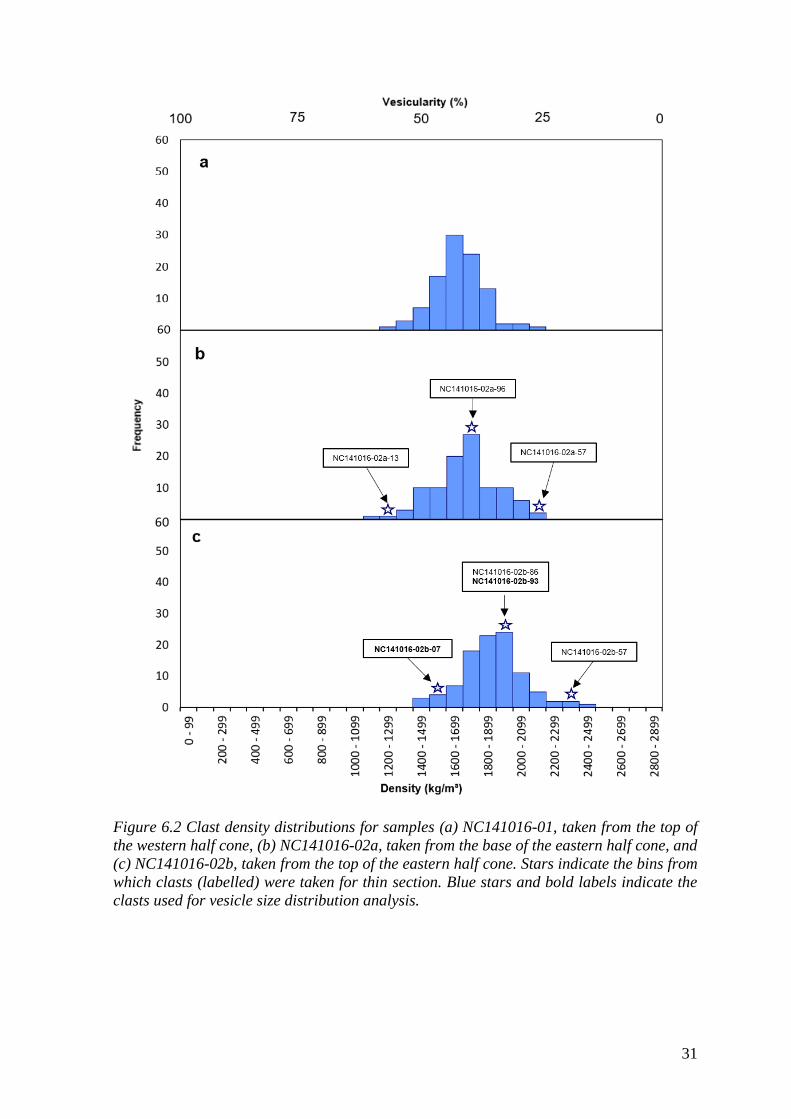
31
Figure 6.2 Clast density distributions for samples (a) NC141016-01, taken from the top of
the western half cone, (b) NC141016-02a, taken from the base of the eastern half cone, and
(c) NC141016-02b, taken from the top of the eastern half cone. Stars indicate the bins from
which clasts (labelled) were taken for thin section. Blue stars and bold labels indicate the
clasts used for vesicle size distribution analysis.
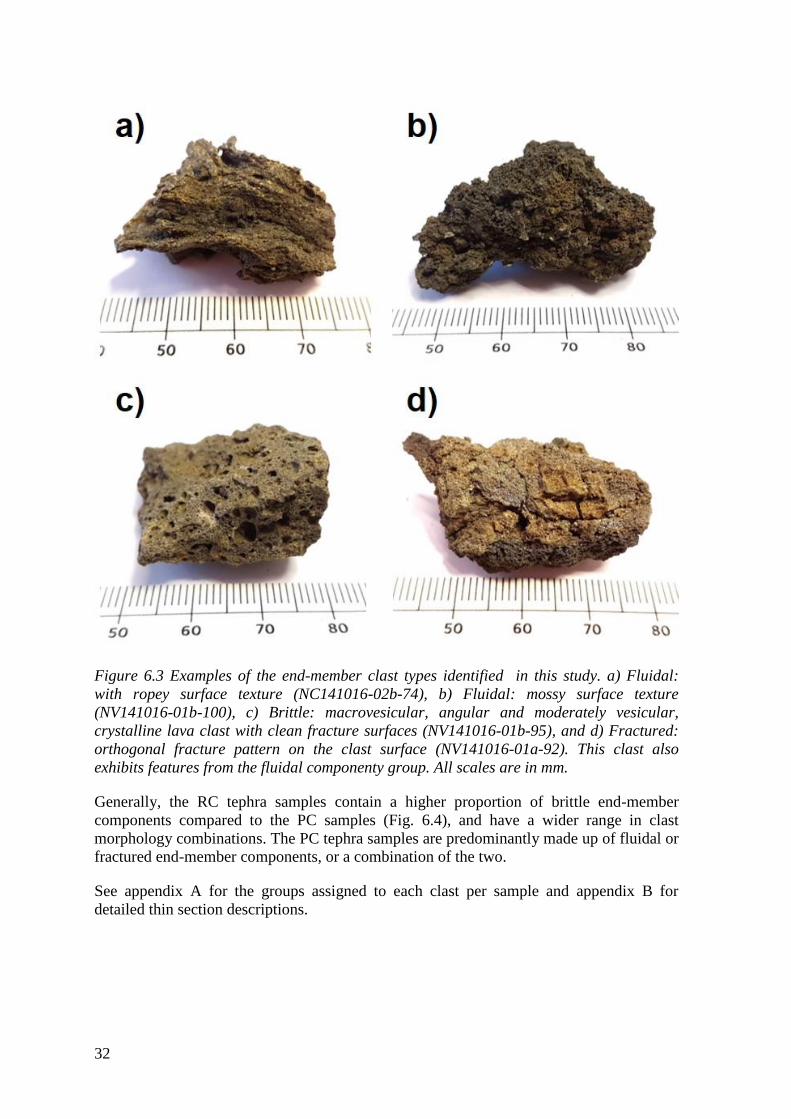
32
Figure 6.3 Examples of the end-member clast types identified in this study. a) Fluidal:
with ropey surface texture (NC141016-02b-74), b) Fluidal: mossy surface texture
(NV141016-01b-100), c) Brittle: macrovesicular, angular and moderately vesicular,
crystalline lava clast with clean fracture surfaces (NV141016-01b-95), and d) Fractured:
orthogonal fracture pattern on the clast surface (NV141016-01a-92). This clast also
exhibits features from the fluidal componenty group. All scales are in mm.
Generally, the RC tephra samples contain a higher proportion of brittle end-member
components compared to the PC samples (Fig. 6.4), and have a wider range in clast
morphology combinations. The PC tephra samples are predominantly made up of fluidal or
fractured end-member components, or a combination of the two.
See appendix A for the groups assigned to each clast per sample and appendix B for
detailed thin section descriptions.
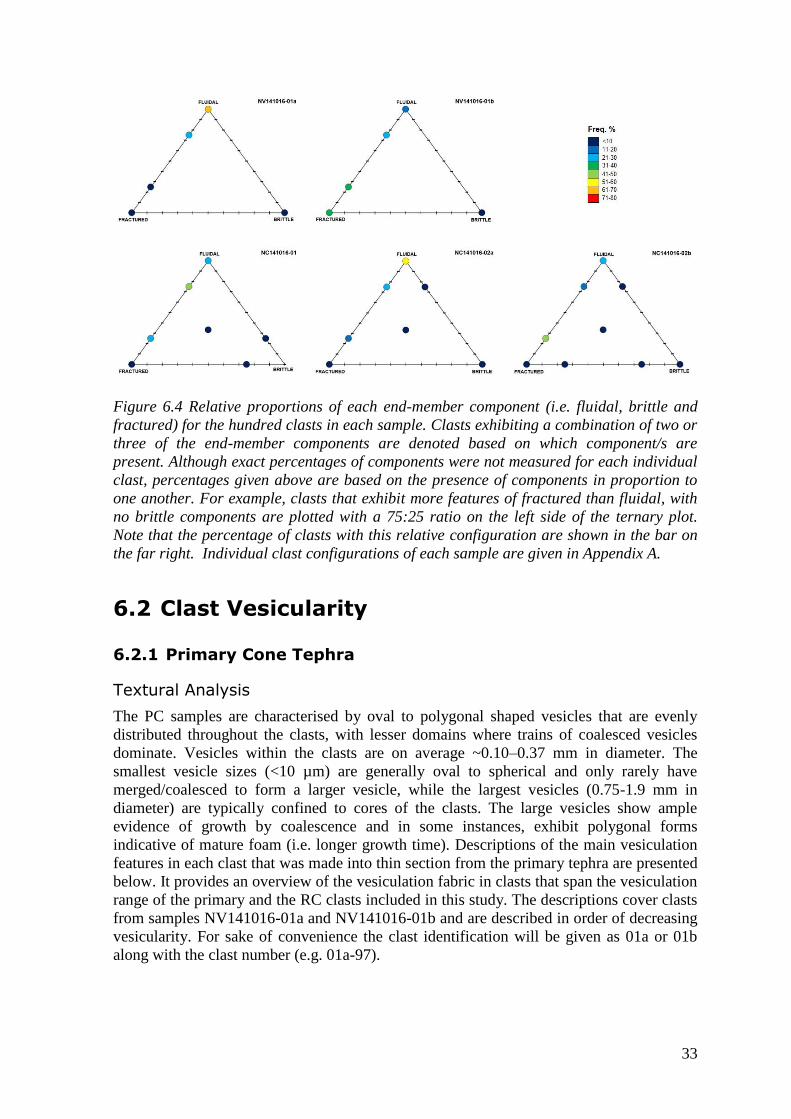
33
Figure 6.4 Relative proportions of each end-member component (i.e. fluidal, brittle and
fractured) for the hundred clasts in each sample. Clasts exhibiting a combination of two or
three of the end-member components are denoted based on which component/s are
present. Although exact percentages of components were not measured for each individual
clast, percentages given above are based on the presence of components in proportion to
one another. For example, clasts that exhibit more features of fractured than fluidal, with
no brittle components are plotted with a 75:25 ratio on the left side of the ternary plot.
Note that the percentage of clasts with this relative configuration are shown in the bar on
the far right. Individual clast configurations of each sample are given in Appendix A.
6.2 Clast Vesicularity
6.2.1 Primary Cone Tephra
Textural Analysis
The PC samples are characterised by oval to polygonal shaped vesicles that are evenly
distributed throughout the clasts, with lesser domains where trains of coalesced vesicles
dominate. Vesicles within the clasts are on average ~0.10–0.37 mm in diameter. The
smallest vesicle sizes (<10 µm) are generally oval to spherical and only rarely have
merged/coalesced to form a larger vesicle, while the largest vesicles (0.75-1.9 mm in
diameter) are typically confined to cores of the clasts. The large vesicles show ample
evidence of growth by coalescence and in some instances, exhibit polygonal forms
indicative of mature foam (i.e. longer growth time). Descriptions of the main vesiculation
features in each clast that was made into thin section from the primary tephra are presented
below. It provides an overview of the vesiculation fabric in clasts that span the vesiculation
range of the primary and the RC clasts included in this study. The descriptions cover clasts
from samples NV141016-01a and NV141016-01b and are described in order of decreasing
vesicularity. For sake of convenience the clast identification will be given as 01a or 01b
along with the clast number (e.g. 01a-97).
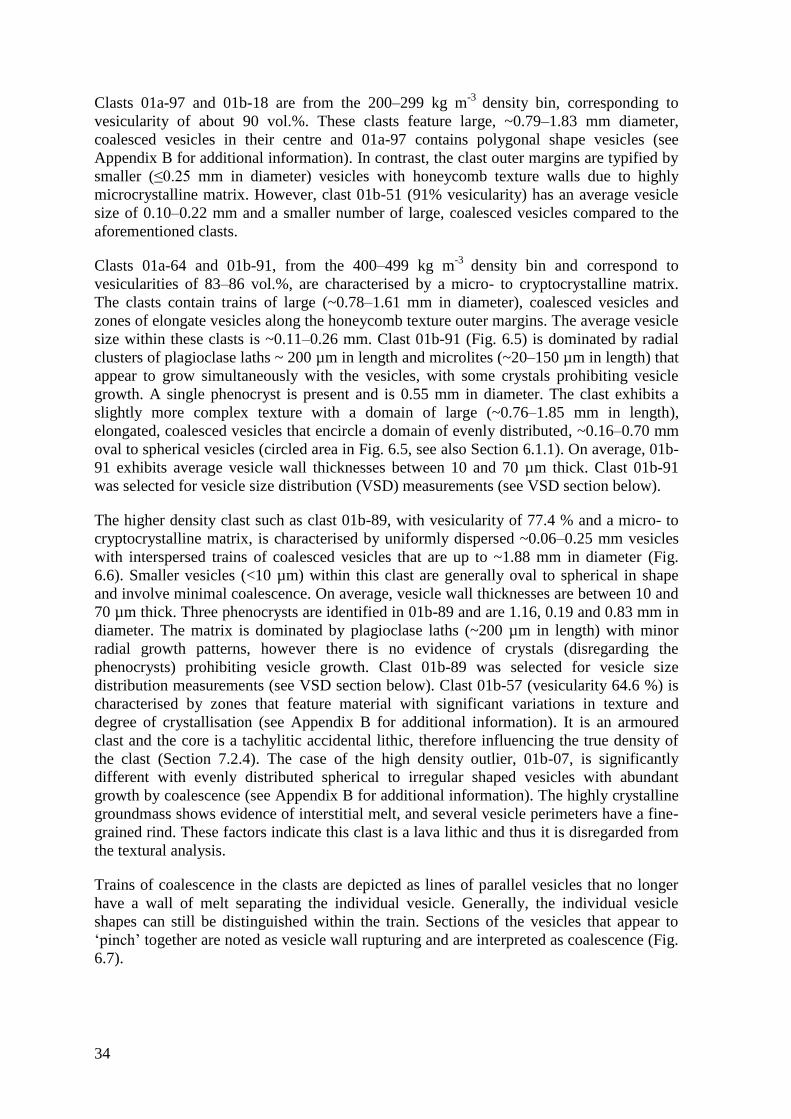
34
Clasts 01a-97 and 01b-18 are from the 200–299 kg m-3
density bin, corresponding to
vesicularity of about 90 vol.%. These clasts feature large, ~0.79–1.83 mm diameter,
coalesced vesicles in their centre and 01a-97 contains polygonal shape vesicles (see
Appendix B for additional information). In contrast, the clast outer margins are typified by
smaller (≤0.25 mm in diameter) vesicles with honeycomb texture walls due to highly
microcrystalline matrix. However, clast 01b-51 (91% vesicularity) has an average vesicle
size of 0.10–0.22 mm and a smaller number of large, coalesced vesicles compared to the
aforementioned clasts.
Clasts 01a-64 and 01b-91, from the 400–499 kg m-3
density bin and correspond to
vesicularities of 83–86 vol.%, are characterised by a micro- to cryptocrystalline matrix.
The clasts contain trains of large (~0.78–1.61 mm in diameter), coalesced vesicles and
zones of elongate vesicles along the honeycomb texture outer margins. The average vesicle
size within these clasts is ~0.11–0.26 mm. Clast 01b-91 (Fig. 6.5) is dominated by radial
clusters of plagioclase laths ~ 200 µm in length and microlites (~20–150 µm in length) that
appear to grow simultaneously with the vesicles, with some crystals prohibiting vesicle
growth. A single phenocryst is present and is 0.55 mm in diameter. The clast exhibits a
slightly more complex texture with a domain of large (~0.76–1.85 mm in length),
elongated, coalesced vesicles that encircle a domain of evenly distributed, ~0.16–0.70 mm
oval to spherical vesicles (circled area in Fig. 6.5, see also Section 6.1.1). On average, 01b-
91 exhibits average vesicle wall thicknesses between 10 and 70 µm thick. Clast 01b-91
was selected for vesicle size distribution (VSD) measurements (see VSD section below).
The higher density clast such as clast 01b-89, with vesicularity of 77.4 % and a micro- to
cryptocrystalline matrix, is characterised by uniformly dispersed ~0.06–0.25 mm vesicles
with interspersed trains of coalesced vesicles that are up to ~1.88 mm in diameter (Fig.
6.6). Smaller vesicles (<10 µm) within this clast are generally oval to spherical in shape
and involve minimal coalescence. On average, vesicle wall thicknesses are between 10 and
70 µm thick. Three phenocrysts are identified in 01b-89 and are 1.16, 0.19 and 0.83 mm in
diameter. The matrix is dominated by plagioclase laths (~200 µm in length) with minor
radial growth patterns, however there is no evidence of crystals (disregarding the
phenocrysts) prohibiting vesicle growth. Clast 01b-89 was selected for vesicle size
distribution measurements (see VSD section below). Clast 01b-57 (vesicularity 64.6 %) is
characterised by zones that feature material with significant variations in texture and
degree of crystallisation (see Appendix B for additional information). It is an armoured
clast and the core is a tachylitic accidental lithic, therefore influencing the true density of
the clast (Section 7.2.4). The case of the high density outlier, 01b-07, is significantly
different with evenly distributed spherical to irregular shaped vesicles with abundant
growth by coalescence (see Appendix B for additional information). The highly crystalline
groundmass shows evidence of interstitial melt, and several vesicle perimeters have a fine-
grained rind. These factors indicate this clast is a lava lithic and thus it is disregarded from
the textural analysis.
Trains of coalescence in the clasts are depicted as lines of parallel vesicles that no longer
have a wall of melt separating the individual vesicle. Generally, the individual vesicle
shapes can still be distinguished within the train. Sections of the vesicles that appear to
‘pinch’ together are noted as vesicle wall rupturing and are interpreted as coalescence (Fig.
6.7).
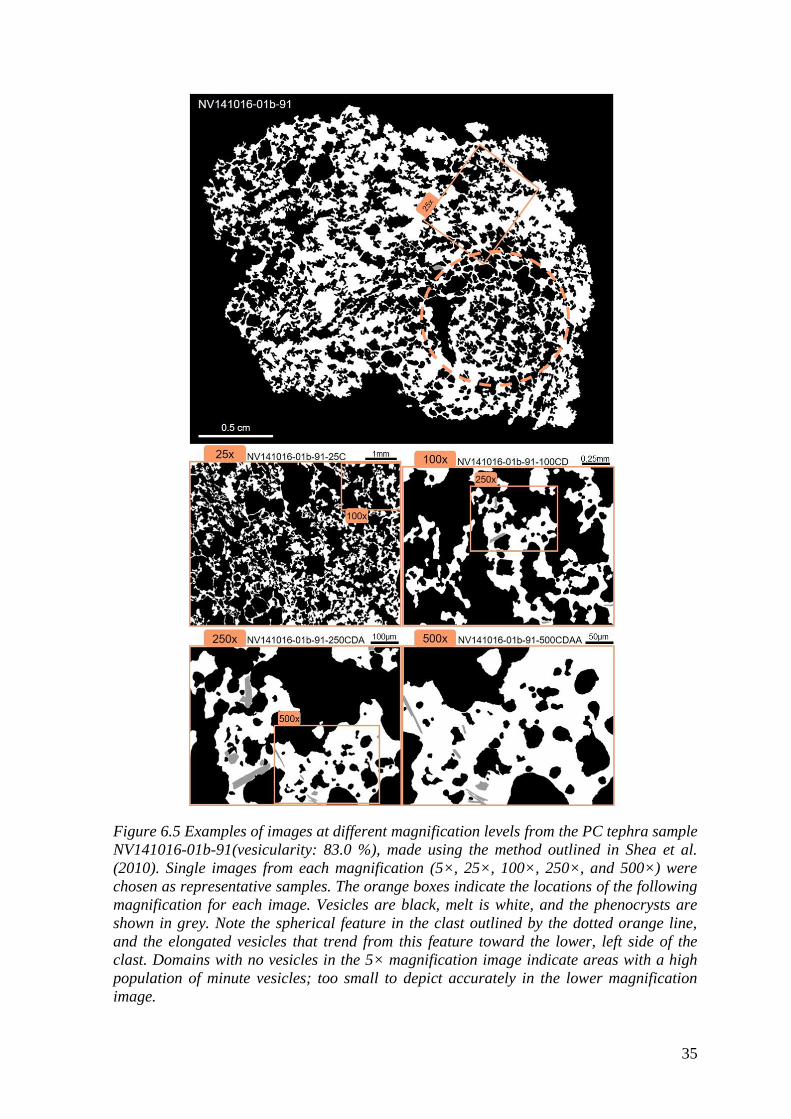
35
Figure 6.5 Examples of images at different magnification levels from the PC tephra sample
NV141016-01b-91(vesicularity: 83.0 %), made using the method outlined in Shea et al.
(2010). Single images from each magnification (5×, 25×, 100×, 250×, and 500×) were
chosen as representative samples. The orange boxes indicate the locations of the following
magnification for each image. Vesicles are black, melt is white, and the phenocrysts are
shown in grey. Note the spherical feature in the clast outlined by the dotted orange line,
and the elongated vesicles that trend from this feature toward the lower, left side of the
clast. Domains with no vesicles in the 5× magnification image indicate areas with a high
population of minute vesicles; too small to depict accurately in the lower magnification
image.
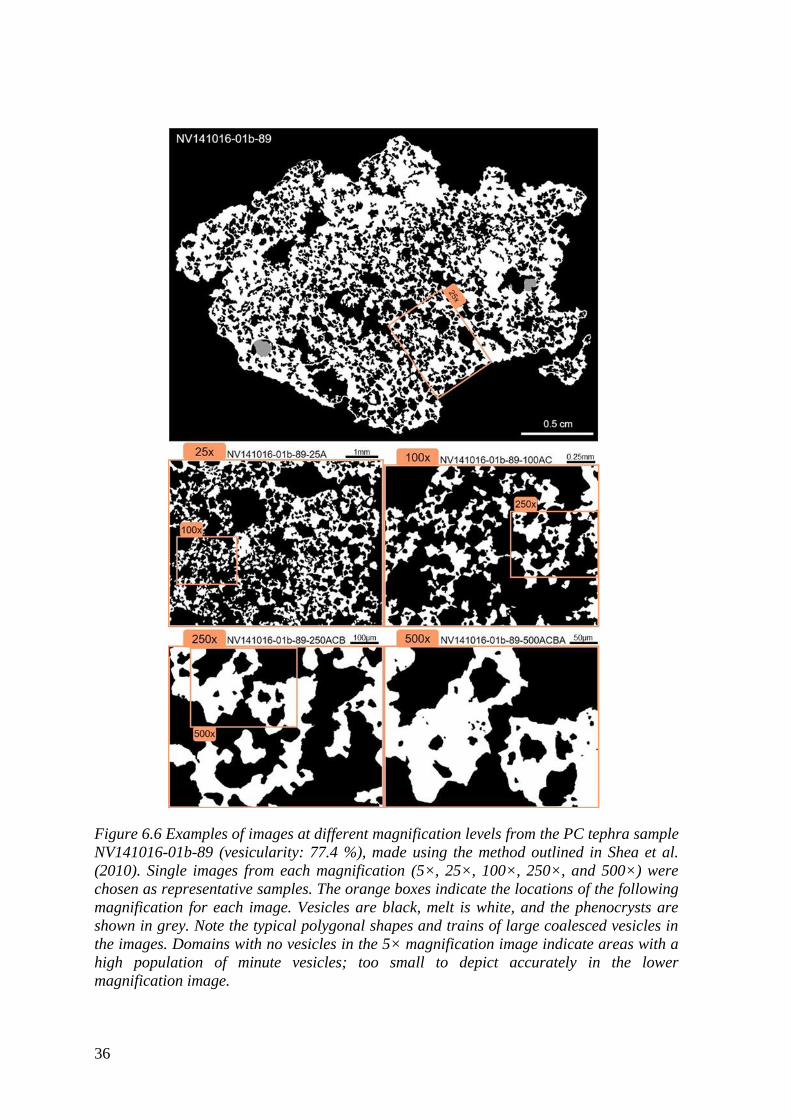
36
Figure 6.6 Examples of images at different magnification levels from the PC tephra sample
NV141016-01b-89 (vesicularity: 77.4 %), made using the method outlined in Shea et al.
(2010). Single images from each magnification (5×, 25×, 100×, 250×, and 500×) were
chosen as representative samples. The orange boxes indicate the locations of the following
magnification for each image. Vesicles are black, melt is white, and the phenocrysts are
shown in grey. Note the typical polygonal shapes and trains of large coalesced vesicles in
the images. Domains with no vesicles in the 5× magnification image indicate areas with a
high population of minute vesicles; too small to depict accurately in the lower
magnification image.
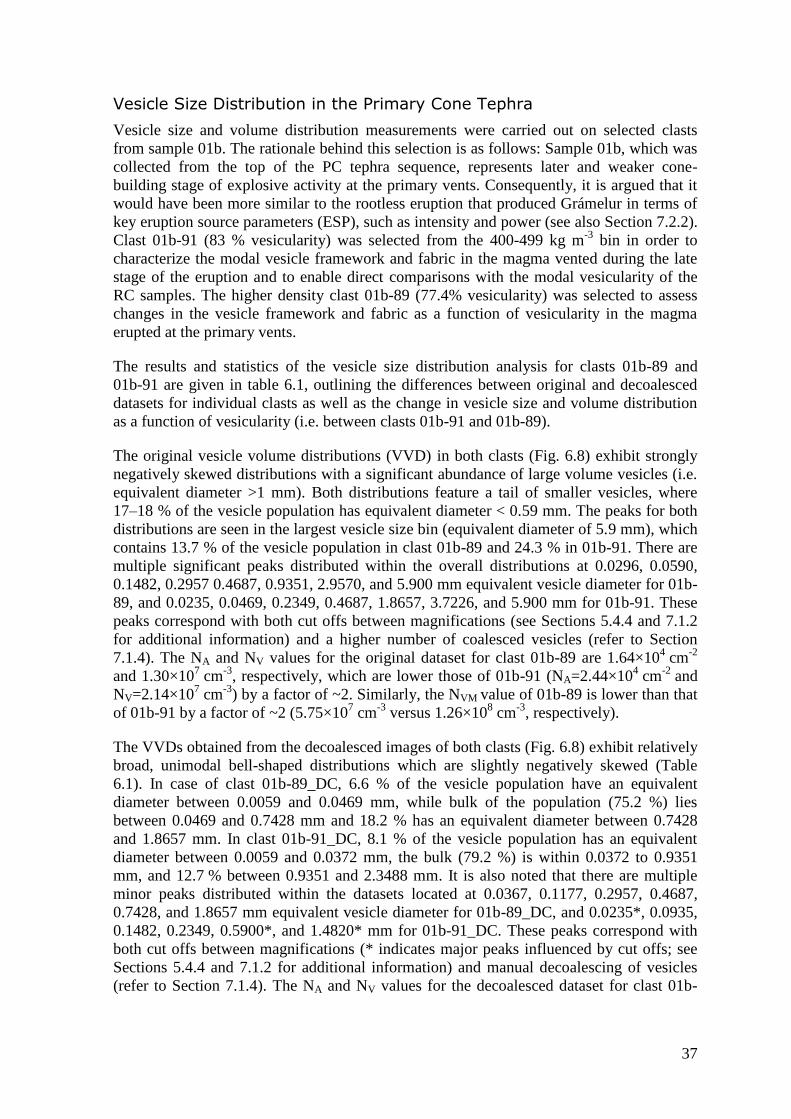
37
Vesicle Size Distribution in the Primary Cone Tephra
Vesicle size and volume distribution measurements were carried out on selected clasts
from sample 01b. The rationale behind this selection is as follows: Sample 01b, which was
collected from the top of the PC tephra sequence, represents later and weaker cone-
building stage of explosive activity at the primary vents. Consequently, it is argued that it
would have been more similar to the rootless eruption that produced Grámelur in terms of
key eruption source parameters (ESP), such as intensity and power (see also Section 7.2.2).
Clast 01b-91 (83 % vesicularity) was selected from the 400-499 kg m-3
bin in order to
characterize the modal vesicle framework and fabric in the magma vented during the late
stage of the eruption and to enable direct comparisons with the modal vesicularity of the
RC samples. The higher density clast 01b-89 (77.4% vesicularity) was selected to assess
changes in the vesicle framework and fabric as a function of vesicularity in the magma
erupted at the primary vents.
The results and statistics of the vesicle size distribution analysis for clasts 01b-89 and
01b-91 are given in table 6.1, outlining the differences between original and decoalesced
datasets for individual clasts as well as the change in vesicle size and volume distribution
as a function of vesicularity (i.e. between clasts 01b-91 and 01b-89).
The original vesicle volume distributions (VVD) in both clasts (Fig. 6.8) exhibit strongly
negatively skewed distributions with a significant abundance of large volume vesicles (i.e.
equivalent diameter >1 mm). Both distributions feature a tail of smaller vesicles, where
17–18 % of the vesicle population has equivalent diameter < 0.59 mm. The peaks for both
distributions are seen in the largest vesicle size bin (equivalent diameter of 5.9 mm), which
contains 13.7 % of the vesicle population in clast 01b-89 and 24.3 % in 01b-91. There are
multiple significant peaks distributed within the overall distributions at 0.0296, 0.0590,
0.1482, 0.2957 0.4687, 0.9351, 2.9570, and 5.900 mm equivalent vesicle diameter for 01b-
89, and 0.0235, 0.0469, 0.2349, 0.4687, 1.8657, 3.7226, and 5.900 mm for 01b-91. These
peaks correspond with both cut offs between magnifications (see Sections 5.4.4 and 7.1.2
for additional information) and a higher number of coalesced vesicles (refer to Section
7.1.4). The NA and NV values for the original dataset for clast 01b-89 are 1.64×104 cm
-2
and 1.30×107 cm
-3, respectively, which are lower those of 01b-91 (NA=2.44×10
4 cm
-2 and
NV=2.14×107 cm
-3) by a factor of ~2. Similarly, the NVM value of 01b-89 is lower than that
of 01b-91 by a factor of ~2 (5.75×107 cm
-3 versus 1.26×10
8 cm
-3, respectively).
The VVDs obtained from the decoalesced images of both clasts (Fig. 6.8) exhibit relatively
broad, unimodal bell-shaped distributions which are slightly negatively skewed (Table
6.1). In case of clast 01b-89_DC, 6.6 % of the vesicle population have an equivalent
diameter between 0.0059 and 0.0469 mm, while bulk of the population (75.2 %) lies
between 0.0469 and 0.7428 mm and 18.2 % has an equivalent diameter between 0.7428
and 1.8657 mm. In clast 01b-91_DC, 8.1 % of the vesicle population has an equivalent
diameter between 0.0059 and 0.0372 mm, the bulk (79.2 %) is within 0.0372 to 0.9351
mm, and 12.7 % between 0.9351 and 2.3488 mm. It is also noted that there are multiple
minor peaks distributed within the datasets located at 0.0367, 0.1177, 0.2957, 0.4687,
0.7428, and 1.8657 mm equivalent vesicle diameter for 01b-89_DC, and 0.0235*, 0.0935,
0.1482, 0.2349, 0.5900*, and 1.4820* mm for 01b-91_DC. These peaks correspond with
both cut offs between magnifications (* indicates major peaks influenced by cut offs; see
Sections 5.4.4 and 7.1.2 for additional information) and manual decoalescing of vesicles
(refer to Section 7.1.4). The NA and NV values for the decoalesced dataset for clast 01b-
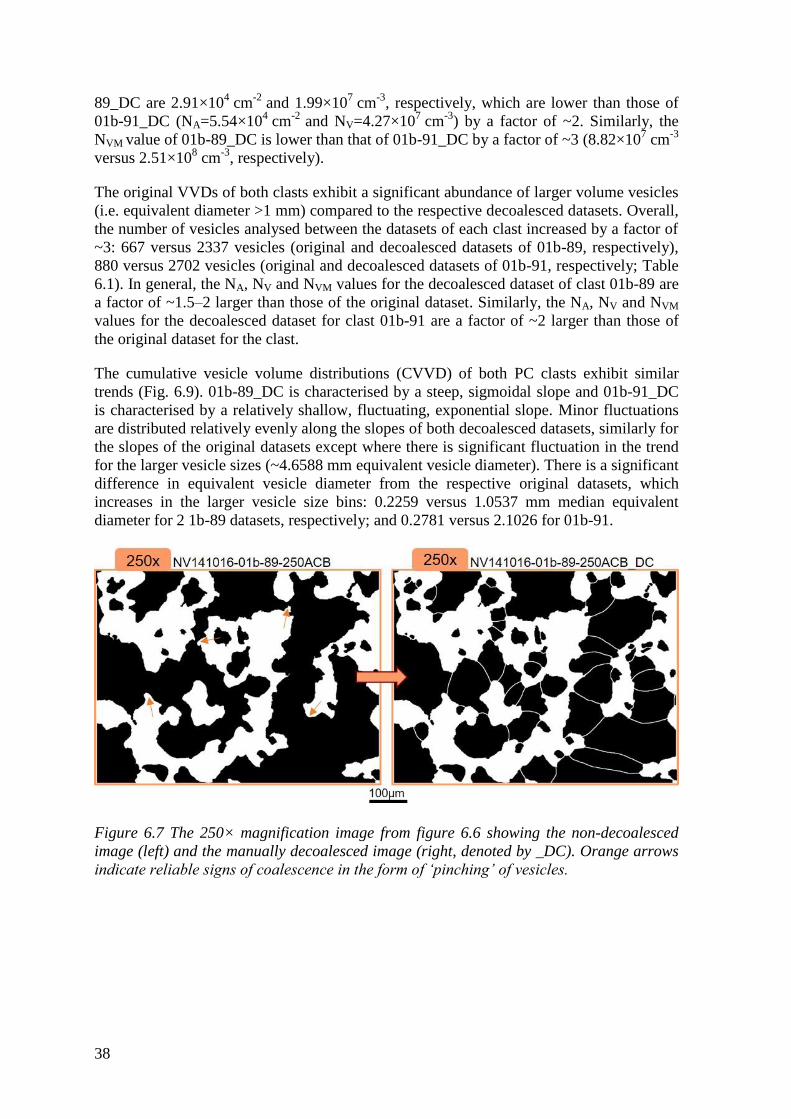
38
89_DC are 2.91×104 cm
-2 and 1.99×10
7 cm
-3, respectively, which are lower than those of
01b-91_DC (NA=5.54×104 cm
-2 and NV=4.27×10
7 cm
-3) by a factor of ~2. Similarly, the
NVM value of 01b-89_DC is lower than that of 01b-91_DC by a factor of ~3 (8.82×107 cm
-3
versus 2.51×108 cm
-3, respectively).
The original VVDs of both clasts exhibit a significant abundance of larger volume vesicles
(i.e. equivalent diameter >1 mm) compared to the respective decoalesced datasets. Overall,
the number of vesicles analysed between the datasets of each clast increased by a factor of
~3: 667 versus 2337 vesicles (original and decoalesced datasets of 01b-89, respectively),
880 versus 2702 vesicles (original and decoalesced datasets of 01b-91, respectively; Table
6.1). In general, the NA, NV and NVM values for the decoalesced dataset of clast 01b-89 are
a factor of ~1.5–2 larger than those of the original dataset. Similarly, the NA, NV and NVM
values for the decoalesced dataset for clast 01b-91 are a factor of ~2 larger than those of
the original dataset for the clast.
The cumulative vesicle volume distributions (CVVD) of both PC clasts exhibit similar
trends (Fig. 6.9). 01b-89_DC is characterised by a steep, sigmoidal slope and 01b-91_DC
is characterised by a relatively shallow, fluctuating, exponential slope. Minor fluctuations
are distributed relatively evenly along the slopes of both decoalesced datasets, similarly for
the slopes of the original datasets except where there is significant fluctuation in the trend
for the larger vesicle sizes (~4.6588 mm equivalent vesicle diameter). There is a significant
difference in equivalent vesicle diameter from the respective original datasets, which
increases in the larger vesicle size bins: 0.2259 versus 1.0537 mm median equivalent
diameter for 2 1b-89 datasets, respectively; and 0.2781 versus 2.1026 for 01b-91.
Figure 6.7 The 250× magnification image from figure 6.6 showing the non-decoalesced
image (left) and the manually decoalesced image (right, denoted by _DC). Orange arrows
indicate reliable signs of coalescence in the form of ‘pinching’ of vesicles.
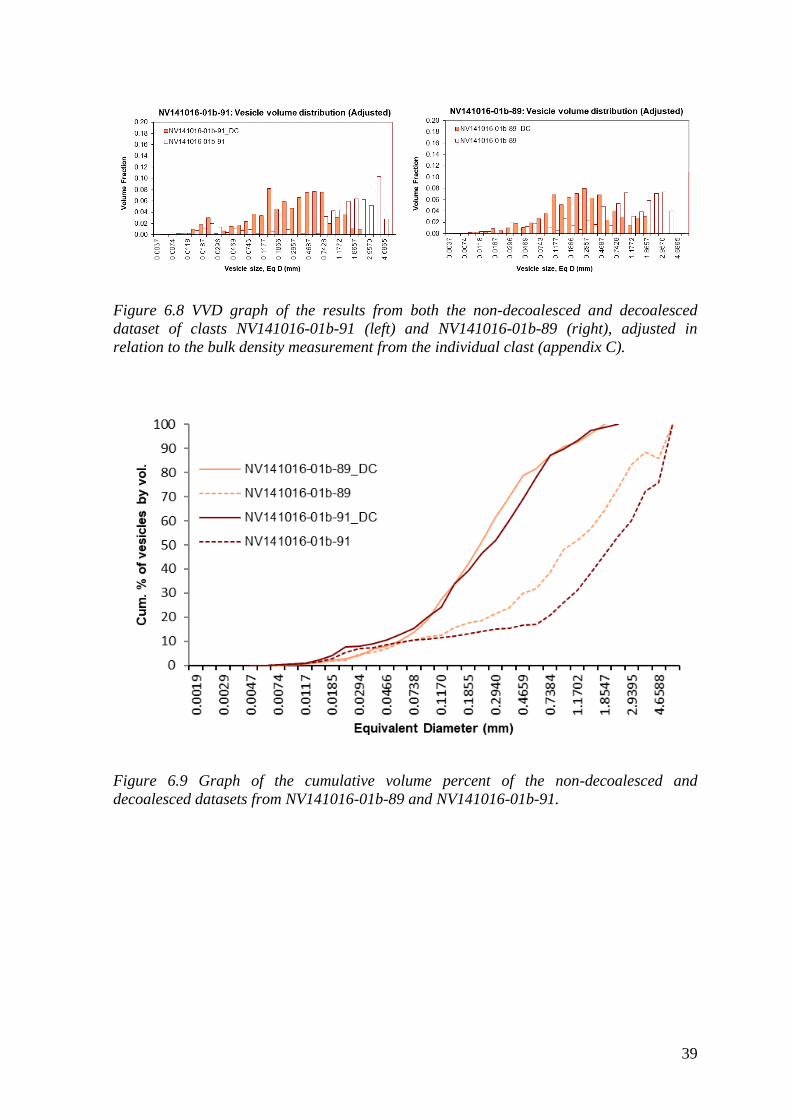
39
Figure 6.8 VVD graph of the results from both the non-decoalesced and decoalesced
dataset of clasts NV141016-01b-91 (left) and NV141016-01b-89 (right), adjusted in
relation to the bulk density measurement from the individual clast (appendix C).
Figure 6.9 Graph of the cumulative volume percent of the non-decoalesced and
decoalesced datasets from NV141016-01b-89 and NV141016-01b-91.
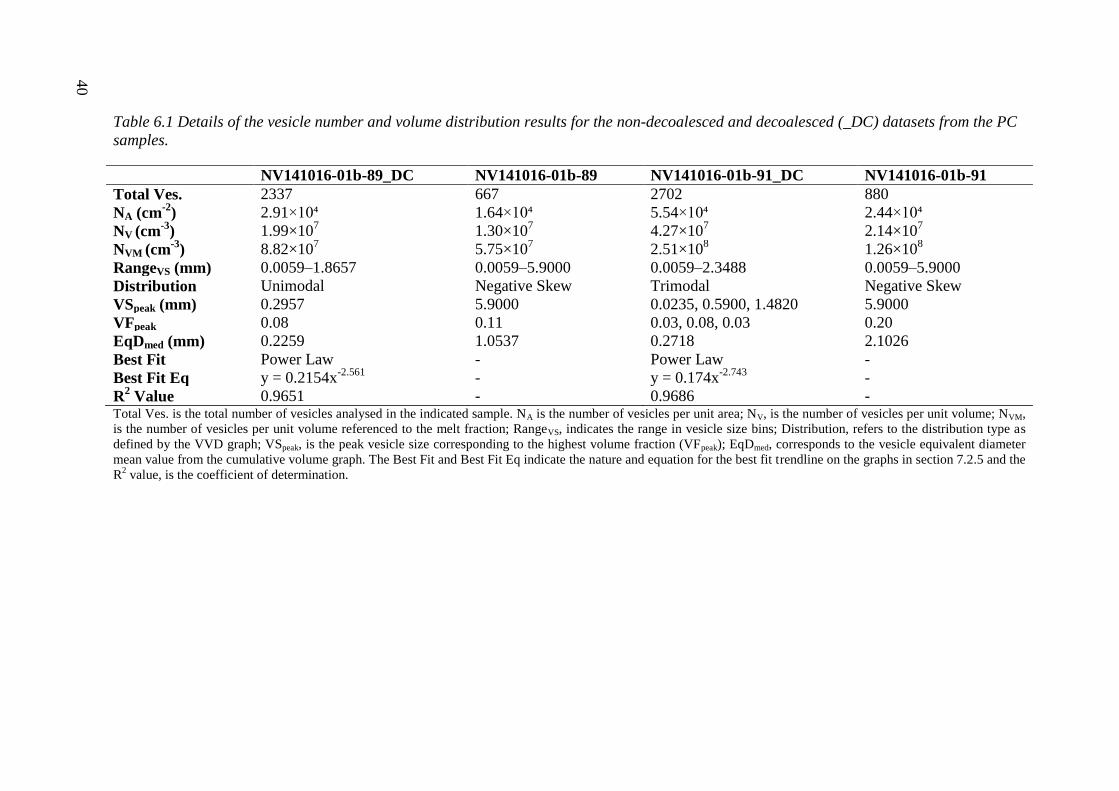
40
Table 6.1 Details of the vesicle number and volume distribution results for the non-decoalesced and decoalesced (_DC) datasets from the PC
samples.
NV141016-01b-89_DC NV141016-01b-89 NV141016-01b-91_DC NV141016-01b-91
Total Ves. 2337 667 2702 880
NA (cm-2
) 2.91×10⁴ 1.64×10⁴ 5.54×10⁴ 2.44×10⁴
NV (cm-3
) 1.99×10⁷ 1.30×10
7 4.27×10
7 2.14×10
7
NVM (cm-3
) 8.82×10⁷ 5.75×10
7 2.51×10
8 1.26×10
8
RangeVS (mm) 0.0059–1.8657 0.0059–5.9000 0.0059–2.3488 0.0059–5.9000
Distribution Unimodal Negative Skew Trimodal Negative Skew
VSpeak (mm) 0.2957 5.9000 0.0235, 0.5900, 1.4820 5.9000
VFpeak 0.08 0.11 0.03, 0.08, 0.03 0.20
EqDmed (mm) 0.2259 1.0537 0.2718 2.1026
Best Fit Power Law - Power Law -
Best Fit Eq y = 0.2154x-2.561
- y = 0.174x-2.743
-
R2 Value 0.9651 - 0.9686 -
Total Ves. is the total number of vesicles analysed in the indicated sample. NA is the number of vesicles per unit area; NV, is the number of vesicles per unit volume; NVM,
is the number of vesicles per unit volume referenced to the melt fraction; RangeVS, indicates the range in vesicle size bins; Distribution, refers to the distribution type as
defined by the VVD graph; VSpeak, is the peak vesicle size corresponding to the highest volume fraction (VFpeak); EqDmed, corresponds to the vesicle equivalent diameter
mean value from the cumulative volume graph. The Best Fit and Best Fit Eq indicate the nature and equation for the best fit trendline on the graphs in section 7.2.5 and the
R2 value, is the coefficient of determination.
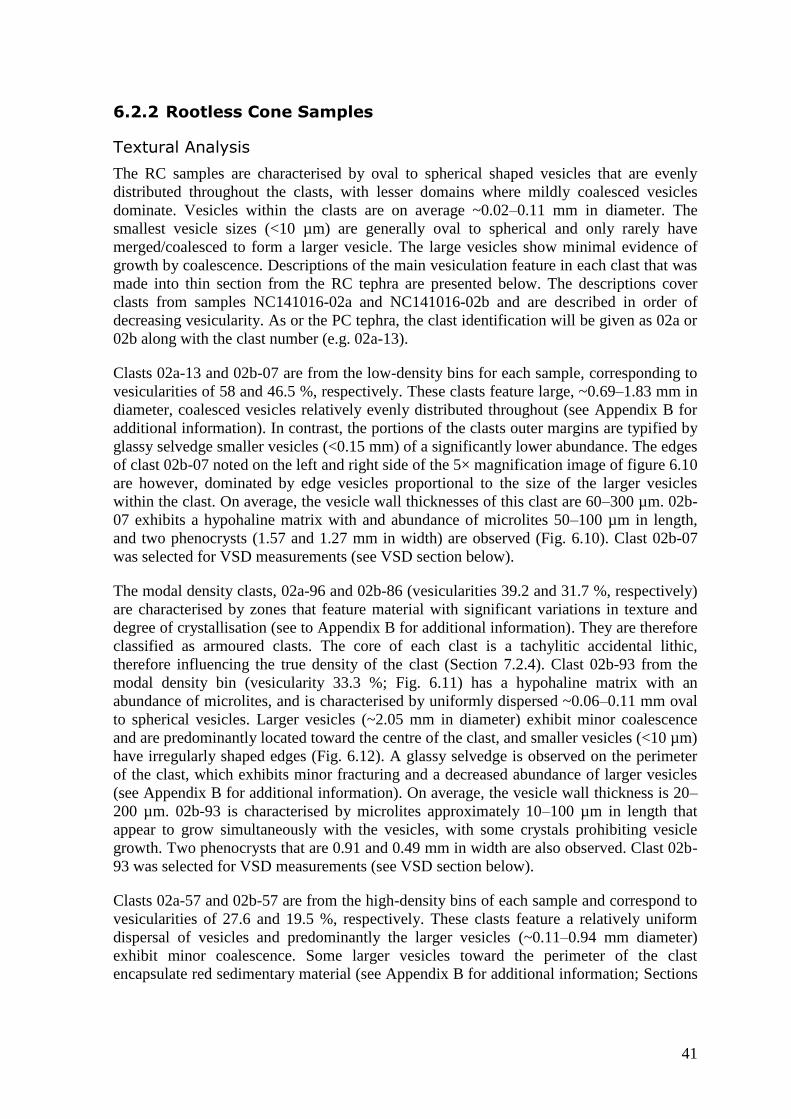
41
6.2.2 Rootless Cone Samples
Textural Analysis
The RC samples are characterised by oval to spherical shaped vesicles that are evenly
distributed throughout the clasts, with lesser domains where mildly coalesced vesicles
dominate. Vesicles within the clasts are on average ~0.02–0.11 mm in diameter. The
smallest vesicle sizes (<10 µm) are generally oval to spherical and only rarely have
merged/coalesced to form a larger vesicle. The large vesicles show minimal evidence of
growth by coalescence. Descriptions of the main vesiculation feature in each clast that was
made into thin section from the RC tephra are presented below. The descriptions cover
clasts from samples NC141016-02a and NC141016-02b and are described in order of
decreasing vesicularity. As or the PC tephra, the clast identification will be given as 02a or
02b along with the clast number (e.g. 02a-13).
Clasts 02a-13 and 02b-07 are from the low-density bins for each sample, corresponding to
vesicularities of 58 and 46.5 %, respectively. These clasts feature large, ~0.69–1.83 mm in
diameter, coalesced vesicles relatively evenly distributed throughout (see Appendix B for
additional information). In contrast, the portions of the clasts outer margins are typified by
glassy selvedge smaller vesicles (<0.15 mm) of a significantly lower abundance. The edges
of clast 02b-07 noted on the left and right side of the 5× magnification image of figure 6.10
are however, dominated by edge vesicles proportional to the size of the larger vesicles
within the clast. On average, the vesicle wall thicknesses of this clast are 60–300 µm. 02b-
07 exhibits a hypohaline matrix with and abundance of microlites 50–100 µm in length,
and two phenocrysts (1.57 and 1.27 mm in width) are observed (Fig. 6.10). Clast 02b-07
was selected for VSD measurements (see VSD section below).
The modal density clasts, 02a-96 and 02b-86 (vesicularities 39.2 and 31.7 %, respectively)
are characterised by zones that feature material with significant variations in texture and
degree of crystallisation (see to Appendix B for additional information). They are therefore
classified as armoured clasts. The core of each clast is a tachylitic accidental lithic,
therefore influencing the true density of the clast (Section 7.2.4). Clast 02b-93 from the
modal density bin (vesicularity 33.3 %; Fig. 6.11) has a hypohaline matrix with an
abundance of microlites, and is characterised by uniformly dispersed ~0.06–0.11 mm oval
to spherical vesicles. Larger vesicles (~2.05 mm in diameter) exhibit minor coalescence
and are predominantly located toward the centre of the clast, and smaller vesicles (<10 µm)
have irregularly shaped edges (Fig. 6.12). A glassy selvedge is observed on the perimeter
of the clast, which exhibits minor fracturing and a decreased abundance of larger vesicles
(see Appendix B for additional information). On average, the vesicle wall thickness is 20–
200 µm. 02b-93 is characterised by microlites approximately 10–100 µm in length that
appear to grow simultaneously with the vesicles, with some crystals prohibiting vesicle
growth. Two phenocrysts that are 0.91 and 0.49 mm in width are also observed. Clast 02b-
93 was selected for VSD measurements (see VSD section below).
Clasts 02a-57 and 02b-57 are from the high-density bins of each sample and correspond to
vesicularities of 27.6 and 19.5 %, respectively. These clasts feature a relatively uniform
dispersal of vesicles and predominantly the larger vesicles (~0.11–0.94 mm diameter)
exhibit minor coalescence. Some larger vesicles toward the perimeter of the clast
encapsulate red sedimentary material (see Appendix B for additional information; Sections
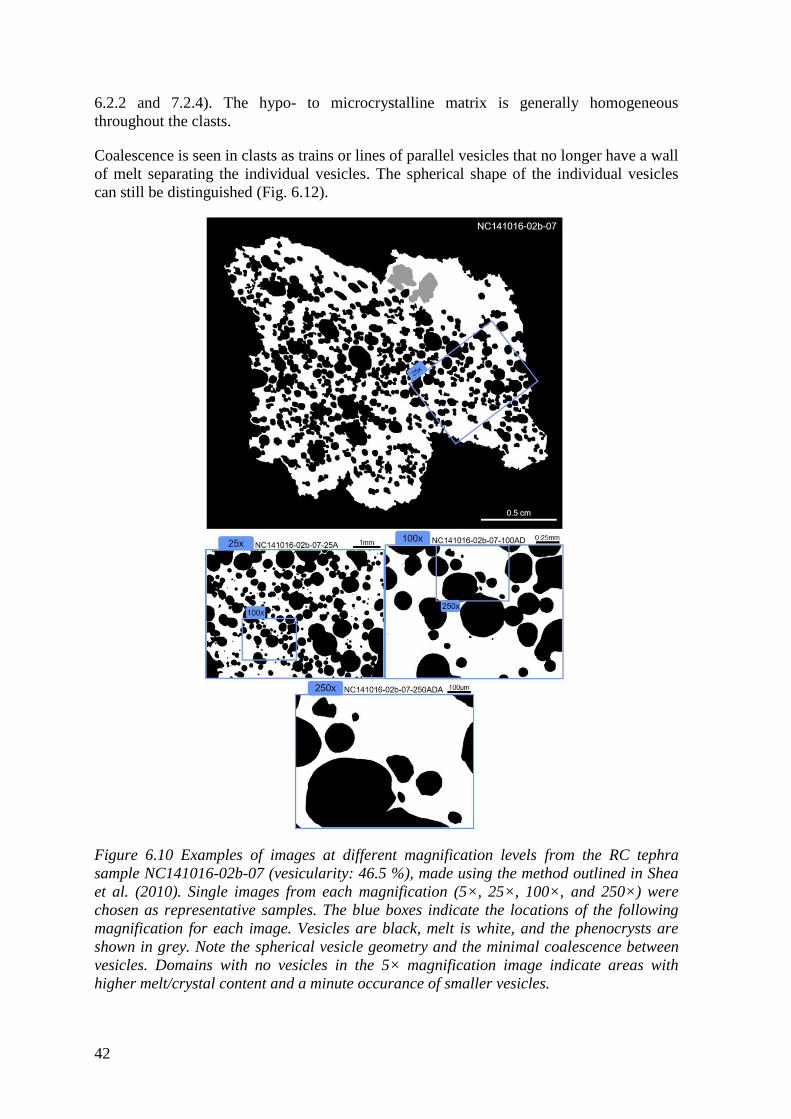
42
6.2.2 and 7.2.4). The hypo- to microcrystalline matrix is generally homogeneous
throughout the clasts.
Coalescence is seen in clasts as trains or lines of parallel vesicles that no longer have a wall
of melt separating the individual vesicles. The spherical shape of the individual vesicles
can still be distinguished (Fig. 6.12).
Figure 6.10 Examples of images at different magnification levels from the RC tephra
sample NC141016-02b-07 (vesicularity: 46.5 %), made using the method outlined in Shea
et al. (2010). Single images from each magnification (5×, 25×, 100×, and 250×) were
chosen as representative samples. The blue boxes indicate the locations of the following
magnification for each image. Vesicles are black, melt is white, and the phenocrysts are
shown in grey. Note the spherical vesicle geometry and the minimal coalescence between
vesicles. Domains with no vesicles in the 5× magnification image indicate areas with
higher melt/crystal content and a minute occurance of smaller vesicles.
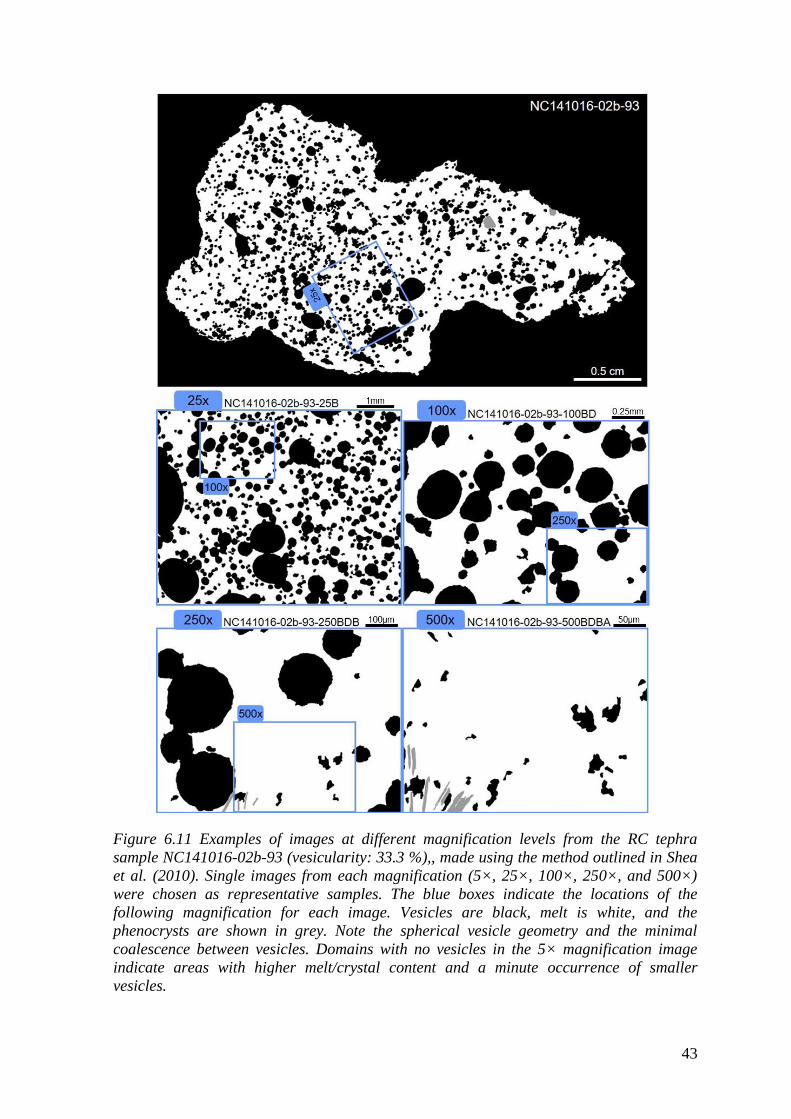
43
Figure 6.11 Examples of images at different magnification levels from the RC tephra
sample NC141016-02b-93 (vesicularity: 33.3 %),, made using the method outlined in Shea
et al. (2010). Single images from each magnification (5×, 25×, 100×, 250×, and 500×)
were chosen as representative samples. The blue boxes indicate the locations of the
following magnification for each image. Vesicles are black, melt is white, and the
phenocrysts are shown in grey. Note the spherical vesicle geometry and the minimal
coalescence between vesicles. Domains with no vesicles in the 5× magnification image
indicate areas with higher melt/crystal content and a minute occurrence of smaller
vesicles.
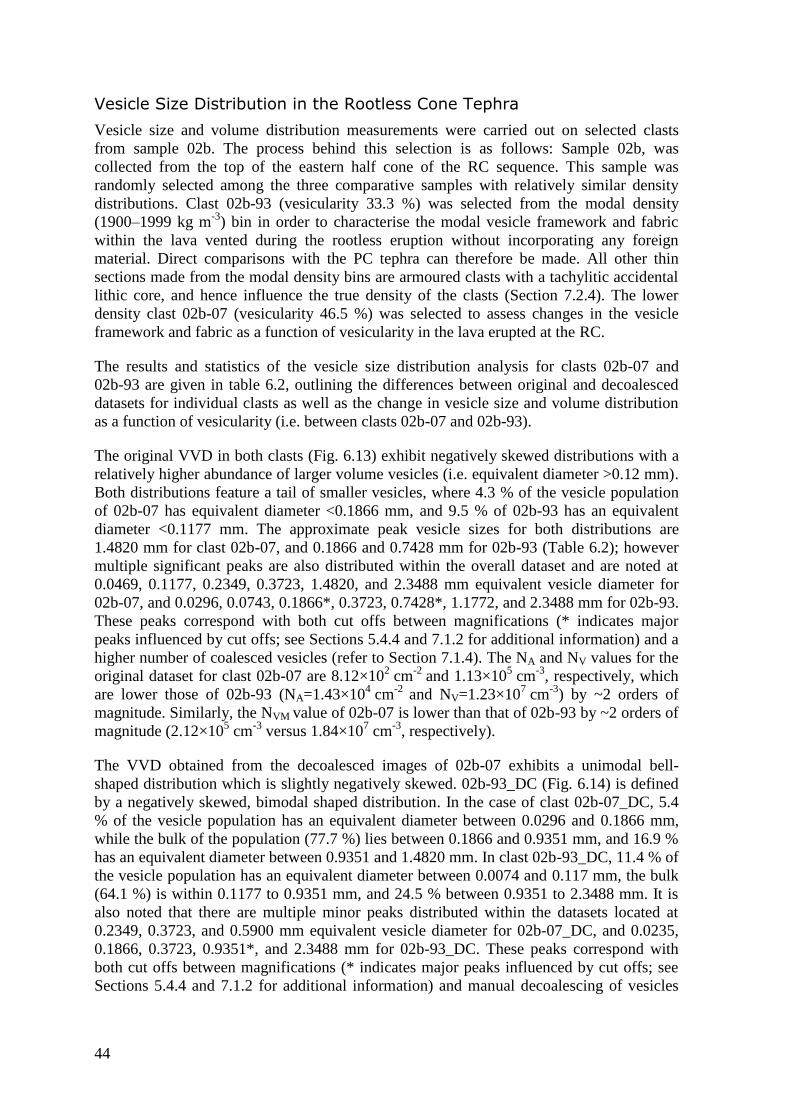
44
Vesicle Size Distribution in the Rootless Cone Tephra
Vesicle size and volume distribution measurements were carried out on selected clasts
from sample 02b. The process behind this selection is as follows: Sample 02b, was
collected from the top of the eastern half cone of the RC sequence. This sample was
randomly selected among the three comparative samples with relatively similar density
distributions. Clast 02b-93 (vesicularity 33.3 %) was selected from the modal density
(1900–1999 kg m-3
) bin in order to characterise the modal vesicle framework and fabric
within the lava vented during the rootless eruption without incorporating any foreign
material. Direct comparisons with the PC tephra can therefore be made. All other thin
sections made from the modal density bins are armoured clasts with a tachylitic accidental
lithic core, and hence influence the true density of the clasts (Section 7.2.4). The lower
density clast 02b-07 (vesicularity 46.5 %) was selected to assess changes in the vesicle
framework and fabric as a function of vesicularity in the lava erupted at the RC.
The results and statistics of the vesicle size distribution analysis for clasts 02b-07 and
02b-93 are given in table 6.2, outlining the differences between original and decoalesced
datasets for individual clasts as well as the change in vesicle size and volume distribution
as a function of vesicularity (i.e. between clasts 02b-07 and 02b-93).
The original VVD in both clasts (Fig. 6.13) exhibit negatively skewed distributions with a
relatively higher abundance of larger volume vesicles (i.e. equivalent diameter >0.12 mm).
Both distributions feature a tail of smaller vesicles, where 4.3 % of the vesicle population
of 02b-07 has equivalent diameter <0.1866 mm, and 9.5 % of 02b-93 has an equivalent
diameter <0.1177 mm. The approximate peak vesicle sizes for both distributions are
1.4820 mm for clast 02b-07, and 0.1866 and 0.7428 mm for 02b-93 (Table 6.2); however
multiple significant peaks are also distributed within the overall dataset and are noted at
0.0469, 0.1177, 0.2349, 0.3723, 1.4820, and 2.3488 mm equivalent vesicle diameter for
02b-07, and 0.0296, 0.0743, 0.1866*, 0.3723, 0.7428*, 1.1772, and 2.3488 mm for 02b-93.
These peaks correspond with both cut offs between magnifications (* indicates major
peaks influenced by cut offs; see Sections 5.4.4 and 7.1.2 for additional information) and a
higher number of coalesced vesicles (refer to Section 7.1.4). The NA and NV values for the
original dataset for clast 02b-07 are 8.12×102 cm
-2 and 1.13×10
5 cm
-3, respectively, which
are lower those of 02b-93 (NA=1.43×104 cm
-2 and NV=1.23×10
7 cm
-3) by ~2 orders of
magnitude. Similarly, the NVM value of 02b-07 is lower than that of 02b-93 by ~2 orders of
magnitude (2.12×105 cm
-3 versus 1.84×10
7 cm
-3, respectively).
The VVD obtained from the decoalesced images of 02b-07 exhibits a unimodal bell-
shaped distribution which is slightly negatively skewed. 02b-93_DC (Fig. 6.14) is defined
by a negatively skewed, bimodal shaped distribution. In the case of clast 02b-07_DC, 5.4
% of the vesicle population has an equivalent diameter between 0.0296 and 0.1866 mm,
while the bulk of the population (77.7 %) lies between 0.1866 and 0.9351 mm, and 16.9 %
has an equivalent diameter between 0.9351 and 1.4820 mm. In clast 02b-93_DC, 11.4 % of
the vesicle population has an equivalent diameter between 0.0074 and 0.117 mm, the bulk
(64.1 %) is within 0.1177 to 0.9351 mm, and 24.5 % between 0.9351 to 2.3488 mm. It is
also noted that there are multiple minor peaks distributed within the datasets located at
0.2349, 0.3723, and 0.5900 mm equivalent vesicle diameter for 02b-07_DC, and 0.0235,
0.1866, 0.3723, 0.9351*, and 2.3488 mm for 02b-93_DC. These peaks correspond with
both cut offs between magnifications (* indicates major peaks influenced by cut offs; see
Sections 5.4.4 and 7.1.2 for additional information) and manual decoalescing of vesicles
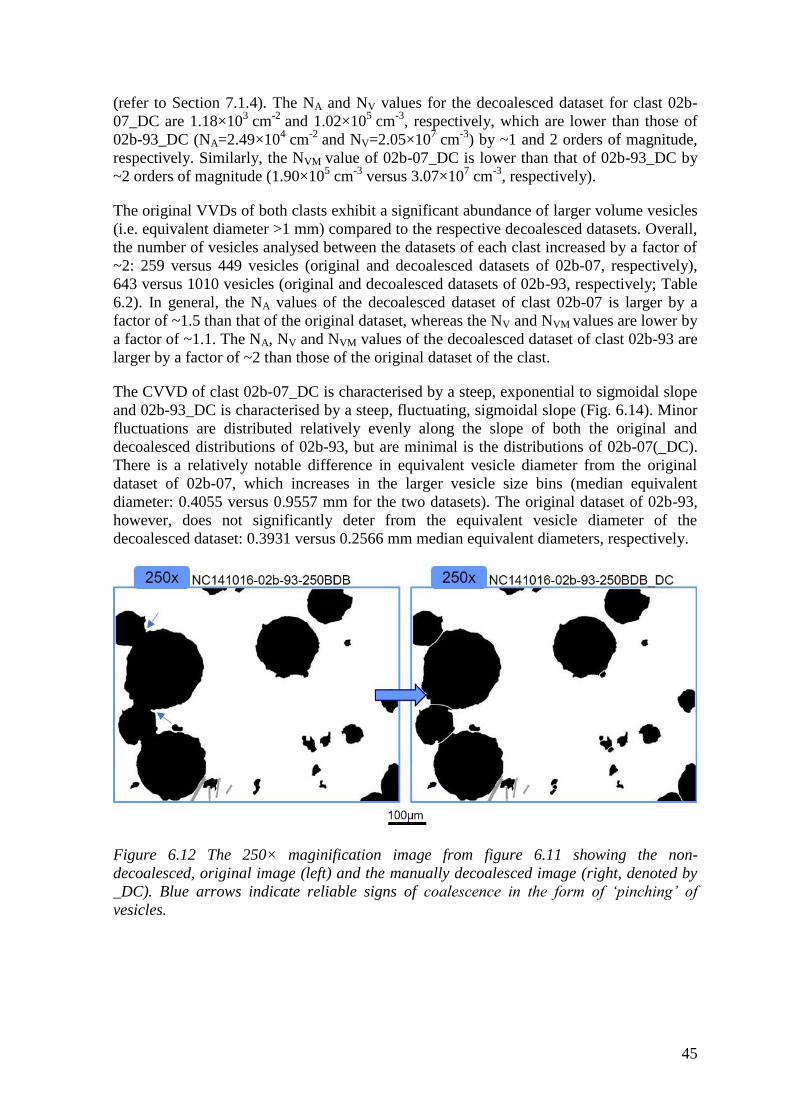
45
(refer to Section 7.1.4). The NA and NV values for the decoalesced dataset for clast 02b-
07_DC are 1.18×103 cm
-2 and 1.02×10
5 cm
-3, respectively, which are lower than those of
02b-93_DC (NA=2.49×104 cm
-2 and NV=2.05×10
7 cm
-3) by ~1 and 2 orders of magnitude,
respectively. Similarly, the NVM value of 02b-07_DC is lower than that of 02b-93_DC by
~2 orders of magnitude (1.90×105 cm
-3 versus 3.07×10
7 cm
-3, respectively).
The original VVDs of both clasts exhibit a significant abundance of larger volume vesicles
(i.e. equivalent diameter >1 mm) compared to the respective decoalesced datasets. Overall,
the number of vesicles analysed between the datasets of each clast increased by a factor of
~2: 259 versus 449 vesicles (original and decoalesced datasets of 02b-07, respectively),
643 versus 1010 vesicles (original and decoalesced datasets of 02b-93, respectively; Table
6.2). In general, the NA values of the decoalesced dataset of clast 02b-07 is larger by a
factor of ~1.5 than that of the original dataset, whereas the NV and NVM values are lower by
a factor of ~1.1. The NA, NV and NVM values of the decoalesced dataset of clast 02b-93 are
larger by a factor of ~2 than those of the original dataset of the clast.
The CVVD of clast 02b-07_DC is characterised by a steep, exponential to sigmoidal slope
and 02b-93_DC is characterised by a steep, fluctuating, sigmoidal slope (Fig. 6.14). Minor
fluctuations are distributed relatively evenly along the slope of both the original and
decoalesced distributions of 02b-93, but are minimal is the distributions of 02b-07(_DC).
There is a relatively notable difference in equivalent vesicle diameter from the original
dataset of 02b-07, which increases in the larger vesicle size bins (median equivalent
diameter: 0.4055 versus 0.9557 mm for the two datasets). The original dataset of 02b-93,
however, does not significantly deter from the equivalent vesicle diameter of the
decoalesced dataset: 0.3931 versus 0.2566 mm median equivalent diameters, respectively.
Figure 6.12 The 250× maginification image from figure 6.11 showing the non-
decoalesced, original image (left) and the manually decoalesced image (right, denoted by
_DC). Blue arrows indicate reliable signs of coalescence in the form of ‘pinching’ of
vesicles.
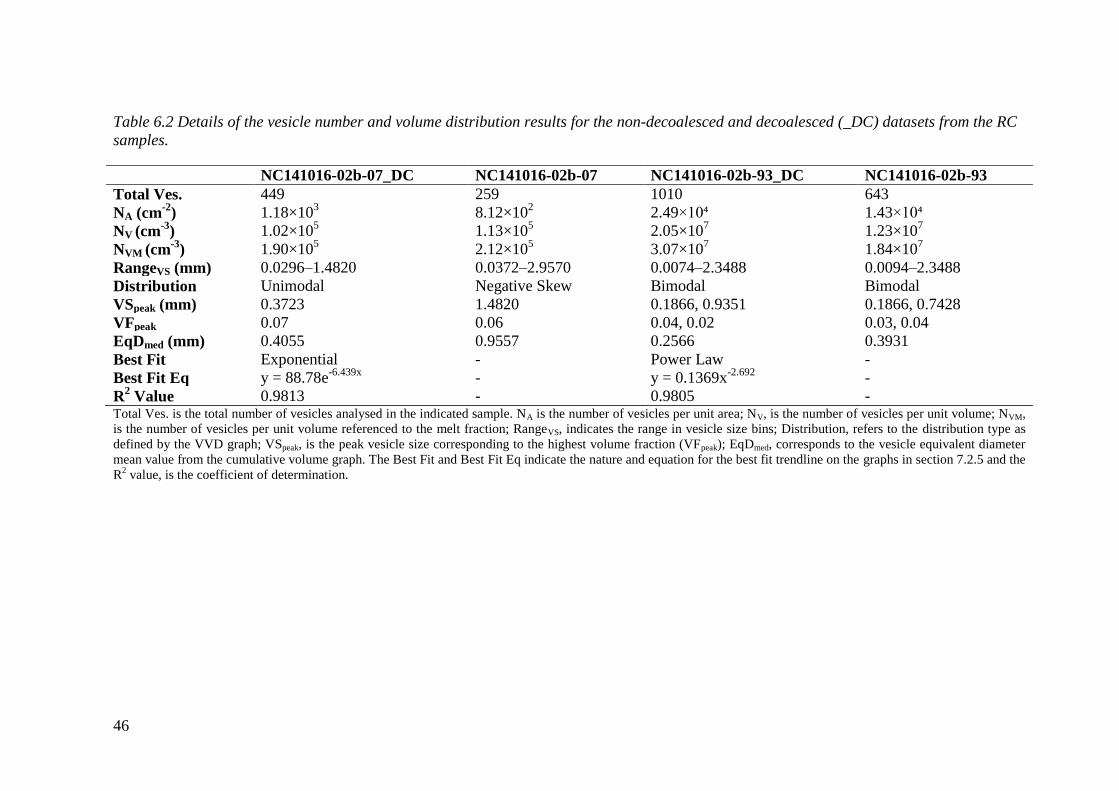
46
Table 6.2 Details of the vesicle number and volume distribution results for the non-decoalesced and decoalesced (_DC) datasets from the RC
samples.
NC141016-02b-07_DC NC141016-02b-07 NC141016-02b-93_DC NC141016-02b-93
Total Ves. 449 259 1010 643
NA (cm-2
) 1.18×10³ 8.12×10
2 2.49×10⁴ 1.43×10⁴
NV (cm-3
) 1.02×10⁵ 1.13×10
5 2.05×10
7 1.23×10
7
NVM (cm-3
) 1.90×10⁵ 2.12×10
5 3.07×10
7 1.84×10
7
RangeVS (mm) 0.0296–1.4820 0.0372–2.9570 0.0074–2.3488 0.0094–2.3488
Distribution Unimodal Negative Skew Bimodal Bimodal
VSpeak (mm) 0.3723 1.4820 0.1866, 0.9351 0.1866, 0.7428
VFpeak 0.07 0.06 0.04, 0.02 0.03, 0.04
EqDmed (mm) 0.4055 0.9557 0.2566 0.3931
Best Fit Exponential - Power Law -
Best Fit Eq y = 88.78e-6.439x
- y = 0.1369x-2.692
-
R2 Value 0.9813 - 0.9805 -
Total Ves. is the total number of vesicles analysed in the indicated sample. NA is the number of vesicles per unit area; NV, is the number of vesicles per unit volume; NVM,
is the number of vesicles per unit volume referenced to the melt fraction; RangeVS, indicates the range in vesicle size bins; Distribution, refers to the distribution type as
defined by the VVD graph; VSpeak, is the peak vesicle size corresponding to the highest volume fraction (VFpeak); EqDmed, corresponds to the vesicle equivalent diameter
mean value from the cumulative volume graph. The Best Fit and Best Fit Eq indicate the nature and equation for the best fit trendline on the graphs in section 7.2.5 and the
R2 value, is the coefficient of determination.
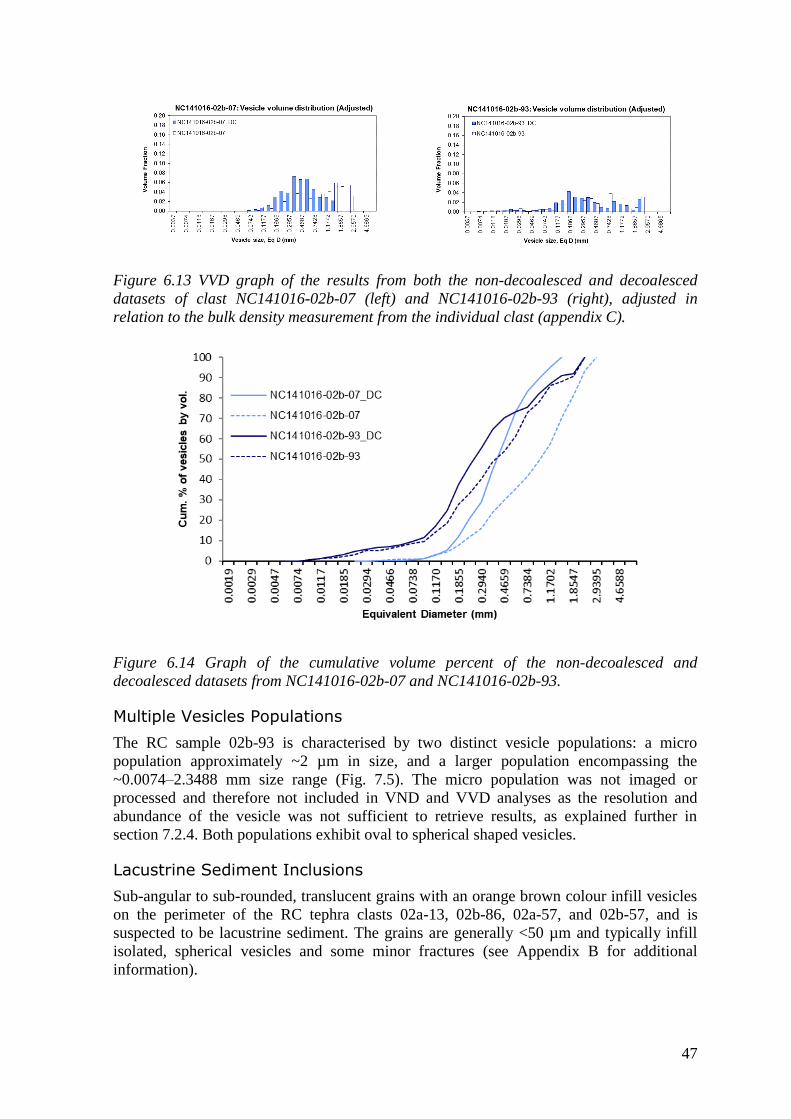
47
Figure 6.13 VVD graph of the results from both the non-decoalesced and decoalesced
datasets of clast NC141016-02b-07 (left) and NC141016-02b-93 (right), adjusted in
relation to the bulk density measurement from the individual clast (appendix C).
Figure 6.14 Graph of the cumulative volume percent of the non-decoalesced and
decoalesced datasets from NC141016-02b-07 and NC141016-02b-93.
Multiple Vesicles Populations
The RC sample 02b-93 is characterised by two distinct vesicle populations: a micro
population approximately ~2 µm in size, and a larger population encompassing the
~0.0074–2.3488 mm size range (Fig. 7.5). The micro population was not imaged or
processed and therefore not included in VND and VVD analyses as the resolution and
abundance of the vesicle was not sufficient to retrieve results, as explained further in
section 7.2.4. Both populations exhibit oval to spherical shaped vesicles.
Lacustrine Sediment Inclusions
Sub-angular to sub-rounded, translucent grains with an orange brown colour infill vesicles
on the perimeter of the RC tephra clasts 02a-13, 02b-86, 02a-57, and 02b-57, and is
suspected to be lacustrine sediment. The grains are generally <50 µm and typically infill
isolated, spherical vesicles and some minor fractures (see Appendix B for additional
information).
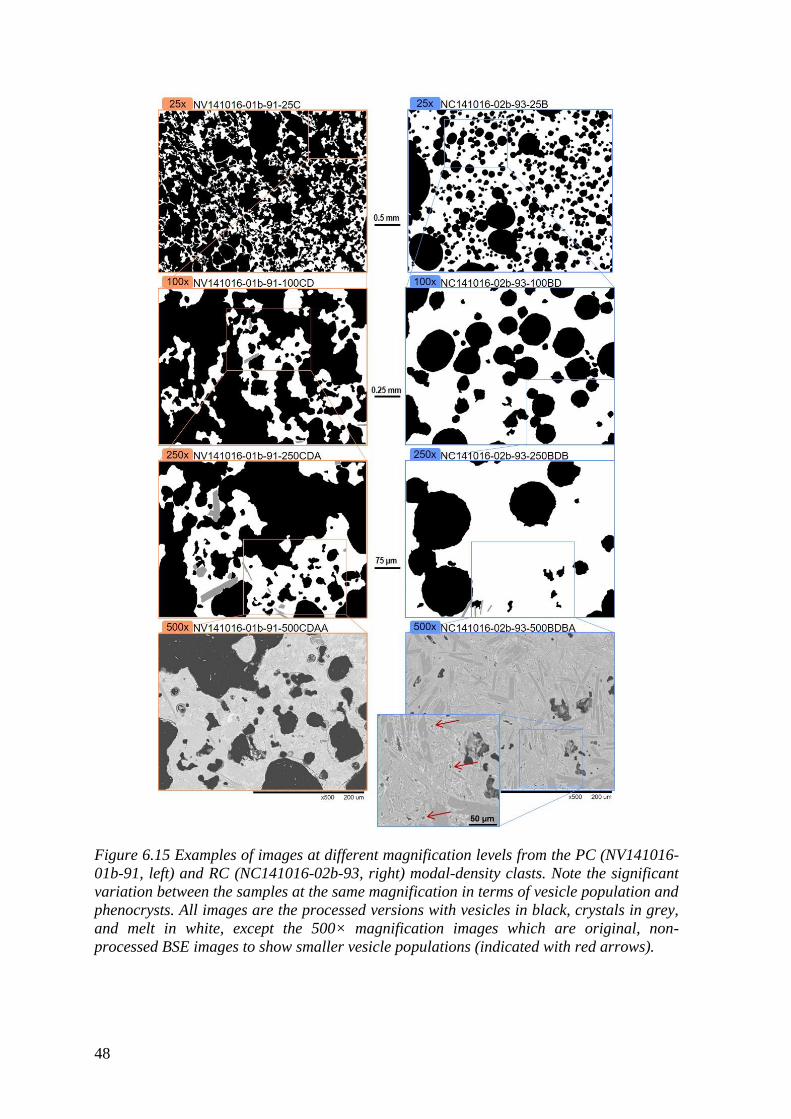
48
Figure 6.15 Examples of images at different magnification levels from the PC (NV141016-
01b-91, left) and RC (NC141016-02b-93, right) modal-density clasts. Note the significant
variation between the samples at the same magnification in terms of vesicle population and
phenocrysts. All images are the processed versions with vesicles in black, crystals in grey,
and melt in white, except the 500× magnification images which are original, non-
processed BSE images to show smaller vesicle populations (indicated with red arrows).
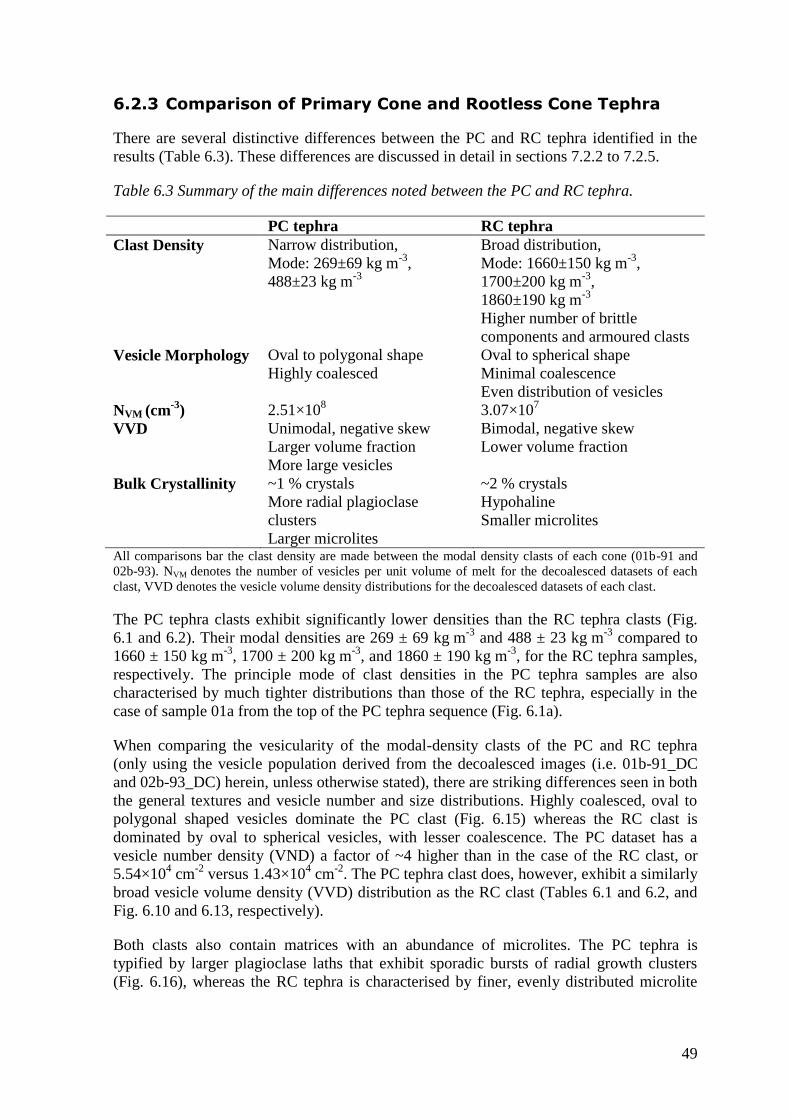
49
6.2.3 Comparison of Primary Cone and Rootless Cone Tephra
There are several distinctive differences between the PC and RC tephra identified in the
results (Table 6.3). These differences are discussed in detail in sections 7.2.2 to 7.2.5.
Table 6.3 Summary of the main differences noted between the PC and RC tephra.
PC tephra RC tephra
Clast Density Narrow distribution,
Mode: 269±69 kg m-3
,
488±23 kg m-3
Broad distribution,
Mode: 1660±150 kg m-3
,
1700±200 kg m-3
,
1860±190 kg m-3
Higher number of brittle
components and armoured clasts
Vesicle Morphology Oval to polygonal shape
Highly coalesced
Oval to spherical shape
Minimal coalescence
Even distribution of vesicles
NVM (cm-3
) 2.51×10⁸ 3.07×10
7
VVD Unimodal, negative skew
Larger volume fraction
More large vesicles
Bimodal, negative skew
Lower volume fraction
Bulk Crystallinity ~1 % crystals
More radial plagioclase
clusters
Larger microlites
~2 % crystals
Hypohaline
Smaller microlites
All comparisons bar the clast density are made between the modal density clasts of each cone (01b-91 and
02b-93). NVM denotes the number of vesicles per unit volume of melt for the decoalesced datasets of each
clast, VVD denotes the vesicle volume density distributions for the decoalesced datasets of each clast.
The PC tephra clasts exhibit significantly lower densities than the RC tephra clasts (Fig.
6.1 and 6.2). Their modal densities are 269 ± 69 kg m-3
and 488 ± 23 kg m-3
compared to
1660 ± 150 kg m-3
, 1700 ± 200 kg m-3
, and 1860 ± 190 kg m-3
, for the RC tephra samples,
respectively. The principle mode of clast densities in the PC tephra samples are also
characterised by much tighter distributions than those of the RC tephra, especially in the
case of sample 01a from the top of the PC tephra sequence (Fig. 6.1a).
When comparing the vesicularity of the modal-density clasts of the PC and RC tephra
(only using the vesicle population derived from the decoalesced images (i.e. 01b-91_DC
and 02b-93_DC) herein, unless otherwise stated), there are striking differences seen in both
the general textures and vesicle number and size distributions. Highly coalesced, oval to
polygonal shaped vesicles dominate the PC clast (Fig. 6.15) whereas the RC clast is
dominated by oval to spherical vesicles, with lesser coalescence. The PC dataset has a
vesicle number density (VND) a factor of ~4 higher than in the case of the RC clast, or
5.54×104 cm
-2 versus 1.43×10
4 cm
-2. The PC tephra clast does, however, exhibit a similarly
broad vesicle volume density (VVD) distribution as the RC clast (Tables 6.1 and 6.2, and
Fig. 6.10 and 6.13, respectively).
Both clasts also contain matrices with an abundance of microlites. The PC tephra is
typified by larger plagioclase laths that exhibit sporadic bursts of radial growth clusters
(Fig. 6.16), whereas the RC tephra is characterised by finer, evenly distributed microlite
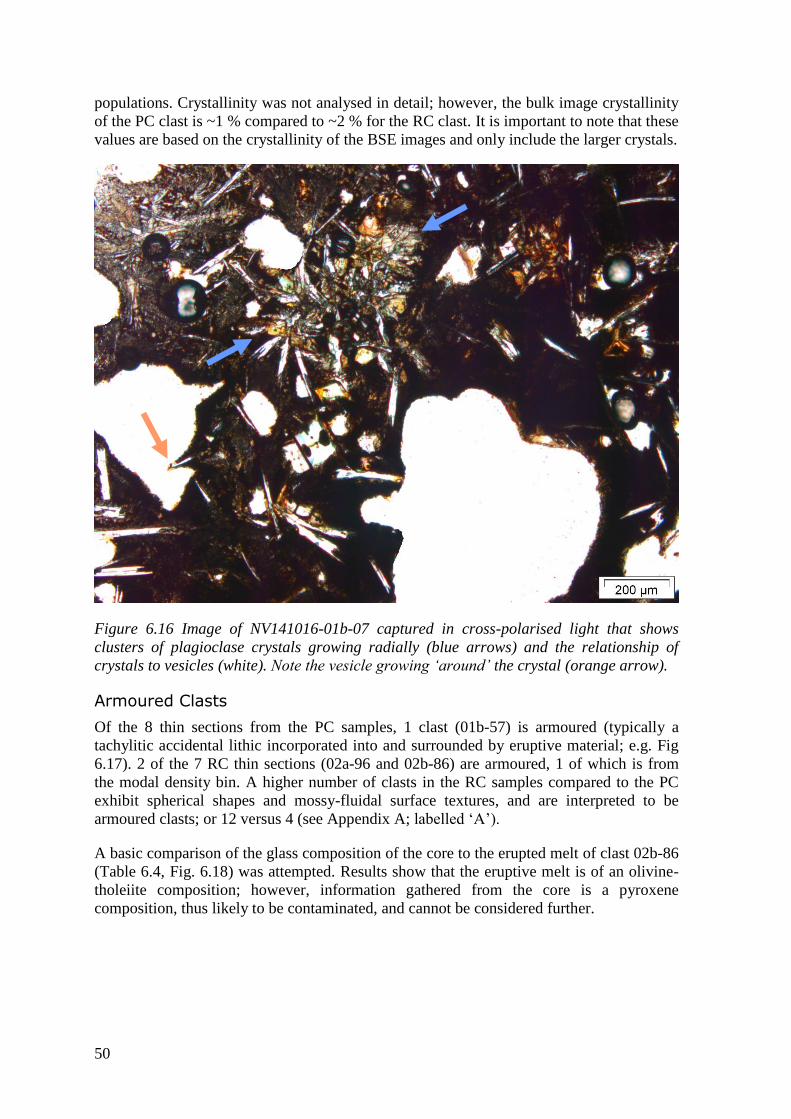
50
populations. Crystallinity was not analysed in detail; however, the bulk image crystallinity
of the PC clast is ~1 % compared to ~2 % for the RC clast. It is important to note that these
values are based on the crystallinity of the BSE images and only include the larger crystals.
Figure 6.16 Image of NV141016-01b-07 captured in cross-polarised light that shows
clusters of plagioclase crystals growing radially (blue arrows) and the relationship of
crystals to vesicles (white). Note the vesicle growing ‘around’ the crystal (orange arrow).
Armoured Clasts
Of the 8 thin sections from the PC samples, 1 clast (01b-57) is armoured (typically a
tachylitic accidental lithic incorporated into and surrounded by eruptive material; e.g. Fig
6.17). 2 of the 7 RC thin sections (02a-96 and 02b-86) are armoured, 1 of which is from
the modal density bin. A higher number of clasts in the RC samples compared to the PC
exhibit spherical shapes and mossy-fluidal surface textures, and are interpreted to be
armoured clasts; or 12 versus 4 (see Appendix A; labelled ‘A’).
A basic comparison of the glass composition of the core to the erupted melt of clast 02b-86
(Table 6.4, Fig. 6.18) was attempted. Results show that the eruptive melt is of an olivine-
tholeiite composition; however, information gathered from the core is a pyroxene
composition, thus likely to be contaminated, and cannot be considered further.
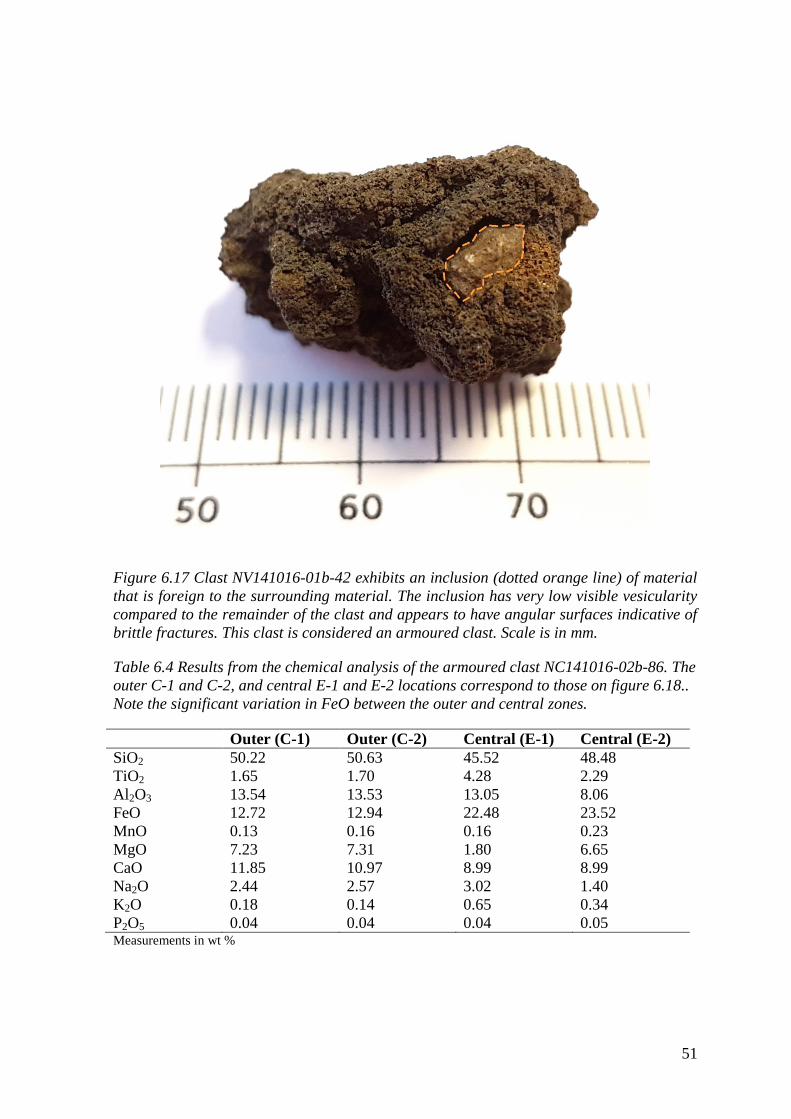
51
Figure 6.17 Clast NV141016-01b-42 exhibits an inclusion (dotted orange line) of material
that is foreign to the surrounding material. The inclusion has very low visible vesicularity
compared to the remainder of the clast and appears to have angular surfaces indicative of
brittle fractures. This clast is considered an armoured clast. Scale is in mm.
Table 6.4 Results from the chemical analysis of the armoured clast NC141016-02b-86. The
outer C-1 and C-2, and central E-1 and E-2 locations correspond to those on figure 6.18..
Note the significant variation in FeO between the outer and central zones.
Outer (C-1) Outer (C-2) Central (E-1) Central (E-2)
SiO2 50.22 50.63 45.52 48.48
TiO2 1.65 1.70 4.28 2.29
Al2O3 13.54 13.53 13.05 8.06
FeO 12.72 12.94 22.48 23.52
MnO 0.13 0.16 0.16 0.23
MgO 7.23 7.31 1.80 6.65
CaO 11.85 10.97 8.99 8.99
Na2O 2.44 2.57 3.02 1.40
K2O 0.18 0.14 0.65 0.34
P2O5 0.04 0.04 0.04 0.05 Measurements in wt %
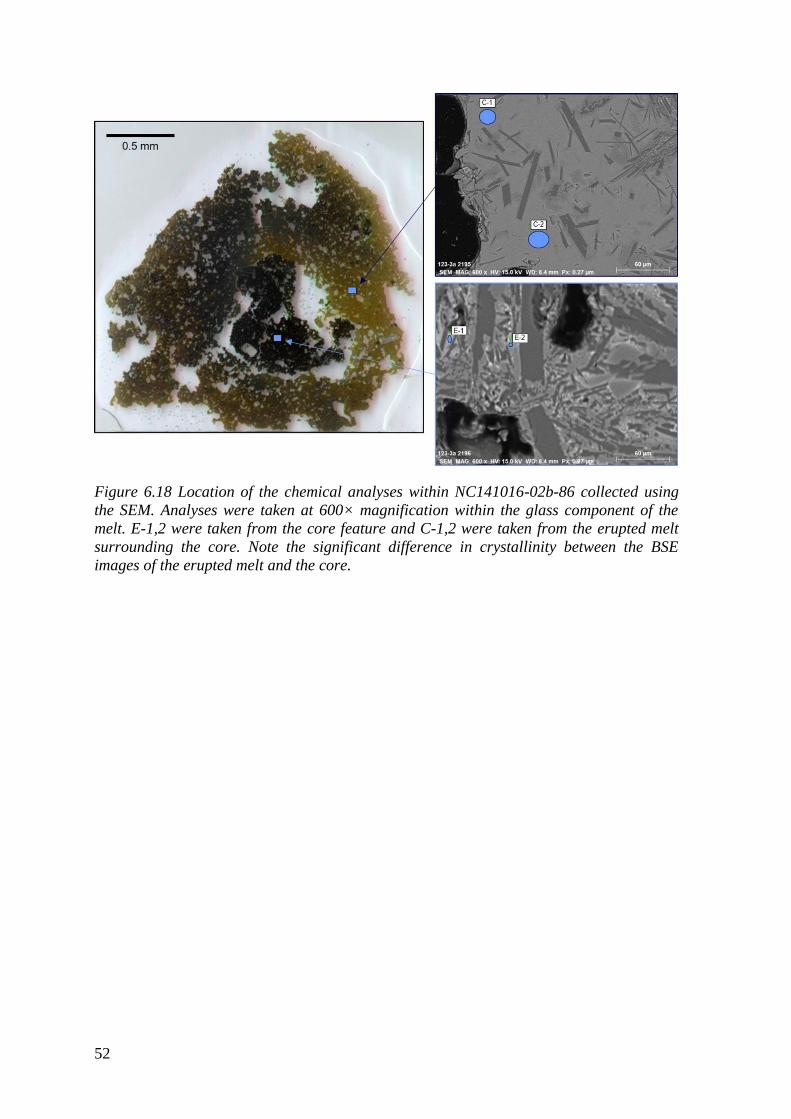
52
Figure 6.18 Location of the chemical analyses within NC141016-02b-86 collected using
the SEM. Analyses were taken at 600× magnification within the glass component of the
melt. E-1,2 were taken from the core feature and C-1,2 were taken from the erupted melt
surrounding the core. Note the significant difference in crystallinity between the BSE
images of the erupted melt and the core.
53
7 Discussion
7.1 Data Quality
The methodology behind density and vesicularity analyses include a number of subjective
aspects that can lead to uncertainty in the results. These primarily involve choices made
during sample collection and image processing such as the choice of vesicle size cutoff
limits, the manual decoalescing of vesicles and the assumptions regarding crystallinity.
The specific uncertainties concerning this study are outlined in sections 7.1.1 to 7.1.5
below.
7.1.1 Bulk Density Distributions
In bulk density distributions, the most common reason for extreme dense outliers is that a
lithic clast has been erroneously classified as juvenile. Observations of outliers in the bulk
density distributions of the PC samples (Fig. 6.1a, b), however, confirm that the outliers
have characteristics identified in the componentry groups, are therefore non-lithic, and
likely classified as juvenile lithics. Outlying clasts from 01a and the 1500–1599 kg m-3
clast of 01b exhibit features of the brittle component group, with angular edges and small
vesicles visible in hand sample. The clast from the 1800–1899 kg m-3
density bin of 01b
exhibits characteristics from both the fluidal and fractured componentry groups. It is
spherical and microvesicular with a rough textured, polygonal fractured surface, similar to
clasts identified as armoured (Fig. 6.17) such as samples 01b-57 and 02b-86 (see appendix
B). Therefore, the possibility that this is an armoured clast cannot be excluded from
interpretation. It is feasible that the high-density measurement is due to a lithic component
within the clast. The sparse and spherical shape of the vesicle population of the clast
however, suggests that it is sampled from a different package of magma, consistent with
possible stages of vesicle collapse and outgassing.
Considering the lack of lithics within the outlying clasts, gaps in the bulk density
measurements of sample 01b (Fig. 7.1) can be explained as insufficient coverage of
representative clasts within the sample. Methods outlined by Houghton and Wilson (1989)
indicate the necessity of collecting 100 clasts for a representative sample, however the
study was based on Plinian type eruptions where the eruptive material is generally more
homogeneous. A higher number of clasts is required for use in eruptions with a wide
diversity in eruptive products to ensure the dataset is representative of the full density
ranges.
7.1.2 Image Coverage
Bias is introduced during image processing as time restraints do not permit the entire clast
to be imaged at all magnifications. Thus, representative areas must be selected, via a nested
structure of images, and applied to the entire clast. In order to select representative areas,
the overall vesicularity distribution of the clast must be considered as over- or under-
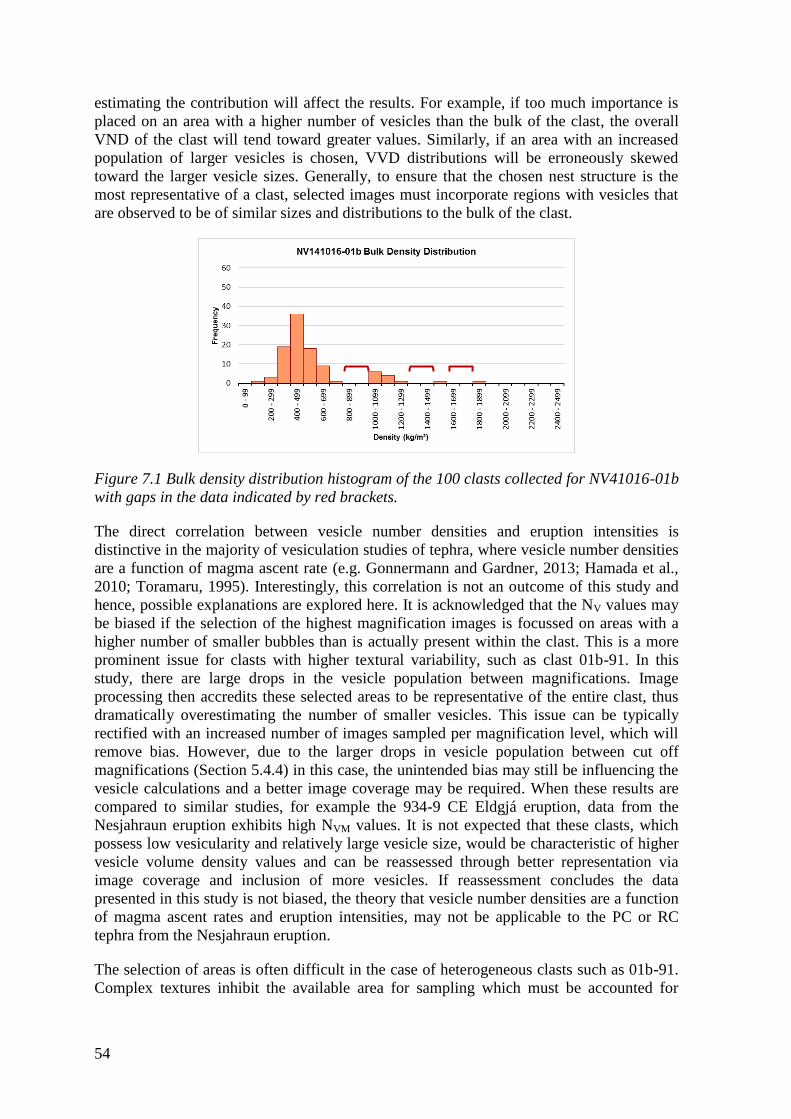
54
estimating the contribution will affect the results. For example, if too much importance is
placed on an area with a higher number of vesicles than the bulk of the clast, the overall
VND of the clast will tend toward greater values. Similarly, if an area with an increased
population of larger vesicles is chosen, VVD distributions will be erroneously skewed
toward the larger vesicle sizes. Generally, to ensure that the chosen nest structure is the
most representative of a clast, selected images must incorporate regions with vesicles that
are observed to be of similar sizes and distributions to the bulk of the clast.
Figure 7.1 Bulk density distribution histogram of the 100 clasts collected for NV41016-01b
with gaps in the data indicated by red brackets.
The direct correlation between vesicle number densities and eruption intensities is
distinctive in the majority of vesiculation studies of tephra, where vesicle number densities
are a function of magma ascent rate (e.g. Gonnermann and Gardner, 2013; Hamada et al.,
2010; Toramaru, 1995). Interestingly, this correlation is not an outcome of this study and
hence, possible explanations are explored here. It is acknowledged that the NV values may
be biased if the selection of the highest magnification images is focussed on areas with a
higher number of smaller bubbles than is actually present within the clast. This is a more
prominent issue for clasts with higher textural variability, such as clast 01b-91. In this
study, there are large drops in the vesicle population between magnifications. Image
processing then accredits these selected areas to be representative of the entire clast, thus
dramatically overestimating the number of smaller vesicles. This issue can be typically
rectified with an increased number of images sampled per magnification level, which will
remove bias. However, due to the larger drops in vesicle population between cut off
magnifications (Section 5.4.4) in this case, the unintended bias may still be influencing the
vesicle calculations and a better image coverage may be required. When these results are
compared to similar studies, for example the 934-9 CE Eldgjá eruption, data from the
Nesjahraun eruption exhibits high NVM values. It is not expected that these clasts, which
possess low vesicularity and relatively large vesicle size, would be characteristic of higher
vesicle volume density values and can be reassessed through better representation via
image coverage and inclusion of more vesicles. If reassessment concludes the data
presented in this study is not biased, the theory that vesicle number densities are a function
of magma ascent rates and eruption intensities, may not be applicable to the PC or RC
tephra from the Nesjahraun eruption.
The selection of areas is often difficult in the case of heterogeneous clasts such as 01b-91.
Complex textures inhibit the available area for sampling which must be accounted for
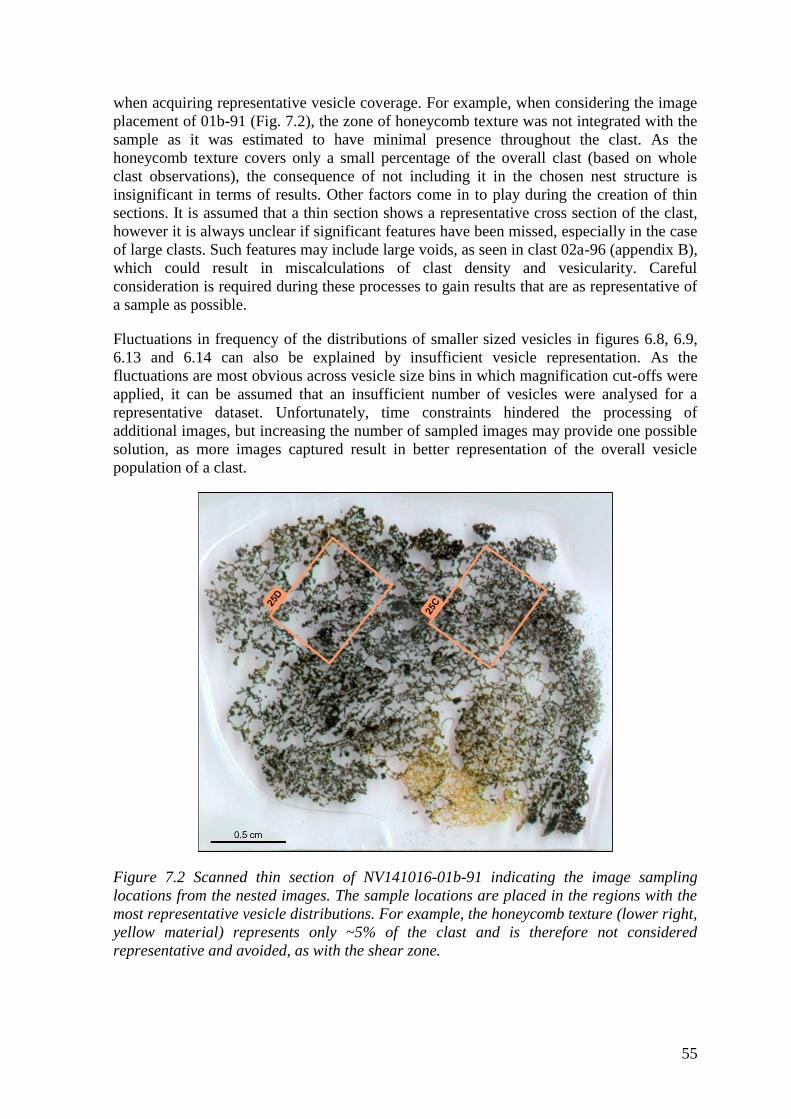
55
when acquiring representative vesicle coverage. For example, when considering the image
placement of 01b-91 (Fig. 7.2), the zone of honeycomb texture was not integrated with the
sample as it was estimated to have minimal presence throughout the clast. As the
honeycomb texture covers only a small percentage of the overall clast (based on whole
clast observations), the consequence of not including it in the chosen nest structure is
insignificant in terms of results. Other factors come in to play during the creation of thin
sections. It is assumed that a thin section shows a representative cross section of the clast,
however it is always unclear if significant features have been missed, especially in the case
of large clasts. Such features may include large voids, as seen in clast 02a-96 (appendix B),
which could result in miscalculations of clast density and vesicularity. Careful
consideration is required during these processes to gain results that are as representative of
a sample as possible.
Fluctuations in frequency of the distributions of smaller sized vesicles in figures 6.8, 6.9,
6.13 and 6.14 can also be explained by insufficient vesicle representation. As the
fluctuations are most obvious across vesicle size bins in which magnification cut-offs were
applied, it can be assumed that an insufficient number of vesicles were analysed for a
representative dataset. Unfortunately, time constraints hindered the processing of
additional images, but increasing the number of sampled images may provide one possible
solution, as more images captured result in better representation of the overall vesicle
population of a clast.
Figure 7.2 Scanned thin section of NV141016-01b-91 indicating the image sampling
locations from the nested images. The sample locations are placed in the regions with the
most representative vesicle distributions. For example, the honeycomb texture (lower right,
yellow material) represents only ~5% of the clast and is therefore not considered
representative and avoided, as with the shear zone.
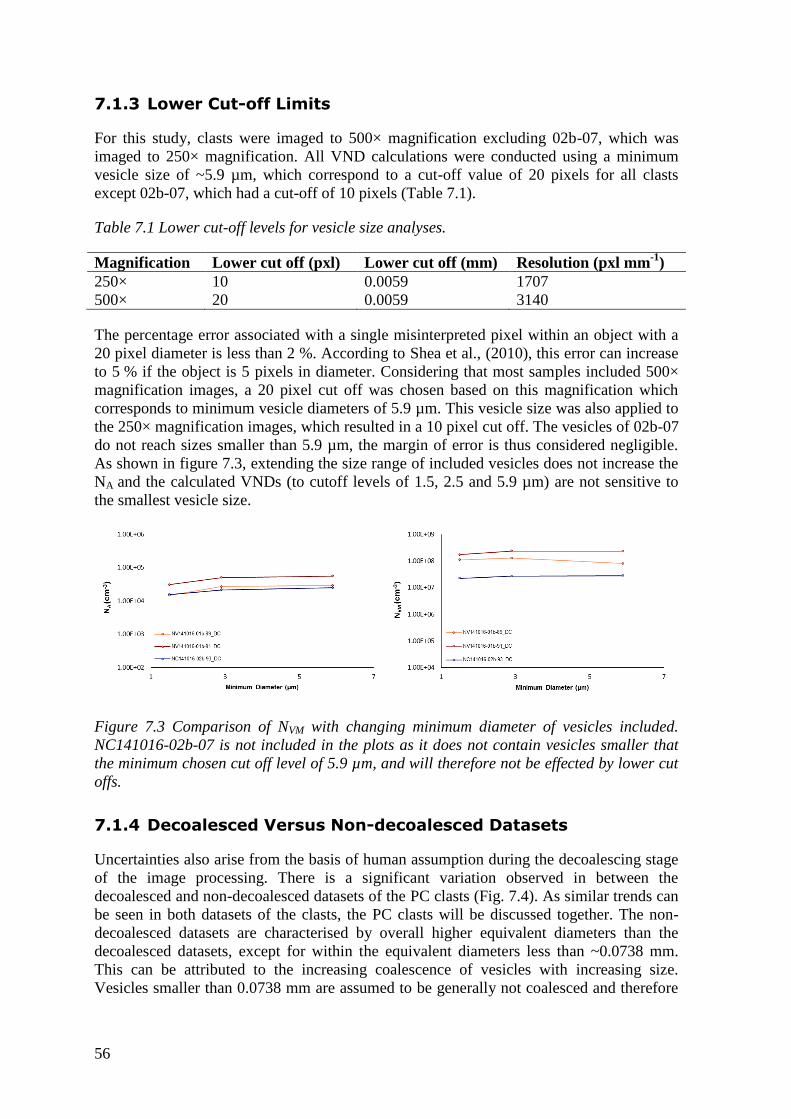
56
7.1.3 Lower Cut-off Limits
For this study, clasts were imaged to 500× magnification excluding 02b-07, which was
imaged to 250× magnification. All VND calculations were conducted using a minimum
vesicle size of ~5.9 µm, which correspond to a cut-off value of 20 pixels for all clasts
except 02b-07, which had a cut-off of 10 pixels (Table 7.1).
Table 7.1 Lower cut-off levels for vesicle size analyses.
Magnification Lower cut off (pxl) Lower cut off (mm) Resolution (pxl mm-1
)
250× 10 0.0059 1707
500× 20 0.0059 3140
The percentage error associated with a single misinterpreted pixel within an object with a
20 pixel diameter is less than 2 %. According to Shea et al., (2010), this error can increase
to 5 % if the object is 5 pixels in diameter. Considering that most samples included 500×
magnification images, a 20 pixel cut off was chosen based on this magnification which
corresponds to minimum vesicle diameters of 5.9 µm. This vesicle size was also applied to
the 250× magnification images, which resulted in a 10 pixel cut off. The vesicles of 02b-07
do not reach sizes smaller than 5.9 µm, the margin of error is thus considered negligible.
As shown in figure 7.3, extending the size range of included vesicles does not increase the
NA and the calculated VNDs (to cutoff levels of 1.5, 2.5 and 5.9 µm) are not sensitive to
the smallest vesicle size.
Figure 7.3 Comparison of NVM with changing minimum diameter of vesicles included.
NC141016-02b-07 is not included in the plots as it does not contain vesicles smaller that
the minimum chosen cut off level of 5.9 µm, and will therefore not be effected by lower cut
offs.
7.1.4 Decoalesced Versus Non-decoalesced Datasets
Uncertainties also arise from the basis of human assumption during the decoalescing stage
of the image processing. There is a significant variation observed in between the
decoalesced and non-decoalesced datasets of the PC clasts (Fig. 7.4). As similar trends can
be seen in both datasets of the clasts, the PC clasts will be discussed together. The non-
decoalesced datasets are characterised by overall higher equivalent diameters than the
decoalesced datasets, except for within the equivalent diameters less than ~0.0738 mm.
This can be attributed to the increasing coalescence of vesicles with increasing size.
Vesicles smaller than 0.0738 mm are assumed to be generally not coalesced and therefore
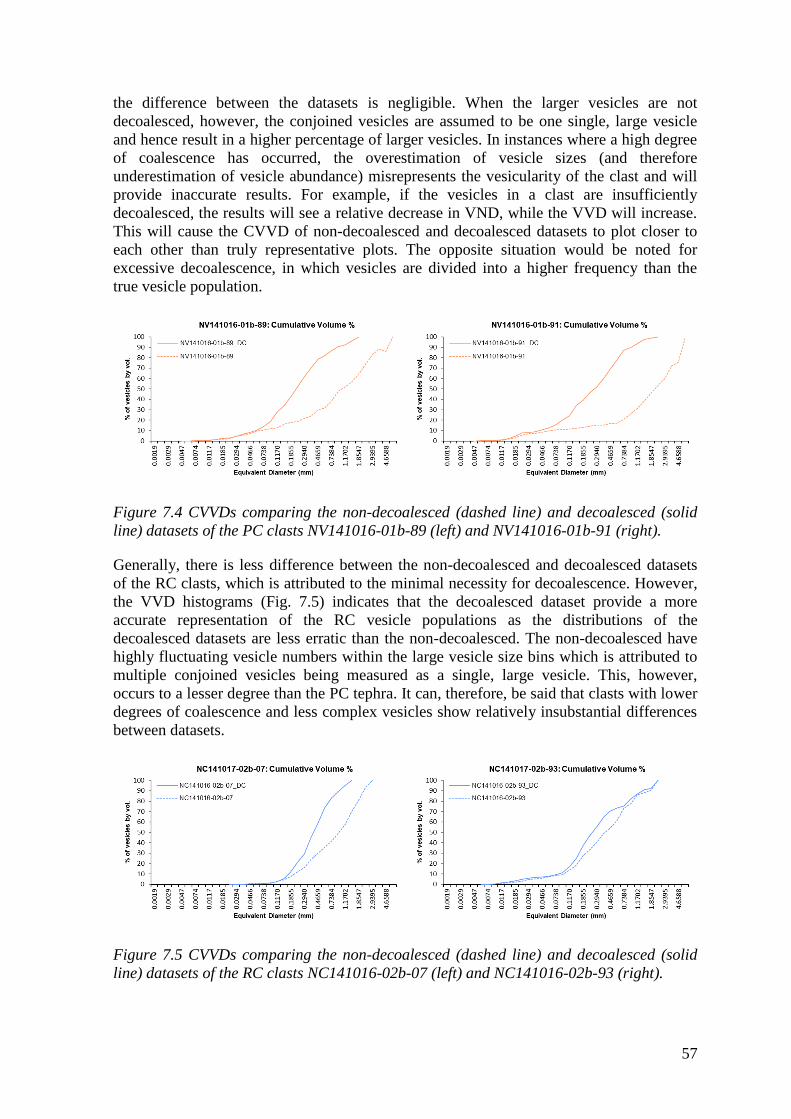
57
the difference between the datasets is negligible. When the larger vesicles are not
decoalesced, however, the conjoined vesicles are assumed to be one single, large vesicle
and hence result in a higher percentage of larger vesicles. In instances where a high degree
of coalescence has occurred, the overestimation of vesicle sizes (and therefore
underestimation of vesicle abundance) misrepresents the vesicularity of the clast and will
provide inaccurate results. For example, if the vesicles in a clast are insufficiently
decoalesced, the results will see a relative decrease in VND, while the VVD will increase.
This will cause the CVVD of non-decoalesced and decoalesced datasets to plot closer to
each other than truly representative plots. The opposite situation would be noted for
excessive decoalescence, in which vesicles are divided into a higher frequency than the
true vesicle population.
Figure 7.4 CVVDs comparing the non-decoalesced (dashed line) and decoalesced (solid
line) datasets of the PC clasts NV141016-01b-89 (left) and NV141016-01b-91 (right).
Generally, there is less difference between the non-decoalesced and decoalesced datasets
of the RC clasts, which is attributed to the minimal necessity for decoalescence. However,
the VVD histograms (Fig. 7.5) indicates that the decoalesced dataset provide a more
accurate representation of the RC vesicle populations as the distributions of the
decoalesced datasets are less erratic than the non-decoalesced. The non-decoalesced have
highly fluctuating vesicle numbers within the large vesicle size bins which is attributed to
multiple conjoined vesicles being measured as a single, large vesicle. This, however,
occurs to a lesser degree than the PC tephra. It can, therefore, be said that clasts with lower
degrees of coalescence and less complex vesicles show relatively insubstantial differences
between datasets.
Figure 7.5 CVVDs comparing the non-decoalesced (dashed line) and decoalesced (solid
line) datasets of the RC clasts NC141016-02b-07 (left) and NC141016-02b-93 (right).
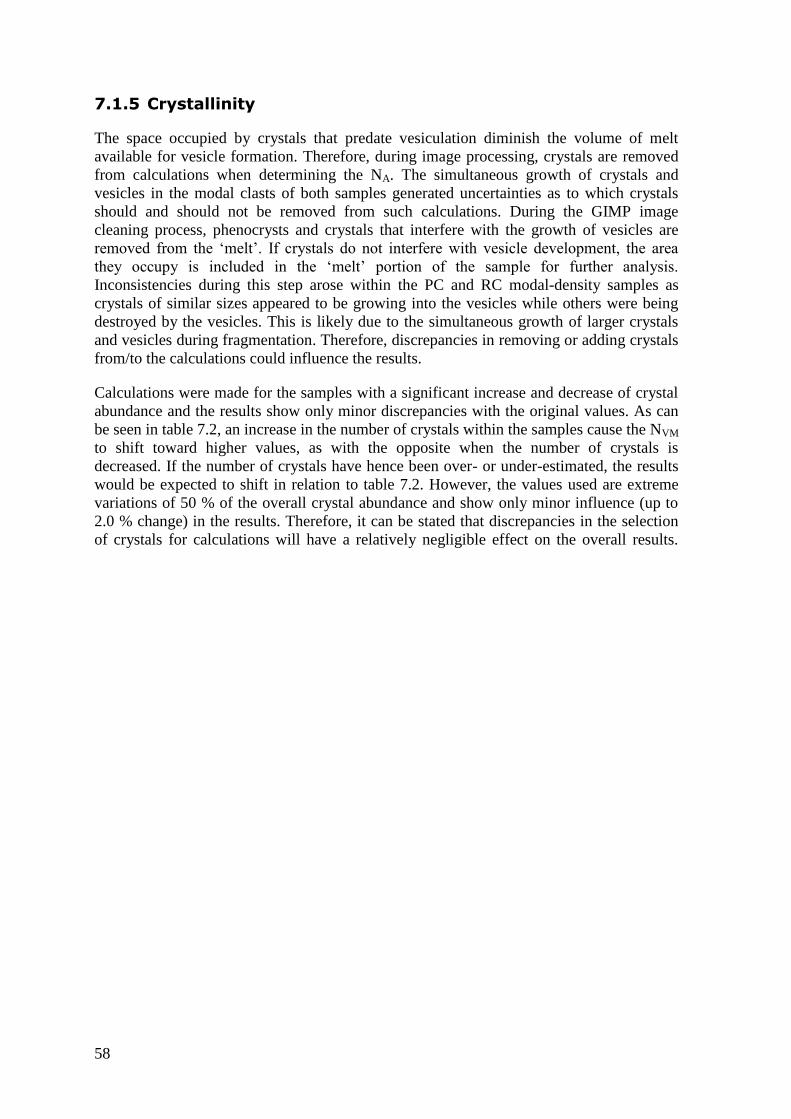
58
7.1.5 Crystallinity
The space occupied by crystals that predate vesiculation diminish the volume of melt
available for vesicle formation. Therefore, during image processing, crystals are removed
from calculations when determining the NA. The simultaneous growth of crystals and
vesicles in the modal clasts of both samples generated uncertainties as to which crystals
should and should not be removed from such calculations. During the GIMP image
cleaning process, phenocrysts and crystals that interfere with the growth of vesicles are
removed from the ‘melt’. If crystals do not interfere with vesicle development, the area
they occupy is included in the ‘melt’ portion of the sample for further analysis.
Inconsistencies during this step arose within the PC and RC modal-density samples as
crystals of similar sizes appeared to be growing into the vesicles while others were being
destroyed by the vesicles. This is likely due to the simultaneous growth of larger crystals
and vesicles during fragmentation. Therefore, discrepancies in removing or adding crystals
from/to the calculations could influence the results.
Calculations were made for the samples with a significant increase and decrease of crystal
abundance and the results show only minor discrepancies with the original values. As can
be seen in table 7.2, an increase in the number of crystals within the samples cause the NVM
to shift toward higher values, as with the opposite when the number of crystals is
decreased. If the number of crystals have hence been over- or under-estimated, the results
would be expected to shift in relation to table 7.2. However, the values used are extreme
variations of 50 % of the overall crystal abundance and show only minor influence (up to
2.0 % change) in the results. Therefore, it can be stated that discrepancies in the selection
of crystals for calculations will have a relatively negligible effect on the overall results.
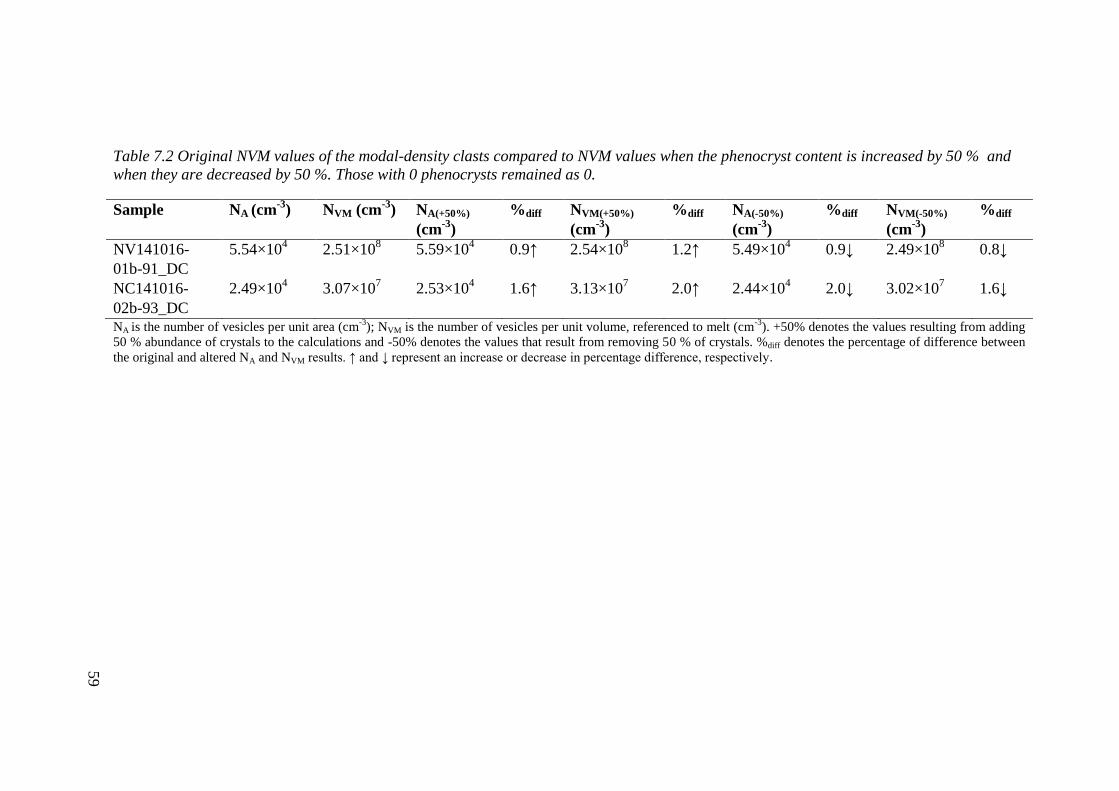
59
Table 7.2 Original NVM values of the modal-density clasts compared to NVM values when the phenocryst content is increased by 50 % and
when they are decreased by 50 %. Those with 0 phenocrysts remained as 0.
Sample NA (cm-3
) NVM (cm-3
) NA(+50%)
(cm-3
)
%diff NVM(+50%)
(cm-3
)
%diff NA(-50%)
(cm-3
)
%diff NVM(-50%)
(cm-3
)
%diff
NV141016-
01b-91_DC
5.54×10⁴ 2.51×10
8 5.59×10
4 0.9↑ 2.54×10
8 1.2↑ 5.49×10
4 0.9↓ 2.49×10
8 0.8↓
NC141016-
02b-93_DC
2.49×10⁴ 3.07×10
7 2.53×10
4 1.6↑ 3.13×10
7 2.0↑ 2.44×10
4 2.0↓ 3.02×10
7 1.6↓
NA is the number of vesicles per unit area (cm-3
); NVM is the number of vesicles per unit volume, referenced to melt (cm-3
). +50% denotes the values resulting from adding
50 % abundance of crystals to the calculations and -50% denotes the values that result from removing 50 % of crystals. %diff denotes the percentage of difference between
the original and altered NA and NVM results. ↑ and ↓ represent an increase or decrease in percentage difference, respectively.
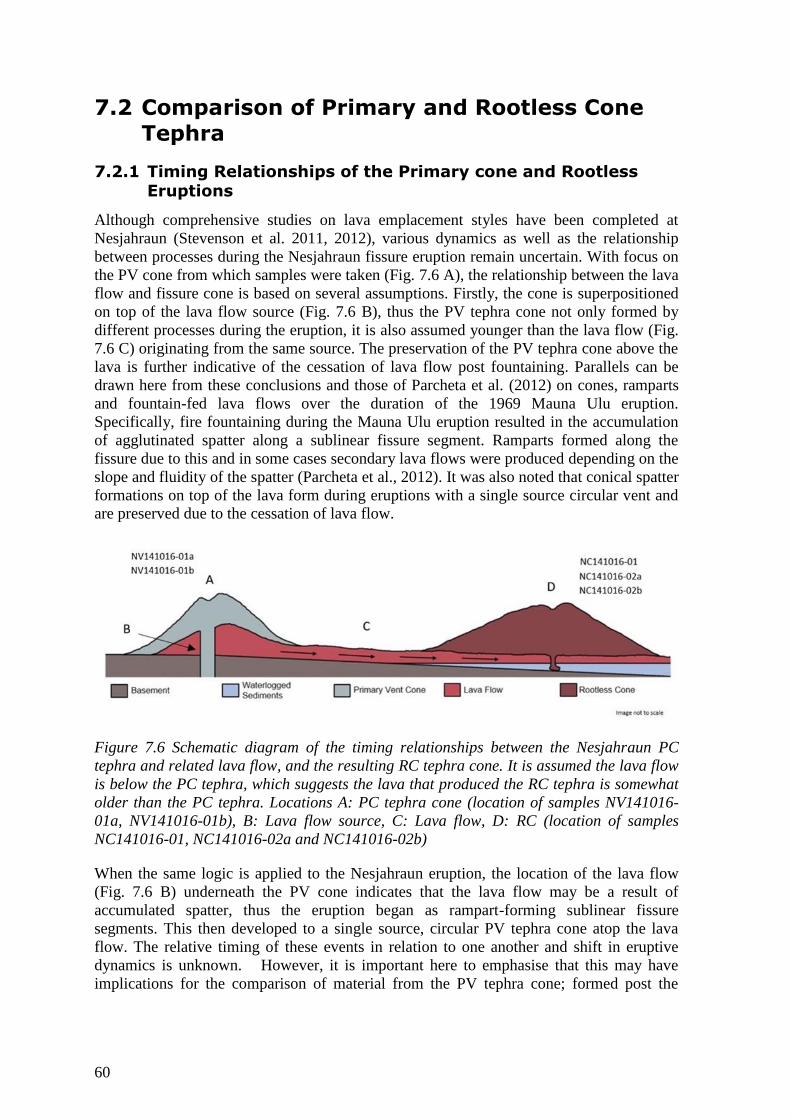
60
7.2 Comparison of Primary and Rootless Cone
Tephra
7.2.1 Timing Relationships of the Primary cone and Rootless Eruptions
Although comprehensive studies on lava emplacement styles have been completed at
Nesjahraun (Stevenson et al. 2011, 2012), various dynamics as well as the relationship
between processes during the Nesjahraun fissure eruption remain uncertain. With focus on
the PV cone from which samples were taken (Fig. 7.6 A), the relationship between the lava
flow and fissure cone is based on several assumptions. Firstly, the cone is superpositioned
on top of the lava flow source (Fig. 7.6 B), thus the PV tephra cone not only formed by
different processes during the eruption, it is also assumed younger than the lava flow (Fig.
7.6 C) originating from the same source. The preservation of the PV tephra cone above the
lava is further indicative of the cessation of lava flow post fountaining. Parallels can be
drawn here from these conclusions and those of Parcheta et al. (2012) on cones, ramparts
and fountain-fed lava flows over the duration of the 1969 Mauna Ulu eruption.
Specifically, fire fountaining during the Mauna Ulu eruption resulted in the accumulation
of agglutinated spatter along a sublinear fissure segment. Ramparts formed along the
fissure due to this and in some cases secondary lava flows were produced depending on the
slope and fluidity of the spatter (Parcheta et al., 2012). It was also noted that conical spatter
formations on top of the lava form during eruptions with a single source circular vent and
are preserved due to the cessation of lava flow.
Figure 7.6 Schematic diagram of the timing relationships between the Nesjahraun PC
tephra and related lava flow, and the resulting RC tephra cone. It is assumed the lava flow
is below the PC tephra, which suggests the lava that produced the RC tephra is somewhat
older than the PC tephra. Locations A: PC tephra cone (location of samples NV141016-
01a, NV141016-01b), B: Lava flow source, C: Lava flow, D: RC (location of samples
NC141016-01, NC141016-02a and NC141016-02b)
When the same logic is applied to the Nesjahraun eruption, the location of the lava flow
(Fig. 7.6 B) underneath the PV cone indicates that the lava flow may be a result of
accumulated spatter, thus the eruption began as rampart-forming sublinear fissure
segments. This then developed to a single source, circular PV tephra cone atop the lava
flow. The relative timing of these events in relation to one another and shift in eruptive
dynamics is unknown. However, it is important here to emphasise that this may have
implications for the comparison of material from the PV tephra cone; formed post the
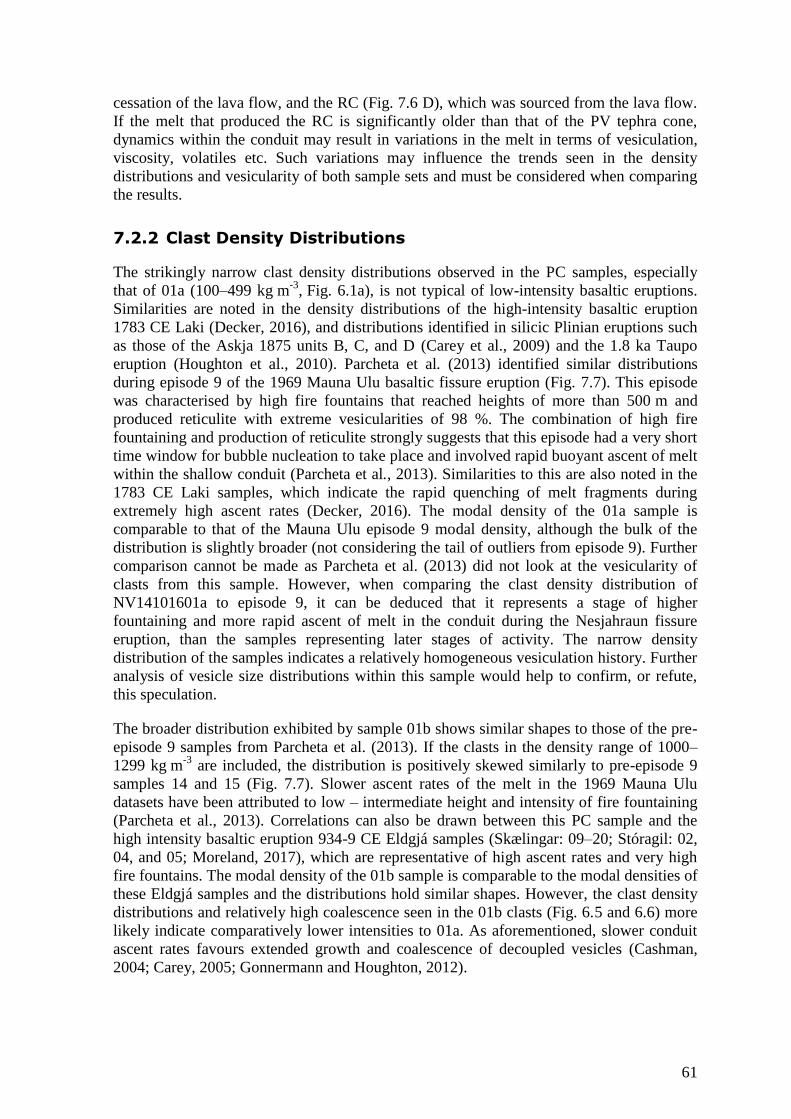
61
cessation of the lava flow, and the RC (Fig. 7.6 D), which was sourced from the lava flow.
If the melt that produced the RC is significantly older than that of the PV tephra cone,
dynamics within the conduit may result in variations in the melt in terms of vesiculation,
viscosity, volatiles etc. Such variations may influence the trends seen in the density
distributions and vesicularity of both sample sets and must be considered when comparing
the results.
7.2.2 Clast Density Distributions
The strikingly narrow clast density distributions observed in the PC samples, especially
that of 01a (100–499 kg m-3
, Fig. 6.1a), is not typical of low-intensity basaltic eruptions.
Similarities are noted in the density distributions of the high-intensity basaltic eruption
1783 CE Laki (Decker, 2016), and distributions identified in silicic Plinian eruptions such
as those of the Askja 1875 units B, C, and D (Carey et al., 2009) and the 1.8 ka Taupo
eruption (Houghton et al., 2010). Parcheta et al. (2013) identified similar distributions
during episode 9 of the 1969 Mauna Ulu basaltic fissure eruption (Fig. 7.7). This episode
was characterised by high fire fountains that reached heights of more than 500 m and
produced reticulite with extreme vesicularities of 98 %. The combination of high fire
fountaining and production of reticulite strongly suggests that this episode had a very short
time window for bubble nucleation to take place and involved rapid buoyant ascent of melt
within the shallow conduit (Parcheta et al., 2013). Similarities to this are also noted in the
1783 CE Laki samples, which indicate the rapid quenching of melt fragments during
extremely high ascent rates (Decker, 2016). The modal density of the 01a sample is
comparable to that of the Mauna Ulu episode 9 modal density, although the bulk of the
distribution is slightly broader (not considering the tail of outliers from episode 9). Further
comparison cannot be made as Parcheta et al. (2013) did not look at the vesicularity of
clasts from this sample. However, when comparing the clast density distribution of
NV14101601a to episode 9, it can be deduced that it represents a stage of higher
fountaining and more rapid ascent of melt in the conduit during the Nesjahraun fissure
eruption, than the samples representing later stages of activity. The narrow density
distribution of the samples indicates a relatively homogeneous vesiculation history. Further
analysis of vesicle size distributions within this sample would help to confirm, or refute,
this speculation.
The broader distribution exhibited by sample 01b shows similar shapes to those of the pre-
episode 9 samples from Parcheta et al. (2013). If the clasts in the density range of 1000–
1299 kg m-3
are included, the distribution is positively skewed similarly to pre-episode 9
samples 14 and 15 (Fig. 7.7). Slower ascent rates of the melt in the 1969 Mauna Ulu
datasets have been attributed to low – intermediate height and intensity of fire fountaining
(Parcheta et al., 2013). Correlations can also be drawn between this PC sample and the
high intensity basaltic eruption 934-9 CE Eldgjá samples (Skælingar: 09–20; Stóragil: 02,
04, and 05; Moreland, 2017), which are representative of high ascent rates and very high
fire fountains. The modal density of the 01b sample is comparable to the modal densities of
these Eldgjá samples and the distributions hold similar shapes. However, the clast density
distributions and relatively high coalescence seen in the 01b clasts (Fig. 6.5 and 6.6) more
likely indicate comparatively lower intensities to 01a. As aforementioned, slower conduit
ascent rates favours extended growth and coalescence of decoupled vesicles (Cashman,
2004; Carey, 2005; Gonnermann and Houghton, 2012).
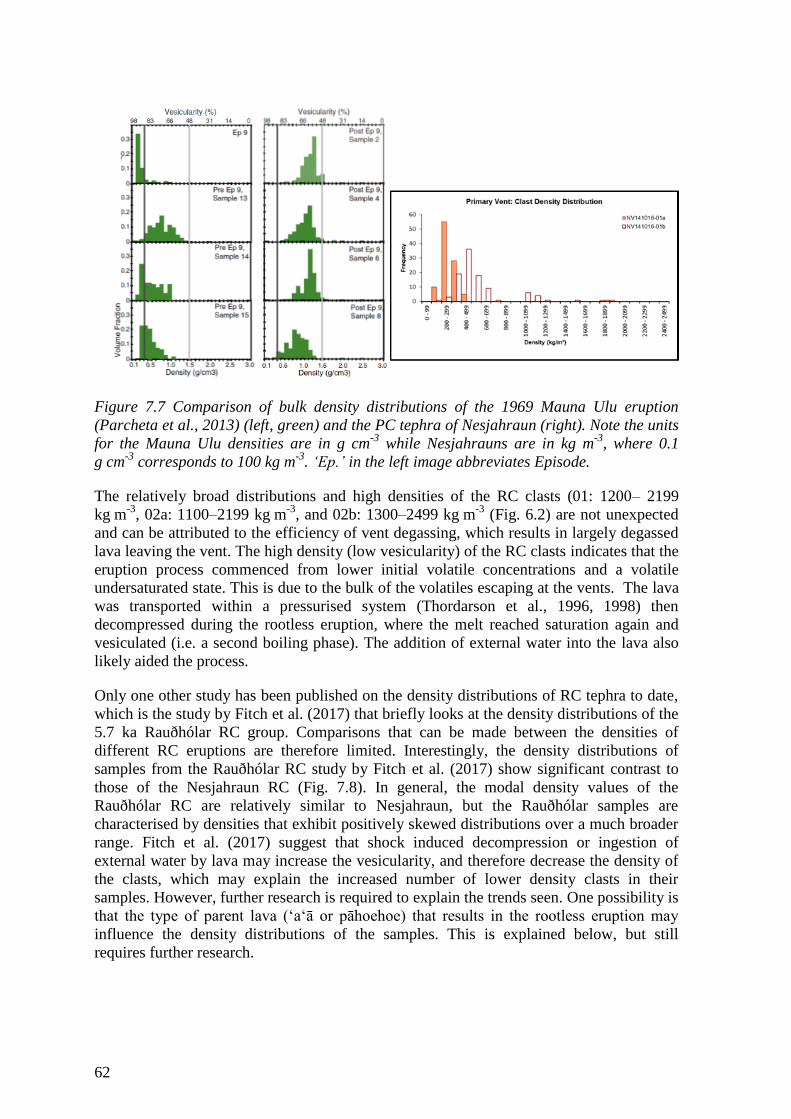
62
Figure 7.7 Comparison of bulk density distributions of the 1969 Mauna Ulu eruption
(Parcheta et al., 2013) (left, green) and the PC tephra of Nesjahraun (right). Note the units
for the Mauna Ulu densities are in g cm-3
while Nesjahrauns are in kg m-3
, where 0.1
g cm-3
corresponds to 100 kg m-3
. ‘Ep.’ in the left image abbreviates Episode.
The relatively broad distributions and high densities of the RC clasts (01: 1200– 2199
kg m-3
, 02a: 1100–2199 kg m-3
, and 02b: 1300–2499 kg m-3
(Fig. 6.2) are not unexpected
and can be attributed to the efficiency of vent degassing, which results in largely degassed
lava leaving the vent. The high density (low vesicularity) of the RC clasts indicates that the
eruption process commenced from lower initial volatile concentrations and a volatile
undersaturated state. This is due to the bulk of the volatiles escaping at the vents. The lava
was transported within a pressurised system (Thordarson et al., 1996, 1998) then
decompressed during the rootless eruption, where the melt reached saturation again and
vesiculated (i.e. a second boiling phase). The addition of external water into the lava also
likely aided the process.
Only one other study has been published on the density distributions of RC tephra to date,
which is the study by Fitch et al. (2017) that briefly looks at the density distributions of the
5.7 ka Rauðhólar RC group. Comparisons that can be made between the densities of
different RC eruptions are therefore limited. Interestingly, the density distributions of
samples from the Rauðhólar RC study by Fitch et al. (2017) show significant contrast to
those of the Nesjahraun RC (Fig. 7.8). In general, the modal density values of the
Rauðhólar RC are relatively similar to Nesjahraun, but the Rauðhólar samples are
characterised by densities that exhibit positively skewed distributions over a much broader
range. Fitch et al. (2017) suggest that shock induced decompression or ingestion of
external water by lava may increase the vesicularity, and therefore decrease the density of
the clasts, which may explain the increased number of lower density clasts in their
samples. However, further research is required to explain the trends seen. One possibility is
that the type of parent lava (‘a‘ā or pāhoehoe) that results in the rootless eruption may
influence the density distributions of the samples. This is explained below, but still
requires further research.
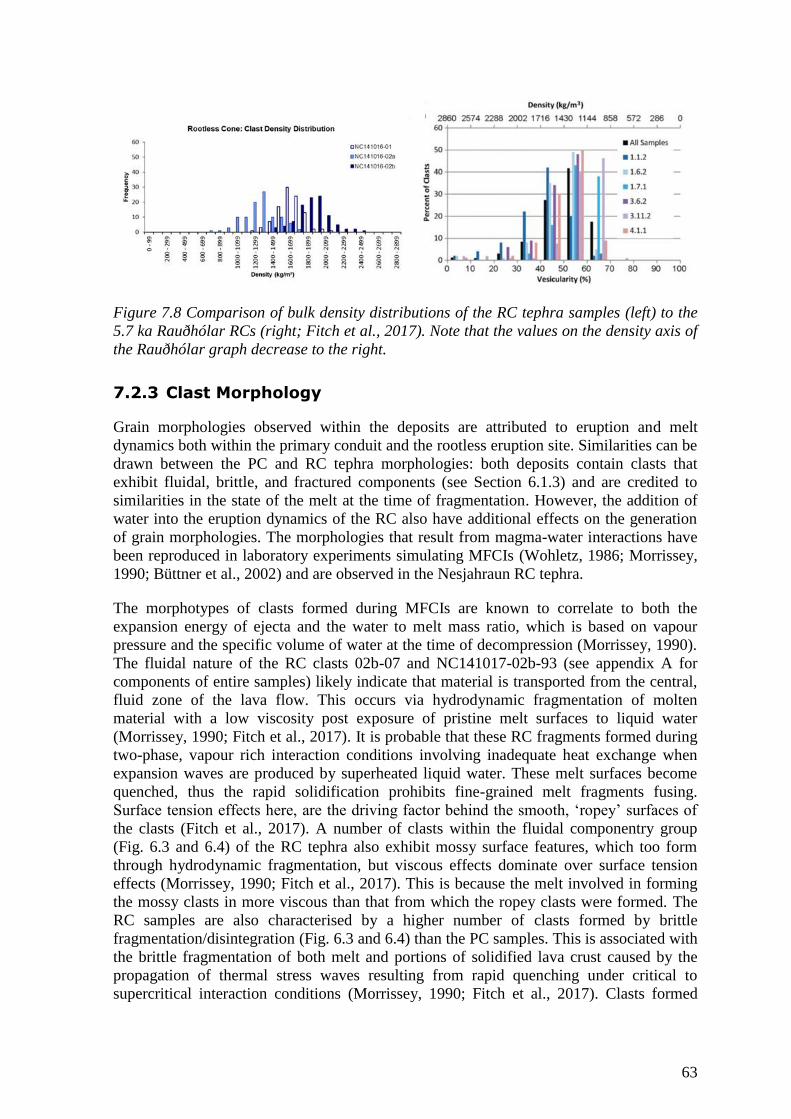
63
Figure 7.8 Comparison of bulk density distributions of the RC tephra samples (left) to the
5.7 ka Rauðhólar RCs (right; Fitch et al., 2017). Note that the values on the density axis of
the Rauðhólar graph decrease to the right.
7.2.3 Clast Morphology
Grain morphologies observed within the deposits are attributed to eruption and melt
dynamics both within the primary conduit and the rootless eruption site. Similarities can be
drawn between the PC and RC tephra morphologies: both deposits contain clasts that
exhibit fluidal, brittle, and fractured components (see Section 6.1.3) and are credited to
similarities in the state of the melt at the time of fragmentation. However, the addition of
water into the eruption dynamics of the RC also have additional effects on the generation
of grain morphologies. The morphologies that result from magma-water interactions have
been reproduced in laboratory experiments simulating MFCIs (Wohletz, 1986; Morrissey,
1990; Büttner et al., 2002) and are observed in the Nesjahraun RC tephra.
The morphotypes of clasts formed during MFCIs are known to correlate to both the
expansion energy of ejecta and the water to melt mass ratio, which is based on vapour
pressure and the specific volume of water at the time of decompression (Morrissey, 1990).
The fluidal nature of the RC clasts 02b-07 and NC141017-02b-93 (see appendix A for
components of entire samples) likely indicate that material is transported from the central,
fluid zone of the lava flow. This occurs via hydrodynamic fragmentation of molten
material with a low viscosity post exposure of pristine melt surfaces to liquid water
(Morrissey, 1990; Fitch et al., 2017). It is probable that these RC fragments formed during
two-phase, vapour rich interaction conditions involving inadequate heat exchange when
expansion waves are produced by superheated liquid water. These melt surfaces become
quenched, thus the rapid solidification prohibits fine-grained melt fragments fusing.
Surface tension effects here, are the driving factor behind the smooth, ‘ropey’ surfaces of
the clasts (Fitch et al., 2017). A number of clasts within the fluidal componentry group
(Fig. 6.3 and 6.4) of the RC tephra also exhibit mossy surface features, which too form
through hydrodynamic fragmentation, but viscous effects dominate over surface tension
effects (Morrissey, 1990; Fitch et al., 2017). This is because the melt involved in forming
the mossy clasts in more viscous than that from which the ropey clasts were formed. The
RC samples are also characterised by a higher number of clasts formed by brittle
fragmentation/disintegration (Fig. 6.3 and 6.4) than the PC samples. This is associated with
the brittle fragmentation of both melt and portions of solidified lava crust caused by the
propagation of thermal stress waves resulting from rapid quenching under critical to
supercritical interaction conditions (Morrissey, 1990; Fitch et al., 2017). Clasts formed

64
from the brittle fragmentation of solidified crust are typically hypohaline to hypocrystalline
and coarsely vesicular with large spherical, often coalesced vesicles. Those formed from
the brittle fragmentation of melt are glassy, with small vesicles and relatively low
vesicularities. Within the RC tephra, polygonal cracks (Fig. 6.3) are observed on both
vesicular and very dense fluidal clasts and are therefore likely not associated with the
expansion of volatiles as is the case with PC tephra. These features are instead related to
enhanced cooling of the clast due to syn-depositional interaction with water or steam (Fitch
et al., 2017).
The fluidal morphology of the PC clasts, such as 01b-89 (see appendix A for components
of entire samples) indicates that it is generated from deformable melt that quenched shortly
after fragmentation, without undergoing any significant post-fragmentation expansion
(Stovall et al., 2011). In this case, surface tension effects are likely to drive the stretching
of the melt to form a ‘ropey surface’ (Fitch et al., 2017). How deformable the melt is,
however, is highly dependent on vesicularity (i.e. higher vesicularity equals higher yield
strength). High velocity streaming of hot magmatic gasses around fragments as they are
ejected from the vent induces fusion (Thordarson et al., 1996) and may also result in
fluidal surface textures. The polygonal cracks on the surface of clast 01b-91 are associated
with continued expansion of vesicles in the interior of the clast during prolonged
suspension at higher elevations in the fire fountain (Stovall et al., 2012), rather than by
enhanced cooling as in the RC clasts. Transitional clasts with non-ropey surface textures,
similar to those of the mossy clasts in the RC samples, are included within the fluidal
componentry group of the PC samples. A higher percentage of the transitional clasts within
the fluidal componentry group, as compared to fluidal clasts, of sample 01a supports the
assumption that the clasts in this sample were produced during an episode of more
intensive fire fountaining compared to 01b, as described in section 7.2.2.
7.2.4 Textural Analysis
In general, as outlined in section 6.2.1, the PC tephra clasts exhibit trains of coalesced, oval
to polygonal shaped vesicles in a microlite rich matrix. In a low viscosity melt such as this,
in the case of sample 01b, relatively slower ascent rates within the conduit favours
extended growth and increased coalescence of decoupled vesicles (Cashman, 2004; Carey,
2005; Gonnermann and Houghton, 2012), which is supported by the density distributions
explained in section 7.2.2. Considering the high degree of coalescence, the vesicle
populations within the clasts are relatively mature. Although minor shape relaxation
indicates that some outgassing may have occurred (i.e. 01b-89), the majority of the sample
has not entirely reached this stage (Bruce Houghton, personal correspondence, 2017). In
contrast, the clast density distribution of sample 01a shows signs of rapid ascent (refer to
Section 7.2.2), however further in depth analysis of this sample was not undertaken.
A portion of the PC tephra clasts examined in this study exhibit clear evidence of post
fragmentation expansion implied by bread crust surface features. These are interpreted to
be extensional fractures formed by inflation while the central vesicles continued to expand
post-surface cooling. A significant number of these clasts are identified in sample 01b
compared to 01a (see Fig. 6.4; fractured component). This suggests that post-fragmentation
expansion becomes increasingly abundant over the duration of the eruption. These features
should be taken into account when later stage samples are analysed as VND and VVD
results are not representative exclusively of the conduit processes. Bread crusting texture is
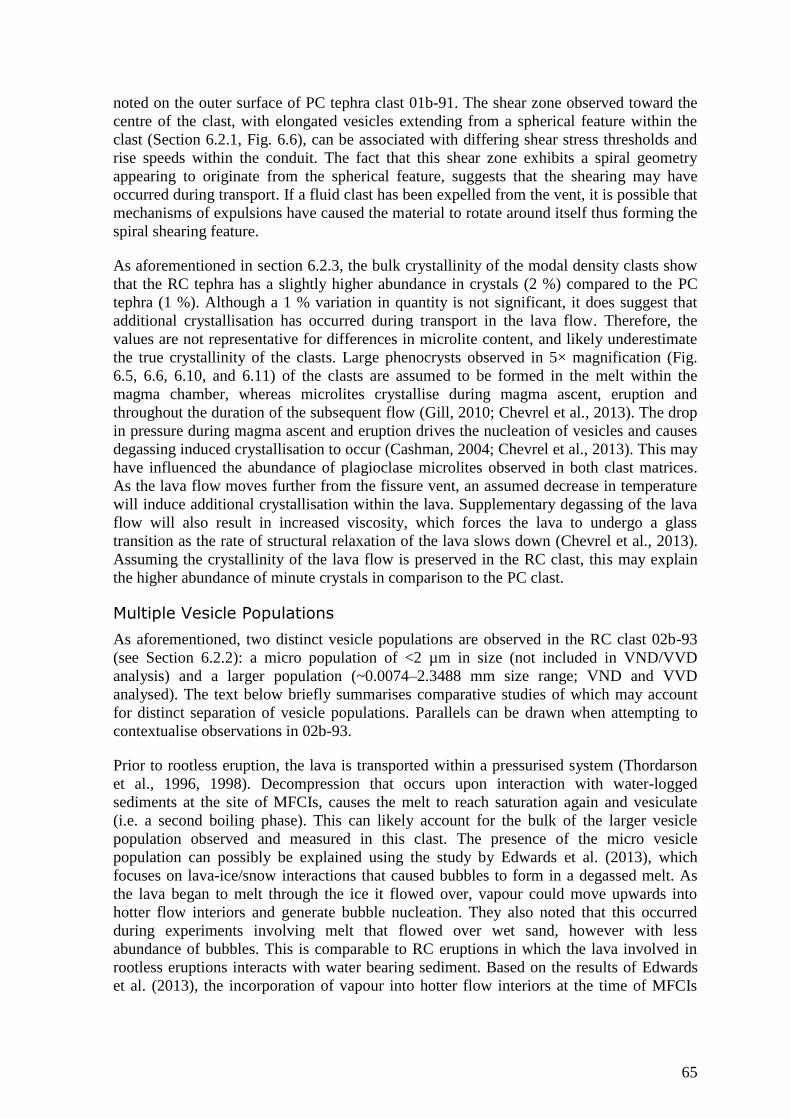
65
noted on the outer surface of PC tephra clast 01b-91. The shear zone observed toward the
centre of the clast, with elongated vesicles extending from a spherical feature within the
clast (Section 6.2.1, Fig. 6.6), can be associated with differing shear stress thresholds and
rise speeds within the conduit. The fact that this shear zone exhibits a spiral geometry
appearing to originate from the spherical feature, suggests that the shearing may have
occurred during transport. If a fluid clast has been expelled from the vent, it is possible that
mechanisms of expulsions have caused the material to rotate around itself thus forming the
spiral shearing feature.
As aforementioned in section 6.2.3, the bulk crystallinity of the modal density clasts show
that the RC tephra has a slightly higher abundance in crystals (2 %) compared to the PC
tephra (1 %). Although a 1 % variation in quantity is not significant, it does suggest that
additional crystallisation has occurred during transport in the lava flow. Therefore, the
values are not representative for differences in microlite content, and likely underestimate
the true crystallinity of the clasts. Large phenocrysts observed in 5× magnification (Fig.
6.5, 6.6, 6.10, and 6.11) of the clasts are assumed to be formed in the melt within the
magma chamber, whereas microlites crystallise during magma ascent, eruption and
throughout the duration of the subsequent flow (Gill, 2010; Chevrel et al., 2013). The drop
in pressure during magma ascent and eruption drives the nucleation of vesicles and causes
degassing induced crystallisation to occur (Cashman, 2004; Chevrel et al., 2013). This may
have influenced the abundance of plagioclase microlites observed in both clast matrices.
As the lava flow moves further from the fissure vent, an assumed decrease in temperature
will induce additional crystallisation within the lava. Supplementary degassing of the lava
flow will also result in increased viscosity, which forces the lava to undergo a glass
transition as the rate of structural relaxation of the lava slows down (Chevrel et al., 2013).
Assuming the crystallinity of the lava flow is preserved in the RC clast, this may explain
the higher abundance of minute crystals in comparison to the PC clast.
Multiple Vesicle Populations
As aforementioned, two distinct vesicle populations are observed in the RC clast 02b-93
(see Section 6.2.2): a micro population of <2 µm in size (not included in VND/VVD
analysis) and a larger population (~0.0074–2.3488 mm size range; VND and VVD
analysed). The text below briefly summarises comparative studies of which may account
for distinct separation of vesicle populations. Parallels can be drawn when attempting to
contextualise observations in 02b-93.
Prior to rootless eruption, the lava is transported within a pressurised system (Thordarson
et al., 1996, 1998). Decompression that occurs upon interaction with water-logged
sediments at the site of MFCIs, causes the melt to reach saturation again and vesiculate
(i.e. a second boiling phase). This can likely account for the bulk of the larger vesicle
population observed and measured in this clast. The presence of the micro vesicle
population can possibly be explained using the study by Edwards et al. (2013), which
focuses on lava-ice/snow interactions that caused bubbles to form in a degassed melt. As
the lava began to melt through the ice it flowed over, vapour could move upwards into
hotter flow interiors and generate bubble nucleation. They also noted that this occurred
during experiments involving melt that flowed over wet sand, however with less
abundance of bubbles. This is comparable to RC eruptions in which the lava involved in
rootless eruptions interacts with water bearing sediment. Based on the results of Edwards
et al. (2013), the incorporation of vapour into hotter flow interiors at the time of MFCIs
66
could induce nucleation and vesicle growth. The minute size of the vesicles is likely
related to degassing during lava transport prior to MFCI. Newly formed vesicles have
limited existing volatiles to remove from the melt and are therefore unable to grow due to
diffusion.
Lacustrine Sediment Inclusions
The lacustrine sediments in RC tephra clasts 02a-13, 02b-86, 02a-57, and 02b-57 (see
Section 6.2.2) infill vesicles, similar to observations made at Mývatn (Frances Boreham,
personal communication, 2017). Although material is observed in the Rauðhólar clasts, the
location of sediments appears to be isolated to small folds in the clasts and is not present in
vesicle (Fitch et al. 2017; refer to Fig. 7.9a). Small vesicles (<200 µm) are seen
surrounding the outer portion of the sediment infill, thought to be vapourised water from
the pore spaces between the sediments (Fitch et al., 2017). This indicates that some degree
of vesicle nucleation and growth may originate from the ingestion of external water within
the lava. In comparison, the Nesjahraun samples do not exhibit sediment infill within folds
of fluidal clasts. Instead, isolated spherical vesicles near the perimeter of the clast are filled
with the lacustrine sediment. The isolation of the vesicles indicates the sediment was
incorporated into the lava during MFCI, rather than post-deposition. There is currently no
explanation for such incidences within RC tephra and further research is required to
provide reliable and detailed reasoning. However, one possible explanation is that the
explosion has resulted in sedimentary material intermingling with the lava, which
enveloped the sediment pre- to syn-fragmentation. Water trapped within the pore spaces of
the sediment may then influence the shape of the envelope, vapourising and forcing the
envelope to form a spherical gas pocket. This feature may be capturing the portion of lava
that penetrated the basal crust and was therefore involved in the initial MFCI stage.
Armoured Clasts
Nesjahraun samples also possess a significant number of armoured clasts (e.g. Fig. 6.17
and 6.18). These features occur via recycling of ejected material when ejected clasts may
fall into a portion of melt within the vent before being re-ejected (Fitch et al., 2017). The
central feature of each of these clasts is significantly different in colour, microstructure and
potentially composition from that of the outer armour material. The assumption is that the
central features are foreign to the 1.9 ka Nesjahraun event, possibly lithics or fragmented
pieces of previously emplaced lava and may therefore cause density results to be
unrepresentative of the erupted material.
7.2.5 Vesicle Number and Volume Distributions
Primary cone versus Rootless Cone
Comparisons of the VVDs of the PC and RC modal density clasts (Fig. 7.10) show
significant differences in the shapes of the distributions. Notably, the PC clast is
characterised by significantly higher volume fractions of vesicles than the RC clast. This is
attributed to significant degassing prior to rootless eruption which results in a considerably
lower quantity of vesicles preserved in the RC tephra. Both datasets do, however, fall
within a similar overall vesicle size range. This may imply that, vesicles are not preserved
from the primary conduit as continuous expansion of vesicles is expected during transport
within the lava flow; instead they are likely to be formed in situ in the lava flow. It would
be expected that, if the vesicles were preserved from the primary conduit, they would
67
exhibit significantly larger sizes within the RC tephra. It also shows that degassing has
drastically reduced the number of vesicles within the RC tephra.
Figure 7.9 Comparison of lacustrine sediment within Rauðhólar and Nesjahraun RC
clasts. a) Images collected by Fitch et al. (2017) that show lacustrine sediment confined
within submillimeter folds of a fluidal grain from Rauðhólar. b) portion of scanned thin
section showing vesicles on the perimeter of clast NC141016-02a-57 filled with lacustrine
sediment (red) and an inset of the lacustrine sediment within a relatively spherical vesicle
captured in optical light on a binocular microscope.
The CVVD (Fig. 7.11) of both clasts also indicates that there is little difference in the
overall VVDs between the PC and RC tephra. Between ~0.1170 and 0.4659 mm the RC
clast has a relatively steeper slope than the PC clast, indicating that most of the vesicle
volume is accounted for within a narrower size range in the RC clast. The PC tephra has
greater vesicle volume (i.e. more vesicles) in the overall vesicle size bins than the RC clast.
The median vesicle diameter is similar for both clasts, 01b-91 = 0.2718 mm and 02b-93 =
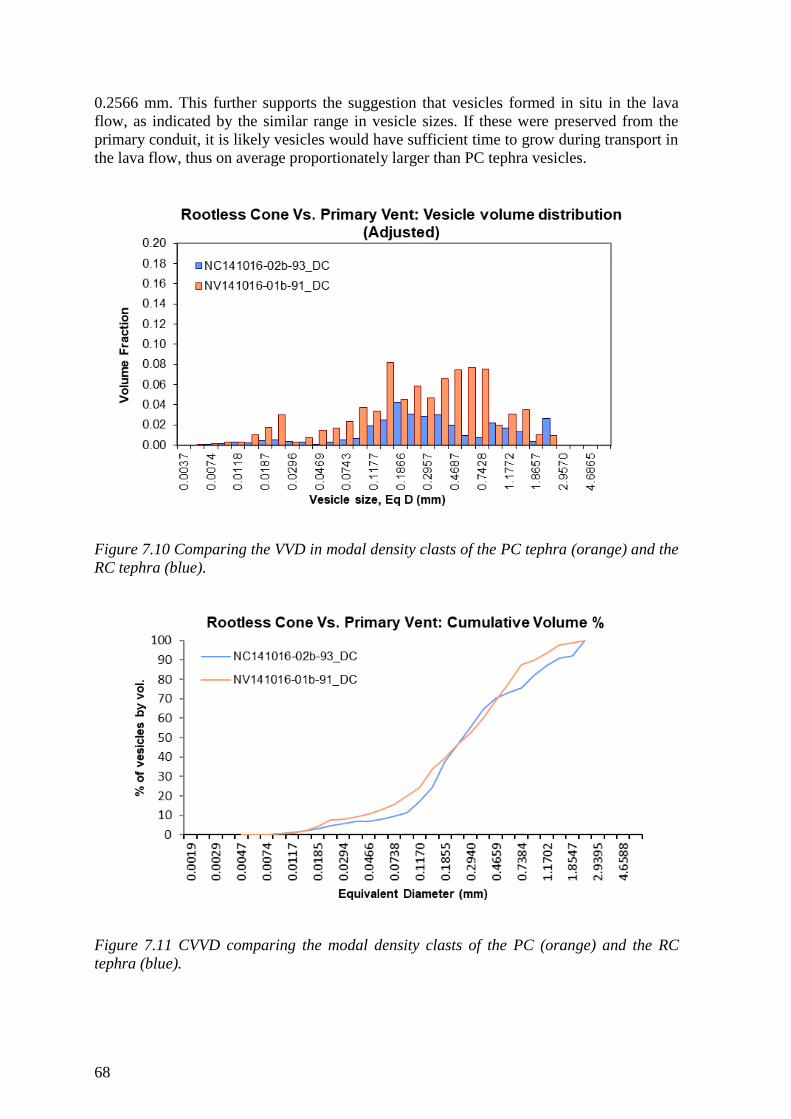
68
0.2566 mm. This further supports the suggestion that vesicles formed in situ in the lava
flow, as indicated by the similar range in vesicle sizes. If these were preserved from the
primary conduit, it is likely vesicles would have sufficient time to grow during transport in
the lava flow, thus on average proportionately larger than PC tephra vesicles.
Figure 7.10 Comparing the VVD in modal density clasts of the PC tephra (orange) and the
RC tephra (blue).
Figure 7.11 CVVD comparing the modal density clasts of the PC (orange) and the RC
tephra (blue).
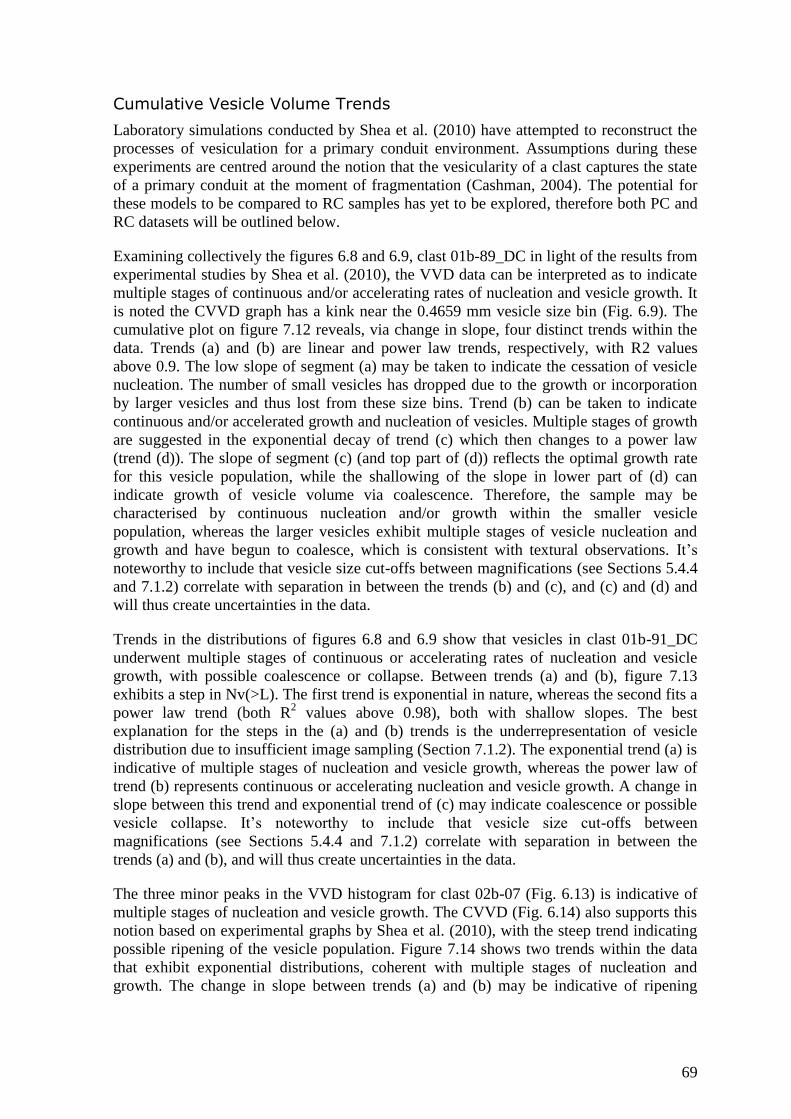
69
Cumulative Vesicle Volume Trends
Laboratory simulations conducted by Shea et al. (2010) have attempted to reconstruct the
processes of vesiculation for a primary conduit environment. Assumptions during these
experiments are centred around the notion that the vesicularity of a clast captures the state
of a primary conduit at the moment of fragmentation (Cashman, 2004). The potential for
these models to be compared to RC samples has yet to be explored, therefore both PC and
RC datasets will be outlined below.
Examining collectively the figures 6.8 and 6.9, clast 01b-89_DC in light of the results from
experimental studies by Shea et al. (2010), the VVD data can be interpreted as to indicate
multiple stages of continuous and/or accelerating rates of nucleation and vesicle growth. It
is noted the CVVD graph has a kink near the 0.4659 mm vesicle size bin (Fig. 6.9). The
cumulative plot on figure 7.12 reveals, via change in slope, four distinct trends within the
data. Trends (a) and (b) are linear and power law trends, respectively, with R2 values
above 0.9. The low slope of segment (a) may be taken to indicate the cessation of vesicle
nucleation. The number of small vesicles has dropped due to the growth or incorporation
by larger vesicles and thus lost from these size bins. Trend (b) can be taken to indicate
continuous and/or accelerated growth and nucleation of vesicles. Multiple stages of growth
are suggested in the exponential decay of trend (c) which then changes to a power law
(trend (d)). The slope of segment (c) (and top part of (d)) reflects the optimal growth rate
for this vesicle population, while the shallowing of the slope in lower part of (d) can
indicate growth of vesicle volume via coalescence. Therefore, the sample may be
characterised by continuous nucleation and/or growth within the smaller vesicle
population, whereas the larger vesicles exhibit multiple stages of vesicle nucleation and
growth and have begun to coalesce, which is consistent with textural observations. It’s
noteworthy to include that vesicle size cut-offs between magnifications (see Sections 5.4.4
and 7.1.2) correlate with separation in between the trends (b) and (c), and (c) and (d) and
will thus create uncertainties in the data.
Trends in the distributions of figures 6.8 and 6.9 show that vesicles in clast 01b-91_DC
underwent multiple stages of continuous or accelerating rates of nucleation and vesicle
growth, with possible coalescence or collapse. Between trends (a) and (b), figure 7.13
exhibits a step in Nv(>L). The first trend is exponential in nature, whereas the second fits a
power law trend (both R2 values above 0.98), both with shallow slopes. The best
explanation for the steps in the (a) and (b) trends is the underrepresentation of vesicle
distribution due to insufficient image sampling (Section 7.1.2). The exponential trend (a) is
indicative of multiple stages of nucleation and vesicle growth, whereas the power law of
trend (b) represents continuous or accelerating nucleation and vesicle growth. A change in
slope between this trend and exponential trend of (c) may indicate coalescence or possible
vesicle collapse. It’s noteworthy to include that vesicle size cut-offs between
magnifications (see Sections 5.4.4 and 7.1.2) correlate with separation in between the
trends (a) and (b), and will thus create uncertainties in the data.
The three minor peaks in the VVD histogram for clast 02b-07 (Fig. 6.13) is indicative of
multiple stages of nucleation and vesicle growth. The CVVD (Fig. 6.14) also supports this
notion based on experimental graphs by Shea et al. (2010), with the steep trend indicating
possible ripening of the vesicle population. Figure 7.14 shows two trends within the data
that exhibit exponential distributions, coherent with multiple stages of nucleation and
growth. The change in slope between trends (a) and (b) may be indicative of ripening
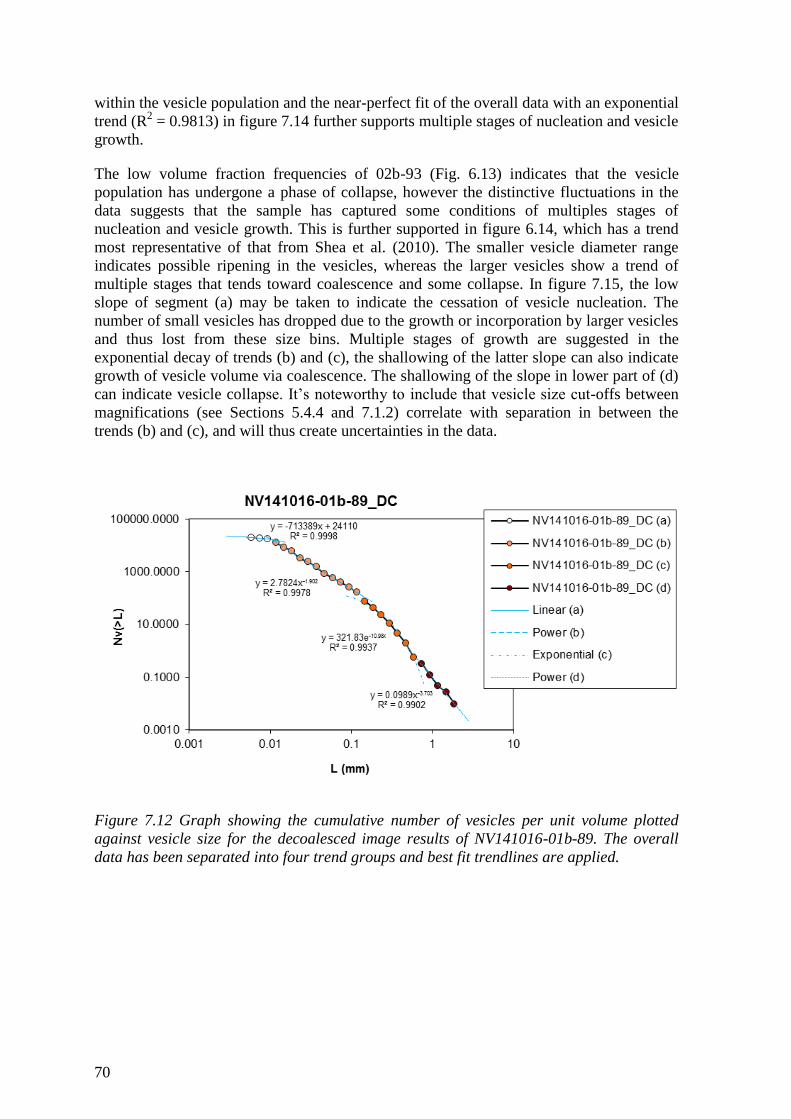
70
within the vesicle population and the near-perfect fit of the overall data with an exponential
trend (R2 = 0.9813) in figure 7.14 further supports multiple stages of nucleation and vesicle
growth.
The low volume fraction frequencies of 02b-93 (Fig. 6.13) indicates that the vesicle
population has undergone a phase of collapse, however the distinctive fluctuations in the
data suggests that the sample has captured some conditions of multiples stages of
nucleation and vesicle growth. This is further supported in figure 6.14, which has a trend
most representative of that from Shea et al. (2010). The smaller vesicle diameter range
indicates possible ripening in the vesicles, whereas the larger vesicles show a trend of
multiple stages that tends toward coalescence and some collapse. In figure 7.15, the low
slope of segment (a) may be taken to indicate the cessation of vesicle nucleation. The
number of small vesicles has dropped due to the growth or incorporation by larger vesicles
and thus lost from these size bins. Multiple stages of growth are suggested in the
exponential decay of trends (b) and (c), the shallowing of the latter slope can also indicate
growth of vesicle volume via coalescence. The shallowing of the slope in lower part of (d)
can indicate vesicle collapse. It’s noteworthy to include that vesicle size cut-offs between
magnifications (see Sections 5.4.4 and 7.1.2) correlate with separation in between the
trends (b) and (c), and will thus create uncertainties in the data.
Figure 7.12 Graph showing the cumulative number of vesicles per unit volume plotted
against vesicle size for the decoalesced image results of NV141016-01b-89. The overall
data has been separated into four trend groups and best fit trendlines are applied.
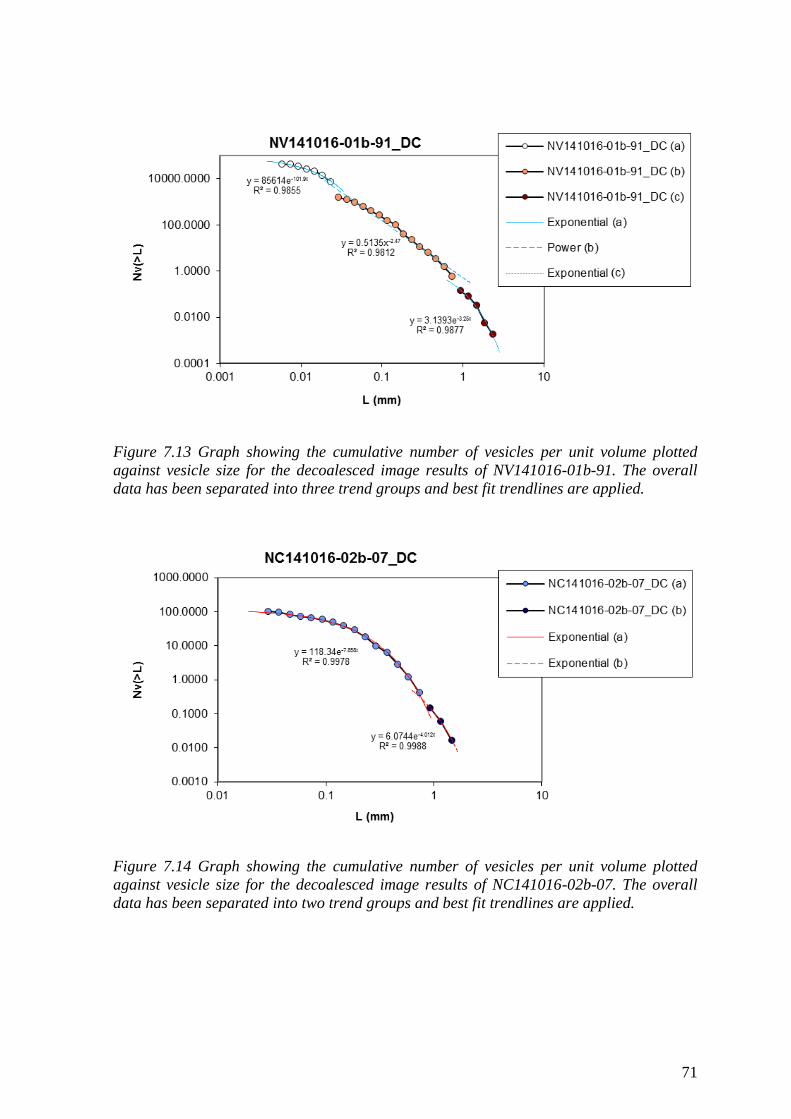
71
Figure 7.13 Graph showing the cumulative number of vesicles per unit volume plotted
against vesicle size for the decoalesced image results of NV141016-01b-91. The overall
data has been separated into three trend groups and best fit trendlines are applied.
Figure 7.14 Graph showing the cumulative number of vesicles per unit volume plotted
against vesicle size for the decoalesced image results of NC141016-02b-07. The overall
data has been separated into two trend groups and best fit trendlines are applied.
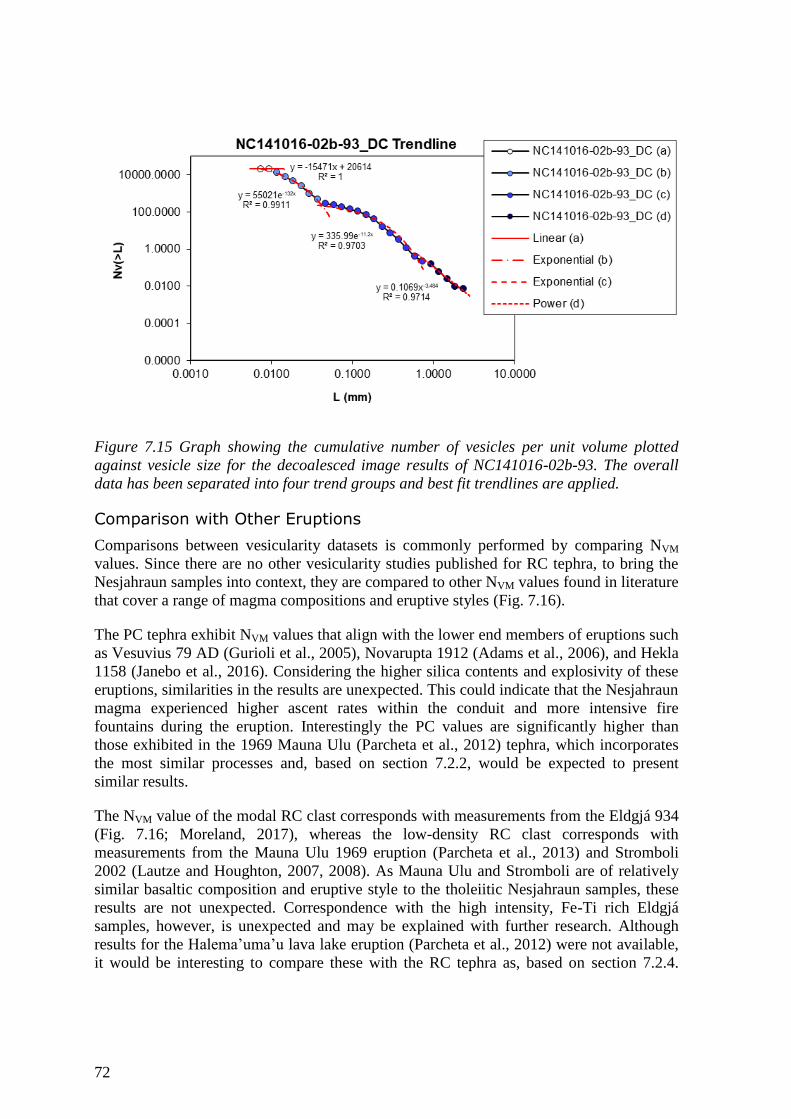
72
Figure 7.15 Graph showing the cumulative number of vesicles per unit volume plotted
against vesicle size for the decoalesced image results of NC141016-02b-93. The overall
data has been separated into four trend groups and best fit trendlines are applied.
Comparison with Other Eruptions
Comparisons between vesicularity datasets is commonly performed by comparing NVM
values. Since there are no other vesicularity studies published for RC tephra, to bring the
Nesjahraun samples into context, they are compared to other NVM values found in literature
that cover a range of magma compositions and eruptive styles (Fig. 7.16).
The PC tephra exhibit NVM values that align with the lower end members of eruptions such
as Vesuvius 79 AD (Gurioli et al., 2005), Novarupta 1912 (Adams et al., 2006), and Hekla
1158 (Janebo et al., 2016). Considering the higher silica contents and explosivity of these
eruptions, similarities in the results are unexpected. This could indicate that the Nesjahraun
magma experienced higher ascent rates within the conduit and more intensive fire
fountains during the eruption. Interestingly the PC values are significantly higher than
those exhibited in the 1969 Mauna Ulu (Parcheta et al., 2012) tephra, which incorporates
the most similar processes and, based on section 7.2.2, would be expected to present
similar results.
The NVM value of the modal RC clast corresponds with measurements from the Eldgjá 934
(Fig. 7.16; Moreland, 2017), whereas the low-density RC clast corresponds with
measurements from the Mauna Ulu 1969 eruption (Parcheta et al., 2013) and Stromboli
2002 (Lautze and Houghton, 2007, 2008). As Mauna Ulu and Stromboli are of relatively
similar basaltic composition and eruptive style to the tholeiitic Nesjahraun samples, these
results are not unexpected. Correspondence with the high intensity, Fe-Ti rich Eldgjá
samples, however, is unexpected and may be explained with further research. Although
results for the Halema’uma’u lava lake eruption (Parcheta et al., 2012) were not available,
it would be interesting to compare these with the RC tephra as, based on section 7.2.4.
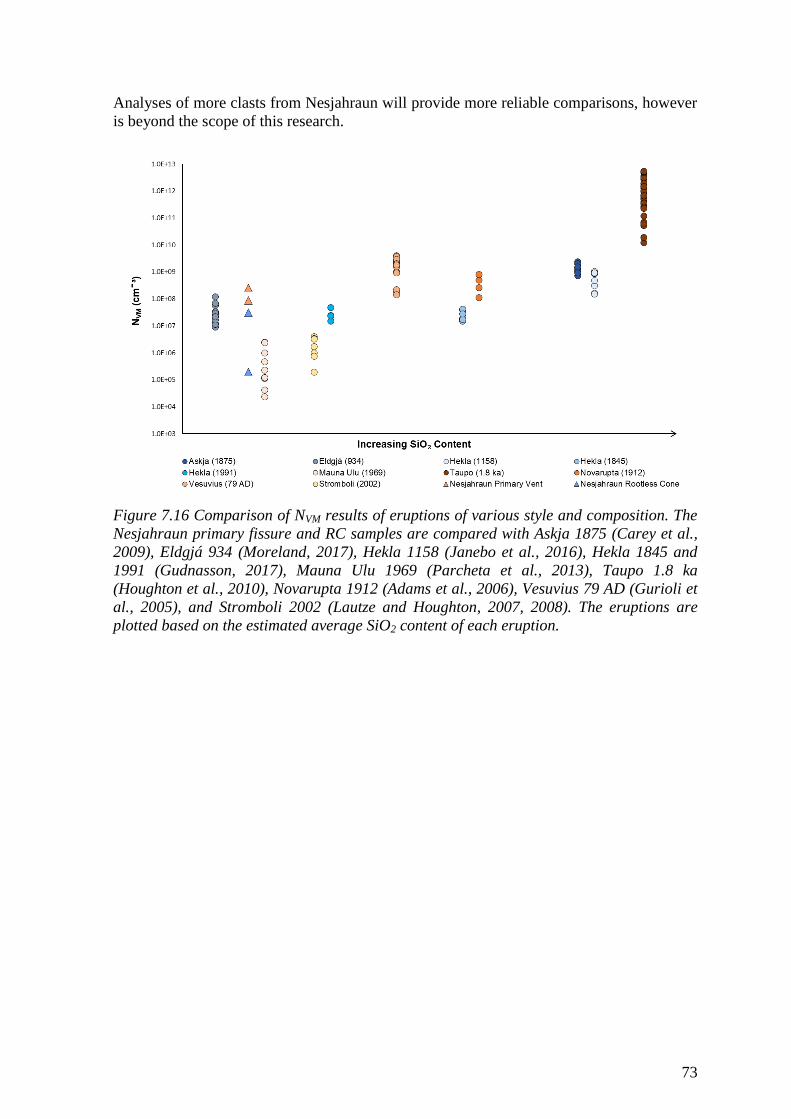
73
Analyses of more clasts from Nesjahraun will provide more reliable comparisons, however
is beyond the scope of this research.
Figure 7.16 Comparison of NVM results of eruptions of various style and composition. The
Nesjahraun primary fissure and RC samples are compared with Askja 1875 (Carey et al.,
2009), Eldgjá 934 (Moreland, 2017), Hekla 1158 (Janebo et al., 2016), Hekla 1845 and
1991 (Gudnasson, 2017), Mauna Ulu 1969 (Parcheta et al., 2013), Taupo 1.8 ka
(Houghton et al., 2010), Novarupta 1912 (Adams et al., 2006), Vesuvius 79 AD (Gurioli et
al., 2005), and Stromboli 2002 (Lautze and Houghton, 2007, 2008). The eruptions are
plotted based on the estimated average SiO2 content of each eruption.

75
8 Summary and Conclusions
Comparisons between the Nesjahraun PC and RC tephra samples have outlined a number
of distinctive differences between the morphologically similar formations and provide
insights into the history of the 1.9 ka Nesjahraun eruption.
The strikingly narrow density distribution of the PC sample 01a is unusual for low-
intensity basaltic eruptions and exhibit similarities to high-intensity basaltic eruptions such
as 1783-4 CE Laki (Decker, 2016) and the high fire fountaining episode of the 1969
Mauna Ulu eruption (Parcheta et al., 2013). Correlations can be drawn between the rapid
ascent of magma within the conduit of Mauna Ulu and conditions during a phase of
intense, high fire fountaining during the Nesjahraun eruption. Although clasts from this
sample were not analysed, it would be interesting to see if correlations can be made with
the vesicle number densities of the Mauna Ulu clasts. Sample 01b exhibits slightly broader
density distributions in comparison to 01a, which suggests this sample represents a stage of
decreased activity during the eruption. Assuming the decreased activity indicates relatively
lower ascent rates in the conduit, the decoupling of melt and vesicles allows vesicles to
grow and coalesce, which is consistent with observations made of clasts from the sample.
Although ascent rates are lower, the coupled growth of crystals and vesicles of the PC
clasts from sample 01b indicate that ascent rates were fast enough to initiate degassing
induced crystallisation in the conduit. VVDs support the observations of coalescence,
while also exhibiting multiple stages of continuous and/or accelerating nucleation and
growth of vesicles.
Significantly higher densities of the RC tephra as compared to the PC tephra are indicative
of excessive degassing at the primary conduit, which is exhibited in the RC vesicle
populations. The VVD histograms of the RC clasts show that degassing has significantly
reduced the number densities of vesicles, however the size distribution is comparable to the
PC, suggesting that the vesicles are not preserved from the primary conduit and are instead
formed in situ in the lava flow at the time of MFCI. Development of the lava throughout
transport is also preserved in the crystallinity of the RC samples. The presence of large
phenocrysts in both the RC and PC clasts indicates that crystallisation has been preserved
from the magma and primary conduit. An approximate 1 % increase in the bulk crystal
content of the RC clasts compared to the PC clasts, suggests that further crystallisation
occurred during transport of the lava.
The presence of both a small (~2 µm) and large (0.0074–2.3488 mm) vesicle population
within the modal clast of the RC tephra suggests that, in the larger population prior to
rootless eruption, the lava is transported in a pressurized system. Decompression that
occurs upon interaction with water logged sediments at the site of MFCI’s causes the melt
to reach saturation again and vesiculate. The smaller vesicle population possibly be
explained by conclusions drawn in Edwards et al. (2013), who proposes that the
incorporation of vapour into hotter flow interiors could induce nucleation and growth
during MFCIs. The small size of the vesicle population in this scenario can be attributed to
the viscous resistance of the lava and the lack of volatiles due to degassing, disallowing
extended growth of the vesicles.

76
Following this study, a number of questions and points have arisen that require further
research to fully understand. These include:
1. Is the incorporation of water during MFCIs influencing the shape and formation of
vesicles in the RC tephra?
2. Does the assumed lacustrine sediment identified within the RC samples have a
similar composition to that of Þingvallavatn, or do they have a different origin?
3. Comparative analysis of crystallinity between primary and RC tephra may help to
complete a more robust distinction between the morphologically similar
formations. It may also provide insight into the mechanisms behind the
simultaneous growth of crystals and vesicles in the primary and RC tephra.
4. Does the distance travelled by the lava influence the vesicularity of the RC tephra?
And is there a way to confirm the timing between tephra produced by a primary
conduit and tephra produce during rootless eruption? Further research of numerous
primary and RC combinations is required to complete a more robust distinction
between the morphologically similar formations.
5. Are rootless eruptions purely formed by MFCIs or is the fragmentation partially
driven by magmatic gases?
6. Due to the lack of correlation between number densities and eruption intensities in
the samples of the Nesjahraun eruption, further studies need to be pursued to
ascertain whether this is a product of bias in the data or whether vesicle number
densities are not a function of magma ascent rates in the PC or RC tephra from the
Nesjahraun eruption.
In conclusion, these observations identify distinctive differences between PC and RC
tephra in terms of overall vesicularity and the nature of the vesicle populations that typify
both tephra. The comparison of clast densities and vesicle size distributions of the primary
versus RC tephra show initial stages in developing robust distinctions between the
geometrically similar volcanic formations. Recognisable dissimilarities between sizes,
spatial arrangements, numbers and overall morphology of the vesicles within each tephra
type provide insights into the degassing and formation processes of both the primary vent
and the associated RC formation. Therefore, with further analysis, there is potential for
underpinning an identification and classification scheme for RC deposits.
77
References
Adams NK, Houghton BF, Fagents SA, Hildreth W (2006) The transition from explosive
to effusive eruptive regime: The example of the 1912 Novarupta eruption. Alaska.
Bull Geol Soc Am 118(5-6):620–634. doi: 10.1130/B25768.1
Bjarnason IÞ (2008) An Iceland hotspot saga. Jokull 58:3–16
Bonadonna C, Costa, A (2012) Estimating the volume of tephra deposits: A new simple
strategy. Geology 40(5):415-418. doi:10.1130/G32769.1
Bonadonna C, Houghton, BF (2005) Total grain-size distribution and volume of tephra-fall
deposits. Bull Volcanol 67(5):441-456. doi: 10.1007/s00445-004-0386-2
Bruno BC, Fagents SA, Hamilton CW, Burr DM, Baloga SM (2006) Identification of
volcanic rootless cones, ice mounds, and impact craters on Earth and Mars: Using
spatial distribution as a remote sensing tool. J Geophys Res E Planets 111 (E6). doi:
10.1029/2005JE002510
Bruno BC, Fagents SA, Thordarson T, Baloga SM, Pilger E (2004) Clustering within
rootless cone groups on Iceland and Mars: Effect of nonrandom processes. J
Geophys Res E Planets 109(E7):1–11. doi: 10.1029/2004JE002273
Büttner R, Dellino P, La Volpe L, Lorenz V, Zimanowski, B (2002) Thermohydraulic
explosions in phreatomagmatic eruptions as evidenced by the comparison between
pyroclasts and products from Molten Fuel Coolant Interaction experiments. J
Geophys Res Solid Earth 107(B11). doi: 10.1029/2001JB000511
Carey RJ, Houghton BF, Thordarson T (2009) Abrupt shifts between wet and dry phases of
the 1875 eruption of Askja Volcano: Microscopic evidence for macroscopic
dynamics. J Volcanol Geotherm Res 184(3-4):256–270. doi:
10.1016/j.jvolgeores.2009.04.003
Carey RJ, Manga M, Degruyter W, Swanson D, Houghton B, Orr T, Patrick M (2012)
Externally triggered renewed bubble nucleation in basaltic magma: The 12 October
2008 eruption at Halema’uma’u Overlook vent, Kilauea, Hawai’i, USA. J Geophys
Res B Solid Earth 117 (B11). doi: 10.1029/2012JB009496
Carey S (2005) Understanding the Physical Behavior of Volcanoes. Volcanoes Environ 1–
54. doi: 10.1017/CBO9780511614767.002
Cashman KV (2004) Volatile Controls on Magma Ascent and Eruption. In Sparks RSJ,
Hawkesworth CJ (eds), The State of the Planet: Frontiers and Challenges in
Geophysics. Geophys Monogr. Ser. 150:109–124. doi: 10.1029/150gm10
78
Chevrel MO, Platz T, Hauber E, Baratoux D, Lavallee Y, Dingwell DB (2013) Lava flow
rheology: A comparison of morphological and petrological methods. Earth Planet Sci
Lett 384:109–120. doi: 10.1016/j.epsl.2013.09.022
Decker Z (2016) Episode 4 of the 1783-84 Laki eruption: conduit processes and eruption
dynamics of phreatomagmatic phase 1. Masters dissertation, Faculty of Geoscience.
University of Iceland.
Edwards BR, Karson J, Wysocki R, Lev E, Binderman I, Kueppers U (2013) Insights on
lava-ice/snow interactions from large-scale basaltic melt experiments. Geology 41
(8):851–854. doi: 10.1130/G34305.1
Einarsson P (2008) Plate boundaries, rifts and transforms in Iceland. Jokull 58 (12):35–58
Fagents SA, Thordarson T (2007) Rootless volcanic cones in Iceland and on Mars. In: 487.
Chapman, M (eds), Chapt. 8: The Geology of Mars: Evidence from Earth-Based
Analogs. Cambridge University Press, 488: 151–177. ISBN 9780511536014
Fagents SA, Lanagan P, Greeley R, Lanagan P (2003) Rootless cones on Mars: a
consequence of lava-ground ice interaction. Geol Soc London, Spec Publ 202
(1):295–317. doi: 10.1144/GSL.SP.2002.202.01.15
Fagents S., Wilson L (1993) Explosive volcanic eruptions- VII. The ranges of pyroclasts
ejected in transient volcanic explosions. Geophys J Int 113 (2):359–370
Fitch EP, Fagents SA, Thordarson T, Hamilton CW (2017) Fragmentation mechanisms
associated with explosive lava–water interactions in a lacustrine environment. Bull
Volcanol 79 (1): 1–16. doi: 10.1007/s00445-016-1087-3
Gill R (2010) Igneous Rocks and Processes: a practical guide, 1st edition. Wiley-Blackwell
Publishing, London. ISBN 978-1-4443-3065-6
Gonnermann HM, Gardner JE (2013) Homogeneous bubble nucleation in rhyolitic melt:
Experiments and nonclassical theory. Geochem Geophys Geosys 14 (11): 4758-
4758. doi: 10.1002/ggge.20281
Gonnermann HM, Houghton BF (2012) Magma degassing during the Plinian eruption of
Novarupta, Alaska, 1912. Geochem Geophys Geosys 13 (10):1–20. doi:
10.1029/2012GC004273
Greeley R, Fagents S. SA (2001) Icelandic pseudocraters as analogs to some volcanic
cones on Mars. J Geophys Res 106 (E9):20527–20546. doi: 10.1029/2000JE001378
Guðnason, J (2017) Magma fragmentation and tephra dispersal in explosive eruptions: The
1991 and 1845 Hekla eruptions. PhD dissertation, Faculty of Earth Sciences,
University of Iceland.
79
Gurioli L, Houghton BF, Cashman K V., Cioni R (2005) Complex changes in eruption
dynamics during the 79 AD eruption of Vesuvius. Bull Volcanol 67 (2):144–159.
doi: 10.1007/s00445-004-0368-4
Hamada M, Laporte D, Cluzel N, Koga KT, Kawamoto T (2010) Simulating bubble
number density of rhyolitic pumices from Plinian eruptions: Constraints from fast
decompression experiments. Bull Volcanol 72(6): 735-746. doi: 10.1007/s00445-
010-0353-z
Hamilton CW, Fitch EP, Fagents SA, Thordarson T (2017) Rootless tephra stratigraphy
and emplacement processes. Bull Volcanol 79 (11):1–19. doi: 10.1007/s00445-016-
1086-4
Hamilton CW, Thordarson T, Fagents SA (2010a) Explosive lava-water interactions I:
Architecture and emplacement chronology of volcanic rootless cone groups in the
1783-1784 Laki lava flow, Iceland. Bull Volcanol 72 (4):449–467. doi:
10.1007/s00445-009-0330-6
Hamilton CW, Fagents SA, Thordarson T (2010b) Explosive lava-water interactions II:
Self-organization processes among volcanic rootless eruption sites in the 1783-1784
Laki lava flow, Iceland. Bull Volcanol 72 (4):469–485. doi: 10.1007/s00445-009-
0331-5
Hamilton CW, Fagents SA, Wilson L (2010c) Explosive lava-water interactions in
Elysium Planitia, Mars: Geologic and thermodynamic constraints on the formation of
the Tartarus Colles cone groups. J Geophys Res Earth Planets 115 (E9). doi:
10.1029/2009je003546
Hon K, Kauahikaua J, Denlinger R, Mackay K (1994) Emplacement and inflation of
pahoehoe sheet flows: Observations and measurements of active lava flows on
Kilauea Volcano, Hawaii. GSA Bull 106 (3):351-370. doi: 10.1130/0016-
7606(1994)106<0351:EAIOPS>2.3.CO;2
Houghton BF, Swanson DA, Rausch J, Carey RJ, Fagents SA, Orr TR (2013) Pushing the
Volcanic Explosivity Index to its limit and beyond: Constraints from exceptionally
weak explosive eruptions at Kīlauea in 2008. Geology 41 (6):627-630. doi:
https://doi.org/10.1130/G34146.1
Houghton BF, Carey RJ, Cashman KV, Wilson CJN, Hobden BJ, Hammer JE (2010)
Diverse patterns of ascent, degassing, and eruption of rhyolite magma during the
1.8ka Taupo eruption, New Zealand: Evidence from clast vesicularity. J Volcanol
Geotherm Res 195 (1):31–47. doi: 10.1016/j.jvolgeores.2010.06.002
Houghton BF, Gonnermann HM (2008) Basaltic explosive volcanism: Constraints from
deposits and models. Chem Erde 68 (2): 117–140. doi:
10.1016/j.chemer.2008.04.002
Houghton BF, Wilson CJN (1989) A vesicularity index for pyroclastic deposits. Bull
Volcanol 51 (6): 451–462
80
Janebo MH, Houghton BF, Thordarson T, Larsen G (2016) Shallow conduit processes
during the ad 1158 explosive eruption of Hekla volcano, Iceland. Bull Volcanol 78
(10):74. doi: 10.1007/s00445-016-1070-z
Karson JA (2017) The Iceland Plate Boundary Zone: Propagating Rifts, Migrating
Transforms, and Rift-Parallel Strike-Slip Faults. Geochem Geophys Geosys 18
(11):4043-4054. doi: 10.1002/2017GC007045
Klawonn M, Houghton BF, Swanson DA, Fagents SA, Wessel P, Wolfe CJ (2014)
Constraining explosive volcanism: subjective choices during estimates of eruption
magnitude. Bull Volcanol 76 (2):793. doi: 10.1007/s00445-013-0793-3
Klawonn M, Houghton BF, Swanson DA, Fagents SA, Wessel P, Wolfe, CJ (2014) From
field data to volumes: constraining uncertainties in pyroclastic eruption parameters.
Bull Volcanol 76 (7):839. doi: 10.1007/s00445-014-0839-1
Keszthelyi L, Milazzo M, Davies AG, Wilson L (2006) A simple thermal model for lava
fountains: applications to Io. Lunar and Planetary Science 37.
Keszthelyi L, Thordarson T, McEwen AS, Haack H, Guilbaud MN, Self S, Rossi MJ
(2004) Icelandic analogs to Martian flood lavas. Geochem Geophys Geosyst 5:1-32.
doi: 10.1029/2004GC000758.
Keszthelyi L, McEwen AS, Thordarson T (2000) Terrestrial analogs and thermal models
for Martian flood lavas. J Geophys Res 105 (E6):15027- 15049.
doi:10.1029/1999JE001191.
Klug C, Cashman KV. (1994) Vesiculation of May 18, 1980, Mount St. Helens magma.
Geology 22 (5):468–472. doi: 10.1130/0091-
7613(1994)022<0468:VOMMSH>2.3.CO
Lanagan PD, McEwen AS, Keszthelyi LP, Thordarson T (2001) Rootless cones on Mars
indicating the presence of shallow equatorial ground ice in recent times. Geophys
Res Lett 28 (12):2365–2367. doi: 10.1029/2001GL012932
Lautze NC, Houghton BF (2007) Linking variable explosion style and magma textures
during 2002 at Stromboli volcano, Italy. Bull Volcanol 69 (4):445–460. doi:
10.1007/s00445-006-0086-1
Lautze NC, Houghton BF (2008) Single explosions at Stromboli in 2002: Use of clast
microtextures to map physical diversity across a fragmentation zone. J Volcanol
Geotherm Res 170 (3-4):262–268. doi: 10.1016/j.jvolgeores.2007.10.011
Moreland WM (2017) Explosive activity in flood lava eruptions: A case study of the 10th
century Eldgja eruption, Iceland. PhD dissertation, Faculty of Earth Sciences,
University of Iceland, 92 pp.
81
Morrissey M, Zimanowski B, Wohletz K, Buettner R (2000) Phreatomagmatic
fragmentation. In: Houghton B, Rymer H, Stix J, McNutt S (eds) Encyclopedia of
Volcanoes. Academic Press, San Diego, 431–445
Morrissey MM (1990) Application of results from Fe-Al melt-water explosion experiments
to hydrovolcanic eruptions. Masters dissertation, Faculty of the Graduate School,
University of Texas at Arlington
Noguchi R, Höskuldsson Á, Kurita K (2016) Detailed topographical, distributional, and
material analyses of rootless cones in Myvatn, Iceland. J Volcanol Geotherm Res
318:89–102. doi: 10.1016/j.jvolgeores.2016.03.020
Nouri-Borujerdi, A (1985) Experiments and Applications of Rayleigh-Taylor Instability in
Reactor Safety Issues. PhD dissertation. University of Wisconsin.
Parcheta CE, Houghton BF, Swanson DA (2013) Contrasting patterns of vesiculation in
low, intermediate, and high Hawaiian fountains: A case study of the 1969 Mauna Ulu
eruption. J Volcanol Geotherm Res 255:79–89. doi:
10.1016/j.jvolgeores.2013.01.016
Parcheta CE, Houghton BF, Swanson DA (2012) Hawaiian fissure fountains 1: Decoding
deposits-episode 1 of the 1969-1974 Mauna Ulu eruption. Bull Volcanol 74
(7):1729–1743. doi: 10.1007/s00445-012-0621-1
Reynolds P, Brown RJ, Thordarson T, Llewellin EW, Fielding K (2015) Rootless cone
eruption processes informed by dissected tephra deposits and conduits. Bull Volcanol
77 (9): 72. doi: 10.1007/s00445-015-0958-3
Pyle DM (1989) The thickness, volume and grainsize of tephra fall deposits. Bull
Volcanol. 51 (1):1-15. doi: 10.1007/BF01086757
Sæmundsson K (1992) Geology of the Thingvallavatn Area. Oikos 64:40–68. doi:
10.1098/rspa.2007.0267
Sahagian DL, Proussevitch AA (1998) 3D particle size distributions from 2D observations:
stereology for natural applications. J. Volcanol. Geotherm. Res. 84 (3-4):173–196
Schneider CA, Rasband WS, Eliceiri K W (2012) NIH Image to ImageJ: 25 years of image
analysis. Nature methods 9 (7): 671-675
Shea T, Houghton BF, Gurioli L, Cashman KV, Hammer JE, Hobden BJ (2010) Textural
studies of vesicles in volcanic rocks: An integrated methodology. J. Volcanol.
Geotherm. Res 190 (3-4):271–289. doi: 10.1016/j.jvolgeores.2009.12.003
Silver LA, Ihinger PÐ, Stolper, E (1990) The influence of bulk composition on the
speciation of water in silicate glasses. Contr. Mineral. and Petrol. 104 (2): 142-162.
doi: 10.1007/BF00306439
82
Sinton J, Grönvold K, Sæmundsson K (2005) Postglacial eruptive history of the Western
Volcanic Zone, Iceland. Geochem Geophys Geosys 6 (12). doi:
10.1029/2005GC001021
Stevenson JA, Mitchell NC, Cassidy M, Pinkerton H (2012) Widespread inflation and
drainage of a pāhoehoe flow field: The Nesjahraun, Þingvellir, Iceland. Bull
Volcanol 74 (1):15–31. doi: 10.1007/s00445-011-0482-z
Stevenson JA, Mitchell NC, Mochrie F, Cassidy M, Pinkerton H (2011) Lava penetrating
water: The different behaviours of pāhoehoe and “a”ā at the Nesjahraun, Þingvellir,
Iceland. Bull Volcanol 74 (1):33–46. doi: 10.1007/s00445-011-0480-1
Stovall WK, Houghton BF, Gonnermann H, Fagents SA, Swanson DA (2011) Eruption
dynamics of Hawaiian-style fountains: The case study of episode 1 of the Kilauea Iki
1959 eruption. Bull Volcanol 73 (5):511–529. doi: 10.1007/s00445-010-0426-z
Stovall WK, Houghton BF, Hammer JE, et al (2012) Vesiculation of high fountaining
Hawaiian eruptions: Episodes 15 and 16 of 1959 Kīlauea Iki. Bull Volcanol 74
(2):441–455. doi: 10.1007/s00445-011-0531-7
Thordarson T, Hoskuldsson A (2014) Iceland: Volume 3 Classic Geology in Europe.
Dunedin Academic Press Ltd, London. ISSN 1746-2355
Thordarson T, Hoskuldsson A (2008) Postglacial volcanism in Iceland. Jokull 58
(198):197–228
Thordarson T, Larsen G (2007) Volcanism in Iceland in historical time: Volcano types,
eruption styles and eruptive history. J Geodyn 43 (3):118–152. doi:
10.1016/j.jog.2006.09.005
Thordarson T, Self S, Miller DJ, Larsen G, Vilmunardóttir EG (2003) Sulphur release from
flood lava eruptions in the Veiðivötn, Grímsvötn and Katla volcanic systems,
Iceland. In: C. Oppenheimer, DM Pyle and J. Barclay (eds), Volcanic
Degassing. Geol. Soc. Lon., Spec. Pub. 213 (1):103–121.
Thordarson T, Self S (1998) The Roza Member, Columbia River Basalt Group: A gigantic
pahoehoe lava flow field formed by endogenous processes? J Geophys Res Solid
Earth 103 (B11):27411–27445. doi: 10.1029/98JB01355
Thordarson T, Miller DJ, Larsen G (1998) New data on the age and origin of the
Leiðólfsfell Cone Group in south Iceland. Jokull 46: 3–15
Thordarson T, Self S, Óskarsson N, Hulsebosch T (1996) Sulfur, chlorine, and fluorine
degassing and atmospheric loading by the 1783–1784 AD Laki (Skaftár Fires)
eruption in Iceland. Bull Volcanol 58 (2-3): 205 -225. doi: 10.1007/s004450050136
Toramaru A (1995) Numerical study of nucleation and growth of bubbles in viscous
magmas. J Geophysical Res 100 (B2): 1913-1931.
83
Wohletz, K., McQueen, R. & Morrissey M (1995) Experimental Study of Hydrovolcanism
by fuel-coolant interaction analogs. NSF/JSPS AMIGO-IMI Semin. 1–32
Wohletz KH (1986) Explosive magma-water interactions: Thermodynamics, explosion
mechanisms, and field studies. Bull Volcanol 48 (5):245–264
Zimanowski B, Büttner R (2002) Dynamic mingling of magma and liquefied sediments. J
Volcanol Geotherm Res 114 (1-2):37–44. doi: 10.1016/S0377-0273(01)00281-5
Zimanowski B, Buttner R, Lorenz V, Häbulletifele H-G (1997) Fragmentation of basaltic
melt in the course of explosive volcanism. J Geophys Res 102 (B1):803–814. doi:
10.1029/96JB02935
Zimanowski B, Wohletz K (2000) Physics of Phreatomagmatism-II. Terra Nostra 6:515–
523

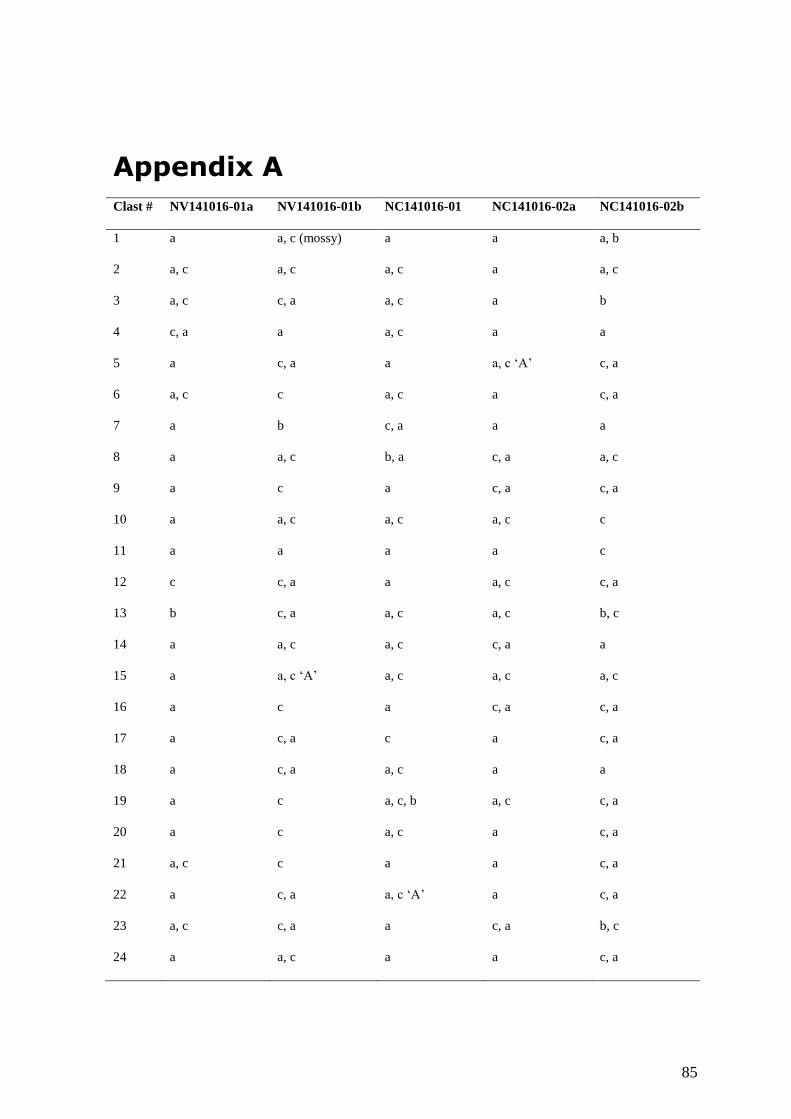
85
Appendix A
Clast # NV141016-01a NV141016-01b NC141016-01 NC141016-02a NC141016-02b
1
2
3
4
5
6
7
8
9
10
11
12
13
14
15
16
17
18
19
20
21
22
23
24
a
a, c
a, c
c, a
a
a, c
a
a
a
a
a
c
b
a
a
a
a
a
a
a
a, c
a
a, c
a
a, c (mossy)
a, c
c, a
a
c, a
c
b
a, c
c
a, c
a
c, a
c, a
a, c
a, c ‘A’
c
c, a
c, a
c
c
c
c, a
c, a
a, c
a
a, c
a, c
a, c
a
a, c
c, a
b, a
a
a, c
a
a
a, c
a, c
a, c
a
c
a, c
a, c, b
a, c
a
a, c ‘A’
a
a
a
a
a
a
a, c ‘A’
a
a
c, a
c, a
a, c
a
a, c
a, c
c, a
a, c
c, a
a
a
a, c
a
a
a
c, a
a
a, b
a, c
b
a
c, a
c, a
a
a, c
c, a
c
c
c, a
b, c
a
a, c
c, a
c, a
a
c, a
c, a
c, a
c, a
b, c
c, a
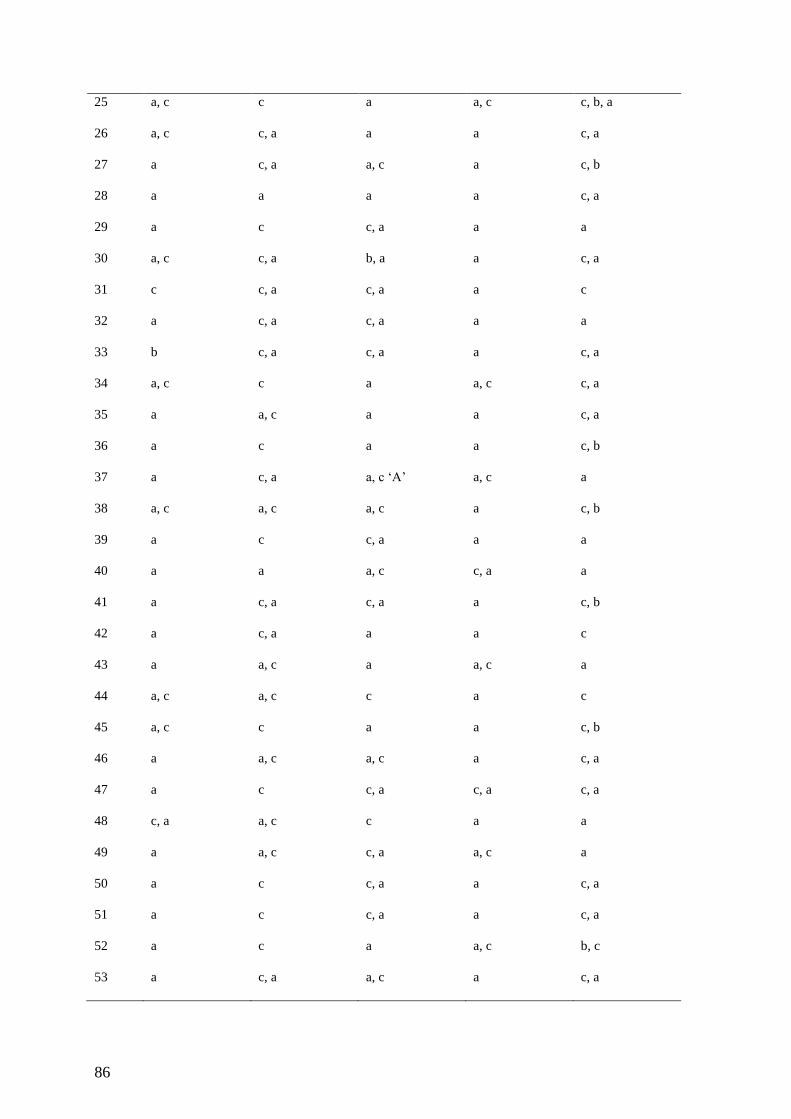
86
25
26
27
28
29
30
31
32
33
34
35
36
37
38
39
40
41
42
43
44
45
46
47
48
49
50
51
52
53
a, c
a, c
a
a
a
a, c
c
a
b
a, c
a
a
a
a, c
a
a
a
a
a
a, c
a, c
a
a
c, a
a
a
a
a
a
c
c, a
c, a
a
c
c, a
c, a
c, a
c, a
c
a, c
c
c, a
a, c
c
a
c, a
c, a
a, c
a, c
c
a, c
c
a, c
a, c
c
c
c
c, a
a
a
a, c
a
c, a
b, a
c, a
c, a
c, a
a
a
a
a, c ‘A’
a, c
c, a
a, c
c, a
a
a
c
a
a, c
c, a
c
c, a
c, a
c, a
a
a, c
a, c
a
a
a
a
a
a
a
a
a, c
a
a
a, c
a
a
c, a
a
a
a, c
a
a
a
c, a
a
a, c
a
a
a, c
a
c, b, a
c, a
c, b
c, a
a
c, a
c
a
c, a
c, a
c, a
c, b
a
c, b
a
a
c, b
c
a
c
c, b
c, a
c, a
a
a
c, a
c, a
b, c
c, a
87
54
55
56
57
58
59
60
61
62
63
64
65
66
67
68
69
70
71
72
73
74
75
76
77
78
79
80
81
82
c, a
a
a
a
a, c
a
a
a, c
c, a
c, a
a
a, c
a
a, c
a
a
a
a
a
a
a
a, c
a
a
a, c
c, a
a
c, a
a
a, c
a
c
c, a
c
a
c, a
c
c, a
c, a ‘A’
c, a
a, c
c, a
c, a
c
c, a
c, a
c
c
a, c
c
c, a
c, a
a
a
c, a
c, a
c
c
a, c ‘A’?
a, c
a, c ‘A’
a, c ‘A’
a
a, c ‘A’?
c, a
a
c, a
c, a
c, a
a, c
c, a
a, c
a
a, c
a
a, c
a, c
c, a
a, c
a, c
c, a ‘A’
a, c
a, c
a, c
a, c
c, a
a, c
c, a
c, a
c, a
b
a
a
a
a, c
a
a
a
a
a
a
a, b
c, a, b
c, a
b
a
a
a, c
a, c
a
a
a, c
c, a
a, c
c, a
a, c
a
c, a
a
b
b
a, c
a
b
c, a
c, a
c, a
a, c
a
a, c
c, a
c, a
a, c, b
c, a
c, a
c, a
a
a, c
c, a
c, a
c, a
c, a
a
c, a
c, a
88
83
84
85
86
87
88
89
90
91
92
93
94
95
96
97
98
99
100
a, c
a
a
a
a, c
a
a
a
a
a, c
a, c
a
a
a
a
a
a
a
c
a
c ‘A’
a, c
a, c
c, a
a
c, a
c
c, a
c
a
b
a, c
c, a
c ‘A’
c, a
c, a
c, a ‘A’
c, a ‘A’
c, a
a, c ‘A’
b, c
a
a
a, c
a, c
a, c
a, c
a, c
c, a
c, a
a, c
a
a
a, c
a
c, a
a, c
c, a
a
c, a
a
a
a
c
a
a
a
a
a
a
a
a, c
c, a ‘A’
c, a
c, a
c, a
c, a
a, c
a, c
a, c, b
a
a
a
c, a
a
c, a
a, c, b (oil slick)
c, a
a
a, c
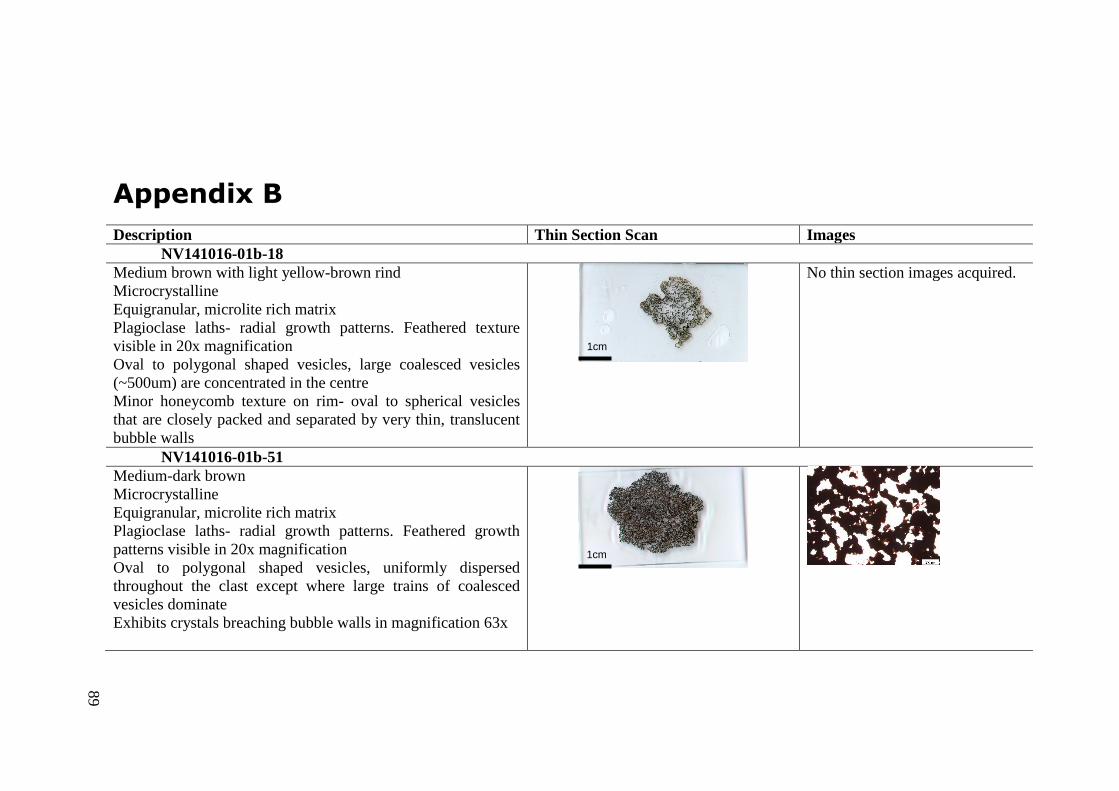
89
Appendix B
Description Thin Section Scan Images
NV141016-01b-18
Medium brown with light yellow-brown rind
Microcrystalline
Equigranular, microlite rich matrix
Plagioclase laths- radial growth patterns. Feathered texture
visible in 20x magnification
Oval to polygonal shaped vesicles, large coalesced vesicles
(~500um) are concentrated in the centre
Minor honeycomb texture on rim- oval to spherical vesicles
that are closely packed and separated by very thin, translucent
bubble walls
No thin section images acquired.
NV141016-01b-51
Medium-dark brown
Microcrystalline
Equigranular, microlite rich matrix
Plagioclase laths- radial growth patterns. Feathered growth
patterns visible in 20x magnification
Oval to polygonal shaped vesicles, uniformly dispersed
throughout the clast except where large trains of coalesced
vesicles dominate
Exhibits crystals breaching bubble walls in magnification 63x
1cm
1cm
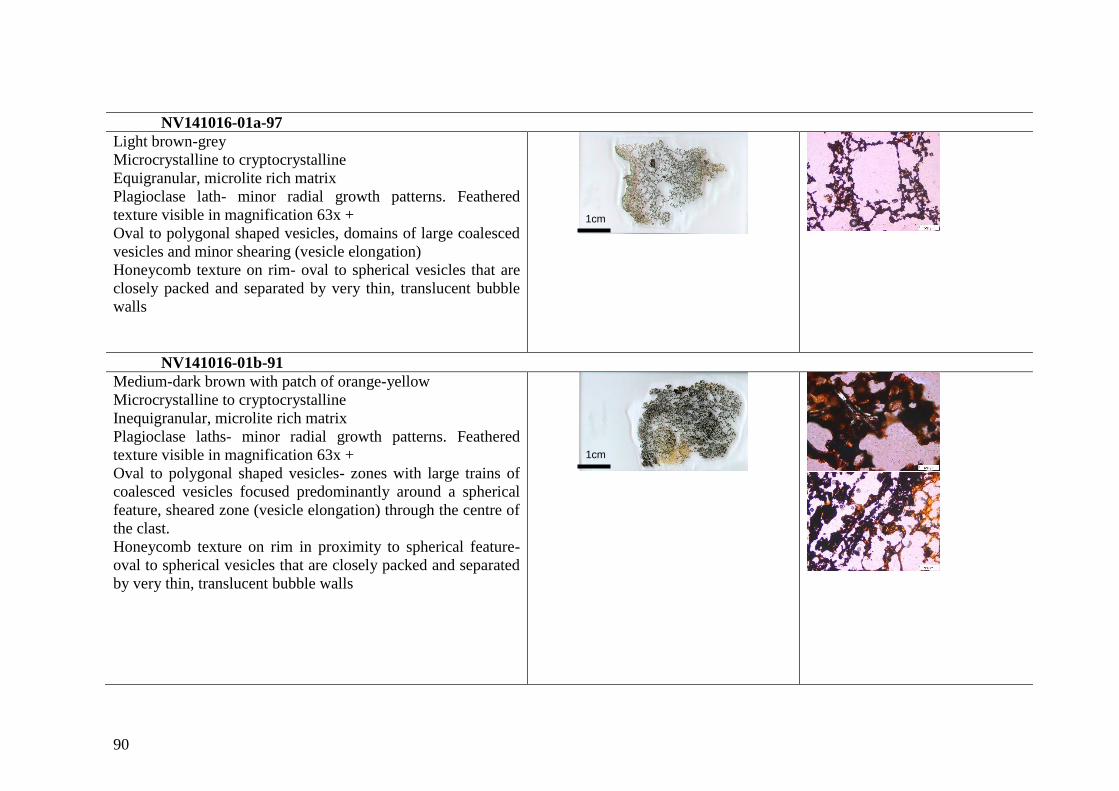
90
NV141016-01a-97
Light brown-grey
Microcrystalline to cryptocrystalline
Equigranular, microlite rich matrix
Plagioclase lath- minor radial growth patterns. Feathered
texture visible in magnification 63x +
Oval to polygonal shaped vesicles, domains of large coalesced
vesicles and minor shearing (vesicle elongation)
Honeycomb texture on rim- oval to spherical vesicles that are
closely packed and separated by very thin, translucent bubble
walls
NV141016-01b-91
Medium-dark brown with patch of orange-yellow
Microcrystalline to cryptocrystalline
Inequigranular, microlite rich matrix
Plagioclase laths- minor radial growth patterns. Feathered
texture visible in magnification 63x +
Oval to polygonal shaped vesicles- zones with large trains of
coalesced vesicles focused predominantly around a spherical
feature, sheared zone (vesicle elongation) through the centre of
the clast.
Honeycomb texture on rim in proximity to spherical feature-
oval to spherical vesicles that are closely packed and separated
by very thin, translucent bubble walls
1cm
1cm
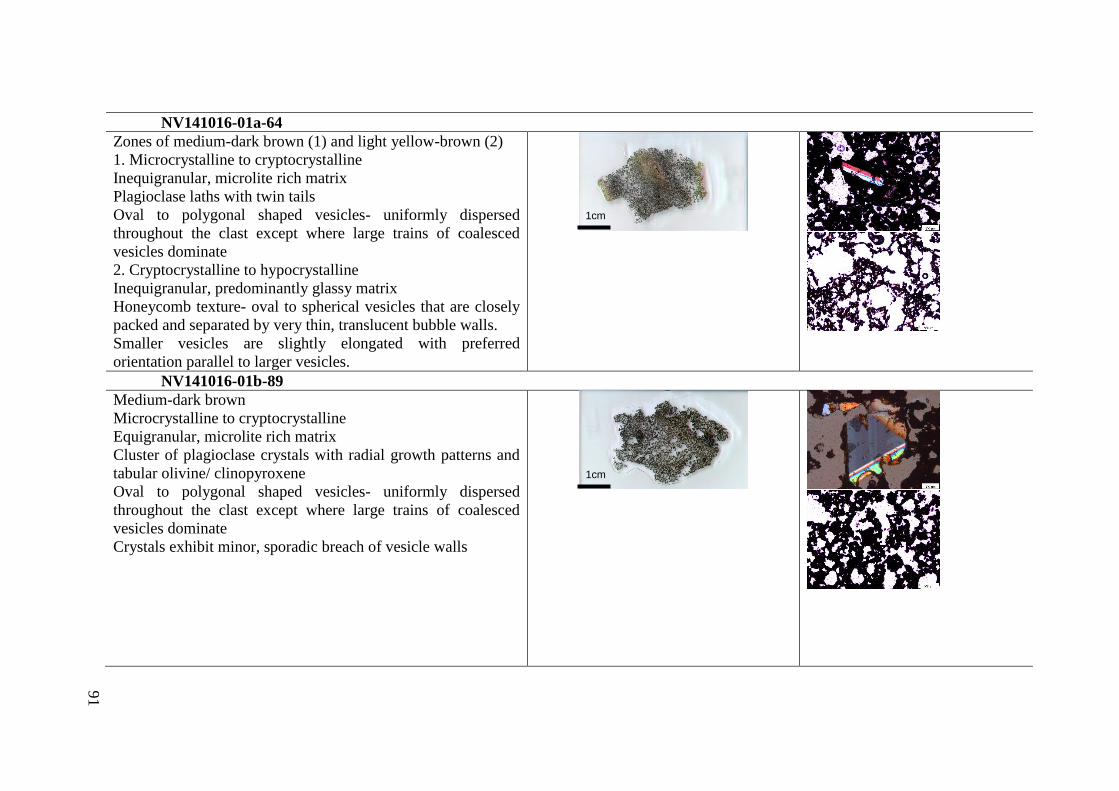
91
NV141016-01a-64
Zones of medium-dark brown (1) and light yellow-brown (2)
1. Microcrystalline to cryptocrystalline
Inequigranular, microlite rich matrix
Plagioclase laths with twin tails
Oval to polygonal shaped vesicles- uniformly dispersed
throughout the clast except where large trains of coalesced
vesicles dominate
2. Cryptocrystalline to hypocrystalline
Inequigranular, predominantly glassy matrix
Honeycomb texture- oval to spherical vesicles that are closely
packed and separated by very thin, translucent bubble walls.
Smaller vesicles are slightly elongated with preferred
orientation parallel to larger vesicles.
NV141016-01b-89
Medium-dark brown
Microcrystalline to cryptocrystalline
Equigranular, microlite rich matrix
Cluster of plagioclase crystals with radial growth patterns and
tabular olivine/ clinopyroxene
Oval to polygonal shaped vesicles- uniformly dispersed
throughout the clast except where large trains of coalesced
vesicles dominate
Crystals exhibit minor, sporadic breach of vesicle walls
1cm
1cm
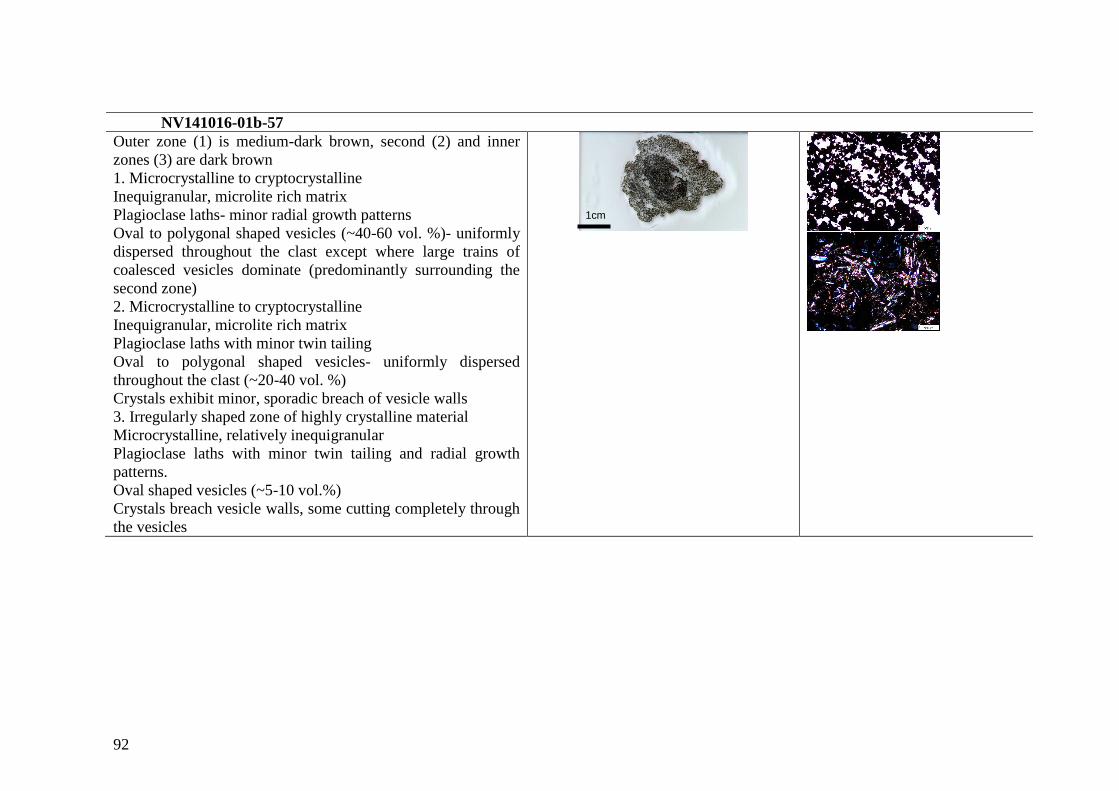
92
NV141016-01b-57
Outer zone (1) is medium-dark brown, second (2) and inner
zones (3) are dark brown
1. Microcrystalline to cryptocrystalline
Inequigranular, microlite rich matrix
Plagioclase laths- minor radial growth patterns
Oval to polygonal shaped vesicles (~40-60 vol. %)- uniformly
dispersed throughout the clast except where large trains of
coalesced vesicles dominate (predominantly surrounding the
second zone)
2. Microcrystalline to cryptocrystalline
Inequigranular, microlite rich matrix
Plagioclase laths with minor twin tailing
Oval to polygonal shaped vesicles- uniformly dispersed
throughout the clast (~20-40 vol. %)
Crystals exhibit minor, sporadic breach of vesicle walls
3. Irregularly shaped zone of highly crystalline material
Microcrystalline, relatively inequigranular
Plagioclase laths with minor twin tailing and radial growth
patterns.
Oval shaped vesicles (~5-10 vol.%)
Crystals breach vesicle walls, some cutting completely through
the vesicles
1cm
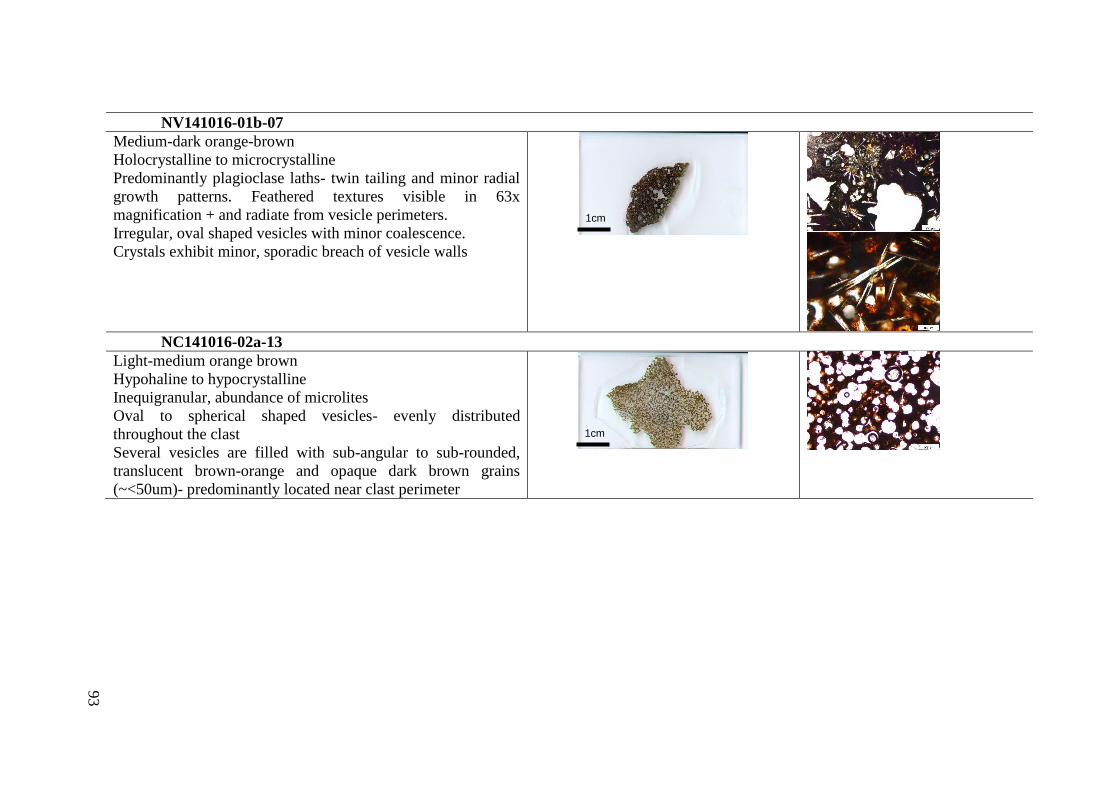
93
NV141016-01b-07
Medium-dark orange-brown
Holocrystalline to microcrystalline
Predominantly plagioclase laths- twin tailing and minor radial
growth patterns. Feathered textures visible in 63x
magnification + and radiate from vesicle perimeters.
Irregular, oval shaped vesicles with minor coalescence.
Crystals exhibit minor, sporadic breach of vesicle walls
NC141016-02a-13
Light-medium orange brown
Hypohaline to hypocrystalline
Inequigranular, abundance of microlites
Oval to spherical shaped vesicles- evenly distributed
throughout the clast
Several vesicles are filled with sub-angular to sub-rounded,
translucent brown-orange and opaque dark brown grains
(~<50um)- predominantly located near clast perimeter
1cm
1cm
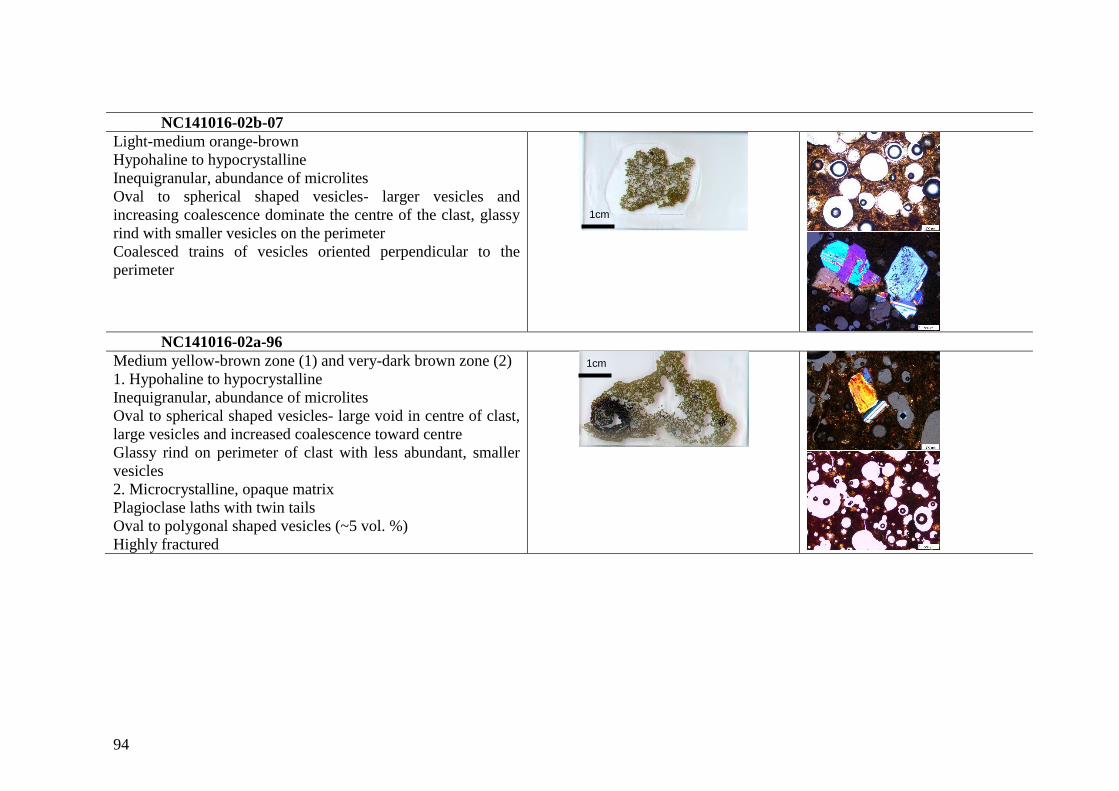
94
NC141016-02b-07
Light-medium orange-brown
Hypohaline to hypocrystalline
Inequigranular, abundance of microlites
Oval to spherical shaped vesicles- larger vesicles and
increasing coalescence dominate the centre of the clast, glassy
rind with smaller vesicles on the perimeter
Coalesced trains of vesicles oriented perpendicular to the
perimeter
NC141016-02a-96
Medium yellow-brown zone (1) and very-dark brown zone (2)
1. Hypohaline to hypocrystalline
Inequigranular, abundance of microlites
Oval to spherical shaped vesicles- large void in centre of clast,
large vesicles and increased coalescence toward centre
Glassy rind on perimeter of clast with less abundant, smaller
vesicles
2. Microcrystalline, opaque matrix
Plagioclase laths with twin tails
Oval to polygonal shaped vesicles (~5 vol. %)
Highly fractured
1cm
1cm
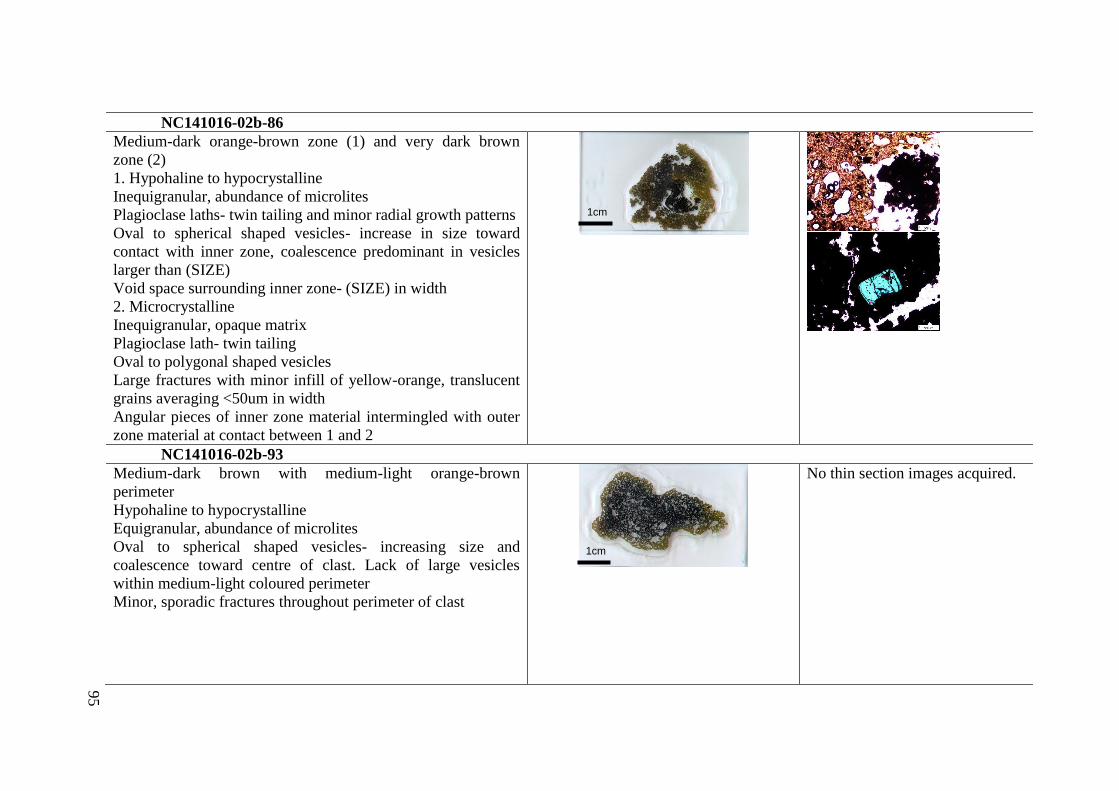
95
NC141016-02b-86
Medium-dark orange-brown zone (1) and very dark brown
zone (2)
1. Hypohaline to hypocrystalline
Inequigranular, abundance of microlites
Plagioclase laths- twin tailing and minor radial growth patterns
Oval to spherical shaped vesicles- increase in size toward
contact with inner zone, coalescence predominant in vesicles
larger than (SIZE)
Void space surrounding inner zone- (SIZE) in width
2. Microcrystalline
Inequigranular, opaque matrix
Plagioclase lath- twin tailing
Oval to polygonal shaped vesicles
Large fractures with minor infill of yellow-orange, translucent
grains averaging <50um in width
Angular pieces of inner zone material intermingled with outer
zone material at contact between 1 and 2
NC141016-02b-93
Medium-dark brown with medium-light orange-brown
perimeter
Hypohaline to hypocrystalline
Equigranular, abundance of microlites
Oval to spherical shaped vesicles- increasing size and
coalescence toward centre of clast. Lack of large vesicles
within medium-light coloured perimeter
Minor, sporadic fractures throughout perimeter of clast
No thin section images acquired.
1cm
1cm
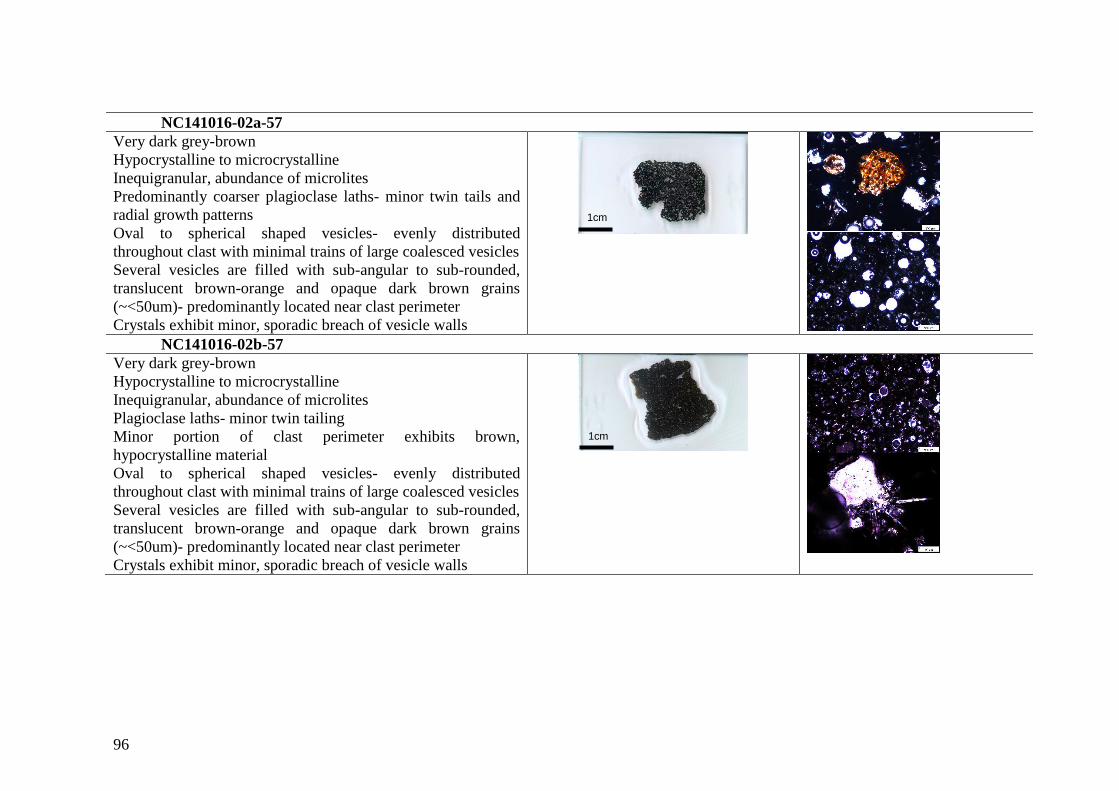
96
NC141016-02a-57
Very dark grey-brown
Hypocrystalline to microcrystalline
Inequigranular, abundance of microlites
Predominantly coarser plagioclase laths- minor twin tails and
radial growth patterns
Oval to spherical shaped vesicles- evenly distributed
throughout clast with minimal trains of large coalesced vesicles
Several vesicles are filled with sub-angular to sub-rounded,
translucent brown-orange and opaque dark brown grains
(~<50um)- predominantly located near clast perimeter
Crystals exhibit minor, sporadic breach of vesicle walls
NC141016-02b-57
Very dark grey-brown
Hypocrystalline to microcrystalline
Inequigranular, abundance of microlites
Plagioclase laths- minor twin tailing
Minor portion of clast perimeter exhibits brown,
hypocrystalline material
Oval to spherical shaped vesicles- evenly distributed
throughout clast with minimal trains of large coalesced vesicles
Several vesicles are filled with sub-angular to sub-rounded,
translucent brown-orange and opaque dark brown grains
(~<50um)- predominantly located near clast perimeter
Crystals exhibit minor, sporadic breach of vesicle walls
1cm
1cm
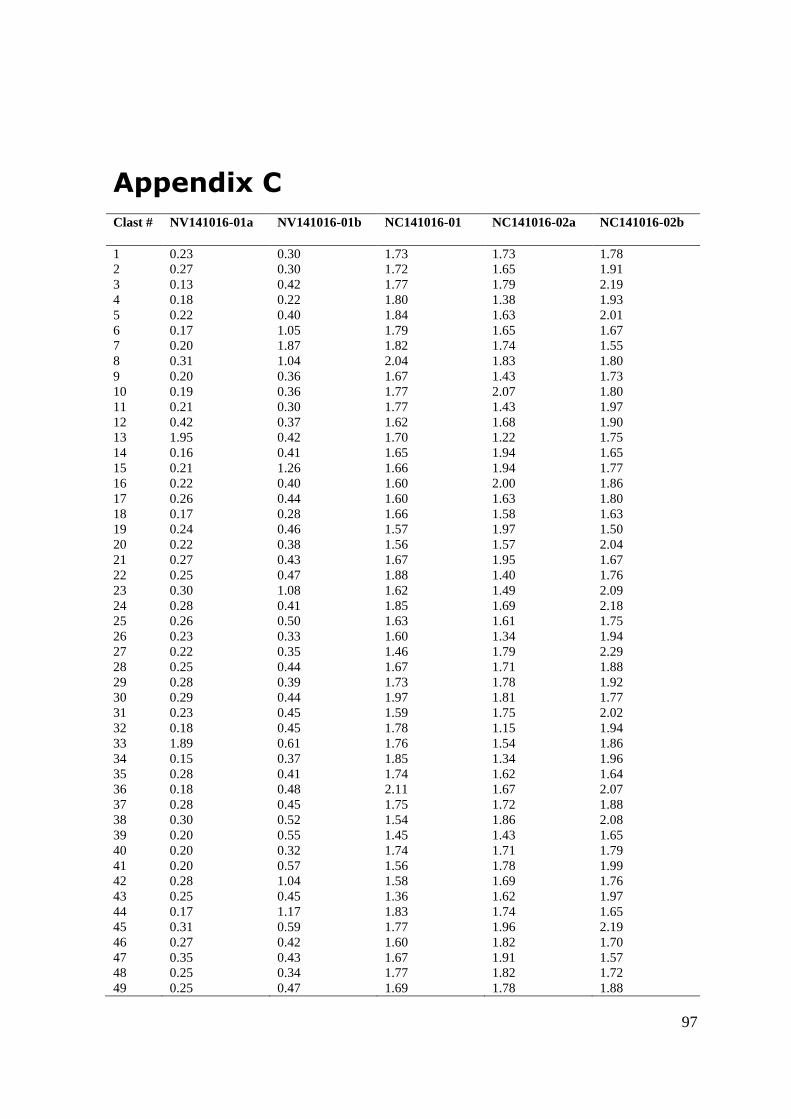
97
Appendix C
Clast # NV141016-01a NV141016-01b NC141016-01 NC141016-02a NC141016-02b
1
2
3
4
5
6
7
8
9
10
11
12
13
14
15
16
17
18
19
20
21
22
23
24
25
26
27
28
29
30
31
32
33
34
35
36
37
38
39
40
41
42
43
44
45
46
47
48
49
0.23
0.27
0.13
0.18
0.22
0.17
0.20
0.31
0.20
0.19
0.21
0.42
1.95
0.16
0.21
0.22
0.26
0.17
0.24
0.22
0.27
0.25
0.30
0.28
0.26
0.23
0.22
0.25
0.28
0.29
0.23
0.18
1.89
0.15
0.28
0.18
0.28
0.30
0.20
0.20
0.20
0.28
0.25
0.17
0.31
0.27
0.35
0.25
0.25
0.30
0.30
0.42
0.22
0.40
1.05
1.87
1.04
0.36
0.36
0.30
0.37
0.42
0.41
1.26
0.40
0.44
0.28
0.46
0.38
0.43
0.47
1.08
0.41
0.50
0.33
0.35
0.44
0.39
0.44
0.45
0.45
0.61
0.37
0.41
0.48
0.45
0.52
0.55
0.32
0.57
1.04
0.45
1.17
0.59
0.42
0.43
0.34
0.47
1.73
1.72
1.77
1.80
1.84
1.79
1.82
2.04
1.67
1.77
1.77
1.62
1.70
1.65
1.66
1.60
1.60
1.66
1.57
1.56
1.67
1.88
1.62
1.85
1.63
1.60
1.46
1.67
1.73
1.97
1.59
1.78
1.76
1.85
1.74
2.11
1.75
1.54
1.45
1.74
1.56
1.58
1.36
1.83
1.77
1.60
1.67
1.77
1.69
1.73
1.65
1.79
1.38
1.63
1.65
1.74
1.83
1.43
2.07
1.43
1.68
1.22
1.94
1.94
2.00
1.63
1.58
1.97
1.57
1.95
1.40
1.49
1.69
1.61
1.34
1.79
1.71
1.78
1.81
1.75
1.15
1.54
1.34
1.62
1.67
1.72
1.86
1.43
1.71
1.78
1.69
1.62
1.74
1.96
1.82
1.91
1.82
1.78
1.78
1.91
2.19
1.93
2.01
1.67
1.55
1.80
1.73
1.80
1.97
1.90
1.75
1.65
1.77
1.86
1.80
1.63
1.50
2.04
1.67
1.76
2.09
2.18
1.75
1.94
2.29
1.88
1.92
1.77
2.02
1.94
1.86
1.96
1.64
2.07
1.88
2.08
1.65
1.79
1.99
1.76
1.97
1.65
2.19
1.70
1.57
1.72
1.88
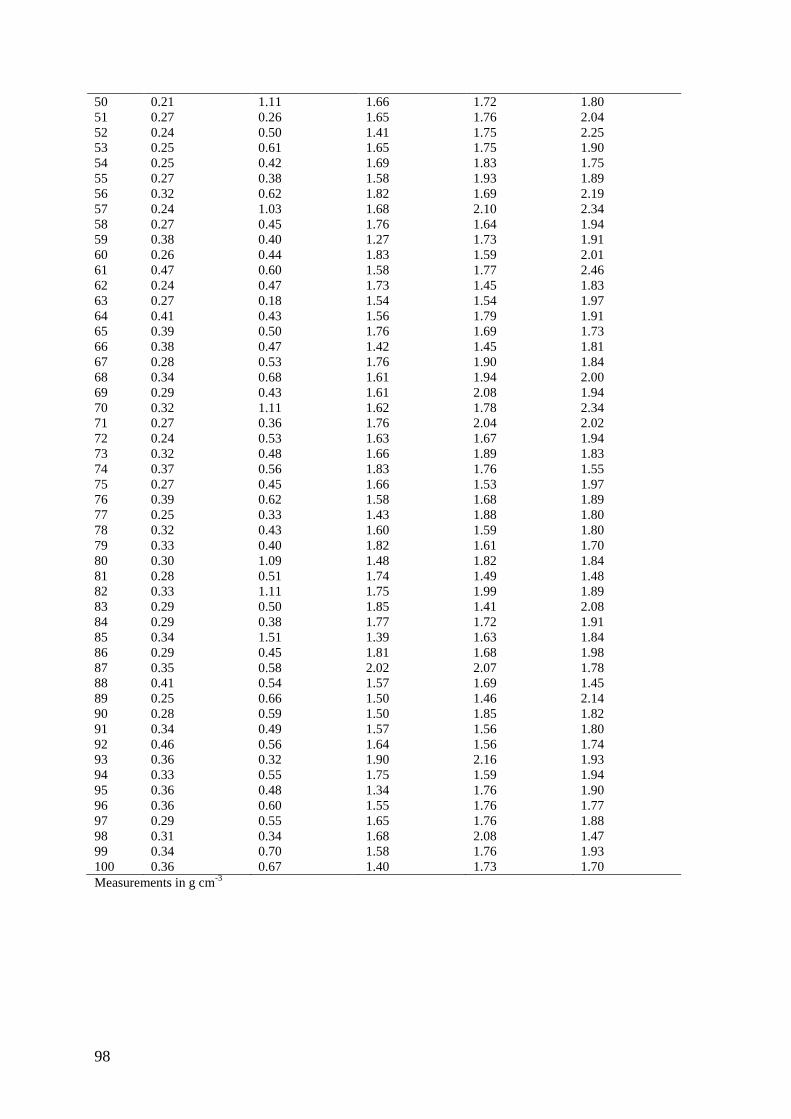
98
50
51
52
53
54
55
56
57
58
59
60
61
62
63
64
65
66
67
68
69
70
71
72
73
74
75
76
77
78
79
80
81
82
83
84
85
86
87
88
89
90
91
92
93
94
95
96
97
98
99
100
0.21
0.27
0.24
0.25
0.25
0.27
0.32
0.24
0.27
0.38
0.26
0.47
0.24
0.27
0.41
0.39
0.38
0.28
0.34
0.29
0.32
0.27
0.24
0.32
0.37
0.27
0.39
0.25
0.32
0.33
0.30
0.28
0.33
0.29
0.29
0.34
0.29
0.35
0.41
0.25
0.28
0.34
0.46
0.36
0.33
0.36
0.36
0.29
0.31
0.34
0.36
1.11
0.26
0.50
0.61
0.42
0.38
0.62
1.03
0.45
0.40
0.44
0.60
0.47
0.18
0.43
0.50
0.47
0.53
0.68
0.43
1.11
0.36
0.53
0.48
0.56
0.45
0.62
0.33
0.43
0.40
1.09
0.51
1.11
0.50
0.38
1.51
0.45
0.58
0.54
0.66
0.59
0.49
0.56
0.32
0.55
0.48
0.60
0.55
0.34
0.70
0.67
1.66
1.65
1.41
1.65
1.69
1.58
1.82
1.68
1.76
1.27
1.83
1.58
1.73
1.54
1.56
1.76
1.42
1.76
1.61
1.61
1.62
1.76
1.63
1.66
1.83
1.66
1.58
1.43
1.60
1.82
1.48
1.74
1.75
1.85
1.77
1.39
1.81
2.02
1.57
1.50
1.50
1.57
1.64
1.90
1.75
1.34
1.55
1.65
1.68
1.58
1.40
1.72
1.76
1.75
1.75
1.83
1.93
1.69
2.10
1.64
1.73
1.59
1.77
1.45
1.54
1.79
1.69
1.45
1.90
1.94
2.08
1.78
2.04
1.67
1.89
1.76
1.53
1.68
1.88
1.59
1.61
1.82
1.49
1.99
1.41
1.72
1.63
1.68
2.07
1.69
1.46
1.85
1.56
1.56
2.16
1.59
1.76
1.76
1.76
2.08
1.76
1.73
1.80
2.04
2.25
1.90
1.75
1.89
2.19
2.34
1.94
1.91
2.01
2.46
1.83
1.97
1.91
1.73
1.81
1.84
2.00
1.94
2.34
2.02
1.94
1.83
1.55
1.97
1.89
1.80
1.80
1.70
1.84
1.48
1.89
2.08
1.91
1.84
1.98
1.78
1.45
2.14
1.82
1.80
1.74
1.93
1.94
1.90
1.77
1.88
1.47
1.93
1.70
Measurements in g cm-3