tensile creep rupture properties of uncoated (2) … · summary tensile, creep rupture and...
TRANSCRIPT

TENSILE AND CREEP RUPTURE PROPERTIES
AT ELEVATED TEMPERATURES OF (I..' UNCOATED AND (2) COATED ENGINEERING ALLOYS
by
Louis J . F r i t z and W.P. Koster
METCUT RESEARCH ASSOCIATES INC. CINCINNATI, OHIO
Prepared for
NATIONAL AERONAUTICS AND SPACE ADMINISTRATION
NASA-Lewis Research Center Cleveland, Ohio
Contract NAS3-18911
Peter T . Bizon, Project Manager
https://ntrs.nasa.gov/search.jsp?R=19770016292 2020-03-24T18:22:19+00:00Z

TABLE OF CONTENTS
PAGE -- SUMMARY INTRODUCTION
GENERAL BACKGROUND
Mater ia ls Specimen Prepara t ion Test P rocedures
TEST RESULTS
Material 1 - *, 075-T6 Aluminum Material 2 - Amzirc Copper Material 3 Material 4 - H- 13 Tool Steel Material 5 - D-979 Material 6 - A-286 Material 7 - L-605 Material 8 - 304 Stainless Steel Material 9 - 316 Stainless Steel Material 10 - Udimet 700 Material 11 - T A Z 8A hlaterial 12 - I N 100 Mcterial 13 - I N 100 t Jocoat Material 14 - B 1900 Material 15 - B 1900 t Jocoat Material 16 - b,"ar M200 Material 17 - Mar M302 Material 18 - Rene 80
- Titanium - 6Al- 2 Sn -4 Z r - 2Mo
1
1
2
2 4
10
14
14 23 31 40 49 58 67 76 85 94
103 112 12 1 129 138 146 155 164

SUMMARY
Tensile, c r eep rupture and Poisson 's Ratio were generated on a group of sixteen materials supplied by NASA-Lewis Research Center. of the materials were additionally tested a f te r a Jocoat* coating was applied,
Two
The tensile and Poisson 's Ratio test data are supplied i n tabular f o r m - with samples of the load-strain c u x e s . presented i n tabular and graphical form - the graphs being i so- thermal plots of the rupture life data as well as families of plastic deform-ation versus time plots.
Creep rupture data are
All such data are grouped according to alloy designations.
4 Jocoat is a high temperature oxidation-resistant coating proprietary to P r a t t & Whitney Aircraf t Corporation applied by an approved source according to Specification PWA A47.
i

IN TRO DU C TION
Over the past s e v e r a l yea r s , a considerable amount of high temperature , low cycle fatigue data have been generated at the Lewis Resea rch Center on a variety of alloys. A significant p a r t of this testing was to develop improved methods for predicting high tempera ture fatigue behavior. SpecificaLly, there was a th rus t to a sce r t a in whether fatigue behavior could be predicted f r o m a knowledge of the tensile propert ies a t the various tempera tures of interest . No such tensile da ta existed on the par t icu lar heats of the ma te r i a l s which had been evaluated in low cycle fatigue testing, although handbook values existed for some mater ia l - tempera ture combinations.
In o r d e r to make a critical evaluation of life prediction appraaches, it became imperat ive to genera te the tensile and c r e e p rupture propert ies on the same heats as were used to genera te the fatigue data.
This r epor t represents the culmination of the test effort to collect the necessary tensile and c r e e p rupture data for correlat ing with existing fatigue data. by NASA-Lewis Research Center.
MateriaL f o r this evaluation was supplied from the t e s t heats
- 1 -

GENERALBACKGROUND
Mate ria 1s
The materials and test temperatures in this program are as follows:
A llov
1. 2. 3. 4. 5, 6. 7, 8. 9.
10. 11. 12 . 14. 15. 16. 17. 18.
3 3 .
7075-T6 Aluminum Amzirc Copper Titaniuni-6A 1-2Snr4Zr -2Mo H- 13 Tool Steel D-979 A-286 L-605 304 Stainless Steel 316 Stainless Steel Udimet 700 TAZ-8A IN 100 IN 100 t Jocoat B 1900 B 1900 + Jocoat M a r -M2 0 0 Mar-M302 &ne' 80
TI ( " C ) (OF)
12 1 2 50 482 900 482 9 00 538 1000 593 1100 593 1100 593 1100 593 1100 593 1100 760 1400 850 1562 850 1562 850 1562 850 1562 850 1562 871 1600 850 1562 850 1562
T2 ( " C ) ('F)
149 3 00 538 1000 538 1000 593 l i00 649 1200 649 1200 649 1200 649 1200 704 1300 816 1500 925 1697 925 1697 925 1697 925 1697 925 1697 927 1700 925 1697 925 1697
T3 JOG) (OF) 177 350 593 1103 593 1100 649 1200 704 1300 704 1300 704 1300 760 1400 816 1500 927 1700
1000 1832 1000 1832 1000 1832 1000 1832 1000 1832 982 1800
1000 1832 1000 1832
Alloys 1-10 were furnished by the Government in the form of wrought ba r s - - 0.75 inch diameter by 27 to 36 inches tang. Specimens of these alloys were machined as described elsewhere in this repor t (page 4).
Alloys 11-18 were furnished by the Government as c a s t remel t stock - - 2-1/2 to 3-1/2 inch diameter by 6 to 43 inches long. Specimens of these alloys were cast to size. The remelt stock was shipped from Metcut to Howmet Corporation-Misco Division, where it was cast into specimen blanks per Figure 1.
The specifics of any heat t reatment o r coating of the alloys is covered in the segment of this repor t covering those par t icular alloys.
- 2 -

Q
'D 0
.3
N
--. 0
cg N
.-4
-3-

GENERAL BACKGROUND (continued)
Specimen P repa ra t ion
The wrought ma te r i a l s (Alloys 1-10) were cu t into appropriate blank s i zes for machining into the tensile, c r e e p and Poisson ' s Ratio teat specimens shown in Figures 2, 3, and 4, respectively. On the assumption that the ma te r i a l was uniform f r o m bar to bar, the blanks were cu t up without sketching specimen location within the bars . Al l tensile blanks might be f r o m consecutive positions in one o r two b a r s with the same procedure followed f o r c r e e p and Poisson ' s Ratio blanks.
Once the blank was cu t to its approximate size, it was faced and centered; thereafter, all machining was performed with re ference to these centers . Such pract ices a s s u r e centratif-y of the finished specimen.
As previously stated, a l l specimen blanks f r o m the cast ma te r i a l s were supplied to a single configuratim. F r o m this blank, the creep, tensile and Poisson 's Ratio specimens were machined per F igures 3, 5, and 6, respect ive Ly.
All specimens (except the Amzi rc Copper) wer? machined using Metcut's "Low s t r e s s " grinding techniques to finish the gage section. Amzi rc Copper specimens were turned a d polished in the reduced gage section.
The
-4-

rJ .# n
om
"I" I
d
0
-5-

ir i-
-6-

v
c
rr)
I c)
r(
i
-4
3
c
0
In
t
I ?--
N
0 0
+I
0 0
In
m
- 7-

X
'c-r
-8-

(\1
0 0
+I
-T- 3
.z
rD P
03 N
J-i
I
4
u W
C
v1 m
w
o
pc .r
(
C
0
P
.rl
4
?. cd w
-9-

G EN ERA L BA C KG RO U - N D ( c o F. tinu e d )
T e s t Procedures
A. Genera l Test P rocedures
All measurements of specimen dimensions were made using mic ro - meters or ca l ipers t raceable to the National Bureau of Standards. Specimen d iameters were measu red to the n e a r e s t . 0001 in. ; specimen lengths were measu red using cal iper which read to the n e a r e s t .001 in. made using s tandard mechanical extensometers. C r e e p readings were made using both optical and electromechanical extensometers . Poisson ' s Ratio was determined using bonded s t ra in gages verified pe r ASTM Method E251. Coated specim-en d iameters were measured pr ior to coating. The reduction of area calculations were cor rec ted for this thickness.
=tension measu remen t s on tensile specimens were
The coating thickness was nominally 7. G O 4 in.
Elevated tempera ture tests were conducted in s tandard wire-wound res i s tance type furnaces. of sa turab le core r eac to r s which have a capability of mair.tsining tempera tures to within f 1 O C . tests through 871°C w e r e made using type K thermocouple wire. Above this tempclrature, measurements were made using Pt- 1370a.h thermocouple wire. C a l i b r a i o n of the thermocouple wire at Metcut routinely follows the procedures ou;;ined in ASTM E 220.
These furnaces were controL1ed by means
Tempera ture measurements on a l l
T:.e tensile machines and s t r e s s rupture f r a m e s at Metcat a r e vr cified to less than one percent erro: Method E74. maintained ir. . ,alibration to s tandards which a r e NBS traceable. Calibrations a r e performed at regular ly scheduled intervals.
*sing methods detai leJ in ASTM All t e s t equipment proposed for u s e i n this program is
B. Tensi le T e s t Procedures
Tensile tes t s to determine ult imate tensile strength, yield strer-gths (0.02 and 0.270 offset), percent alongation, percen, reduction of area, s t r a in hardening exponent, and t rue f r ac tu re strength were performed on a minimum of three (3) specimens at each of four (4 ) t es t t empera tures - - room and three eievated temperatures .
- 1 0 -

B. Tensile Teat Procedures (continued)
A l l testing was performed in one of two Batdwin universal hydraulic testing machines. Both machines are equipped with in tegra l s t r a i n pacers and autographic load-strain recording sys terns.
Room temperature s t r a i n was monitored using a linear differential t ransformer extensometer which was clipped d i rec t ly to the test section. A t elevated temperatures , the motion was t r ans fe r r ed to a n LVDT extensometer through extension arms attached to the specimen gage section.
A s t r a i n ra te of 0.005 cm/cm/min. was maintained through the 0.2q0 yield strength; thereaf ter , a controlled head rate of 0.125 cm/min. was used.
All strength calculations were based on loads and cross-sectional areas measured to the accuracies as descr ibed earlier. Drxctility values were calculated using initial and final measurements as measured to these accuracies also.
Elongation measurements for the wrought alloys were made bctweei; gage marks (1 in. length) i n the reduced section. For the cast mater ia ls , where such m a r k s could adversely affect the test resul ts , the elongation was measured using the overa l l specimen length. Pe rcen t elongation was then calculated using the adjusted reduced gage section length as described i n ASTM E21.
The units of measurement in all cases werc the U.S. customary sys tem of units. Measurements were made in inches, loads in pounds and stresses calculated in pounds pe r inch.2 The SI units presented in the report are from conversions using NBS values.
The s t r a in hardening exponent "nl1 was calucated using the power expression of the form,
where C = 1.0, and n is the s t r a in hardening exponent. The value of n is rnos t accurately determined from tensile s t r e s s - s t r a i n data obtained in a tensile test using special high elongation extensometry.
is t rue s.ress, G p is t rue plastic s t ra in , K is the s t r e s s a t
P
-11 -
B. Tensile Test Procedures (continued)
The extensometry used in normal s t r e s s - s t r a in testing has higher precision, but will not permit measurement of plastic strains Larger than a few percent. It is possible, however, to get a good estimate of the strain hardening exponent from load elongation data obtained in normal tensile testing. The Limitation is that the t rue s t r e s s versus t rue plastic s t r a in resul ts occurs only over a Limited range of strain. Plotting the ava i la t -e data points on log-log coordinates and taking the s lope of the straight line between them yields an estimate of n which is useful for engineering comparisons of s t ra in hardening behavior among various types of materials. This was the procedure used in this report.
The modulus of elasticity is another value which theoretically can be calculated from a s t r e s s - s t r a in plot of a tensile test. In reality, however, the load and s t ra in magnificavdns necessary to produce a complete tensile curve are not necessar i ly the ranges one would choose for measuring modulus of elasticity. elasticity was obtained with the same specimen as that used for tensile testing, by loading seve ra l times to loads well below the proportional limit at suitable load and s t ra in magnification ranges.
The modulus of
ALL tensile data is reported in both SI and the U.S. customary systems of units.
C. Poisson's Ratio
Tension specimens having a rectangular cross-sect ion per Figures 4 and 6 were used fo r this determination. Strain gages were bonded on the .250 in. wide tes t surface at mid-span. The gages w e r e 90" rosettes with 0.100 in. grids. Gages were mounted on opposite faces to compensate for any bending which occurred during testing.
Static loads were applied in approximately ten equal steps with the maximum stress on the specimen being held well below the proportional limit. Strain measurements w e r e made at the individual s tep loads while Loading and anloading the specimen. cycle was performed a total of three t imes on each specimen.
The ent i re
-12-

C. Poisson's Ratio (continued)
The loads were applied while the specimen was mounted in a stress rupture frame and were either d i r ec t dead weight loaded or lever loaded, depending on the maximum stress to which the specimen was subjected. numerically to produce the individual and sample mean (average) value for Poisson 's Ratio and both 90 and 95 percent confidence limits. measured. Poisson 's Ratio was not determined using the slope of the plotted values.
The load-strain values thus obtained were analyzed
The values so analyzed were the individual values as
D. Creep Rupture Procedures
Creep rupture testing was performed using procedures as detailed in ASTM E 139 on specimens .having a 2 in. gage length (F igure 3).
Readings were made using optical c r e e p cathetometers for the longer time and higher temperature tests. A mechanical c r eep sys tem was used to obtain maximum d a h points for the sho r t e r time tests, .since it gave 24 hour per day coverage of these readings.
The data so generated, 3ssis ted by the employment of a variety of numerical analysis procedures, yielded the following:
(1) A plotted curve of c reep s t r a in v e r s u s time
(2) The time to the onset of third-stage c reep
( 3 ) The time to achieve 1% c r e e p s t r a in
(4) The minimum creep rate
( 5 ) The time to rupture
( 6 ) The percent elongation a t failure
(7) The percent reduction of area at fai lure
F r a m the minimumA of five ( 5 ) t es t s a t each of three (3) tes t temperatures , and u s i n g the appropriate isothermal and parametr ic relationships, the s t r e s s levels to produce rupture lives of 100, 300, and 1000 hours were determined.
- 1 3 -

TEST RESULTS
Material 1: 7075-T6 Aluminum
This high strength, heat t reatable aluminum alloy was supplied as fully heat treated, wrought b a r s tcck by NASA-Lewis Research Center. Nominal composition of this alloy is as follows:
Zinc Magnesium Copper Chromium Manganese Iron Silicon Titanium Other Impurit ies,
each Other Impurit ies,
tota 1 A luminum
5. I - 6.1% 2.1 - 2.9 1.2 - 2.0 0.30 max. 0.50 max. 0.40 max. 0.20 max.
a. 18 - 0.35
0.05 max.
0.15 max. Ba Lance
Tensile resul ts are presented as Table I with samples of the load-strain curves compiled as Figure 7.
Poisson 's Ratio values are as listed below:
Specimen Average Value Confidence Limits
I - P I -0.3244 k. 0018 f. 3022
1 -P2 -0.3190 k. 0030 *. 0036 1 -P3 -0.3285 t. 002 1 f. 0026
Number Poisson's Ratio -- 9070 95%
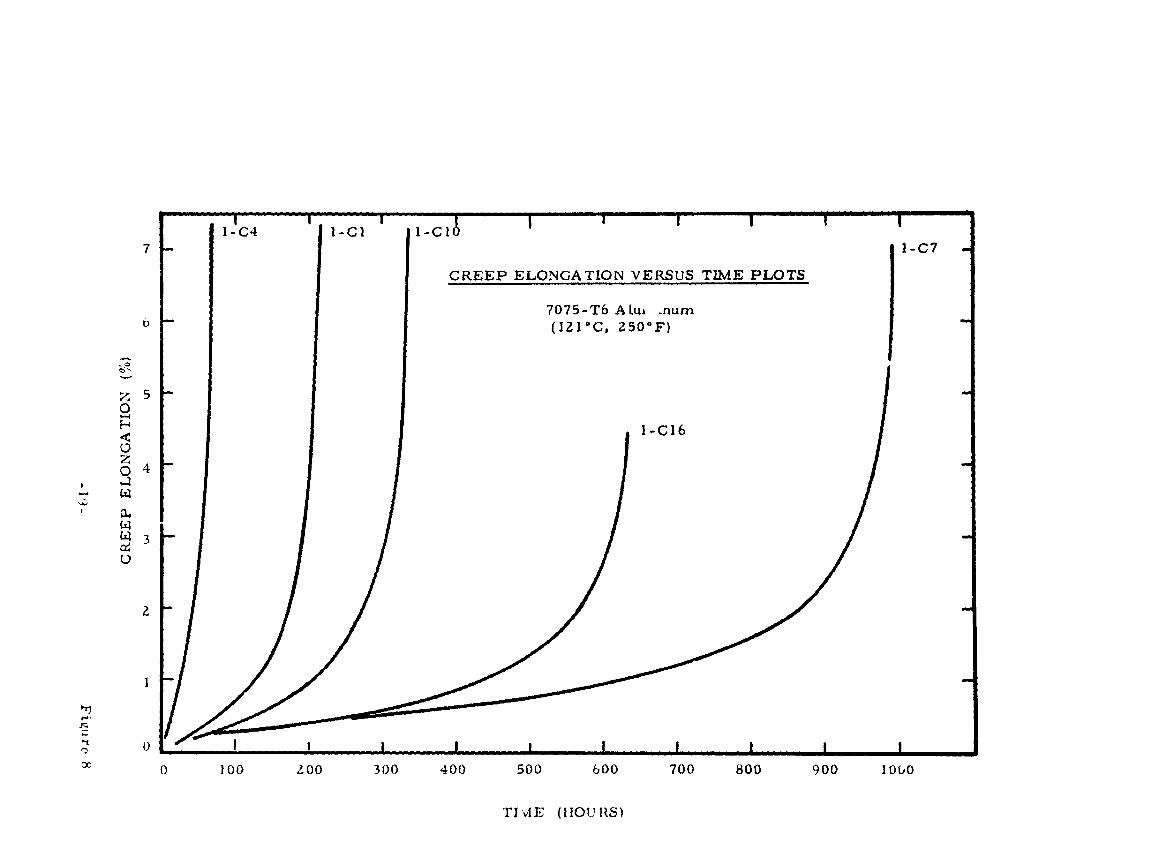
Creep rupture data are presented in Table 11. t ime vahes are plotted i n Figures 8, 9, and 10. the rupture life data appear as Figure 11.
Creep deformation versus Isothermal plots of
- 14-
TEST RESULTS (continued)
Material 1: 7075-T6 Aluminum (continued)
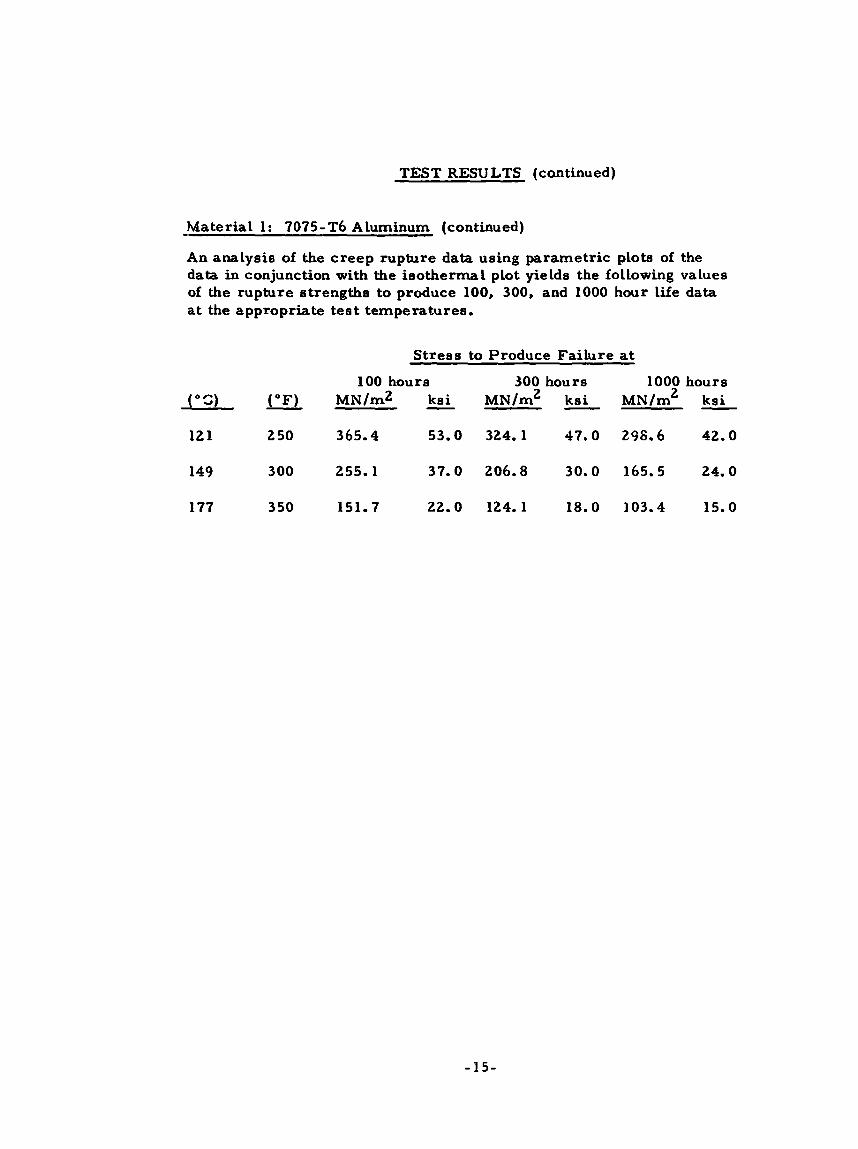
An analysis of the creep rupture data using parametric plots of the data in conjunction with the isothermal plot yields the following values of the rupture strengths to produce 100, 300, and 1000 hour life data at the appropriate test temperatures.
Stress to Produce Failure at
100 hours 300 hours 1000 hours ("3 (OF) MN/m2 - ksi MN/rn2 - k s i MN/m2 - k s i
12 1 2 50 365.4 53 .0 324.1 4 7 . 0 298 .6 4 2 . 0
149 3 00 255.1 37 .0 206.8 30 .0 165.5 24.0
177 3 50 151.7 22.0 124.1 18.0 103.4 15 .0
- 1 5 -

<N
l-
**
m
cr
ml
m
ml
.: "4
0-
0 000
00
1 0
01
.
..
..
. .
.I
.
.I
s
ao
0
00
0
00
0
0 I
00
I
"4 X
Il
l
Il
l
11
1
Il
l
11
1 I
ll
I
ll
I
ll
I
ll
I
ll
(
I;
I
ll
Il
l
Il
l I
ll
I
ll
I
ll
I
ll
I
ll
I
ll
1
11
I
ll
1
11
I
ll
,
Il
l
Il
l
Il
l I
ll
0
0
0
0
m
0
Lrl
dl*l
r- N
0
m
E
- 10-

- 6( 0
0
VI N
u’ 2
d
Y
N
r+ I r(
I I
I
1-
0
0
i.
I I
I I
I 0
0
0
0
* N
0
0
0
d,
4
I-(
?S
Y ‘SS3IJ.L
S
-17
- F
igu
rc 7

Ob
0
mn
l a
o0
NO
QI
Q)@
NQ
II
n
mo
oi
oo
o
co
oo
0
00
00
~000'00
00
00
0
00
00
0
~ In
s*
dd
e-W
-0
a
ot
Q-
00
0.
.
.. .
e.
-.
.....
'*( =: N ci
I-
O 0
m
6
d
c(
0
ui m
mn
l
E .r(
0
Q, a
-18-
1 I
I I
I 1
I
l- u 1 c(
U
-1
\ \I
I.
\U
0 0
I-
0
0
* C
0
m
0
0
hl
0
0
- 0
-19
- F
iKurc 8

00 u
t I
1
-1
\ \
L
U
I nl
I r(
0
0
0 0
I-(
0 0 6
0 0
00
0
0
12
09
In
0"
s
3
0 9
2 A Y u c-c
0 0
e
0
0
m
0 0
N
0 0
#-4
0
-20
- F
igure 9

0 0 0
CI
0 0
m
0
0
03
Q 0
I'..
0
0
* 0
0
m
Q
0
N
0 0
- 0
-21
- F
igu
re 10

0
00
0 0
0
Pa
m d
rr) 0
m
0
00 9
(\1
r(
U
!BY 'S
S3X
LS
-2
2-
Figu
re 11

TEST RESULTS (continued)
Mater ia l 2: Amzi rc C o m e r
This copper zirconium alloy, developed to produce good strength Levels a t high temperature , was supplied as fully processed (half-hard) wrought b a r stock by NASA-Lewis Research Center.
Chemical composition of this heat of m a t e r i a l (supplied by NASA-Lewis R -:search Center) is as follows:
I ron 0.00270 Nicke 1 0.002 Z i r co nium Copper Ba Lance
0. 18
Tensile resu l t s are presented as Table 111 w.l;h samples of the Load-strain curves compiled as Figure 12.
Poisson 's Ratio values are as listed below:
Specimen Average Value Confidence Limits Number Poisson 's Ratio 9 0% 95 /a
2 - P 2 -0.3656 f . 0028 f. 0034
2 -P3 -0.3623 t. 0027 f. 0032
2 -I.. -0 .3570 f . 0013 f. 0016
C r r ep rupture data are presented in Table IV. t i w e values a r e plotted in Figures 13, 14, and 15. the rupture Life data appear as Figure 16.
Creep deformation versus i so thermal plots of
An analysis of the c r e e p rupture data using parametr ic plots of the data in conjunction with the isothermal plot yields the follov.ing values of the rupture s t r e rg ths to produce 100, 300, and 1000 hour life data a t the appropriate test tempe ra turea .
St re s s to Produce Fail l ire a ' Temp. 100 hrs . 30C hrs . 1000 h:.s.
M!h/m2 ksi
482 90C 4 8 . 3 7 . 0 3 7 . 9 5. 5 3 1 . 0 2 . 5 - "C - "F MN/m2 -- ksi M N / m 2 k s i -
538 1000 2 9 . 6 4 . 3 22 .8 3 . 3 16 .3 2 . 4
593 1100 17 .9 2 . 6 13 .8 2 . 0 10 .3 1 . 5
- 2 3 -

,oG
w '$ 000
OO
VI 000
lc
Q
... ...
*.
I
NNM
4N
.G
N9N
CO
N
NNN NNN MmM
bb
l m
m
N
Qd
VI
V
IM
N
MC
6e
9
9
000 000 OOC
mr
ul
...
ddd ddd 000 dd' 0
0
m
Il
l
Il
l
Il
l
II
II
I
II
I
11
1
11
1
Il
l
mo
b
00
r-m
NN
N
...
mlc
4-
NM
.. G
I.
Ir
(
v)
Y
m
a,
SD Y
C k
5
P
a, h
5
Id k a, a
a,
.d
U
E U
QeC
O
NQ
N
MMM
... MMd
mc
ob
0
..
00 cv I"
m9
CO
W
NN
... u
r(
C.
-No
**
m
..
I.
#
MI
9
NN
N
V
a, a
0
0
m
0 0 0
m
0 0
u
Y
.a
U
@
m
e, &I
a, > u e,
.rl
Y
N
00 zr
00 M
In

U
N
30
0
.r N
1
v
N
Ec I N
-25
-

mo
o
00
...(
0.
-mo
o
,P
a0
-
fu
00
0 00
9036
1O
QN
OO
I
Ql
6*
&N
..... c(
,0
00
3O
N
05
00
0*
c
o*
01
ce
m
NN
NM
--
......
0 0
r(
c(
0 0
0
4
co cr) In
m
Ql
In
..
-26
-

I I
I
0
c1
u I N
-. ‘-4
I 30 d
0
-0
0
W
0
0
0.
0 0
00
0 0
b
3
22
3
0
z
ow
- 2
2
F:
0
0
* 0
0
rrl
0 0
fu
0
0
c(
0
-27- F
igu
re 13

3
3 3
II
3
3 r
3 9
P
0 0
P-
O 0
9
0
0
tn 0
0
d
0 0
rr)
0
Q
tu 0 0
d
0
Figu
re 14 1

I
\
N
\
0 0 0
c.l
0 0
OI
3
a0
0 0
* 0
0
9
0
0
In
0
0
v
0 0
f-0
0
0
nl
0
0
1
0
Figu
re 15

0
0
0
d
0
0
a0
I I
t1
I
1 I
11
1 1
I 1
I 0
0 0
om
am
*
rr) N
d(r)
N
r(
!*Y ‘S
Srn
LS
4
-30- F
igu r
0
0
9
0
0
In
0 0
m
0
0
N
0
0
0
9
‘e 16
3
8 Y

TEST RESULTS (continued)
Mater ia l 3 : Titanium -6A 1-2Sn -42 r - 2Mo This super-alpha t i tanium alloy, developed to produce a good combination of tensile, c reep , toughness, and stabil i ty to 1050°F was supplied as fully processed wrought b a r s tock by NASA-Lewis Resea rch Center.
Nominal composition of this alloy is as follows:
A luminum Tin Zirconium Molybdenum I ron Carbon Nitrogen Hyd r oge n Oxygen Titanium
5.5 - 6.570 1.8 - 2.2 3.6 - 4.4 1.8 - 2.2 0.25 max. d.05 max. 0.05 max. 0.0150 max. 0.12 max. Balance
Tensi le resul ts are presented as Table V with samples of the load-strain curves compiled as F igure 17.
Poisson ' s Ratio values are as listed below:
S pec imen ~ v e r a g e Value Confidence Limits 9570 - Number Poisson ' s Ratio 90%
3-P1 -0.301 7 f . 0012 +. 0015
3-P2 -0.3076 f. 0026 t. 003 1
3-P3 -0.3115 t. 0016 +. 0020 -
Creep rupture data a r e presented in Table VI. t ime values are plotted in F igures 18, 19, and 20. the rupture life data appear as F igure 21.
Creep deformation versus Isothermal plots of
An analysis of the c r e e p ruptdre data using paramet r ic plots of the data in conjunction with the i so thermal plot yields the following values of the rupture s t rengths to produce 100, 300, and 1000 hour liie d a t a at the appropriate k s t temperatures .
- 3 1 -

TEST RESULTS (continued)
Material 3: Titanium-6Al-2Sn-4Zr-2Mo (continued)
Stress to Produce Failure at Temp. 100 hour '306 hour 1000 hour
482 900 620.5 90.0 579.2 84 .0 254.0 76.0
538 1000 399.9 58 .0 324.1 4 7 . 0 258.6 37.5
MN/m2 ks i -- "C "F M N /m2 - ka i MN /m2 - ks i -
593 1100 227.5 33 .0 162.0 2 3 . 5 113 .8 16.5
-32-

5 0 0
Q)
Y
.-l
a, Yl
5 is E
mN
S m
m4
O
I-
4
*cool
000 4
-4
0-4 000
000 000 000 000
... ... ... ..
.
Il
l
I1
1
11
1
Il
l
11
1
11
1
Il
l
Il
l
11
1
Il
l
11
1
Il
l
11
1
11
1
Il
l
11
1
11
1
11
1 I
ll
I
ll
1
11
1
11
1
11
I
ll
1
11
1
11
I
t1
I
ll
0
0
0
C
0
0
0
0
4
4
4
&?I r-
6
E
L
0000
"I I-0
00
ti.
604
.-
4
4
El
-33
-

I I "I
I
T-
-3 0
0

--m
dl
d.
Y
I
I h
-"I ld
M
C
'D
ld 0
C 0
.r(
d
.dl 00000 ooooom oooom
1
V
V 0
e, k
0
0
rc
CI
co Pl m
-35
-

a w w r(
rr: u
u I
rr)
0
OD 9
CI
N
r(
(Ohlo) NO
ILV
tJf)NO
’T3 d332l3
-36
- F
igure 18
d
N
0

1 1
I I
I
9
.-(
u I vl
L
0
0
0
c
0
0
0-
0
0 a
0
0
b
0
0
9
0
0
In 0
0
rs
0
0
m 3
0
Y
0
0 e
0

7
I I
1 I
I 1
..I(
A
\
-38- F
igu
re 20

-I -
Il
l I
Il
l
b( 0
3
5
Ln
Y Q
i I
II
I I
II
II
Il
l I
I I
I I 8
3c
30
0
00
0
03
0
0
00
00
0
33
0
OT
X
o
:n
0 0
0
d
0 0
a0
c
0 9
0
0
VI
0
0 e
0
0
rF,
G
0
N
0
m
- 0
0
- C
X
C
3
c
- r
- m
s: 0
3
d
=r c
Y

TEST RESULTS (continued)
Mater ia l 4: H-13 Tool Steel
This air-hardening, hot work tool and die s t ee l was eupplied as bar stock bv NASA-Lewis Research Center. Nominal composition of this alloy is as follows:
Carbon 0.35% Manganese 0.35 Silicon 1.00 Chromium 5.00 Vanadium 1.00
Iron Balance Molybdenum 1.50
P r i o r to finish machining, the ma te r i a l was heat treated at Metcut using the following NASA recommended heat treatment.
Preh-a t specimen blanks to 1400°F for 1/2 hour. Transfer to 1850°F/1 hour i a i r cool. Double temper a t 1200°F for two hours, air cool to room temperature each time. .
T
Tensile resul ts are presented as Table VI1 with samples of the load-strain curves compiled as Figure 22.
Specimen Average V a l u e Confidence Limits Number Poisson 's Ratio 90% - 95%
4-PI
4-P2
t. 0023
t. 0020 - t. 001 9
-0.2786 t. 0017 -0.2746 -
- t. 0018 - t. 0015 - 4 -P3 -0.2758
Creep rupture data are presented in Table VU. t ime values are plotted in Figures 23, 24, and 25. rupture life data appear as Figure 26.
Creep deformation versus Isothermal plots of the
An analysis of the creep rupture data using paramet r ic plots of the data in conjunction with the isothermal plot yields the following values of the rupture strengths to produce 100, 300, and 1000 hour life data at the appropriate t e s t temperatures.
-40-

TEST RESL ..TS (continued)
Material 4: H- 13 Tool Stee l (continued)
S tres s to Produce Fai lure a t
Temp. 100 hours 300 hours 1000 hours "C
538 1000 282.7 4 1 . 0 237 .9 34 .5 193.0 2 8 . 0
593 1100 165.5 24.0 134.4 19.5 106.9 15.5
049 1200 96.5 14.0 79 .3 1 1 . 5 62 .0 9 . 0
MN/m3- k s i - MN/m2 k s i MN/m2 - "F - -
- 4 1 -

.+;a
-=+tu
+m
m mqw 9 I
w
::ao
0
00
0
00
000
01
0
Id
ad
4
4-
0
00
000
01
0
..
. ... ...
.I
.
m:
X
3: 7 a, 1
11
1
11
I
ll
1
11
1
11
I
ll
I
ll
I
ll
I
ll
I
ll
I
O I
11
I
ll
1
11
1
11
1
11
0
0
0
0
0
0
0
4
N
E 6'1 H
.+
H
0000
.r4l b
oo
0
-42
-

0
0
- 0
N d
n
Ir 0
O
b
I\
0
0
3
0
N
3
c.
I
0
0
-r 0
0
Y
0
0
N

OC
QO
N-
In
r;rcL
no
o
-009
-N
m
oo
oo
oln
*m
mn
l
... U
idd
Ln
oo
o
0 0
0
d
00 m
VI
m 0' VI
0' * 9
-44
-

3 3
s.
3
3
x3
3 3
b
Y
Fc
I 1
\ c(
(Ob
) NO
TL V9N013 d3323 3
-46
- F
igure 2
4

I -
1
'-- I
'- -I
-'I
I m
0
0
-0
- 0
-
0
m
0
-0
00
0
-0
r-
\
0
0
4
0
0
In
0
0
I +
I" W
0
0
-47
-

I I
I I
I I
I I
I c
00
0 0
0
0
m
0
00 9
FS
ln
*
M
N
r(
.-(
!SY ‘SS3X
;LS
-473- F
igure 2
6
0
z Y

TEST RESULTS (continued)
Mater ia l 5: D-979
This precipitation hardening austenit ic, high temperature superalloy was supplied as fully processed wrought bar stock by NASA-Lewis Research Center.
-
Nominal composition of this alloy is as follows:
Carbon Manganese SiLicon Phosphorus Chromium M o lybdenum Tungs ten Titanium A Luminum Boron Iron Nickel
0.08 max. 0.75 max. 0.75 m2x. 0.040 max. 14.00 - 16.00 3. OC - 4.50 3.00 - 4. 50 2.70 - 3.00 0.75 - 1.30 0.008 - 0.016 25.00 - 29.00 42.00 - 48.00
Tensile resu l t s a r e presented as Table IX with samples of the load- s t r a in curves compiled as Figure 27.
Poisson 's Ratio values a r e as listed below:
Specimen Average Value Confidence Limits 9 570 -- Number Poisson 's Ratio 90%
5-P1 -0.2852 t. - 0026 t. 003 1
5-P2 -0.2853 t. - 0016 t. 0020 - ;r. 0012 f. 0014 5 -P3 -0.3013
Creep rupture data a r e presented i n T.:ble X . t ime values a re plotted in F i g u r e s 2 8 , 23 , and 30. thc rupture life data appear a s Figurc : J 1.
Creep deformation v e r s u s Isothcrmal pl,.cs of

TEST RESULTS (continued)
Mater ia l 5: D-979 (continued)
An analysis of the c r e e p rupture data using paramet r ic plote of the data in conjunction with the i so the rma l plot j i e l d s the following values of the rupture s t rengths to produce 100, 300, and 1000 hour life data at appropriate test temperatures .
Stress to Produce to Fa i lu re at
Temp. 100 hour 300 hour 1000 hour MN/m2 kel klN/m2 kai MN/m2 k s i - "F - C" -
593 1100 758.4 1'1.0 696.4 101.0 627.4 91.0
649 1200 599.8 87.0 537.8 78.0 482.6 70.0
7 04 1300 468.8 68.0 427.5 62.0 386.1 56.0
-53-

a
.- *
LI
..
..
..
..
..
..
-51
-

I
h
6( 0
0
r-
m 1m
0
0
0
3
0
0
0
0
0
0
00 9
d
Y
0
9
0
0
N
0
0
7 1
r -
1 1 T
-I ‘1 21

FO
Q
--
00
0
OG
OO
O
4m
N-
O
..... N
-Q
)
mQ
O.3
-
*N
-O
O
ooooc
.....
mN
+m
a
m!
-J
oo
-
00
00
0
00
00
.....
3
Y
z cd 3
0
.r(
&I
00
00
0
oo
co
o
OQ
U'
NO
c
z'
.J
)F
r-
F
..
..
. 0
00
00
....
GO
Y3
.3
b
FQ
4m
..... O
NO
rn
O
H0
03
\3
\
CI
-R
m $
0
0 c
c
0
0
Pl -
c- Y
9
?
0
r-
.. 'L:
3
u
II
II
I
ml
nl
nm
m
z -5
3-

In
3
In
G
In
0
In
0
m
rcI fw
N
d
l-4 0
0
0 0
d
0
0
rn
0 0
r)
0
0
r- 0 0
-0
0
0
In
0 t
d
0
0
m
c)
0
ru 0
0
d
0
Figiir$ 2
8
-54
-

w Fc 3 a w w d
U
-
tu u
I IL
"
1 - I
m 0
m
0
Ln
0
m
m
Y
tu c(
3
NO
ILV
f>N
0?3 d3
BN
3
In
0
0
0
0 0
.-(
C
0
m
0 0
30
0
0
r-
0
0
3
0
0
ln
0
0
* 0
0
rn
0
0
-J 0
0
c1
3
-55
- F
igu
re 2
9

II
I
I I
I 1
I
t-
I
tn rr)
0
rR
0
CR
cr) nl
N
- 0
in 0
1-)
0
Figu
re 30
0 0 0
CI
0 0
0'
0 0
m 0
0
I-
0 0 9
0
0
u)
0
0 e
0
0
<I
0 0
hl
0
0
c.
0

II
I I
I I
' I
I P
r'
II
''
'I
I
I
0
;I c-( u' OO
7 0 0
II
I I
1 I
I I
I I
II
II
II
I I
I I I
I c
30
3 0
9
0
0
0
s0
c
00
33
c
0
0
0
m
0C
.z
0 0 0
CI
0 0
9
0 0
In
0
3
w
3
In c
3
0
c(
3
X
3
-r
: y 'ssm7.Ls
- 57
-

TEST RESULTS (continued)
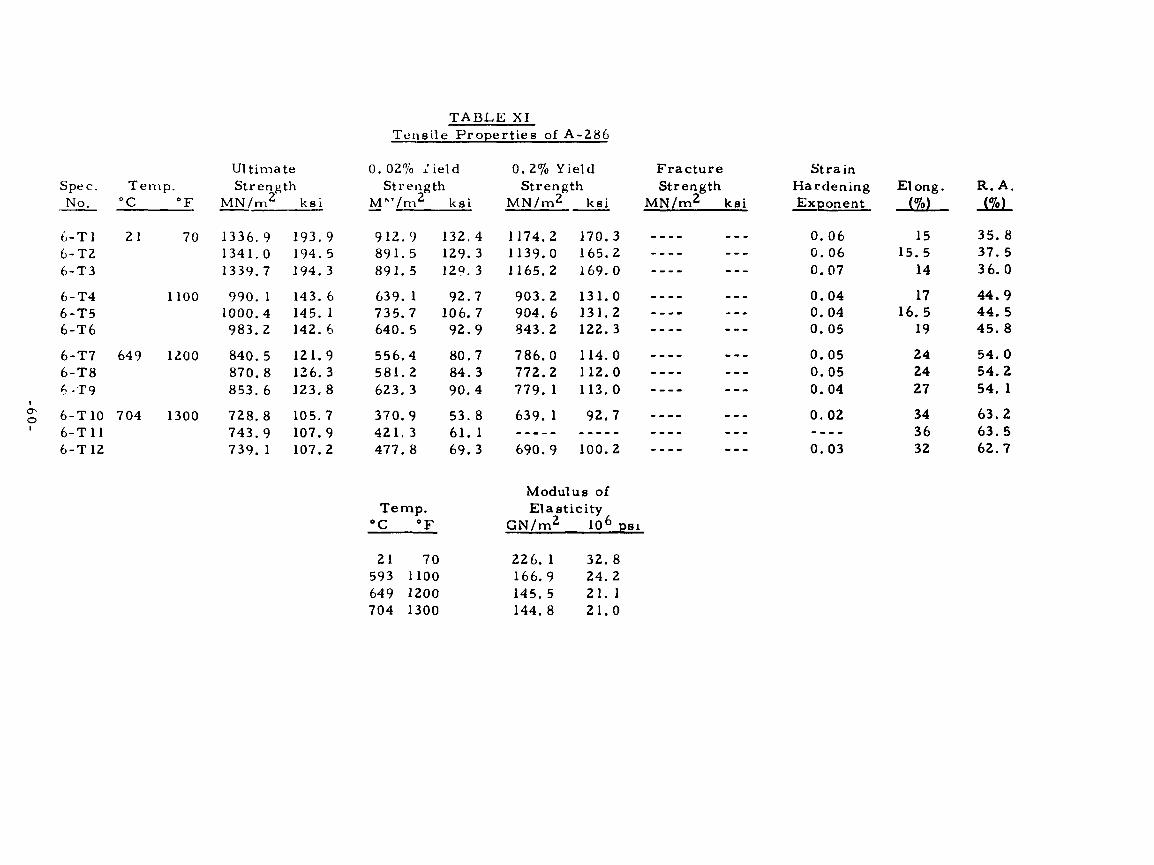
Mater ia l 6: A-286
This age hardenable austenit ic nickel-chromium s t ee l was supplied as wrought b a r stock by NASA-Lewis Resea rch Center. composition of this alloy is as follows:
Nominal
Carbon Manganese Silicon P ho s pho rou s Sulfur Chromium Nickel M o lybd e num Titanium A luminum Vanadium Boron I ron
0.08 max. 2 . 0 0 Max. 1.00 max. 0.025 max. 0.025 max. 13.50- 16.00 24 .00-27 .00 1 .00 -1 .50 1 .90-2 .35 0 .35 max. 0 .10-0 .50 0 .003-0 .010 Balance
Prior to finish machining, the ma te r i a l was heat t reated at Metcut using the following NASA recommended heat treatment:
Age at 1325"F/16 hours / a i r cool to room tempera ture
Tensile resul ts are presented as Table XI with samples of the load-strain curves compiled as F igu re 32.
Poisson ' s Ratio values are as listed below:
Specimen Average Value Number Poisson 's Ratio
6-P1 -0 .262 1
6 -P2 -0 .2624
6-P3 -0 .2640
Confidence Limits 9070 9 5% --
?. 0015 ?. 0018 t. 0024 2.0029
!. 0015 f . 0018
C r e e p rupture data a r e presented i n Table XII. v e r s u s t ime values are plotted in F igu res 33, 34, and 35. I so thermal plots of the rupture Life data appear as Figure 36.
Creep deformation
-58-

TEST RESULTS (continued)
Mater ia l 6: A-286 (continued)
An analysis of the crr-ep rupture data using paramet r ic plots of the da.a in conjunction with the isothermal plot yields the following values of the rupture strengths to produce 100, 300, and 1000 hour life data at the appropriate test temperatures .
Stress to produce fa i lure at Temp. 100 hours 300 hours 1000 hours
"F MN/m2 k s i M N /m2 ks i M N / m 2 k s i - "C - 593 1100 703.3 102.0 648.1 9 4 . 0 593 .0 8 6 . 0
649 1200 524.0 76 .0 437 .8 63 .5 358.5 52 .0
704 1300 303.4 4 4 . 0 217 .2 31 .5 148.2 2 1 . 5
-59 -
F
tn
m
ln
w
~i
m
000 000 000
01
0
..
..
..
..
.
I.
000 000 000 d
l0
Il
l
Il
l
11
1 I
ll
I
ll
I
ll
1
11
I
ll
I
ll
I
ll
I
ll
I
ll
I
ll
I
ll
I
ll
I
ll
me-
co
N"
0
av
-4
M
NN
N
..
..
-60
-

I 1
I I
I I
I I
U
3
a - d
U
0
d
h
.J
U
d
v
0
3
0
3
e
-
Y
- X
3
Y
-.I
c

109000
IN
NS
NO
I
AN
Nm
m
e-
9e
o
m-000
~0000
..... 9
mN
m
tn
r-
mN
4
mo
o0
0
00000
..... "I-
Im
ON
In
N
IN
N4
00
100000
..... 2 0 > ._
c)
m Q)
c,
0
c,
00000
000000
+r
om
*o
+
r*) n.
nl
..
..
..
k 0
k a
.C
..
..
.
OO
urru
In
-0
mm
co
4
4
P)
E" P) c,
I k
9) > 0
0
0
d
.. 0 0
N
CI
0 0 -+l
c(
Q' * 9
+ 0 IC
u 0, a
v)
.. aJ 3
Y
z
-62
-

v)
F-c 0
4
a
I
V I
0
0
0
c1
0
0
0
0
2
0
0
r- 0
0 a
G
0
In 0
0
-*
a
3
w
0
0
*J
3
- 3

0 0
0
0 0
co
0 0
r-
0
0
9
0
0
Y,
0 0
m
0
0
N
0
A
v)
e: 3
s
Fig
ure 34
- 64
-


60
$0
I 0 I
0 2 r.4 0 u’ I o T- I i 0
r.4 0
0
3
3
..I
a
0
Q
zW
/NH
‘SS
3NL
S
.-( I
ll
1
11
I I
I I
1 1
I I
I 0
3 3
00
0 0
0
om
0
Ln
c
dt
u
0
co
p4
m
*
WN
N
m
d
-l
-l
r(
!*Y ‘SS323L
S F
igu
re 3
b
2 3
0
z -
-bb-

TEST XESULTS (continued)
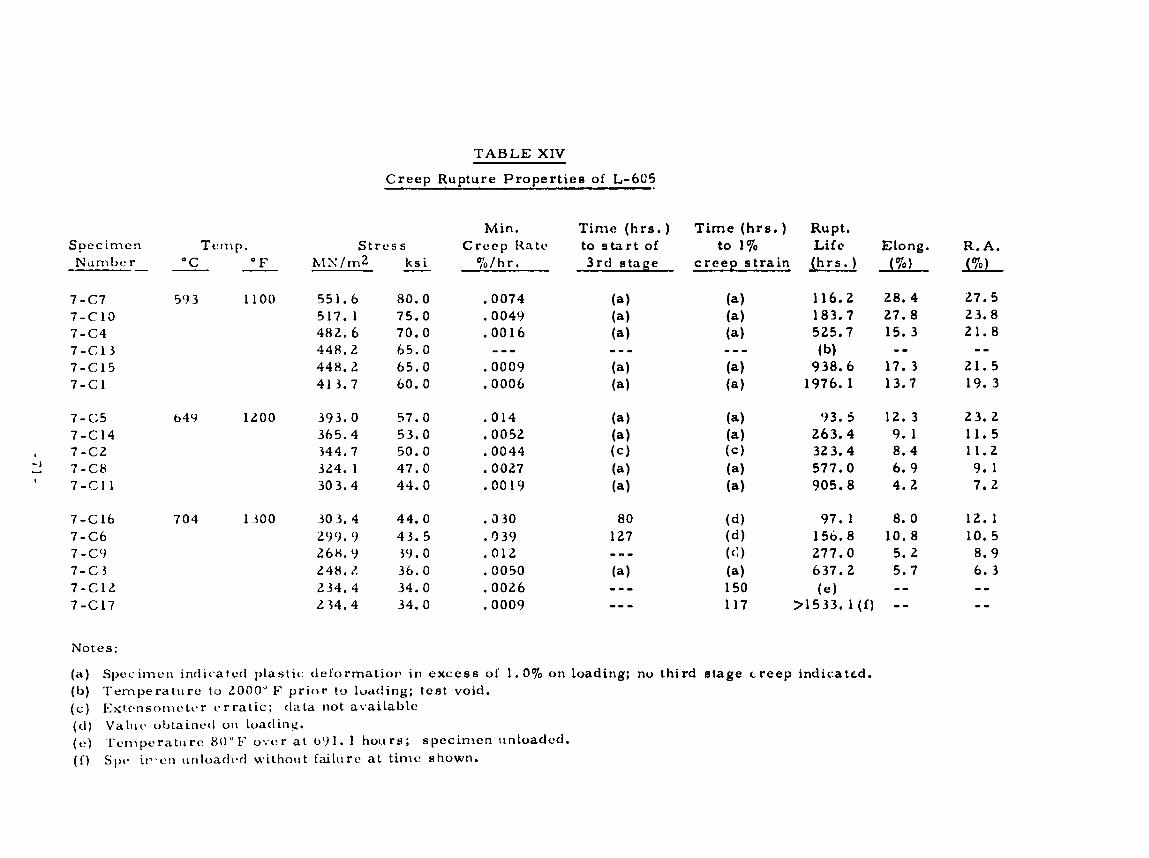
Material 7: L-605
This alloy, a cobalt-base alloy, was supplied irs fully processed wrought b a r skock by NASA-Lewis Research Center. this alloy is as follows:
Nominal composition of
Carbon Manganese Silicon Phosphorous Sulfur Chromium Nic tcel Tungsten Iron Cobalt
0.05-0.15 1.00-2.00 0.040 max. 0.040 max. 0.030 max. 19.00-21.00 9.00-1 1-00 14.00- 16.00 3.00 max. Bala nc e
Tensile resu l t s a re prebenced in Table XI11 with samples of the load- s t ra in cu rves compiled as F i g u r e 37.
Poisson 's Ratio values a r e as l isted belaw:
Specimen Average V a l u e Confidence Limits Number Poisson 's Ratio 90% 95%
7-P1
7-P2
7 -P3
-0.2924 t. 0016 +. 0020
-0.2935 f.0015 ?. 0018
-0.2874 f . 0012 t. 001 5
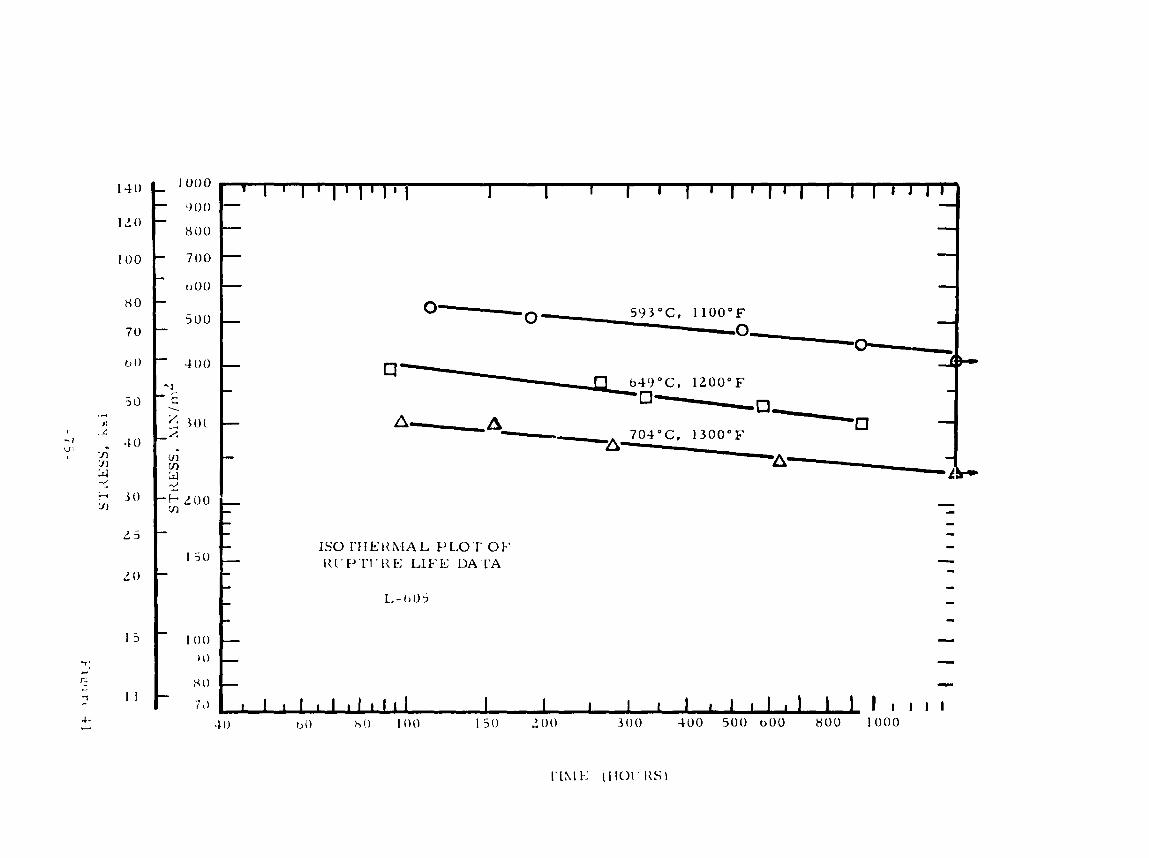
Creep rupture data a r e presented i n Table XIV. ve r sus t ime values a r e plotted in F igure3 38, 39, and 40. Isothermal plots of the rupture life data appear as Figure 41.
C r e e p deformation
- 6 7 -

TEST RESULTS (continued)
,a ter ia l 7: L-605 (continued)
An analysis of the c reep rupture data using pa rame t r i c plots of the data in conjunction with the isothermal plot yields the following values of the rupture strengths to produce 100, 300, and 1000 hour life data at the appropriate test temperatures .
S t r e s s to produce fai lure a t Temp. 100 hours 300 hours 1000 hours
MN/m2 ks i - A4N/m2 k s i - MN/m2 ks i - "C "F - - 593 1100 551.6 80.0 496.4 72 .0 448.2 65 .0
649 1200 399.9 58 .0 351.6 51.0 299.9 43 .5
704 1300 303.4 44.0 275.8 40 .0 244.8 35.5
-68-

II
IO
I
11
1
11
1
Il
l
Il
l I
ll
1
11
I
ll
1
11
1
11
1
11
Il
l
Il
l
11
1
11
1
11
1
11
1
11
1
11
1
Il
l
11
1
11
1
Il
l
' 1
11
I
ll
I
11
I
ll
NN
S
mm
r-
v
m4
o
m3
0
aa4 m
mm
m
mm
m
mm
.
..
..
.
..
..
.
mm
m
mm
m i
o0
-0
-

c
1
?e
3 'SS32TLLS
Figu
re - 70-
37
-2 2 r,
..4 a c ..4 a
9) a, &
J
0) M
(d m
c,
..- 5 0 c .- M f -5
Id 0
.L
3 0
J
(d 0
c -.
*ma
IC
*@
000
000
... -9
10
0
10
0
80
0
..
N*IC
rn
*
ln
*N
d
-0000
00000
..
..
.
09-
Or
nN
ln
NO
r
nr
nd
00
0
t7
c?
oo
oo
.
..
..
.
000000 00000 omoooo
...... .
..
..
omommo
IC
WO
IC
d
cQ
IC
IC
.0
99
m
mm
**
L
0
.r.
Y
2 & -
a
Or
-
0
0
a, 3
iJ
%
.e
0 0
0
0
Y
d
0
0
- 3
C
3. d
9
d 0
r-
.. VI 1) Y
s

Y
I
0
n
u I l-
0
0
0
d
0
0 6
0
0
Q)
0
0
r-
3
0 0 1
0 0
m
0 0
N
0
0
n
(%)
NO
ILV
9NO
T3 d33XJ3
Fig
ure 38
-72
-

I I
-r c(
u I r- \
I I
I
I \
ir,
u
I
r- \
I I
3
-r *J
3

cr) u IC
rrl
In
-
O 0
0
Ll cr) \ \\ \\
Y
\ \
0
0
0
w
0
0 6
0 0
a0
0 0
IC
h
2 1 o
b
0
In 0
0
* 0 0
cr)
0
0
N
0
0
c(
0
- 74
- F
igu
re 40
b

TEST RESULTS (continued)
Mater ia l 8: 304 Stainless S tee l
This alloy, a low carbon m e m b e r of the austeni t ic s ta in less steel family, was supplied as fully processed b a r s tock by NASA-Lewis Resea rch Center.
Nominal composition of this alloy is as follows:
Carbon Manganese Silicon P ho s p ho r u s Sulfur C hroinium Nickel I ron
0.08 max. 2.00 xnax. 1.00 max. 0.045 max. 0.030 max. 18.00 - 20.00 8.00 - 10.50
Balance
Tensi le resu l t s are presented as Table XV with samples of the load-strain curves compiled PS Figure 42.
Poisson ' s Ratio values are as Listed below:
Specimen Average Value Confidence Limits Number Poisson ' s Ratio - 90% 9 5%
8-P4 -0.2609 - 8-P5 -0.2458 -
t. 0039 - t. 0046 t. 0040 - +. 0048
t. 0057 - t. 0047 - 8-P6 -0.2617
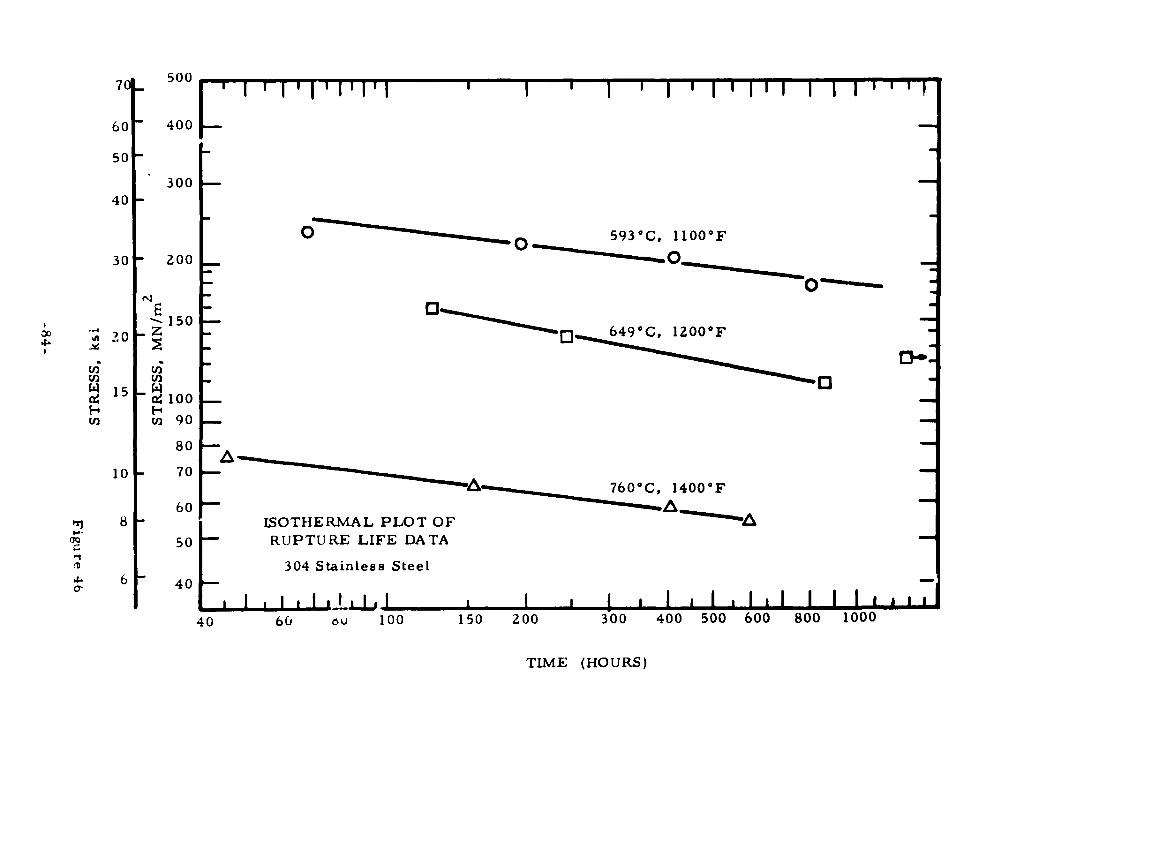
Creep rupture data a r e presented in Table XVI. time values a=e plotted in F igu res 43, 44, and 45. rupture life data appear a s F igu re 46.
Creep deformation versus I so thermal plots of the
An analysis of the c r e e p rupture data us i rg paramet r ic plots of the data in conjunction with the i so thermal plot yields the following values of the rupture s t rengths to produce 100, 300, and 1000 hour life data at the appropriate t e s t temperatures .
-76-

TEST RESULTS (continued)
Material 8: 304 Stainless Steel (continued)
Stress to Produce Failure a t Temp. 100 hour 300 hour 1000 hour
"C "F MN/m2 k s i MN/m2 - k s i MN/m2 - k s i
593 1100 237.9 34 .5 206 .8 30 .0 179.3 2 6 . 0 - --
649 1200 162.0 2 3 . 5 134.4 19.5 106.9 15.5
760 1400 68 .9 10.0 59 .3 8 . 6 50 .3 7 . 3
- 77-

b
im
b-
4
ON
-
9Q
pr
l
0
IO
O
ON
-.-I- 00-
0
IO
000 000 000
.I
. .
..
..
..
..
II
I
I
II
II
I
1
II
I
I
- 78-

I I
I I
I I
d
a,
VI U
Lrc 0
.-
Id VI Y
9
0
m
II
T 3
0
0
i
I I
I c
c
E
2 d
0
0
0
d
0
3
3
3
M
3 3 I
0
33
c
r: u

A
0, u K
l U
m
m
a, C
A
.d
b VI * 0 M U
0
a &
a 0
Lc
m
.d
c)
a a
k
L)
1 u & 2 0 > U
m
fu
MW
b
InH
109-
r(
M
1-
00
...
.. ....
rn
oo
oo
NNN--
.... 4MO009
0
0
H
.-(
0
0
lu H
0 0
d
.-(
I
IJ a
r
LI
0' d 9
0 9
r-
-80-

L
I
X

m
d
0
(\1
d
0
r(
3
c1
N
N
N
(Ob) N
OIL
V9N013 d33X 3
0
0
0
r(
0
0
06
0 0
0
0
* 0 0
m
0 0
N
0
0
c1
0
Fig
ure 4
4
-82-

\
X
I'
I I
'I
IT
"'
I I
I I
I I
I I
A c
I
Oi
0
0
=0
Irr
'i I 0
0
0 i
$1 0
0
e
"Q
7 I / I
1
I 1
11
11
11
1 I
I I
I I 1
I 1
1
Q
0
0
0
0
0
0
VI d
m
0
0
0000 0 0
0
0
In
06
CO
F 9
In
d
N
- "
-J uf / NVV 'S
SW
L S
I I
I I
I I
I I
I I
c
u
00
0
0
0
In
0
30 9
QI
n
d
0
e; r(
"
!SY
'SSm
3L.S
Fig
ure 46
-84
-

TEST RESULTS (continued)
Mater ia l 9: 316 Stainless S tee l
This molybdenum bearing grade of austeni t ic s ta inless , which can oe hardened only by cold working, was supplied as ‘~~Lly processed wrought bar stock by NASA-Lewis Research Center.
The nominal composition of this alloy is as follows:
Carbcn Mangancs e Silicon Pho s pho r u s Su Lfur Chromium Nickel Titanium I ron
0.08 max. 2.00 max. 1.00 max. 0.045 max. 0.030 max. 17.00 - 19.00 9.00 - 12.00
5XC min. Balance
Tensile resu l t s are presented as Table XVII with samples of the to ld-s t ra in curves compiled as Figure 47.
Poisson’s Ratio values are as listed below:
Specimen Average Value Confidence Limits Numher - Poisson’s Ratio - 9 0% 95Yo
9-P4 -0.2881 k. 0028 f . 0033
9-P5 -0.2d46 2.0023 t. 0027
9-P6 -0.2928 t. 0035 t. - 0043
Creep rupture data a r e presented i l l Table XVIII. versus time valuez are plotted in Figures 48, 49, and 50. Isothermal plots of the rupture life data appear as Figure 51.
Creep deformation
- 8 5 -

TEST RESULTS (continued)
Material 9: 316 Stainlees Stee l (continued)
An analysis of Lhe creep rupture data using parametric plots of the data in conjunction with the isothermal plot yields the following values of the rupture strengths to produce 100, 300, and 1000 hour life data a t the appropriate test temperatures.
Stress to Produce Failure at emp. 100 hour 300 hour I000 hour -.I
"F MN/m2 - k s i MN/m2 k s i MN/m2 - k s i - - -- 1 1100 303.4 44.0 282.7 41.0 255.1 37.0
704 1300 134.4 19.5 113.8 16.5 93.1 13.5
816 1500 64.1 9.3 51.7 7.5 40.7 5.9
- 8 6 -

rn rn a2 C
Ri
- .+
NQ
V
N-
N
000
..
. -
m-
N
NN
000
..
.
11
1
Il
l
I1
1
11
1
11
1
11
1
11
1
11
1
11
1
11
1
11
1
Il
l
11
1
11
1
I1
1
11
1
Il
l
11
1
11
1
11
1
11
1
11
1
Il
l
11
1
II
II
II
I
ll
I
ll
00
0
m
t-30
4
-
4m
u
NC
.0
L
or-
m
Ln 4
u?
In
0
c
0
0
m
+
a
X
-87
-

A
h
0
0
b
u’ CI
N
Y
rn
Fc I b
\
\
I I
I I
I I
I
3
in T
0
0
m
0
0
0
m
0
m
N
N
c(
7U
J/NW
‘SS3?.!.LS
0
0
- 0
0
In
0
* 0
0
m
N
!SY
‘S
S3H
l.S
0’
Fig
ure
47
-a!+-

.....
00
00
0
Qm
NU
-ln
*
**
mm
.....
oo
lnln
o
rY
C5
bQ
.....
l-44
0
0
0
0
ln
0
0
CI
- m
+
rs) 0.
ln
3 0
t-

N
m
5 a
9 G m
3
m
d w > z 0 w 4
u 4
w a w w d
u Y
3
z 3 3
A
9
2 8 3
Y
0
0
In
id
0
0
d
0
c
m
0
0
N
0
0
- 0
-90 -

L.

a w w d 'u
u N
-
3 3
tc
0 3
v
0
0
rr)
0 0
N
0
0
CI

3
3
3
3
3
v
in -r
,-l
h

TEST RESU LTS (continued)
Mater ia l 10: Udimet 700 - Thie nickel-base alloy was developed for high tempera ture tensile strength, c r e e p res i s tance and high fatigue strength. Chemica L composition of this heat of m a t e r i a l (supplied by NASA) is ds follows:
Carbon Manganese Silicon Chromium Coba lt I ron Mo lybde num Boron Zirconium Sulfur Copper Tic ke 1
0.07% <o. 10 <o. 10 14.6 19.0 0. 19 4.85 0.027
<O. 05 0.003
CO. 10 Balance
The b a r stock supplied by NASA-Lewis Research Center required this recommended heat t rea tment pr ior to final machining.
2125"F/4 hours / a i r cool to room tempera ture 1975"F/4 hours / a i r cool to room tempera ture 1 550"F/24 hours /air cool to room tempera ture 1400°F; 16 hours /air cool to room tempera ture
Tensile resul ts a r e presented as Table XIX with samples of the load- s t r a in curves compiled as Figure 52.
Poisson's Ratio values a r e as listed below:
S pecime n Average Value Confidencc Limits Number Poisson ' s Ratio 90% 9 5%
10-P1 -0.2903 f. 0014 +. 0017 10-P2 -0.2926 t. 0 2 3 t. 0023 - iO-P3 -0.2862 f . 001 7 f . 0020
-94-

I I I
TEST RESULTS (continued)
Mater ia l 10: Vdimet 700 (continued)
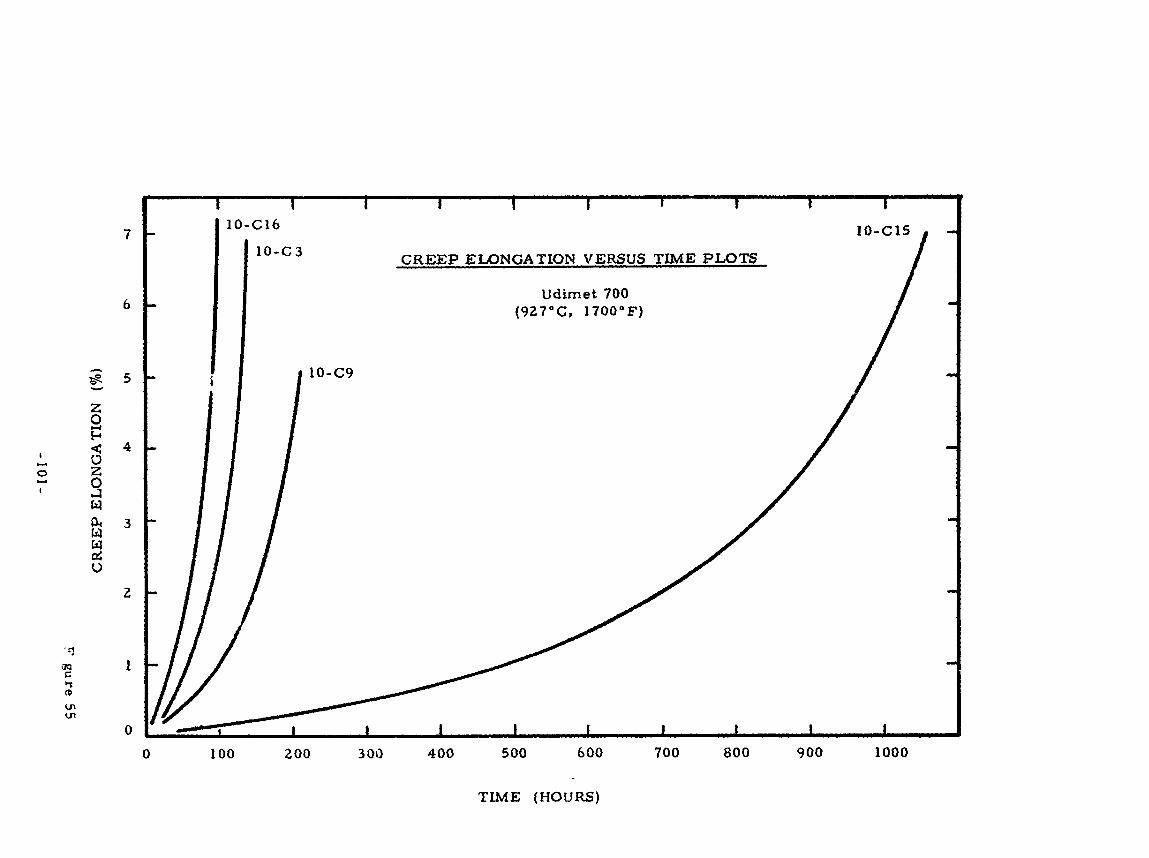
Creep rupture data are presented in Table XX. Creep deformation versus t h e values are plotted in Figures 53, 54, and 55, Isothermal plots of the rupture Life data appear as Figure 56,
L e analysi, ,f the c r e e p rupture data using parametric plots of the data in conjunction with the isothermal plot yields the following =lues of the r:?ture strengths to produce 100, 300, and 1000 hour Life data at the appropriate test temperatures.
Stress to Produce Fa i lure at Temp. 100 hour 300 hour 1000 hour -- "C "F MN/rn2 - k s i MN /m2 - ks i MN/m2 - ks i
760 1400 482.6 70.0 420.6 61 .0 358.5 52 .0
816 1500 372.3 54.0 331.0 4 8 . 0 289.6 4 2 . 0
927 1700 186.2 27 .0 151.7 22 .0 120.7 17.5
-95-

da
oa
o -
**
f4m
w
MO
O 0
00
0
00
00
0 0
00
0
00
. . . . . . . . .
0
0
0
0
0
0
In
IC
2 cI
d
0
9
IC
9
4
N
IC
m
m
Il
l
Il
l
Il
l
000 003 0
00
4
-0
r
(-
(r
(
c(cIc(

I I
I I
I
I
I
CI
cr 0
0
0
* d u’ 0
9
r-
In
- F I
d
0
L-
crr 0
0
0
In
c(
u’ 9
d
00
rc -
0
0
F
crr I
0 -
0
d
T * 0 0
0
0
0
0
0
0
0
0
0
0
d 0
00 9
e
d
00 9
w
N
(u
N
w
c1
d
4
c1
!*Y ‘SS3lT
L.S
-07
-
Fig
ure 52

ma*
N*
N~
l
U)
OO
O
,0
00
0
0.
0 . .
0
0
YP w
0
0
In
e-4
0
0
IC w
I
0
9
IC
9
a0 r(
pc N
QI

M
d
u t 0
I
. 0
!i ni w t4
G W
\-
r- t u 0
I t
f I
i I
(Ob) N
OI.L
V9N
OT
3 d338tJ3 F
igure 53
-99
-

I I
I I
1 I
r
.
I I
1 I
I 1
U
0
Figu
re 54
0
0
* 0
0
c*)
0
0
N
0
0
r(
8
- 100-
I I
I I
I
I I
0
0 0
4
0 0
Q‘
0 0
co
0
0
r- 0
Iv)
0 0
crl
0
-10
1-

Il
l I
I I
‘ I
I
a Il
l
00
0
6
v-4
I .
g
00
C
OIC
.-. UJ/AIw
‘SS3XL
S ,Z
-
I I
I I
1
Figu
re 56 -1
02
-

TEST RESULTS (continued)
Mater ia l 11: TAZ-8A
This alloy was developed by NASA-Lewis Research Center for go3d elevzted temperature s trengths and excellent cor ros ion resistance. The ma te r i a l was supplied as cast remelt stock and was cast into bar specimens by Howmet Corporation-Misco Division. perfomred on the ma te r i a l in the as-cast condition.
Testing was
Chemical analysis of this heat of material (supplied by NASA-Lewis Research Center) is as follows:
Carbon Manganese Silicon Chromium M o lybd enum Tung:, ten Iron Sulfur A luminum Co lumbium Tanta lum Boron Zirconium Bismuth Lead Nickel
0.13% 0.04 0 . 1 1 6.10 3.90 4.00
<o. 10 0.015 5 .78 1.81 8.10 0.005 0 .57 c . 2 ppm
Balance < 1 PPM
Tensile resul ts are presented as Table XXI with samples of the load- s t r a in curves compiled as Figure 57.
Poisson 's Ratio values are as listed below:
Specimen Average Value Confidence Limit 9
Number Pois s on' s Ratio 9 0% 95%
+. 0080 - t. 0067 - l l -P1 -0.3092
1 1 -P2
1 1 - P 3
+. 0029 - t. 0024 -0 .3295 - t. 0101 - t. 0084 - -0.3111
-103-

TEST RESULTS (continued)
Mater ia l 11: TAZ-8A (continued)
Creep rupture data are presented i n Table XXII. Creep deformation versus time values are plotted in Figures 58, 59, and 60. Isothermal plots of the rupture life data appear as Figure 61.
An analysis of the c r e e p rupture data using parametric plota of the data in conjunction with the isothermal plot yields the following values of the rupture strengths to produce 100, 300, and 1000 hour life data at the appropriate test temperatures.
Stress to Produce Fa i lure at Temp. 100 hour 300 hour 1000 hour
MN/m2 k s i MN/mZ ks i MN/m2 - k s i
850 1562 417.1 60.5 348.2 50.5 282.7 41.0
92 5 1697 244.8 35.5 203.4 29.5 166.5 24.0
1000 1832 137.9 20.0 117.2 17.0 96.5 14.0
- - "F - "C -
-104-

9-
b
QN
Q 9
69
Q
I6
m
0-
0 040 -0- 00-
. . . . . . . . . 0
00
000 000 d
dd
N0
50
4-1
9
...
w i pI
0
N
pc nl
r
9
6
m
m
9
00 rl
- rl
0

I
c N
co I
8
- __.-
I
c? N
I U U
H
-1
-
0
0 -
I I
I 0
0
- 0
0
0
0
0
0
0
0
0
0
0
3
0
0
00 9
d
hl
d
2
U
l-4
- 106- F
igure 57

0
rr) 0
ln 4 00
or-
turn e
cln
lnln
o
(u
ln
a-9
N
N
e.
..
.
.....
, o
oo
oln
o
2 0 >
tn 9) l.I
rn c,
e,
ec 6
9
4
E 0,
ln N
6
0
-10
7-

In
0
In
Q
In
0
m
0
0
. 0
. cc)
rn nl
N
- U
d
NO
ILV
DN
CY
I3 dO
m3
F
igure 58
- 108-

0
0
0
0
d
0
0
R
Figu
re 59
-109-

I '-
I-' 1 1
-
-I--' 1
0
-0
0
U
0
0
'6
VI r(
0
d
d
\
0
-0
00
0
-0
rc
0
-0
9
0
-0
VI
0
-0
-P 0
-0
rn
0 0
'h
)
0
0
4
'0
I-
In
h)
U
0
($) N
01.L V9
NO
T3
d33?33
Figu
re 60
- 110-

I'
I I
I""I"" 1 I
1 I
I 1
1
I 9
N
In0
..v I
0
0
0
0
In
*
0
rl
u' In
N ! QI 0
i Il
l
II I I I I I
I I
I I I--I. ,I,. I
I I
0
0
wl
0
0
0
m
N
c(
0000 0 0
0
Oo
\Q
)r
CQ
In
d( r(
W/N
M 'S
S3V
.I.S
I I
I I
I 2
I I
I I
0
00
0 0
I- rr)
0
In
N
r(
0
a0 9
r(
0
0
0
r(
0 0
a0
0 0
9
0 0
In
0 0
*-
3
mu
w r3
sg
3 0
0
0
In
r(
0 0
r(
0
Q)
0
9
0
dl
Figu
re 61 ?B
y 'SS3IlLS
-11:-

TEST RESULTS (continued)
Mater ia l 12: IN 100
This nickeI- ' w e alloy, developed for high temperature e trength, was supplierl by '4ASA-Lewis Research Center as c a e t remelt stock. Scbeeqlient y, it wae cae t into bar epecimens by Howmet Corporation- Misco Divic: ion. condition.
Testing wae performed on the material in the a e -cast
Chemical composition of thie heat of material (supplied by NASA-Lewis Research C nter ) is as follows:
Carbon Manganese Silicon Chromium Goba lt Molybdenum Aluminum Titanium Zirconium Boron Iron Vanadium ':.ckel
0.17 < o m 02
0.11 10.30 15.10 2.96 5.45 4.76 0.084 0.016 0.021 0.97 Balance
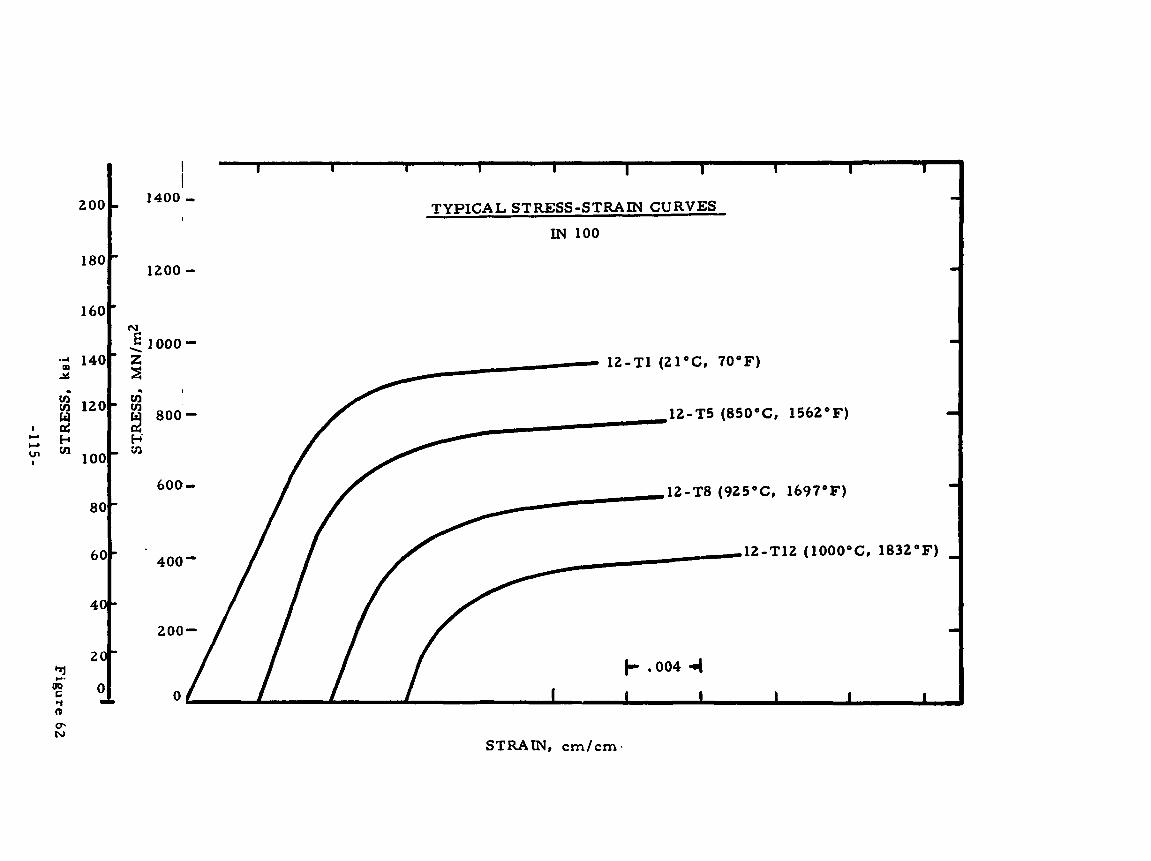
Teneile reautte are presented as Table XXIII with samples of the load- s t r a i n curveH compiled as Figure 62.
Poieson's Ratio va lues are a e listed below:
Spec in ien Average Value Confidence Limits Number Poie son's Ratio 90% 9 5% - -- 12-PI -0.3038 - +. 0080 - t. 0096
t. 0038 - t. 0046 12 t 2 -0.3188 - t. 0059 - t. 0049 - 12 -P3 -0.2717
- 1 12-

TEST RESULTS (continued)
Mater ia l 12: IN 100 (continuea)
Creep ru r tu re data are presented in Table XXIV. Creep deformation versus t ime values are plotted in F igures 63, 64, and 65. I so thermal plots of the rupture Life data appear as Figure 66.
An analysis of the c r e e p rupture data using paramet r ic plots of the data in conjunction with the isothermal plot yeidls the following values of the rupture strengths to produce 100, 300, and 1000 hour Life data at the appropriate test temperatures.
Stress to Produce Fa i lu re at
MN;m2 k s i MN/m2 MN/m2 ks i Temp. 100 hour 300 hour 1000 hour
- - "C O F
850 1562 427.5 62.0 358.5 52.0 296.5 43.0
925 1697 262.0 38.0 206.8 30.0 158.6 23.0
1000 1832 137.9 20.0 113.8 16.5 93.1 13.5
- -
-113-

d
XI
mo
b
040
Odd
*O
O
--
4
000
... 48
4-
... 000
-6-
-04
ddd
0
PI
4
N
N 9
m
r(
0
m
co
IC
rn 9
r(
m hl rn
N
m
co 9-l
0
0 0
9-l
n
k
0 0
n
0 k
cu 9
In
r(
u’ ?2 0
In
In I b
!BY
‘SS3X
LS
-115-
Figu
re 62

O\O
\l-I*
N
N9
m-
w
do000
00000
..... *a40
N N
- moo00
00
00
0
o.
..
.
00000
mm
NN
N
..... c
o~
tc
mm
N
9
m c(
N
m
Oo U
0
m
a0
m
N
m
0
0 0
U
- 116-

.
I I
-
1'
- -
-
I -a
I I
I
VI w
.
m
N
r(
0
I- 9 (%
) N
OIL
V9N
OT
3 d33X3
-11
7-
Figu
re 63
0
0
0
r(
0
0
0
0
Q)
0
0
I-
.-.
w I
nH
O
E;
0
0
0
w
0 0
m
0 0
tu 0
0
N
0

t- 9
rr, M
cv U
0
(%I N
OIL
LN
OT
3 d33X3
- 118- F
igure 64
0
0
0
rl
0
0
QI
0
0
(c
0
0
rn
0
0
N
0
0
1-4
0

- 4
I
I I
I I
I f
+
9
ln
d
rr) N
U
0
NO
XL
V9N
013 d3m
3
0
0
0 0
cr5
0
0
N
0
- 119- F
igure 65

I zU
J / NIN ‘ S
Sm
L S I
I I
I I
I I
I
0
In
cv 9-l
0
00 9
4
w F’ 3
?B
Y ‘S
S3
2n
S
-12
0-
Figu
re 66

TEST RESULTS (continvied)
Mater ia l 13: IN 100 t Jocoat
Some of the c a s t IT! 100 b a r s (Mi ie r i a l 12) were coated with PW ?2 A 47 Jocoat at TRW Inc. -Turbine Components Division. A t the end of the coating cycle, the b a r s were heat t reated in vacuum as foliows:
1975 "F/4 hours / rap id a r g o i quench
Tenoile reaul,, are prese3ted a8 Table XXV with samples of the load-st. iia curves compiled as Figure 67.
Creep rupture data are presented i n Table XXVI. Creep deformation versus time values are plotted in F igures 68, 69, and 70. I so thermal plots of the rupture life data appear as Fivre 71.
An analysis of the c r e e p rupture data using paramet r ic plots of the data i n conjunction with the i so thermal plot yields the following values of the rupture s t rengths to produce 103, 300, a d 1000 hour life data at the appropriate tea t temperatures .
Stress to Produce Fa i lu re at Temp. 1 002 hour 300 hour 1000 hour
" C OF MN/m - k s i MN/m2 - ks i MN/m2 & -- 850 1562 413.7 60.0 344.7 50.0 i d . 7 41.0
925 1697 244.8 35.5 199.9 29.0 158.6 23.0
1000 1832 137.9 20.0 106.5 15.5 82.7 12.0
-121-

2;
5h 04.4 999
mm
m
rD
&
00
0 0
00
0
00
0
00
gj 1 w
4-
4
00
0 0
00
0
00
.
..
..
..
..
..
.
- 122-

I I
1 I
I 1
I
.n
aJ 0
0
c, + 0
0
n
I I
I 0
0
0
0
0
0
0
0
0
0
0
0
0
0
e
N
0
OD 9
e
N
U
Y
2 b I cr) r(
d 0
0 .
1, I
0
0
0
0
0
0
0
0
0
0
0
0
00 9
N
H
r(
N
0
OD 9
e
N
.-(
r(
P
U
?BY ‘S
S3X
LS
-12
3-
Figu
re 67

m9
mr
-0
0
bv
)*
mo
-
00
00
0
00
00
.....
9ln
Inr-
r-
om
m-
N
-0
00
00000
.....
oo
oo
ln
N
9
ln
r(
N
m
co .-(
0
v)
co In
N
6
0
0 0
rc
- 124-

I I
I 1
t 1
1
Ps
\
Figu
re 68 - 125-

0
0
0
d
0
0 6
0 c
0 0
P-
0 0
m
0
0
N
0
0
-.1
Figu
re 69
- 126-

I I
I I
I I
vi
r(
Figu
re 70 -127-

I'
cr 0
cv 9
Ln
U
.
I
0 P 0
I
0 l
II
II
I
II
00
co
b
II
I 0
5 0
Sl
n
d
0
0 0
r(
0
0
00
0
0
9
0
0
m
3 0
* 0 0
rn
0
0
N
0
In
.-(
0
0
r(
m
0 9
0
*
w
I I
I I
I I
I I
I I
00
0 0
0
0
VI
0
Q)
Q
+Q
ln
*
m
hl
c1
c(
?B
Y 'SSrnL
LS
Figu
re 71
- 128-

TEST RESULTS (continued)
Mater ia l 14: B 1900
This nickel-base alloy, developed by Prate & Whitney Aircraf t for turbine applications was supplied by NASA-Lewis Research Center as cast remel t stock. The alloy was cast into specimen blanks by Howme t Go rporation- Mia co Divis ion.
Chemical composition (supplied by NASA-Lewis Research Center) of this heat of mater ia l is as follows:
Carbon Manganese Silicon Chromium Cobalt Molybdenum Tungs ten A luminum r i tanium Zirconium Boron Tantalum Iron N i c ke 1
0.10 0.10
eo. 10 8.11 10.15 6.11
(0.10 6.09 0.98 0.08 0.013 4.28 0.16 Balance
Prior to finiah machining the specimens were heat treated i n air per NASA-Lewis Research Center. Instructions w e r e as follows:
1550°F/24 h o u r s / a i r cool to room temperature
Tensile resul ts a r e presented as Table XXVII with samples of the load- s t r a i n curves compiled a s Figure 72.
Poisson's Ratio values are as listed below:
Specimen Average Value Confidence Limits Number Poisson's Ratio 9 0% 9 5%
to. 0028 to. 0033 14-P1 -0.2 176 - - to. 0071 to. 0085
to. 0024 to. 0029 - - 14-P2 -0.2118
14-P3 -0.3771 - -
- 129-
TEST KESULTS (continued)
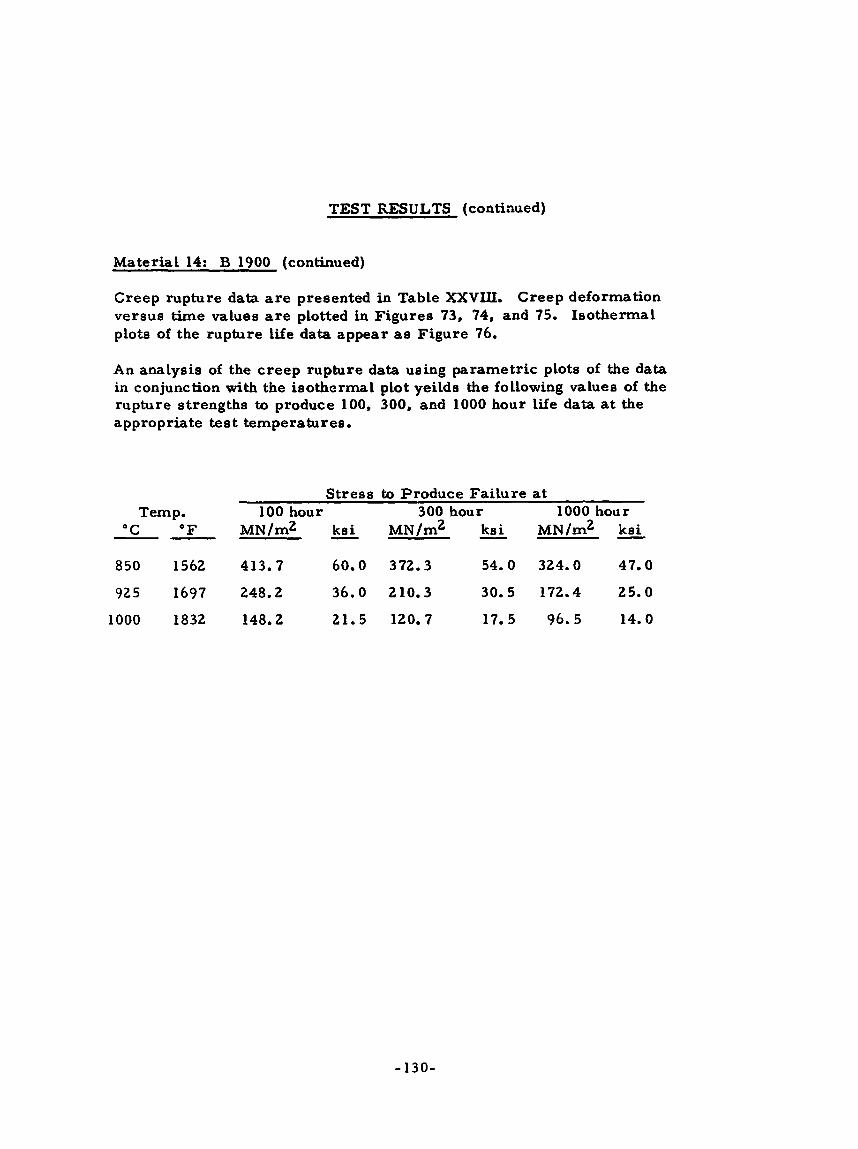
Mater ia l 14: B 1900 (continued)
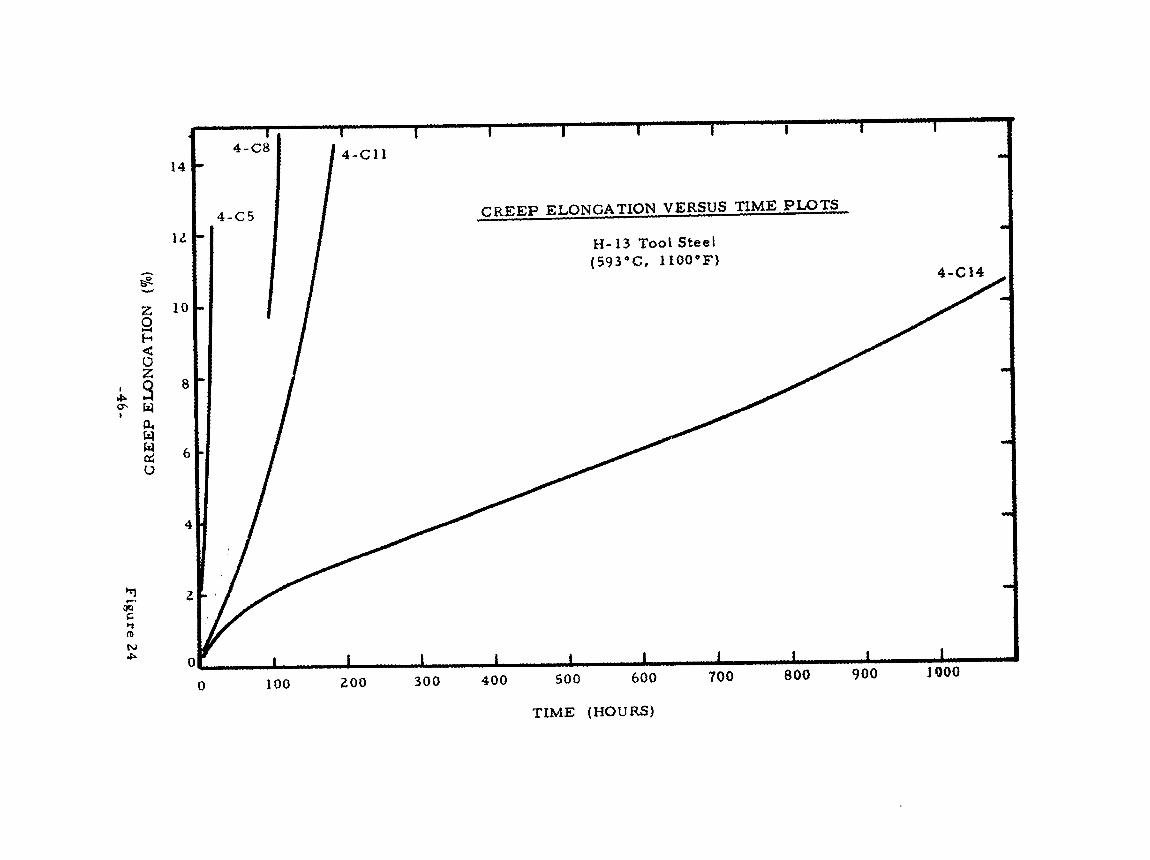
Creep rupture data are presented in Table XXVIII. versus time values are plotted in F igures 73, 74, and 75. Isothermal plots of the rupture life data appear as Figure 76.
C r e e p deformation
An analysis of the c r e e p rupture data using parametric plots of the data in conjunction with the isothermal plot yeilds the following values of the rupture strengths to produce 100, 300, and 1000 hour life data at the appropriate test temperatures.
Stress to Produce F a i l u r e at Temp. 100 hour 300 hour 1000 hour
"C "F MN/m2 k s i MN/m2 - k s i MN/m2 && - -- 850 1562 413.7 60 .0 372.3 54 .0 324 .0 47 .0
925 1697 248.2 36 .0 210 .3 30 .5 172.4 2 5 . 0
1000 1832 148.2 21 .5 120.7 17.5 9 6 . 5 14 .0
- 130-

L'q
bo
bo
I *
0 0010
00
0 0
1
0
.. .
I .
-0
P-
00011)
-131-

0 0
0
0 .
Y
0 0
QI
r(
E9
I I
I v
0
0
0
0
0
0
0
0
0
* 0
00 .D
*
N
c(
2 v
0
00 .D
*
N
c(
2
0
0
0
0
0
0
0
0
0
od
ni
0
b)
9
* N
f-4
r(
f-4
f-4
ad
0
a0 N
r(
?B
Y ‘SS3X
3.S
Figu
re 72 -1
32
-

v x 2 P 0
0
E
c)
2 B ?I Id P
0
)
;
10
x 3 4
w
Y
0
;
m
v E
td
U
0
.u
.rl
E Y
.a 10 k
5 0
2 9
UI 9
b
d a Q
) 9) k
U . Y
OI
d P
Q)
Id U
P
C
C
c,
.d
.d
: .rl u P) a
vl
P
A
Y
oommo
Ln
bN
Od
N
mm
bb
U9
a
mr
C.-
o
-0000
00000
.*
.a
.
.... s 4
2 .rl
s d 0
C d P
C 0
U
C ,
5
Y Id k 0)
c,
b .. .4
Y
E c,
E 4 0
(D C Q
) u
A
Id -
P- 6
9
U
N
Q
yr U
N
m
co C
I
0
m
co In
N
m
0
0
0
CI
-13
3-

,
U
\
0
0 0
r(
0
0 6
0
0
00
0
0 e
"
ln
k
0
0
d(
0 0
r\)
0 0
r(
0
- 134- F
igure 73

I I
I I
1 1
I
00 I u d
\
\
m
e
m
N
c(
G
(Ob) N
0I.L VD
NO
T3 d
3323
Fig
ure
74
- 135-
0
0 0
- 0
0
m
0
a
a0
0
0
z Y f-c

0
0
0
d
0 0
m
0
0
Qo
0
0
IC
Oi
ii
3
0
X
0
9
Y
::2 c( t.c
Yr
0 0
w
0
0
m
0 0
N
0
0
r(
0
e
9
VI
m
N
.-(
0
(I)
NOI.T.V!3NO
'T3 cf33?J3
Figu
re 75
-136-

1'
I I
I'l
'~l
''rr
I
1 1
I I
I
0 i u' 0
!I VI "OO I 0
I
P
0 i I
1 I
I IIIIIIIIII I I
I I
I I
11 0
T#
0
0
0
0
0
00
00
0 0
0
0
c
0
cn O
@C
O+
Q
In
d
0
In
w
m
N Z
Uf/N
W 'SS2IX
LS M
4
I I
I I
I I
I I
I I
VI 0
m
9
M
- 0
0 0
0
0
0
w-
4
In
d
m
N
?BY 'SS3X
LS
Figu
re 76
- 137-

TEST RESULTS (conti d)
Mater ia l 15: B 1900 + Jocoat
A number of the machine. w e r e shipped to TRW Inc - h r b i n e Componeqts Division tc L -1% the PWA A 47 Jocoat applied. During this coating cycle, the b a r s w e r e vacuum heat t reated as follows:
nd heat t reated cast E 1900 bars (Material 14)
1 9 7 5 OF /4 hours / rapid argon quench
After coating, the specimens w e r e heat t reated ( a t Metcut) in air as follows:
1550°F/24 h o u r s / a i r cool to room temperature
Tensile resul ts are presented as Table XXIX with samples of the load-strain curves compiled as Figure 77.
Creep rupture data are presented i n Table XXX. versus time values are plotted i n F igure 78, 79, and 80. Isothermal plots of the rupture Life data appear as Figure 81.
C r e e p deformation
An analysis of the c r e e p rupture data using parametric plots of the data in conjunction with the i so thermal plot yields the following values of the rupture strengths to produce 100, 300, and 1000 hour Life data at the appropriate test temperatures.
Stress to Produce Fa i lure at
MN/m2 k s i MN/m2 k s i MN/m2 ksi Temp. 100 hour 300 hour 1000 hour
- - "C "F -- 850 1562 393.0 57.0 344.7 50.0 299.9 43.5
925 1697 241.3 35.0 199.9 29.0 165.5 24.0
1000 1832 137.9 20.0 113.8 16.5 93.1 13.5
-138-

+9
-
Op
cQ
0
0-
-
0-
ddd d
dd
omm
em
1-
No
06
o
m(
U
... ..
.
mm
o 0
00
mmo lc
bb
Q&
O
Om
&
9Q
-P
m
mm
*
*lh
m
mm
N
IC
9
m
ln
9
4
4
0
m
In
N
co a
-139-
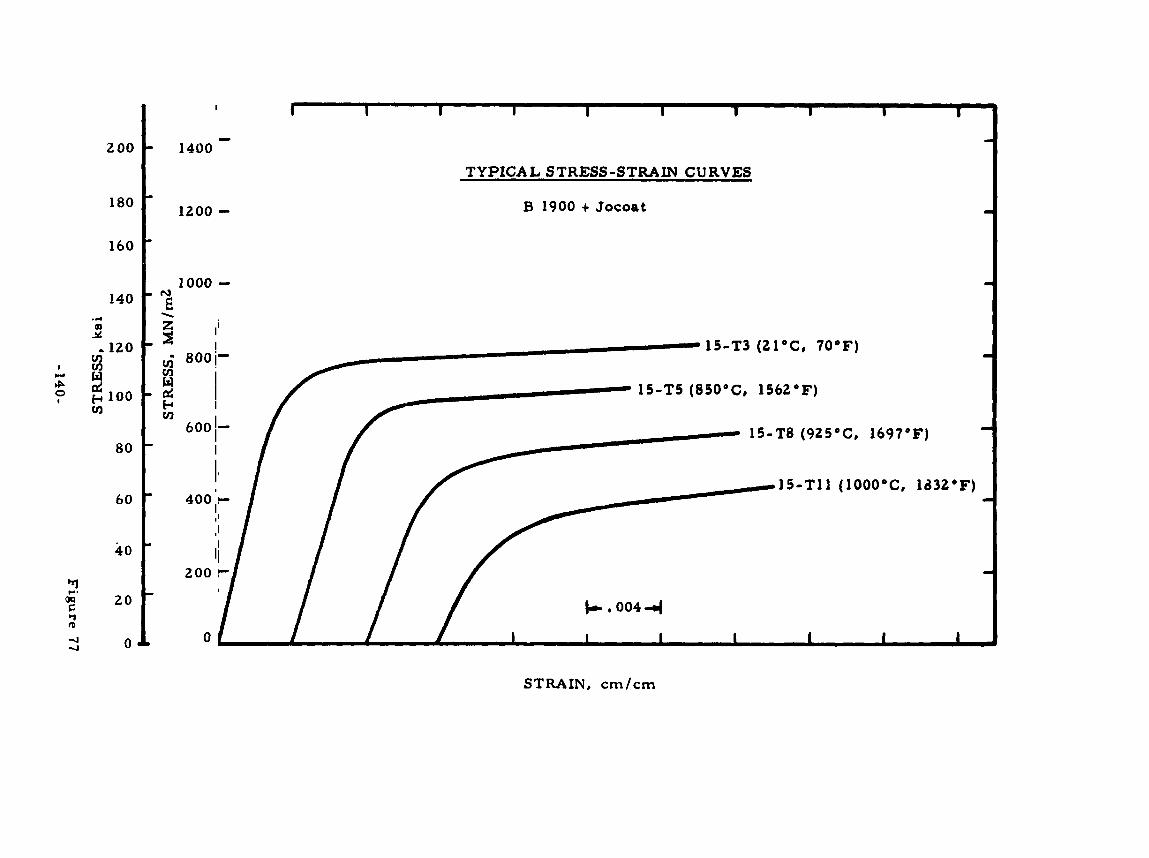
I I
I
0
0
0
0
0
0
0
0
0
0
3
0
0
0
0
0
0
0
90 9
d, N
dr
r(
N
U
r(
p/
NW
‘SS3XIL
S
0
0
0
0
0
0
0
0
0
0
0
0
00 9
cr tu
U
U
U
N
0
00 9
.e r\l
U
r(
E E i U
\
U
3 F
vl
Figu
re 77 -1
40
-

nl
-I
-@
"
MM
I-
Nm
Q
N0
00
0
00
00
.....
OO
oO
dV
I
-m
dN
-
-0
00
0
00
00
0
..... m
a-
om
l
nI
-m
No
-
00
00
0
00
00
.....
00
00
0
mc
CN
I-
9
Qln
In
eq
..... 0
00
00
bN
6I-In
m
mN
NN
.....
I-
o' 9
d
N
m
00 d
N
9
m
c(
0
m
cb
In
N
m
0
0 0
N
- 141 -

--
I
I I
1
I 1
1-
-
m u I m
--\
I I
I I
CI
cc 9
m
e
PF) N
R
0
(%I N
OIL
V9
N0
13
d33X3
- 142- F
igure 78
3 3 3
r(
3
O
m 0 0
0 0
IC
Q
0
0
m
0 0
e
0 0
m
0 0
N
0 0
d
L
h
m
d 3 0
3:
w Y
s F:

0
r(
u I VI c(
+ I
VI
u c(
6
u I
r(
m
0
0 0
r(
0
0 6
0 0
a3
0 0
+
0
0
9
0 0
VI
0
0
* 0
0
M
0
0
N
0
0
c1
0
r- 9
VI d
l rr)
N
- 0
(Ob) N
OIL
Vf)N
0?3 d33M13
Fig
ure
79
-14
3-

I I
I I
I I
r(
r- 9
In
e
m
N
Figu
re 80
0
c, 0
r(
0
0 6
0
0
00
0
0
IC
0
0
d
0 0
rl
0 0
N
0
- 144-

D I 0
I
I I
W/N
W 'SS3X
J.S I
I I
I IZ
I I
1 1
1 0
00
0
0
0
Ln
0
co
9
b
am
e
Frl N
U
U
!BY 'S
S3X
LS
F
igu
re 81
-14
5-
0
0 0
r(
0 0
00
0 0
9
0 0
m
0
0
-=t
h
2 3
0 0
"8
Y
03
0
w
ru
b
0
In
1-4
0 0
1-4
0
00
0 9
0
Cr

TEST RESULTS (continued)
Mater ia l 16: Mar-M200
The nickel-base alloy, designed for use as a cast turbine blade mater ia l , was supplied as c a s t r eme l t stock by NASA-Lewis Research Center. T e s t specimen blanks ware cast by Howmet Corporation-Misco Division. Testing was performed on the material in the as-cast condition.
Chemical composition (supplied by NASA-Lewis Research Center) on this heat of material is as follows:
Carbon Manganese Silicon Chromium Cobalt Tunga ten A luminum Titanium Z i r c onium Boron Iron Columbium Vanadium N i c ke 1
0.15 <o. 02
0.080 9.20
10.25 12.55 5.05 2.13 0.048 0.017 0.36 0.96
co. 01 Balance
Tensi le resul ts are presented as Table XXXI with samples of the load-strain curves compiled as F igure 82.
Poisson ' s Ratio values a r e as listed below:
Specimen Average Value Number Poisson ' s Ratio
16-PI -0.2843
16-P2 -0.3107
16-P3 -0.3167
Confidence Limits - 9 0% 9 570
t. 0053 - t. 0044 - t. 0042 - - t. 0035
t. 0072 - t. 0060 -
-146-

TEST RESULTS (continued)
Mater ia l lb: Mar-M2OO (continued)
Creep rupture data are presented in Table XXXII. v e r s u s time values are plotted in F igures 83, 84, and 85. plota of the rupture life data appear as Figure 86.
Creep deformation Isothermal
An analysis of the c reep ruptare data usilig paramet r ic plots of the data i n conjunction with the ieo the imal plot yields the following values of the rupture strengths to produce 100, 300, and 1000 hour life data a t the appropriate t e a t temperature 8 .
Stress to Produce F A l u r e at Temp. 100 hour 300 hour 1000 hour
"C "F MN/m2 - ksi MN/m2 - ks i MN/m2 ksi 871 1600 400.0 58.0 344.7 50.0 296.5 43.0
927 1700 262.0 38.0 217.2 31.5 175.8 25.5
982 1800 165.5 24.0 137.9 20.0 110.3 16.0
- -
- 147-

- 148-

. -1
-
0
0
0
$3 U
0
0
0
0
d
d
?mu/
NM ‘SS3U
;LS
I I
I I
I I
I I
I I 0
I 0
0
0, 9
-r fu
0
0
0
00
0
0
00 9
dN
0
.. r(
U
m
4
tu c(
?S
7 ‘SS3N.L
S
- 14
9-
Fig
ure 8
2

.I
m
m
9)
&
m
U
Y
Id k
5
0
-d
9)
E 0
&
Q) z
W
Id &
0
s! M
I 2 f4 0
0
9
h
9)
Id
A
U
E .d
SI
O
Ot-N
d
bN
crd
I
0000 I
0000
.... d
~I
c)
pc
Oo
a
m(
Uo
0
00
00
0
00000
.....
00000
F cr) m
1.4
r
r)
m(
YN
(U
.....
0 0
IC
0
0
Q) d
N
oo m
- 150-

i
9
Ln
bl
rr) tu
c(
0
Fig
ure 8
3
0
0
* 0 0 9
0
0
Ln
c)
0
* 0 0
rr)
0
0
N
3
0
CI
0
3 0
z -
- 151 -

1 9
I I
I In
dr
m
I N
0
0 0
r(
0
0
m
0 0
00
0 0
IC
e.
0
$2
E
“3
3
Y
0 0
G 0
0
Cr
0 0
m
0 0
nl
0
0
r(
0
0
Figu
re 84
-15
2-

-1
'
- 7- - -I---- -1' -
-1
0 0
d
0
0
m 0
0
N
0
0
c1
0
9
In
d
rn N
- 0
("16) N
OIL
V!3N
0?3 d33X3
Fig
ure c:G
-153-
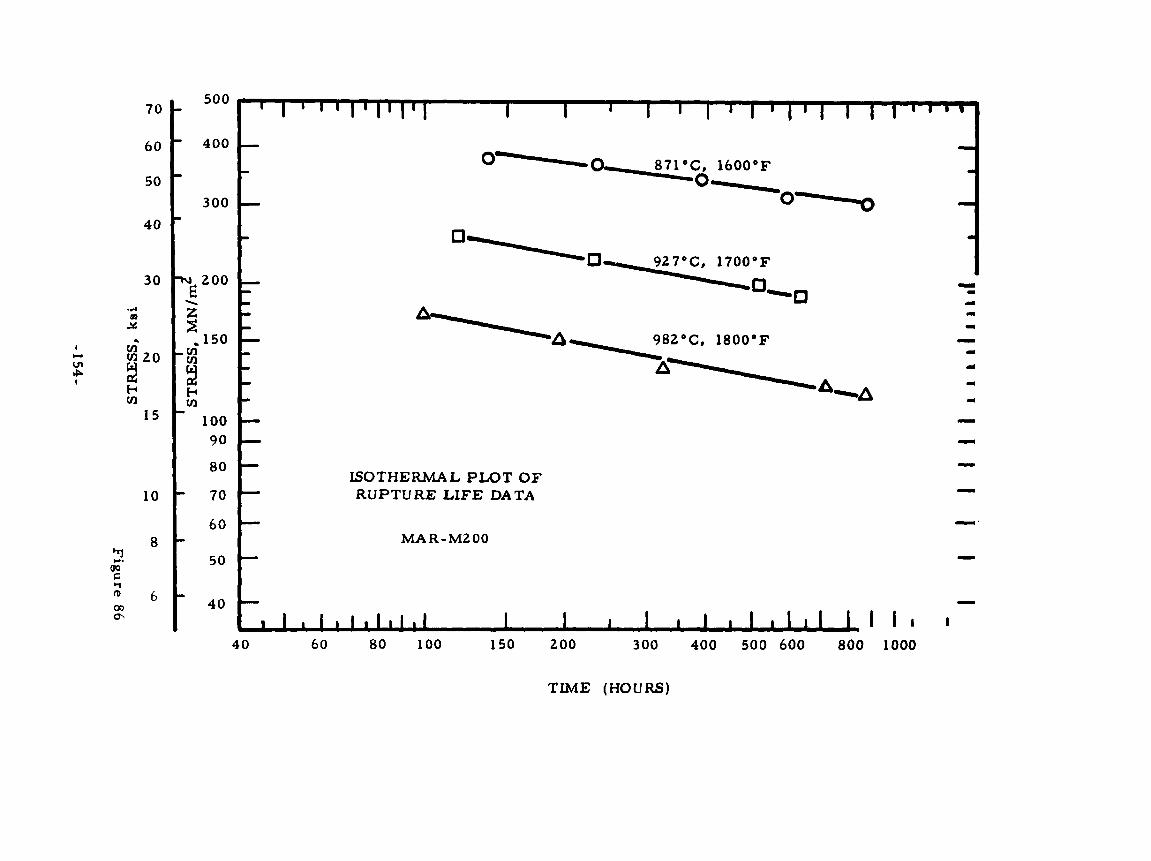
II
I~
I
I
a 1 a
-0
0
-
0
c(
-
00
00
0 0
0
06
\O
ob
g
VI e
4
0
0
0
VI (\1
4
0
0
0
0
0
0
u)
cr rn
U/N
Y\I ‘SS=.M
LS
I I
I I
I I
I I
00
0 0
0
0
VI 0
co 9
?*Y ‘S
Srn
LS
e
cc) h)
U
4
Figu
re 86
- 154-

TEST RESULTS (continued)
Material 17: Mar-M302
This cobalt base alloy, having good oxidation and thermal shock resistance, was supplied as cast r e m e l t stock by NASA-Lewis Resea rch Center. Howmet Corporation-Misco Division. All testing was performed on the material in the as-cast condition.
It was subsequently cast into specimens by the
Chemical composition (supplied by NASA-Lewis Research Center) f o r this heat of material is as follows:
Carbon Manganese Silicon Chromium Nickel Mo lybdenum Tungs ten 2 i rconium Boron Tantalum Iron Cobalt
0.88 <o. 10
0.22 21.9
0.49 < 0.1
9.89 0.24
<o. 01 8.80 1.11 Balance
Tensi le resu l t s a re presented as Table XXXIII with samples of t h e load-strain curves compiled as Figure 87.
Poisson ' s Ratio values are as listed below:
Specimen Average Value Confidence Limits Number Poisson 's Ratio 90% 9 5%
17-P1 - 0.300 1 - t. 0020 t. 0024
17-P2
17-P3
-0.2906 t. 0044 - t. 0037 - +. 006 1 - t. 0051 - -0.2907
- 1 5 5 -

TEST RESULTS (continued)
Creep rupture data are presented i n Table XXXIV. versus time values are plotted in F igures 88, 89, and 90. Isothermal plots of the rupture life data appear as Figure 91.
Creep deformation
An analysis of the c r e e p rupture data using parametr ic pLots of the data in conjunction with the i so thermal plot yields the following values of the rupture strengths to produce 100, 300, and 1000 hour life data at the appropriate test temperatures.
Stress to Produce Fa i lure at
MN/m2 k s i MN/m2 ksi MN/m2 ks i Temp. 100 hour 300 hour 1000 hour
- - - "C "F -- 850 1562 217.2 31.5 186.2 27.0 155.1 22.5
925 1697 144.8 21.0 120.7 17.5 98.6 14.3
1000 1832 79.3 11.5 65.5 9.5 51.7 7.5
-156-

m*
m a-00
00
-0
0 *e2
N-m 4-0 0-0 00
000 000 000 000
..
. ... .
..
...
..
.
..
. .
..
0
-
- gL+J
NO
F 4
44
N
mI
'
mm
o
om
co
m
Ln
m
NN
6 M
Nr
n
0
a"l I-
ci F
I
- 157-
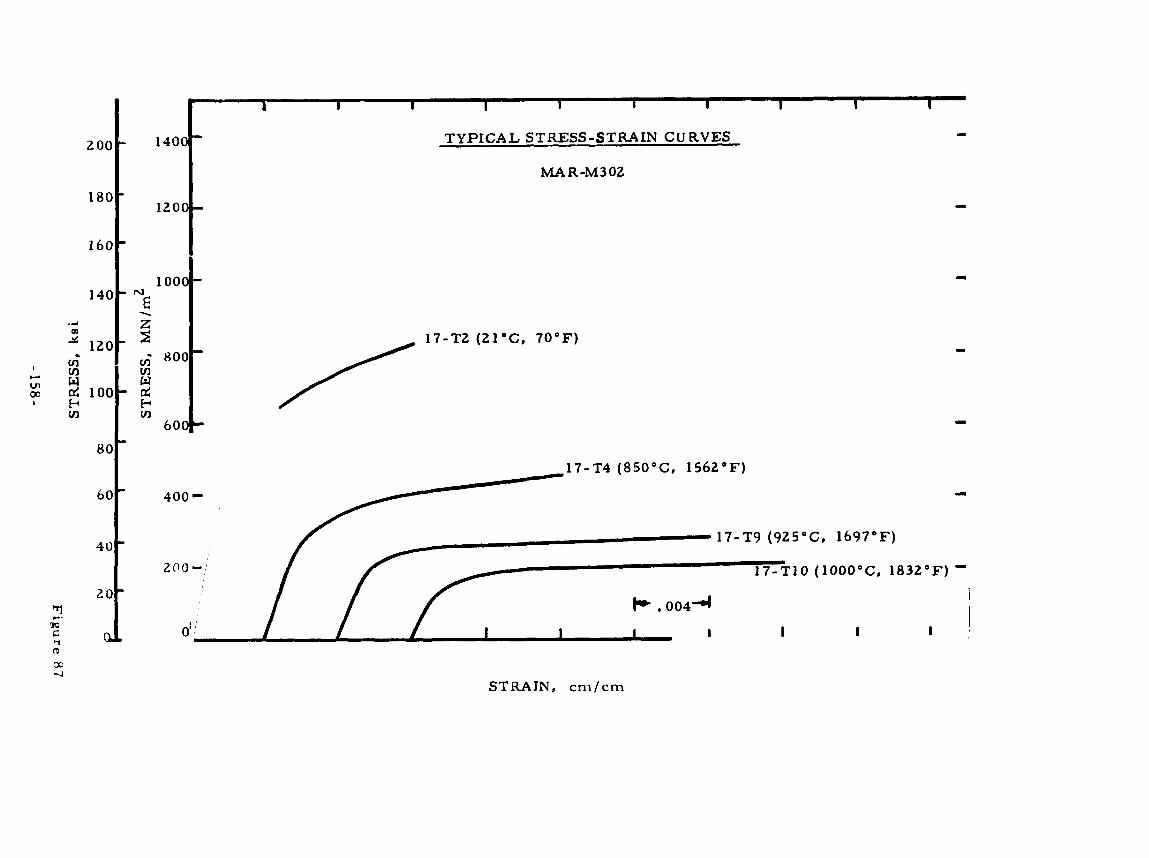
I I
N
0
m 3 rr:
I
crc 0
0
I-
u’ r(
N
r+ I I-
r(
I
- r4 0
N
9
m
d
u’ 0
In
00
d
v
t-c I I- d
I
CI
r4 0
I- rF
9
r(
u‘ m
N
rF
Y
I-
d
I
E E L) --. L) . 5 P v1
I 1
I I
0
0
0
0
--0
I 0
0
0
0
C
0
*)
9
d
N
-b
0
0
N
d
9
w
d W
/NR
‘SS3X.LS
z 1
1 I
I I
I I
I I
I 0
0
0
0
0
0
0
0
3
0
d 0
cn N
0
N
?B
Y ‘SS323L
S F
igu
re 8
7
- 15
8-

00 Q
\9
b.
.
Uim
oa
m
d
I*. o
pc
m
0
E
- ,
PO
0
5
-m
No
9m
m
mm99 -
4-0
10
:do00 1
0
.... m
mm
N
lc
N0
0
0000
... .... o
ulln
oln
O
bl
cl
nN
m
nl
NN
N
..... o
oo
m
OO
OQ
m
Nd
UU
b.
'.
N 9
m
d
N
m
m
9-4
0
m
00
ln
N 6
0
0 0
- 159-

0
00 9
d
N
0
4 (Oh)
NO
ILV
9N013 d
33?33
Figu
re 88 0
0
0
4
0 0 6
0 0
m
0
0
IC
0 0
0
0
m
0
0
N
0
0
d
0
- 160-

4
cu
' E
>
N
o\
Y
m
U I
r- d
N
r(
d
d
0
co 9
d
4
0 0
0
U
0 0
o\
0
0
co
0 0
f- 02
0
0
0
rcl
0
0
N
0 0
c-(
N
0
Fig
ure
89
-16
1-

I 1
..
1
1 I
cn f
w7
I N
9
0
0
0
r(
0
0
CP 0 0
m
Q
Q
pc
0 0
9
Q 0
v)
0 0
* 0
0
M
0
a
N
0
0
.-(
0
.I
0
Figu
re 90 - 162-

I I
pc
In
(u
B
O I
I I
I I
I I
I I
I I
0
0
0
1 CI
0
30 3
#-I
l-l 0
0 0
r-
a
In
d
c.rl N
3
Y
- 163-

TEST RESULTS (continued)
Mater ia l 18: Renal 80
i h i s nickel-base alloy, developed f r o m high temperature-high s t rength applications was supplied by NASA-Lewis Research Ceuter as cast remelt stock. Specimen blanks were cast by Howmet Corporation-Misco Division. Subsequently, Miscc aLsd heat treated the blanks as follows:
2200°F (vacuum)/2 hours/vacuum cool to 2000"F, gas fan cool 2000°F (vacuum)/4 hours/gas fan cool 1925°F (vacuum)/4 houre/cool to 1200°F in 1 hour - gas fan cool 1550°F (a rgon) / l6 hour s / a i r cool
Cbemical composition (supplied by NASA-Lewis Research Center) f o r this heat of material is as follos
Carbon Manganese Si licon Chromium Molybdenum Iron Titanium A luminr- rn Cobalt Tungs ten Zirconium Boron Nickel
0.17 <o. 02 CO. 05 13.80 4.11 c. 1 3 4.87 2.95 9.73 3.94 C. 043 0.01 5 Ea !anc e
Tensile results are presented as Table XXXV with samples of the load-strain curves compiled as Figure 92.
Poisson 's Ratio values are as Listed below:
Specimen Average Value Confidence Limits Number Pois s on's Ratio -- 90% 9 SYO
IS-P1 -0.3039 - t. 0038 - t. 0046
t. 0062
t. 01 15 - 18-P2 -0.3312 t. 0051
t. 0095 - 18-P3 -0.3195 -
- 164-

TEST RESULTS ( con tinu ed )
Material 18: Rene' 80 (continued)
Creep rupture data are presented i n Table XXXVI. versus time values are plotted in F igures 93, 34, and 95. plots of the rupture life data appear as Figure 96.
Creep deformation Isothermal
An analysis of the c r e e p rupture data using parametr ic plots of the data in conjunction with the isothermal plot yields the folloqing values of the rupture s t rengths to produce 100, 300, and 1000 hour Life data a t the appropriate test temperatures.
Temp. "C " F
850 1562
925 1697
1000 1832
-- -
Stress to Produce Fa i lure at 100 hour 300 hour 1000 hour
MN /m2 ks i MN/m2 - ks i MN/m2 - ksi - 358.5 52.0 313.7 45.5 272.3 39.5
227.5 33.0 186.2 2?. 0 155.1 22.5
127.6 18.5 103.4 15.0 82.7 12.3
- 165-

990.
mom
60s'
N 9
m
c.
3
m
a0
mo
m
mw-
r-r-r- .
..
NN
O
mom
N-
m
In
mv
..
.
m
N
0.
N
m
m
4
0 0
0
r(
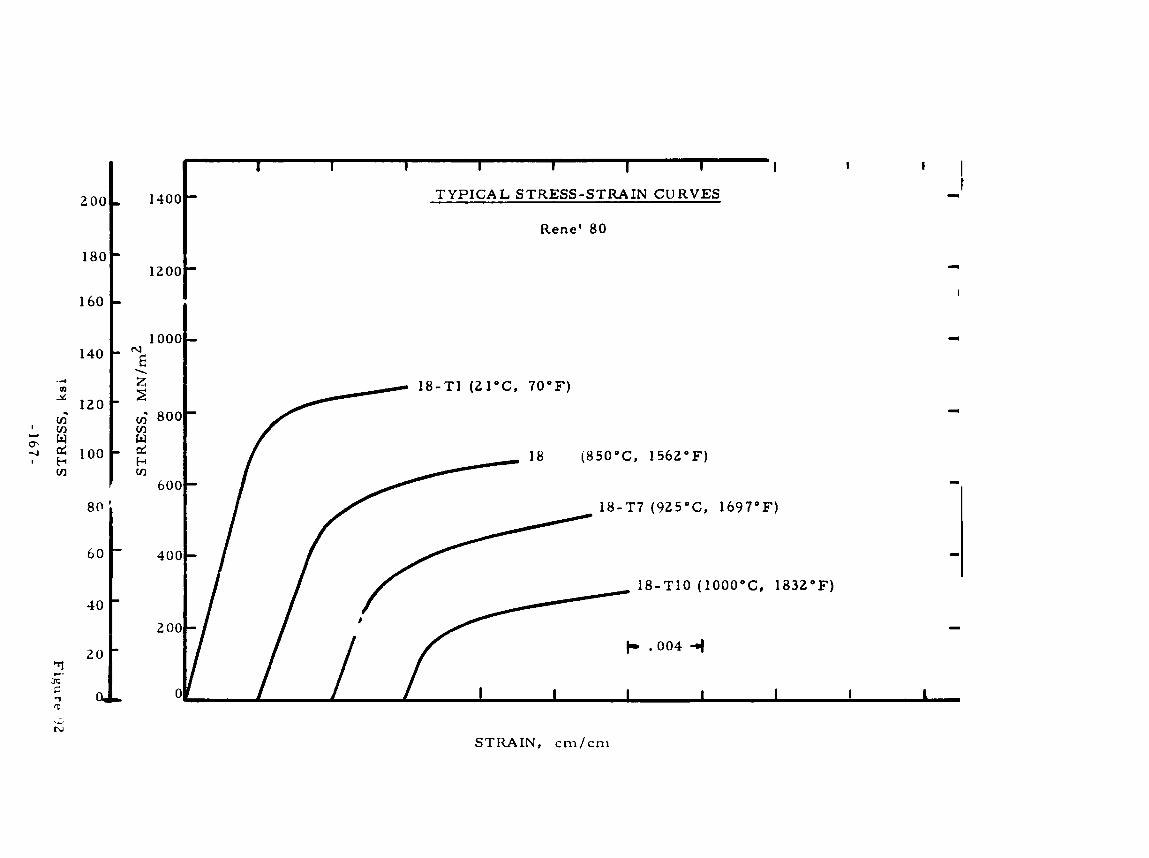
I-
1
-
0
0
0
0
1
N
d
d
c1
I I
n
crc 0
r- OI 9
I-l
n
crc u'
0
nl
In
9
N
In
04 I-l
Y
r- I
d
u" Fc co
0
v)
I
0
0
0
0
0
C 0
0
0
0
0
0
m
9
* N
d
zUJ/N
N 'S
S38L
.S
T'
d 0
0
L.
c
C
U
I 1
I I
I I
1 I
I
0
0
0
0
0
0
G
0
0
0
- N
0
m
9
-r N
I-l
d
m
9
d
0
N
d
L-. d
?SY 'S
SB
XL
S
Fig
ure
\I2
- 167-

1-I
.s .I a 0
U d
i! O
'O
N
OQ
NR
)
9"
OO
O
@O
OO
O
..... O
b9
9
rC
,-
2,0000
0 loo00
.... !u
+
In
ln
Cn
N
94-00
-to
o0
0
.....
.. E
a - L*l
N
9
VI m
p5
CSI 9
c(
N
m
00 m
E Q,
t.c ..I 0
u, to
-16
8-

* 9
Ln
d
vl N
c.
0
(Ohlo) N
OLL V
9N013 d33233
Fig
ure 93
-16
9-
0 0 0
&
0
0 e.
0
0
#
0
0
b
0 0
a
0
0
VI
0
0
‘rf
0
0
m
0
0
ru
0
0
- 0

of
a
m
-9
E
0
\ In
\ N
9
In
w
rr) N
C
I 0
0 0 0
CI
0 0
m
0
0
03
0
0
F
0 0
d
0
0
rn
0
0
nl
0
Fig
ure 94
- 170-

d
4
u I m
4
9
CI
u I
r(
co
\
!Oh) N
OI.L
V9N
013 d33?33
0
0
0
.-.
0
0
0'
0
0
30
0
0
r- 0 o
3
99
w L
F: 0
0
ln
0
0
-P
0
0
m
3
3
3
-17
1-

-
I I
"I I
0
0
0
0
0
0
In
Cr
wl
0
0
0
- 0
0
Q?
0
0
9
0
0
In
0
In
- 0
0
CI
0
30
0
.3
0
3
I I
I I
I I
I I
I I I
0
00
0
0
0
In
0
32 Y
r- a
m *
wl
fu
4
H
!e7 'SS3I3L
S F
igu
re 06
-17
2-