tennessee’s report on healthcare-associated infections
TRANSCRIPT

Tennessee’s Report on Healthcare-Associated Infections:
January 1, 2008 — December 31, 2011
Report Date:
February 2013

2 of 128
EXECUTIVE SUMMARY Since January 2008, hospitals in Tennessee with an average daily census ≥25 have been required to report central
line-associated bloodstream infection (CLABSI) data in adult and pediatric intensive care units (ICUs, also called
“critical care units”), excluding burn and trauma ICUs to the Tennessee Department of Health (TDH). Neonatal
ICUs in Tennessee have been reporting CLABSI data since July 2008. Hospitals began reporting CLABSI data in
burn and trauma ICUs, specialty care areas (SCAs), and long-term acute care (LTAC) facilities in July 2010.
Hospitals collect and report CLABSIs data to TDH via the National Healthcare Safety Network (NHSN), a secure,
Internet-based surveillance system maintained by the Centers for Disease Control and Prevention (CDC).
Hospitals in Tennessee have reported surgical site infections (SSIs) related to coronary artery bypass graft surgery
with both a chest and donor site incision (CBGB) and from coronary artery bypass graft surgery with a chest incision
only (CBGC) since January 2008. Tennessee hospitals also reported SSIs related to hip prosthesis (HPRO)
procedures from July 2010 through December 2011 and SSIs related to cardiac (CARD) procedures during July–
December 2011.
Central Line-Associated Bloodstream Infections (CLABSIs) in Adult and Pediatric ICUs, January–
December 2011:
Excluding burn and trauma ICUs, which became reportable in Tennessee July 2010, the overall CLABSI
standardized infection ratio (SIR) in Tennessee ICUs in 2011 was 28% lower than the national 2006-8 SIR of 1
(SIR=0.72; 95% CI: 0.64, 0.81) (Table 3). Including burn and trauma ICUs, the overall CLABSI standardized
infection ratio (SIR) in Tennessee was 26% lower than the national 2006-8 SIR of 1 (SIR=0.74; 95% CI: 0.67, 0.82)
(Table 4). Viewing the data by year, the overall CLABSI SIR in Tennessee went from being significantly higher
than the national 2006-8 SIR of 1 in 2008 (SIR=1.20; 95% CI: 1.10, 1.31) to being significantly lower than 1 in
2010-11. From baseline to 2011, CLABSI SIRs decreased in all ICU types except non-major teaching medical-
surgical ICUs with ≤15 beds, pediatric medical ICUs, and pediatric surgical cardiothoracic ICUs (Table 5).
In 2011, CLABSI rates were highest in pediatric surgical cardiothoracic ICUs (7.8 infections per 1,000 central line-
days), followed by: burn (6.0), pediatric medical (3.1), trauma (2.7), medical cardiac (1.7), non-major teaching
medical (1.6), major teaching medical-surgical (1.4), non-major teaching medical-surgical with ≤15 beds (1.4),
pediatric medical-surgical (1.4), non-major teaching medical-surgical with >15 beds (1.3), surgical (1.3), major
teaching medical (1.1), surgical cardiothoracic (1.1), neurosurgical (1.0), and neurological (0.7) (Table 6, Figure 3).
Tennessee rates were significantly lower than national rates in major teaching medical ICUs [1.1 vs. 2.6 infections
per 1,000 central line-days; SIR=0.41 (0.23, 0.68)], neurosurgical ICUs [1.0 vs. 2.5 infections per 1,000 central line-
days; SIR=0.39 (0.20, 0.70)], pediatric medical-surgical ICUs [1.4 vs. 3.0 infections per 1,000 central line-days;
SIR=0.46 (0.27, 0.75)], surgical ICUs [1.3 vs. 2.3 infections per 1,000 central line-days; SIR=0.57 (0.39, 0.81)], and
trauma ICUs [2.7 vs. 3.6 infections per 1,000 central line-days; SIR=0.74 (0.53, 0.99)] (Table 6, Figures 3 and 5).
Pediatric surgical cardiothoracic ICUs had a CLABSI rate that was significantly higher than the corresponding
2006–2008 National Healthcare Safety Network (NHSN) baseline rate [7.8 vs. 3.3 infections per 1,000 central line-
days; SIR=2.34 (1.21, 4.09)].
The microorganisms identified in 372 CLABSI events among adult and pediatric ICU patients are listed in Table 2
and Figure 7. The most common pathogens among total positive isolates were coagulase-negative Staphylococcus
species (24.0%), Candida species and other yeasts (23.1%), Enterococcus species (13.0%), and Staphylococcus
aureus (11.8%). Methicillin-resistant S. aureus (MRSA) accounted for 7.5% and vancomycin-resistant
Enterococcus (VRE) for 3.6% of total positive isolates.

3 of 128
Central Line-Associated Bloodstream Infections (CLABSIs) in Neonatal ICUs, January–December 2011:
The overall SIR across all reporting NICUs in Tennessee in 2011was 38% lower than the national SIR of 1
(SIR=0.62; 95% CI: 0.48, 0.79) (Table 9). Viewing the data by year, the overall CLABSI SIR in Tennessee went
from being significantly higher than the national 2006-8 SIR of 1 during July–December 2008 (SIR=1.51; 95% CI:
1.22, 1.85) to being significantly lower than 1 in 2011 (Table 9). From baseline to January–December 2011,
CLABSI SIRs decreased for both level III and level II/III NICUs (Table 10).
During 2011, the overall CLABSI SIR in level III neonatal ICUs in Tennessee was statistically significantly lower
than 1, while the CLABSI SIR in level II/III NICUs was not statistically different from 1 (Table 10). CLABSI rates
in level III and level II/III NICUs were significantly lower than 2006-8 rates in the 1501-2500g birth weight category
(Table 11, Figures 24-25).
The microorganisms identified in 66 CLABSI events among neonatal ICU patients are listed in Table 8 and Figure
29. The most common microorganisms identified in NICU-related CLABSIs were coagulase-negative
Staphylococcus (30.1%), Staphylococcus aureus (26.0%), Candida species and other yeasts (8.2%), and
Enterococcus species (8.2%). Methicillin-resistant S. aureus (MRSA) accounted for 17.8% of organisms identified,
and one vancomycin-resistant Enterococcus (VRE) isolate was identified (1.4%).
Central Line-Associated Bloodstream Infections (CLABSIs) in Specialty Care Areas (SCAs), January–
December 2011:
The overall CLABSI standardized infection ratio (SIR) in Tennessee SCAs in 2011 was 0.85 (95% CI: 0.70, 1.01);
the overall CLABSI SIR in Tennessee SCAs was 0.90 (95% CI: 0.69, 1.14) during July–December 2010. The SIR
was not significantly different from 1 in either time period (Table 14). CLABSI SIRs were significantly lower than 1
among bone marrow transplant (SIR=0.54; 95% CI: 0.35, 0.80) and pediatric hematology/oncology SCAs
(SIR=0.31; 95% CI: 0.14, 0.59) in 2011 (Table 15, Figure 32). Because only one solid organ transplant SCA existed
in Tennessee during the reporting period, data for this SCA type are not shown in this report. Additionally, NHSN
2006-8 baseline data are not available for pediatric bone marrow transplant units.
During 2011, rates of BSIs associated with temporary central lines were highest in hematology/oncology SCAs (2.6
infections per 1,000 central line-days), followed by: bone marrow transplant (1.8), pediatric bone marrow transplant
(0.0), and pediatric hematology/oncology (0.0). The rate of BSIs associated with temporary central lines was
significantly lower than the corresponding national rate in bone marrow transplant SCAs and pediatric
hematology/oncology SCAs (Table 16, Figure 30). Rates of BSIs associated with permanent central lines were
highest in pediatric bone marrow transplant SCAs (2.9 infections per 1,000 central line-days), followed by: bone
marrow transplant (2.5), hematology/oncology (1.3), and pediatric hematology/oncology (0.0). The rate of BSIs
associated with permanent central lines was significantly lower than the corresponding national rate in pediatric
hematology/oncology SCAs (Table 17, Figure 31). No SCA type had a CLABSI rate that was significantly higher
than the corresponding 2006–2008 National Healthcare Safety Network (NHSN) baseline rate.
The microorganisms identified in 124 CLABSI events among SCA patients are listed in Table 13 and Figure 39. The
most common pathogens among total positive isolates were Enterococcus species (18.5%), coagulase-negative
Staphylococcus species (13.3%), Escherichia species (12.6%), and Pseudomonas species (11.9%). Vancomycin-
resistant Enterococcus (VRE) accounted for 11.1% of total positive isolates, and methicillin-resistant Staphylococcus
aureus (MRSA) accounted for 3.0%.

4 of 128
Central Line-Associated Bloodstream Infections (CLABSIs) in Long-Term Acute Care (LTAC) Facilities,
January–December 2011:
The overall CLABSI standardized infection ratio (SIR) in Tennessee LTACs in 2011 was slightly below the national
2006-8 SIR of 1 (SIR=0.91; 95% CI: 0.75, 1.11); the overall CLABSI SIR in Tennessee LTACs was 1.05 (95% CI:
0.79, 1.37) during July–December 2010. The SIR was not significantly different from 1 in either time period (Table
19). Only one type of unit, the LTAC ward, was present among the nine Tennessee LTACs during the reporting
period. Tennessee’s pooled mean CLABSI rate for this unit type in 2011 was 1.6 CLABSIs per 1,000 central line-
days, compared to the national NHSN pooled mean rate of 1.7 CLABSIs per 1,000 central line-days (Table 20).
The microorganisms identified in 103 CLABSI events among LTAC patients are listed in Table 18 and Figure 41.
The most common pathogens among total positive isolates were Enterococcus species (28.4%), coagulase-negative
Staphylococcus species (13.8%), Staphylococcus aureus (11.2%), and Candida species and other yeasts (9.5%).
Vancomycin-resistant Enterococcus (VRE) accounted for 16.4% of total positive isolates, and methicillin-resistant S.
aureus (MRSA) accounted for 10.3%.
Surgical Site Infections (SSIs) Related to Coronary Artery Bypass Graft (CBGB/C) and Hip Prosthesis
(HPRO) procedures, January–December 2011:
The combined All SSI SIR for CBGB/C and HPRO procedures in Tennessee in July-December 2011was statistically
significantly lower than the national SIR of 1 (SIR=0.76; 95% CI: 0.63, 0.91). The Complex A/R SIR for SSIs
related to CBGB/C and HPRO procedures in Tennessee was not statistically significantly different from 1
(SIR=0.89; 95% CI: 0.70, 1.10) (Table 21).
Surgical Site Infections (SSIs) Related to Coronary Artery Bypass Graft Surgery with Both a Chest and
Donor Site Incision (CBGB) and Coronary Artery Bypass Graft Surgery with a Chest Incision Only
(CBGC), January–December 2011:
The All SSI SIR for CBGB/C procedures in Tennessee in 2011 was statistically significantly lower than the national
SIR of 1 (SIR=0.75; 95% CI: 0.623, 0.90). The Complex A/R SSI SIR was not statistically significantly different
than the national SIR of 1 (SIR=0.92; 95% CI: 0.73, 1.150) (Table 23). The most common pathogens among the 128
total positive isolates were Staphylococcus aureus (36.7%) and coagulase-negative Staphylococcus species (18.0%).
Methicillin-resistant S. aureus (MRSA) accounted for 14.6% of total positive isolates, and vancomycin-resistant
Enterococcus (VRE) accounted for 0.8% (Table 22, Figure 43). Overall, CBGB/C SSIs were most often deep
primary (30.6%) and least often deep secondary infections (2.1%) (Figure 45). SSIs related to CBGB/C procedures
were most often identified upon readmission (71.5%) (Figure 46).
Surgical Site Infections (SSIs) Related to Hip Prosthesis (HPRO) Surgery, January–December 2011:
The All SSI SIR for HPRO procedures in Tennessee in 2011 was statistically significantly lower than the national
SIR of 1 (SIR=0.76; 95% CI: 0.63, 0.90). The Complex A/R SIR was not statistically significantly different from 1
(SIR=0.84; 95% CI: 0.67, 1.03) (Table 28). The most common pathogens among the 134 total positive isolates were
Staphylococcus aureus (52.2%) and Enterococcus species (9.7%). Methicillin-resistant S. aureus (MRSA) accounted
for 29.1% of total positive isolates, and vancomycin-resistant Enterococcus (VRE) accounted for 2.4% (Figure 47,
Table 27). SSIs related to HPRO procedures were most commonly deep primary infections (46.5%) (Figure 49).
SSIs related to HPRO procedures were most often identified upon readmission (4.2%) (Figure 50).

5 of 128
Surgical Site Infections (SSIs) Related to Cardiac (CARD) Surgery, July–December 2011:
The All SSI SIR for CARD procedures in Tennessee in October–December 2011 was not statistically significantly
different from the national SIR of 1 (SIR=0.71; 95% CI: 0.26, 1.55), and was higher than the SIR for July-September
2011 (SIR=0.58; 95% CI: 0.19, 1.36). The Complex A/R SIR for October-December 2011 was not statistically
significantly different from 1 (SIR=0.40; 95% CI: 0.05, 1.43) and was the same as that for July-September 2011
(Table 31). The most common pathogens among the nine total positive isolates were Staphylococcus aureus,
comprising two (22.2%) isolates in July-December 2011. Of these, one was methicillin-resistant S. aureus (MRSA)
(Table 30). SSIs related to CARD procedures were either superficial primary (63.6%) or organ/space (36.4%)
(Figure 51). SSIs related to CARD procedures were most often identified during admission (81.3%) (Figure 52).

6 of 128
BACKGROUND Healthcare-associated infections (HAIs) are a major public health problem. According to the Centers for Disease
Control and Prevention (CDC), there were an estimated 1.7 million HAIs and 99,000 HAI-related deaths in the
United States in 2002, making HAIs one of the top ten leading causes of death (Klevens et al, 2007, Public Health
Reports). A 2009 CDC report estimated that the annual medical costs (adjusted to 2007 dollars) of HAIs to U.S.
hospitals to be between $35.7 billion and $45 billion (Scott, 2009, available at:
http://www.cdc.gov/ncidod/dhqp/pdf/Scott_CostPaper.pdf), though these monetary costs do not measure the effects
of HAIs on patients or their family members, friends, and colleagues. The emotional, physical, and personal costs
associated with HAIs are not quantifiable.
In December 2006, the Tennessee Legislature passed Senate Bill 2978 and the Governor signed the Public Acts,
Public Chapter 904 (PC904) requiring hospitals to report selected HAIs to the Tennessee Department of Health
(TDH). The legislation required use of CDC’s National Healthcare Safety Network (NHSN) for reporting, making
Tennessee the fifth state to use this system. Currently, 30 states require HAI reporting via NHSN, which has become
the standard system for HAI reporting. Additionally, as of January 2011, the Centers for Medicare and Medicaid
Services (CMS) require hospitals in the Hospital Inpatient Quality Reporting Program to report CLABSIs in
intensive care units (ICUs) to NHSN.
The following report summarizes the TDH central line-associated bloodstream infection (CLABSI) and surgical site
infection (SSI) reporting activities from January 2008 through December 2011. This report provides CLABSI
standardized infection ratios (SIRs) and rates by individual hospital, ICU type, and state aggregate. The 2011
CLABSI SIRs are compared to Tennessee data from 2008-2010 and to national NHSN baseline data from 2006-
2008. SSI data are provided by state aggregate only and are compared to national NHSN baseline data from 2006-
2008.

7 of 128
DEFINITIONS Unless a reader works in the healthcare field or understands statistics, he/she may not be familiar with some of the
words or labels mentioned in the Tennessee HAI Report. On this page, we attempt to explain what some of these
terms mean. A reader does not need to know all of the terms in order to understand the reports.
All Surgical Site Infection Standardized Infection Ratio (All SSI SIR): (See Standardized Infection Ratio.) A
standardized infection ratio calculated by NHSN for surgical site infections, which includes all inpatient and
outpatient procedures and all primary SSIs identified during admission, readmission, or post-discharge surveillance,
as defined in the NHSN Patient Safety Component Manual.
ASA Score: Assessment by the anesthesiologist of the patient’s preoperative physical condition using the American
Society of Anesthesiologists’ (ASA) Classification of Physical Status. Patient is assigned one of the following which
is used as one element of the SSI Basic Risk index:
1 -- Normally healthy patient
2 -- Patient with mild systemic disease
3 -- Patient with severe systemic disease that is not incapacitating
4 -- Patient with an incapacitating systemic disease that is a constant threat to life
5 -- Moribund patient who is not expected to survive for 24 hours with or without the operation
Cardiac surgery (CARD): Procedure performed on the heart, including valves or septum; does not include
coronary artery bypass graft, surgery on vessels, heart transplantation, or pacemaker implantation.
Central line: A flexible tube that is inserted in a patient’s blood vessel and terminates at or close to the heart or in
one of the large vessels near the heart. A central line (or an umbilical line for newborns) can be used to give fluids,
antibiotics, medical treatments such as chemotherapy, and/or liquid food. If a central line is inserted incorrectly or
not cared for properly, it can lead to dangerous bloodstream infections (see Patient Guide to CLABSI [PDF]).
Central lines are also sometimes called central venous lines or central venous catheters.
In specialty care areas, rates are calculated separately for permanent and temporary central lines. According to
NHSN, permanent central lines include tunneled catheters (including certain dialysis catheters) and implanted
catheters (including ports). Temporary central lines are non-tunneled catheters.
Central line-associated bloodstream infection (CLABSI): When a patient develops a bloodstream infection while
having a central line in place or within 48 hours of central line removal, the infection is considered a CLABSI.
Central line-days: This is the total number of days a central line is in place for patients in a particular unit. The
count is performed at the same time each day. Each patient with one or more central lines at the time the count is
performed is counted as one central line day. In specialty care areas, central line-days are collected separately for
permanent and temporary central lines (see “Central line” definition). If a patient has both a permanent and a
temporary central line, the day is recorded as a temporary central line-day.
Example: 5 patients on the first day of the month had one or more central lines in place. Similarly, 5 patients on day
two, 2 patients on day three, 5 patients on day four, 3 patients on day five, 4 patients on day six, and 4 patients on
day seven had central lines in place. Adding the number of patients with central lines on days one through seven, we
would have 5 + 5 + 2 + 5 + 3 + 4 + 4 = 28 central line-days for the first week. The number of central line-days for
the month is the sum of the daily counts.
CLABSI infection rate: This rate is the total number of central line-associated bloodstream infections divided by
the number of central line-days, multiplied by 1,000.

8 of 128
Central line utilization ratio (also called the “device utilization (DU) ratio”): This ratio is the number of central
line-days divided by the number of patient-days.
Complex Admission/Readmission Standardized Infection Ratio (Complex A/R SIR): (See Standardized
Infection Ratio.) A standardized infection ratio calculated by NHSN for surgical site infections, which only includes
inpatient procedures and deep incisional primary and organ/space SSIs identified during admission or readmission to
the reporting facility, as defined in the NHSN Patient Safety Component Manual.
Confidence intervals: Confidence intervals tell us about the reliability of a point estimate, such as a standardized
infection ratio or infection rate. If TDH mentions a confidence interval of 95%, it means that the TDH is
95%confident that the hospital’s precise infection rate (the point estimate) falls within the range given. In this report,
the confidence interval is based on the number of infections observed and the number of central line-days
accumulated during the specified time period.
If two hospitals have different infection rates, but the confidence intervals for the two rates overlap, then it is
reasonably possible that the true rates are the same (see Discussion of Confidence Intervals [PDF]).
Coronary Artery Bypass Graft (CBGB/C): Coronary artery bypass graft with both chest and donor site incisions
(CBGB): Chest procedure to perform direct revascularization of the heart; includes obtaining suitable vein from
donor site for grafting.
Coronary artery bypasses graft with chest incision only (CBGC): Chest procedure to perform direct vascularization
of the heart using, for example, the internal mammary (thoracic) artery.
Deep incisional SSI: A surgical site infection that involves the deep soft tissues (e.g., fascial and muscle layers) of
the incision and meets the NHSN criteria for a deep incisional SSI as described in the NHSN Patient Safety Manual.
A deep incisional SSI can be either 1) primary – identified in the primary incision in a patient that had an operation
with one or more incisions (e.g., chest incision in a CBGB) or 2) secondary – identified in the secondary incision in
a patient that had an operation with more than one incision (e.g., donor site (leg) incision in a CBGB).
Healthcare-associated infection (HAI): For an infection to be considered healthcare-associated, there must be no
evidence that the infection was present or incubating at the time of hospital admission. A HAI may be confined to
one area of the body (localized) or be spread throughout (systemic). It is the body's adverse reaction to the presence
of an infectious agent(s) or its toxin(s).
Hip prosthesis (HPRO): In HPRO surgery (also called a “hip arthroplasty”), all or part of a diseased hip joint is
removed and replaced with an artificial joint.
Infection control/prevention processes: These are routine measures that can be used in all healthcare settings to
prevent infections. These steps or principles can be expanded to meet the needs of specialized types of hospitals.
Examples include:
Diligent hand cleaning
Use of personal protective equipment such as gloves, gowns, and/or masks when caring for patients in select
situations to prevent the spread of infections
Use of an infection prevention checklist when inserting central lines.The list reminds healthcare workers to
clean their hands thoroughly; clean the patient’s skin with the appropriate type of disinfectant before
insertion; wear the recommended sterile gown, gloves and mask; and place sterile barriers around the
insertion site.
Monitoring staff to ensure that they are following proper infection prevention procedures
Infection preventionists (IPs): Health professionals with special training in infection prevention and monitoring.

9 of 128
Intensive care unit (ICU) (also called a “critical care unit”): ICUs are hospital units that provide intensive
observation and treatment for patients either dealing with, or at risk of developing, life-threatening problems.
Smaller hospitals typically care for both medical and surgical patients in a combined medical-surgical ICU. Larger
hospitals often have separate ICUs for medical patients and surgical patients.
Long-Term Acute Care (LTAC) Facility: LTACs provide evaluation, treatment, and management of patients
suffering medically complex conditions, or who have suffered recent catastrophic illness or injury, and require and
extended stay in an acute care environment.
National Healthcare Safety Network (NHSN): This is the online system that Tennessee hospitals must use to
report HAI data to the Tennessee Department of Health. NHSN is a secure, internet-based surveillance (monitoring
and reporting) system. Among other features, the network offers integrated patient and healthcare worker safety
surveillance systems. NHSN is managed by CDC’s Division of Healthcare Quality Promotion. In NHSN, hospitals
submit information that is needed to calculate HAI rates and standardized infection ratios (SIRs). Hospitals must
confer rights to TDH in order for TDH to collect data from NHSN and report the information to the public.
NHSN Patient Safety Component Manual: This manual contains standardized surveillance definitions and data
collection methods that are essential for fair reporting of HAIs (NHSN PSC Manual).
NHSN operative procedure: A procedure that:
1) Is performed on a patient who is an NHSN inpatient or an NHSN outpatient
2) Takes place during an operation where a surgeon makes at least one incision through the skin or mucous
membrane, including laparoscopic approach, and closes the incision before the patient leaves the
operating room, and
3) That is included in Table 1, Chapter 9 of the NHSN Patient Safety Manual.
Operation: A single trip to the operating room (OR) where a surgeon makes at least one incision through the skin
or mucous membrane, including laparoscopic approach, and closes the incision before the patient leaves the OR.
Organ/space SSI: A surgical site infection that involves any part of the body, excluding the skin incision, fascia, or
muscle layers, that is opened or manipulated during the operative procedure (e.g., osteomyelitis).
Specialty care area (SCA): SCAs are hospital units dedicated to management and treatment of patients with
special conditions, such as bone marrow transplant, solid organ transplant, hematology/oncology, and inpatient
dialysis units.
Standardized infection ratio (SIR): The SIR is a summary measure used to compare infection data from one
population to data from a “standard” population. For HAI reports, the standard population comes from data reported
from U.S. hospitals that report to NHSN. The SIR is calculated by dividing the observed number of infections by
the predicted (or statistically expected) number of infections, which is calculated using data from the standard
population.
Standardized infection ratio (SIR) methodology: A SIR is the number of observed infections divided by the
number of predicted infections.
A SIR of 1.0 means the observed number of infections is equal to the number of predicted infections.
A SIR above 1.0 means that the infection rate is higher than that found in the “standard” population. For
HAI reports, the standard population comes from data reported by U.S. hospitals that report to NHSN. The
difference above 1.0 is the percentage by which the infection rate exceeds that of the standard population.
A SIR below 1.0 means that the infection rate is lower than that of the standard population. The difference
below 1.0 is the percentage by which the infection rate is lower than that experienced by the standard
population.
10 of 128
For CLABSIs, indirect standardization accounts for differences in the risk of CLABSIs among patient populations in
different ICU types. In neonatal ICUs, the SIR accounts for risk differences among different unit type/birth weight
categories; in specialty care areas, the SIR accounts for risk differences among different unit type/central line type
categories. The predicted number of CLABSIs is calculated by multiplying the facility’s number of central line-days
for each stratum of data (i.e., unit type for adult/pediatric ICUs or unit type/birth weight/line type category for
NICUs) by the NHSN pooled mean CLABSI rate (per 1,000 line-days) for that stratum.
For SSIs, logistic regression models are used to account for procedure- and patient-specific risk factors, which
include factors such as patient age, gender, and procedure duration. With this method, each risk factor’s contribution
varies according to its association with risk of SSI for a given operative procedure, and this is reflected in each
model’s parameter estimates. The predicted number of SSIs is determined by calculating each patient’s risk of SSI
with the regression model, then summing across patients to give the expected number of infections in the population.
Superficial incisional SSI: A surgical site infection that involves only skin and soft tissue layers of the incision and
meets the NHSN criteria for a superficial incisional SSI as described in the NHSN Patient Safety Manual. A
incisional SSI can be either 1) primary – identified in the primary incision in a patient that had an operation with one
or more incisions (e.g., chest incision in a CBGB) or 2) secondary – identified in the secondary incision in a patient
that had an operation with more than one incision (e.g., donor site (leg) incision in a CBGB).
Surgical Site Infection (SSI): An infection found after an operation in the part of the body where the surgery was
performed.
Surveillance: The process of finding and documenting infections.
Active surveillance: This includes, but is not limited to, active, patient-based, prospective surveillance by a
trained infection preventionist (IP). The IP seeks out infections during a patient’s stay by screening a variety
of data sources. The sources may include patient charts and laboratory, pharmacy, radiology/imaging,
admission/discharge/transfer, and pathology databases. The complete definition of surveillance, including
how to capture denominator data to calculate infection rates, is found in each module of the NHSN Patient
Safety Component Manual (see above).
Post-discharge surveillance: This is the process IPs use to seek out infections after patients have been
discharged from the hospital. Post-discharge surveillance includes screening data sources such as re-
admission and emergency department visit records.
Validation: Validation is the process of making sure that HAI data reported to NHSN are complete and accurate.
The purposes of validation are to:
Assess the accuracy and quality of data submitted to NHSN
Provide hospitals with information to help them correctly use the NHSN application
Provide education to IPs and other hospital staff to improve data accuracy and quality, if necessary
Teach IPs how to confirm the accuracy of written or electronic data they receive from hospital departments
Look for unreported HAIs
Assess selected infection control processes
Make recommendations for improvements if data accuracy and/or quality issues are discovered

11 of 128
Key Abbreviations Found in the HAI Public Report
A/R – admission/readmission
ASA – American Society of Anesthesiologists
CARD – cardiac surgery
CBGB – coronary artery bypass graft surgery: both chest and donor site incisions
CBGC – coronary artery bypass graft surgery: chest incision only
CCU – critical care unit (used interchangeably with intensive care unit (ICU))
CDC – Centers for Disease Control and Prevention
CI – confidence interval
CL days- central line-days
CLABSI – central line-associated bloodstream infection
CMS – Centers for Medicare and Medicaid Services
DIP – deep incisional primary SSI
DIS – deep incisional secondary SSI
DU ratio – device utilization ratio
HAI – healthcare-associated infection
HPRO – hip prosthesis procedure
IP – infection preventionist
ICU – intensive care unit (use interchangeably with critical care unit (CCU))
LTAC – long-term acute care
MRSA – methicillin-resistant Staphylococcus aureus
NHSN – National Healthcare Safety Network
NICU – neonatal intensive care unit
No. – number
OR – operating room
SCA – specialty care area
SIP – superficial incisional primary SSI
SIR – standardized infection ratio
SIS – superficial incisional secondary SSI
SSI – surgical site infection
TDH – Tennessee Department of Health
TN – Tennessee
VRE – vancomycin-resistant Enterococcus

12 of 128
METHODS
CLABSI Reporting for 2008-2011
A central line is a tube that is placed into a patient’s large vein, usually in the neck, chest, arm, or groin. The line is
used to give fluids and medication, withdraw blood, and/or monitor the patient’s condition. A bloodstream infection
can occur when microorganisms (e.g., bacteria, fungi) are introduced, attach, and multiply on the tubing or in fluid
administered through the tubing, and then enter the blood.
The Tennessee Department of Health (TDH) and CMS require central line-associated bloodstream infections in
intensive care units to be reported to NHSN; TDH also requires CLABSIs in long-term acute care facilities and
CLABSIs in SCAs (through 2011) to be reported to NHSN.
SSI Reporting for 2008-2011
Surgical site infections (SSIs) are infections found after an operation in the part of the body where the surgery was
performed. The majority of SSIs involve only the skin surrounding the incision site; however, others may be deeper
and more serious. TDH requires reporting of SSIs associated with coronary artery bypass graft surgery, including
coronary artery bypass graft surgery with both chest and donor site incisions (CBGB) and coronary artery bypass
graft surgery with chest incision only (CBGC); TDH also requires reporting of SSIs associated with hip prosthesis
(HPRO) procedures through 2011 and SSIs associated with cardiac procedures (CARD) during July–December
2011.
CBGB/C surgery is a procedure performed for heart disease in which a vein or artery from the chest or another part
of the body is used to create an alternate path for blood to flow to the heart, bypassing a blocked artery. In HPRO
surgery, all or part of a diseased hip joint is removed and replaced with an artificial joint. CARD procedures are
performed on the heart, including valves or septum and excluding coronary artery bypass graft, surgery on vessels,
heart transplantation, or pacemaker implantation. All facilities performing CBGB, CBGC, HPRO, and/or CARD
procedures were required to report to NHSN.
Training of Infection Preventionists at Healthcare Facilities
Hospitals are required to review the NHSN patient safety protocol, archived webinars, and other training materials
from CDC as per CDC/NHSN instructions. TDH also held nine NHSN training webinars during 2011. These
sessions included didactic lectures on NHSN enrollment and definitions, with question-and-answer sessions and
case-studies. Facilities continue to participate in monthly NHSN conference calls during which definitions and
protocols are clarified and case scenarios are discussed.
Timeliness, Completeness and Accuracy of Reporting
TDH staff monitored the timeliness, completeness, and accuracy of hospital reports. In each Tennessee state HAI
report, facilities with missing data during the reporting period are displayed in Table 1. No facilities were missing
data during the current reporting period.
Table 1: Facilities with Incomplete Central Line-Associated Bloodstream Infection (CLABSI) Data for
the Reporting Period January–December 2011
Facility
Missing Data
Reason for Missing Data From To
None N/A N/A N/A

13 of 128
Data Validation Data reported to NHSN are validated using several methods:
Point-of-entry checks – NHSN is a web-based data reporting and submission program that includes validation
routines for many data elements, thus reducing common data entry errors. Hospitals can view, edit, and analyze
their data at any time.
Monthly checks for internal consistency – Each month, TDH staff download CLABSI data from NHSN and verify
completeness with a computerized data validation program. Data that are missing, unusual, inconsistent, or
duplicative are identified and investigated through email or telephone communication with hospital staff. Hospitals
are given the opportunity to verify and/or correct the data. This process has not yet been implemented for SSI data.
On-site CLABSI audits – Audits of a sample of medical records were conducted by TDH to assess compliance with
reporting requirements. Onsite visits were conducted by HAI program staff in 14 reporting hospitals in 2009 and in
30 hospitals in 2010-11. These visits consist of reviewing medical charts from adult, pediatric, and neonatal ICUs.
The purposes of the audits were to:
Enhance reliability and consistency in applying NHSN surveillance definitions
Evaluate the adequacy of surveillance methods to detect infections
Evaluate intervention strategies designed to reduce or eliminate specific infections
Discuss identified inconsistencies and allow hospitals to modify records as needed
Ongoing monitoring, education, and trainings are provided to ensure integrity of the data. Some facilities also
conduct their own validation studies.
Thresholds for Reporting Hospital-Specific Infection Rates In Tennessee, only hospitals with an average daily census of at least 25 inpatients were required to report CLABSIs
in ICUs since 2008; however, as of January 2011, CMS requires all facilities with ICUs to report CLABSIs. Several
facilities with an average daily census <25 have opted for their ICU data to be included in this state report. Hospital
ICUs with very few patients with central lines will have infection rates that may fluctuate greatly over time. Even a
few infections will yield a numerically high rate when the denominator of central lines is small. To ensure a fair and
representative set of data, TDH adopted the NHSN minimum thresholds for reporting. The minimum thresholds are:
For CLABSI rates, there must be a minimum of 50 central line-days during the reporting period. Central
line-days are the total number of days that central lines are used for patients in an ICU over a given
period of time.
For the calculation of a facility-wide standardized infection ratio (SIR), there must be a minimum of 50
central line-days in all ICUs combined during the reporting period.
CMS does not publish SIRs for facilities for which the predicted number of CLABSIs is <1.0. In this
report, SIRs for facilities with a predicted number of CLABSIs <1.0 and SIRs for facilities with a
predicted number ≥1.0 are shown in separate figures.
CLABSI SIR key percentiles are not reported for locations with fewer than five facilities reporting (e.g.,
major teaching medical ICUs, bone marrow transplant SCAs).
Risk Adjustment
Risk adjustment is a statistical technique that allows hospitals to be more fairly compared by accounting for
differences in patient populations in terms of severity of illness and other factors that may affect the risk of
developing a HAI. A hospital that performs a large number of complex procedures on very sick patients would be
14 of 128
expected to have a higher infection rate than a hospital that performs more routine procedures on healthier patients.
Therefore, before comparing the infection rates of hospitals, it is important to adjust for the number and proportion
of high- and low-risk patients. Different risk adjustment methods are used for different types of HAIs.
For adult and pediatric ICU and LTAC patients with central lines, risk adjustment is limited to the type of hospital
location; hospital type and unit bed size are used to categorize ICUs in some instances. Additional information is
used for risk adjustment in other locations, including birth weight category (≤750 g, 751-1000 g, 1001-1500 g, 1501-
2500 g, >2500 g) in NICUs and line type (permanent or temporary) in SCAs.
For individuals undergoing surgical procedures, risk adjustment is calculated through logistic regression models
which use NHSN baseline data to represent a standard population1. With this method, risk factors are procedure-
specific and each risk factor’s contribution varies according to its association with risk of SSI.
For CBGB/C procedures, significant risk factors include:
Age (≤44 vs >44)
American Society of Anesthesiologists’ physical status score (ASA score) (3/4/5 vs. 1/2)
Procedure duration
Gender
Additionally, risk adjustment for the All SSI SIR (explained in more detail below under “Tennessee State and
National Comparisons – SSI”) includes hospital bed size, and the Complex A/R SIR includes medical school
affiliation, and age-gender interaction.
For HPRO procedures, risk factors include:
Age (≤44 vs >44)
Anesthesia
ASA score (3/4/5 vs. 1/2)
Duration
Total/partial/revision
Hospital bed size
Presence of trauma
Additionally, the Complex A/R SSI includes medical school affiliation as a risk factor.
For CARD procedures, risk factors include:
Age
Duration
Additionally, the All SSI SIR includes ASA score, and the Complex A/R SSI accounts for emergency procedures in
its risk adjustment.
1 Yi M, Edwards JR, et al. Improving risk-adjusted measures of surgical site information for the National Healthcare Safety Network.
Infect Control Hosp Epidemiol 2011; 32(10):970-986.

15 of 128
Tennessee State and National Comparisons - CLABSI
This report displays Tennessee CLABSI data for 2008-11. For comparison, baseline national data were obtained
from the National Healthcare Safety Network (NHSN) report that covered the period of 2006–2008 (available at
http://www.cdc.gov/nhsn/PDFs/dataStat/2009NHSNReport.pdf). The CDC modified definitions as of January 1,
2008 and used the new definitions and methods of analysis for their 2006-2007 report onward. Because CDC
discontinued the use of clinical sepsis (CSEP) CLABSI criteria for NICUs in January 2010, national baseline NICU
data for this report were adjusted by subtracting any CLABSIs meeting the CSEP criteria (see Tables 17-18 of the
NHSN report referenced above). In January 2011, the NHSN CLABSI definition was changed to no longer include
antibiotic resistance profiles to determine whether two common commensal isolates are considered the same
organism. This change could cause an increase in the number of reported CLABSI events associated with common
commensal organisms. Further, in October 2011, CDC clarified that because fever is a non-specific sign and may be
due to more than one infection occurring at the same time, fever must be attributed to multiple causes at once (if
applicable) in order to prevent selective attribution. Hospitals were asked to review cases dating back to January
2011 to ensure consistency with this clarified definition.
CLABSI rates must be stratified by location type to be risk-adjusted. This scientifically sound risk-adjustment
strategy creates a practical challenge to summarizing this information nationally, regionally, or even for an
individual healthcare facility. For instance, when comparing CLABSI rates, there may be a number of different
types of locations for which CLABSI rates could be reported. In neonatal ICUs and SCAs, data are further stratified
by birth weight category and central line type, respectively. This stratification creates the need for a method of
combining CLABSI rate data across different risk strata to facilitate data interpretation and comparisons.
Tennessee rates were compared to national rates using the same statistical tests implemented in NHSN for
comparing hospital rates to national rates within risk categories. CLABSI rates are based on the Poisson distribution.
We used the SIR as a summary measure to compare CLABSI data in adult, pediatric, and neonatal ICUs in
Tennessee to published national (NHSN) data for 2006-8 for each location type. The SIR is identical in concept to a
standardized mortality ratio and is an indirect standardization method for summarizing the HAI experience across
any number of stratified groups of data.
The CLABSI SIR is calculated by dividing the total number of observed CLABSI events by the predicted number
of CLABSIs, using the CLABSI rates from the standard population (in this case, national NHSN 2006-8 data). This
predicted number, which can also be understood as a projection, is calculated by multiplying the national CLABSI
rate from the standard population by the observed number of central line-days (CLD) for each stratum. When the
SIR = 1, the healthcare facility’s units had the same CLABSI rate as the national average (pooled mean) rate. A SIR
> 1 implies the facility experienced more CLABSIs than predicted; a SIR < 1 means the facility experienced fewer
infections than predicted.
ICU CLABSI SIRs were calculated for each ICU type, each facility, all adult/pediatric ICUs in Tennessee, and all
NICUs in Tennessee compared to national NHSN data. The SIR for each facility was calculated separately for
adult/pediatric ICUs and neonatal ICUs. In calculating SIRs for neonatal ICUs, birth weight category was also taken
into account. SCA CLABSI SIRs were calculated for each SCA type and for all SCAs in Tennessee, risk adjusting
by unit type and type of central line (permanent vs. temporary). LTAC CLABSI SIRs were also calculated for each
LTAC unit type and for all LTACs in Tennessee.
The following table illustrates the method of calculating a SIR across two risk strata (two ICU types: medical
cardiac and medical-surgical) for which national data exist from NHSN. If the observed data represented a follow-up
period such as January–December 2011, one would state that a SIR of 0.77 implies that there were 23% fewer
“Predicted” is used throughout the report as a synonym for the standard statistical term “expected”.

16 of 128
CLABSIs than predicted for the nation, region, or facility during that time period.
In summary, to calculate the CLABSI Standardized Infection Ratio (SIR) for a facility:
1. For each reporting unit, multiply the number of central line-days (CLD) by the published national infection rate
for that unit type to estimate the number of infections predicted (expected) for that unit if it were to produce
CLABSIs at the same frequency as the national rate (CLD x national rate / 1000).
2. Within each hospital, calculate the sum of predicted (expected) infections and the sum of reported infections
across all reporting units.
3. Calculate the SIR by dividing the total reported infections by the total predicted (expected) infections.2
The SIR concept and calculation are based on the underlying CLABSI rate data that exist across a potentially large
number of strata. Thus, the SIR provides a single metric for performing comparisons as an alternative to the
cumbersome task of performing multiple comparisons across many strata. Given the underlying CLABSI rate data,
one retains the option to perform comparisons within a particular set of strata where observed rates may differ
significantly from the rates in the standard population. These more detailed comparisons can be very useful and
necessary for identifying areas needing more focused prevention efforts.
2 Copyright 2010 by Consumers Union of United States, Inc., 101 Truman Ave., Yonkers, NY 10703, a nonprofit organization. This
report was posted with permission for educational purposes only, from www.ConsumerReportsHealth.org. No downloading,
transmission, photocopying, or commercial use permitted. www.ConsumerReportsHealth.org and www.ConsumerReports.org.®
Risk Group
Stratifier
Observed CLABSI Rates NHSN CLABSI Rates for 2006-2007
(Standard Population)
Location Type
#CLABSI
#Central
line-days
CLABSI
rate* #CLABSI
#Central
line-days CLABSI rate*
Medical cardiac
ICU 170 100,000 1.7 1260 600,000 2.1
Med-Surg ICU 58 58,000 1.0 600 400,000 1.5
SIR =
77.0297
228
87210
228
1000
5.1000,58
1000
1.2100000
58170
expected
observed

17 of 128
Tennessee State and National Comparisons - SSI
This report displays CBGB, CBGC, HPRO, and CARD SSI data in aggregate for Tennessee for 2009–2011. For
comparison, baseline national data were obtained from the National Healthcare Safety Network (NHSN) report that
covered the period of 2006 through 2008 (available at
http://www.cdc.gov/nhsn/PDFs/dataStat/2009NHSNReport.pdf). For SSI data, both crude (unadjusted) rates and
SIRs are presented.
Crude (unadjusted) SSI rates are calculated as follows:
SSI Rate = Number of SSI reported * 100
Number of procedures reported
SIRs for surgical site infections are calculated similarly to those for CLABSIs, by dividing the number of observed
infections by the number of predicted infections. However, for SSIs, the risk adjustment method used to determine
the predicted number of infections is derived from a logistic regression model using the baseline national data (see
above section on risk adjustment).
Below is a general logistic regression model. For each operative procedure, parameter estimates (represented by β in
the model) have been calculated by CDC and represent each risk factor’s contribution to a patient’s overall risk. In
this model, represents a patient’s probability of SSI, and x=1 if a given risk factor is present or x=0 if the risk
factor is absent.
logit ( ) = α + β1 X1+ β2 X2 + β3 X3 + β4 X4
For a given NHSN operative procedure, the table below illustrates the parameter estimates for the significant risk
factors associated with that procedure. Note that this table is for teaching purposes only and should not be considered
an actual model for predicting a patient’s risk of SSI3.
Factor Parameter Estimate OR p-value
Intercept -5.448 - -
Age (≤44 vs >44) 0.520 1.659 <0.0001
ASA (3/4/5 vs 1/2) 0.425 1.529 0.0415
Duration (>100 vs ≤100) 0.501 1.650 0.0019
Medical School affiliation (Y vs N) 1.069 2.912 <0.0001
Applying the parameter estimates to the above model gives the following formula:
logit( ) = -5.448 + 0.520 (Age ≤ 44)+ 0.425 (ASA 3/4/5) +0.501 (Duration >100)+ 1.069 (Med school affiliation)
The probability of SSI for a given patient can be calculated using this formula. For example:
Patient Age ASA Duration Med School Affiliation
A 35 3 105 Y
logit( ) = -5.448 + 0.520 (1)+ 0.425 (1) +0.501 (1)+ 1.069 (1) = -2.934
3 Example extracted from “NHSN e-News: SIRs Special Edition,” Division of Healthcare Quality Promotion, Centers for Disease
Control and Prevention, 10 December 2010 (http://www.cdc.gov/nhsn/PDFs/Newsletters/NHSN_NL_OCT_2010SE_final.pdf)
18 of 128
Solving for gives a probability of SSI for Patient A of 0.05, or 5%.
To calculate the predicted number of infections for a population, each patient’s risk of SSI is generated using the
appropriate logistic regression model, and summed.
For this report, SSI SIRs are generated by NHSN, and come in two forms: All SSI and Complex
Admission/Readmission (Complex A/R) SIRs. The All SSI SIR includes all procedures and superficial incisional
primary, deep incisional primary, and organ/space SSIs identified during admission, readmission, or post-discharge
surveillance; secondary SSIs are not included. Complex A/R SIRs include only inpatient procedures and deep
incisional primary and organ/space SSIs which were identified during admission or readmission to the reporting
facility, as defined in the NHSN manual.

19 of 128
Calculation of Exact Confidence Interval of the SIR4:
Rationale
Confidence intervals are frequently required in epidemiology, including in relation to standardized infection ratios
(SIRs). The SIR is the ratio of the observed number of infections, usually assumed to be the realization of a Poisson
variate, to the predicted number of infections, which is assumed to be a constant. The predicted number is assumed
to be a constant because the reference rates are usually based on a very large number of persons, so that variation in
these rates can be ignored. For a larger number of observed infections, several approximation methods are available.
When the number of infections is small, however, all of the approximation methods will be inadequate, and exact
confidence limits may be desirable.
Exact Test
Exact confidence limits for a SIR can be derived by setting limits for the numerator and assuming the expected
number in the denominator to be a constant. The limits for ‘a’ with 100(1-α) percent confidence are the iterative
solutions and .
Computations for the iterative solutions and are below.
Fisher’s Exact Test
Lower bound:
Upper bound:
Therefore, the exact lower and upper limits for SIR equal to “a/λ” would be
, respectively.
The notation for the formulae is:
a = the observed number of infections
λ = the expected number of infections
In this report, statistical analyses were performed using SAS version 9.3. Tables and figures were created using SAS
version 9.3 and/or Microsoft Excel.
4 Rothman KJ, Boice JD Jr: Epidemiologic analysis with a programmable calculator. NIH Pub No. 79-1649. Bethesda, MD:
National Institutes of Health, 1979;31-32.

20 of 128
Figures 1 and 2 demonstrate how the figures pertaining to facility-specific standardized infection ratios (SIRs) and
infection rates should be interpreted in this report.
Figure 1: How to Read Hospital-Specific Standardized Infection Ratio Figures
Hospital A reported CLABSIs from one ICU type (N=1). The facility had two CLABSIs during 2011 (OBS).
Statistically, 1.4 CLABSIs were predicted (PRED) during that time, based on the number of central line-days
(CLD) in Hospital A’s ICU and the national NHSN rate for that type of ICU. The standardized infection ratio
(SIR) is 1.4. Thus, the number of infections observed was 40% greater than predicted. This result was not
significantly different from the NHSN baseline SIR, as the green bar (95% confidence interval) crosses the
dotted line. The confidence interval is somewhat wide due to the relatively small number of central line-days.
Hospital B reported CLABSIs from one type of ICU. This facility had ten CLABSIs in 2011. Statistically,
2.5 CLABSIs were predicted during that time, based on the number of central line-days in that ICU and the
national rate for that type of ICU. The red bar does not cross the dotted line, indicating that the SIR of 4.0 is
statistically significantly higher than the national baseline SIR of 1.0.
Hospital C reported from three ICU types. The facility reported six infections in 2011, compared to the 17
infections that were predicted based on 2006-8 NHSN baseline data. The SIR is 0.4, meaning that the facility
had 60% fewer CLABSIs than predicted. The bar representing the 95% confidence interval is blue and does
not cross the dotted line, indicating that the facility’s SIR is significantly lower than the baseline SIR.
Hospital D reported from four ICU types and observed 14 CLABSIs (39.5 were predicted). This hospital’s
SIR was significantly lower than the national SIR (the confidence interval does not cross the dotted line).
The narrow confidence interval indicates that Hospital D had a large number of central line-days in 2011.
Hospital E reported from one ICU type and observed zero CLABSIs (2.3 were predicted), but the 95%
confidence interval (represented by the green bar) includes the reference SIR of 1. Although this hospital’s
SIR was not significantly lower than the national baseline, the asterisk (*) next to the hospital name indicates
that this hospital had zero infections during the reporting period.
Hospital A
Hospital B**
Hospital C^^
Hospital D^^
Hospital E*
21 of 128
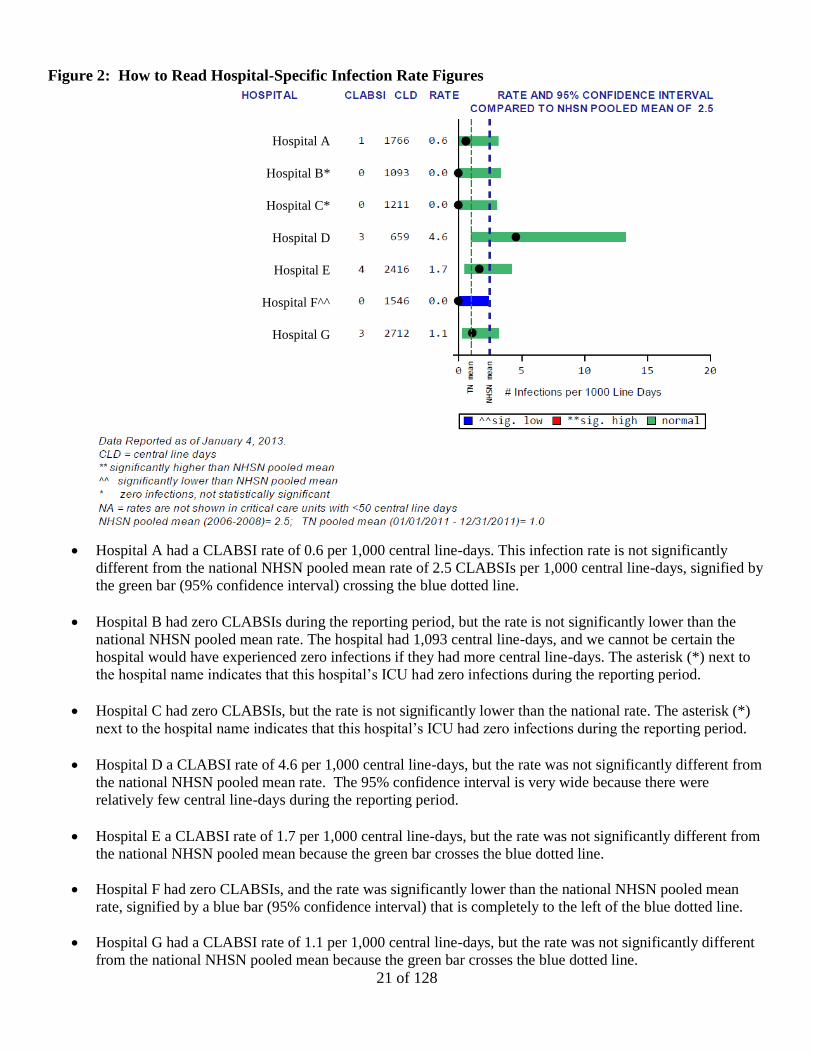
Figure 2: How to Read Hospital-Specific Infection Rate Figures
Hospital A had a CLABSI rate of 0.6 per 1,000 central line-days. This infection rate is not significantly
different from the national NHSN pooled mean rate of 2.5 CLABSIs per 1,000 central line-days, signified by
the green bar (95% confidence interval) crossing the blue dotted line.
Hospital B had zero CLABSIs during the reporting period, but the rate is not significantly lower than the
national NHSN pooled mean rate. The hospital had 1,093 central line-days, and we cannot be certain the
hospital would have experienced zero infections if they had more central line-days. The asterisk (*) next to
the hospital name indicates that this hospital’s ICU had zero infections during the reporting period.
Hospital C had zero CLABSIs, but the rate is not significantly lower than the national rate. The asterisk (*)
next to the hospital name indicates that this hospital’s ICU had zero infections during the reporting period.
Hospital D a CLABSI rate of 4.6 per 1,000 central line-days, but the rate was not significantly different from
the national NHSN pooled mean rate. The 95% confidence interval is very wide because there were
relatively few central line-days during the reporting period.
Hospital E a CLABSI rate of 1.7 per 1,000 central line-days, but the rate was not significantly different from
the national NHSN pooled mean because the green bar crosses the blue dotted line.
Hospital F had zero CLABSIs, and the rate was significantly lower than the national NHSN pooled mean
rate, signified by a blue bar (95% confidence interval) that is completely to the left of the blue dotted line.
Hospital G had a CLABSI rate of 1.1 per 1,000 central line-days, but the rate was not significantly different
from the national NHSN pooled mean because the green bar crosses the blue dotted line.
Hospital A
Hospital B*
Hospital C*
Hospital D
Hospital E
Hospital F^^
Hospital G

22 of 128
RESULTS
CLABSIs in Adult/Pediatric ICUs:
Total number of hospitals reporting in 2011: 92
Microorganisms Associated with CLABSIs in Adult and Pediatric ICUs (Table 2, Figure 7)
The four most common pathogens among total positive isolates were coagulase-negative Staphylococcus
species (24.0%), Candida species and other yeasts (23.1%), Enterococcus species (13.0%), and
Staphylococcus aureus (11.8%). Methicillin-resistant S. aureus (MRSA) accounted for 7.5% and
vancomycin-resistant Enterococcus (VRE) for 3.6% of total positive isolates.
Tennessee and National Comparisons:
Key Percentiles for Tennessee SIRs (Tables 3-5, Figure 5)
Excluding burn and trauma ICUs, the overall SIR across all reporting adult and pediatric ICUs in Tennessee
in 2011 was statistically significantly lower than the national SIR of 1 (SIR=0.72; 95% CI: 0.64, 0.81). This
SIR indicates that the number of CLABSIs in ICUs was 28% lower than expected, compared to national
NHSN 2006-8 data. The overall Tennessee SIR for 2011 was lower than the overall SIRs for 2008–2010.
Including burn and trauma ICUs, the overall SIR across all reporting adult and pediatric ICUs in Tennessee
in 2011 was statistically significantly lower than the national SIR of 1 (SIR=0.74; 95% CI: 0.67, 0.82). This
SIR indicates that the number of CLABSIs in ICUs was 26% lower than expected, compared to national
NHSN 2006-8 data. The overall Tennessee SIR for 2011 was lower than the overall SIRs for 2008–2010.
In 2011, the median (50th percentile) facility-specific SIR was 0.25, indicating that half of all reporting
Tennessee hospitals had a SIR at or below 0.25. This value is lower than the median values in 2008–2010.
In 2011, Tennessee CLABSI SIRs were significantly lower than the 2006-8 baseline SIR in medical ICUs in
major teaching hospitals (SIR=0.41, 95% CI: 0.23, 0.68), neurosurgical ICUs (SIR=0.39, 95% CI: 0.20,
0.70), pediatric medical-surgical ICUs (SIR=0.46, 95% CI: 0.27, 0.75), surgical ICUs (SIR=0.57, 95% CI:
0.39, 0.81), and trauma ICUs (SIR=0.49, 95% CI: 0.32, 0.72). The CLABSI SIR in pediatric surgical
cardiothoracic ICUs was significantly higher than the 2006-8 baseline SIR (SIR=2.34, 95% CI: 1.21, 4.09).
From baseline to 2011, median unit-specific SIRs decreased among all ICU types for which data were
available, except medical-surgical ICUs with ≤15 beds in non-major teaching hospitals (remained at 0.00).
Rates by Unit Type (Table 6, Figure 3)
The following list summarizes the CLABSI rates per 1,000 central line-days in Tennessee for 2011.
CLABSI rates were highest in pediatric surgical cardiothoracic ICUs and lowest among neurological ICUs:
o Pediatric surgical cardiothoracic ICUs (7.8)
o Burn (6.0)
o Pediatric medical (3.1)
o Trauma (2.7)
o Medical cardiac (1.7)
o Non-major teaching medical (1.4)
o Major teaching medical-surgical (1.4)
o Non-major teaching medical-surgical with ≤15 beds (1.4)
o Pediatric medical-surgical (1.4)
o Non-major teaching medical-surgical with >15 beds (1.3)
o Surgical (1.3)
23 of 128
o Major teaching medical (1.1)
o Surgical cardiothoracic (1.1)
o Neurosurgical (1.0)
o Neurological (0.7)
From 2010 to 2011, infection rates per 1,000 central line-days decreased among burn ICUs (10.5 to 6.0),
major teaching medical ICUs (3.1 to 1.1), major teaching medical-surgical ICUs (2.5 to 1.4), non-major
teaching medical-surgical ICUs with ≤15 beds (1.3 to 0.7), neurosurgical ICUs (1.6 to 1.0), pediatric
medical-surgical ICUs (1.5 to 1.4), and trauma ICUs (3.6 to 2.7).
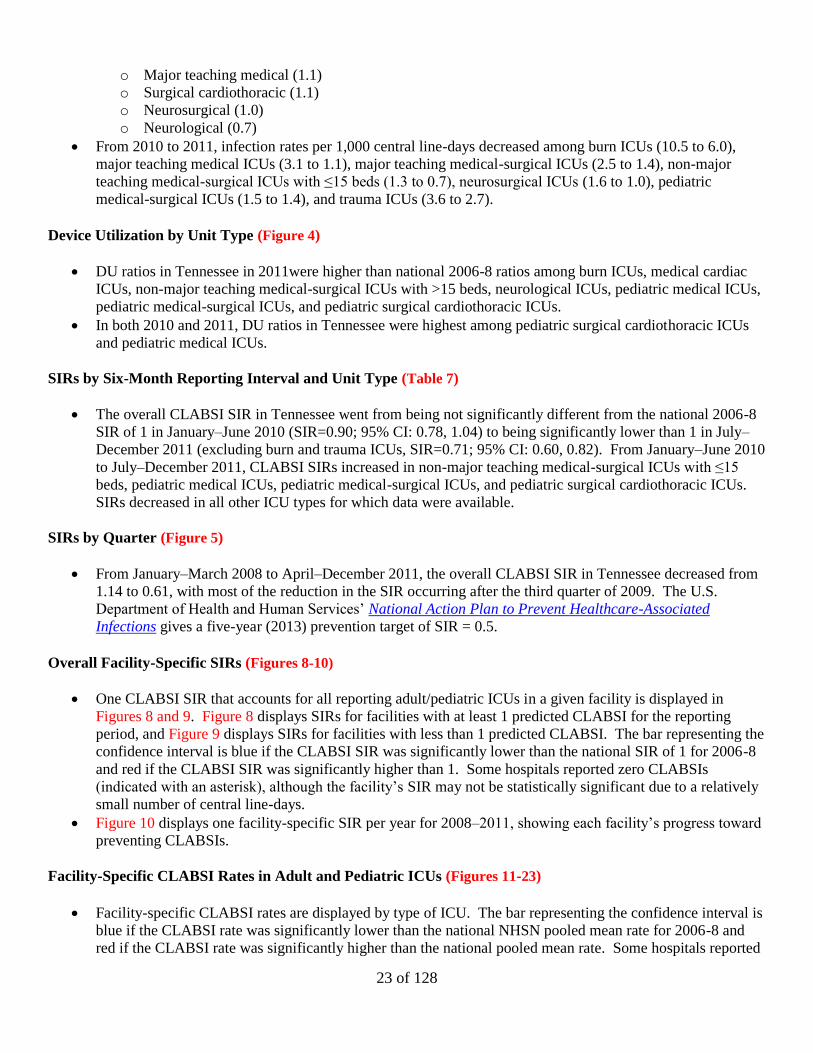
Device Utilization by Unit Type (Figure 4)
DU ratios in Tennessee in 2011were higher than national 2006-8 ratios among burn ICUs, medical cardiac
ICUs, non-major teaching medical-surgical ICUs with >15 beds, neurological ICUs, pediatric medical ICUs,
pediatric medical-surgical ICUs, and pediatric surgical cardiothoracic ICUs.
In both 2010 and 2011, DU ratios in Tennessee were highest among pediatric surgical cardiothoracic ICUs
and pediatric medical ICUs.
SIRs by Six-Month Reporting Interval and Unit Type (Table 7)
The overall CLABSI SIR in Tennessee went from being not significantly different from the national 2006-8
SIR of 1 in January–June 2010 (SIR=0.90; 95% CI: 0.78, 1.04) to being significantly lower than 1 in July–
December 2011 (excluding burn and trauma ICUs, SIR=0.71; 95% CI: 0.60, 0.82). From January–June 2010
to July–December 2011, CLABSI SIRs increased in non-major teaching medical-surgical ICUs with ≤15
beds, pediatric medical ICUs, pediatric medical-surgical ICUs, and pediatric surgical cardiothoracic ICUs.
SIRs decreased in all other ICU types for which data were available.
SIRs by Quarter (Figure 5)
From January–March 2008 to April–December 2011, the overall CLABSI SIR in Tennessee decreased from
1.14 to 0.61, with most of the reduction in the SIR occurring after the third quarter of 2009. The U.S.
Department of Health and Human Services’ National Action Plan to Prevent Healthcare-Associated
Infections gives a five-year (2013) prevention target of SIR = 0.5.
Overall Facility-Specific SIRs (Figures 8-10)
One CLABSI SIR that accounts for all reporting adult/pediatric ICUs in a given facility is displayed in
Figures 8 and 9. Figure 8 displays SIRs for facilities with at least 1 predicted CLABSI for the reporting
period, and Figure 9 displays SIRs for facilities with less than 1 predicted CLABSI. The bar representing the
confidence interval is blue if the CLABSI SIR was significantly lower than the national SIR of 1 for 2006-8
and red if the CLABSI SIR was significantly higher than 1. Some hospitals reported zero CLABSIs
(indicated with an asterisk), although the facility’s SIR may not be statistically significant due to a relatively
small number of central line-days.
Figure 10 displays one facility-specific SIR per year for 2008–2011, showing each facility’s progress toward
preventing CLABSIs.
Facility-Specific CLABSI Rates in Adult and Pediatric ICUs (Figures 11-23)
Facility-specific CLABSI rates are displayed by type of ICU. The bar representing the confidence interval is
blue if the CLABSI rate was significantly lower than the national NHSN pooled mean rate for 2006-8 and
red if the CLABSI rate was significantly higher than the national pooled mean rate. Some hospitals reported

24 of 128
zero CLABSIs in specific ICUs, although the rate may not be statistically significant due to small numbers of
central line-days. The following numbers and percentages of ICUs reported zero infections in 2011
(facilities with <50 line-days excluded):
o 2 of 8 medical cardiac ICUs – 25%
o 0 of 4 major teaching medical ICUs – 0%
o 11 of 21 non-major teaching medical ICUs – 52%
o 1 of 5 major teaching medical-surgical ICUs – 20%
o 25 of 34 non-major teaching medical-surgical ICUs with ≤15 beds – 74%
o 2 of 19 non-major teaching medical-surgical ICUs with >15 beds – 11%
o 0 of 1 neurological ICUs – 0%
o 3 of 7 neurosurgical ICUs – 43%
o 0 of 1 pediatric medical ICUs – 0%
o 2 of 6 pediatric medical-surgical ICUs – 33%
o 0 of 1 pediatric surgical cardiothoracic ICUs – 0%
o 4 of 15 surgical cardiothoracic ICUs – 27%
o 1 of 11 surgical ICUs – 9%
CLABSIs in Neonatal ICUs:
Total number of neonatal ICUs (NICUs) reporting in 2011: 24
Microorganisms Associated with CLABSIs in Neonatal ICUs (Table 22, Figure 27)
The most common microorganisms identified in NICU-related CLABSIs were coagulase-negative
Staphylococcus (30.1%), Staphylococcus aureus (26.0%), Candida species and other yeasts (8.2%), and
Enterococcus species (8.2%). Methicillin-resistant S. aureus (MRSA) accounted for 17.8% of organisms
identified, and one vancomycin-resistant Enterococcus (VRE) was identified among the isolates (1.4%).
Tennessee and National Comparisons: Note: When viewing data from 2008, please note that NICU data are available for July–December 2008 only.
Key Percentiles for Tennessee SIRs (Tables 9–10)
The overall SIR across all reporting NICUs in Tennessee in 2011 was statistically significantly lower than
the national SIR of 1 (SIR=0.62; 95% CI: 0.48, 0.79). The overall Tennessee SIR for 2011was lower than
the overall SIRs for 2008– 2010.
In 2011, the median (50th percentile) facility-specific SIR was 0.21, indicating that half of all reporting
Tennessee hospitals had a SIR at or below 0.21. This value is lower than it was in 2010, when 50% of
reporting hospitals had a SIR at or below 0.39. During 2008–December 2011, at least 25% of NICUs had a
SIR of 0.
In 2011, the Tennessee CLABSI SIR in level III NICUs was significantly lower than 2006-8 national SIR of
1 (SIR=0.61; 95% CI: 0.45, 0.81). The Tennessee CLABSI SIR in level II/III NICUs was not significantly
different from 1(SIR=0.65; 95% CI: 0.40, 1.00). In both level III and level II/III NICUs, the CLABSI SIR
decreased greatly from July–December 2008 through January–December 2011.
From 2008 to 2011, the median unit-specific SIR decreased among level III NICUs (0.94 to 0.73) and
remained the same among level II/III NICUs (0.00).
25 of 128
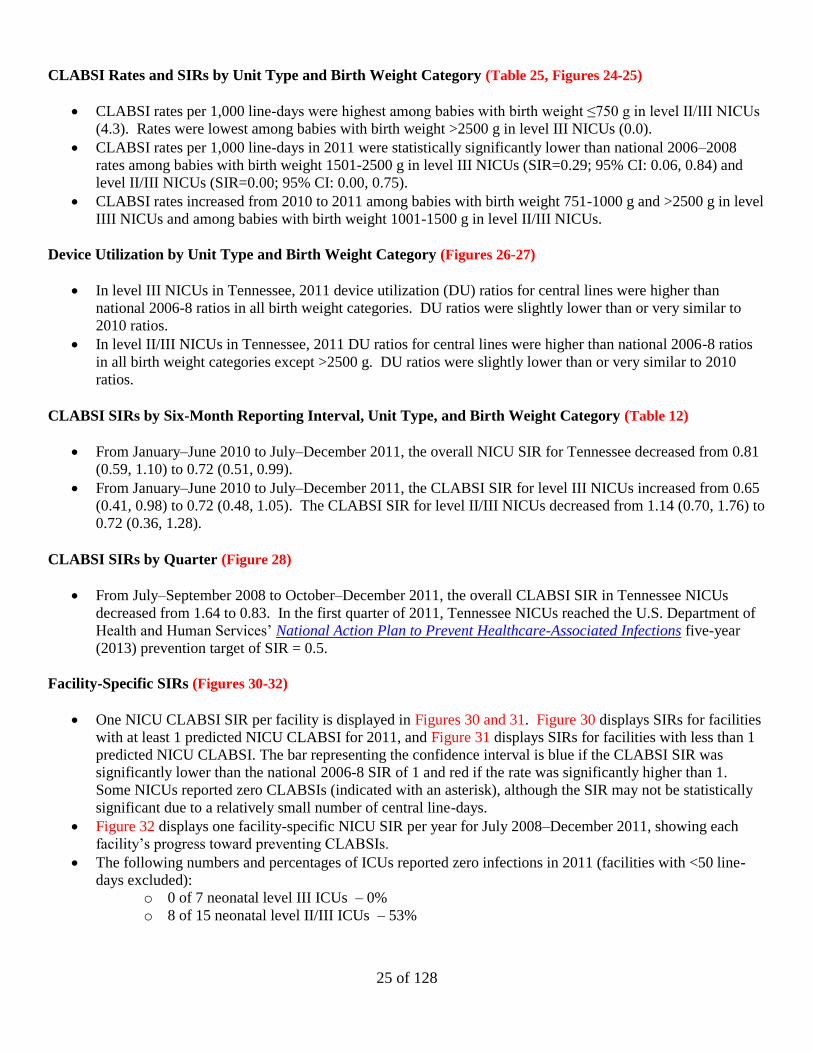
CLABSI Rates and SIRs by Unit Type and Birth Weight Category (Table 25, Figures 24-25)
CLABSI rates per 1,000 line-days were highest among babies with birth weight ≤750 g in level II/III NICUs
(4.3). Rates were lowest among babies with birth weight >2500 g in level III NICUs (0.0).
CLABSI rates per 1,000 line-days in 2011 were statistically significantly lower than national 2006–2008
rates among babies with birth weight 1501-2500 g in level III NICUs (SIR=0.29; 95% CI: 0.06, 0.84) and
level II/III NICUs (SIR=0.00; 95% CI: 0.00, 0.75).
CLABSI rates increased from 2010 to 2011 among babies with birth weight 751-1000 g and >2500 g in level
IIII NICUs and among babies with birth weight 1001-1500 g in level II/III NICUs.
Device Utilization by Unit Type and Birth Weight Category (Figures 26-27)
In level III NICUs in Tennessee, 2011 device utilization (DU) ratios for central lines were higher than
national 2006-8 ratios in all birth weight categories. DU ratios were slightly lower than or very similar to
2010 ratios.
In level II/III NICUs in Tennessee, 2011 DU ratios for central lines were higher than national 2006-8 ratios
in all birth weight categories except >2500 g. DU ratios were slightly lower than or very similar to 2010
ratios.
CLABSI SIRs by Six-Month Reporting Interval, Unit Type, and Birth Weight Category (Table 12)
From January–June 2010 to July–December 2011, the overall NICU SIR for Tennessee decreased from 0.81
(0.59, 1.10) to 0.72 (0.51, 0.99).
From January–June 2010 to July–December 2011, the CLABSI SIR for level III NICUs increased from 0.65
(0.41, 0.98) to 0.72 (0.48, 1.05). The CLABSI SIR for level II/III NICUs decreased from 1.14 (0.70, 1.76) to
0.72 (0.36, 1.28).
CLABSI SIRs by Quarter (Figure 28)
From July–September 2008 to October–December 2011, the overall CLABSI SIR in Tennessee NICUs
decreased from 1.64 to 0.83. In the first quarter of 2011, Tennessee NICUs reached the U.S. Department of
Health and Human Services’ National Action Plan to Prevent Healthcare-Associated Infections five-year
(2013) prevention target of SIR = 0.5.
Facility-Specific SIRs (Figures 30-32)
One NICU CLABSI SIR per facility is displayed in Figures 30 and 31. Figure 30 displays SIRs for facilities
with at least 1 predicted NICU CLABSI for 2011, and Figure 31 displays SIRs for facilities with less than 1
predicted NICU CLABSI. The bar representing the confidence interval is blue if the CLABSI SIR was
significantly lower than the national 2006-8 SIR of 1 and red if the rate was significantly higher than 1.
Some NICUs reported zero CLABSIs (indicated with an asterisk), although the SIR may not be statistically
significant due to a relatively small number of central line-days.
Figure 32 displays one facility-specific NICU SIR per year for July 2008–December 2011, showing each
facility’s progress toward preventing CLABSIs.
The following numbers and percentages of ICUs reported zero infections in 2011 (facilities with <50 line-
days excluded):
o 0 of 7 neonatal level III ICUs – 0%
o 8 of 15 neonatal level II/III ICUs – 53%

26 of 128
CLABSIs in Specialty Care Areas (SCAs):
Total number of hospitals reporting in 2011: 13
Microorganisms Associated with CLABSIs in SCAs (Table 13, Figure 39)
The three most common pathogens among total positive isolates were Enterococcus species (18.5%),
coagulase-negative Staphylococcus species (13.3%), Escherichia species (12.6%), and Pseudomonas species
(11.9%). Vancomycin-resistant Enterococcus (VRE) accounted for 11.1% of total positive isolates, and
methicillin-resistant Staphylococcus aureus (MRSA) accounted for 3.0%.
Tennessee and National Comparisons: Note: National 2006-8 baseline data for pediatric bone marrow transplants SCAs are not available. Therefore, SIR
calculations do not include these units. Additionally, because facility-specific SCA data are not published in
Tennessee at this time, this report does not show data for Tennessee’s one solid organ transplant unit.
Key Percentiles for Tennessee SIRs (Tables 14-15, Figure 37)
The overall SIR across all reporting SCAs in Tennessee in 2011 was not significantly different than the
national SIR of 1 (SIR=0.85; 95% CI: 0.70, 1.01). The overall Tennessee SIR for 2011 was slightly lower
than the overall SIR for July–December 2010 (SIR=0.90; 95% CI: 0.69, 1.14).
In 2011, the median (50th percentile) facility-specific SIR was 0.84, indicating that half of all reporting
Tennessee hospitals had a SCA SIR at or below 0.84. This value is higher than the median in July–
December 2010 (0.46).
In 2011, Tennessee CLABSI SIRs were significantly lower than the 2006-8 baseline SIR in bone marrow
transplant SCAs (SIR=0.54, 95% CI: 0.35, 0.80) and pediatric hematology/oncology SCAs (SIR=0.31, 95%
CI: 0.14, 0.59). No SCA type had a SIR that was significantly greater than 1.
From July–December 2010 to 2011, the SIR decreased among bone marrow transplant SCAs and pediatric
hematology/oncology SCAs. The SIR increased among hematology/oncology SCAs.
From July–December 2010 to 2011, the median unit-specific SIRs increased among hematology/oncology
SCAs (0.00 to 0.84) and decreased among bone marrow transplant SCAs (1.31 to 0.55). Key percentiles for
other SCA types are not shown because there were fewer than five units of each type in Tennessee.
Rates by Unit Type and Line Type (Tables 16-17, Figures 33–34)
The following list summarizes the CLABSI rates per 1,000 central line-days in Tennessee SCAs for January–
December 2011.
CLABSI rates associated with temporary central lines were as follows:
o Hematology/oncology (2.6)
o Bone marrow transplant (1.8)
o Pediatric bone marrow transplant (0.0)
o Pediatric hematology/oncology (0.0)
CLABSI rates associated with permanent central lines were as follows:
o Pediatric bone marrow transplant (2.9)
o Bone marrow transplant (2.5)
o Hematology/oncology (1.3)
o Pediatric hematology/oncology (0.8)
The CLABSI rate associated with temporary central lines was significantly lower than the corresponding
NHSN 2006-8 pooled mean rate among bone marrow transplant and pediatric hematology/oncology SCAs.

27 of 128
The CLABSI rate associated with permanent central lines was significantly lower than the corresponding
NHSN 2006-8 pooled mean rate among pediatric hematology/oncology SCAs.
Device Utilization by Unit Type and Line Type (Figures 35–36)
Temporary central line DU ratios in Tennessee SCAs in 2011were higher than national 2006-8 ratios in bone
marrow transplant and hematology/oncology SCAs. Permanent central line DU ratios in Tennessee SCAs in
2011were higher than national 2006-8 ratios in pediatric hematology/oncology SCAs.
From July–December 2010 to 2011, the temporary and permanent central line DU ratios in Tennessee
remained relatively constant among all SCA types.
SIRs by Quarter (Figure 38)
From July–September 2010 to October–December 2011, the overall CLABSI SIR in Tennessee decreased
from 0.89 to 0.50, with most of the reduction occurring in the fourth quarter of 2011.
CLABSIs in Long-Term Acute Care (LTAC) Facilities:
Total number of LTACs participating in this reporting period: 9
Microorganisms Associated with CLABSIs in SCAs (Table 18, Figure 41)
The most common pathogens among total positive isolates were Enterococcus species (28.4%), coagulase-
negative Staphylococcus species (13.8%), Staphylococcus aureus (11.2%), and Candida species and other
yeasts (9.5%). Vancomycin-resistant Enterococcus (VRE) accounted for 16.4% of total positive isolates,
and methicillin-resistant S. aureus (MRSA) accounted for 10.3%.
Tennessee and National Comparisons:
Key Percentiles for Tennessee SIRs (Table 19)
The overall SIR across all reporting LTACs in Tennessee in 2011 was not significantly different than the
national SIR of 1 (SIR=0.91; 95% CI: 0.75, 1.11). The overall Tennessee SIR for 2011 was slightly lower
than the overall SIR for July–December 2010 (SIR=1.05; 95% CI: 0.79, 1.37).
In 2011, the median facility-specific SIR was 1.00, indicating that half of all reporting Tennessee LTACs had
SIR at or below 1.00. This value is lower than the median in July–December 2010 (1.26).
Only one type of LTAC location (LTAC ward) was present in Tennessee during the reporting period, so the
unit-specific SIR and key percentiles are the same as the aggregate Tennessee values.
Rates by Unit Type (Table 20)
One type of LTAC location (LTAC ward) was present in Tennessee during the reporting period. The pooled
mean CLABSI rate in Tennessee LTAC wards was not significantly different from the NHSN 2006-8 pooled
mean rate (1.6 vs. 1.7 CLABSIs per 1,000 line-days).
SIRs by Quarter (Figure 40)
From July–September 2010 to October–December 2011, the overall CLABSI SIR in Tennessee decreased
from 1.02 to 0.81, with most of the reduction occurring after the second quarter of 2011.

28 of 128
SSIs Related to CBGB/C and HPRO Procedures (Combined)
Total number of facilities reporting in this period: 74
Tennessee and National Comparisons:
Key Percentiles for Tennessee SIRs (Table 21)
The combined All SSI SIR for SSIs related to CBGB/C and HPRO procedures in Tennessee in July–
December 2011was statistically significantly lower than the national SIR of 1 (SIR=0.76; 95% CI: 0.63,
0.91). This SIR was approximately the same as those for the preceding two half-year periods.
In July–December 2011, the median combined All SSI SIR for CBGB/C and HPRO procedures was 0.59,
indicating that half of reporting facilities had an All SSI SIR at or below 0.59. This value is lower than the
medians for the preceding two half-year periods.
The Complex A/R SIR for SSIs related to CBGB/C and HPRO procedures in Tennessee in July–December
2011was not significantly different from 1 (SIR=0.89; 95% CI: 0.70, 1.10). This SIR was higher than those
for the preceding two half-year periods.
In July–December 2011, the median combined All SSI SIR for CBGB/C and HPRO procedures was 0.81,
indicating that half of reporting facilities had an All SSI SIR at or below 0.81. This value is higher than those
for the preceding two half-year periods.
SIRs by Quarter (Figure 42)
From July-September 2010 to October-December 2011, the combined All SSI SIR for SSIs related to
CBGB/C and HPRO procedures in Tennessee decreased overall.
The Complex A/R SIR for SSIs related to CBGB/C or HPRO procedures increased overall between July-
September 2010 and October-December 2011; however, the SIR decreased slightly between the third and
fourth quarters of 2011.
SSIs Related to CBGB and CBGC Procedures:
Total number of facilities reporting in this period: 26
Microorganisms associated with SSIs following CBGB/C Procedures (Figure 43, Table 22)
The most common pathogens among 128 total positive isolates for SSIs related to CBGB/C procedures were
Staphylococcus aureus (36.7%) and coagulase-negative Staphylococcus species (18.0%). Methicillin-
resistant S. aureus (MRSA) accounted for 10.3% of total positive isolates.
Tennessee and National Comparisons:
Key Percentiles for Tennessee SIRs (Table 23)
The All SSI SIR for SSIs related to CBGB/C procedures in Tennessee in 2011 was statistically significantly
lower than the national SIR of 1 (SIR=0.75; 95% CI: 0.62, 0.90). The All SSI SIR for CBGB/C was higher
than the SIR for 2010.
In 2011, the median All SSI SIR for CBGB/C procedures was 0.82, indicating that half of reporting facilities
had an All SSI SIR at or below 0.82. This value is higher than the median in 2010.
The Complex A/R SIR for SSIs related to CBGB/C procedures in Tennessee in 2011 was not significantly

29 of 128
different than the national SIR of 1 (SIR=0.92; 95% CI: 0.73, 1.15). The Complex A/R SIR for CBGB/C was
higher than the SIR for 2010, which was significantly lower than 1 (SIR=0.71; 95% CI: 0.55, 0.90).
In 2011, the median Complex A/R SIR for CBGB/C procedures was 0.73, indicating that half of reporting
facilities had an All SSI SIR at or below 0.73. This value is higher than the median for 2010.
SIRs by Quarter (Figure 44)
From January-March 2009 to October-December 2011, there was no major overall change in the combined
All SSI SIR for SSIs related to CBGB/C procedures in Tennessee.
The Complex A/R SIR for SSIs related to CBGB/C procedures increased overall from January-March 2009
to October-December 2011, and has been greater than the U.S. Department of Health and Human Services’
National Action Plan to Prevent Healthcare-Associated Infections five-year (2013) prevention target of SIR=
0.75 since April-June 2011.
Rates, Infection Sites, and Detection (Table 24, Figure 45-46)
In 2011, 144 SSIs were reported among 7,403 CBGB/C procedures in Tennessee, for a crude rate of 1.95
infections per 100 operations. This rate is lower than in 2010, when the crude (unadjusted) rate was 2.03
infections per 100 operations.
Overall, SSIs related to CBGB/B procedures were most often deep primary (30.6%) and least often deep
secondary infections (2.1%).
SSIs related to CBGB/C procedures were most often identified upon readmission (71.5%).
SSIs Related to HPRO procedures
Total number of facilities reporting in this period: 74
Microorganisms associated with SSIs following HPRO Procedures (Figure 47, Table 27)
The most common pathogens among 134 total positive isolates for SSIs related to HPRO procedures were
Staphylococcus aureus (52.2%) and Enterococcus species (9.7%). Methicillin-resistant S. aureus (MRSA)
accounted for 29.1% of total positive isolates.
Tennessee and National Comparisons:
Key Percentiles for Tennessee SIRs (Table 45)
The All SSI SIR for SSIs related to HPRO procedures in Tennessee in 2011 was significantly lower than the
national SIR of 1 (SIR=0.76; 95% CI: 0.63, 0.90). This value is slightly higher than that for 2010.
In 2011, the median All SSI SIR for HPRO procedures was 0.70, indicating that half of reporting facilities
had an All SSI SIR at or below 0.70. This value is higher than the median in 2010.
The Complex A/R SIR for SSIs related to HPRO procedures in Tennessee in 2011 was not statistically
significantly different than the national SIR of 1 (SIR=0.84; 95% CI: 0.67, 1.03). This value is higher than
that for 2010, when the SIR was significantly lower than 1 (SIR=0.51; 95% CI: 0.32, 0.75)
In 2011, the median Complex A/R SIR for HPRO procedures was 0.68, indicating that half of reporting
facilities had an All SSI SIR at or below 0.68. This value is higher than the median in 2010.
SIRs by Quarter (Figure 48)

30 of 128
The All SSI SIR for SSIs related to HPRO procedures increased overall from July-September 2010 to
October-December 2011.
The Complex A/R SIR for SSIs related to HPRO procedures increased overall from July-September 2010 to
October-December 2011, having been below the U.S. Department of Health and Human Services’ National
Action Plan to Prevent Healthcare-Associated Infections five-year (2013) prevention target of SIR= 0.75
until the second quarter of 2011.
Rates, Infection Sites, and Detection (Table 28, Figure 49-50)
In 2011, 127 SSIs were reported among 9,978 HPRO procedures, for a crude rate of 1.27 infections per 100
operations. This is a slight increase from July-December 2010, when the crude (unadjusted) rate was 1.24.
SSIs related to HPRO procedures were relatively evenly distributed among the three possible sites, with deep
primary infections being most common (46.5%).
SSIs related to HPRO procedures were most often identified upon readmission (84.2%).
SSIs Related to CARD procedures
Total number of facilities reporting in this period: 25
Microorganisms associated with SSIs following CARD Procedures (Table 30)
The most common pathogen among nine total positive isolates for SSIs related to CARD procedures was
Staphylococcus aureus, comprising two (22.2%) isolates during July-December 2011. Methicillin-resistant S.
aureus (MRSA) was reported for one CARD SSI event.
Tennessee and National Comparisons:
Key Percentiles for Tennessee SIRs (Table 31)
The All SSI SIR for SSIs related to CARD procedures in Tennessee in October–December 2011 was not
statistically significantly different than the national SIR of 1 (SIR=0.71; 95% CI: 0.26, 1.55). This value is
higher than the SIR for July-September 2011 (SIR=0.58; 95% CI: 0.19, 1.36).
In October–December 2011, the median All SSI SIR for CARD procedures was 1.26, indicating that half of
reporting facilities had an All SSI SIR at or below 1.26. This value is higher than the median in 2010.
The Complex A/R SIR for SSIs related to CARD procedures in Tennessee in October–December 2011 was
not significantly different than the national SIR of 1 (SIR=0.40; 95% CI: 0.05, 1.43).
In October–December 2011, the median Complex A/R SIR for CARD procedures was 0.72, indicating that
half of reporting facilities had an All SSI SIR at or below 0.72. This value is slightly lower than the median
in July-September 2011.
Rates, Infection Sites, and Detection (Table 32, Figure 51-52)
In October–December 2011, 7 SSIs were reported among 656 CARD procedures in Tennessee, for a crude
rate of 1.07 infections per 100 operations. This is a slight increase from July-September 2011, when the
crude (unadjusted) rate was 0.92 infections per 100 operations.
SSIs related to CARD procedures were either superficial primary (63.6%) or organ/space (36.4%).
SSIs related to CARD procedures were most often identified during admission (72.7%).

31 of 128
CLABSI Figures and Tables
Adult and Pediatric Critical Care Units

Tennessee’s Report on Healthcare-Associated Infections: January 2008–December 2011
32 of 128
Figure 3: Central Line-Associated Bloodstream Infection (CLABSI) Pooled Mean Rates per 1,000 Central Line Days by Intensive Care Unit (ICU) Type,
Tennessee, 2010 and 2011, vs. National Healthcare Safety Network (NHSN), 2006-8 Note: Burn and trauma ICU data are available since July 2010; no neurological or pediatric medical ICUs were present in Tennessee in 2010

Tennessee’s Report on Healthcare-Associated Infections: January 2008–December 2011
33 of 128
Figure 4: Central Line Utilization Ratio by Intensive Care Unit (ICU) Type, Tennessee, 2010 and 2011, vs. National Healthcare Safety Network (NHSN),
2006-8 Note: Burn and trauma ICU data are available since July 2010; no neurological or pediatric medical ICUs were present in Tennessee in 2010

Tennessee’s Report on Healthcare-Associated Infections: January 2008–December 2011
34 of 128
Figure 5: Standardized Infection Ratios (SIRs) for Central Line-Associated Bloodstream Infections (CLABSIs) by Intensive Care Unit (ICU) Type,
Including Burn and Trauma ICUs, Tennessee, 2010 and 2011 [Reference standard: National Healthcare Safety Network (NHSN), 2006-8] Note: Burn and trauma ICU data are available since July 2010; no neurological or pediatric medical ICUs were present in Tennessee in 2010

Tennessee’s Report on Healthcare-Associated Infections: January 2008–December 2011
35 of 128
Figure 6: Standardized Infection Ratios (SIR) for Central Line-Associated Bloodstream Infections (CLABSIs) for Adult and Pediatric Intensive Care
Units (ICUs) by Quarter, Excluding Burn and Trauma ICUs, Tennessee, 01/01/2008–12/31/2011 [Reference standard: National Healthcare Safety
Network (NHSN), 2006-8]

Tennessee’s Report on Healthcare-Associated Infections: January 2008–December 2011
36 of 128
Figure 7: Organisms Isolated from Central Line-Associated Bloodstream Infections (CLABSIs) in Adult and
Pediatric Intensive Care Units, Tennessee, 01/01/2011–12/31/2011
Number of organisms = 416; number of events = 372

Tennessee’s Report on Healthcare-Associated Infections: January 2008–December 2011
37 of 128
Table 2: Microorganisms Identified in Central Line-Associated Bloodstream Infections (CLABSIs) in Adult and
Pediatric Intensive Care Units, Tennessee, 01/01/2011–12/31/2011
Number of organisms = 416; number of events = 372
Microorganism
Number of
Isolates Percent
Coagulase-negative Staphylococcus species 100 24.0
Candida species and other yeasts 96 23.1
Enterococcus species 54 13.0
Vancomycin-resistant Enterococcus (VRE) (% of total positive isolates)
15 (3.6)
Staphylococcus aureus 49 11.8
Methicillin-resistant S. aureus (MRSA) (% of total positive isolates)
31 (7.5)
Enterobacter species 23 5.5
Klebsiella species 18 4.3
Acinetobacter species 17 4.1
Pseudomonas species 12 2.9
Serratia species 8 1.9
Streptococcus species 8 1.9
Escherichia species 6 1.4
Pantoea species 4 1.0
Bacteroides species 2 0.5
Citrobacter species 2 0.5
Fusobacterium species 2 0.5
Other pathogens 15 3.6
Data reported as of January 4, 2013
Other pathogens = Agrobacterium spp., Bacillus spp., Clostridium subterminale, Morganella morganii, Paenibacillus polymyxa,
Peptostreptococcus asaccharolyticus, Proteus mirabilis, Providencia stuartii, Raoultella planticola, Salmonella spp., Sphingomonas
paucimobilis, coagulase-positive Staphylococcus, Stenotrophomonas maltophilia, Veillonella parvula, Xanthomonas spp.

Tennessee’s Report on Healthcare-Associated Infections: January 2008–December 2011
38 of 128
Table 3: Key Percentiles for Facility-Specific Central Line-Associated Bloodstream Infection (CLABSI) Standardized Infection Ratios (SIRs) in Adult
and Pediatric Intensive Care Units (ICUs) by Reporting Year, Excluding Burn and Trauma ICUs, Tennessee, 01/01/2008–12/31/2011
SIR, 95% CONFIDENCE INTERVAL, AND KEY PERCENTILES
STATE YEAR No. SIR LOWER
LIMIT UPPER LIMIT 10% 25% 50% 75% 90%
Tennessee
2011 92 0.72 0.64 0.81 0.00 0.00 0.25 0.90 1.71
2010 83 0.79 0.71 0.88 0.00 0.00 0.45 0.88 1.67
2009 79 1.16 1.06 1.27 0.00 0.00 0.70 1.38 2.40
2008 79 1.20 1.10 1.31 0.00 0.00 0.87 1.45 2.48
Data reported as of January 4, 2013
No . = number of facilities with reporting units; SIR = standardized infection ratio (observed/predicted number of CLABSI)
Red highlighting indicates SIR for reporting period is significantly higher than national 2006-2008 SIR of 1.0
Blue highlighting indicates SIR for reporting period is significantly lower than national 2006-2008 SIR of 1.0
Table 4: Key Percentiles for Facility-Specific Central Line-Associated Bloodstream Infection (CLABSI) Standardized Infection Ratios (SIRs) in Adult
and Pediatric Intensive Care Units (ICUs) by Reporting Year, Including Burn and Trauma ICUs, Tennessee, 01/01/2008–12/31/2011
SIR, 95% CONFIDENCE INTERVAL, AND KEY PERCENTILES
STATE YEAR No. SIR LOWER
LIMIT UPPER LIMIT 10% 25% 50% 75% 90%
Tennessee
2011 92 0.74 0.67 0.82 0.00 0.00 0.25 0.94 1.51
2010 83 0.83 0.75 0.92 0.00 0.00 0.45 0.88 1.67
2009 79 1.16 1.06 1.27 0.00 0.00 0.70 1.38 2.40
2008 79 1.20 1.10 1.31 0.00 0.00 0.87 1.45 2.48
Data reported as of January 4, 2013
Includes burn and trauma ICU data since July 2010
No . = number of facilities with reporting units; SIR = standardized infection ratio (observed/predicted number of CLABSI)
Red highlighting indicates SIR for reporting period is significantly higher than national 2006-2008 SIR of 1.0
Blue highlighting indicates SIR for reporting period is significantly lower than national 2006-2008 SIR of 1.0

Tennessee’s Report on Healthcare-Associated Infections: January 2008–December 2011
39 of 128
Table 5: Key Percentiles for Unit-Specific Central Line-Associated Bloodstream Infection (CLABSI) Standardized Infection Ratios (SIRs) by Type of
Intensive Care Unit (ICU) and Reporting Year, Tennessee, 01/01/2008–12/31/2011
SIR, 95% CONFIDENCE INTERVAL, AND KEY PERCENTILES
ICU TYPE YEAR No. SIR LOWER
LIMIT UPPER LIMIT 10% 25% 50% 75% 90%
Burn Critical Care 2011 2 1.09 0.68 1.65 NA NA NA NA NA
2010 2 1.91 1.17 2.96 NA NA NA NA NA
Medical Cardiac Critical Care
2011 8 0.85 0.54 1.27 0.00 0.30 0.73 1.14 1.71
2010 8 0.65 0.38 1.02 0.00 0.00 0.36 1.06 2.30
2009 9 1.27 0.95 1.66 0.00 0.00 1.20 1.56 2.41
2008 9 1.20 0.89 1.60 0.51 0.79 1.16 1.50 2.59
Medical Critical Care, Major Teaching
2011 4 0.41 0.23 0.68 NA NA NA NA NA
2010 4 1.20 0.83 1.66 NA NA NA NA NA
2009 2 2.73 1.98 3.68 NA NA NA NA NA
2008 2 1.89 1.28 2.70 NA NA NA NA NA
Medical Critical Care, Non-Major Teaching
2011 22 0.77 0.54 1.07 0.00 0.00 0.00 0.70 1.52
2010 20 0.71 0.49 0.99 0.00 0.00 0.42 1.05 1.41
2009 18 0.95 0.70 1.26 0.00 0.00 0.75 1.52 1.65
2008 17 0.79 0.56 1.08 0.00 0.17 0.49 1.17 2.68
Medical-Surgical Critical Care, Major Teaching
2011 5 0.68 0.42 1.05 0.00 0.13 0.54 0.82 1.84
2010 7 1.17 0.85 1.57 0.27 0.48 0.98 1.33 2.76
2009 7 1.62 1.27 2.03 0.31 0.62 1.43 2.21 3.55
2008 7 1.63 1.29 2.04 0.53 1.00 1.26 2.20 2.66
Medical-Surgical Critical Care, Non-Major Teaching & ≤15 beds
2011 39 0.94 0.62 1.38 0.00 0.00 0.00 0.00 2.77
2010 37 0.93 0.61 1.35 0.00 0.00 0.00 0.65 2.84
2009 34 1.03 0.70 1.45 0.00 0.00 0.00 1.14 3.69
2008 34 0.81 0.52 1.19 0.00 0.00 0.00 1.17 2.48

Tennessee’s Report on Healthcare-Associated Infections: January 2008–December 2011
40 of 128
SIR, 95% CONFIDENCE INTERVAL, AND KEY PERCENTILES
ICU TYPE YEAR No. SIR LOWER
LIMIT UPPER LIMIT 10% 25% 50% 75% 90%
Medical-Surgical Critical Care, Non-Major Teaching & >15 beds
2011 19 0.87 0.68 1.09 0.00 0.51 0.73 1.23 1.84
2010 19 0.88 0.69 1.11 0.00 0.41 0.68 1.01 2.37
2009 18 1.06 0.84 1.31 0.00 0.28 0.85 1.26 2.63
2008 18 1.28 1.04 1.56 0.00 0.30 1.13 1.70 2.91
Neurological Critical Care 2011 1 0.52 0.01 2.91 NA NA NA NA NA
Neurosurgical Critical Care
2011 7 0.39 0.20 0.70 0.00 0.00 0.23 0.67 1.85
2010 7 0.63 0.38 0.99 0.00 0.24 0.42 1.09 1.11
2009 7 0.78 0.50 1.16 0.00 0.43 0.83 1.13 1.80
2008 7 1.06 0.71 1.51 0.00 0.35 0.91 1.10 2.28
Pediatric Medical Critical Care
2011 2 2.37 0.77 5.53 NA NA NA NA NA
2010 1 1.69 0.35 4.94 NA NA NA NA NA
2009 1 2.02 0.66 4.71 NA NA NA NA NA
2008 1 1.08 0.13 3.89 NA NA NA NA NA
Pediatric Medical-Surgical Critical Care
2011 7 0.46 0.27 0.75 0.00 0.00 0.21 0.99 0.99
2010 7 0.50 0.30 0.79 0.00 0.00 0.48 0.56 1.39
2009 6 1.02 0.73 1.40 0.10 0.92 0.92 1.52 2.36
2008 6 1.16 0.83 1.58 0.86 0.95 1.06 1.42 2.00
Pediatric Surgical Cardiothoracic Critical Care
2011 1 2.34 1.21 4.09 NA NA NA NA NA
2010 2 0.98 0.47 1.81 NA NA NA NA NA
2009 1 0.91 0.25 2.33 NA NA NA NA NA
Surgical Cardiothoracic Critical Care
2011 15 0.80 0.56 1.10 0.00 0.00 0.69 1.17 1.45
2010 15 0.76 0.52 1.06 0.00 0.00 0.55 1.10 1.33
2009 14 1.12 0.81 1.50 0.00 0.53 0.74 1.38 1.91
2008 14 1.30 0.97 1.73 0.00 0.56 1.03 1.31 2.15
Surgical Critical Care 2011 11 0.57 0.39 0.81 0.23 0.30 0.36 0.92 1.44

Tennessee’s Report on Healthcare-Associated Infections: January 2008–December 2011
41 of 128
SIR, 95% CONFIDENCE INTERVAL, AND KEY PERCENTILES
ICU TYPE YEAR No. SIR LOWER
LIMIT UPPER LIMIT 10% 25% 50% 75% 90%
Surgical Critical Care
2010 11 0.49 0.32 0.72 0.00 0.00 0.31 0.59 0.84
2009 11 1.00 0.74 1.31 0.00 0.35 0.89 1.52 1.76
2008 10 1.13 0.85 1.48 0.00 0.75 0.88 1.10 1.89
Trauma Critical Care 2011 6 0.74 0.53 0.99 0.22 0.43 0.47 0.72 1.31
2010 6 0.99 0.67 1.40 0.00 0.47 0.94 1.12 1.47
Data reported as of January 4, 2013
Burn and trauma ICU data available since July 2010
No. = number of facilities with reporting units; SIR = Standardized Infection Ratio (observed/predicted number of CLABSI)
NA = not reported if the number of facilities is <5
Red highlighting indicates SIR for reporting period is significantly higher than national 2006-2008 SIR of 1.0
Blue highlighting indicates SIR for reporting period is significantly lower than national 2006-2008 SIR of 1.0

Tennessee’s Report on Healthcare-Associated Infections: January 2008–December 2011
42 of 128
Table 6: Comparison of Tennessee and National Healthcare Safety Network (NHSN) Central Line-Associated Bloodstream Infection (CLABSI) Rates
and Standardized Infection Ratios (SIRs) by Type of Intensive Care Unit (ICU), 01/01/2011–12/31/2011
TENNESSEE 01/01/2011 - 12/31/2011 NHSN 2006-2008
SIR AND 95% CONFIDENCE
INTERVAL
ICU TYPE No. CLABSI CL
DAYS POOLED MEAN*
MEDIAN RATE* CLABSI
CL DAYS
POOLED MEAN*
MEDIAN RATE* SIR
LOWER LIMIT
UPPER LIMIT
Burn Critical Care 2 22 3670 6.0 7.4 390 70932 5.5 3.1 1.09 0.68 1.65
Medical Cardiac Critical Care 8 23 13504 1.7 1.5 876 436409 2.0 1.3 0.85 0.54 1.27
Medical Critical Care, Major Teaching 4 15 14201 1.1 1.2 1410 549088 2.6 2.3 0.41 0.23 0.68
Medical Critical Care, Non-Major Teaching 22 35 23894 1.5 0.0 687 362388 1.9 1.0 0.77 0.54 1.07
Medical-Surgical Critical Care, Major Teaching 5 20 13921 1.4 1.1 1474 699300 2.1 1.7 0.68 0.42 1.05
Medical-Surgical Critical Care, Non-Major Teaching & ≤15 beds 39 26 18442 1.4 0.0 1130 755437 1.5 0.0 0.94 0.62 1.38
Medical-Surgical Critical Care, Non-Major Teaching & >15 beds 19 75 58943 1.3 1.1 1449 986982 1.5 1.1 0.87 0.68 1.09
Neurological Critical Care 1 1 1418 0.7 NA 61 45153 1.4 1.0 0.52 0.01 2.91
Neurosurgical Critical Care 7 11 11403 1.0 0.6 396 160879 2.5 1.9 0.39 0.20 0.70
Pediatric Medical Critical Care 2 5 1590 3.1 1.6 23 17321 1.3 NA 2.37 0.77 5.53
Pediatric Medical-Surgical Critical Care 7 16 11724 1.4 0.6 923 314306 3.0 2.5 0.46 0.27 0.75
Pediatric Surgical Cardiothoracic Critical Care 1 12 1539 7.8 NA 195 58626 3.3 NA 2.34 1.21 4.09
Surgical Cardiothoracic Critical Care 15 37 33268 1.1 1.0 879 632769 1.4 0.8 0.80 0.56 1.10
Surgical Critical Care 11 31 23667 1.3 0.8 1683 729989 2.3 1.7 0.57 0.39 0.81
Trauma Critical Care 6 43 16096 2.7 1.7 814 224864 3.6 3.0 0.74 0.53 0.99
TOTAL 0.74 0.67 0.82
Data reported as of January 4, 2013
No. = number of facilities
CLDays = Central Line Days
SIR = Standardized Infection Ratio (observed/predicted number of CLABSI)
NA = not available
*per 1000 central line days
Red highlighting indicates SIR for reporting period is significantly higher than national 2006-2008 SIR of 1.0
Blue highlighting indicates SIR for reporting period is significantly lower than national 2006-2008 SIR of 1.0

Tennessee’s Report on Healthcare-Associated Infections: January 2008–December 2011
43 of 128
Table 7: Comparison of Tennessee Central Line-Associated Bloodstream Infection (CLABSI) Standardized Infection Ratios (SIRs) by Type of Intensive
Care Unit (ICU) and Six-Month Period [Data shown for most recent two years: 01/01/2010–12/31/2011]
Jan-Jun 2010
SIR AND 95%
CONFIDENCE INTERVAL
Jul-Dec 2010
SIR AND 95%
CONFIDENCE INTERVAL
Jan-Jun 2011
SIR AND 95%
CONFIDENCE INTERVAL
Jul-Dec 2011
SIR AND 95%
CONFIDENCE INTERVAL
ICU TYPE SIR LOWER
LIMIT UPPER LIMIT SIR
LOWER LIMIT
UPPER LIMIT SIR
LOWER LIMIT
UPPER LIMIT SIR
LOWER LIMIT
UPPER LIMIT
Burn Critical Care NA NA NA 1.91 1.17 2.96 1.60 0.93 2.56 0.52 0.17 1.22
Medical Cardiac Critical Care 0.75 0.38 1.35 0.53 0.21 1.09 0.70 0.33 1.28 1.02 0.54 1.74
Medical Critical Care, Major Teaching 1.72 1.05 2.66 0.85 0.48 1.40 0.52 0.25 0.96 0.29 0.09 0.68
Medical Critical Care, Non-Major Teaching 0.87 0.54 1.31 0.53 0.27 0.93 0.83 0.50 1.29 0.71 0.41 1.16
Medical-Surgical Critical Care, Major Teaching 1.21 0.80 1.77 1.10 0.64 1.77 0.74 0.37 1.33 0.62 0.28 1.18
Medical-Surgical Critical Care, Non-Major Teaching & ≤15 beds 1.13 0.68 1.77 0.65 0.28 1.28 0.50 0.20 1.02 1.41 0.85 2.20
Medical-Surgical Critical Care, Non-Major Teaching & >15 beds 0.88 0.61 1.22 0.88 0.62 1.21 0.92 0.66 1.25 0.81 0.56 1.13
Neurological Critical Care NA NA NA NA NA NA 0.00 0.00 3.99 1.01 0.03 5.62
Neurosurgical Critical Care 0.99 0.55 1.63 0.27 0.07 0.69 0.36 0.12 0.84 0.42 0.16 0.92
Pediatric Medical Critical Care 0.00 0.00 3.92 3.60 0.74 10.5 1.02 0.03 5.69 3.54 0.96 9.05
Pediatric Medical-Surgical Critical Care 0.54 0.23 1.06 0.47 0.23 0.87 0.27 0.09 0.63 0.70 0.35 1.25
Pediatric Surgical Cardiothoracic Critical Care 1.09 0.50 2.07 0.52 0.01 2.92 0.98 0.12 3.53 3.26 1.56 5.99
Surgical Cardiothoracic Critical Care 0.78 0.46 1.23 0.73 0.42 1.19 0.99 0.63 1.49 0.61 0.33 1.02
Surgical Critical Care 0.54 0.30 0.89 0.44 0.22 0.78 0.64 0.39 1.00 0.48 0.25 0.84
Trauma Critical Care NA NA NA 0.99 0.67 1.40 1.01 0.68 1.44 0.46 0.24 0.78
TOTAL 0.90 0.78 1.04 0.77 0.66 0.88 0.77 0.67 0.89 0.71 0.60 0.82
Data reported as of January 4, 2013
Burn and trauma ICU data available since July 2010; without burn and trauma ICUs, the SIRs and 95% confidence intervals for Jul-Dec 2010, Jan-Jun 2011, and Jul-Dec 2011 are 0.67 (0.57-
0.80), 0.70 (0.59-0.82), and 0.75 (0.64-0.88), respectively
SIR = Standardized Infection Ratio (observed/predicted number of CLABSI)
NA = not available
Red highlighting indicates SIR for reporting period is significantly higher than national 2006-2008 SIR of 1.0
Blue highlighting indicates SIR for reporting period is significantly lower than national 2006-2008 SIR of 1.0

Tennessee’s Report on Healthcare-Associated Infections: January 2008–December 2011
44 of 128
Figure 8: CLABSI Standardized Infection Ratio (SIR) for Adult and Pediatric Intensive Care Units in Facilities
with ≥1 Predicted CLABSI, Excluding Burn and Trauma ICUs, Tennessee, 01/01/2011–12/31/2011
NH
SN
SIR

Tennessee’s Report on Healthcare-Associated Infections: January 2008–December 2011
45 of 128
Figure 8 (cont’d)
NH
SN
SIR

Tennessee’s Report on Healthcare-Associated Infections: January 2008–December 2011
46 of 128
Figure 9: CLABSI Standardized Infection Ratio (SIR) for Adult and Pediatric Intensive Care Units in Facilities
with <1 Predicted CLABSI, Excluding Burn and Trauma ICUs, Tennessee, 01/01/2011–12/31/2011
NH
SN
SIR
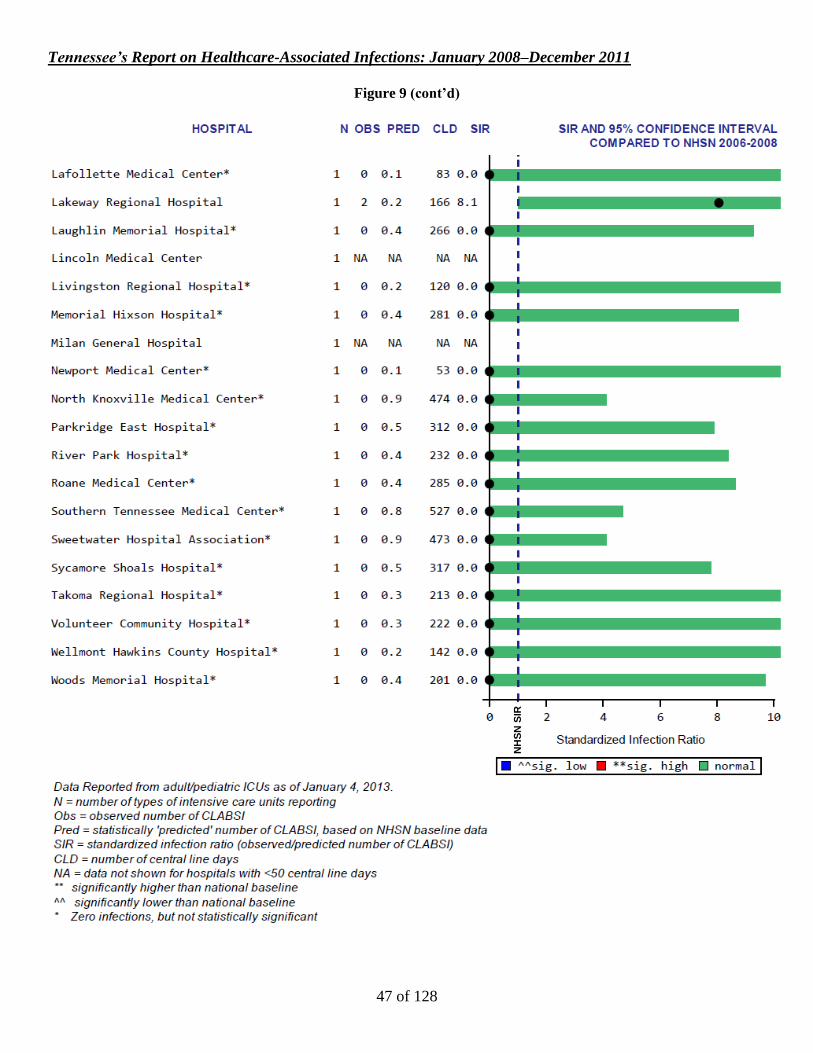
Tennessee’s Report on Healthcare-Associated Infections: January 2008–December 2011
47 of 128
Figure 9 (cont’d)
NH
SN
SIR

Tennessee’s Report on Healthcare-Associated Infections: January 2008–December 2011
48 of 128
Figure 10: CLABSI Standardized Infection Ratio (SIR) for Adult and Pediatric Intensive Care Units by Year,
Excluding Burn and Trauma ICUs, Tennessee, 01/01/2008–12/31/2011
NH
SN
SIR
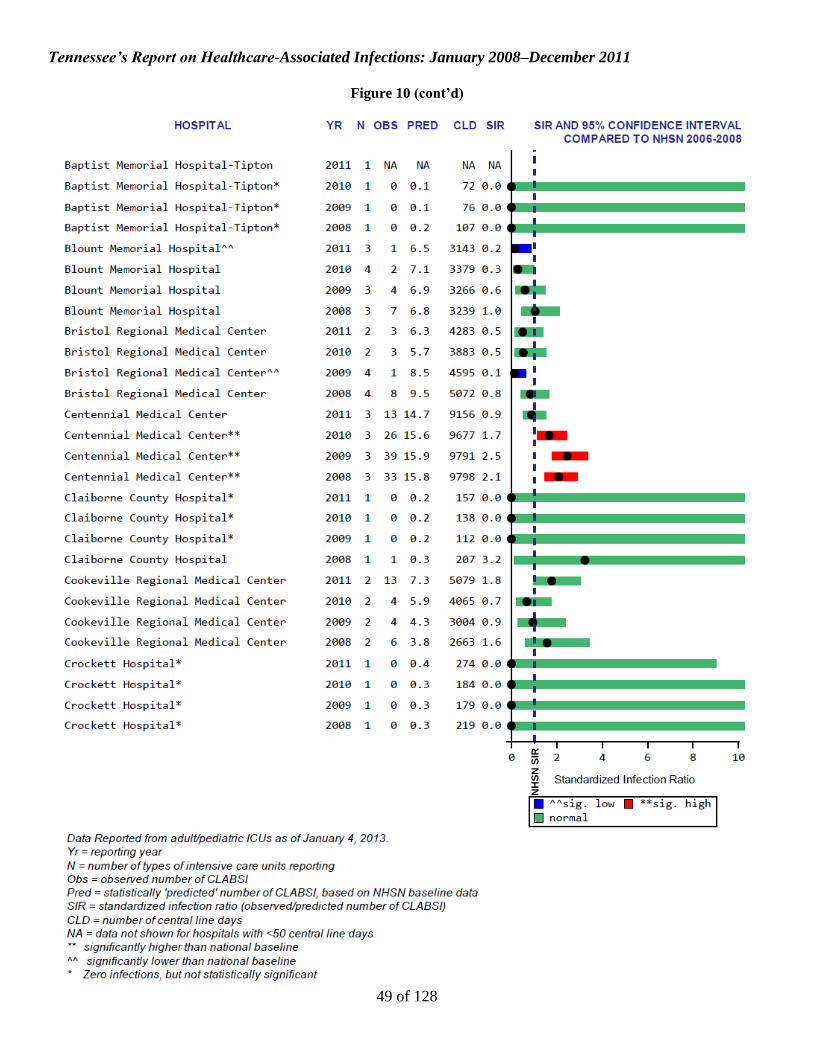
Tennessee’s Report on Healthcare-Associated Infections: January 2008–December 2011
49 of 128
Figure 10 (cont’d)
NH
SN
SIR

Tennessee’s Report on Healthcare-Associated Infections: January 2008–December 2011
50 of 128
Figure 10 (cont’d)
NH
SN
SIR

Tennessee’s Report on Healthcare-Associated Infections: January 2008–December 2011
51 of 128
Figure 10 (cont’d)
NH
SN
SIR

Tennessee’s Report on Healthcare-Associated Infections: January 2008–December 2011
52 of 128
Figure 10 (cont’d)
NH
SN
SIR

Tennessee’s Report on Healthcare-Associated Infections: January 2008–December 2011
53 of 128
Figure 10 (cont’d)
NH
SN
SIR

Tennessee’s Report on Healthcare-Associated Infections: January 2008–December 2011
54 of 128
Figure 10 (cont’d)
NH
SN
SIR

Tennessee’s Report on Healthcare-Associated Infections: January 2008–December 2011
55 of 128
Figure 10 (cont’d)
NH
SN
SIR

Tennessee’s Report on Healthcare-Associated Infections: January 2008–December 2011
56 of 128
Figure 10 (cont’d)
NH
SN
SIR

Tennessee’s Report on Healthcare-Associated Infections: January 2008–December 2011
57 of 128
Figure 10 (cont’d)
NH
SN
SIR

Tennessee’s Report on Healthcare-Associated Infections: January 2008–December 2011
58 of 128
Figure 10 (cont’d)
NH
SN
SIR

Tennessee’s Report on Healthcare-Associated Infections: January 2008–December 2011
59 of 128
Figure 10 (cont’d)
NH
SN
SIR
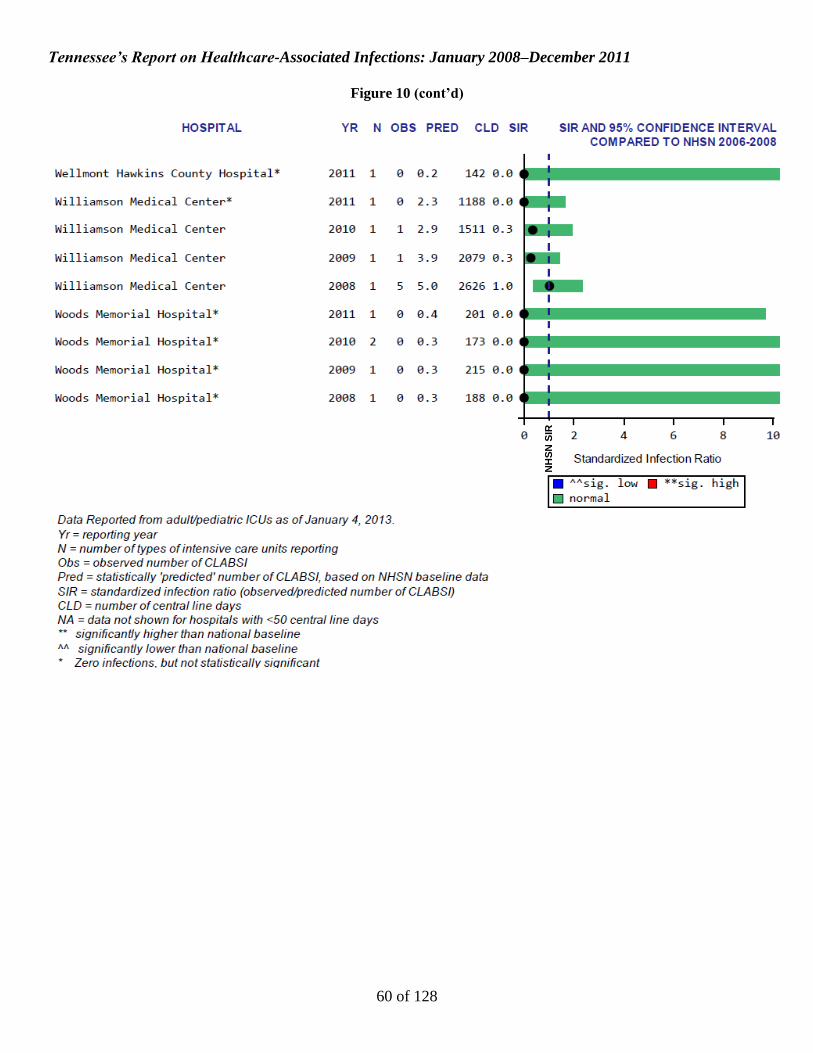
Tennessee’s Report on Healthcare-Associated Infections: January 2008–December 2011
60 of 128
Figure 10 (cont’d)
NH
SN
SIR

Tennessee’s Report on Healthcare-Associated Infections: January 2008–December 2011
61 of 128
Figure 11: Central Line-Associated Bloodstream Infection Rates per 1,000 Central Line Days in Tennessee,
01/01/2011–12/31/2011, Medical Cardiac Critical Care Units
TN
Mean
NH
SN
Me
an

Tennessee’s Report on Healthcare-Associated Infections: January 2008–December 2011
62 of 128
Figure 12: Central Line-Associated Bloodstream Infection Rates per 1,000 Central Line Days in Tennessee, 01/01/2011–12/31/2011, Medical Critical Care Units in Major Teaching Hospitals
TN
Mean
NH
SN
Me
an

Tennessee’s Report on Healthcare-Associated Infections: January 2008–December 2011
63 of 128
Figure 13: Central Line-Associated Bloodstream Infection Rates per 1,000 Central Line Days in Tennessee,
01/01/2011–12/31/2011, Medical Critical Care Units in Non-Major Teaching Hospitals
TN
Mean
NH
SN
Me
an

Tennessee’s Report on Healthcare-Associated Infections: January 2008–December 2011
64 of 128
Figure 14: Central Line-Associated Bloodstream Infection Rates per 1,000 Central Line Days in Tennessee,
01/01/2011–12/31/2011, Medical-Surgical Critical Care Units in Major Teaching Hospitals
TN
Mean
NH
SN
Me
an

Tennessee’s Report on Healthcare-Associated Infections: January 2008–December 2011
65 of 128
Figure 15: Central Line-Associated Bloodstream Infection Rates per 1,000 Central Line Days in Tennessee,
01/01/2011–12/31/2011, Medical-Surgical ICUs with ≤15 beds in Non-Major Teaching Hospitals
TN
Mean
N
HS
N M
ean

Tennessee’s Report on Healthcare-Associated Infections: January 2008–December 2011
66 of 128
Figure 15 (cont’d)
TN
Mean
NH
SN
Me
an

Tennessee’s Report on Healthcare-Associated Infections: January 2008–December 2011
67 of 128
Figure 16: Central Line-Associated Bloodstream Infection Rates per 1,000 Central Line Days in Tennessee, 01/01/2011–12/31/2011, Medical-Surgical ICUs with >15 beds in Non-Major Teaching Hospitals
TN
Mean
NH
SN
Me
an

Tennessee’s Report on Healthcare-Associated Infections: January 2008–December 2011
68 of 128
Figure 17: Central Line-Associated Bloodstream Infection Rates per 1,000 Central Line Days in Tennessee, 01/01/2011–12/31/2011, Neurological Critical Care Units
TN
Mean
NH
SN
Me
an

Tennessee’s Report on Healthcare-Associated Infections: January 2008–December 2011
69 of 128
Figure 18: Central Line-Associated Bloodstream Infection Rates per 1,000 Central Line Days in Tennessee, 01/01/2011–12/31/2011, Neurosurgical Critical Care Units
TN
Mean
N
HS
N M
ean
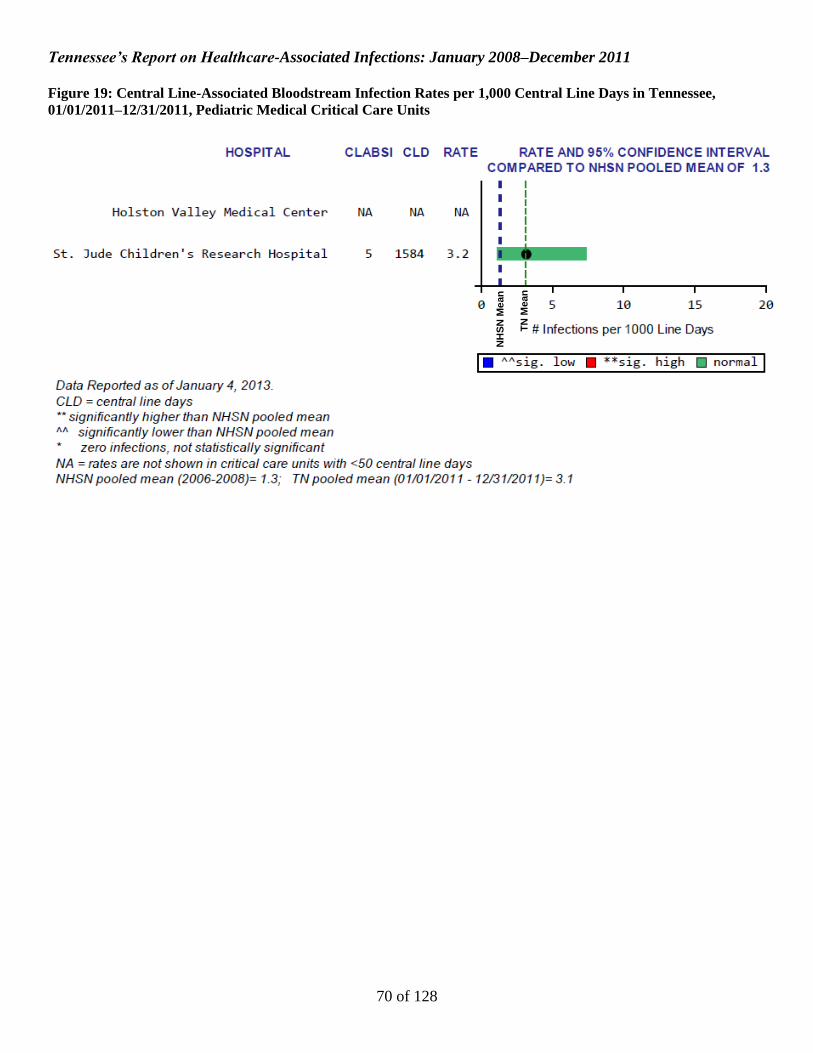
Tennessee’s Report on Healthcare-Associated Infections: January 2008–December 2011
70 of 128
Figure 19: Central Line-Associated Bloodstream Infection Rates per 1,000 Central Line Days in Tennessee,
01/01/2011–12/31/2011, Pediatric Medical Critical Care Units
NH
SN
Me
an
TN
Mean
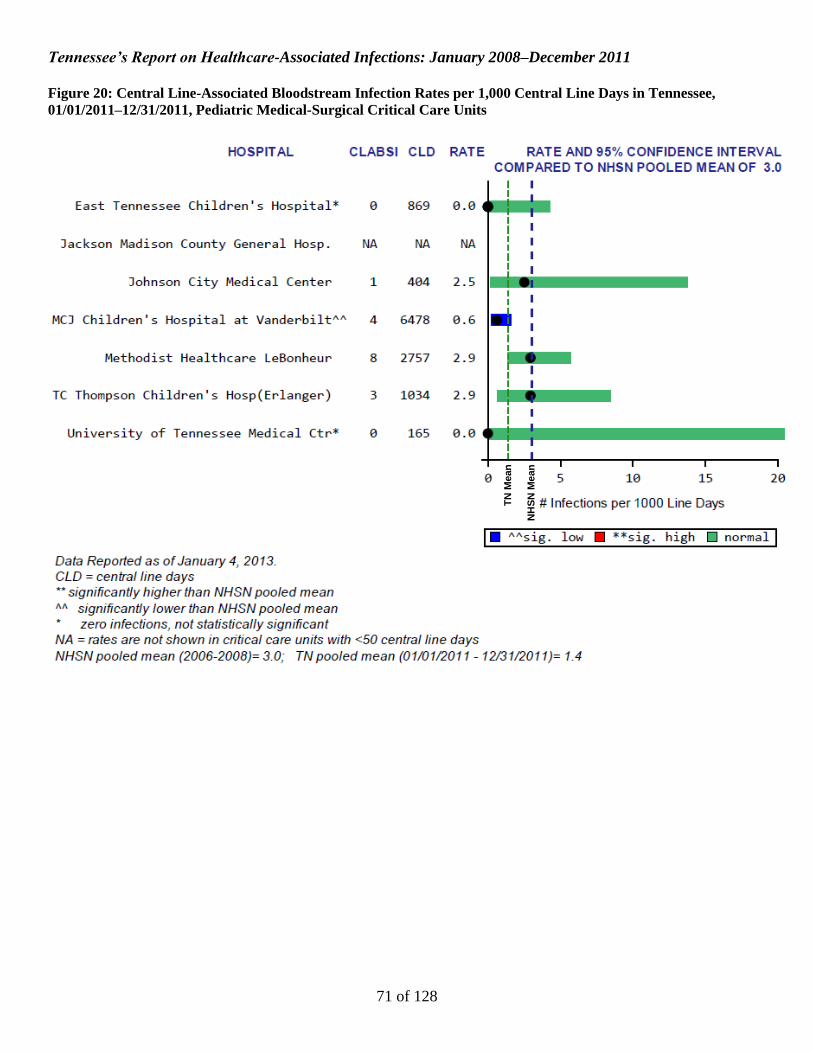
Tennessee’s Report on Healthcare-Associated Infections: January 2008–December 2011
71 of 128
Figure 20: Central Line-Associated Bloodstream Infection Rates per 1,000 Central Line Days in Tennessee,
01/01/2011–12/31/2011, Pediatric Medical-Surgical Critical Care Units
TN
Mean
N
HS
N M
ean

Tennessee’s Report on Healthcare-Associated Infections: January 2008–December 2011
72 of 128
Figure 21: Central Line-Associated Bloodstream Infection Rates per 1,000 Central Line Days in Tennessee,
01/01/2011–12/31/2011, Surgical Cardiothoracic Critical Care Units
TN
Mean
NH
SN
Me
an

Tennessee’s Report on Healthcare-Associated Infections: January 2008–December 2011
73 of 128
Figure 22: Central Line-Associated Bloodstream Infection Rates per 1,000 Central Line Days in Tennessee,
01/01/2011–12/31/2011, Pediatric Surgical Cardiothoracic Critical Care Units
NHSN Mean TN Mean

Tennessee’s Report on Healthcare-Associated Infections: January 2008–December 2011
74 of 128
Figure 23: Central Line-Associated Bloodstream Infection Rates per 1,000 Central Line Days in Tennessee,
01/01/2011–12/31/2011, Surgical Critical Care Units
TN
Mean
NH
SN
Me
an

Tennessee’s Report on Healthcare-Associated Infections: January 2008–December 2011
75 of 128
CLABSI Figures and Tables
Neonatal Critical Care Units

Tennessee’s Report on Healthcare-Associated Infections: January 2008–December 2011
76 of 128
Figure 24: Central Line-Associated Bloodstream Infection (CLABSI) Pooled Mean Rates per 1,000 Central Line Days in Level III Neonatal Intensive
Care Units by Birth Weight Category, Tennessee, 2010 and 2011, vs. National Healthcare Safety Network (NHSN), 2006-8
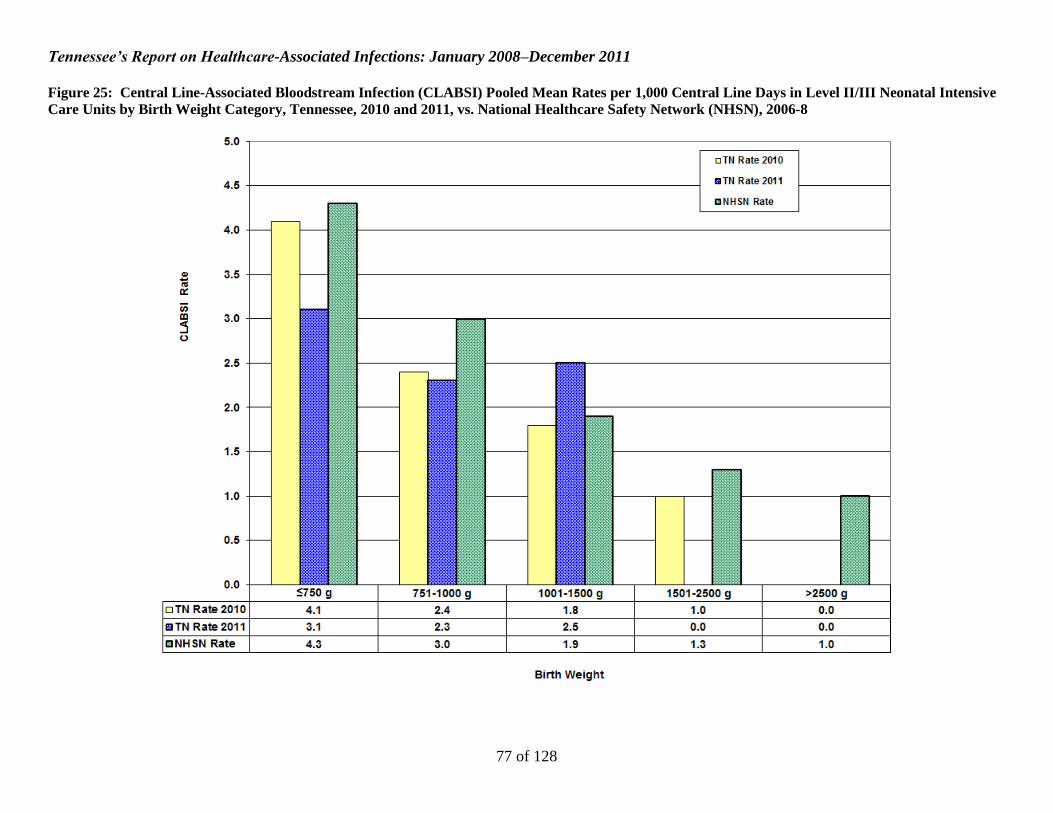
Tennessee’s Report on Healthcare-Associated Infections: January 2008–December 2011
77 of 128
Figure 25: Central Line-Associated Bloodstream Infection (CLABSI) Pooled Mean Rates per 1,000 Central Line Days in Level II/III Neonatal Intensive
Care Units by Birth Weight Category, Tennessee, 2010 and 2011, vs. National Healthcare Safety Network (NHSN), 2006-8

Tennessee’s Report on Healthcare-Associated Infections: January 2008–December 2011
78 of 128
Figure 26: Central Line Utilization Ratios in Level III Neonatal Intensive Care Units (NICUs), Tennessee, 2010 and 2011, vs. National Healthcare Safety
Network (NHSN), 2006-8

Tennessee’s Report on Healthcare-Associated Infections: January 2008–December 2011
79 of 128
Figure 27: Central Line Utilization Ratios in Level II/III Neonatal Intensive Care Units (NICUs), Tennessee, 2010 and 2011, vs. National Healthcare
Safety Network (NHSN), 2006-8

Tennessee’s Report on Healthcare-Associated Infections: January 2008–December 2011
80 of 128
Figure 28: Central Line-Associated Bloodstream Infection (CLABSI) Standardized Infection Ratios (SIRs) for Neonatal Intensive Care Units (NICUs) by
Quarter, Tennessee, 07/01/2008–12/31/2011 [Reference standard: National Healthcare Safety Network (NHSN), 2006-8]

Tennessee’s Report on Healthcare-Associated Infections: January 2008–December 2011
81 of 128
Figure 29: Organisms Isolated from Central Line-Associated Bloodstream Infections (CLABSIs) in Neonatal
Intensive Care Units, Tennessee, 01/01/2011–12/31/2011
Number of organisms = 73; number of events: 66
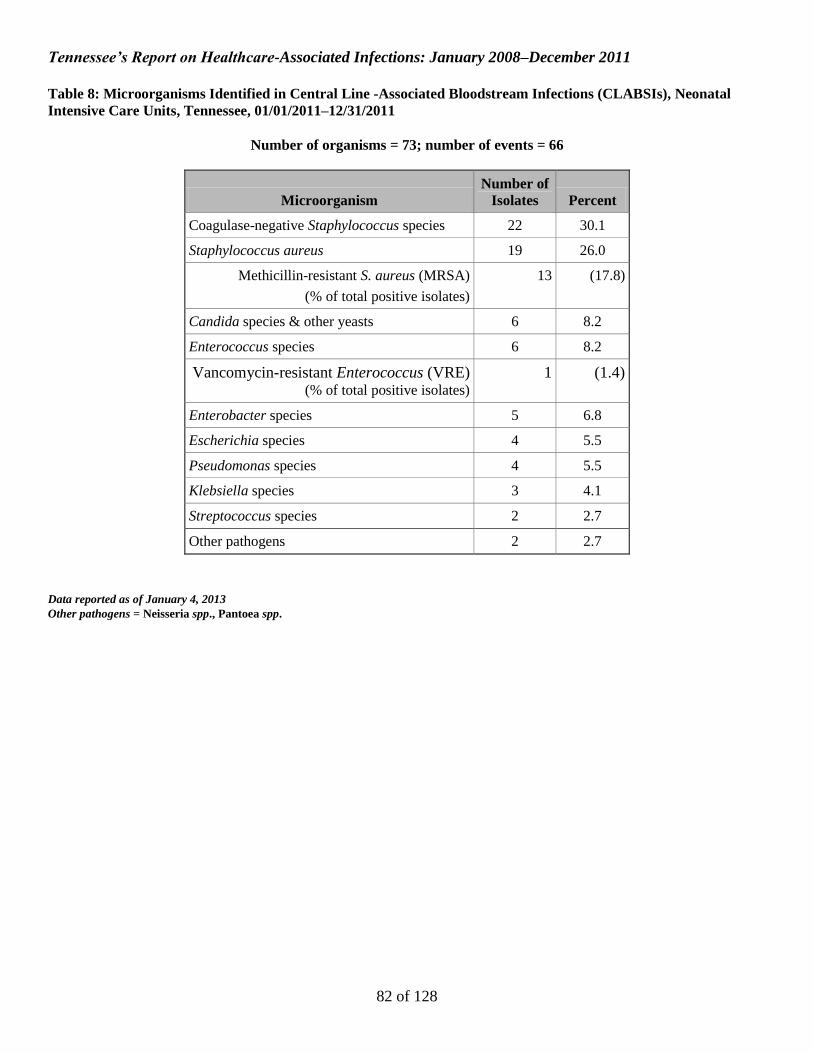
Tennessee’s Report on Healthcare-Associated Infections: January 2008–December 2011
82 of 128
Table 8: Microorganisms Identified in Central Line -Associated Bloodstream Infections (CLABSIs), Neonatal
Intensive Care Units, Tennessee, 01/01/2011–12/31/2011
Number of organisms = 73; number of events = 66
Microorganism
Number of
Isolates Percent
Coagulase-negative Staphylococcus species 22 30.1
Staphylococcus aureus 19 26.0
Methicillin-resistant S. aureus (MRSA)
(% of total positive isolates)
13 (17.8)
Candida species & other yeasts 6 8.2
Enterococcus species 6 8.2
Vancomycin-resistant Enterococcus (VRE) (% of total positive isolates)
1 (1.4)
Enterobacter species 5 6.8
Escherichia species 4 5.5
Pseudomonas species 4 5.5
Klebsiella species 3 4.1
Streptococcus species 2 2.7
Other pathogens 2 2.7
Data reported as of January 4, 2013
Other pathogens = Neisseria spp., Pantoea spp.

Tennessee’s Report on Healthcare-Associated Infections: January 2008–December 2011
83 of 128
Table 9: Key Percentiles for Facility-Specific Central Line-Associated Bloodstream Infection (CLABSI) Standardized Infection Ratios (SIRs) in Neonatal
Intensive Care Units (NICUs), by Reporting Year, Tennessee, 07/01/2008–12/31/2011
SIR, 95% CONFIDENCE INTERVAL, AND KEY PERCENTILES
STATE YEAR No. SIR LOWER
LIMIT UPPER LIMIT 10% 25% 50% 75% 90%
Tennessee
2011 24 0.62 0.48 0.79 0.00 0.00 0.21 0.74 0.94
2010 24 0.69 0.54 0.86 0.00 0.00 0.39 0.93 1.24
2009 25 1.01 0.84 1.21 0.00 0.00 0.00 0.85 2.20
2008 25 1.51 1.22 1.85 0.00 0.00 0.69 1.68 2.49
Data reported as of January 4, 2013
No . = number of facilities; SIR = Standardized Infection Ratio (observed/predicted number of CLABSI)
Red highlighting indicates SIR for reporting period is significantly higher than national 2006-2008 SIR of 1.0
Blue highlighting indicates SIR for reporting period is significantly lower than national 2006-2008 SIR of 1.0
Table 10: Key Percentiles for Unit-Specific Central Line-Associated Bloodstream Infection (CLABSI) Standardized Infection Ratios (SIRs) by NICU
Type and Reporting Year, Tennessee, 07/01/2008–12/31/2011
SIR, 95% CONFIDENCE INTERVAL, AND KEY PERCENTILES
ICU TYPE YEAR No. SIR LOWER
LIMIT UPPER LIMIT 10% 25% 50% 75% 90%
Neonatal ICU Level III
2011 7 0.61 0.45 0.81 0.18 0.24 0.73 0.94 1.47
2010 7 0.64 0.47 0.84 0.35 0.45 0.57 1.24 1.26
2009 7 0.93 0.74 1.16 0.00 0.34 0.73 1.39 2.31
2008 8 1.38 1.04 1.79 0.00 0.34 0.94 1.61 1.91
Neonatal ICU Level II/III
2011 17 0.65 0.40 1.00 0.00 0.00 0.00 0.53 0.88
2010 17 0.80 0.52 1.18 0.00 0.00 0.00 0.60 1.08
2009 18 1.23 0.89 1.67 0.00 0.00 0.00 0.60 2.20
2008 17 1.79 1.25 2.49 0.00 0.00 0.00 1.68 2.51
Data reported as of January 4, 2013
No . = number of facilities; SIR = Standardized Infection Ratio (observed/predicted number of CLABSI)
Red highlighting indicates SIR for reporting period is significantly higher than national 2006-2008 SIR of 1.0
Blue highlighting indicates SIR for reporting period is significantly lower than national 2006-2008 SIR of 1.0

Tennessee’s Report on Healthcare-Associated Infections: January 2008–December 2011
84 of 128
Table 11: Comparison of Tennessee and National Healthcare Safety Network (NHSN) Central Line-Associated Bloodstream Infection (CLABSI) Rates
and Standardized Infection Ratios (SIRs) by Type of Neonatal Intensive Care Unit (NICU), Tennessee 01/01/2011–12/31/2011
TENNESSEE 01/01/2011 - 12/31/2011 NHSN 2006-2008 SIR AND 95% CONFIDENCE
INTERVAL
ICU TYPE Birth Weight Category No. CLABSI CL
DAYS POOLED MEAN*
MEDIAN RATE* CLABSI
CL DAYS
POOLED MEAN* SIR
LOWER LIMIT
UPPER LIMIT
Neonatal ICU Level III
≤750 grams 7 20 8478 2.4 2.5 559 155220 3.6 0.66 0.40 1.01
751-1000 grams 7 12 4887 2.5 1.6 413 140785 2.9 0.84 0.43 1.46
1001-1500 grams 7 7 5668 1.2 1.0 306 147305 2.1 0.59 0.24 1.22
1501-2500 grams 7 3 5725 0.5 0.0 223 122883 1.8 0.29 0.06 0.84
>2500 grams 7 4 6404 0.6 0.0 170 128245 1.3 0.47 0.13 1.21
TOTAL 0.61 0.45 0.81
Neonatal ICU Level II/III
≤750 grams 17 7 2284 3.1 0.0 329 77283 4.3 0.72 0.29 1.48
751-1000 grams 17 5 2213 2.3 0.0 199 65801 3.0 0.75 0.24 1.74
1001-1500 grams 17 8 3240 2.5 0.0 145 78352 1.9 1.33 0.58 2.63
1501-2500 grams 17 0 3720 0.0 0.0 82 62268 1.3 0.00 0.00 0.75
>2500 grams 17 0 3607 0.0 0.0 65 65559 1.0 0.00 0.00 1.03
TOTAL 0.65 0.40 1.00
TOTAL 0.62 0.48 0.79
Data reported as of January 4, 2013
No. = number of facilities
CLDays = Central Line Days
SIR = Standardized Infection Ratio (observed/predicted number of CLABSI)
*per 1000 central line days
Red highlighting indicates SIR for reporting period is significantly higher than national 2006-2008 SIR of 1.0
Blue highlighting indicates SIR for reporting period is significantly lower than national 2006-2008 SIR of 1.0

Tennessee’s Report on Healthcare-Associated Infections: January 2008–December 2011
85 of 128
Table 12: Comparison of Tennessee Central Line-Associated Bloodstream Infection (CLABSI) Standardized Infection Ratios (SIRs) by NICU Type and
Six-Month Period [Data shown for most recent two years: 01/01/2010–12/31/2011]
Jan-Jun 2010
SIR AND 95%
CONFIDENCE INTERVAL
Jul-Dec 2010
SIR AND 95%
CONFIDENCE INTERVAL
Jan-Jun 2011
SIR AND 95%
CONFIDENCE INTERVAL
Jul-Dec 2011
SIR AND 95%
CONFIDENCE INTERVAL
ICU TYPE SIR LOWER
LIMIT UPPER LIMIT SIR
LOWER LIMIT
UPPER LIMIT SIR
LOWER LIMIT
UPPER LIMIT SIR
LOWER LIMIT
UPPER LIMIT
Neonatal ICU Level III
≤750 grams 0.77 0.33 1.52 0.89 0.44 1.59 0.90 0.49 1.51 0.40 0.15 0.87
751-1000 grams 0.47 0.13 1.21 0.60 0.22 1.31 0.43 0.09 1.24 1.24 0.57 2.35
1001-1500 grams 1.28 0.55 2.52 0.39 0.08 1.15 0.17 0.00 0.94 1.03 0.38 2.24
1501-2500 grams 0.48 0.10 1.39 0.54 0.11 1.59 0.17 0.00 0.95 0.44 0.05 1.59
>2500 grams 0.00 0.00 0.93 0.43 0.05 1.55 0.00 0.00 0.97 0.85 0.23 2.18
TOTAL 0.65 0.41 0.98 0.62 0.40 0.92 0.50 0.30 0.78 0.72 0.48 1.05
Neonatal ICU Level II/III
≤750 grams 1.20 0.44 2.61 0.68 0.14 1.98 0.86 0.24 2.21 0.59 0.12 1.72
751-1000 grams 0.99 0.32 2.30 0.54 0.07 1.95 0.24 0.01 1.34 1.57 0.43 4.03
1001-1500 grams 1.57 0.58 3.41 0.29 0.01 1.61 1.35 0.37 3.47 1.31 0.36 3.37
1501-2500 grams 1.51 0.31 4.41 0.00 0.00 1.96 0.00 0.00 1.61 0.00 0.00 1.41
>2500 grams 0.00 0.00 2.24 0.00 0.00 2.60 0.00 0.00 2.48 0.00 0.00 1.76
TOTAL 1.14 0.70 1.76 0.40 0.15 0.88 0.58 0.27 1.10 0.72 0.36 1.28
TOTAL 0.81 0.59 1.10 0.56 0.38 0.80 0.52 0.35 0.75 0.72 0.51 0.99
Data reported as of January 4, 2013
SIR = Standardized Infection Ratio (observed/predicted number of CLABSI)
Red highlighting indicates SIR for reporting period is significantly higher than national 2006-2008 SIR of 1.0
Blue highlighting indicates SIR for reporting period is significantly lower than national 2006-2008 SIR of 1.0

Tennessee’s Report on Healthcare-Associated Infections: January 2008–December 2011
86 of 128
Figure 30: CLABSI Standardized Infection Ratio (SIR) for Neonatal Intensive Care Units in Facilities with ≥1
Predicted CLABSI, Tennessee, 01/01/2011–12/31/2011
NH
SN
SIR

Tennessee’s Report on Healthcare-Associated Infections: January 2008–December 2011
87 of 128
Figure 31: CLABSI Standardized Infection Ratio (SIR) for Neonatal Intensive Care Units in Facilities with <1
Predicted CLABSI, Tennessee, 01/01/2011–12/31/2011
NH
SN
SIR

Tennessee’s Report on Healthcare-Associated Infections: January 2008–December 2011
88 of 128
Figure 32: CLABSI Standardized Infection Ratio (SIR) for Neonatal Intensive Care Units by Year, Tennessee,
01/01/2008–12/31/2011
NH
SN
SIR

Tennessee’s Report on Healthcare-Associated Infections: January 2008–December 2011
89 of 128
Figure 32 (cont’d)
NH
SN
SIR

Tennessee’s Report on Healthcare-Associated Infections: January 2008–December 2011
90 of 128
Figure 32 (cont’d)
NH
SN
SIR

Tennessee’s Report on Healthcare-Associated Infections: January 2008–December 2011
91 of 128
Figure 32 (cont’d)
NH
SN
SIR

Tennessee’s Report on Healthcare-Associated Infections: January 2008–December 2011
92 of 128
CLABSI Figures and Tables
Specialty Care Areas

Tennessee’s Report on Healthcare-Associated Infections: January 2008–December 2011
93 of 128
Figure 33: Central Line-Associated Bloodstream Infection (CLABSI) Pooled Mean Rates per 1,000 Central Line Days by Specialty Care Area (SCA)
Type, Temporary Central Lines, Tennessee, 2010 and 2011, vs. National Healthcare Safety Network (NHSN), 2006-8 Note: NHSN 2006-8 baseline data not available for pediatric bone marrow transplant SCAs

Tennessee’s Report on Healthcare-Associated Infections: January 2008–December 2011
94 of 128
Figure 34: Central Line-Associated Bloodstream Infection (CLABSI) Pooled Mean Rates per 1,000 Central Line Days by Specialty Care Area (SCA)
Type, Permanent Central Lines, Tennessee, 2010 and 2011, vs. National Healthcare Safety Network (NHSN), 2006-8 Note: NHSN 2006-8 baseline data not available for pediatric bone marrow transplant SCAs

Tennessee’s Report on Healthcare-Associated Infections: January 2008–December 2011
95 of 128
Figure 35: Central Line Utilization Ratio by Specialty Care Area (SCA), Temporary Central Lines, Tennessee, 2010 and 2011, vs. National Healthcare
Safety Network (NHSN), 2006-8 Note: NHSN 2006-8 baseline data not available for pediatric bone marrow transplant SCAs

Tennessee’s Report on Healthcare-Associated Infections: January 2008–December 2011
96 of 128
Figure 36: Central Line Utilization Ratio by Specialty Care Area (SCA), Permanent Central Lines, Tennessee, 2010 and 2011, vs. National Healthcare
Safety Network (NHSN), 2006-8 Note: NHSN 2006-8 baseline data not available for pediatric bone marrow transplant SCAs

Tennessee’s Report on Healthcare-Associated Infections: January 2008–December 2011
97 of 128
Figure 37: Standardized Infection Ratios (SIRs) for Central Line-Associated Bloodstream Infections (CLABSIs) by Specialty Care Area (SCA) Type,
Tennessee, 2010 and 2011 [Reference standard: National Healthcare Safety Network (NHSN), 2006-8] Note: NHSN 2006-8 baseline data not available for pediatric bone marrow transplant SCAs

Tennessee’s Report on Healthcare-Associated Infections: January 2008–December 2011
98 of 128
Figure 38: Standardized Infection Ratios (SIR) for Central Line-Associated Bloodstream Infections (CLABSIs) for Specialty Care Areas (SCAs) by
Quarter, Tennessee, 07/01/2010–12/31/2011 [Reference standard: National Healthcare Safety Network (NHSN), 2006-8] Note: NHSN 2006-8 baseline data not available for pediatric bone marrow transplant SCAs

Tennessee’s Report on Healthcare-Associated Infections: January 2008–December 2011
99 of 128
Figure 39: Organisms Isolated from Central Line-Associated Bloodstream Infections (CLABSIs) in Specialty Care
Areas, Tennessee, 01/01/2011–12/31/2011
Number of organisms = 135; number of events = 124

Tennessee’s Report on Healthcare-Associated Infections: January 2008–December 2011
100 of 128
Table 13: Microorganisms Identified in Central Line-Associated Bloodstream Infections (CLABSIs) in Specialty
Care Areas, Tennessee, 01/01/2011–12/31/2011
Number of organisms = 135; number of events = 124
Microorganism
Number of
Isolates Percent
Enterococcus species 25 18.5
Vancomycin-resistant Enterococcus (VRE) (% of total positive isolates)
15 (11.1)
Coagulase-negative Staphylococcus species 18 13.3
Escherichia species 17 12.6
Pseudomonas species 16 11.9
Candida species and other yeasts 12 8.9
Klebsiella species 12 8.9
Streptococcus species 11 8.1
Staphylococcus aureus 10 7.4
Methicillin-resistant S. aureus (MRSA) (% of total positive isolates)
4 (3.0)
Enterobacter species 4 3.0
Pantoea species 2 1.5
Rothia species 2 1.5
Other pathogens 6 4.4
Data reported as of January 4, 2013
Other pathogens = Acinetobacter baumannii, Bacillus spp., Citrobacter freundii, Pediococcus pentosaceus, Stenotrophomonas maltophilia,
Xanthomonas spp.
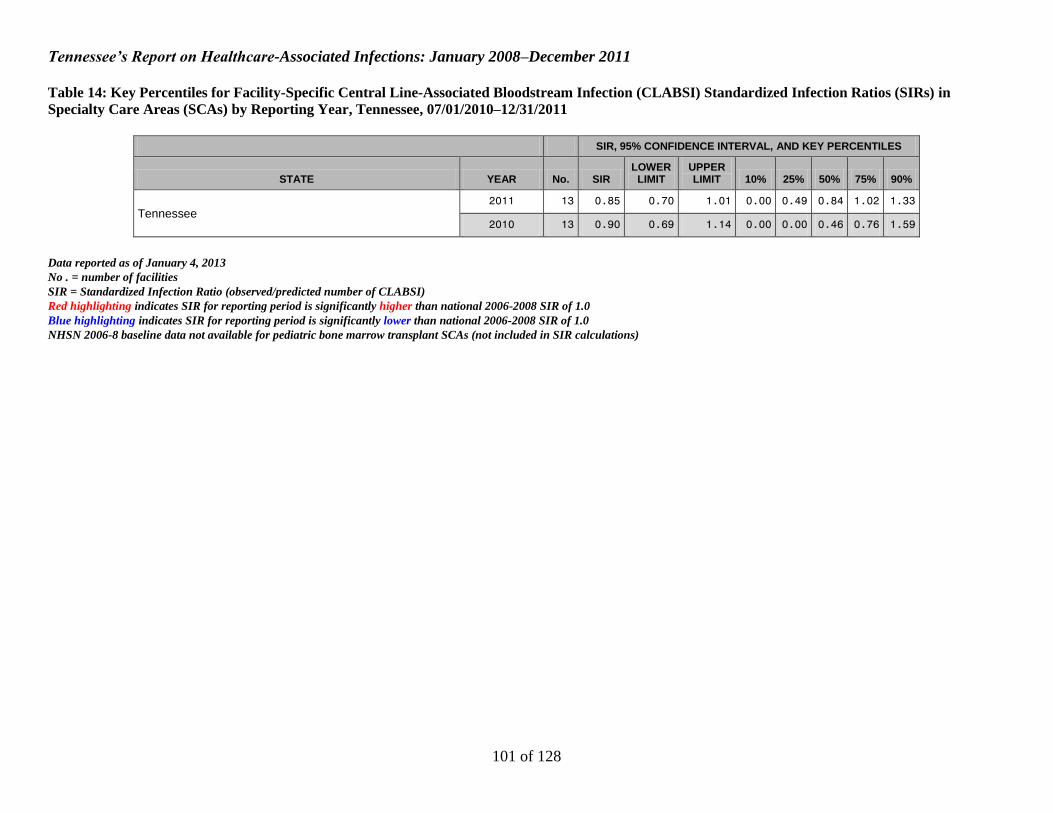
Tennessee’s Report on Healthcare-Associated Infections: January 2008–December 2011
101 of 128
Table 14: Key Percentiles for Facility-Specific Central Line-Associated Bloodstream Infection (CLABSI) Standardized Infection Ratios (SIRs) in
Specialty Care Areas (SCAs) by Reporting Year, Tennessee, 07/01/2010–12/31/2011
SIR, 95% CONFIDENCE INTERVAL, AND KEY PERCENTILES
STATE YEAR No. SIR LOWER
LIMIT UPPER LIMIT 10% 25% 50% 75% 90%
Tennessee 2011 13 0.85 0.70 1.01 0.00 0.49 0.84 1.02 1.33
2010 13 0.90 0.69 1.14 0.00 0.00 0.46 0.76 1.59
Data reported as of January 4, 2013
No . = number of facilities
SIR = Standardized Infection Ratio (observed/predicted number of CLABSI)
Red highlighting indicates SIR for reporting period is significantly higher than national 2006-2008 SIR of 1.0
Blue highlighting indicates SIR for reporting period is significantly lower than national 2006-2008 SIR of 1.0
NHSN 2006-8 baseline data not available for pediatric bone marrow transplant SCAs (not included in SIR calculations)

Tennessee’s Report on Healthcare-Associated Infections: January 2008–December 2011
102 of 128
Table 15: Key Percentiles for Unit-Specific Central Line-Associated Bloodstream Infection (CLABSI) Standardized Infection Ratios (SIRs) by Type of
Specialty Care Area (SCA) and Reporting Year, Tennessee, 07/01/2010–12/31/2011
SIR, 95% CONFIDENCE INTERVAL, AND KEY PERCENTILES
SCA TYPE YEAR No. SIR LOWER
LIMIT UPPER LIMIT 10% 25% 50% 75% 90%
Bone Marrow Transplant 2011 3 0.54 0.35 0.80 0.36 0.36 0.55 0.87 0.87
2010 3 1.24 0.81 1.81 0.97 0.97 1.31 1.60 1.60
Pediatric Bone Marrow Transplant 2011 2 . . . . . . . .
2010 2 . . . . . . . .
Hematology/Oncology 2011 11 0.97 0.75 1.23 0.00 0.00 0.84 1.25 1.33
2010 11 0.80 0.53 1.16 0.00 0.00 0.00 0.76 1.59
Pediatric Hematology/Oncology 2011 2 0.31 0.14 0.59 NA NA NA NA NA
2010 2 0.34 0.11 0.79 NA NA NA NA NA
Solid Organ Transplant 2011 1 NA NA NA NA NA NA NA NA
2010 1 NA NA NA NA NA NA NA NA
Data reported as of January 4, 2013
No .= number of facilities
SIR = Standardized Infection Ratio (observed/predicted number of CLABSI)
NA = percentiles not reported if the number of facilities with reporting units is <5; SIR not shown for Solid Organ Transplant SCA because N = 1
. = NHSN 2006-8 baseline data not available
Red highlighting indicates SIR for reporting period is significantly higher than national 2006-2008 SIR of 1.0
Blue highlighting indicates SIR for reporting period is significantly lower than national 2006-2008 SIR of 1.0

Tennessee’s Report on Healthcare-Associated Infections: January 2008–December 2011
103 of 128
Table 16: Comparison of Tennessee and National Healthcare Safety Network (NHSN) Temporary Central Line-Associated Bloodstream Infection
(CLABSI) Rates by Specialty Care Area (SCA) Type, 01/01/2011–12/31/2011
TENNESSEE 01/01/2011 - 12/31/2011 NHSN 2006-2008
SCA TYPE No. CLABSI TCL
DAYS POOLED MEAN*
MEDIAN RATE* CLABSI
TCL DAYS
POOLED MEAN*
MEDIAN RATE*
Bone Marrow Transplant 3 18 9988 1.8 1.5 96 27290 3.5 .
Pediatric Bone Marrow Transplant 2 0 595 0.0 0.0 . . . .
Hematology/Oncology 11 41 16032 2.6 2.6 117 51950 2.3 1.3
Pediatric Hematology/Oncology 2 0 968 0.0 0.0 47 10287 4.6 .
Solid Organ Transplant 1 NA NA NA NA 66 32591 2.0 .
Data reported as of January 4, 2013
No. = number of facilities
TCLDays = Temporary Central Line Days
. = NHSN 2006-8 baseline data not available
NA = data not shown for Solid Organ Transplant SCA because N = 1
*per 1000 line days
Red highlighting indicates pooled mean rate for reporting period is significantly higher than national 2006-2008 pooled mean rate
Blue highlighting indicates pooled mean rate for reporting period is significantly lower than national 2006-2008 pooled mean rate

Tennessee’s Report on Healthcare-Associated Infections: January 2008–December 2011
104 of 128
Table 17: Comparison of Tennessee and National Healthcare Safety Network (NHSN) Permanent Central Line-Associated Bloodstream Infection
(CLABSI) Rates by Specialty Care Area (SCA) Type, 01/01/2011–12/31/2011
TENNESSEE 01/01/2011 - 12/31/2011 NHSN 2006-2008
SCA TYPE No. CLABSI PCL
DAYS POOLED MEAN*
MEDIAN RATE* CLABSI
PCL DAYS
POOLED MEAN*
MEDIAN RATE*
Bone Marrow Transplant 3 7 2820 2.5 0.9 235 60546 3.9 1.8
Pediatric Bone Marrow Transplant 2 20 6813 2.9 3.0 . . . .
Hematology/Oncology 11 24 18858 1.3 0.7 158 95535 1.7 0.9
Pediatric Hematology/Oncology 2 9 10653 0.8 0.7 75 32255 2.3 .
Solid Organ Transplant 1 NA NA NA NA 11 3953 2.8 .
Data reported as of January 4, 2013
No. = number of facilities
PCLDays = Permanent Central Line Days
. = NHSN 2006-8 baseline data not available
NA = data not shown for Solid Organ Transplant SCA because N = 1
*per 1000 line days
Red highlighting indicates pooled mean rate for reporting period is significantly higher than national 2006-2008 pooled mean rate
Blue highlighting indicates pooled mean rate for reporting period is significantly lower than national 2006-2008 pooled mean rate

Tennessee’s Report on Healthcare-Associated Infections: January 2008–December 2011
105 of 128
CLABSI Figures and Tables
Long-Term Acute Care Facilities

Tennessee’s Report on Healthcare-Associated Infections: January 2008–December 2011
106 of 128
Figure 40: Standardized Infection Ratio (SIR) for Central Line-Associated Bloodstream Infections (CLABSIs) for Long-Term Acute Care (LTAC)
Facilities by Quarter, Tennessee, 07/01/2010–12/31/2011 [Reference standard: National Healthcare Safety Network (NHSN), 2006-8]

Tennessee’s Report on Healthcare-Associated Infections: January 2008–December 2011
107 of 128
Figure 41: Organisms Isolated from Central Line-Associated Bloodstream Infections (CLABSIs) in Long-Term
Acute Care Facilities, Tennessee, 01/01/2011–12/31/2011
Number of organisms = 116; number of events = 103

Tennessee’s Report on Healthcare-Associated Infections: January 2008–December 2011
108 of 128
Table 18: Microorganisms Identified in Central Line-Associated Bloodstream Infections (CLABSIs) in Long-Term
Acute Care Facilities, Tennessee, 01/01/2011–12/31/2011
Number of organisms = 116; number of events = 103
Microorganism
Number of
Isolates Percent
Enterococcus species 33 28.4
Vancomycin-resistant Enterococcus (VRE) (% of total positive isolates)
19 (16.4)
Coagulase-negative Staphylococcus species 16 13.8
Staphylococcus aureus 13 11.2
Methicillin-resistant S. aureus (MRSA) (% of total positive isolates)
12 (10.3)
Candida species and other yeasts 11 9.5
Pseudomonas species 10 8.6
Klebsiella species 8 6.9
Enterobacter species 6 5.2
Acinetobacter species 4 3.4
Proteus species 2 1.7
Serratia species 2 1.7
Stenotrophomonas species 2 1.7
Other pathogens 8 6.9
Other commensals 1 0.9
Data reported as of January 4, 2013
Other pathogens =Aerobe not otherwise specified, Bacillus spp., Burkholderia cepacia, Clostridium perfringens, Escherichia coli, Providencia
stuartii, Staphylococcus spp., group B Streptococcus
Other commensals = Corynebacterium striatum

Tennessee’s Report on Healthcare-Associated Infections: January 2008–December 2011
109 of 128
Table 19: Key Percentiles for Facility-Specific Central Line-Associated Bloodstream Infection (CLABSI) Standardized Infection Ratios (SIRs) in Long-
Term Acute Care (LTAC) Facilities by Reporting Year, Tennessee, 07/01/2010–12/31/2011
SIR, 95% CONFIDENCE INTERVAL, AND KEY PERCENTILES
STATE YEAR No. SIR LOWER
LIMIT UPPER LIMIT 10% 25% 50% 75% 90%
Tennessee 2011 9 0.91 0.75 1.11 0.07 0.48 1.00 1.45 1.50
2010 9 1.05 0.79 1.37 0.00 0.45 1.26 1.42 2.66
Data reported as of January 4, 2013
No . = number of facilities; SIR = Standardized Infection Ratio (observed/predicted number of CLABSI)
Red highlighting indicates SIR for reporting period is significantly higher than national 2006-2008 SIR of 1.0
Blue highlighting indicates SIR for reporting period is significantly lower than national 2006-2008 SIR of 1.0
Table 20: Comparison of Tennessee and National Healthcare Safety Network (NHSN) Central Line-Associated Bloodstream Infection (CLABSI) Rates
by Long-Term Acute Care (LTAC) Location, 01/01/2011–12/31/2011
TENNESSEE 01/01/2011 - 12/31/2011 NHSN 2006-2008
SCA TYPE No. CLABSI CL
DAYS POOLED MEAN*
MEDIAN RATE* CLABSI
CL DAYS
POOLED MEAN*
MEDIAN RATE*
LTAC Ward 9 103 65311 1.6 1.7 298 172576 1.7 .
Data reported as of January 4, 2013
No. = number of facilities with reporting units
CL Days = central line days
. = NHSN 2006-8 baseline data not available
*per 1000 line days
Red highlighting indicates pooled mean rate for reporting period is significantly higher than national 2006-2008 pooled mean rate
Blue highlighting indicates pooled mean rate for reporting period is significantly lower than national 2006-2008 pooled mean rat
Tennessee’s Report on Healthcare-Associated Infections: January 2008–December 2011
110 of 128
SSI Figures and Tables
CBGB/CBGC, HPRO, and CARD Procedures
January 1, 2009 – December 31, 2011

Tennessee’s Report on Healthcare-Associated Infections: January 2008–December 2011
111 of 128
Table 21: Coronary Artery Bypass Graft (CBGB/C) and Hip Prosthesis (HPRO) Combined All and Complex
Admission/Readmission Surgical Site Infection (SSI) Standardized Infection Ratios (SIRs) by Six-Month Period,
Tennessee, 07/01/2010–12/31/2011
SIR, 95% CONFIDENCE INTERVAL, AND KEY PERCENTILES
STATE SIR TYPE YEAR
HALF No. SIR LOWER
LIMIT UPPER LIMIT 10% 25% 50% 75% 90%
Tennessee
All Procedures
2011 2 74 0.76 0.63 0.91 0.00 0.20 0.59 1.11 1.52
2011 1 74 0.75 0.62 0.89 0.00 0.36 0.63 0.99 1.69
2010 2 66 0.75 0.62 0.90 0.00 0.30 0.61 1.09 1.64
Complex A/R
2011 2 74 0.89 0.70 1.10 0.00 0.22 0.81 1.22 1.46
2011 1 74 0.86 0.68 1.07 0.00 0.36 0.79 1.24 1.96
2010 2 66 0.61 0.46 0.79 0.00 0.00 0.41 1.11 1.98
Data reported as of January 9, 2013
No . = number of facilities with reporting units; SIR = Standardized Infection Ratio (observed/predicted number of SSI)
Red highlighting indicates SIR for reporting period is significantly higher than national 2006-2008 SIR of 1.0
Blue highlighting indicates SIR for reporting period is significantly lower than national 2006-2008 SIR of 1.0
Figure 42: Combined Coronary Artery Bypass Graft (CBGB/C) and Hip Prosthesis (HPRO) All and Complex
Admission/Readmission Surgical Site Infection (SSI) Standardized Infection Ratios (SIRs) by Quarter, Tennessee,
07/01/2010–12/31/2011

Tennessee’s Report on Healthcare-Associated Infections: January 2008–December 2011
112 of 128
Figure 43: Organisms Isolated from Coronary Artery Bypass Graft (CBGB/C) Surgical Site Infections (SSIs),
Tennessee, 01/01/2011–12/31/2011
Number of organisms = 128; number of events = 108

Tennessee’s Report on Healthcare-Associated Infections: January 2008–December 2011
113 of 128
Table 22: Microorganisms Identified in Coronary Artery Bypass Graft (CBGB/C) Surgical Site Infections (SSIs),
Tennessee, 01/01/2011–12/31/2011
Number of organisms = 128; number of events = 108
Microorganism Number of
Isolates Percent
Staphylococcus aureus 47 36.7
Methicillin-resistant S. aureus (MRSA)
(% of total positive isolates)
18 (14.6)
Coagulase-negative Staphylococcus species 23 18.0
Pseudomonas species 10 7.8
Serratia species 9 7.0
Klebsiella species 7 5.5
Enterobacter species 6 4.7
Enterococcus species 6 4.7
Vancomycin-resistant Enterococcus (VRE)
(% of total positive isolates)
1 (0.8)
Proteus species 6 4.7
Candida species and other yeasts 3 2.3
Escherichia species 2 1.6
Streptococcus species 2 1.6
Other pathogens 7 5.5
Data reported as of January 9, 2013
Other pathogens = Citrobacter koseri, Clostridium hastiforme, Coccidioides spp., Corynebacterium spp., Haemophilus influenzae type
unspecified, Morganella morganii, Propionibacterium acnes
No culture results were available for 36 events

Tennessee’s Report on Healthcare-Associated Infections: January 2008–December 2011
114 of 128
Table 23: Coronary Artery Bypass Graft (CBGB/C) All and Complex Admission/Readmission Surgical Site Infection (SSI) Standardized Infection
Ratios (SIRs) by Year, Tennessee, 01/01/2009–12/31/2011
SIR, 95% CONFIDENCE INTERVAL, AND KEY PERCENTILES
STATE SIR TYPE YEAR No. SIR LOWER
LIMIT UPPER LIMIT 10% 25% 50% 75% 90%
Tennessee
All Procedures
2011 26 0.75 0.62 0.90 0.00 0.31 0.82 1.03 1.71
2010 26 0.67 0.55 0.80 0.00 0.34 0.65 1.00 1.86
2009 23 0.74 0.62 0.89 0.00 0.19 0.72 1.11 1.50
Complex A/R
2011 26 0.92 0.73 1.15 0.00 0.00 0.73 1.36 1.87
2010 26 0.71 0.55 0.90 0.00 0.19 0.68 1.01 1.88
2009 23 0.77 0.60 0.98 0.00 0.13 0.74 1.13 1.83
Data reported as of January 9, 2013
No . = number of facilities with reporting units; SIR = Standardized Infection Ratio (observed/predicted number of SSI)
Red highlighting indicates SIR for reporting period is significantly higher than national 2006-2008 SIR of 1.0
Blue highlighting indicates SIR for reporting period is significantly lower than national 2006-2008 SIR of 1.0
Table 24: Crude (Unadjusted) Rate of Coronary Artery Bypass Graft (CBGB/C) Surgical Site Infection (SSI) by Year, Tennessee, 01/01/2009–12/31/2011
State Year No. of Hospitals No. of Procedures No. of SSI TN Rate*
Tennessee
2011 26 7403 144 1.95
2010 26 8187 166 2.03
2009 23 7813 153 1.96
Data reported as of January 9, 2013
*Per 100 operations

Tennessee’s Report on Healthcare-Associated Infections: January 2008–December 2011
115 of 128
Table 25: Coronary Artery Bypass Graft (CBGB/C) All Surgical Site Infection (SSI) Standardized Infection Ratios (SIRs) by Six-Month Period,
Tennessee, 01/01/2009–12/31/2011
SIR, 95% CONFIDENCE INTERVAL, AND KEY
PERCENTILES
STATE YEAR
Half No. SIR LOWER
LIMIT UPPER LIMIT
Tennessee
2011 2 26 0.80 0.61 1.03
2011 1 26 0.71 0.54 0.91
2010 2 26 0.76 0.58 0.97
2010 1 26 0.58 0.43 0.76
2009 2 23 0.73 0.55 0.95
2009 1 23 0.75 0.58 0.96
Data reported as of January 9, 2013
No . = number of facilities with reporting units; SIR = Standardized Infection Ratio (observed/predicted number of SSI)
Red highlighting indicates SIR for reporting period is significantly higher than national 2006-2008 SIR of 1.0
Blue highlighting indicates SIR for reporting period is significantly lower than national 2006-2008 SIR of 1.0
Table 26: Coronary Artery Bypass Graft (CBGB/C) Complex Admission/Readmission Surgical Site Infection (SSI) Standardized Infection Ratios (SIRs)
by Six-Month Period, Tennessee, 01/01/2009–12/31/2011
SIR, 95% CONFIDENCE INTERVAL, AND KEY
PERCENTILES
STATE YEAR
Half No. SIR LOWER
LIMIT UPPER LIMIT
Tennessee
2011 2 26 0.90 0.63 1.24
2011 1 26 0.93 0.67 1.27
2010 2 26 0.73 0.50 1.03
2010 1 26 0.69 0.48 0.97
2009 2 23 0.91 0.64 1.25
2009 1 23 0.65 0.44 0.92
Data reported as of January 9, 2013
No . = number of facilities with reporting units; SIR = Standardized Infection Ratio (observed/predicted number of SSI)
Red highlighting indicates SIR for reporting period is significantly higher than national 2006-2008 SIR of 1.0
Blue highlighting indicates SIR for reporting period is significantly lower than national 2006-2008 SIR of 1.0

Tennessee’s Report on Healthcare-Associated Infections: January 2008–December 2011
116 of 128
Figure 44: Coronary Artery Bypass Graft (CBGB/C) All and Complex Admission/Readmission Surgical Site Infection (SSI) Standardized Infection
Ratios (SIRs) by Quarter, Tennessee, 01/01/2009–12/31/2011

Tennessee’s Report on Healthcare-Associated Infections: January 2008–December 2011
117 of 128
Figure 45: Coronary Artery Bypass Graft (CBGB/C) Surgical Site Infections by Site, Tennessee, 01/01/2011-
12/31/2011
Number of Events = 144

Tennessee’s Report on Healthcare-Associated Infections: January 2008–December 2011
118 of 128
Figure 46: Coronary Artery Bypass Graft (CBGB/C) Surgical Site Infection Detection, Tennessee, 01/01/2011-
12/31/2011
Number of Events = 144

Tennessee’s Report on Healthcare-Associated Infections: January 2008–December 2011
119 of 128
Figure 47: Organisms Isolated from Hip Prosthesis (HPRO) Surgical Site Infections (SSIs), Tennessee, 01/01/2011–
12/31/2011
Number of organisms = 134; number of events = 115

Tennessee’s Report on Healthcare-Associated Infections: January 2008–December 2011
120 of 128
Table 27: Microorganisms Identified in Hip Prosthesis (HPRO) Surgical Site Infections (SSIs), Tennessee,
01/01/2011–12/31/2011
Number of organisms = 134; number of events = 115
Microorganism Number of
Isolates Percent
Staphylococcus aureus 70 52.2
Methicillin-resistant S. aureus (MRSA)
(% of total positive isolates)
39 (29.1)
Enterococcus species 13 9.7
Vancomycin-resistant Enterococcus (VRE)
(% of total positive isolates)
3 (2.4)
Coagulase-negative Staphylococcus species 10 7.5
Pseudomonas species 10 7.5
Streptococcus species 6 4.5
Escherichia species 5 3.7
Proteus species 5 3.7
Klebsiella species 4 3.0
Enterobacter species 3 2.2
Citrobacter species 2 1.5
Serratia species 2 1.5
Other pathogens 4 3.0
Data reported as of January 9, 2013
Other pathogens = Acinetobacter baumannii, Corynebacterium striatum, Morganella morganii, Staphylococcus spp.
No culture results were available for 13 events

Tennessee’s Report on Healthcare-Associated Infections: January 2008–December 2011
121 of 128
Table 28: Hip Prosthesis All and Complex Admission/Readmission Surgical Site Infection (SSI) Standardized Infection Ratios (SIRs) by Year,
Tennessee, 07/01/2010–12/31/2011
SIR, 95% CONFIDENCE INTERVAL, AND KEY PERCENTILES
STATE SIR TYPE YEAR No. SIR LOWER
LIMIT UPPER LIMIT 10% 25% 50% 75% 90%
Tennessee
All Procedures
2011 74 0.76 0.63 0.90 0.00 0.31 0.70 1.07 1.68
2010 66 0.74 0.56 0.96 0.00 0.38 0.62 1.09 1.62
Complex A/R
2011 74 0.84 0.67 1.03 0.00 0.45 0.68 1.13 1.92
2010 66 0.51 0.32 0.75 0.00 0.00 0.16 0.74 1.66
Data reported as of January 9, 2013
No . = number of facilities with reporting units; SIR = Standardized Infection Ratio (observed/predicted number of SSI)
Red highlighting indicates SIR for reporting period is significantly higher than national 2006-2008 SIR of 1.0
Blue highlighting indicates SIR for reporting period is significantly lower than national 2006-2008 SIR of 1.0
Table 29: Crude (Unadjusted) Rate of Hip Prosthesis Surgical Site Infection (SSI) by Year, Tennessee, 07/01/2010–12/31/2011
State Year No. of Hospitals No. of Procedures No. of SSI TN Rate*
Tennessee 2011 74 9978 127 1.27
2010 66 4674 58 1.24
Data reported as of January 9, 2013
*Per 100 operations

Tennessee’s Report on Healthcare-Associated Infections: January 2008–December 2011
122 of 128
Figure 48: Hip Prosthesis (HPRO) All and Complex Admission/Readmission Surgical Site Infection (SSI) Standardized Infection Ratios (SIRs) by
Quarter, Tennessee, 07/01/2010–12/31/2011

Tennessee’s Report on Healthcare-Associated Infections: January 2008–December 2011
123 of 128
Figure 49: Hip Prosthesis (HPRO) Surgical Site Infections by Site, Tennessee, 01/01/2011-12/31/2011
Number of Events = 127

Tennessee’s Report on Healthcare-Associated Infections: January 2008–December 2011
124 of 128
Figure 50: Hip Prosthesis (HPRO) Surgical Site Infection Detection, Tennessee, 01/01/2011-12/31/2011
Number of Events = 127

Tennessee’s Report on Healthcare-Associated Infections: January 2008–December 2011
125 of 128
Table 30: Microorganisms Identified in Cardiac (CARD) Surgical Site Infections (SSIs), Tennessee, 07/01/2011–
12/31/2011
Number of organisms = 9; number of events = 6
Microorganism Number of
Isolates Percent
Staphylococcus epidermidis 2 22.2
Candida albicans 1 11.1
Citrobacter youngae 1 11.1
Enterobacter cloacae 1 11.1
Escherichia coli 1 11.1
Klebsiella pneumoniae 1 11.1
Pseudomonas aeruginosa 1 11.1
Staphylococcus aureus 1 11.1
Methicillin-resistant S. aureus (MRSA)
(% of total positive isolates)
1 (11.1)
Data reported as of January 9, 2013
No culture results were available for 5 events

Tennessee’s Report on Healthcare-Associated Infections: January 2008–December 2011
126 of 128
Table 31: Cardiac Surgery All and Complex Admission/Readmission Surgical Site Infection (SSI) Standardized Infection Ratios (SIRs) by Year,
Tennessee, 07/01/2011–12/31/2011
SIR, 95% CONFIDENCE INTERVAL, AND KEY PERCENTILES
STATE SIR TYPE
YEAR QUARTER No. SIR LOWER
LIMIT UPPER LIMIT 10% 25% 50% 75% 90%
Tennessee
All Procedures 2011 4 24 0.71 0.26 1.55 1.26 1.26 1.26 1.26 1.26
3 25 0.58 0.19 1.36 0.40 0.40 0.40 0.40 0.40
Complex A/R 2011 4 24 0.40 0.05 1.43 0.72 0.72 0.72 0.72 0.72
3 25 0.40 0.05 1.46 0.74 0.74 0.74 0.74 0.74
Data reported as of January 9, 2013
No . = number of facilities with reporting units; SIR = Standardized Infection Ratio (observed/predicted number of SSI)
Red highlighting indicates SIR for reporting period is significantly higher than national 2006-2008 SIR of 1.0
Blue highlighting indicates SIR for reporting period is significantly lower than national 2006-2008 SIR of 1.0
Table 32: Crude (Unadjusted) Rate of Cardiac Surgical Site Infection (SSI) by Year, Tennessee, 07/01/2010–12/31/2011
State
Year Quarter No. of Hospitals No. of Procedures No. of SSI TN Rate*
Tennessee
2011
4 24 656 7 1.07
3 25 650 6 0.92
Data reported as of January 9, 2013
*Per 100 operations

Tennessee’s Report on Healthcare-Associated Infections: January 2008–December 2011
127 of 128
Figure 51: Cardiac (CARD) Surgical Site Infections by Site, Tennessee, 07/01/2011-12/31/2011
Number of Events = 11

Tennessee’s Report on Healthcare-Associated Infections: January 2008–December 2011
128 of 128
Figure 52: Cardiac (CARD) Surgical Site Infection Detection, Tennessee, 07/01/2011-12/31/2011
Number of Events = 11