tennessee virtual academy assessment 2012-13
TRANSCRIPT

Tennessee Virtual Academy Assessment 2012-13
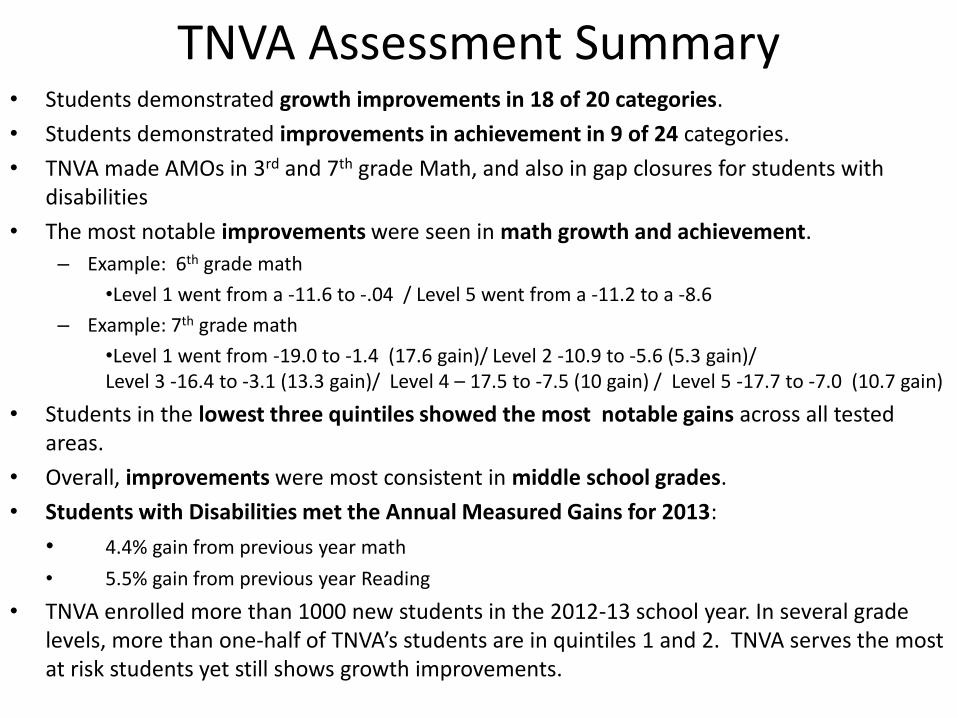
TNVA Assessment Summary • Students demonstrated growth improvements in 18 of 20 categories.
• Students demonstrated improvements in achievement in 9 of 24 categories.
• TNVA made AMOs in 3rd and 7th grade Math, and also in gap closures for students with disabilities
• The most notable improvements were seen in math growth and achievement.
– Example: 6th grade math
•Level 1 went from a -11.6 to -.04 / Level 5 went from a -11.2 to a -8.6
– Example: 7th grade math
•Level 1 went from -19.0 to -1.4 (17.6 gain)/ Level 2 -10.9 to -5.6 (5.3 gain)/ Level 3 -16.4 to -3.1 (13.3 gain)/ Level 4 – 17.5 to -7.5 (10 gain) / Level 5 -17.7 to -7.0 (10.7 gain)
• Students in the lowest three quintiles showed the most notable gains across all tested areas.
• Overall, improvements were most consistent in middle school grades.
• Students with Disabilities met the Annual Measured Gains for 2013:
• 4.4% gain from previous year math
• 5.5% gain from previous year Reading
• TNVA enrolled more than 1000 new students in the 2012-13 school year. In several grade levels, more than one-half of TNVA’s students are in quintiles 1 and 2. TNVA serves the most at risk students yet still shows growth improvements.
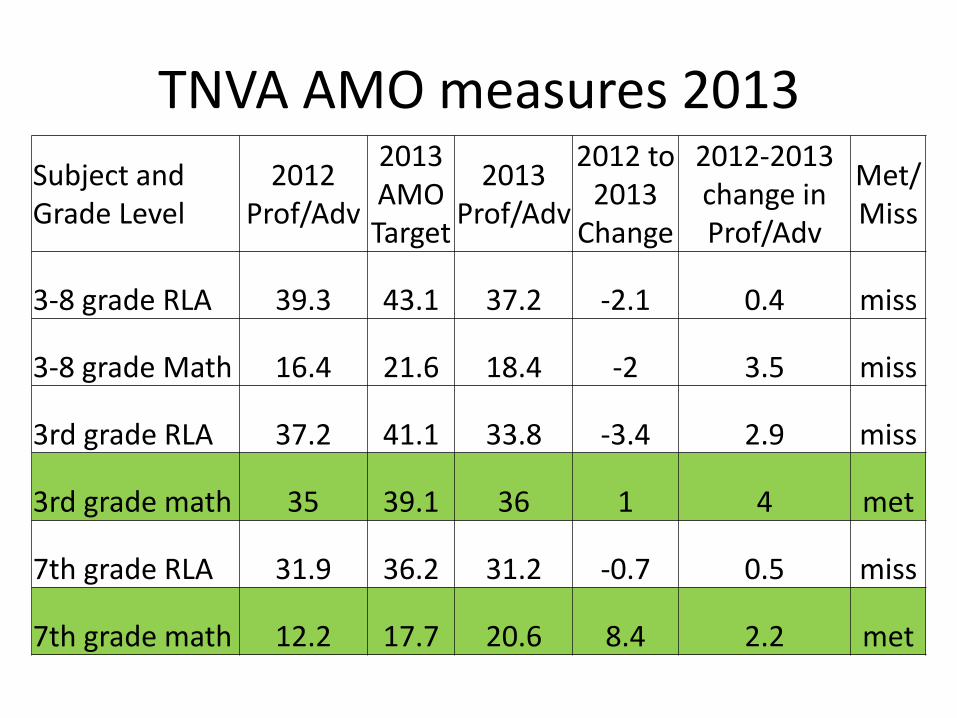
TNVA AMO measures 2013
Subject and Grade Level
2012 Prof/Adv
2013 AMO Target
2013 Prof/Adv
2012 to 2013
Change
2012-2013 change in Prof/Adv
Met/Miss
3-8 grade RLA 39.3 43.1 37.2 -2.1 0.4 miss
3-8 grade Math 16.4 21.6 18.4 -2 3.5 miss
3rd grade RLA 37.2 41.1 33.8 -3.4 2.9 miss
3rd grade math 35 39.1 36 1 4 met
7th grade RLA 31.9 36.2 31.2 -0.7 0.5 miss
7th grade math 12.2 17.7 20.6 8.4 2.2 met
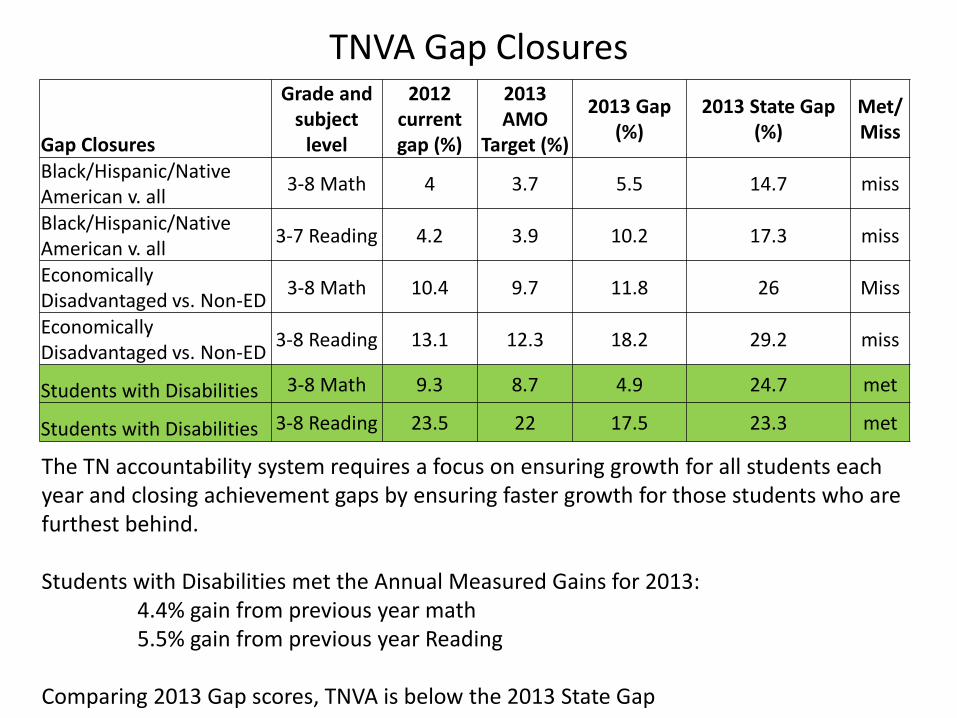
TNVA Gap Closures
Gap Closures
Grade and subject
level
2012 current gap (%)
2013 AMO
Target (%)
2013 Gap (%)
2013 State Gap (%)
Met/Miss
Black/Hispanic/Native American v. all
3-8 Math 4 3.7 5.5 14.7 miss
Black/Hispanic/Native American v. all
3-7 Reading 4.2 3.9 10.2 17.3 miss
Economically Disadvantaged vs. Non-ED
3-8 Math 10.4 9.7 11.8 26 Miss
Economically Disadvantaged vs. Non-ED
3-8 Reading 13.1 12.3 18.2 29.2 miss
Students with Disabilities 3-8 Math 9.3 8.7 4.9 24.7 met
Students with Disabilities 3-8 Reading 23.5 22 17.5 23.3 met
The TN accountability system requires a focus on ensuring growth for all students each year and closing achievement gaps by ensuring faster growth for those students who are furthest behind. Students with Disabilities met the Annual Measured Gains for 2013: 4.4% gain from previous year math 5.5% gain from previous year Reading Comparing 2013 Gap scores, TNVA is below the 2013 State Gap
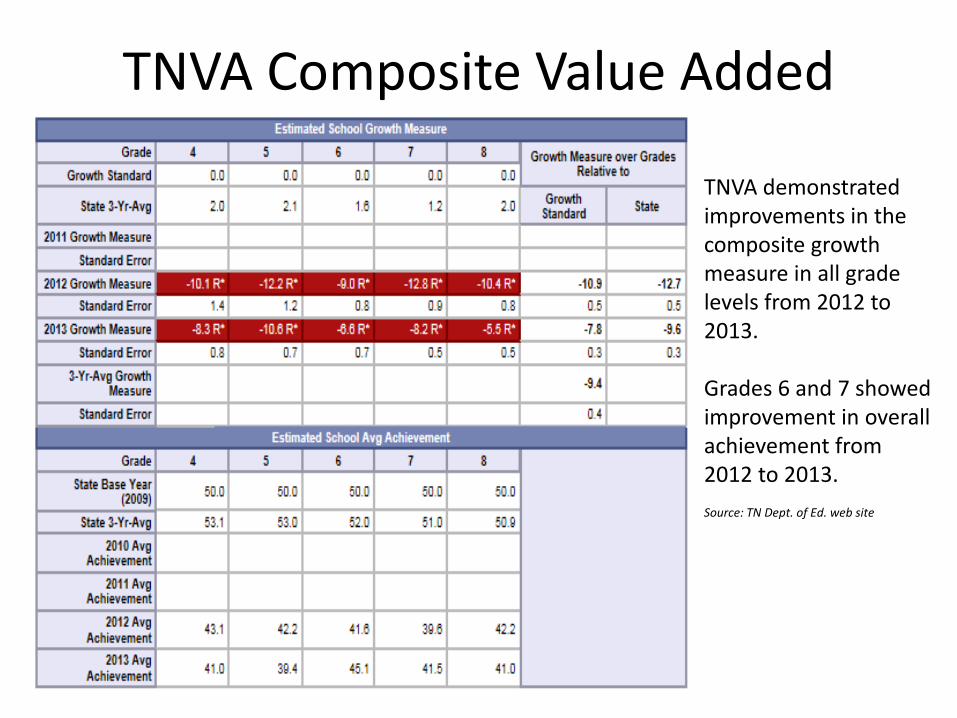
TNVA Composite Value Added
TNVA demonstrated improvements in the composite growth measure in all grade levels from 2012 to 2013. Grades 6 and 7 showed improvement in overall achievement from 2012 to 2013. Source: TN Dept. of Ed. web site
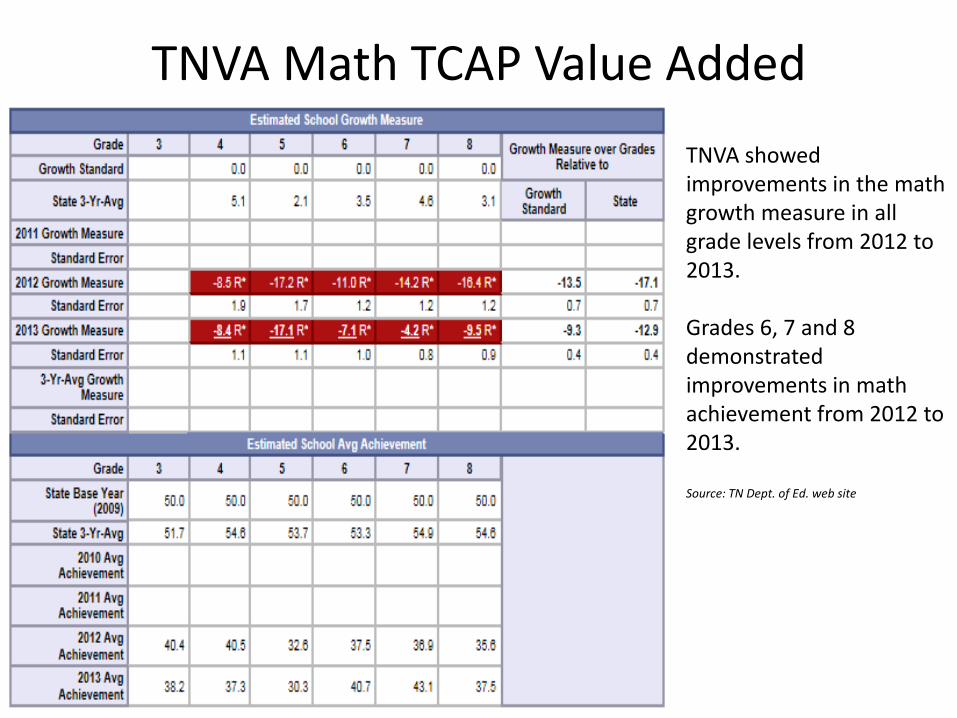
TNVA Math TCAP Value Added
TNVA showed improvements in the math growth measure in all grade levels from 2012 to 2013. Grades 6, 7 and 8 demonstrated improvements in math achievement from 2012 to 2013. Source: TN Dept. of Ed. web site
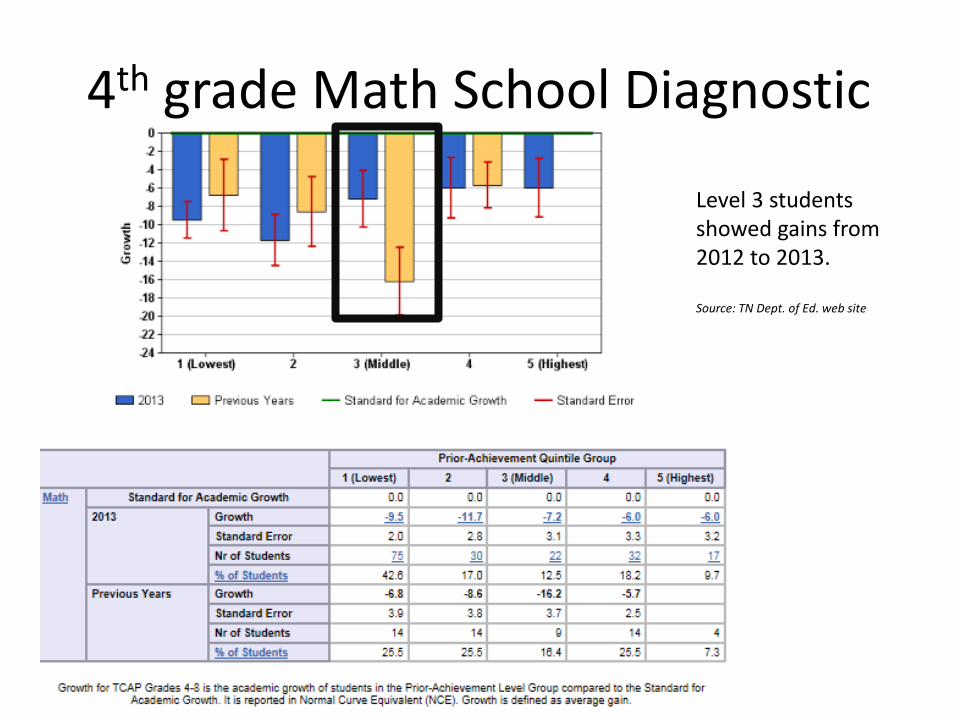
4th grade Math School Diagnostic
• Source: TN Dept. of Ed. web site
• Source: TN Dept. of Ed. web site
Level 3 students showed gains from 2012 to 2013. Source: TN Dept. of Ed. web site
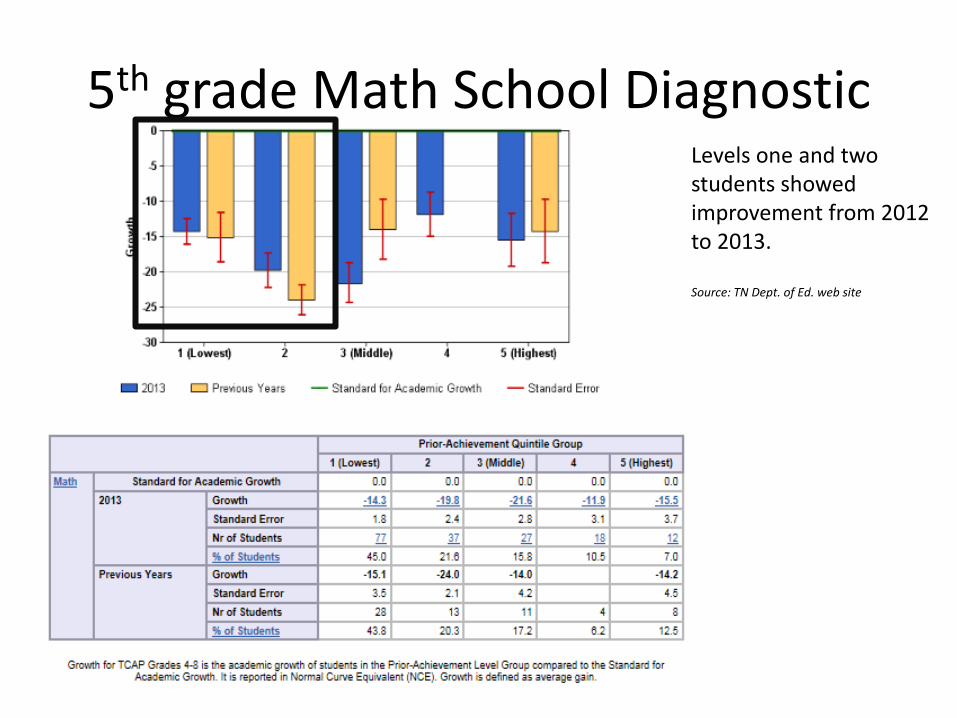
5th grade Math School Diagnostic Levels one and two students showed improvement from 2012 to 2013. Source: TN Dept. of Ed. web site
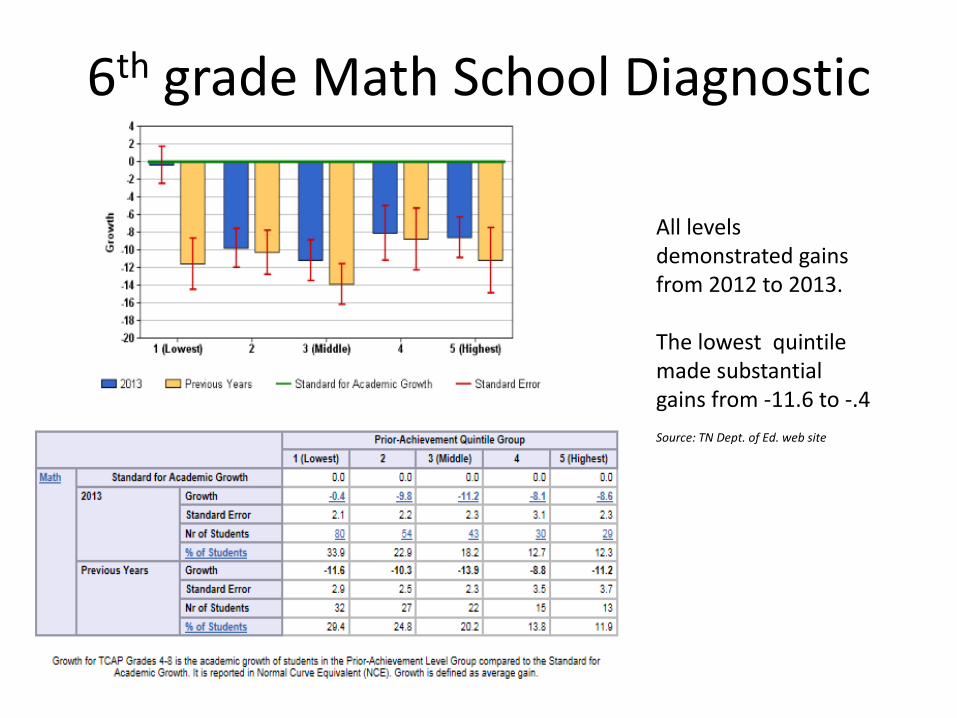
6th grade Math School Diagnostic
All levels demonstrated gains from 2012 to 2013. The lowest quintile made substantial gains from -11.6 to -.4 Source: TN Dept. of Ed. web site

7th grade Math School Diagnostic
All levels demonstrated gains from 2012 to 2013. All levels, including the lowest quintiles, showed notable improvements from 2012 to 2013. Source: TN Dept. of Ed. web site
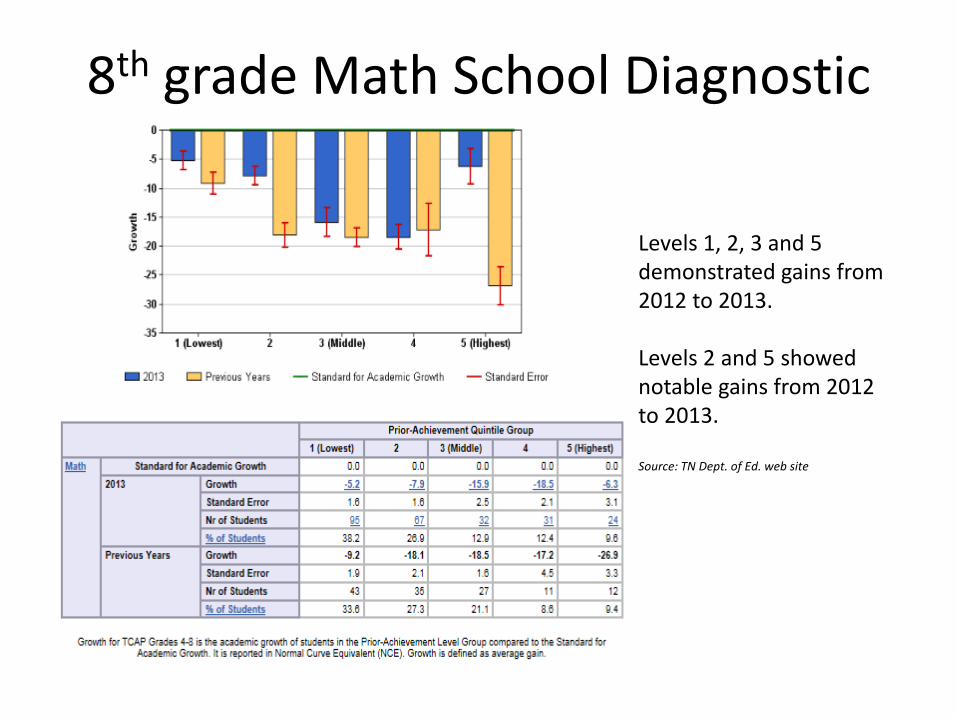
8th grade Math School Diagnostic
Levels 1, 2, 3 and 5 demonstrated gains from 2012 to 2013. Levels 2 and 5 showed notable gains from 2012 to 2013. Source: TN Dept. of Ed. web site
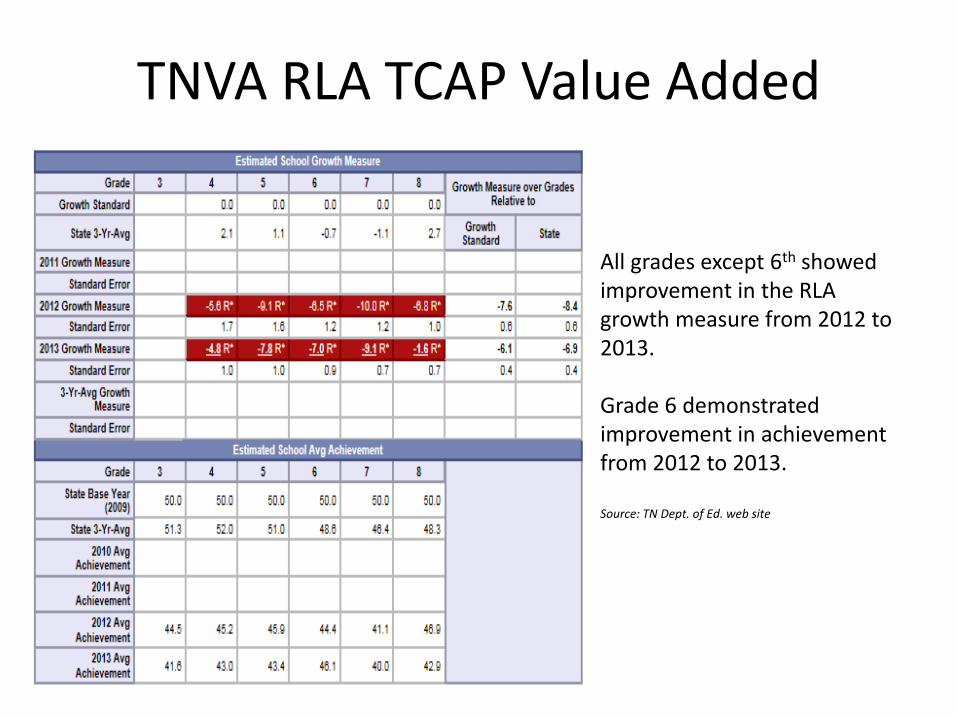
TNVA RLA TCAP Value Added
All grades except 6th showed improvement in the RLA growth measure from 2012 to 2013. Grade 6 demonstrated improvement in achievement from 2012 to 2013. Source: TN Dept. of Ed. web site
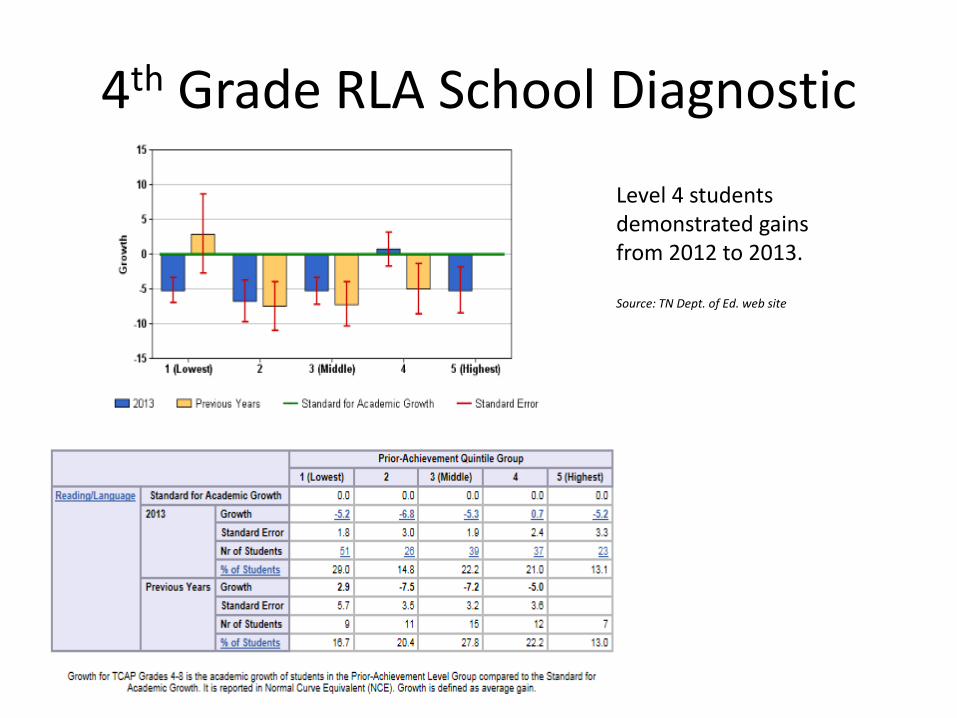
4th Grade RLA School Diagnostic
Level 4 students demonstrated gains from 2012 to 2013. Source: TN Dept. of Ed. web site
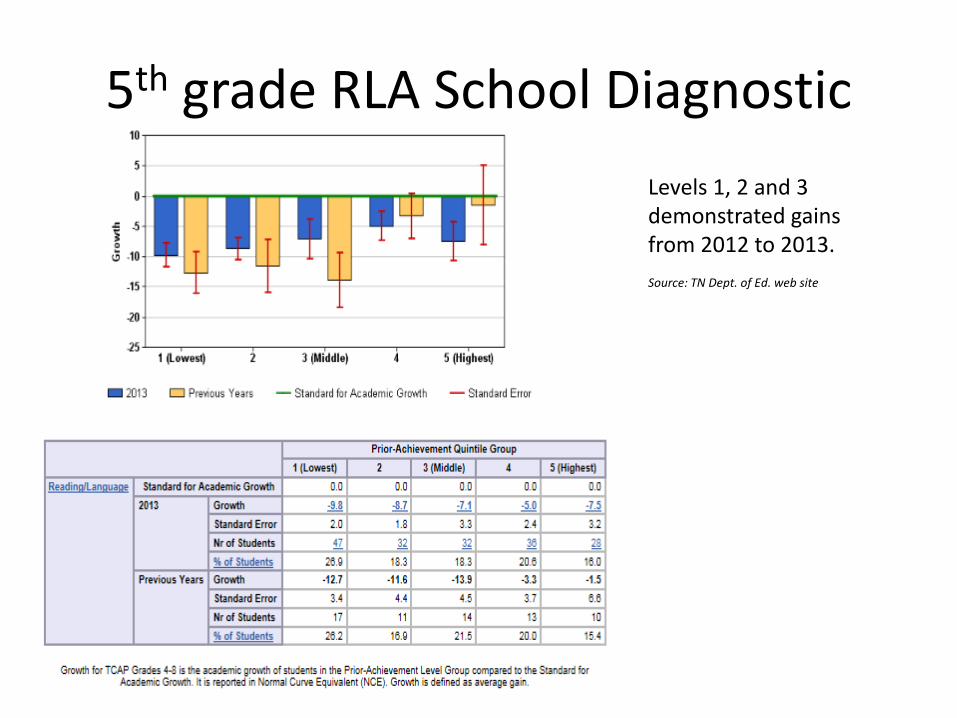
5th grade RLA School Diagnostic
• Source: TN Dept. of Ed.
Levels 1, 2 and 3 demonstrated gains from 2012 to 2013. Source: TN Dept. of Ed. web site
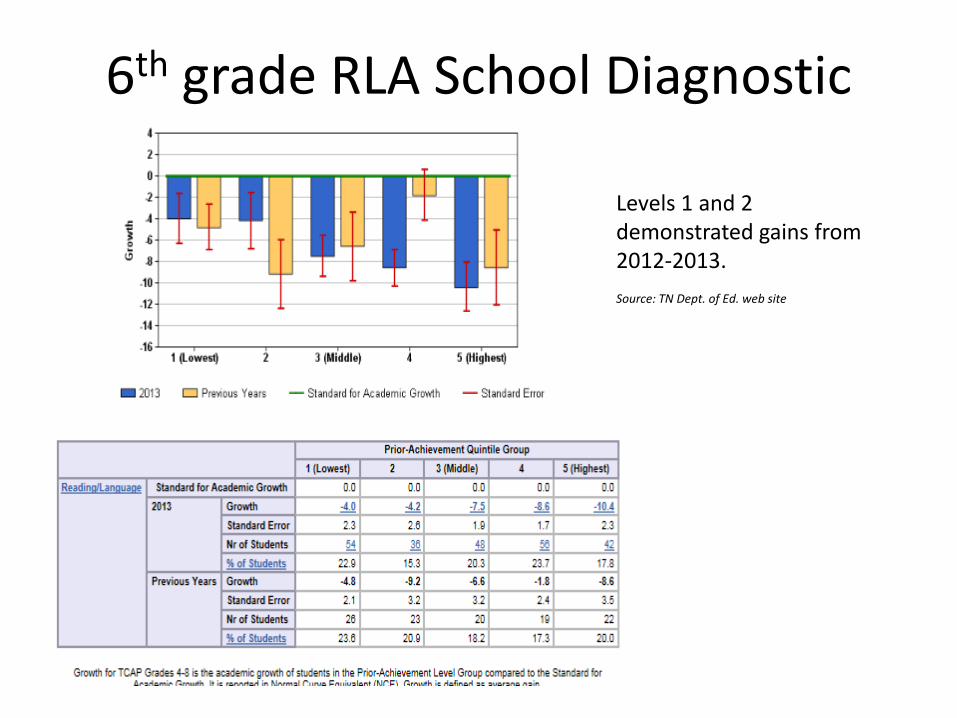
6th grade RLA School Diagnostic
Levels 1 and 2 demonstrated gains from 2012-2013. Source: TN Dept. of Ed. web site

7th grade RLA School Diagnostic
• Le
Levels 1, 3 and 5 showed gains from 2012 to 2013. Source: TN Dept. of Ed. web site
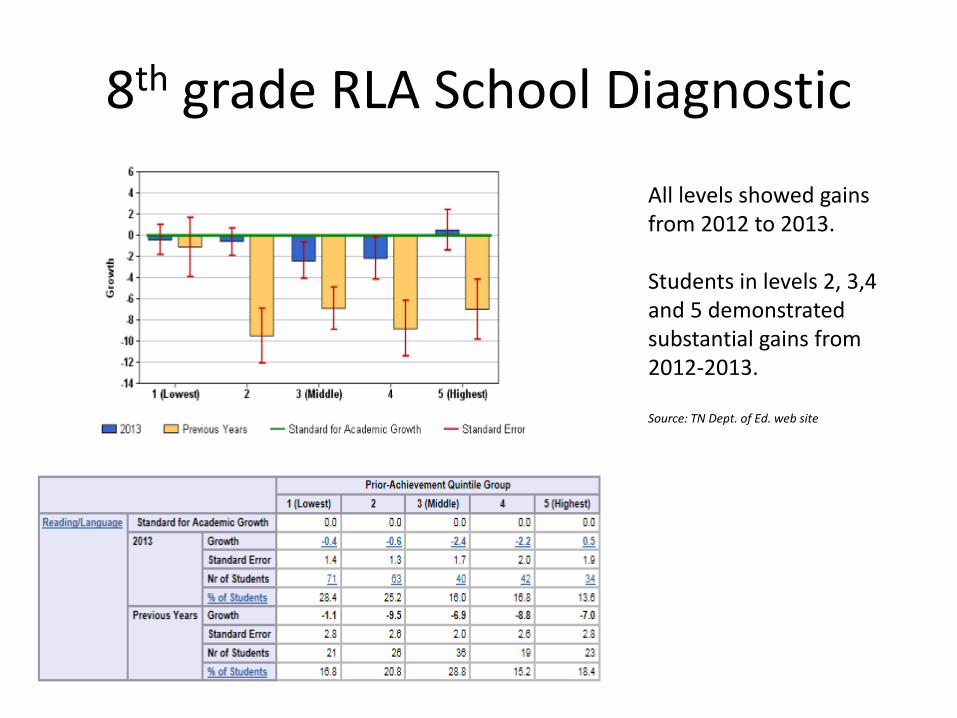
8th grade RLA School Diagnostic
All levels showed gains from 2012 to 2013. Students in levels 2, 3,4 and 5 demonstrated substantial gains from 2012-2013. Source: TN Dept. of Ed. web site

TNVA Science TCAP Value Added
All grades showed improvement in the science growth measure from 2012 to 2013. Grade 6 and 7 demonstrated improvement in achievement from 2012 to 2013. Source: TN Dept. of Ed. web site
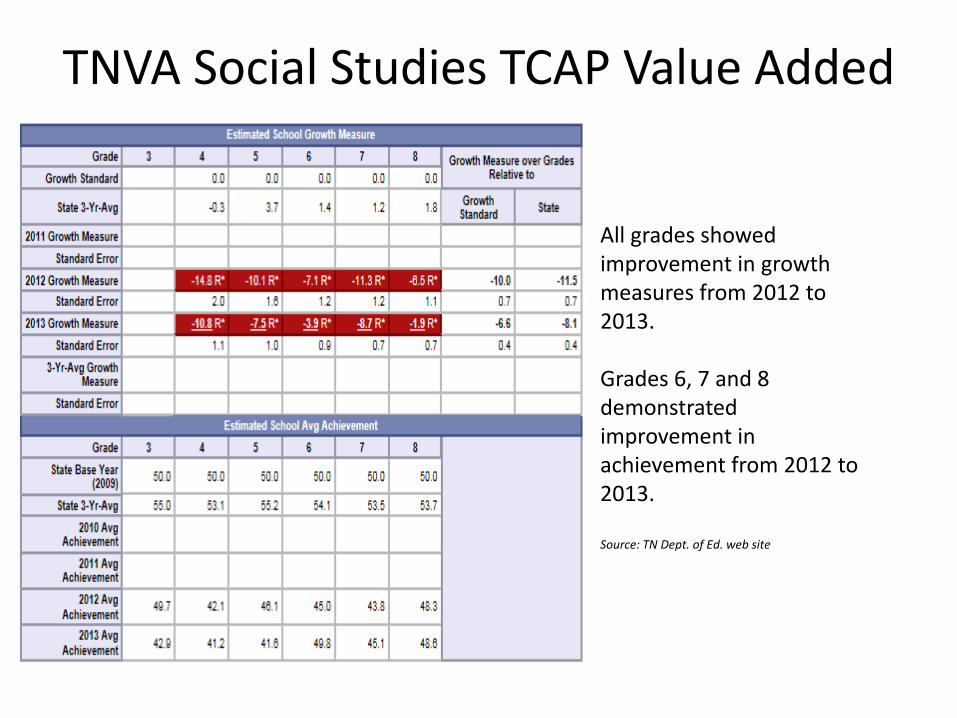
TNVA Social Studies TCAP Value Added
All grades showed improvement in growth measures from 2012 to 2013. Grades 6, 7 and 8 demonstrated improvement in achievement from 2012 to 2013. Source: TN Dept. of Ed. web site