tenet healthcare presentation slides 2012 06 06...
TRANSCRIPT
Tenet HealthcareTenet Healthcare
June 6, 2012
Jefferies 2012 Global Healthcare Conference

Forward-looking Statements
Certain statements contained in this presentation constitute “forward-looking statements” within the meaning of Section 27A of the Securities Act of1933 and Section 21E of the Securities Exchange Act of 1934. Such forward-looking statements are based on management's current expectationsand involve known and unknown risks, uncertainties and other factors that may cause the Company’s actual results to be materially different fromthose expressed or implied by such forward-looking statements. Such factors include, among others, the following: the passage of heath carereform legislation and the enactment of additional federal and state health care reform; other changes in federal, state and local laws andregulations affecting the health care industry; general economic and business conditions, both nationally and regionally; demographic changes;changes in, or the failure to comply with, laws and governmental regulations; the ability to enter into managed care provider arrangements onacceptable terms; changes in Medicare and Medicaid payments or reimbursement; liability and other claims asserted against the Company;competition, including the Company’s ability to attract patients to its hospitals; technological and pharmaceutical improvements that increase thecost of providing, or reduce the demand for, health care; changes in business strategy or development plans; the ability to attract and retainqualified personnel, including physicians, nurses and other health care professionals, and the impact on the Company’s labor expenses resultingfrom a shortage of nurses or other health care professionals; the significant indebtedness of the Company; the Company's ability to integrate newbusinesses with its existing operations; the availability and terms of capital to fund the expansion of the Company's business, including theacquisition of additional facilities; the creditworthiness of counterparties to the Company’s business transactions; adverse fluctuations in interestrates and other risks related to interest rate swaps or any other hedging activities the Company undertakes; the ability to continue to expand and
2
rates and other risks related to interest rate swaps or any other hedging activities the Company undertakes; the ability to continue to expand andrealize earnings contributions from the revenue cycle management, health care information management, capitation management, and patientcommunications services businesses under our Conifer Health Solutions (“Conifer”) subsidiary by marketing these services to third party hospitalsand other health care-related entities; and its ability to identify and execute on measures designed to save or control costs or streamline operations.Such factors also include the positive and negative effects of health reform legislation on reimbursement and utilization and the future designs ofprovider networks and insurance plans, including pricing, provider participation, coverage and co-pays and deductibles, all of which containsignificant uncertainty, and for which multiple models exist which may differ materially from the company's expectations. Certain additional risksand uncertainties are discussed in the Company’s filings with the Securities and Exchange Commission, including the Company’s annual report onForm 10-K and quarterly reports on Form 10-Q. The information contained in this presentation is as of June 6, 2012. The Company specificallydisclaims any obligation to update any forward-looking statement, whether as a result of changes in underlying factors, new information, futureevents or otherwise.
Non-GAAP Information
This presentation includes certain financial measures such as Adjusted EBITDA, which are not calculated in accordance with generally acceptedaccounting principles (GAAP). Management recommends that you focus on the GAAP numbers as the best indicator of financial performance.These alternative measures are provided only as a supplement to aid in analysis of the Company. Reconciliation between non-GAAP measures andrelated GAAP measures can be found in the Company’s first quarter earnings release issued on May 8, 2012.

• 101 free-standing outpatient centers• 64 imaging centers
• 26 ambulatory
Diversified Business Model
• 50 hospitals
• More than 500,000 admissions (LTM)
Tenet Healthcare Providing Value through Sustainable Growth
Conifer Health Solutions
Acute Care Hospitals
• Revenue Cycle Services
• Patient
Outpatient Centers
surgery centers
• 9 urgent care centers
• 2 free-standing EDs
• More than 4 million visits (LTM)
• 15 centers acquired in 2011
• 24 centers acquired in 2010
3
admissions (LTM)
• #1 or #2 in 14 of 25 markets
• Patient Communications
• Capitation Management
• Serving more than 380 total healthcare entities(1)
(1) Includes 56 hospitals with Catholic Healthcare Initiatives; integration of CHI begins July 1, 2012.

Geographically Diverse Portfolio and Concentrated Positions within Markets
4
Asset Portfolio
Acute Care Hospitals .……… 50
Diagnostic Imaging Centers … 64
Ambulatory Surgery Centers …26
OP Centers in Development …. 8
Urgent Care Centers …...…........ 9
Emergency Departments ......… 2

States with Active Provider Fee Programs(1)
States with Active Provider Fee or similar programs to fund hospital Medicaid payments
Acute Care Hospitals
Diagnostic Imaging Centers
Ambulatory Surgery Centers
OP centers in development
Urgent Care Centers
Emergency Departments
Tenet Hospitals and Free-Standing OP Facilities
5
(1) Includes private hospital UPL program in Texas.

Market Data
• Average market share of 21%
• Market share > 50 % in 3 PSAs
• #1 position in 11 markets
• #1 or #2 position in 14 markets
Tenet has the #1 Market Position in 11 of 25 Markets
North Central CA
Philadelphia(Pediatric)
#1 or #2 in 14 of 25 markets
6
• #1 or #2 position in 14 markets
• One of two Level 1 trauma centers in 3 markets
• One of two pediatric Level 1 trauma centers in Philadelphia
• Sole market provider in 3 markets
• “Must-Have” hospitals leveraged by negotiating on a state-wide or nation-wide basis
El Paso
San Luis Obispo County
Coachella Valley
Nacogdoches
NW Houston Palm Beach
County
Miami
SanfordHickory
York County
Hilton HeadSpalding County
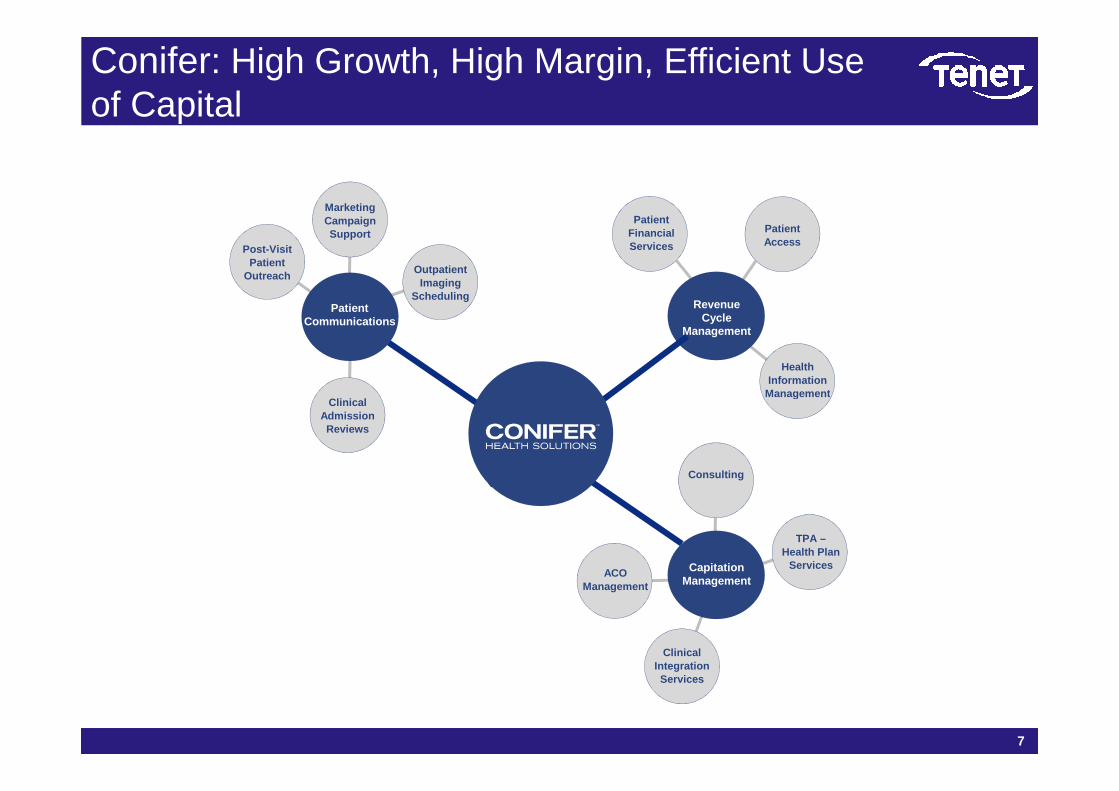
Conifer: High Growth, High Margin, Efficient Use of Capital
MarketingCampaignSupport
Post-VisitPatient
OutreachOutpatient
ImagingScheduling
HealthInformation
Management
PatientAccess
PatientFinancialServices
RevenueCycle
Management
PatientCommunications
7
ClinicalAdmissionReviews
Management
CapitationManagement
TPA –Health Plan
Services
Consulting
ClinicalIntegrationServices
ACOManagement
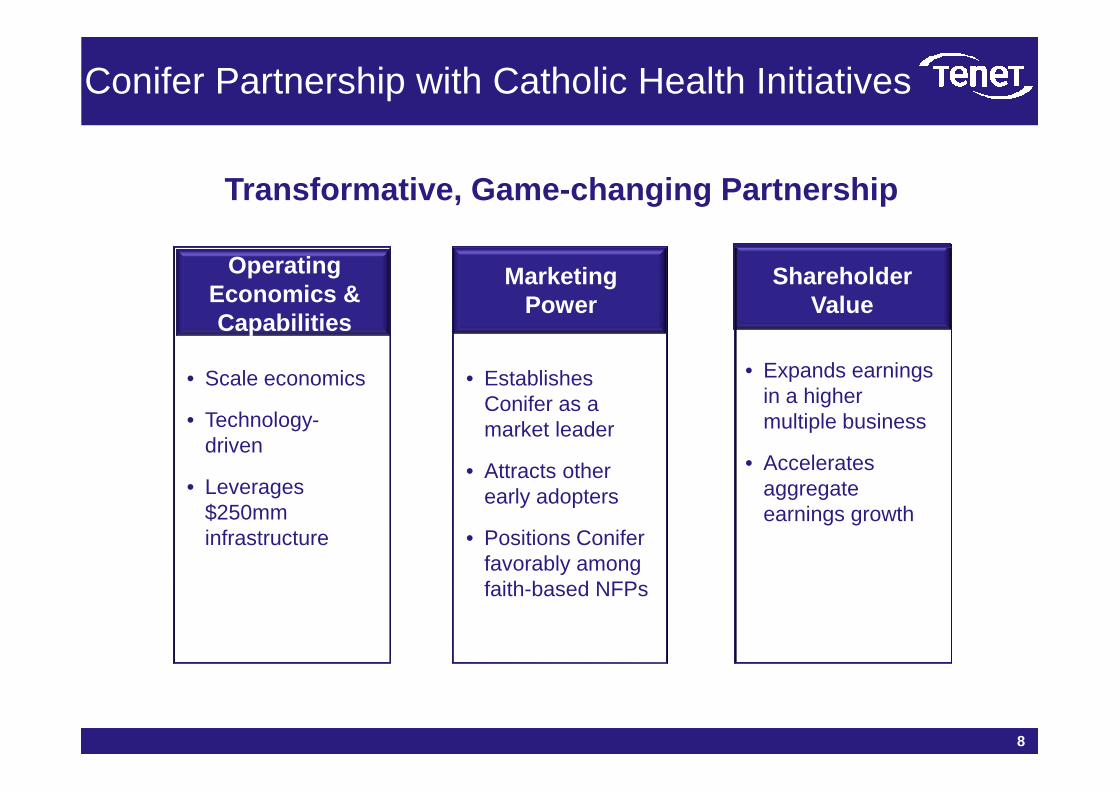
Conifer Partnership with Catholic Health Initiatives
• Establishes Conifer as a
• Expands earnings in a higher
Transformative, Game-changing Partnership
• Scale economics
Shareholder Value
Operating Economics & Capabilities
Marketing Power
8
Conifer as a market leader
• Attracts other early adopters
• Positions Conifer favorably among faith-based NFPs
in a higher multiple business
• Accelerates aggregate earnings growth
• Technology-driven
• Leverages $250mm infrastructure

Conifer with Catholic Health Initiatives (CHI)
Conifer (Prior to CHI Agreement) Conifer (with CHI)
9
Conifer(3/31/12)
Key MetricsConiferwith CHI
4,100 Employees 6,500
300 Healthcare Entity Clients 380
$11 billion Net Revenue Processed Annually $18 billion
5mm Patient Accounts Processed Annually 9.5mm
Conifer Centers of Excellence
Revenue Cycle Management Client Locations
Patient Communications Client Locations
Cap Management Systems Client Locations
CHI Facility
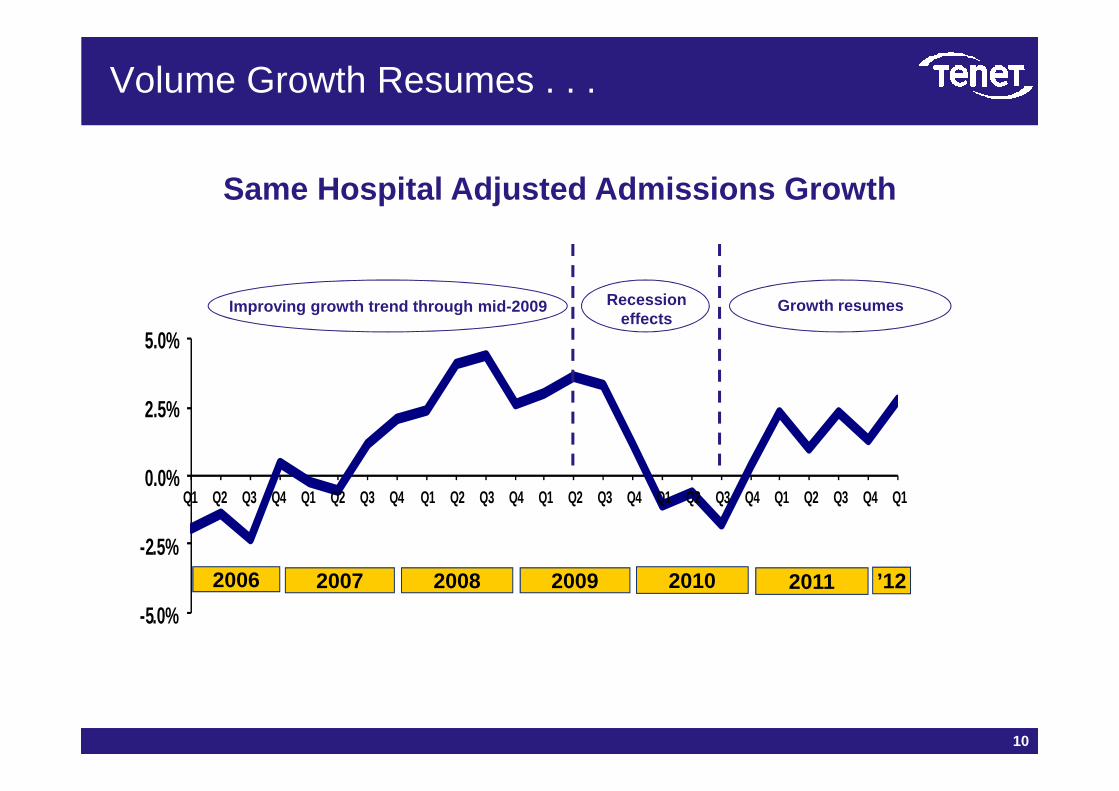
Volume Growth Resumes . . .
5.0%
Growth resumesRecessioneffects
Improving growth trend through mid-2009
Same Hospital Adjusted Admissions Growth
-5.0%
-2.5%
0.0%
2.5%
Q1 Q2 Q3 Q4 Q1 Q2 Q3 Q4 Q1 Q2 Q3 Q4 Q1 Q2 Q3 Q4 Q1 Q2 Q3 Q4 Q1 Q2 Q3 Q4 Q1
2006 2010 20112007 2008 2009 ’12
10
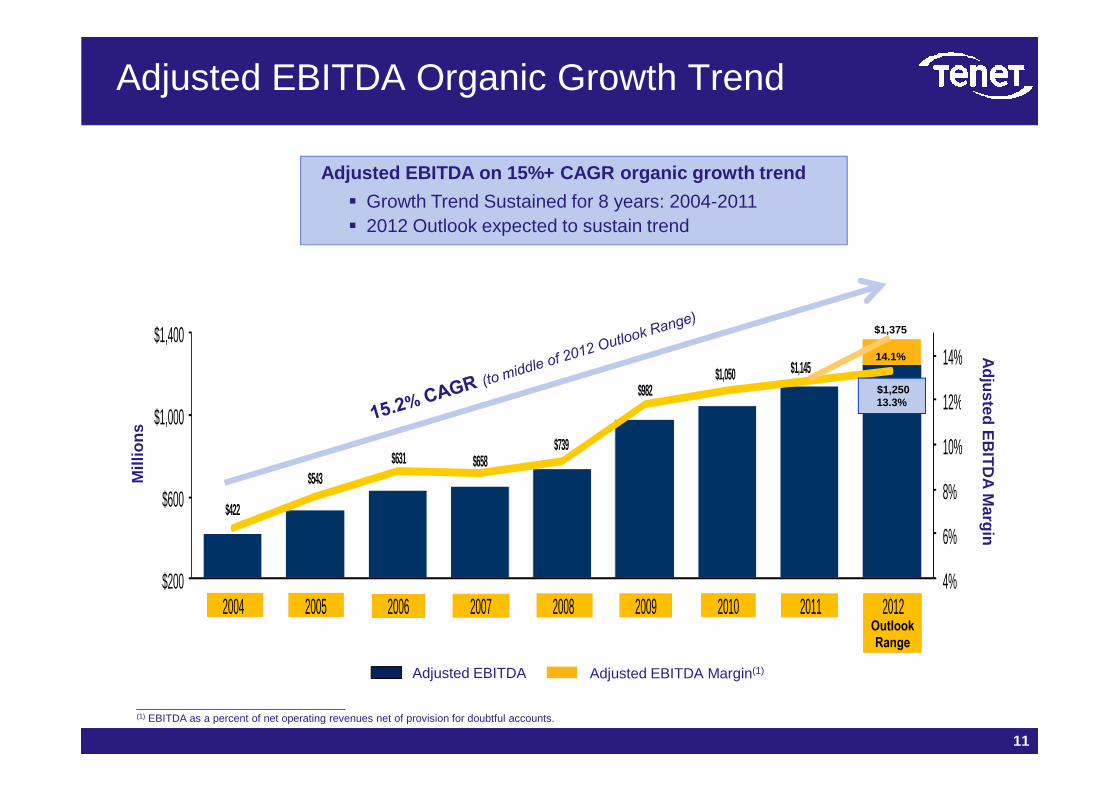
$982 $1,050 $1,145
12%
14%$1,400 $1,375
14.1%
Adjusted EBITDA Organic Growth TrendA
djusted EB
ITD
A Margin
$1,250
Adjusted EBITDA on 15%+ CAGR organic growth trend
� Growth Trend Sustained for 8 years: 2004-2011� 2012 Outlook expected to sustain trend
Outlook
Range
$422
$543 $631 $658
$739
$982
4%
6%
8%
10%
12%
$200
$600
$1,000
2004 2005 2006 2007 2008 2009 2010 2011 2012
Mill
ions
Adjusted E
BIT
DA M
argin
Adjusted EBITDA Adjusted EBITDA Margin(1)
11
___________________________________(1) EBITDA as a percent of net operating revenues net of provision for doubtful accounts.
$1,250 13.3%

Aggressive Balance Sheet Restructuring
565 (1)
Sha
re C
ount
(m
m)
Open market share
repurchase
Upgraded debt rating from Fitch; S&P and Moody’s debt ratings reaffirmed
487 (1)
59 (3)
487 (4) 17 (2)
59 (3)434 (1)
19 (2)
Fully Diluted
12
Mar 312011
Jan 31 2012
Apr 302012
(1) Pro forma fully diluted share count assuming remaining mandatory preferred conversion based on closing common share price on 6/1/12(2) Restricted Stock Units (RSUs) and stock options(3) Pro forma common shares assuming mandatory preferred conversion based on closing common share price on 6/1/12(4) Common shares outstanding
Sha
re C
ount
repurchase program Convertible
preferred repurchase
59 (3)
411 (4) 412 (4)
14 (2)
8 (3)RSUs and Options
Conv. Preferred
Common Shares
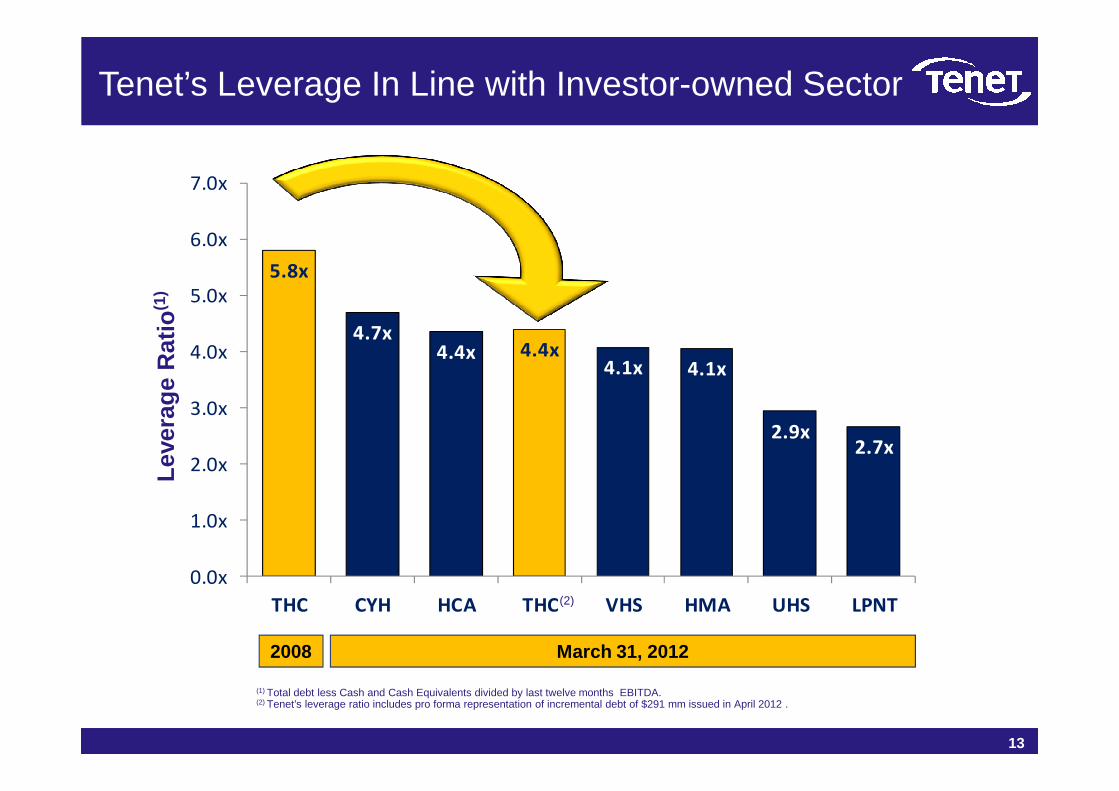
Tenet’s Leverage In Line with Investor-owned Sector
HCA(2)
HMA
CHS
Leve
rage
Rat
io(1
)
5.8x
4.7x4.4x 4.4x
4.1x 4.1x
3.0x
4.0x
5.0x
6.0x
7.0x
LPNT
UHSLeve
rage
Rat
io
13
(1) Total debt less Cash and Cash Equivalents divided by last twelve months EBITDA.(2) Tenet’s leverage ratio includes pro forma representation of incremental debt of $291 mm issued in April 2012 .
VHS2.9x
2.7x
0.0x
1.0x
2.0x
3.0x
THC CYH HCA THC VHS HMA UHS LPNT
2008 March 31, 2012
(2)

Near-term Debt Reduced and Maturities Extended
(millions) December 31, 2008
March 31, 2012 (1)
6.375%
6.5 %
7.375% 9.875%
6.875%
9.25%
$0
$200
$400
$600
$800
$1,000
$1,200
2010 2011 2012 2013 2014 2015 2016 2017 2018 2019 2020 2031
(millions)
6.5 %(2)
7.375%9.875%
6.875%9.25%
10.0%(4)
6.25%(4)
8.875%(4)
8.0%
Weighted Average Maturity of 7.2 years
March 31, 2012 (1)
(1) Includes Q2’12 issuance of $150mm , 8.0% Sr. Unsecured note maturing 08/01/20 and $141mm , 6.25% Sr. Secured note maturing 05/01/18 and repurchase of remaining $1mm, 9.0% Sr. Secured. (2) $57mm matured and retired on 6/1/12. (3) Credit facility - 1 week LIBOR + 2.25%. (4) Secured debt.
2.44%(3)
14
Existing debt as of 12/31/08 Debt issued since 12/31/08 Current Date
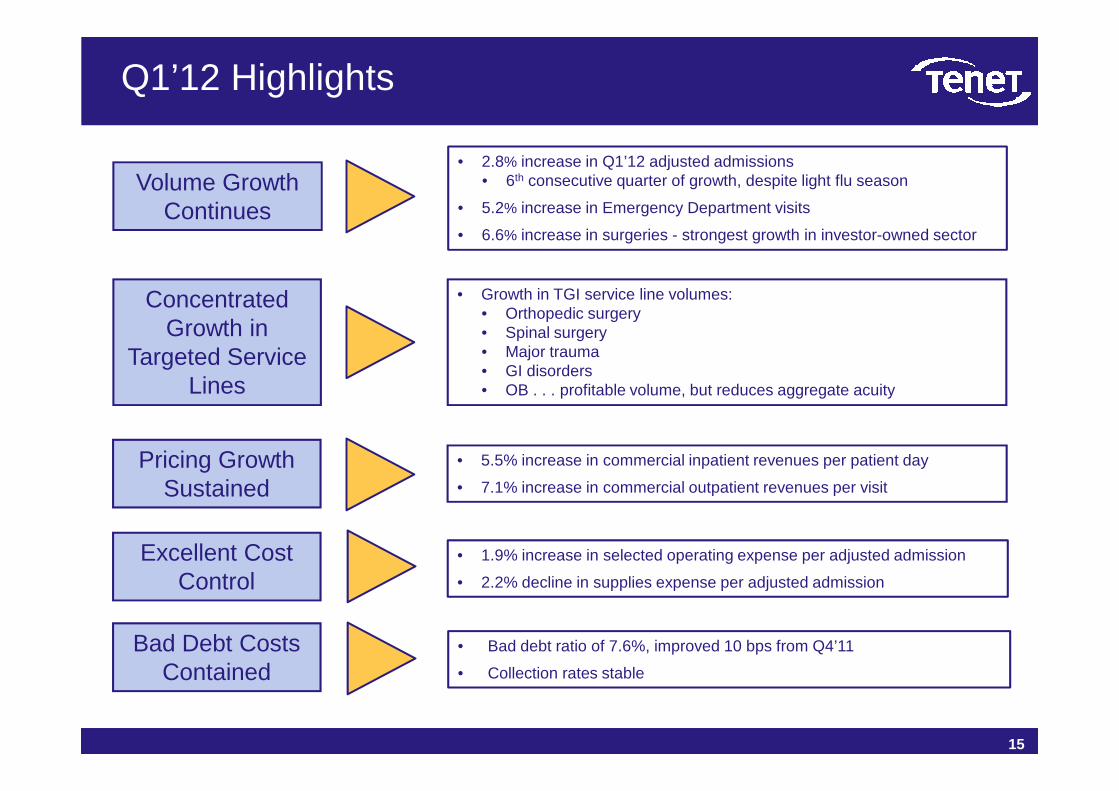
Q1’12 Highlights
• 2.8% increase in Q1’12 adjusted admissions • 6th consecutive quarter of growth, despite light flu season
• 5.2% increase in Emergency Department visits
• 6.6% increase in surgeries - strongest growth in investor-owned sector
• Growth in TGI service line volumes:• Orthopedic surgery• Spinal surgery• Major trauma• GI disorders• OB . . . profitable volume, but reduces aggregate acuity
Concentrated Growth in
Targeted Service Lines
Volume GrowthContinues
• Bad debt ratio of 7.6%, improved 10 bps from Q4’11
• Collection rates stable
• OB . . . profitable volume, but reduces aggregate acuity
• 5.5% increase in commercial inpatient revenues per patient day
• 7.1% increase in commercial outpatient revenues per visit
• 1.9% increase in selected operating expense per adjusted admission
• 2.2% decline in supplies expense per adjusted admission
Lines
Pricing GrowthSustained
Excellent Cost Control
Bad Debt CostsContained
15

Compelling Investment Value
Investment Value
8-year record of 15%+ EBITDA Growth
$1.7 Billion NOL Enhances Cash Flow
Strong Cash Flow Growth Expectation
$2.00/share gap between Tenet’s current multiple and
the industry’s
Value Proven Strategies forFurther Growth
Diversified Earnings Streams include
Conifer Health Solutions
Transparent Disclosure
Upside Potential fromAffordable Care Act and Economic Cycle
16
Sun Belt Markets
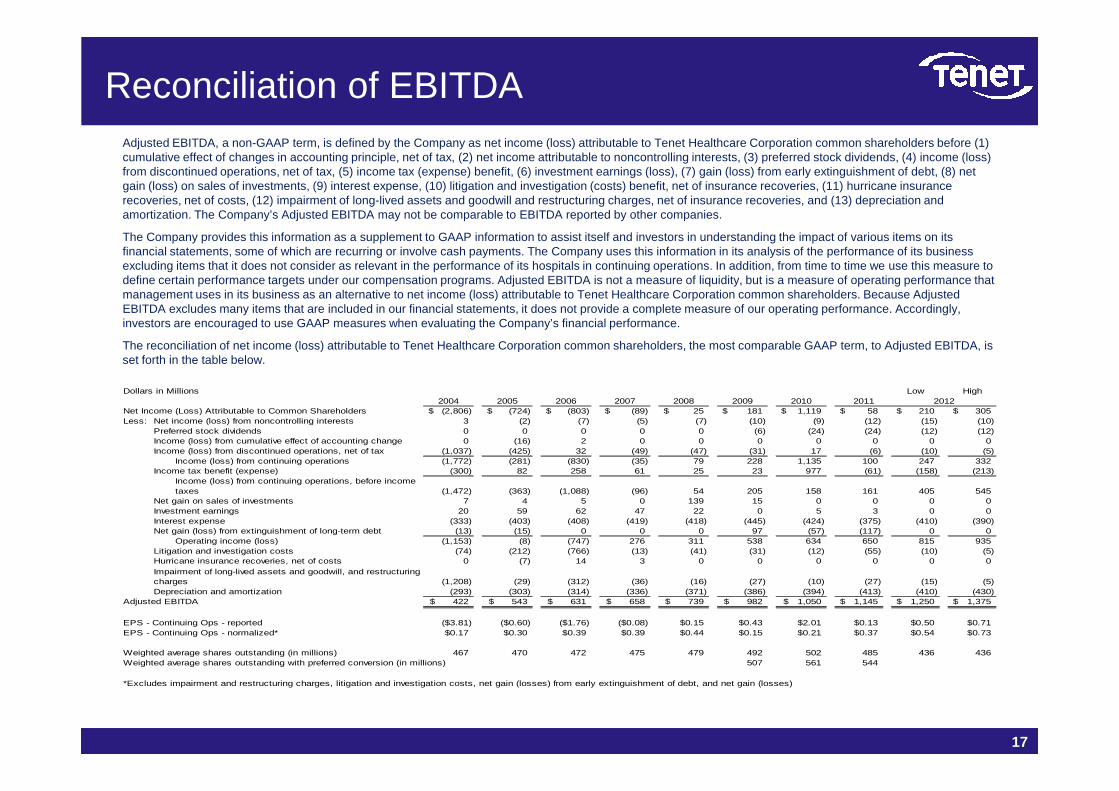
Reconciliation of EBITDAAdjusted EBITDA, a non-GAAP term, is defined by the Company as net income (loss) attributable to Tenet Healthcare Corporation common shareholders before (1) cumulative effect of changes in accounting principle, net of tax, (2) net income attributable to noncontrolling interests, (3) preferred stock dividends, (4) income (loss) from discontinued operations, net of tax, (5) income tax (expense) benefit, (6) investment earnings (loss), (7) gain (loss) from early extinguishment of debt, (8) net gain (loss) on sales of investments, (9) interest expense, (10) litigation and investigation (costs) benefit, net of insurance recoveries, (11) hurricane insurance recoveries, net of costs, (12) impairment of long-lived assets and goodwill and restructuring charges, net of insurance recoveries, and (13) depreciation and amortization. The Company’s Adjusted EBITDA may not be comparable to EBITDA reported by other companies.
The Company provides this information as a supplement to GAAP information to assist itself and investors in understanding the impact of various items on its financial statements, some of which are recurring or involve cash payments. The Company uses this information in its analysis of the performance of its business excluding items that it does not consider as relevant in the performance of its hospitals in continuing operations. In addition, from time to time we use this measure to define certain performance targets under our compensation programs. Adjusted EBITDA is not a measure of liquidity, but is a measure of operating performance that management uses in its business as an alternative to net income (loss) attributable to Tenet Healthcare Corporation common shareholders. Because Adjusted EBITDA excludes many items that are included in our financial statements, it does not provide a complete measure of our operating performance. Accordingly, investors are encouraged to use GAAP measures when evaluating the Company’s financial performance.
The reconciliation of net income (loss) attributable to Tenet Healthcare Corporation common shareholders, the most comparable GAAP term, to Adjusted EBITDA, is set forth in the table below.
Dollars in Millions Low High
1717
2004 2005 2006 2007 2008 2009 2010Net Income (Loss) Attributable to Common Shareholders (2,806)$ (724)$ (803)$ (89)$ 25$ 181$ 1,119$ 58$ 210$ 305$ Less: Net income (loss) from noncontrolling interests 3 (2) (7) (5) (7) (10) (9) (12) (15) (10)
Preferred stock dividends 0 0 0 0 0 (6) (24) (24) (12) (12)Income (loss) from cumulative effect of accounting change 0 (16) 2 0 0 0 0 0 0 0Income (loss) from discontinued operations, net of tax (1,037) (425) 32 (49) (47) (31) 17 (6) (10) (5)
Income (loss) from continuing operations (1,772) (281) (830) (35) 79 228 1,135 100 247 332Income tax benefit (expense) (300) 82 258 61 25 23 977 (61) (158) (213)
Income (loss) from continuing operations, before income taxes (1,472) (363) (1,088) (96) 54 205 158 161 405 545
Net gain on sales of investments 7 4 5 0 139 15 0 0 0 0Investment earnings 20 59 62 47 22 0 5 3 0 0Interest expense (333) (403) (408) (419) (418) (445) (424) (375) (410) (390)Net gain (loss) from extinguishment of long-term debt (13) (15) 0 0 0 97 (57) (117) 0 0
Operating income (loss) (1,153) (8) (747) 276 311 538 634 650 815 935Litigation and investigation costs (74) (212) (766) (13) (41) (31) (12) (55) (10) (5)Hurricane insurance recoveries, net of costs 0 (7) 14 3 0 0 0 0 0 0
(1,208) (29) (312) (36) (16) (27) (10) (27) (15) (5)Depreciation and amortization (293) (303) (314) (336) (371) (386) (394) (413) (410) (430)
Adjusted EBITDA 422$ 543$ 631$ 658$ 739$ 982$ 1,050$ 1,145$ 1,250$ 1,375$
EPS - Continuing Ops - reported ($3.81) ($0.60) ($1.76) ($0.08) $0.15 $0.43 $2.01 $0.13 $0.50 $0.71EPS - Continuing Ops - normalized* $0.17 $0.30 $0.39 $0.39 $0.44 $0.15 $0.21 $0.37 $0.54 $0.73
Weighted average shares outstanding (in millions) 467 470 472 475 479 492 502 485 436 436Weighted average shares outstanding with preferred conversion (in millions) 507 561 544
2012
*Excludes impairment and restructuring charges, litigation and investigation costs, net gain (losses) from early extinguishment of debt, and net gain (losses)
2011
Impairment of long-lived assets and goodwill, and restructuring charges