ten years of change in the humboldt county economy
DESCRIPTION
Ten Years of Change in the Humboldt County Economy. Prof. Erick Eschker and Jessica Digiambattista. The Index of Economic Activity for Humboldt County. Celebrating 10 Years--The Index of Economic Activity for Humboldt County. Professor Erick Eschker, Chair of the Department of Economics - PowerPoint PPT PresentationTRANSCRIPT

Ten Years of Change in the Humboldt County Economy
The Index of Economic Activity for Humboldt County
Prof. Erick Eschker and Jessica Digiambattista

Celebrating 10 Years--The Index of Economic Activity for
Humboldt County• Professor Erick Eschker, Chair of the Department
of Economics• Jessica Digiambattista, student assistant editor• Garrett Perks and Andrea Walters, student
assistant analysts• Founded by Prof. Steve Hackett and Prof. Tim
Yeager• Six previous student assistants

Thanks to Humboldt Bank for use of these great facilities!

Our Sponsoring Business Partners:
• Coast Central Credit Union
Dean Christensen, President, and Dennis Hunter, Vice President of Marketing.
Representing Coast Central Credit Union today are Matt Dennis, Executive Vice President
and Jim Sessa, Vice President and Chief Financial Officer

Our Sponsoring Business Partners:
• Humboldt Bank
Martha Traphagen, Senior Vice President and Area Manager

Our Sponsoring Business Partners:
• North Coast Small Business Development Center
Kristin Roach-Johnson, Executive Director

Our Sponsoring Business Partners:
• Six Rivers Bank
Russ Harris, President and Chief Executive Officer

Thanks to our Data Providers!

What is the Index?
• The only monthly source of broad-based economic indicators for Humboldt County
• Extremely timely--most data are from the previous month
• Leading indicators
• Data since January 1994

What is the Index?
Tracks six sectors of the economy:
• Home sales
• Retail sales
• Energy consumption
• Occupancy rates at hotels/motels/inns
• Employment
• Lumber manufacturing

What does an Index tell us?
• Seasonally adjusted--Units are not dollars
• Index numbers are relative to the base period (January 1994=100)
• Useful for determining percent change
• Dow Jones Industrial Average example

Readershipwww.humboldt.edu/~indexhum/
• Available about the 5th of each month• Steady growth in readership• 95% of readers from outside HSU• E-mail us to join our mailing list
Index Web StatsJanuary 15-June 1
Hits 31,828 (1,469 more than fall 2003)People (hosts) 1,654 (284 more than fall 2003)Visits 4,979 (803 more than fall 2003)
On average, people read 3 out of the 4 editions this spring.

Index Budget2003-2004
Sponsor Contributions $5,500
Student stipends 3000Student webpage stipend 200Project Director 1500Journal subscriptions 200Postage/supplies 200Hospitality 200Phone lines 200
$5,500
Index projects in 2003-2004
• New website
• New layout
• Local Spotlight interviews
• Gasoline prices in Humboldt County

Potential projects
• Housing sales predictor• Form “historical” Index back to 1960• Expansion of retail sector• New service sector
Depends upon continued support from existing and new sponsors!

Demographic Changes
According to the U.S. Census Bureau:
• Humboldt County population has grown 6.2 percent from 1990 to 2000.
• California state population has grown 13.8 percent in the same time.

Demographic Changes
• In Humboldt County the number of households with social security income has grown 9.4 percent from 1990 to 2000.
• Throughout the state this change has been 12.7 percent.

Demographic Changes
• In Humboldt County the number of households with retirement income has grown 10 percent from 1990 to 2000.
• Throughout the state this number has grown 14.5 percent.

Home Sales
• Based on the number of homes that sell in Humboldt County each month.
• Measure is adjusted for seasonal variation.
• Quality of the data is very high.

Changes and TrendsHome sales index has increased by 32 percent since 1994.

Changes and TrendsMedian home prices have increased 97 percent, from $118250 to $232900.
Analysis
• Home sales began increasing before the drop in interest rates.
• Local sales have followed the upward trends seen at the state and national levels.

Projections
• Housing affordability will become more problematic if housing prices continue to rise faster than incomes.
• Some economists speculate there is a housing bubble.

Retail Sector
• Based on seasonally adjusted sales at a range of local retail businesses.
• Measures spending on final goods and services.

Accuracy of the Retail Sales Index
Humboldt County Taxable Sales vs. Retail Index
(not seasonally adjusted)
200
250
300
350
400
97 I II III
IV98
I II III
IV99
I II III
IV00
I II III
IV01
I II III
IV02
I II
Quarter
Sal
es (
mil
lio
n $
)
100
120
140
160
180
Ind
ex V
alu
e
Taxables Sales Retail Index
Correlation of 79.6

Retail Sector TrendsFrom 1994 – 2004 the retail sales index has increased 40 percent.

National Retail TrendsRetail sales increased 58 percent from
1994 – 2003.

Analysis
•Local retail sector did not follow the national trends during the early 1990’s.
•More recently local retail has reflected the national trends.

Projections
• Consumer confidence is currently high.
• EDD predicts that employment in the retail trade sector will increase by 700 jobs from 2001 to 2008.

Electricity Consumption
• Based on seasonally adjusted electricity consumption.
• Measures kilowatt hours of electricity used in Humboldt County.

Quality of the Data
• Correlation between the index and the actual consumption is 100%.
• Data are only received quarterly.

Changes and TrendsFrom 1993 – 2004 electricity consumption has increased by 16 percent.

State Level TrendsStatewide electricity consumption from 1994 – 2001 increased by 10 percent.

Analysis
• Local electricity consumption has followed statewide trends. Both increased rapidly in the late 1990’s, then dropped sharply with the onset of the energy crisis.
• Recent data show local consumption is again trending upward.

ProjectionsThe state electricity forecast predicts that consumption will increase through 2007.

Hospitality Sector
• Based on seasonally adjusted average occupancy each month at a cross section of local hotels, motels and inns
• A measure of the number of tourists who visit the North Coast
• Quality of data is very good

Very similar to series generated by the CA Division of Tourism:
Humboldt County CA Division of Tourism vs. Hospitality Index
(not seasonally adjusted)
0
20
40
60
80
100
2000
2001
2002
2003
Ave
rag
e O
ccu
pan
cy (
%)
0
50
100
150
200
250
300
Ind
ex V
alu
e
CA Division of Tourism Hospitality Index
Correlation of 96.2%

• Unchanged 1994-2001• Drop in occupancy starting in 2002
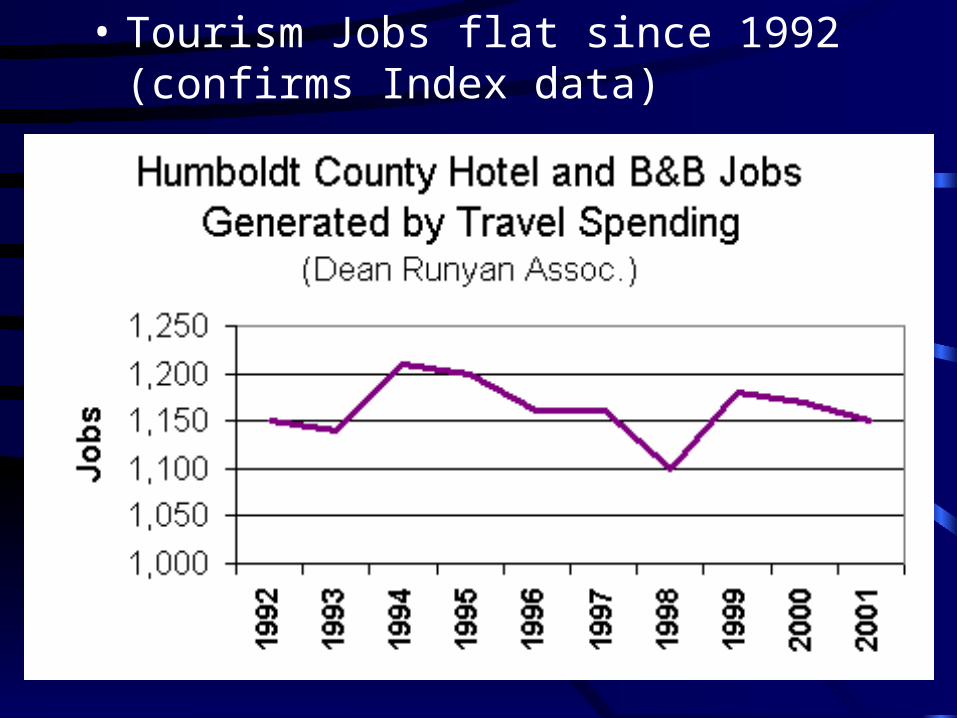
• Tourism Jobs flat since 1992 (confirms Index data)

• U.S. Hotel and Lodging Industry Income rising since 1994
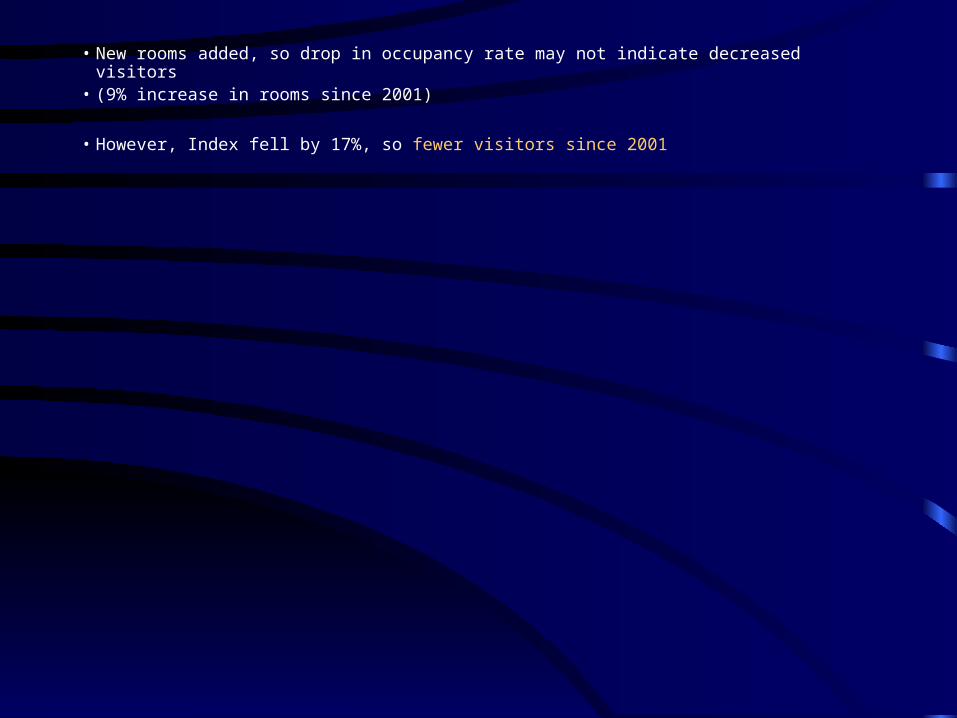
• New rooms added, so drop in occupancy rate may not indicate decreased visitors • (9% increase in rooms since 2001)
• However, Index fell by 17%, so fewer visitors since 2001
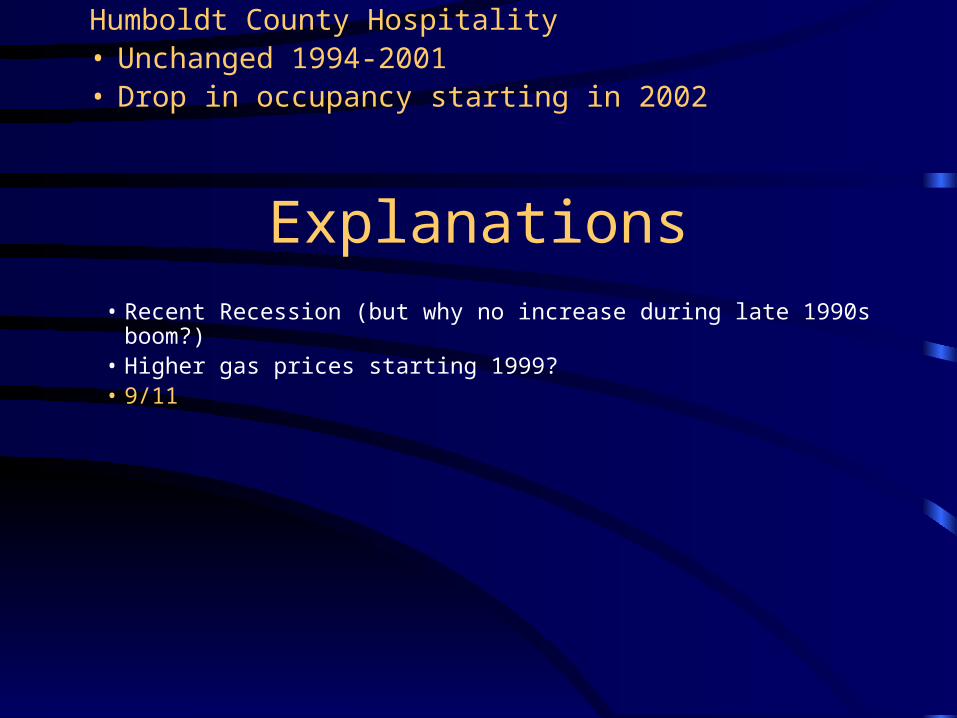
Humboldt County Hospitality• Unchanged 1994-2001• Drop in occupancy starting in 2002
Explanations
• Recent Recession (but why no increase during late 1990s boom?)• Higher gas prices starting 1999?• 9/11

Hospitality Sector Projections
• Depends on people’s willingness to travel
• Depends on easy access to Humboldt County
• EDD predicts employment in Hospitality increasing 22% from 2001 to 2008.
Employment Sector
• Based on seasonally adjusted total county employment as reported by the Employment Development Department
• We report which sectors gained jobs and which sectors lost jobs
• Quality of data is excellent

• Employment peaked 2000 and began mild recovery in 2002 (same as nationally)

U.S. Employment Level(dominated by upward trend)
• Only 5% increase in Employment since 1994 (almost 15% nationally)
• However, national population is growing much faster
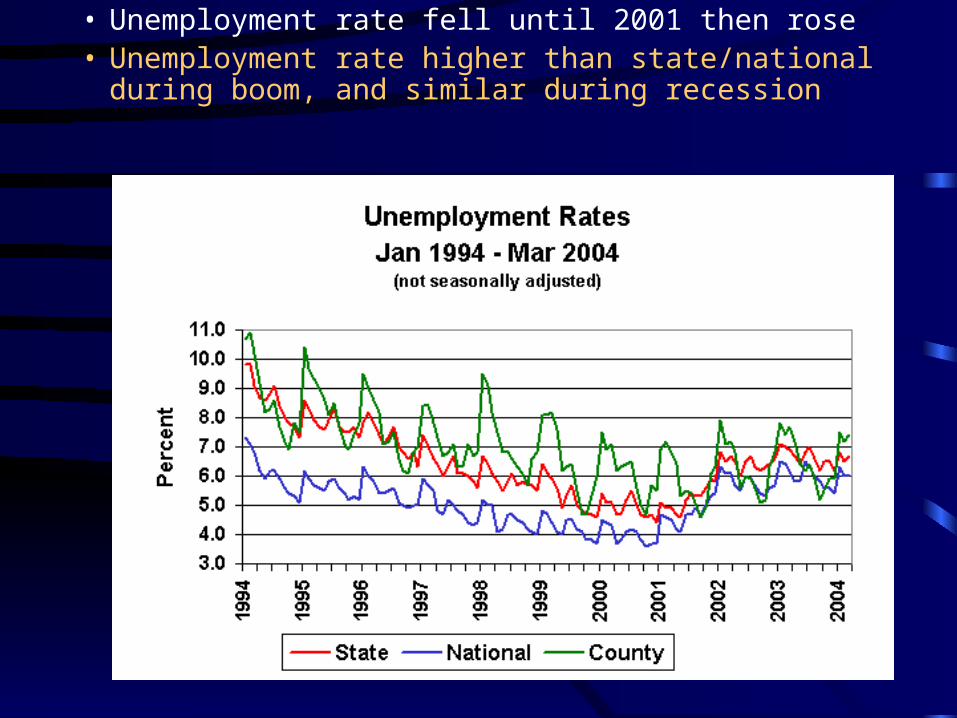
• Unemployment rate fell until 2001 then rose• Unemployment rate higher than state/national during
boom, and similar during recession

No relative change in labor markets within Humboldt County
Annual City labor statistics relative to Humboldt County% of Labor Force % point difference in U-rate
1994 2003 1994 2003Arcata 14% 14% 0.8% 0.7%Blue Lake 1% 1% -2.0% -1.5%Eureka 22% 22% 0.1% 0.1%Ferndale 1% 1% -5.4% -4.1%Fortuna 7% 7% -1.6% -1.2%McKinleyville 9% 9% -1.8% -1.4%Rio Dell 2% 2% 9.3% 7.4%Willow Creek 1% 1% 7.7% 6.1%

EDD projects 5.7% growth in employment 2001-2008
EDD Occupation job growth projections, 2001-2008
Occupation job increaseFive greatestCashiers 220Comb Food Prep & Serving Wrkrs, Incl Fast Food 180Retail Salespersons 140Maids & Housekeeping Cleaners 110Truck Drivers, Heavy & Tractor-Trailer 80
Five leastMachine Feeders & Offbearers -60Secretaries, Except Legal, Medical -40Laborers & Freight, Stock, & Material Movers, Hand -30Elementary School Teachers, Except Special Ed -30Dishwashers -30

Manufacturing Sector
• Based on payroll employment and board feet of lumber production at county lumber companies
• Lumber-based manufacturing generates 60 percent of total county manufacturing employment
• Manufacturing is about 8 percent of total county employment
• Quality of data is very good, but is only a fair representation of overall manufacturing
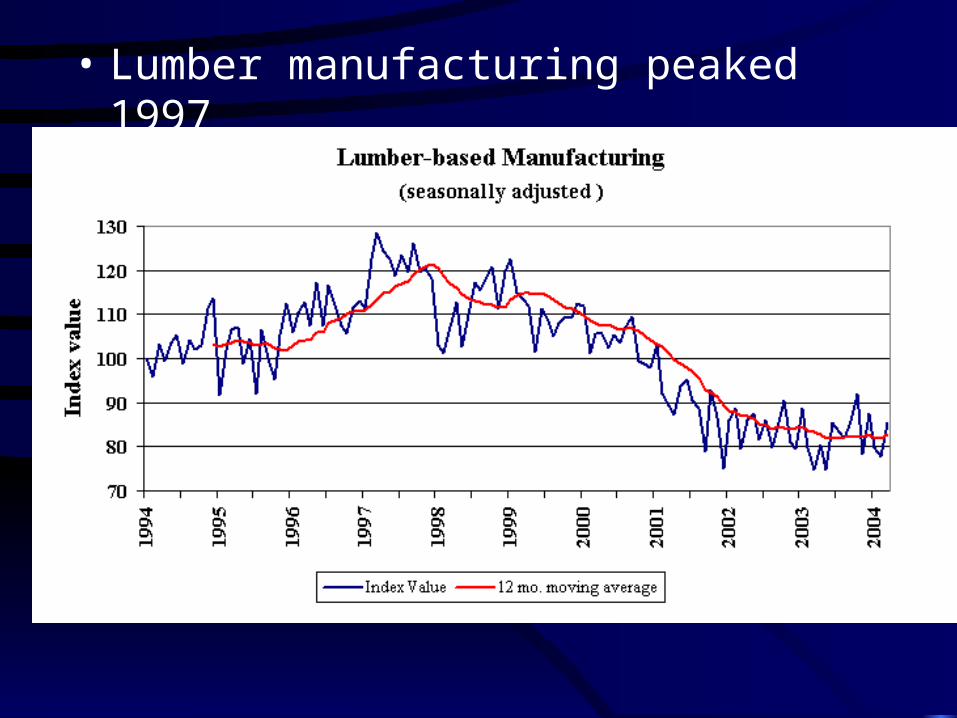
• Lumber manufacturing peaked 1997

• Similar to County Timber Harvest
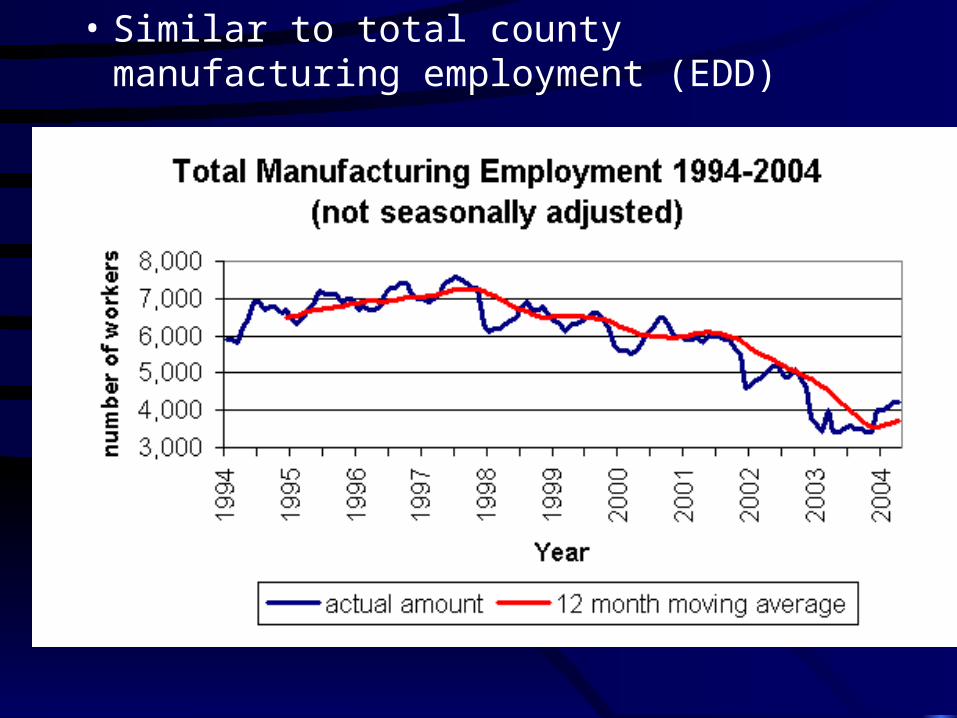
• Similar to total county manufacturing employment (EDD)

• Decline in payroll began later (2000)

• Just as U.S. Total Manufacturing Industry Income peaked in 2000 (BEA)

Manufacturing Sector Projections
• EDD predicts employment in total manufacturing will decrease by 300 jobs (5.7%) from 2001 to 2008.
• EDD predicts employment in lumber & wood products and sawmills will decrease by 800 jobs (13%) from 2001 to 2008.

Composite Index• Measure of overall economic activity• Weighted combination of the six sectors:
Sector weights in Composite Index
Homes 7%Employment 40%Retail 15%Manufacturing 12%Hospitality 14%Energy 12%

• Index peaked in 2000, bottomed out in 2002• Less than 10% growth since 1994
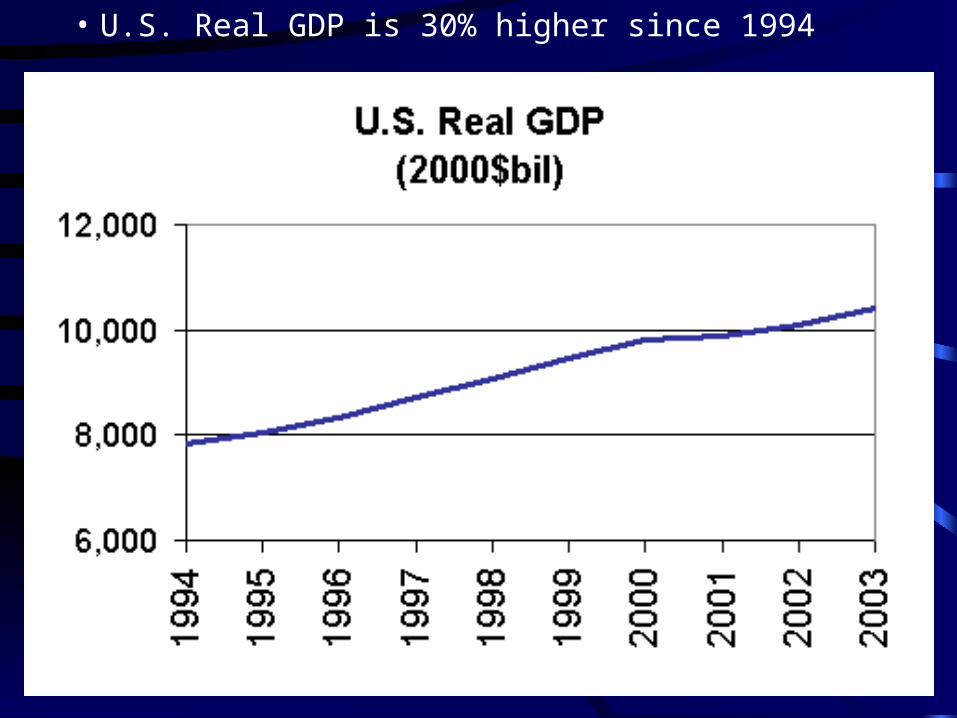
• U.S. Real GDP is 30% higher since 1994

• U.S. Real per capita GDP is 20% higher since 1994

• During 1990s boom, California incomes grew relative to the U.S.

• During 1990s boom, Humboldt County incomes fell relative to the U.S.

Humboldt County Economy 1994-2004
More steady than national/state economy:Grew less during Boom, fell less during Recession
Similar pattern to rural U.S.:• Sharpest decline in Manufacturing• Uneven record in Hospitality, Energy• Largest gains in Retail/Housing

Humboldt County Economy 10-year Projections
• Aging of constant total population• Continued declines in Manufacturing• Increases in Services (low and high value added)• Vulnerable to government budget reductions• Cooling in Housing market• Moderate overall growth