ten-year plan (2008 – 2017) of electric...
TRANSCRIPT

PUBLIC SERVICE COMMISSION OF MARYLAND
TEN-YEAR PLAN (2008 – 2017)
OF ELECTRIC COMPANIES IN MARYLAND
Prepared for the Maryland Department of Natural Resources
In compliance with Section 7-201 of the Maryland Public Utility Companies Article
February 2009

State of Maryland Public Service Commission
Douglas R. M. Nazarian, Chairman Harold D. Williams, Commissioner Allen M. Freifeld, Commissioner Susanne Brogan, Commissioner
Lawrence Brenner, Commissioner
Terry J. Romine Gregory V. Carmean Heather H. Polzin Executive Secretary Executive Director General Counsel
6 St. Paul Street Baltimore, MD 21202 Tel: (410) 767-8000 www.psc.state.md.us
This report was drafted by the Commission’s Integrated Resource Planning Division (Michael Lee, Director) in cooperation with the Demand Side Management Division (Crissy Godfrey, Director), the Electricity Division (Phillip VanderHeyden, Director) and the Engineering Division (E. Frank Bender, Chief Engineer). Electric companies under the Commission’s jurisdiction provided most of the data in the Appendix.

TABLE OF CONTENTS
I. INTRODUCTION............................................................................................................1
II. MARYLAND UTILITY AND PJM ZONAL LOAD FORECASTS ..........................3 A. Discussion....................................................................................................................... 3
III. GENERATION AND SUPPLY ADEQUACY IN MARYLAND................................5 A. Introduction..................................................................................................................... 5 B. Current Maryland Generation Profile and At-Risk Generation Units ............................ 6 C. Potential Generation Additions in Maryland .................................................................. 9 D. Maryland’s Healthy Air Act and Generation Upgrades ............................................... 12 E. CPCN Exemptions for Generation................................................................................ 13 F. Case No 9149, GAP RFPs, and Distributed Generation............................................... 15 G. Regional Reliability Summit......................................................................................... 16 H. The PJM Queue............................................................................................................. 17
IV. ENERGY TRANSMISSION IN PJM AND MARYLAND .......................................21 A. The Regional Transmission Expansion Planning Protocol........................................... 21 B. Proposals for New High Voltage Transmission Lines in PJM ..................................... 24 C. Transmission Congestion in Maryland ......................................................................... 28
V. DEMAND RESPONSE AND CONSERVATION AND ENERGY EFFICIENCY 31 A. Statutory Requirements................................................................................................. 31 B. Demand Response Initiatives........................................................................................ 32 C. Pre-Empower Conservation and Energy Efficiency ..................................................... 35 D. EmPower Maryland Programs...................................................................................... 38 E. Mid-Atlantic Distributed Resources Initiative (“MADRI”) ......................................... 40 F. Advanced Metering Infrastructure / Smart Grid........................................................... 41
VI. ENERGY, THE ENVIRONMENT AND RENEWABLES ......................................44 A. Maryland’s Commission on Climate Change .............................................................. 44 B. The Regional Greenhouse Gas Initiative ...................................................................... 47 C. The Renewable Energy Portfolio Standard Program.................................................... 48 D. Solar Power Requirements in Maryland ....................................................................... 52 E. Small Generators Interconnection................................................................................. 55
VII. ELECTRIC DISTRIBUTION RELIABILITY IN MARYLAND ............................57 A. Electric Distribution Reliability Assurance .................................................................. 57 B. Distribution Reliability Issues....................................................................................... 60 C. Managing Distribution Outages.................................................................................... 63 D. Distribution Planning Process....................................................................................... 69
VIII. MARYLAND ELECTRICITY MARKETS................................................................74 A. Status of Retail Electric Choice in Maryland ............................................................... 74 B. Standard Offer Service.................................................................................................. 76
1
IX. PJM AND REGIONAL ENERGY ISSUES AND EVENTS .....................................78 A. Overview of PJM, OPSI, and Reliability First ............................................................. 78 B. PJM Summer Peak Events of 2007 and 2008............................................................... 80 C. Electricity Imports and Exports within PJM................................................................. 82 D. PJM’s Reliability Pricing Model .................................................................................. 84 E. Demand Response in PJM Markets .............................................................................. 89
X. FEDERAL AND NATIONAL ENERGY ISSUES IMPACTING MARYLAND....95 A. NERC Report to FERC on 2008 Summer Operations and Standards Compliance...... 95
APPENDIX...............................................................................................................................97 Table A-1: Utilities Providing Retail Electric Service in Maryland.................................... 98 Table A-2: Number of Customers by Customer Class (As of December 31, 2007) ........... 99 Table A-3: Sales by Customer Class (As of December 31, 2007; GWh).......................... 100 Table A-4: Typical Monthly Utility Bills in Maryland, (Winter 2008)............................. 101 Table A-5(a): System-Wide Peak Demand Forecast (Net of DSM Programs: MW)........ 102 Table A-5(b): Maryland Peak Demand Forecast (Net of DSM Programs; MW).............. 103 Table A-5(c): System-wide Peak Demand Forecast (Gross of DSM Programs; MW) ..... 104 Table A-5(d): Maryland Peak Demand Forecast (Gross of DSM Programs; MW) .......... 105 Table A-6(a): System-Wide Energy Sales Forecast (Net of DSM Programs; GWh)........ 106 Table A-6(b): Maryland Energy Sales Forecast (Net of DSM Programs; GWh).............. 107 Table A-7: Licensed Electric and Natural Gas Suppliers and Brokers /Aggregators........ 108 Table A-8: Transmission Enhancements by Service Area ................................................ 113 Table A-9: Renewable Projects Providing Capacity and Energy to Maryland Customers 115 Table A-11: Comparison of Residential Demand Response Programs in Maryland ........ 116
2
LIST OF MAPS, TABLES, AND CHARTS Map I.1: Maryland Utilities and their Service Territories in Maryland................................. 2 Table III.A.1: Generation by Owner, County, and Capacity ................................................. 8 Table III.A.2: Maryland Generating Capacity Profile (as of January 1, 2009) ..................... 6 Table III.A.3: Maryland Electric Power Generation Profile.................................................. 7 Table III.B.1: New Generating Resources Planned for Construction in Maryland .............. 10 Table III.D.1: Emission Related Upgrades for Coal-fired Plants ......................................... 12 Table III.E.1: CPCN Exemptions Granted, Since October 2001.......................................... 15 Table VI.A.1: Maryland Commission on Climate Change Goals ....................................... 44 Table VI.A.3: Maryland Commission on Climate Change Recommended Actions ........... 45 Table VI.B.1: Annual Emissions Budget (2009 – 2014) ..................................................... 47 Chart VI.C.1: MD RPS Certified Rated Capacity by State (as of 11/1/2008)...................... 51 Table VI.C.1: Updated RPS Percentage Requirements ....................................................... 52 Table VI.D.1: Updated RPS Compliance Fee Schedule...................................................... 53 Table VIII.A.1: Electric Choice Enrollment in Maryland .................................................... 75 Map IX.A.1: PJM Zones....................................................................................................... 79 Table IX.B.1: Summer 2007 and Summer 2008 Coincident Peaks and Zone LMP ........... 81 Table IX.E.1: Maryland Electricity Net Imports, 2002-2006.............................................. 82 Table IX.E.2: State Electricity Imports for Year 2007 ........................................................ 83 Table IX.E.3: State Electricity Exports for Year 2007 ........................................................ 84 Table IX.F.1: Results for First Four RPM Transitional Auctions ....................................... 87 Table IX.F.2: Results for First RPM Regular Auction ........................................................ 88 Table IX.H.1: Energy Program Registration: Within 2002 to 2007 .................................... 90 Table IX.H.2: Emergency Program Registration: Within 2002 to 2006 ............................. 91 Table IX.H.3: Performance of Emergency Program Participants........................................ 92
3
LIST OF ACRONYMS AND DEFINITIONS USED A&N A&N Electric Cooperative ACEEE American Council for an Energy Efficient Economy AMI Advanced Metering Infrastructure AP / PE The Potomac Edison Company d/b/a Allegheny Power Berlin Town of Berlin Blueprint Plan Blueprint for the Future Plan BGE Baltimore Gas and Electric Company BRAC Base Realignment and Closing Commission BTU British thermal unit C&I Commercial and Industrial CAISO California Independent System Operator CCM Capacity Credit Market CEG / Constellation Constellation Energy Group CETL Capacity Emergency Transfer Limit CETO Capacity Emergency Transfer Objective CFL Compact Fluorescent Light bulbs Choptank Choptank Electric Cooperative CIS Customer Information System CO2 Carbon Dioxide COMAR Code of Maryland Regulations Commission / MDPSC Public Service Commission of Maryland CONE Cost of New Entry CPCN Certificate of Public Convenience and Necessity CSA Construction Service Agreement CSP Curtailment Service Providers CWIP Construction Work in Progress D.C. District of Columbia DFAX distribution factors DG Distributed Generation DNR Department of Natural Resources (Maryland) DOE Department of Energy DPL / Delmarva Delmarva Power and Light Company DR Demand Response (or Resource) DRI Demand Response Initiative DSM Demand Side Management DSRWG Demand Side Response Working Group Easton Easton Utilities Commission EDC Electric Distribution Company EE&C Energy Efficiency & Conservation EIA Energy Information Administration Electric Act Electric Customer Choice and Competition Act of 1999 EMAAC Eastern Mid-Atlantic Area Council EMS Energy Management System EPA Environmental Protection Agency
4
EPAct Energy Policy Act ERCOT Electric Reliability Council of Texas ERO Electric Reliability Organization ESA 2007 Energy and Security Act of 2007 ESP Electro-Static Precipitator ETR Estimated Time of Restoration EVA Economic Value Added FERC Federal Energy Regulatory Commission FGD Flue Gas Desulfurization (System) FRR Fixed Reserve Requirement FTR Financial Transmission Right GATS Generation Attributes Tracking System GIS Geographic Information System GW/GWh Gigawatt/Gigawatt-hours HAA Healthy Air Act Hagerstown Hagerstown Municipal Electric Light Plant Hg Mercury HVAC Heating, Ventilation, and Air Conditioning HVDC High Voltage Direct Current HVCS High Volume Call Service IEEE Institute of Electrical and Electronics Engineers IOU Investor-Owned Utility IRM Installed Reserve Margin ISA Interconnection Service Agreement ISO Independent System Operator ISO-NE ISO-New England IVR Interactive Voice Response kV Kilovolt kW/kWh Kilowatt/Kilowatt-hours LDA Load Deliverability Area LMP Locational Marginal Price LNG Liquefied Natural Gas LSE Load Serving Entity MAAC Mid-Atlantic Area Council MACRUC Mid-Atlantic Conference of Regulatory Utilities
Commissions MADRI Mid-Atlantic Distributed Resources Initiative MAPP Mid-Atlantic Power Pathway MBR Market-Based Rate MDE Maryland Department of the Environment MDM Meter Data Management System MDS Mobile Dispatch System MEA Maryland Energy Administration MERTT Maryland Electric Reliability Tree Trimming (Council) MISO Midwest Independent (Transmission) System Operator MMU Market Monitoring Unit (PJM)
5
MOU Memorandum of Understanding MW/MWh Megawatt/Megawatt-hours NERC North American Electric Reliability Council NIETC National Interest Electric Transmission Corridors (DOE) NIST National Institute of Standards and Technology NOx Nitrous Oxides NYISO New York Independent System Operator O&M Operation and Maintenance OA Operating Agreement (PJM) OATT Open Access Transmission Tariff (PJM) ODEC Old Dominion Electric Cooperative OFA Over Fire Air OMS Outage Management System OPC Office of People’s Counsel (Maryland) OPSI Organization of PJM States, Inc. PATH Potomac-Appalachian Transmission Highline PE / AP The Potomac Edison Company d/b/a Allegheny Power Pepco Potomac Electric Power Company PHI Pepco Holding, Inc. PJM PJM Interconnection, LLC (Pennsylvania-Jersey-Maryland) PJM-EIS PJM – Environmental Information Systems, Inc PPRP Power Plant Research Program PSC Public Service Commission PUC Public Utility Commission PURPA Public Utility Regulatory Policies Act (of 1978) PV Photo-voltaic QF Qualifying Facility REC Renewable Energy Credit RFC Reliability First Corporation RFP Request for Proposal RGGI Regional Greenhouse Gas Initiative RIM Rate Impact Measure ROE Return on Equity ROW Right-of-Way RPM Reliability Pricing Model (PJM) RPPWG Regional Planning Process Working Group RPS Renewable Energy Portfolio Standard RPS Legislation PUC Article § 7-701 et seq. RTEP Regional Transmission Expansion Plan RTEPP Regional Transmission Expansion Planning Protocol RTO Regional Transmission Organization SACR Selective Auto-Catalytic Reduction SAIDI System Average Interruption Duration Index SAIFI System Average Interruption Frequency Index SCADA Supervisory Control and Data Acquisition SCR Selective Catalytic Reduction
6

SERC Southeast Reliability Council SMECO Southern Maryland Electric Cooperative, Inc. SO2 Sulfur Dioxide Somerset Somerset Rural Electric Cooperative SOS Standard Offer Service SPP Southwest Power Pool Staff Technical Staff of the Maryland PSC SWMAAC Southwest Mid-Atlantic Area Council TEAC Transmission Expansion Advisory Committee (PJM) Ten-Year Plan Ten-Year Plan of Electric Companies in Maryland Thurmont Thurmont Municipal Light Company TrAIL Trans-Allegheny Interstate Line TRC Total Resource Cost TWG Technical Working Group Williamsport Town of Williamsport WMS Work Management System
7
I. INTRODUCTION
Section 7-201 of the Public Utility Companies Article, Annotated Code of Maryland, requires the Maryland Public Service Commission (“Commission” or “PSC” or “MD PSC”) to forward a Ten-Year Plan to the Secretary of Natural Resources on an annual basis. This report constitutes that effort for the 2008-2017 timeframe, and the referenced data and information is as it existed as of December 31, 2008. It is a compilation of information on long-range plans of Maryland electric utilities. This report also includes summaries of events that have or may affect the electric utility industry in Maryland in the near future. To meet its obligations to ratepayers, the reliability of Maryland’s electricity supply is now the principle focus of the Commission. Competitive markets have not produced new generating plants within the State, and newly planned – but yet to be constructed – interstate transmission lines that are essential to deliver additional electricity to the State are beyond the Commission’s control. The Commission, as detailed in this report, is making efforts on several fronts, challenging wholesale power policies at the Federal Energy Regulatory Commission (“FERC”), working with the wholesale market operator PJM to effectuate positive market results, taking independent action to procure new generation in the State, directing new utility investment in demand response programs to reduce peak electricity demand, evaluating conservation and energy efficiency programs to meet EmPower Maryland peak and energy reductions,1 and encouraging better use of emergency generation within the State to preserve reliability in the State.
Section II of this plan addresses the peak demand load forecast for Maryland and establishes the baseline load requirements for the next ten years. Section III provides information on generation, including certificates of public convenience and necessity (“CPCNs”), and forecasts the availability of generation to meet load requirements. Section IV reviews transmission issues impacting Maryland including the Department of Energy’s National Interest Electric Transmission Corridors. Section V addresses the need for energy efficiency, conservation, and demand response as part of Maryland’s supply resources and discusses the effort required to meet the Governor’s “EmPower Maryland” goals. As the environment continues to play an increasingly important role in energy decisions, Section VI discusses climate change, Maryland’s involvement in the Regional Greenhouse Gas Initiative, and issues involving the growth of renewable generation. Section VII provides information on distribution reliability, the manner in which utilities have managed outages and how they plan to meet load requirements.
Beginning with Section VIII, we broaden our perspective and review Maryland’s Electricity Market in general terms and its relation to Commission efforts that are currently underway or anticipated. Section IX discusses PJM and the impact that market rule changes have had both regionally and in Maryland. Section X reviews national issues and the impact generated by FERC rulings and the Department of Energy actions. Also included in the Ten-Year Plan is an Appendix that contains a compilation of data provided 1 EmPower Maryland Energy Efficiency Act of 2008, Chapter 131, Laws of Maryland, which amended § 7-
211 of the Public Utility Companies Article.
1

by Maryland’s utilities summarizing, among other things, demand and sales anticipated over the next 15 years.
The Maryland energy service territory is geographically divided among thirteen electric utilities. Four of the largest are investor-owned utilities (“IOUs”), four are electric cooperatives (two of which serve only small areas of Maryland) and five are electric municipal operations.2 Table A-1 in the Appendix lists the utilities providing retail electric service in Maryland and Map I.1 below provides a geographic picture of the utilities’ service territories.
Map I.1: Maryland Utilities and their Service Territories in Maryland
2 The St. Michaels Utilities Commission service territory was transferred to Choptank Electric Cooperative,
Inc.
2

II. MARYLAND UTILITY AND PJM ZONAL LOAD FORECASTS
A. Discussion
The foundation of an analysis for meeting Maryland’s electricity needs starts with a forecast of the anticipated demand over a relevant planning horizon. The Commission evaluates forecasts from individual utilities, and the PJM regional forecasts provide for separate transmission owner zones.3 PJM operates the wholesale power market in the mid-Atlantic region and dispatches power plants to serve load on an economic bid basis, subject to transmission capacity availability. Because the PJM forecasts impacts consumer prices at the retail level, the Commission closely monitors the development of PJM regional forecasts.
While forecasts can rely on similar economic data, there can be significant differences in the forecasts of peak demand and energy usage created to a large degree by the assumptions used to produce the forecasts. The expected growth in peak demand and electricity usage is due primarily to expected increases in population and economic activity, which have a direct impact on electricity consumption levels. Key forecast variables include economic and non-economic variables. Economic variables used in forecast models can include gross domestic product, employment, energy prices, and population. Non-economic variables can include weather normalized variables, monthly seasonal variables, ownership of appliances, and building codes.
The utilities’ peak demand and energy sales forecasts as supplied in response to Commission data requests are compiled in Appendices A5 and A6. The declining economic conditions of 2008 are not fully captured in the utility load forecasts included in this report. Utility provided forecasts were prepared in the fall of 2008 and, for the most part, assumed a traditional economic recession. A longer, deeper recession is now predicted by most economists. Commission Staff continues to monitor and review the peak demand and energy sales forecasts of PJM for each transmission zone serving Maryland. Through the PJM stakeholder process, Staff has expressed concerns with the draft 2009 PJM load forecast, which is used for transmission planning purposes and to develop the amount of capacity to be purchased from generators for the planning year 2012-2013 PJM capacity auction. Of particular interest is PJM’s summer peak load growth rate for the BGE service territory. Staff expressed concern that the ten year annualized growth rate has increased over 220 percent from approximately 1.0 percent in the 2008 forecast to 2.2 percent in the 2009 forecast. On December 9, 2008, PJM stated that a review of economic data indicated the recession will be deeper and longer than expected; therefore, PJM produced a revised load 3 PJM transmission owner zones typically correlate with the investor-owned utility (“IOU”) service
territories. The four IOUs operating in Maryland are Baltimore Gas and Electric Company (“BGE), Potomac Electric Power Company (“Pepco”), Delmarva Power and Light Company (“DPL”), and The Potomac Edison Company d/b/a Allegheny Power (“AP” or “Allegheny”). PJM zones for three of the four IOUs traverse state bounds and extend into other jurisdictions. Pepco, DPL and AP company data are a subset of the PJM zonal data, since PJM’s zonal forecasts are not limited to Maryland. The BGE zone, alone, resides strictly within the State of Maryland.
3

forecast report. The revised forecast results in lower peak demand and energy sales forecasts for certain service territories within the PJM region; including a significant reduction to 1.8 percent for the BGE service territory.
4
III. GENERATION AND SUPPLY ADEQUACY IN MARYLAND
A. Introduction Pursuant to the Maryland Electric Choice and Competition Act of 1999, the Commission must maintain electric system reliability in the State. The Commission recognizes that in order to maintain electric system reliability and an adequate supply of electricity for customers in the future, access to adequate electric generating capacity must be available to meet customer demand.
A critical requirement for reliable electric service is an appropriate level of generation and transmission capacity to meet Maryland consumers’ energy needs. While reliability needs may be partially met through local demand side management programs and the import of low-cost electricity via high-voltage transmission lines, in-state generation must be maintained and is also essential to keep the lights on and the power grid operating effectively and economically. As of December 2007, Maryland’s net summer generating capacity was 12,675 megawatts (MW). Simultaneously, Maryland’s total peak load requirement was approximately 17,500 MW (16,100 MW of actual demand plus a reserve margin of 1,400 MW for a total requirement of 17,500 MW.) Therefore, nearly 4,800 MWs of capacity in the transmission system served to meet Maryland’s peak load requirements. Similarly, with respect to energy needs, Maryland retail sales were approximately 65,250 (GWh).4 The total energy need including transmission and distribution line losses was approximately 70,500 GWh. Maryland’s fleet of power plants generated a total of approximately 50,000 GWh in 2008; imports from neighboring states provided for approximately 20,500 GWh of the State’s electricity requirements.
All major utility systems in the eastern half of the United States and Canada are interconnected and operate synchronously as part of the Eastern Interconnection. PJM operates, but does not own, the transmission systems in Maryland, all or part of 12 other states, and the District of Columbia. With FERC approval, PJM undertakes this task in order to coordinate the movement of wholesale electricity and provide access to the transmission grid for utility and non-utility users alike. Within the PJM region, power plants are dispatched to meet load requirements without regard to operating company boundaries. Generally, adjacent utility service territories import or export wholesale electricity as needed to reduce the total amount of installed capacity required by balancing retail load and generation capacity over a regional, diversified system.
Maryland and the surrounding states of Delaware, New Jersey, and Virginia, as well, as the District of Columbia continue to be net importers of electricity. Maryland imported nearly 30% of its electricity in 2007. On an absolute basis, Maryland is the fourth largest electric energy importer in the United States – surpassed by two other Eastern States: New Jersey and Virginia and California. Nearby, the District of Columbia and Delaware are also large importers, ranking 6th and 12th respectively, out of the top jurisdictions to import power in the United States.5 Much of the East Coast is dependent on generation exported 4 See Tables IX.E.1 and IX.E.2 in Section IX. 5 Source: Energy Information Administration.
5

from states to the west of the region – many with low-cost, largely depreciated, coal-fired generation assets. Prominent states currently exporting more electricity in aggregate than is consumed are Pennsylvania, West Virginia, and Kentucky.
B. Current Maryland Generation Profile and At-Risk Generation Units Most electric generating capacity in Maryland is provided via coal-fired power plants, which contribute 40% of the summer peak capacity available in-state. The vast majority of the State’s coal-fired generation capacity (nearly 70%) is provided by power plants 30 or more years old. The only units built within the last thirty-five years are the two Brandon Shores plants (646 and 643 MW, 1984 and 1991) and the AES Warrior Run plant (180 MW, 1999). The other major coal facilities in Maryland include Morgantown (1,492 MW); Chalk Point (2,428 MW); Dickerson (853 MW); H.A. Wagner (1,007 MW); and C.P. Crane (399 MW). About 24% of all capacity burns oil as either the primary or sole fuel source, and the majority of these facilities are aging. Overall, only 22% of the State’s summer generating capacity has been constructed in the past twenty years as Table III.B.1 displays.
Table III.B.1: Maryland Generating Capacity Profile (as of January 1, 2009)
Capacity Age of Plants, by % of Fuel Type
Primary Fuel Type Summer (MW)
Pct. of Total
1-10 Years
11-20 years
21-30 years
31+ years
Coal 4,966 39% 3.6% 13.0% 13.6% 69.8% Dual-fired* 3,272 26% 2.3% 35.7% 18.7% 43.4% Nuclear 1,735 14% 0.0% 0.0% 0.0% 100.0% Gas 1,125 9% 57.4% 0.0% 0.2% 42.6% Petroleum 879 7% 1.4% 2.5% 0.2% 95.8% Hydroelectric 567 4% 0.0% 0.0% 0.1% 99.8% Other Renewables 132 1% 12.2% 40.9% 47.1% 0.0% TOTAL 12,675 100% 7.3% 14.9% 10.7% 67.1%
*Dual-fired plants primary fuel types: 66.07% Oil; 33.93% Gas. Due to rounding, figures may not add to total shown.
Although no significant generation has been constructed in Maryland within the past
few years, no units have retired. The Gould Street plant (101 MW), located in the BGE zone was deactivated in 2003, until being reactivated in June 2008.
While no generating facilities in Maryland are scheduled for retirement, a few of the
older generating units in the PJM region near Maryland have requested deactivation. Although largely comprised of older generating units, which may only come online during periods of peak usage and therefore for only a few hours during a year, these high-cost units are helpful in ensuring reliable electric service in the region. However, absent the construction of economically reasonable generation or transmission solutions, these older units also contribute to significant price increases experienced in and around Maryland, particularly in the summer months.
6
Recently nearby facilities have been either retired or are slated for retirement. In
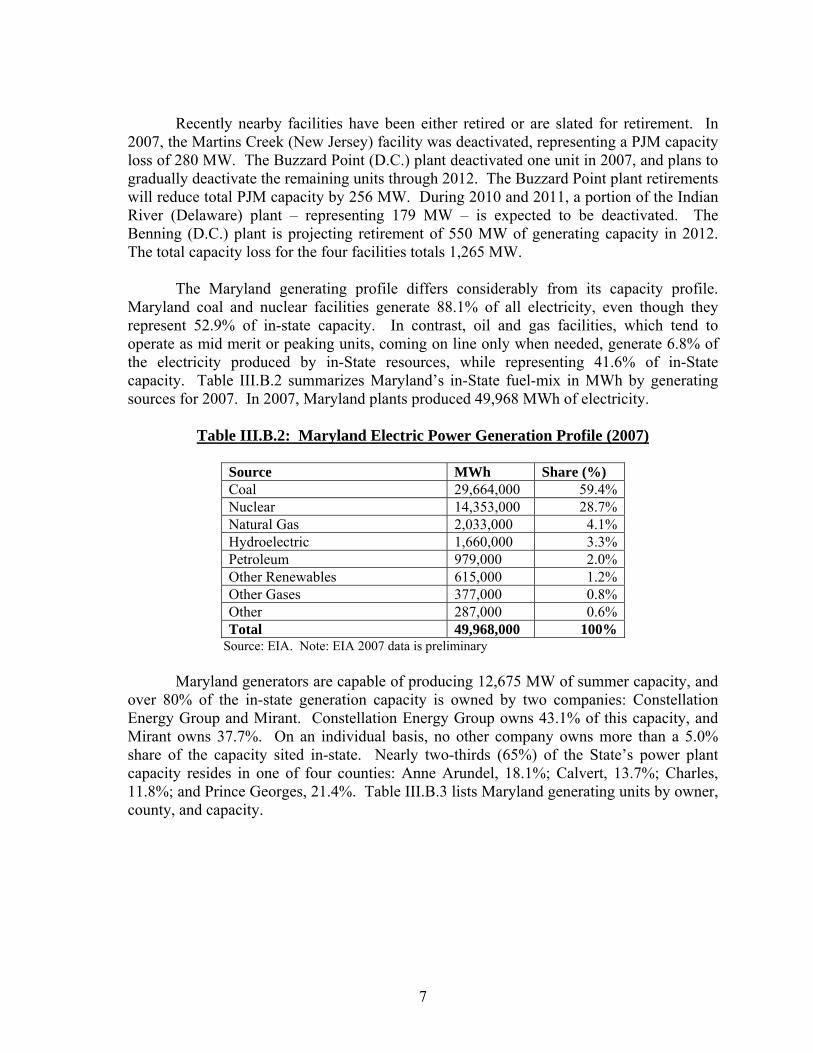
2007, the Martins Creek (New Jersey) facility was deactivated, representing a PJM capacity loss of 280 MW. The Buzzard Point (D.C.) plant deactivated one unit in 2007, and plans to gradually deactivate the remaining units through 2012. The Buzzard Point plant retirements will reduce total PJM capacity by 256 MW. During 2010 and 2011, a portion of the Indian River (Delaware) plant – representing 179 MW – is expected to be deactivated. The Benning (D.C.) plant is projecting retirement of 550 MW of generating capacity in 2012. The total capacity loss for the four facilities totals 1,265 MW. The Maryland generating profile differs considerably from its capacity profile. Maryland coal and nuclear facilities generate 88.1% of all electricity, even though they represent 52.9% of in-state capacity. In contrast, oil and gas facilities, which tend to operate as mid merit or peaking units, coming on line only when needed, generate 6.8% of the electricity produced by in-State resources, while representing 41.6% of in-State capacity. Table III.B.2 summarizes Maryland’s in-State fuel-mix in MWh by generating sources for 2007. In 2007, Maryland plants produced 49,968 MWh of electricity.
Table III.B.2: Maryland Electric Power Generation Profile (2007)
Source MWh Share (%) Coal 29,664,000 59.4% Nuclear 14,353,000 28.7% Natural Gas 2,033,000 4.1% Hydroelectric 1,660,000 3.3% Petroleum 979,000 2.0% Other Renewables 615,000 1.2% Other Gases 377,000 0.8% Other 287,000 0.6% Total 49,968,000 100%
Source: EIA. Note: EIA 2007 data is preliminary Maryland generators are capable of producing 12,675 MW of summer capacity, and over 80% of the in-state generation capacity is owned by two companies: Constellation Energy Group and Mirant. Constellation Energy Group owns 43.1% of this capacity, and Mirant owns 37.7%. On an individual basis, no other company owns more than a 5.0% share of the capacity sited in-state. Nearly two-thirds (65%) of the State’s power plant capacity resides in one of four counties: Anne Arundel, 18.1%; Calvert, 13.7%; Charles, 11.8%; and Prince Georges, 21.4%. Table III.B.3 lists Maryland generating units by owner, county, and capacity.
7

Table III.B.3: Generation by Owner, County, and Capacity
Owner Name/Plant Name County Capacity Statistics (MWs) Nameplate Summer Pct. A & N Electric Coop/Smith Island Somerset 1.7 1.6 0.01% AES Warrior Run Inc/AES/Warrior Run Cogen F Allegheny 229.0 180.0 1.44% Allegheny Energy Supply Co LLC/R. Paul Smith Washington 109.5 115.0 0.92% Alternative Energy Associates/Brighton Dam Montgomery 0.5 0.5 0.00% Berlin MD (Town of)/Berlin Worcester 7.2 7.0 0.06% Brookfield Asset Management Inc/Deep Creek Garrett 20.0 18.0 0.14% ConEd Inc./Rock Springs Generating Facility Cecil 397.8 316.8 2.39% CEG/Calvert Cliffs Nuclear Power Plant Calvert 1,960.7 1,735.0 CEG/Brandon Shores Anne Arundel 1,370.0 1,289.0 CEG/C P Crane Baltimore 415.8 399.0 CEG/Gould Street Baltimore City 103.5 104 CEG/Herbert A Wagner Anne Arundel 1,058.5 1,007.0 CEG/Notch Cliff Baltimore 144.0 128.0 CEG/Perryman Harford 404.4 360.0 CEG/Philadelphia Road Baltimore City 82.8 64.0 CEG/Riverside (MD) Baltimore 257.2 249.0 CEG/Westport Baltimore City 121.5 121.0
43.05%
Easton Utilities/Easton; Easton 2 Talbot 72.4 68.9 0.55% Exelon Corp./Conowingo Harford 510.4 548.0 4.38% First Reserve Corp/Newland Park Landfill Wicomico 4.0 4.0 0.03% Florida Crystals Corp./Domino Sugar Baltimore Baltimore City 17.5 17.5 0.14% Keenan Development/Fort Detrick Frederick 30 30 0.24% MD Dept of Pub Safety & Corr Svc/Eastern Corr Inst Somerset 5.8 3.8 0.03% MeadWestvaco Corp (The)/Luke Mill Allegany 65.0 65.0 0.52% Mirant Corp/Chalk Point Prince Georges 2,647.0 2,428.0 Mirant Corp./Dickerson Montgomery 930.0 853.0 Mirant Corp/Morgantown Generating Station Charles 1,548.0 1,492.0
37.66%
Mittal Steel Co. N V/Sparrows Point Baltimore 120.0 152.0 1.21% Northeast MD Waste Disp Auth/Montgomery Co. Montgomery 67.8 54.0 0.43% NRG Energy Inc./Vienna Dorchester 183.0 170.0 1.36% ODEC/Rock Springs Generating Facility Cecil 374.8 315.4 2.50% Panda Energy Intl Inc/Panda Brandywine LP Prince Georges 288.8 248.4 1.98% Pepco Holdings Inc/Crisfield Somerset 11.6 10.0 Pepco Holding Inc/Eastern Sanitary Landfill Baltimore 3.0 3.0
0.10%
Prince Georges County/Brown Station Road I and II Prince Georges 6.7 6.1 0.05% TriGen Cinergy Sol. Balto/Inner Harbor East Heat Baltimore City 2.1 2.1 TriGen Cinergy Sol. Balto/Millennium Hawkins Pt. Baltimore 10.5 7.1
0.08%
Trigen Cinergy Sol. College Park/UMCP CHP Plant Prince Georges 27.4 27.4 0.22% Trigen Cinergy Sol. Sweetheart Cup/Owings Mills Baltimore 11.2 11.2 0.09% Waste Energy Partners LP/Waste Energy Partners LP Harford 1.2 1.1 0.01% Waste Management/Wheelabrator Baltimore Refuse Baltimore City 64.5 61.3 0.49% Worcester County Renewable Worcester 1.0 0.9 0.01% Total 13,687.8 12,675.1 100%
Due to rounding, figures may not add to total shown.
8

C. Potential Generation Additions in Maryland Siting for Maryland generation continues to be an important concern. There are reliability, environmental, and competitive issues that must be resolved while finding an appropriate location for a new generator. With generation largely deregulated and currently the responsibility of independent power producers, siting has tended to be limited to the expansion of existing sites. Generation companies have proposed various projects, but they are typically either expansions of existing sites or conjoined locations with other industrial or government facilities. Without the financial assurances that were typically available through utility ownership, it has become increasingly difficult for all but the major generation companies to select potential new sites and secure the funding necessary to build new generation and secure long-term sales contracts. As environmental and aesthetic considerations continue to make power plant siting difficult, it will be critical to identify and site generation technologies that will ameliorate these concerns while providing the energy necessary for Maryland consumers. In some respects, this energy need can be partially met with distributed generation that can include renewable generation and combined heat and power installations. Co-locating smaller generation facilities with other industrial process facilities provides an easier approach than increasing central station generation capacity. However, regardless of the growth in distributed generation, there will still be a need for central power stations that can be acceptably developed. Areas in or near the State that may be considered for new generation include off-shore wind projects in the Atlantic Ocean and along the Eastern Shore, the Nanticoke river area around Vienna on the Lower Eastern Shore, the Calvert Cliffs area in Southern Maryland, various brownfield sites in the Central Maryland area, and wind power sites in the mountains of Western Maryland. Upgrades and additions to existing sites (i.e., brownfield deployment) offer advantages over new, undeveloped greenfield sites with respect to licensing, transmission facilities, and environmental concerns. During the last five years, the Commission has granted several CPCNs for generating projects in Maryland. When and if constructed, the electricity generated by these projects will be available for Maryland and the PJM region. On the next page, Table III.B.1 identifies all proposed generating projects for which the Commission has recently granted or received an application to grant a CPCN. Late in 2007 and early 2008, the Commission received four CPCN applications (and two CPCN exemption applications) totaling approximately 3,065 MW in new generation and another 186 MW of reactivated generation (Case Nos. 8938, 8939, 9124, 9127, 9129, 9132, 9136 and 9164). Case No. 9124 was successfully concluded on February 15, 2008; Case No. 9127 is currently in progress; Case No. 9129 resulted in the grant of a CPCN on November 8, 2008; and Case No. 9132 authorized a CPCN on May 10, 2008. All of these CPCNs have or had expedited procedural schedules such that the Commission might reach a decision during 2008. These projects are described in more detail below according to the docketed case number.
9
• Case No. 8938: Exemption of the CPCN requirements approved October 29, 2008.
Clipper Windpower filed a CPCN application for 101 MW of wind powered energy. The CPCN was approved in March 2003, but the wind facility was not built and the CPCN expired. In January 2008, Clipper—under the name Criterion Power Partners—filed a CPCN Exemption for 70 MW of wind powered energy. Criterion was the first applicant to utilize newly enacted legislation allows a generating station that produces electricity from wind to be exempted from the CPCN process if the capacity of the wind generating station does not exceed 70 MW.
• Case No. 9124: Approved February 15, 2008. Constellation Energy Group
(“Constellation”) filed to re-activate the Gould Street generating station, which was retired in 2003 due to equipment failure. The gas-fired generator will be rebuilt to provide 101 MWs of capacity, and the proposed facility is scheduled for commercial operation in 2016. It is listed in the PJM queues as project #S67.
• Case No. 9127: In Progress. A CPCN application has been received from UniStar, a
Constellation and Electricté de France company, to construct a third unit at the existing Calvert Cliffs Nuclear site. With a nameplate capacity of approximately 1,710 MWs, the proposed nuclear unit is designed to provide base load generation in Maryland. Two of the three PJM required interconnection studies have been completed (PJM Queue project #Q48), and the proposed facility is scheduled to begin commercial operation in 2016. These initial studies indicate that significant network transmission upgrades in the BGE and Pepco service territories will be required to support the nuclear project. However, the proposed 500 kV Mid-Atlantic Power Pathway (“MAPP”) transmission project is also positioned to extend through the Calvert Cliffs substation. The MAPP transmission line is slated to begin operating before the Calvert Cliff’s nuclear facility begins operations; as a result, the MAPP project is expected to reduce the overall scale and scope of transmission upgrades required to support the nuclear project.
• Case No. 9129: Approved November 8, 2008. Competitive Power Ventures announced
plans for a 645 MW gas-fired plant in Charles County. A CPCN application was received by the Commission on December 14, 2007 and docketed as Case No. 9129. It is listed in the PJM queues as project #R17 Morgantown-Oak Grove 230 kV. A CPCN was previously granted to Free State Electric, LLC for a project on this site known as Kelson Ridge in 2001 (See Case No. 8843). The project was originally permitted for 1,200 MW, but the CPCN was subsequently relinquished on December 6, 2002, and the plant was not constructed.
• Case No. 9132: Approved May 10, 2008. On December 27, 2007, Constellation filed a
CPCN application to reactivate Unit 5 at the Riverside Generating Station, which was taken out of service in 1993. The unit will operate exclusively as a natural gas-fired unit and provide up to 85 MW of additional capacity. The current generating capacity at the Riverside State is 261 MW, which first went into operation in 1951. The project is listed as project #S33 in the PJM queues. The feasibility study calls for a long list of network upgrades for a 300 MW injection with optional delivery points – one for 115 kV and
10

one for 230 kV. The PJM Impact Study is expected to limit the scope of this project and require fewer upgrades.
• Case No. 9136: In Progress. On January 29, 2008, Constellation filed a CPCN
application for the modification of the Perryman Generating Station at the Hartford County, Maryland site. The application represents 600 MW of additional capacity.
• Case No. 9164; In Progress. On November 5, 2008, Dans Mountain Wind Force, LLC
filed a CPCN Exemption application the project envisions the construction of a 69.7 MW wind generation facility in Frostburg, Maryland.
Table III.C.1: New Generating Resources Planned for Construction in Maryland Resource Developer
And Location Capacity &
Fuel Expected
In-Service Date To be
Intercon-nected w/PJM?
CPCN Status
Savage Mountain US Wind Force LLC, Allegany and Garrett Cos.
40 MW Wind
1st Qtr. 2010 Yes CN 8939 Granted
3/20/2003Synergics Wind Energy, Roth Rock Windpower Project, Garrett Co.
40 MW Wind
2008 (Suspended)
Yes H.E. Order 10/31/2006
Gould Street, Constellation Energy, Baltimore City (reactivation)
101 MW Gas
In-Service Yes CN 9124 Granted
2/15/2008UniStar (Constellation Energy), Calvert Co.
1,640 MW Nuclear
4th Qtr. 2015 Yes CN 9127 In Progress
Competitive Power Ventures, Charles Co.
645 MW Gas
4th Qtr. 2010 Yes CN 9129 Granted
11/8/2008Riverside, Constellation Energy, Baltimore Co. (reactivation)
85 MW Gas
2nd Qtr. 2010 Yes CN 9132 Granted
5/10/2008Criterion Power Partners, LLC., Garrett Co.
70 MW Wind
4th Qtr. 2009 Yes CN 8938 Exemption
Granted 10/29/2008
Perryman, Constellation Energy, Harford Co. in Allegheny County
600 MW Gas/Oil
120 - 240 MW by June 2010
600 MW by 2014
Yes CN 9136 In Progress
Dan’s Mountain Wind Force Allegheny County
770MW Wind
Yes CN 9164 In Progress
Additional projects are listed for Maryland in the PJM queues in various stages of
the study process. PJM queued projects include projects powered by wind, natural gas, and landfill gas. Some queued projects are below 70 MWs and do not require CPCNs. Other projects less than 20 MWs represent additions to existing plants or commitment of behind the meter generation to sell power to the grid.
11

D. Maryland’s Healthy Air Act and Generation Upgrades Pursuant to the Healthy Air Act of 2006 (“Healthy Air Act” or “HAA”), Constellation and Mirant investigated methods for emissions control at their Maryland coal-fired plants. Maryland’s total generating capacity within the State is nearly 12,500 MW, and coal fired generation currently provides almost 60% of the power. Maryland’s larger coal-fired generating units are being retrofitted with wet scrubbers for the control of sulfur dioxide and selective catalytic reduction systems for the control of nitrogen oxides. However, Constellation has determined that this was not cost-effective for the Crane and Wagner plants, so only the Brandon Shores units will have both of these controls. Constellation plans to use low-sulfur coal with reagents and sorbents for the reduction of emissions of mercury and sulfur dioxide (“SO2”) at both the Crane and Wagner plants. Constellation subsequently obtained permission from the Commission to conduct test burns to evaluate emissions and performance of the plants with the use of various combinations of coals, sorbents and reagents. Some plants have sought CPCNs for modifications such as barge unloading facilities to accommodate the delivery and processing of limestone and different types of coal (Morgantown, Crane, and Wagner). The evaluations will assist Constellation and the State agencies in their determination of the efficacy of the process and whether or not more testing needs to be done. A summary of plant modifications for compliance with the HAA follows.
Table III.D.1: Emission Related Upgrades for Coal-fired Plants
Power Plant/ Owner
Relevant Case Numbers
Generating Capacity
Existing Emissions Controls
Retrofits for Healthy Air Act Compliance
Dickerson/ Mirant
CN9087 CN9140
853 MW total, 3 coal units total 546 MW
Low NOx burners with OFA, ESP, fabric filters
FGD SNCR
Chalk Point/ Mirant
CN9079 CN9086
2,400 MW total, 2 coal units total 700 MW
Low NOx burners with OFA, ESP, SACR (unit 2)
FGD, SCR ($78M), sorbent (unit 1) ($1.8M)
Morgantown/ Mirant
CN9031 CN9085
1,250 MW Low NOx burners with OFA, ESP, SCR
Delivery of coal by barge, FGD, sorbent
Brandon Shores/ Constellation
CN9075 1,370 MW Low sulfur coal, ESP, SCR
FGD (>$500M), sorbent for Hg & SAM, fabric filter
Crane/ Constellation
CN9048 Unit 1: 190 MW Unit 2: 209 MW
Fabric filter for particulates at both units
Delivery of coal by barge, low sulfur coal, sorbents and reagents
Wagner/ Constellation
CN9083 Unit 2: 136 MW Unit 3: 359 MW
ESP, SCR (unit 3) Low sulfur coal, sorbents and reagents (<$10M)
12

Based on the permitted testing, Constellation has selected Selective Non-Catalytic Reduction (SNCR) as the nitrogen oxide (“NOx”) control technology at the Crane 1 and 2 and Wagner 2 and 3 units. Performance testing at the two plants is expected to begin in January 2009. For mercury controls, both plants have selected to use halogenated activated carbon injection systems Performance testing at the two plants is expected to begin early in the fourth quarter of 2009. Constellation continues testing SO2 control options at Crane and Wagner. A combination of using blends of low sulfur sub-bituminous coals (from the Powder River basin) with the currently used bituminous coal and chemical sorbent systems such as Trona or Chem-ModTM. Switching to a new fuel blend will likely require a CPCN review and, as a result, further proceedings are expected.
Constellation is expected to continue experimenting with alternate fuels and process
alterations through January 2009 at Crane and Wagner in order to ensure a reliable generating process that complies with the HAA. Both Mirant and Constellation are considering use of biodiesel at their oil-fired generation plants. Large quantities of sorbents and reagents may be required to reduce emissions to acceptable limits at the coal plants. Based on preliminary studies, between four and twenty tons of sorbent per hour per unit may be required. This material will be captured in the downstream particulate control equipment as fly ash. The additional accumulations of fly ash will require disposal and will be a factor in evaluating the cost of the pollution controls. The Chem-ModTM technology warrants further study by Constellation because it uses the least amount of sorbent by mass and volume. Testing of alternate reagents and sorbents will enable Constellation to determine a cost-effective way to comply with the Healthy Air Act. Constellation and Mirant have filed with the Commission most of the CPCNs necessary to implement the retrofits needed for Healthy Air Act compliance. The table below lists the relevant case numbers for each coal plant and summarizes the generating capacity, existing emissions controls, and the retrofits proposed for HAA compliance. Existing emissions controls at some of the plants include electrostatic precipitator, flue gas desulfurization systems, low NOx burners with overfire air, and selective auto-catalytic reduction.
E. CPCN Exemptions for Generation Pursuant to PUC Article §7-207.1, the Commission can exempt certain power generation projects from the Certificate of Public Convenience and Necessity process. PUC Article §7-207.1 became effective October 1, 2001, and was modified effective October 1, 2005. More recently, a wind-generating station category was added to the section – effective July 1, 2007. Three categories of generators qualify for a CPCN exemption:
13

On-Site Generators:
• A generating station designed to provide on-site generated electricity;6 • The capacity of the generating station does not exceed 70 MW; and, • The electricity that may be exported for sale from the generating station to the
electric system is sold only on the wholesale market pursuant to an interconnection, operation, and maintenance agreement with the local electric company.
Wind Generators:
• A generating station that produces electricity from wind; • The generating station is land-based; • The capacity of the generating station does not exceed 70 MW; • The electricity that may be exported for sale from the generating station to the
electric system is sold only on the wholesale market pursuant to an interconnection, operation, and maintenance agreement with the local electric company; and
• The Commission provides an opportunity for public comment at a public hearing. Other Generators:
• A generating station whose capacity does not exceed 25 MW; • The electricity that may be exported for sale from the generating station to the
electric system is sold only on the wholesale market pursuant to an interconnection, operation, and maintenance agreement with the local electric company; and
• At least 10% of the electricity generated at the generating station each year is consumed on-site.
The Commission’s CPCN exemption application requires the applicant to select one of four specific types of generating station from the three categories offered. A Type I generator will not be synchronized with the local electric company’s transmission and distribution system and will not export electricity to the electric system.7 An emergency or back-up generator is the most common Type I generator. Type I generators also include generators that can self supply the applicant’s entire facility when participating in a demand response program. A Type II generator will be synchronized with the electric system and will not export electricity to the electric system. Generators used for peak-load shaving or generators participating in a demand response program are the most common form of Type II generators. Type II applicants will continue to receive a portion of their power from the utility but will supplement their electricity usage by on-site, self generation. The Commission has approved 21 Type II generators. Type III generators will be synchronized with the electric system and will export electricity. Wind generators – and other more 6 PUC §1-101 (s) defines “On-site generated electricity” as electricity that: (1) is not transmitted or
distributed over an electric company’s transmission or distribution system; or (2) is generated at a facility owned or operated by an electric customer or operated by a designee of the owner who, with the other tenants of the facility, consumes at least 80% of the power generated by the facility each year.
7 PUC §1-101 (h) defines “Electric company” with certain exclusions as a person who physically transmits or distributes electricity in the State to a retail electric customer.
14

common fuel-based generators – may qualify as a Type III generator. The Commission has approved 7 Type III generators, including 1 wind facility. A Type IV generator is a generator that is synchronized with the electric system and utilizes a disconnect feature of an inverter to prevent export of power in the event of a power failure on the utility’s grid. The Commission did not approve any Type IV generators in 2008.
Table III.D.1: CPCN Exemptions Granted, Since October 20018
Period Approved Applications No. of Units Total MWs Calendar Year 2002 16 33 76.3 Calendar Year 2003 23 40 67.1 Calendar Year 2004 40 63 72.1 Calendar Year 2005 41 80 131.1 Calendar Year 2006 33 73 101.4 Calendar Year 2007 41 62 69.1 Calendar Year 2008* 72 105 204.9
Total 266 456 722 Pending 12 20 20.6 Total (Including Pending) 278 476 742.6
*In October 2008, a 28 turbine, 70 MW wind generating facility was approved. The facility is included in the 2008 total, but is not yet installed. An applicant must submit a completed application and an interconnection, operating, and maintenance agreement entered into with the local electric distribution company, and if necessary, PJM. If the applicant will not export any electricity from the generating station, then the applicant must obtain a letter from the local EDC that states an interconnection, operating, and maintenance agreement is not necessary. It is important to note that exemption from a CPCN does not exempt an applicant from obtaining all other necessary state permits and regulations, such as those required by the Air and Radiation Management Administration at Maryland Department of the Environment (“MDE”).
F. Case No 9149, GAP RFPs and Distributed Generation In 2007, PJM first reported to the Commission the possibility of electricity shortfalls in 2011. In response the Commission asked PJM to update its projections in the fall of 2007 and in May 2008, after the Reliability Pricing Model capacity auctions. According to PJM, absent significant new transmission projects coming on line, there will be a regional peak demand shortfall beginning in 2011 and increasing thereafter. The Commission instituted Case No. 9149 for the purpose of investigating appropriate procedures that could be used by Maryland’s investor-owned utilities to issue one or more Requests for Proposals to address the potential gap in the reliability in the State (“Gap RFPs”). The Commission also requested that PJM convene a Regional Reliability Summit among the states affected by the potential shortfall within the context of Case No. 9149.
8 Current through November 1, 2008.
15

The Commission determined that the Mid-Atlantic Region faces a gap of approximately 2,600-3,000 MW,9 of which approximately 600-690 MWs are attributable to Maryland. The Trans-Allegheny Interstate Line (“TrAIL”) transmission project is expected to come into service in 2011-2013 time frame and will alleviate potential short term reliability shortfalls. However, the capability of the transmission system to deliver adequate electricity into Central and Eastern Maryland and continue to sustain reliable power supplies will require the Potomac-Appalachian Transmission Highline Project (“PATH”) transmission project to be constructed and in-service by 2013. Smaller transmission upgrades will not be sufficient to fill this forecasted gap because these upgrades have already been built into the projections being used. Market structures designed to incent new generation in the constrained portions of the State have not yielded any new generation that could narrow the 2011-2012 shortfall. It is possible that, due to various factors such as the current economic environment, growth may be lower in coming years than currently projected. Absent wholesale market efforts, however, any active solution would likely rely on either market forces or Commission action.
The Commission determined that a series of incremental solutions rather than a
single comprehensive approach is needed to deal with the dynamic nature of a potential supply shortfall demand. On November 6, 2008, the Commission ordered the four IOUs to develop and issue Gap RFPs to meet the requirements of PJM’s Emergency Load Response Program for the planning years 2011-2016, in order to mitigate potential impacts of a delay in the projected in-service dates of the TrAIL and PATH lines. The Commission also directed Staff to convene a distributed generation work group for the purpose of determining the scope of potentially available distributed generation resources and proposing a methodology to harness those resources that are not currently participating in PJM’s Emergency Load Response Program. A report is due from the Work Group on March 30, 2009, and additional orders are anticipated in this case.
G. Regional Reliability Summit
The interconnected nature of the electricity system means that any capacity shortfall affects connected regions, not just individual states. As a result, any step taken solely by the Maryland Commission that imposes additional costs on Maryland ratepayers will require Maryland ratepayers to bear a disproportionate share of what is a regional burden involving several states and the District of Columbia. Accordingly, at the Commission’s request, PJM convened a Regional Reliability Summit on November 7, 2008, and representatives from the District of Columbia, Delaware, Indiana, Maryland, New Jersey, Pennsylvania, and Virginia participated.
9 The Mid-Atlantic portion of the PJM region includes the states of New Jersey, Delaware, most of
Maryland, and parts of Pennsylvania. The region includes the service territories of Atlantic City Electric, Baltimore Gas and Electric, Delmarva Power, Jersey Central Power & Light, Metropolitan Edison, PECO, Pennsylvania Electric Company, Pepco, PPL Electric Utilities, Public Service Electric and Gas Company, Rockland Electric Company and UGI Electric Service. The service territory of Allegheny Power is not included within PJM’s Mid-Atlantic region.
16
The Summit featured a presentation by PJM describing the potential extent of a regional capacity shortfall if the TrAIL line is not in service by June 1, 2011. PJM reiterated that its wholesale tariff, as currently approved by FERC, does not permit it to hold incremental auctions for the purpose of obtaining additional capacity in the event a transmission project is delayed beyond its original in-service date. As a result, PJM concluded that any regional solution will need to be implemented by or through the affected states. Each of the states present at the Summit agreed to continue the dialogue with respect to possible long and short-term solutions, possibly undertaken through the Organization of PJM States, Inc. (“OPSI”). Chairman Nazarian of the Commission assumed the OPSI Presidency in 2009.
H. The PJM Queue
PJM operates – but does not own – the high voltage transmission system throughout the PJM region, which serves Maryland, 12 other states, and the District of Columbia. PJM undertakes a suite of activities, including power plant dispatch to meet load requirements, operation of the bulk power transmission system, and establishment of wholesale market rules for the efficient and reliable operation of generation and transmission.
A potential interconnection customer must comply with the PJM Open Access Transmission Tariff (“OATT”), as approved by FERC. PJM organizes generation interconnection requests into clusters, or queues, for the purpose of identifying required transmission system improvements. Upon the receipt of an interconnection request, PJM conducts sequential studies, provided the potential customer meets certain requirements to retain its queue position. These requirements include progress payments as each study is executed. The studies are dependent on other projects within the geographical area. The studies performed by PJM are the Feasibility Study, the Impact Study, and the Facilities Study. The studies are intended to determine what system enhancements are necessary to accommodate the interconnecting generator and maintain the reliability and stability of the transmission system.
1. The Feasibility Study
Computer modeling of the electric system is used by PJM to evaluate the feasibility of new generation with respect to compliance with the Regional Reliability Council, Reliability First, of the North American Electric Reliability Council (“NERC”) reliability and stability criteria. Short circuit calculations are performed to ensure that circuit breaker capacities are not exceeded. This report identifies direct connection requirements and network impacts. Once the Feasibility Study is completed, a Feasibility Report is issued. In order to maintain its queue position, the applicant must then execute an Impact Study Agreement. 2. The Impact Study The Impact Study is a continuation of the Feasibility Study with the inclusion of more detailed analysis. Capacity Resources are evaluated for load deliverability and
17

generation deliverability. Load deliverability is a measure of the ability to transfer power to the load in a particular sub-area. Generator deliverability is a measure of the ability to export generation from a sub-area. Stability is evaluated for critical contingencies. Short circuit calculations are performed, taking into consideration all elements of the regional plan, to ensure that circuit breaker capacities are not exceeded. The average cost for an impact study is between $7,000 and $25,000 depending upon the size of the project; however, an impact study could cost as much as $45,000. These funds are deducted from deposits made by the interconnection customer to retain the queue position. Funds that are not used can be refunded or applied to further studies.
In order to maintain the queue position, the applicant may be required to execute a Facilities Study Agreement or a Construction Study Agreement. By executing the Facilities study the potential interconnection customer retains the assigned priority in the PJM queues. The Facilities Study further defines the construction details and responsibilities for the direct connection requirements and network upgrades and their cost. 3. Interconnection Service Agreement
Ultimately, the applicant must execute an ISA with PJM and the transmission owner, which is filed with FERC. The ISA provides detailed requirements for the physical and operational interconnection to the grid. These provisions qualify the project as a capacity resource. A capacity resource provides generation sold in bilateral contracts or through the PJM Capacity market to Load Serving Entities (LSEs) to fulfill the LSE’s obligation to serve load under the Reliability Assurance Agreement10. According to PJM’s OATT, an accredited Capacity Resource has Capacity Interconnection Rights commensurate with its size in megawatts. Capacity Interconnection Rights entitle the holder to deliver the output of a Capacity Resource at the point where the Capacity Resource interconnects to the transmission facilities.
The ISA specifies the system enhancements necessary for the physical and electrical
interconnection of the generator to the transmission owner’s system. It also specifies the obligations, on the part of the Interconnection Customer, to pay for system enhancements required for the interconnection. The document may also specify requirements related to the operation and maintenance of the system enhancements. The specifications are dependent upon the standards of the local transmission owner. However, most of the system enhancements have already been identified during the course of the PJM studies, since the local transmission owner participates in the PJM studies. It is important for the generation owner and the transmission owner to agree on how the interface should operate. This greatly reduces the risk of failure and thereby improves the safety and reliability of the grid. The ISA represents the culmination of the PJM study process and recommended upgrades. ISAs for PJM projects are posted on PJM’s website and filed with FERC. ISAs are required to be filed at the MD PSC for smaller generation projects that do not require CPCNs. 10 The Reliability Assurance Agreement (RAA) is a contract entered into by members of PJM.
18

4. Network Upgrades Network upgrades are often required to ensure an adequate pathway of conductors
(transmission lines) for delivery of electricity produced at the power plant to distribution systems and ultimately to consumers. It is important to identify these upgrades before the company undertakes construction, because the upgrades can add considerable cost and delay to the project. The costs identified in the PJM studies influence the applicant’s plan to build the project and its schedule. PJM is continually re-evaluating the reliability of the grid through the Transmission Expansion Advisory Committee (“TEAC”) and Regional Transmission Expansion Plan (“RTEP”) procedures.11 Any changes to the baseline transmission system may modify the Impact Study Results. Changes in the status of other projects in the queues may also affect the results. 5. Status of the PJM Queuing Process Within the past ten years Maryland has added approximately 1,200 MWs to its inventory of electric generation through the PJM Queues. These projects include combustion turbines, landfill gas projects, co-generation facilities, reactivation of retired plants, and improvements to existing plants including nuclear and hydro facilities. All of these projects did not need CPCNs because many were additions to existing sites or below the threshold that requires a CPCN in Maryland. However, with the exception of limited behind-the-meter generation or emergency generators, all have interconnection rights to the grid.
Although, at any given time, there are many generation projects in the PJM Queues, historically 75% of the projects drop out. Many projects have duplicate queue positions because timing and interconnection requirements can vary considerably depending on the queued position. PJM’s queued volume increased threefold from January 2006 to January 2008. This has created a backlog. In April of 2008, there were 360 generation projects active in the PJM Queues, totaling 84,164.32 MW. As of October 17, 2008, there are about 96,000 MWs of proposed new generation projects under development through the interconnection process, with 8,300 MW of projects under construction. 6. Queue Reform
FERC is concerned about delays in processing interconnection queues. In Docket
No. AD08-2-000, FERC issued an order on March 20, 2008 which directed the Regional Transmission Organizations (RTOs) and Independent System Operators (ISOs) to file status reports regarding efforts to improve the interconnection queue process. In addition, PJM re-chartered the Regional Planning Process Working Group (RPPWG) to evaluate and make recommendations to the PJM Members Committee to consider reform of the interconnection queue and study process. Some of the recommended changes include the following:
11 RTEP evaluates the grid 15 years into the future for compliance with NERC standards, load growth,
contingencies, thermal overloads and voltage support.
19
1. Change the deposits and fee schedule for maintaining queue positions; 2. Assign probabilities of commercial success to individual projects; 3. More evenly distribute network upgrades within each queue; 4. Allocate costs for upgrades greater than $10M between different queue groups; 5. Use a single batch analysis for each queue, thereby reducing the time needed for
transmission owners to study the projects; 6. Increase the DFAX cutoff to greater than 15% for voltages 500 kV and above;12
This would limit required upgrades, especially those distant from the project. 7. Limit changes to existing queue positions (Currently, applicants can reduce the
size of their project by 60% prior to the release of the Impact Study); 8. Removal of projects that do not provide necessary information on time; 9. Limit the number of interconnection points studied for each project; 10. Change the practice whereby interconnection customers with ISAs can suspend
their projects for up to three years, because this creates cost uncertainty for the other projects;
11. Cluster projects for the purpose of study or cost allocation; 12. Handle mega projects (like nuclear reactors) separately because these can cause
unique problems due to their size; and 13. Transfer network upgrade costs to Transmission Owners
Beginning February 1, 2008, PJM instituted a three month queue and a 90-day study period, which provides for a total of six months to produce feasibility results. PJM is working to reduce the workload associated with the study process, while maintaining a sustainable queue process that ensures the timely completion of most interconnection studies. Modifications to the interconnection process are expected to expedite the interconnection queues, eliminate speculative projects, reduce overdue studies, and support the interconnection of new generation and merchant transmission projects. As of September 8, 2008, PJM has made one filing for queue reform in FERC Docket AD08-2-000. PJM has also implemented non-tariff related improvements. Work in 2009 will continue to investigate changes to deposit levels, project milestones, additional site control requirements, and possible changes to some study processes.
12 A distribution factor or “DFAX” applies to the percentage of power flowing on an element (A) that will be
picked up (or backed down) on another element (B) as a result of an outage on the first element (A) or a shift on generation.
20
IV. ENERGY TRANSMISSION IN PJM AND MARYLAND
Transmission facilities in PJM and Maryland have continued to play a key role in energy supply. With Maryland’s dependence on energy imports, it is extremely important that adequate transmission facilities be available to provide needed supplies. While all network systems can experience congestion at times, the Maryland and D.C. areas have continued to experience significantly higher levels of congestion than the rest of PJM. This, in turn, leads to higher energy and capacity costs for Maryland consumers and potential reliability concerns. This is a concern that needs to be monitored, managed, and supplemented with additional infrastructure to ensure adequate capacity and reliability with limited levels of congestion. Two transmission projects in particular are of critical importance to Maryland, the Trans-Allegheny Interstate Line and the Potomac-Appalachian Transmission Highline Project. The first of these projects, TrAIL, has surmounted important regulation hurdles in other states, while the PATH and another regional line, MAPP,13 appear to be making progress toward filings and construction. Although the Commission will play a role in siting and possibly approving the Maryland portions of PATH and MAPP, the Commission does not and cannot direct the timing or in-service dates of these projects, leaving uncertainty regarding the role these lines can or will play in addressing Maryland’s reliability issues. As this plan is implemented, it is important for the Commission to take an active role in monitoring transmission systems, setting appropriate reliability and congestion goals, and expediting infrastructure improvements where needed.
A. The Regional Transmission Expansion Planning Protocol
Planning the enhancement and expansion of transmission capability on a regional basis is one of the primary functions of an RTO like PJM. PJM implements this function pursuant to the Regional Transmission Expansion Planning Protocol (“RTEPP”) set forth in Schedule 6 of the PJM Operating Agreement.
PJM annually develops the Regional Transmission Expansion Plan (“RTEP”) to meet system enhancement requirements for firm transmission service, load growth, interconnection requests, and other system enhancement drivers. To establish a starting point for development, PJM performs a “baseline” analysis of system adequacy and security. The baseline is used for conducting feasibility studies for all proposed generation and transmission projects. Subsequent System Impact Studies for those projects provide recommendations that become part of the RTEP Report. As a regional planning effort, the RTEPP determines the best way to integrate projects to provide for the operational, economic, and reliability requirements of the grid. The RTEPP applies reliability criteria over a fifteen-year horizon to identify transmission constraints and other reliability concerns. RTEP integrates many bulk power system factors including:
13 Mid-Atlantic Power Pathway.
21

• Transmission owner-identified project proposals; • Long-term firm transmission service requests; • Generation interconnection requests; • Generation retirements; • Load-serving entity capacity plans; • Transmission enhancements to alleviate persistent congestion; • Distributed generation and self-generation developments; • Demand response and energy efficiency; and • Proposed merchant transmission projects.
The RTEPP has recently undergone significant changes to address more comprehensively the reliability and transmission congestion issues associated with PJM’s growing footprint. While previously the RTEPP concentrated on generation interconnections, its focus is now on ensuring reliability throughout the expanded footprint and ensuring essential transmission infrastructure is built to support system integration and more robust wholesale power markets. The Transmission Expansion Advisory Committee (TEAC) is the primary forum for stakeholders to discuss the RTEPP results. The Maryland Public Service Commission is an active participant in the RTEPP and regularly attends the TEAC meetings. 1. Baseline Reliability Assessment
PJM establishes a baseline from which the need and responsibility for transmission system enhancements can be determined. PJM performs a comprehensive load flow analysis of the ability of the grid to meet reliability standards, taking into account forecasted firm loads, firm imports and exports to neighboring systems, existing generation and transmission assets, and anticipated new generation, generation retirements, and transmission assets. The baseline reliability assessment identifies areas where the planned system is not in compliance with applicable NERC and regional reliability councils’ (ReliabilityFirst, SERC) standards, nuclear plant licensee requirements, and PJM reliability standards. The baseline assessment develops and recommends enhancement plans to achieve compliance. 2. Cost Allocation
On October 17, 2008, PJM announced that its Board of Directors has approved $1.8 billion in electric transmission system additions and upgrades for the grid. The Board has authorized a cumulative $11.6 billion in transmission improvements since 2000 when PJM’s first RTEP was approved. The PJM RTEPP requires that cost responsibility for transmission enhancements be established. The cost of transmission facilities in PJM that operate at a voltage of 500 kV and above are socialized across all PJM load. BGE and Pepco have secured through FERC incentive rate adders for their transmission projects. There are four categories of facility enhancements for which cost assignments are made:
a. Transmission Planning to Maintain System Reliability: Transmission system reinforcements needed to maintain national and regional reliability standards are
22

built by transmission owners and paid for by customers in proportion to benefit. Transmission owners recover their costs through FERC-approved transmission service rates.
b. Transmission Planning for Generation Interconnection and Merchant Transmission
Interconnection Projects: Generation and transmission project developers are responsible for costs associated with interconnecting their facilities to the grid. Interconnection of such facilities also may require the upgrading of additional system elements to maintain reliability. An appropriate proportion of those costs is borne by the project developer.
c. Transmission to Alleviate Persistent, Costly Congestion: Through spot market
energy prices and the RTEPP, PJM market participants can identify the portions of the transmission grid prone to persistent congestion, the costs of which customers are not able to hedge through financial transmission rights (FTRs). Market participants proposing solutions to resolve such constraints are responsible for direct interconnection costs and for an appropriate proportion of any network upgrade costs required to facilitate their interconnection. Reliability and economic benefits are regional in nature and are quantitatively assigned by distribution factors (DFAX). PJM also performs market sensitivity analysis for lines required for system reliability.
d. Transmission Planning to Coordinate with Neighboring Regions: PJM is engaged in
planning processes that address issues of mutual concern to PJM and neighboring transmission grid systems: the Midwest ISO, ISO New England, the New York ISO, and the Tennessee Valley Authority. The Inter-regional Planning Stakeholder Advisory Committee facilitates stakeholder review and input into the Coordinated System Plan. Coordinated regional transmission expansion planning across seams is expected to reduce congestion on an inter-RTO basis and to enhance the physical and economic efficiencies of congestion management. Inter-regional ties are a benefit for reliability, especially when load centers peak at different times (referred to as load diversity). Coordination among neighboring ISOs and RTOs can break down, however. For example, due to uncontrollable loop flows around Lake Erie during the summer of 2008, FERC precluded the scheduling of external transactions over eight scheduling paths as requested by the NY ISO. See Docket ER08-1281-000.
3. Obligation to Build RTEPP Projects
PJM’s Transmission Owners’ Agreement obligates transmission owners to build transmission projects that are needed to maintain reliability standards and that are approved by the PJM Board of Directors. Transmission owners can voluntarily build these projects or PJM can file with FERC to request FERC to order the project to be built. In Maryland, CPCN permits are required for new rights-of-way or modifications to existing facilities.
23

4. PJM’s Authority
FERC approved PJM as an Independent System Operator in 1997. Since that time, PJM has administered its RTEPP as described in Schedule 6 of the Operating Agreement. PJM has subsequently received authority from FERC for procedures and rules for transmission expansions needed to enable the interconnection of new and expanded generation and merchant transmission facilities (1999). PJM has amended the RTEPP to include the development of transmission projects to support competition in wholesale electric markets, allowing them to justify projects for economic reasons as well as reliability.
With the addition of Allegheny Power in 2002, PJM received final approval as an RTO. PJM is the administrator of the OATT as approved by FERC. The OATT is the basis for PJM to collect charges to recover the costs of projects owned, constructed, or financed by the transmission owners. Transmission owners file rate schedules with FERC to recover transmission investments made pursuant to the RTEPs approved by the PJM Board.
5. Transmission Expansion Highlights for 2008
RTEP results are presented to the Transmission Advisory Committee. The Planning Committee then seeks approval from the Members Committee and PJM’s Board of Directors. The Maryland PSC is reviewing several large projects this year for generation and transmission expansion. In CN9127, the UniStar Companies (affiliated with Constellation, Areva, and Electricité de France) has proposed a new unit 3 nuclear reactor at Calvert Cliffs. Unit 3 would produce 1600 MWs of electricity as early as 2017. The major transmission providers (AEP, PHI, and Allegheny) are continuing with their plans for three major new transmission lines: Mid-Atlantic Power Pathway (MAPP), Trans Allegheny Interstate Line (TrAIL), and Potomac Appalachian Transmission Highline (PATH). These projects have all been approved by the PJM board.
Some projects are initiated by individual transmission owners for their service
territory. For instance, Southern Maryland Electric Cooperative (“SMECO”) is continuing with plans for its high voltage loop in Southern Maryland (Aquasco to Holland Cliffs), much of it on existing right of way.
B. Proposals for New High Voltage Transmission Lines in PJM
Demand for power on the East Coast has pushed the current grid configuration to its limits. This is evidenced by persistent congestion in central Maryland and northern Virginia. CETO/CETL analysis for 23 load deliverability areas has passed the deliverability test for 2011. However, PJM is predicting delivery problems in 2012. Consequently, several large interstate transmission projects have been proposed. They are in various stages of the approval and development process. Some projects are not
24
physically located in Maryland; however, Maryland can be affected by these projects due to inter-regional dependence on the grid.
The ‘backbone’ of the grid in PJM consists of the 500 kV and 230 kV transmission lines. There have not been many changes to the 500 kV system in the past 20-30 years. The high voltage circuits were originally designed for spare capacity, anticipated load growth, and inter-regional power transfers. The economic and territorial landscape of the grid has since changed. Power is now traded through RTO markets such as PJM’s Reliability Pricing Model (“RPM”). Spare capacity for the lines is reduced and many are frequently overloaded. Transmission owners have responded with proposals for several new high voltage interstate transmission lines:
1. MAPP: Mid-Atlantic Power Pathway by PHI (500 kV) 2. TrAIL: Trans Allegheny Interstate Line by Dominion and Allegheny (500 kV) 3. PATH: Potomac Appalachian Trail Highline by Allegheny and AEP (765/500
kV) 1. The MAPP Project PJM identified a new 500 kV circuit emanating from the Possum Point Generating Station in Virginia to the Salem Nuclear Station in New Jersey as an integral component of PJM's plans to ensure a reliable electric system in the mid-Atlantic Region, including the Baltimore-Washington metropolitan area and the Delmarva Peninsula. In addition, MAPP will increase import capability, lower congestion costs, and enhance the ability of existing and new renewable resources, including wind, to reach load centers in the Baltimore-Washington region and on the Delmarva Peninsula. In Maryland, the MAPP project traverses parts of Prince George's, Charles and Calvert Counties, including the Possum Point to Chalk Point corridor, crosses under the Chesapeake Bay and proceeds in an eastward direction through parts of Dorchester and Wicomico Counties before crossing into Delaware.14
Pepco and the Delmarva Power and Light Company are obligated to build the majority of the 230 mile MAPP project since the line is located primarily in the Companies' service territories. For the Chesapeake Bay crossing, Pepco has stated that it is considering installing a 640kV high voltage direct current ("HVDC") line. In Delaware, MAPP will continue in an easterly direction to the Indian River Generating Station before heading north to a substation in the vicinity of the Salem Nuclear Plant in New Jersey. Many state and federal agencies (such as the Army Corps of Engineers and U.S. Fish and Wildlife) are involved with the waterway crossings (Potomac River, Chesapeake Bay, and Delaware River). Pepco plans to install the MAPP project in phases, some requiring separate CPCNs. The next phases of the project will involve the filing of Maryland CPCN applications for the following portions of the proposed 500 kV transmission line:
14 Information about the MAPP project can be found at a website www.powerpathway.com.
25

1. Pepco is currently seeking MD PSC approval for a second conductor along the Moss Point to Burches Hill to Chalk Point route. The original double circuit 500 kV line from Possum Point to Chalk Point was permitted in CN6526 by the Commission during the 1970s. This existing right of way is an important component of the new MAPP line. Its estimated cost is $62M. The length of the line is about 50 miles.
2. The crossing from Moss Point to Possum Point in Virginia across the Potomac River is a relatively short link, about 11,200 feet. However permits are required for the installation of new towers in the river. Possum Point is the site of a 1,730 MW gas and oil fired generation plant.
3. Pepco will need a CPCN from the MD PSC to modify the existing 500 kV transmission line from Chalk Point to the vicinity of the Calvert Cliffs Nuclear Station. This section of line is about 20 miles.
4. Another CPCN proceeding will be necessary for the submarine cables for High Voltage DC (HVDC) to cross the Chesapeake Bay into Dorchester County. The crossing may be up to 10 miles long to avoid environmentally sensitive areas.
5. This line will continue through Dorchester County to Vienna, about 33 miles.
6. Vienna to Indian River is mostly in Delaware, about 35 miles.
7. The line is expected to continue from Indian River through Delaware to Salem, New Jersey, about 80 miles.
8. Also in Maryland, PHI will construct an additional 230 kV line from Vienna to Steele. The Vienna to Loretto and Loretto to Piney Grove 138 kV lines will be upgraded to 230 kV. This will form a 230 kV loop on the lower Delmarva Peninsula.
MD PSC Staff and DNR/PPRP have participated in community meetings sponsored by the applicant, most notably in Dorchester County. MAPP is primarily justified for the following reasons:
1. To extend the high voltage grid into southern Delmarva Peninsula which till now has been fed radially from the north;
2. To alleviate historical congestion problems in Delmarva, central Maryland, and northern Virginia. PJM’s 2007 RTEP analysis determined that the MAPP Project would solve overloads on the eastern interface that would otherwise occur as early as 2012;
3. To extend the grid for open access and improve deliverability of load and generation. PHI analysis indicates that eastern PJM import capability would increase by 1,000-2,500 MW as a result of the MAPP project,
4. To compensate for retirements of power plants such as Buzzard Point, Benning Road, Vienna, and Indian River; and
5. To accommodate load growth in southern Maryland and the Eastern Shore.
26
2. The TrAIL Project
TrAIL is an alternating current single circuit 500 kV overhead transmission line that begins in Washington County, Pennsylvania, passes through West Virginia, and ends in Loudon County, Virginia. According to PJM, TrAIL provides critical support to the eastern Mid-Atlantic PJM area and maintains reliability in Northern Virginia and the Baltimore/Washington D.C. area once it comes on line in June 2011. The expectation is that this line will import electricity from low-cost baseload generators in the Midwest to Maryland.
TrAIL has been approved by the West Virginia (August 1, 2008), Virginia (October
7, 2008), and Pennsylvania (November 13, 2008) Commissions. The West Virginia approval remains subject to certain conditions that the company believes will be resolved now that the other states have given their approvals. Pennsylvania’s recent approval removes a significant hurdle.
The project’s rate of return also has been resolved. On July 21, 2008, FERC
approved an uncontested settlement among TrAILCo, the PSC, and other parties that resolved all issues relating to the transmission cost of service formula rate that governs construction and operation of the project. The PSC had contested certain incentives sought by TrAILCo that imposed an unwarranted burden that would ultimately be borne by ratepayers. As a result of the PSC’s advocacy with other states, the incentive return on equity (“ROE”) was reduced by settlement to 12.7 percent from 13.9 percent. TrAILCo provided a public update on the status of TrAIL to the Commission at the Administrative Meeting held on December 17, 2008. 3. The PATH Project
Potomac-Appalachian Transmission Highline (PATH) is a joint venture between AEP and Allegheny. It is 250 miles of 765 kV line between Amos (Charleston, WV) and Bedington (West Virginia near Washington Co., MD). It continues for another 40 miles from Bedington as a 765 kV line through Maryland to Kemptown (Frederick Co., MD). PATH was authorized by the PJM Board on June 22, 2007. It is estimated to cost $1.8B with a June 2013 in-service date. PJM is planning for a substation at the intersection of the TrAIL and PATH lines, somewhere in Virginia, with a 1,000 MVAR reactive compensator.
MAPP, TrAIL, and PATH are very ambitious projects—all considered to be necessary by PJM. The new interstate transmission lines fall within the National Interest Electric Corridors (“NIETC”) established by DOE. Under certain conditions, these lines could be permitted at the federal level. Speculation about when these projects will be in service has led to concerns about their inclusion in PJM’s base case which is used for RPM
27

auctions. PJM is establishing rules and milestones by which future transmission lines can be included in RPM base cases.
C. Transmission Congestion in Maryland 1. PJM’s Definition of Congestion
PJM’s Locational Marginal Pricing (“LMP”) system takes into account regional price differences for electricity on a daily basis. The process considers the value of the energy at the specific location at the time it is delivered and is, in part, based upon transmission constraints that limit the free flow of electricity across the regional transmission system that extends across multiple state lines. Transmission constraints can vary hourly, daily, and seasonally based upon the weather patterns, electricity requirements, and generator availability across the PJM region. Historically, long-distance transmission lines allowed utilities to locate power plants near inexpensive fuel resources. Transmission congestion can typically occur when remote, low-priced energy cannot be delivered and more-expensive electricity, but advantageously located (oftentimes local), generation is required to meet demand. As a result, costs can potentially be higher for the congested area and lower at the source of less expensive power.
Electricity is often procured by the load serving entities that in turn serve retail
markets. The LSEs commonly enter into long-term bilateral contracts at secured prices, which assists in insulating both the load serving entities and the retail loads from price variations. Moreover, transmission constraints are commonly hedged using available financial tools and local economic generation. However, when the portion of the load affected by a transmission constraint cannot hedge against price increases using these financial and physical resources, additional costs may be realized. Once PJM determines that sufficient unhedged congestion exists so as to potentially merit a transmission expansion, a cost/benefit analysis is conducted to determine if a PJM-sponsored transmission project would results in net benefits. Costs associated with transmission projects are socialized.
While congestion can increase the cost of electricity, it is important to note that
congestion does not suggest that a reliability problem exists within the system. As long as sufficient power can be delivered, the system is considered to be reliable. Congestion costs can be high for a particular region when demand is high or when certain generators or transmission lines are out of service. Congestion costs vary rapidly during the course of a day, seasonally, and from year to year. Persistent patterns of high LMPs can indicate future reliability problems and the need for new generation, new transmission, and/or demand response. 2. Planning for Congestion Control
PJM’s RTEP looks at a 15 year projection of the grid to predict reliability problems. The system is planned for the probability of loss of load to be one day in ten years. Single
28
contingency analysis allows the grid to function with the loss of any one line. In some cases double contingency analysis is used. PJM’s 15-year planning horizon process has predicted that the congestion on the eastern and western interfaces will cause both load deliverability and generator deliverability in central Maryland15. Most of these deliverability issues are a result of the congestion across the interfaces combined with significant load growth and the retirement of existing generation16. Ideally, these problems can be solved with a combination of new generation, transmission projects, and demand response. 3. Costs of Congestion
The 500 kV Bedington to Black Oak line is PJM’s most congested circuit and responsible for much of the congestion in central Maryland. It was responsible for $711.3M or 38.7% of PJM’s total congestion in 2007. Allegheny installed a Static VAR Compensator (SVC) at Black Oak substation in Dec of 200717. Together with a Mt. Storm-Pruntytown 500 kV upgrade and various other transformers and breakers, the capacity of this line has been increased. However, congestion will continue to be a problem until TrAIL and Path are built.
Within PJM the total market congestion for 2007 was about $1,840 million18. The top 20 congestion causing constraints account for 87.4% of the total 2007 congestion. Future RTEP upgrades needed for reliability are expected to relieve or eliminate most congestion associated with 2007 historical constraints. PJM’s 2012 RTEP upgrades are expected to reduce congestion costs by about $1,750 million. During PJM’s summer 2008 reliability assessment PJM stated that the Baltimore/Washington area will continue to be a significant concern until new transmission, generation, or demand response is built in the area. The Maryland Public Service Commission supports the addition of new generation, transmission expansion, and demand response to maintain reliable grid operation and to reduce congestion costs.
As stated in the DOE Transmission Congestion Study, Maryland is directly affected by congestion areas located on the Delmarva Peninsula and in the Baltimore – Washington, D.C. area. The Delmarva Peninsula has existed as a load pocket for a significant amount of time. The power prices have been higher and the reliability has been lower there than in adjoining areas. As it exists today, the Delmarva Peninsula is not densely populated. However, this area is experiencing a significant growth in population and load demand.
The Baltimore/Washington area is in a situation where the reliability of the electricity transmission grid indisputably warrants attention. The United States DOE stated that without transmission upgrades, the reliability criteria established for critically important 15 The central Maryland area of the Mid-Atlantic generally includes northern Virginia and the
Baltimore/Washington region. 16 Generation slated for retirement includes Benning Road and Buzzard Point in Washington, DC and Indian
River on the Eastern Shore. 17 FERC approved an incentive return on equity rate of 12.7 percent for the static VAR compensator installed
at the existing Black Oak Substation. 18 From data presented to the Transmission Expansion Advisory Committee (TEAC) concerning 2008 Market
Efficiency Analysis on August 20, 2008.
29

loads will not be met over the next 15 years.19 Both the Department of Energy and PJM have concluded that in order to alleviate this recurring congestion problem, upgrades to the PJM transmission system need to be initiated and completed. 4. Summer Loads for 2008 Congestion during the summer of 2008 was not as pronounced as it has been in previous years. This has been primarily due to reduced demand with no significant generation or transmission outages. The PJM metered peaks for 2008 were lower than the peaks in 2007 and 2006. This was due to the relatively mild weather, the slowing economy, and more diversity (non-coincident peaks). The unrestricted peak of 130,792 MWs occurred on June 9, 2008 at 5:00 PM. No emergency measures were required by PJM. The peak was 7.5% lower than the peak for 2007 and it was 5.2% below the forecast.
19 U.S. Department of Energy, National Electric Transmission Congestion Study, August 2006.
30

V. DEMAND RESPONSE AND CONSERVATION AND ENERGY EFFICIENCY Demand side management (DSM), including various methods of energy efficiency, conservation, demand reduction, and distributed generation, is expected to become an important source of meeting the State’s needed supply. DSM supports system reliability, energy security, energy and capacity price mitigation (i.e., reducing overall energy costs), enhanced energy market competitiveness and limits environmental impacts. The Commission encourages energy service providers to offer DSM programs to customers where appropriate. Distribution companies have been tasked with providing cost-effective DSM programs, particularly for mass market residential and small commercial customers. As part of the EmPower Maryland Energy Efficiency Act of 2008 enacted on April 24, 2008, the Commission will require the utilities to implement aggressive and cost-effective demand management and energy conservation programs.
A. Statutory Requirements
The EmPower Maryland Energy Efficiency Act (“EmPower Maryland”) was enacted on April 24, 2008. By statute, each utility is required to develop and implement cost-effective programs and services that encourage and promote the efficient use and conservation of energy by consumers and utilities alike. EmPower Maryland also establishes long-term target reduction goals for electric consumption and demand, based on a per capita basis and a 2007 energy consumption baseline. See PUC Article §7-211 (or House Bill 374). The Act specifically states at §7-211(g)(1) and (2):
(1) To the extent that the Commission determines that cost-effective energy efficiency and conservation programs and services are available, for each affected class, require each electric company to procure or provide for its electricity customers cost-effective energy efficiency and conservation measures programs and services with projected and verifiable energy electricity savings that are designed to achieve the following a targeted reduction of at least 5% by the end of 2011 and 10% by the end of 2015 of per capita electricity consumed in the electric company’s service territory during 2007; and (2) require each electric company to implement a cost-effective demand response program in the electric company’s service territory that is designed to achieve a targeted reduction of at least 5% by the end of 2011, 10% by the end of 2013, and 15% by the end of 2015, in per capita peak demand of electricity consumed in the electric company’s service territory in 2007.
Utilities are required to submit these plans by September 1, for the next three subsequent years, beginning in September 2008. The Commission is directed to determine by December 31 if each utilities’ initial plans are adequate and cost-effective in reaching the EmPower Maryland goals. The Commission is also required to report its findings to the General Assembly regarding the implementation and success of these programs on or before March 1, 2009 and every year thereafter.
31

B. Demand Response Initiatives
Demand response is defined as changes in electric usage by end-use customers from their normal consumption patterns either in response to changes in the price of electricity over time or to incentive payments designed to induce lower electricity use at times of high wholesale market prices and when system reliability is jeopardized. The increase in electricity prices and changes in technology have spurred interest in finding cost-effective means of reducing electricity consumption. Additionally, the price of electricity in the wholesale markets serving the central and eastern portions of Maryland is determined, in part, by the relative scarcity of generation and transmission capacities serving those areas.
After testimony from PJM in Case No. 9111 that the State faced a “reliability gap in 2011 if the 500 kv interstate transmission line was not completed by May 2011”, the Commission took its first steps to preserve reliability in the State by encouraging residential demand response. By Letter Order dated November 30, 2007, the Commission approved with modifications BGE’s Rider 15 Demand Response Service for residential customers. On January 3, 2008, the Commission directed Pepco, Delmarva, AP, and SMECO to file programs for Demand Response Service that provides similar or proportional peak load reductions by 2011 to those contemplated in the BGE program. Such filings were to be made to provide the Commission the opportunity to consider the plans and approve the plans in sufficient time to allow the utilities to bid the peak load reduction into the PJM RPM auction scheduled for May of 2008.
These filings resulted in 650 MW of demand response being bid into the PJM auction for 2011. On February 15, 2008, AP, Pepco, and Delmarva filed their Demand Response Initiative (“DRI”) programs as directed by the Commission on January 3, 2008. SMECO filed its DRI program on March 18, 2008. Of the four DRI proposals, AP was the only company to indicate that a DRI program would not be cost effective in its service territory and requested that the Commission not direct AP to implement a DRI program. After consideration at the Commission’s Administrative Meeting held March 19, 2008, the Commission concluded that the implementation of a DRI program by AP would not be cost effective and the Commission did not require AP to implement a DRI program. However, the Commission expects that, should AP determine that a change in circumstances or other events occur that result in a program becoming cost-effective, AP will file a proposal with the Commission at that time.
Below is a description of the four approved Commission DRI programs. A matrix is attached as an Appendix to provide a side by side comparison of the four DRI programs. 1. BGE
BGE has started to implement its Demand Response Initiative for its residential customers, effective January 3, 2008. The purpose of the program is to reduce customer demand of electricity during the peak summer period. Under this voluntary demand response program for residential customers, BGE will cycle off customers’ central air conditioning (“A/C”) or heat-pump units 50%, 75%, or 100% during specified periods. The
32

maximum number of periods that the cycling will occur is ten times per program year and the maximum time that an A/C or heat-pump unit can be cycled off is six hours. The cycling off of the A/C and heat-pump units can be invoked by a PJM emergency event or by a local emergency on the distribution system. The cycling can also occur if BGE determines that economic considerations (very high energy prices) warrant a cycling event to occur. BGE will offer participants incentives of $50, $75, or $100 for signing up for the 50%, 75%, or 100% cycling options, respectively.
BGE estimates that if it is successful in implementing the DRI program, the DRI program will generate overall net savings of $965 million (in present value terms) over a 15-year period. The benefit-to-cost ratio of implementing the DRI program is approximately seven-to-one.
BGE states that it believes that enrolling 50% (450,000) of its eligible customers with central A/C or heat-pump units is achievable by the end of 2011. BGE states that it can achieve an average of 1.38 kW demand reduction per A/C or heat pump unit. Overall, BGE estimates a benefit of 600 MW of demand reduction from implementing the DRI program.
For the 2011/2012 PJM RPM Capacity Auction, BGE bid and cleared 495 MW of demand reduction. 2. Pepco
Pepco received Commission approval to implement its DRI program on April 18, 2008. Under this voluntary demand response program for residential customers, Pepco will cycle off customers’ central A/C or heat-pump units 50%, 75%, or 100% during specified periods. The cycling off of the A/C and heat-pump units can be invoked by a PJM emergency event or by a local emergency on the distribution system. The cycling can also occur if Pepco determines that economic considerations (very high energy prices) warrant a cycling event to occur. Pepco will offer participants incentives of $40, $60, or $80 for signing up for the 50%, 75%, or 100% cycling options, respectively.
Pepco estimates that if it is successful in implementing the DRI program, the DRI program will generate overall net savings of $225 million (in present value terms) over a 15-year period. The benefit-to-cost ratio of implementing the DRI program is approximately three-to-one.
Pepco states that it believes that enrolling 42% (166,000) of its eligible customers with central A/C or heat-pump units is achievable by the end of 2015. Pepco states that it can achieve an average of 1.23 kW demand reduction per A/C or heat pump unit. Overall, Pepco estimates a benefit of 206 MW of demand reduction from implementing the DRI program.
For the 2011/2012 PJM RPM Capacity Auction, Pepco bid and cleared 102 MW of demand reduction.
33
3. Delmarva
Delmarva received Commission approval to implement its DRI program on April 18, 2008. Under this voluntary demand response program for residential customers, Delmarva will cycle off customers’ central A/C or heat-pump units 50%, 75%, or 100% during specified periods. The cycling off of the A/C and heat-pump units can be invoked by a PJM emergency event or by a local emergency on the distribution system. The cycling can also occur if Delmarva determines that economic considerations (very high energy prices) warrant a cycling event to occur. Delmarva will offer participants incentives of $40, $60, or $80 for signing up for the 50%, 75%, or 100% cycling options, respectively.
Delmarva estimates that if it is successful in implementing the DRI program, the DRI program will generate overall net savings of $45 million (in present value terms) over a 15-year period. The benefit-to-cost ratio of implementing the DRI program is approximately three-to-one.
Delmarva states that it believes that enrolling 59% (54,000) of its eligible customers with central A/C or heat-pump units is achievable by the end of 2015. Delmarva states that it can achieve an average of 1.23 kW demand reduction per A/C or heat pump unit. Overall, Delmarva estimates a benefit of 67 MW of demand reduction from implementing the DRI program.
For the 2011/2012 PJM RPM Capacity Auction, Delmarva bid and cleared 25.6 MW of demand reduction. 4. SMECO
SMECO received Commission approval to implement its DRI program on April 15, 2008. The major difference between SMECO’s DRI proposal and the other utilities is that SMECO has entered into a 10 year contract with Converge to run SMECO’s DRI program. Under this voluntary demand response program for residential customers, Delmarva will use an initial 2 degree offset followed by 30% cycling for the thermostats and a 50% cycling option followed by 30% cycling for the switches during specified periods. The cycling off of the A/C and heat-pump units can be invoked by a PJM emergency event or by a local emergency on the distribution system. The cycling can also occur if SMECO determines that economic considerations (very high energy prices) warrant a cycling event to occur. SMECO will offer incentives of $25 for participants who have a direct load control switch and $50 for participants with a smart thermostat.
SMECO estimates that if it is successful in implementing the DRI program, the DRI program will generate overall net savings of $24 million (in present value terms) over a 10-year period. The benefit-to-cost ratio of implementing the DRI program is approximately two-to-one.
34
SMECO states that it believes that enrolling 33% (37,000) of its eligible customers with central A/C or heat-pump units is achievable by the end of 2015. SMECO states that it can achieve an average of 1.25 kW demand reduction per A/C or heat pump unit. Overall, SMECO estimates a benefit of 50 MW of demand reduction from implementing the DRI program.
For the 2011/2012 PJM RPM Capacity Auction, SMECO bid and cleared 25 MW of demand reduction.
C. Pre-Empower Conservation and Energy Efficiency DSM programs are designed to enable customers to better control their electric bills. Currently, the proposed DSM programs would fall into two categories: energy efficiency and demand response. Energy efficiency programs, such as HVAC and lighting, are designed to lower customer energy usage through more efficient lighting, air conditioning, and appliances, which lead to lower electric bills. Demand response programs are designed in a manner that allows the customer to “respond” to price signals, actively or passively, thereby lowering energy demand during critical periods of high electricity prices. A smart thermostat can be programmed to increase the thermostat setting automatically in response to high electricity prices. As discussed above, Maryland’s four investor-owned electric companies filed energy efficiency and conservation plans during 2007, and revised plans in 2008. The plans consisted of “fast track” programs and, for three of the four IOUs, more comprehensive long-term programs. The “fast-track” programs are designed to take advantage of “low hanging fruit” on an expedited basis. The purpose of these programs is to provide residential customers with an opportunity to reduce electricity usage and electricity costs and to enjoy energy cost savings quickly and without significant capital expenditures. The plans for comprehensive long-term programs have been incorporated into the aforementioned EmPower Maryland filings. 1. BGE
On April 23, 2008, the Commission approved BGE’s Smart Energy Pricing pilot proposal, pursuant to creating an AMI pilot inclusive of a viable critical peak pricing pilot component to gather statistically significant, measurable and meaningful information as to the potential positive effect of AMI on reducing peak system demand. The pilot has two components: 1) testing of the AMI vendor equipment in its service territory, and 2) monitoring of consumer behavior in conjunction with day-ahead dynamic peak pricing signals and “smart switch” on their air conditioning unit. BGE will continue its pilot for a second year to ensure sustainability of perceived and projected load reductions, validating the monetization of energy and demand response value with PJM as well as system development and IT integration of AMI equipment. Pending Commission approval, BGE expects to fully deploy the AMI program in 2011.
35

On June 30, 2008, BGE received Commission approval to continue two “fast-track” Energy Star conservation and energy efficiency programs as follows: (1) a buy-down rebate20 for compact fluorescent light bulbs; and (2) rebates for certain large appliances (such as clothes washers, freezers, and refrigerators). The Commission also accepted the cost recovery surcharge associated with the programs. The Commission directed BGE to file monthly reports detailing the participation level and expense results associated with the “fast-track” programs. The efficiency surcharge, effective July 1, 2008, was set at $0.00035 per kWh through June 30, 2009, decreasing approximately 48% from the previous rate of $0.00067 per kWh.
As of September 22, 2008, BGE indicated that it has spent $3.3 million in “fast-track” programs. According to BGE, the “fast-track” programs achieved estimated annual bill savings of $12,656,593 and $114.6 million in life cycle bill savings for the June 30, 2007 – September 22, 2008 period. Partner retailers have sold 1,738,931 CFL bulbs through BGE’s “fast-track” programs, which result in an estimated 91.8 million kWh saved annually. Life cycle savings for the “fast-track” programs, based on Energy Star assumptions, are expected to result in approximately 848.8 million kWh savings. Under BGE’s second “fast track” program, 15,039 processed appliance rebates (7,137 clothes washers, 7,546 refrigerators, and 356 freezers) are expected to generate 1,758,603 kWh annual savings and 20.56 million kWh lifetime savings. Room air conditioners were removed from the eligible list of products due to Commission concern regarding rebate amounts. BGE proposed additional energy efficiency and conservation programs, which are inclusive of the above “fast-track” programs, which were approved by Order No. 82384 in Case No. 915421 issued December 31, 2008. BGE estimates that these additional conservation programs will cost $390,134,897 ($188,302,057 for six residential programs and $188,332,840 for commercial and industrial programs) over the next eight years (2008-2015). BGE projects estimated savings from the electric programs of 2,653,902 MWh in energy reductions (From electric and demand programs: 1,086,693 MWh in energy reductions for the residential class and 1,525,209 MWh in energy reductions for the commercial and industrial classes. Demand response programs are expected to save 42,000 MWh). BGE estimated 12,186,792 therms in total gas energy reductions (5,874,895 therms for the residential class and 6,311,898 therms for the commercial and industrial classes). According to BGE, these EE&C programs will yield an estimated energy reduction representing approximately 62% of BGE’s contribution to the EmPower Maryland goals.22
20 A “buy-down” rebate is processed through participating retailers as opposed to a “mark-down” which is
negotiated through manufacturers and/or distributors. A buy-down usually expedites participation in such programs through the immediate reduction at point of sale. BGE provided a rebate to retailers of $1.50 for a single CFL and $3.00 for a multi-pack.
21 In the Matter of Baltimore Gas and Electric Company’s Energy Efficiency, Conservation and Demand Response Porgrams Pursuant to the EmPower Maryland Energy Efficiency Act of 2008.
22 See PUC Article §7-211 (or House Bill 374). EmPower Maryland establishes a 15% per capita reduction statewide in total electric usage by 2015. All state utilities are required to meet two-thirds of the energy consumption goal, with the Maryland Energy Administration meeting the last five (5) percent.
36
2. Pepco and Delmarva By Order No. 81618, issued September 19, 2007, , the Commission directed Pepco and Delmarva to implement their residential CFL programs and associated Energy Awareness Campaign necessary to support the CFL programs, referred to as “fast track” programs. The Pepco and Delmarva CFL programs are similar to the BGE program using the buy-down mechanism. The Commission found the CFL programs to be cost-effective energy efficiency and conservation programs that will afford each residential customer who participates in one of the CFL programs an opportunity to save both energy and money. The Commission authorized Pepco and Delmarva to recover the costs associated with the CFL programs, and both utilities are required to submit quarterly CFL program reports to the Commission. On July 8, 2008 Pepco and DPL filed their quarterly reports in compliance with Commission Order No. 81618 noted above. Each filing is a combination of partial fourth quarter 2007 (November-December) and the first quarter of 2008 (January-March) because the program began in mid-November and December of 2007, which did not constitute a complete calendar quarter. 3. Pepco’s CFL Program As of March 31, 2008, consumers had purchased 549,858 bulbs through Pepco’s participating retailers. Actual sales of CFLs eclipsed the Company’s 3-year sales projection figures in just four months. Pepco forecasted the sale of 544,000 CFL bulbs during its entire three year program. To date, Pepco has spent $423,025 on bulb rebates. Participants have achieved an estimated 27,678,726 of kilowatt-hour (“kWh”) savings, or $3,655,529 per year of electricity savings. Pepco has also given away 7,982 bulbs. The Company has spent $983,985 in program costs. Expenditures are expected to be $2.4 million at the conclusion of the year, more than double the budgeted total due to higher than expected sales and increased participation among local retailers and expanded marketing efforts. 4. DPL CFL As of March 31, 2008, Delmarva had sold 51,120 bulbs through its participating retailers, spending $57,682 on bulb rebates. Actual sales of CFLs eclipsed the Company’s 3-year sales projection figures in just four months. Pepco forecasted the sale of 544,000 CFL bulbs during its entire three year program. Participants have achieved an estimated 2,335,412 of kilowatt-hour (“kWh”) savings, or $319,134 per year of electricity savings. Delmarva has also given away 7,400 bulbs. For the first quarter, the Company has spent $199,973 in program costs. Expenditures are expected to be $600,000 at the conclusion of the year. The original “Blueprint for the Future” plans filed on March 21, 2007 by Pepco and Delmarva have segued into the EmPower Maryland filings, Case Nos. 9155 and 9156
37

respectively. These filings comprise a suite of EE&C and AMI program offerings, in order to reach the EmPower Maryland target goal, and include estimated surcharges and bill impacts accordingly. 5. Allegheny The Commission approved two “fast-track” energy efficiency programs for AP on September 26, 2007: (1) the CFL Program; and (2) the Education Campaign Program. By Letter Order dated September 26, 2007, the Commission authorized AP to offer the two “fast-track” energy efficiency programs and to recover the costs of those programs. Allegheny requested an effective date of October 3, 2007 to implement these programs.23 Allegheny’s CFL program differed in the respect that it proposed to “give away” the CFLs rather than use a buy-down mechanism. The Commission further directed AP to file monthly reports informing the Commission of the progress of the “fast-track” programs, including the educational materials provided to the Company’s residential customers. Upon implementation, the Commission received numerous customer complaints regarding the distribution of the CFL bulbs. As a result, the programs were discontinued as of January 2008. On April 25, 2008, the Commission approved a remediation measure for AP so that any remaining customers who did not receive a CFL kit would receive one. AP indicated that Niagara Conservation Corporation had shipped a total of 223,035 CFL kits (93,870 in November, 128,391 in December, and 774 in May) to AP’s residential customers. As of May 2008, AP has provided approximately 5,140 educational booklets on energy efficiency and conservation to 124 teachers in 22 different schools. The Commission ordered a remediation plan to set the Energy Conservation Surcharge (ECS) to zero and provide a one-time bill credit to residential customers for these programs. Based on CFL distribution and requests as of May 2008, participants are estimated to have achieved 22,957,000 of kilowatt-hour (“kWh”) savings per year, or an estimated $1,147,738 in electricity savings per year.
D. EmPower Maryland Programs During the 2008 legislative session, the General Assembly passed the EmPower Act, which recognized that energy efficiency is among the least expensive ways to meet the growing electricity demands of the State. The Act sets significant and aggressive goals for reducing the State’s peak demand and energy consumption in a set time frame, i.e., a 15 percent reduction in per capita electricity consumption by the end of 2015, and a 15 percent reduction in per capita peak demand by the end of 2015. The Act requires the IOUs to offer appropriate and cost-efficient programs to its residential, commercial and industrial customers designed to achieve a 5 percent reduction by 2011 and a 15 percent reduction by 2015 in per capita peak demand and a 5 percent reduction by 2011 and a 10 percent 23 The effective date coincides with the National ENERGY STAR® “Change a Light” campaign, which
encourages commitment to energy efficiency.
38
reduction by 2015 in per capital electricity consumed. Additionally, the Act requires the IOUs to include energy efficiency and conservation programs specifically targeted to low-income and low-to-moderate income communities.
The Act directed the IOUs, as well as the Southern Maryland Electric Cooperative, to submit plans to the PSC on or before September 1, 2008 that detail the companies’ proposals for achieving the reduction targets. Prior to the submission date, the PSC’s Technical Staff, along with the Maryland Energy Administration (“MEA”), conducted several workgroup meetings with the IOUs. As a result of these meetings, the PSC issued its “EmPower Maryland Plan Outline,” which provided guidance to the IOUs on how to organize, present and document their proposed EmPower Maryland Plans.
Each of the five utilities submitted detailed plans on or before September 1, 2008.
Although each proposal reflects that utility’s unique customer base and prior experience with energy efficiency and conservation programs, there are numerous similarities among the IOUs. For example, each utility’s portfolio of program offerings includes appliance rebates and total home energy audits for residential customers plus lighting programs and custom applications for the industrial customers. All programs include a customer education and outreach component.
The Act compels participation by MEA in the formulation and implementation of
the EmPower Maryland programs. Prior to July 1, 2008, the Act required each utility to consult with MEA regarding the design and adequacy of the programs it was proposing. Each utility is also required to provide an annual update to the PSC and MEA on plan implementation and progress towards meeting the goals. The PSC, in consultation with MEA, must provide an annual report to the General Assembly regarding the status of the programs, a recommendation for the appropriate funding level to adequately fund the programs and services, and the per capita electricity consumption and peak demand for the previous year.
The PSC established a separate proceeding and procedural schedule for each
utility’s filing. Motions to Intervene were filed by eight to ten parties in each proceeding; the PSC granted all such motions. Comments by the intervenors, as well as a response by the utility, have been filed in each proceeding. The PSC has conducted hearings, each of which has lasted more than a day, on each utility’s proposal. According to the Act, in determining whether a program or service encourages and promotes the efficient use and conservation of energy, and therefore whether it should be approved, the PSC must consider (i) the cost-effectiveness; (ii) the impact on rates of each ratepayer class; (iii) the impact on jobs; and (iv) the impact on the environment.
Several points on the filings warrant comment. First, four of the five utilities’ plans
(Allegheny Power is the exception) meet the Act’s goal of a 5 percent peak demand reduction by 2011. By 2015, only Baltimore Gas and Electric Company and Potomac Electric Power Company meet the 15 percent reduction in peak demand. The numbers are even worse for energy consumption. In 2011, only Southern Maryland Energy Cooperative is able to meet the 5 percent reduction in energy consumption; in 2015, no utility’s proposal
39

reaches the 10 percent goal. It is clear that more aggressive, innovative programs are required.
Second, there is no current baseline study of Maryland customers that allows the utilities or the regulators to assess the reasonableness of the utilities’ assumptions regarding participation rates, necessary rebates, and the like. The participants in these proceedings have urged the PSC to initiate such a study so that all parties have a reasonable baseline to utilize when predicting and evaluating program results. The PSC issued an order on December 1 directing the utilities to collaborate on and issue a request for proposals to initiate a State-wide baseline study during 2009, which will help refine these programs going forward and help ensure they are and remain cost-effective.
Although the Commission has struggled to find and approve the appropriate mix of
programs, there is no doubt that energy efficiency and demand response programs yield the greatest bang for the ratepayers’ investment buck. PSC undertook a series of reports to the Maryland General Assembly and employed Levitan & Associates to assist with the analysis. Levitan’s analysis demonstrates that meeting the EmPower Maryland goals would provide one of the highest levels of economic value added (“EVA”) as compared to business-as-usual. Levitan evaluated four of the five EmPower Maryland plans60 and “grossed up” their proposed energy reductions to ensure that they would meet the 15 percent reduction by 2015. The “reference case,” designed to simulate a business-as-usual approach, assumes only 25 percent of the EmPower Maryland goals will be met. As compared to the reference case, Levitan’s “15x15” scenario showed cost savings every year, rising in later years to nearly $500 million per year. However, Levitan assumes that costs will rise as market penetration increases, so that the highest benefit to cost ratio is for the early “low-hanging fruit,” the first 25 percent included in the reference case. Annual savings skyrocket under the “peak oil” scenario, to over $1 billion per year in later years, but more importantly, remain strongly positive under the much lower oil price scenario (i.e., the Federal Outlook case). According to Levitan, meeting the EmPower Maryland goals would also reduce carbon dioxide emissions nearly three times as much as the annual target under the Regional Greenhouse Gas Initiative. Demand-side initiatives must be an important weapon in Maryland’s reliability arsenal, and our work on these programs will continue in 2009 and beyond.
E. Mid-Atlantic Distributed Resources Initiative (“MADRI”) MADRI was established by “classic” PJM State Commissions, DOE, and PJM at a meeting in Baltimore, held on June 14-15, 2004. Its goal is “to develop regional policies and market-enabling activities to support distributed generation and demand response in the Mid-Atlantic region”. Facilitation support is provided by the Regulatory Assistance Project funded by DOE. There has been much participation by a large number of stakeholders, including utilities, FERC, service providers, and consumers. During 2008, MADRI had activities in the following areas:
40

• Advanced metering study, including concepts ranging from simple one-way remote (automatic) meter reading to complex two-way “smart” meters that perform numerous power monitoring functions through advanced metering infrastructure. The AMI Toolbox on the MADRI website24 may be the best one-stop source of AMI information. Meetings include updates of AMI and smart grid proposals and deployment in the region.
• Incorporation of peak demand reductions resulting from energy efficiency measures
into the PJM capacity market. • Review and discussion of pricing pilot programs in the region intended to reduce
usage during peak and other high cost times. • A regional perspective and emphasis on maximizing demand response resources.
• Exchange of information between utilities, PJM, and curtailment service providers.
This involves data on customer demand baseline and curtailment under PJM programs, when there is a “two supplier” problem with different retail suppliers serving a customer.
• Consumer education and a uniform regional consent form for demand response
customers.
F. Advanced Metering Infrastructure / Smart Grid 1. Background
Advance Metering Infrastructure (“AMI”) or “Smart grid” technology is generally defined as a two-way communication system and associated equipment and software, including equipment installed on an electric customer’s premises that uses the electric company’s distribution network to provide real-time monitoring, diagnostic, and control information and services that improve the efficiency and reliability of the distribution and use of electricity. The deployment of advanced meters enable customers to see and respond to market based pricing, can assist in increasing grid reliability and act to reduce environmental impacts. Consequently, “Smart grid” technology can ameliorate the need to dispatch generation facilities at peak electric usage periods, reduce congestion costs, while simultaneously assisting to forestall power plant construction. Additionally, reliability and power quality benefits can also accrue with employment to reduce blackout probabilities and forced outage rates while restoring power in shorter time periods.
On June 8, 2007, the Maryland Public Service Commission (PSC or Commission) established a collaborative process to consider four issues pertaining to AMI and demand side management (DSM) programs: ● technical standards, ● extent to which programs are
24 Source: http://www.energetics.com/MADRI/ the Toolbox was updated in 2008.
41
to be offered, ● program cost recovery, and ● the appropriate tests to determine cost effectiveness.
On September 28, 2007, the Commission issued Order No. 81637 that established the following minimum technical standards for AMI:
• A minimum of hourly meter reads delivered one time per day. • Non-discriminatory access for retail electric suppliers and curtailment
service providers to meter data and demand response functions that is equivalent to the electric company’s own access to those functions.
• AMI shall be implemented for all customers of the electric company. • Metering and meter data management and AMI/DSM implementation should
generally continue to be an electric company function.25 • All AMI meters shall have the ability to monitor voltage at each meter and
report the data in a manner that allows the utility to react to the information. • All meters shall have remote programming capability. • All meters shall be capable of two-way communications. • Remote disconnect / reconnect for all meters rated at below 200 amps. • Time-stamp capability for all AMI meters. • All meters shall have a minimum of 14 days of data storage capability on the
meter. • All meters shall communicate outages and restorations. • All meters shall be net metering and bi-directional metering capable.
In response to the Order, in early 2007, three Maryland investor-owned utilities filed
smart metering and DSM proposals. BGE is the only utility in Maryland that is currently running an AMI pilot. Pepco, Delmarva, and Allegheny Power have filed proposals with the Commission. Additional detail is provided below. The Commission will begin an in-depth evaluation of Maryland utility AMI proposal/smart grid proposal in 2009. The Commission’s review commences after reviewing September 2008 EmPower Maryland programs filings and issuing decisions on December 31 2008. To assist in this evaluation, the Commission has sought outside technical assistance. Responses to the Commission’s Request for Proposal were filed on December 15, 2008. The chosen vendor will assist the Commission in its evaluation of proposals filed as well as providing background technical information. 25 Metering and data management options may be considered for larger non-residential customers (this does
not exclude any customer from a requirement that their AMI shall at a minimum be fully consistent with all AMI standards). For example, if an industrial or commercial customer (and its retail supplier or CSP) requires more frequent meter reads or downloads, the utility shall work in good faith to accommodate such requirements.
42

2. BGE
In January 2007, BGE filed for authority to initiate an AMI and a DSM pilot. BGE’s AMI and Smart Energy Pricing Programs were reviewed by the Commission and approved in April 2007. The Commission directed BGE to develop and propose a comprehensive pilot designed to test varied and extreme conditions. Pilot design components are as follows:
• Roughly 5,300 electric and gas modules • Test in 2 zip codes
o Westminster – a more rural area o Baltimore City
• 2 AMI vendors selected • Indoor and outdoor meter locations
As of October 15, 2008, BGE has reported the following:
• Installed over 5,000 AMI meters • Installed the Communications Infrastructure • Installed Meter Data Management System (“MDM”) • Integrations to transfer data from the meter and MDM to Customer
Information System test region BGE will file a final report on the AMI pilot to the PSC no later than January of
2009. Pending pilot results, BGE will file a service territory wide AMI business case. 3. Pepco and Delmarva
Pepco and Delmarva propose AMI system implementation for their entire service territories.26 The companies felt that an AMI pilot program was unnecessary and would not provide for additional learning, given the availability of robust information available as a result of activities conducted in other states. 4. Allegheny Power
AP has included an AMI pilot proposal as a part of its EmPower Maryland filing with the following highlights:
• Pilot to run in the city of Urbana • Pilot will last 15 months • 1,140 customers to receive an advanced meter • Some customers will receive a smart thermostat to control electric central air
conditioning and/or a device for electric hot water heaters
AP intends to discuss pilot implementation with Staff and other interested parties. 26 A component of the PHI Blue Print for the Future filings in March of 2007.
43
VI. ENERGY, THE ENVIRONMENT AND RENEWABLES
A. Maryland’s Commission on Climate Change
On April 20, 2007, Governor O’Malley signed Executive Order 01.01.2007.07, which established the Maryland Commission on Climate Change. The Commission on Climate Change is comprised of sixteen State agency leaders, including the Chairman of the Public Service Commission, and six members of the General Assembly. The Commission on Climate Change’s primary charge was to develop a Climate Action Plan27 that would address the drivers of climate change, prepare for its likely impacts in Maryland, and to establish goals and timetables for implementation.
Table VI.A.1 shows the greenhouse gas reduction goals established by the
Commission on Climate Change. The goals are based on greenhouse gas reductions from a 2006 base year, and are purposely very aggressive.
Table VI.A.1: Maryland Commission on Climate Change Goals
Year Maryland’s Goals 2012 10% Reduction from 2006 Levels 2015 15% Reduction from 2006 Levels 2020 Minimum Goal - 25% Reduction From 2006 Levels 2020 Aspiration Goal - 50% Reduction From 2006 Levels 2050 90% Reduction From 2006 Levels
The Maryland Department of Environment is the lead agency behind the work of the
Commission on Climate Change, and the Climate Change Commission’s work is facilitated by the Center for Climate Strategies. The work of the Commission on Climate Change is founded on the assumption that excess carbon dioxide released by human activity is causing global warming. The Commission’s working groups and technical working groups are focused on identifying actions that have the potential to reduce greenhouse gases and thus stop and reverse the effects of global warming.
In January 2008, the Commission on Climate Change issued an Interim Report that
updated the Governor and General Assembly on the state of the science on climate change, recommended greenhouse gas reduction goals, and recommended a host of early actions and policy options. The report included a variety of recommendations for legislative action, and the General Assembly adopted a number of them during the 2008 legislative session, including:
• Enacted the EmPOWER Maryland Energy Efficiency Act of 2008; • Established a Strategic Energy Investment Fund and a Strategic Energy
Investment Program;
27 The Climate Action Plan is available at http://www.mdclimatechange.us/.
44

• Accelerated the requirements of the Renewable Portfolio Standard; and • Enacted the High Performance Buildings Act of 2008;
The General Assembly declined to enact one of the Commission on Climate
Change’s top legislative recommendations, the Global Warming Solutions Act of 2008. The Global Warming Solutions Act would have required a Statewide reduction of greenhouse gas emissions by 25 percent by 2020, and 50 percent by 2050.
The Commission on Climate Change issued its Climate Action Plan in August 2008.
Building on the work behind the Interim Report, the Climate Action Plan contains studies and recommendations of the Commission’s three working groups: the Scientific and Technical Working Group; the Adaptation and Response Working Group; and, the Greenhouse Gas and Carbon Mitigation Working Group. The Climate Action Plan details what effects global warming will have on the State, recommends actions to protect Maryland’s property and people from rising sea levels and changing weather patterns, and outlines 42 actions to help the state greatly reduce its global warming pollution. The report concludes that Maryland would see significant economic and environmental benefits from taking early, immediate actions to reduce global warming pollution and that the goals proposed by the Commission are achievable and would help spur innovation in the State.
The Commission on Climate Change divided its 42 recommended actions for reducing global warming into four different “bins.” The Commission also identified lead agencies for each policy option. These lead agencies, which are responsible for further analysis and implementation of the policies, and co-lead agencies or assisting agencies (in parentheses) are identified in Table VI.A.2. The Maryland Public Service Commission is the lead agency for the policy options relating to the Renewable Portfolio Standard and Integrated Resource Planning.
Table VI.A.2: Maryland Commission on Climate Change Recommended Actions
Bin 1: Higher Emission Reductions/Easier to Implement
Policy Lead Agency GHG Cap-and-Trade MDE Transportation Technologies MDOT (MDE) Energy Efficiency Resource Standard MEA State & Local Government Lead by Example MDE (MEA, MDOT) Improved Design, Construction, Appliances & Lighting in Government
MDE (others)
Waste Management / Advanced Recycling MDE Renewable Portfolio Standard PSC (MEA) Demand Side Management & Energy Efficiency MEA (PSC) Improved Building & Trade Codes DHCD (MEA)
45

Bin 2: Lower Emission Reduction / Easier Implementation
Policy Lead Agency GHG Emission Inventories & Forecasting MDE GHG Reporting & Registries MDE Statewide GHG Reduction Goals MDE Public Education and Outreach MDE (MSDE, MEA) Participate in Regional, Multi-State & National Efforts MDE Review Institutional Capacity Commission on Climate
Change After Peak Oil MEA (MDE) Public Health Risks DHMH (MDE) Promotion & Incentives for Energy Efficient Lightion MEA Clean Distributed Generation MEA (PSC) Low-Cost Loans for Energy Efficiency MEA Promotion of Renewable Energy MEA (PSC) Integrated Resource Planning PSC (MEA) More Stringent Appliance/Equipment & Efficiency Standards MEA Promote Economic Development Opportunities DBED (MEA) Technology Focused Initiatives for Electricity Supply MEA Managing Urban Trees & Forests DNR Afforestation, Reforestation, & Restoration of Forests & Wetlands
DNR (MDA)
Protection & Conservation of Agricultural Land, Coastal Wetlands & Forested Land
MDA
Forest Management for Enhanced Carbon Sequestration DNR Buy Local Programs MDA (DNR)
Bin 3: Higher Emission Reduction / Harder Implementation
Policy Lead Agency
Energy Improvements & Repowering Existing Plants MEA (PSC) Generation Performance Standards MDE (PSC, MEA) Land Use & Location Efficiency MDOT (MDP, MDE) Transit MDOT (MDP, MDE) Intercity Travel MDOT (MDP, MDE) Pay-As-You-Drive Insurance MDOT (MDP, MDE) Bike & Pedestrian Infrastructure MDOT (MDP, MDE) Incentives, Pricing & Resource Measures MDOT (MDP, MDE) Evaluate GHGs from Major Projects MDOT (MDP, MDE)
46
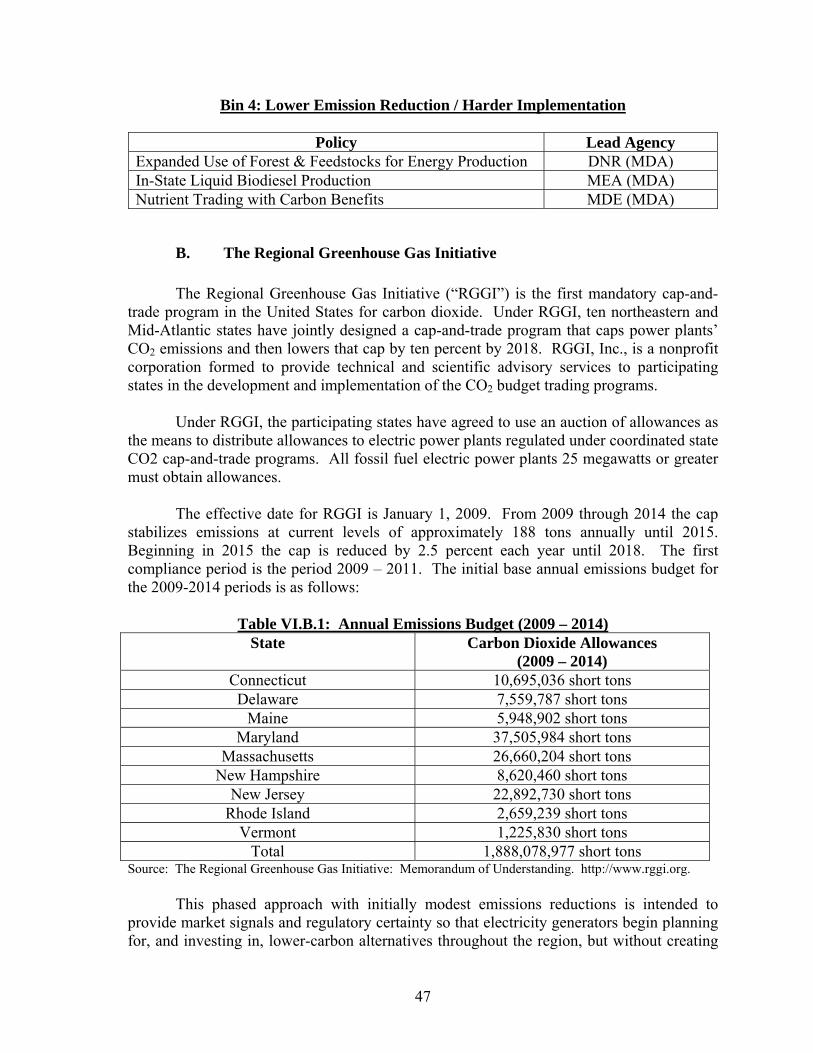
Bin 4: Lower Emission Reduction / Harder Implementation
Policy Lead Agency Expanded Use of Forest & Feedstocks for Energy Production DNR (MDA) In-State Liquid Biodiesel Production MEA (MDA) Nutrient Trading with Carbon Benefits MDE (MDA)
B. The Regional Greenhouse Gas Initiative The Regional Greenhouse Gas Initiative (“RGGI”) is the first mandatory cap-and-
trade program in the United States for carbon dioxide. Under RGGI, ten northeastern and Mid-Atlantic states have jointly designed a cap-and-trade program that caps power plants’ CO2 emissions and then lowers that cap by ten percent by 2018. RGGI, Inc., is a nonprofit corporation formed to provide technical and scientific advisory services to participating states in the development and implementation of the CO2 budget trading programs. Under RGGI, the participating states have agreed to use an auction of allowances as the means to distribute allowances to electric power plants regulated under coordinated state CO2 cap-and-trade programs. All fossil fuel electric power plants 25 megawatts or greater must obtain allowances. The effective date for RGGI is January 1, 2009. From 2009 through 2014 the cap stabilizes emissions at current levels of approximately 188 tons annually until 2015. Beginning in 2015 the cap is reduced by 2.5 percent each year until 2018. The first compliance period is the period 2009 – 2011. The initial base annual emissions budget for the 2009-2014 periods is as follows:
Table VI.B.1: Annual Emissions Budget (2009 – 2014) State Carbon Dioxide Allowances
(2009 – 2014) Connecticut 10,695,036 short tons Delaware 7,559,787 short tons
Maine 5,948,902 short tons Maryland 37,505,984 short tons
Massachusetts 26,660,204 short tons New Hampshire 8,620,460 short tons
New Jersey 22,892,730 short tons Rhode Island 2,659,239 short tons
Vermont 1,225,830 short tons Total 1,888,078,977 short tons
Source: The Regional Greenhouse Gas Initiative: Memorandum of Understanding. http://www.rggi.org. This phased approach with initially modest emissions reductions is intended to provide market signals and regulatory certainty so that electricity generators begin planning for, and investing in, lower-carbon alternatives throughout the region, but without creating
47

dramatic wholesale electricity price impacts and attendant retail electricity rate impacts. The RGGI MOU apportions CO2 allowances among signatory states through a process that was based on historical emissions and negation among the signatory states. Together, the emissions budgets of each signatory state comprise the regional emissions budget or RGGI “cap”.
RGGI accomplished a major milestone this year with the successful auctions of the CO2 allowances (an allowance is a limited permission to emit one ton of CO2) on September 25, 2008 and December 17, 2008. The first auction closing price was $3.07 per CO2 allowance. Maryland’s Strategic Energy Investment Fund received $16,368,567.67. The second auction closing price was $3.38 per CO2 allowance and the SEIF received $18,021,419.78. In part, the SEIF supports renewable and energy efficiency programs and provides rate relief through the auction. Auctions of CO2 allowances will now be held quarterly with the next auction scheduled for March 2009. RGGI, Inc. is a non-profit Delaware corporation with offices to be located in New York City in space collocated with the New York Public Service Commission at 90 Church Street. The RGGI Board of Directors is composed of two representatives from each member state (20 total), with equal representation from the states environmental and energy regulatory agencies. Agency Heads (two from each state), also serving as board members, constitute a steering committee that provides direction to the Staff Working Group and allows in-process projects to be conditioned for Board Review.
C. The Renewable Energy Portfolio Standard Program In 2005, the Commission implemented the Renewable Energy Portfolio Standard (“RPS”).28 The RPS requires Maryland Load Serving Entities (“LSEs”), including electricity suppliers and utilities, to obtain a certain amount of their electricity from renewable sources such as solar, wind, hydroelectric and biomass. The annual RPS requirement applies to retail electricity sales in the State In 2007, and again in 2008, the renewable source requirements were altered and accelerated, thereby increasing the percentages of electricity sales that must be met in specified years through the accumulation of renewable energy credits (“RECs”). The renewable percentage requirements began at 3.5% in 2006, and increase every year, eventually peaking at 20% in 2022. Annually, an LSE must either submit RECs or pay a compliance fee in order to meet its RPS obligation. Additional information regarding the annual status of the Maryland RPS is available in the annual Renewable Energy Portfolio Standard Reports submitted to the General Assembly.29 A REC is equal to the renewable attributes associated with one megawatt-hour of electricity generated using specified renewable resources. Each supplier must present, on an annual basis, RECs equal to the required percentage. Generators and suppliers are allowed to trade RECs using a Commission-sanctioned or established REC registry and
28 See PUC Article § 7-701 et seq. and COMAR 20.61 for more specific information concerning the
Maryland RPS Program. 29 Maryland PSC, Commission Reports, Available:
http://webapp.psc.state.md.us/Intranet/psc/Reports_new.cfm
48
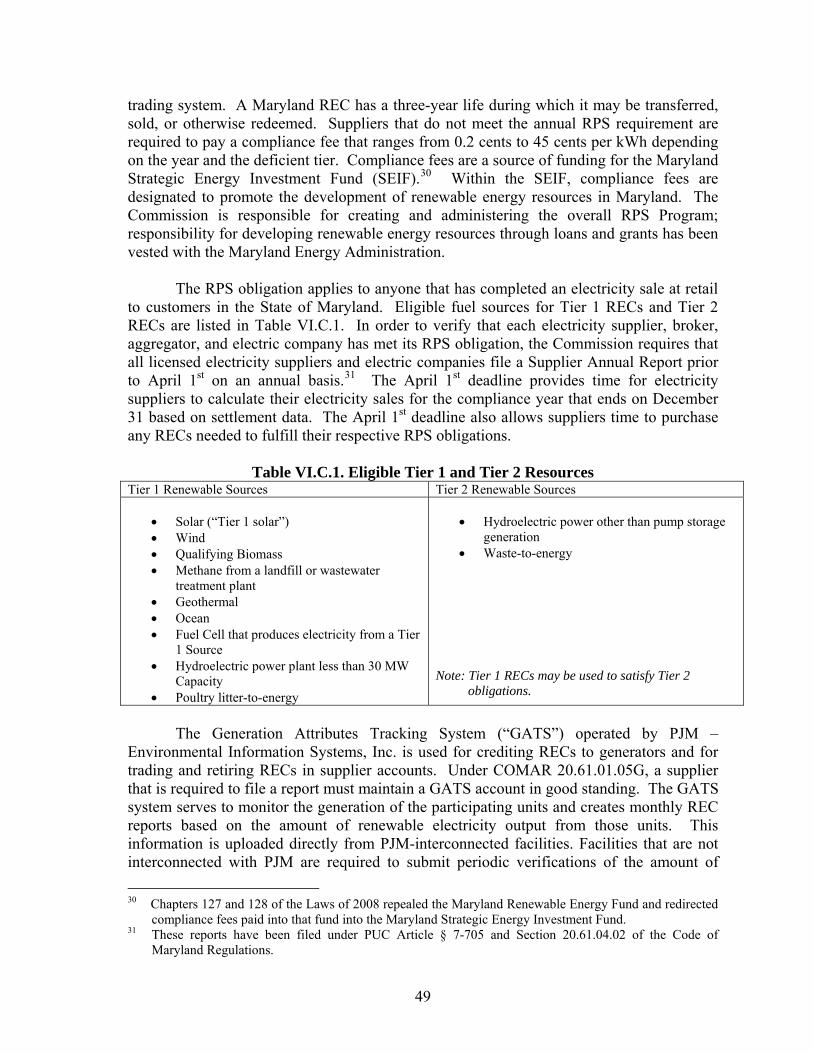
trading system. A Maryland REC has a three-year life during which it may be transferred, sold, or otherwise redeemed. Suppliers that do not meet the annual RPS requirement are required to pay a compliance fee that ranges from 0.2 cents to 45 cents per kWh depending on the year and the deficient tier. Compliance fees are a source of funding for the Maryland Strategic Energy Investment Fund (SEIF).30 Within the SEIF, compliance fees are designated to promote the development of renewable energy resources in Maryland. The Commission is responsible for creating and administering the overall RPS Program; responsibility for developing renewable energy resources through loans and grants has been vested with the Maryland Energy Administration.
The RPS obligation applies to anyone that has completed an electricity sale at retail
to customers in the State of Maryland. Eligible fuel sources for Tier 1 RECs and Tier 2 RECs are listed in Table VI.C.1. In order to verify that each electricity supplier, broker, aggregator, and electric company has met its RPS obligation, the Commission requires that all licensed electricity suppliers and electric companies file a Supplier Annual Report prior to April 1st on an annual basis.31 The April 1st deadline provides time for electricity suppliers to calculate their electricity sales for the compliance year that ends on December 31 based on settlement data. The April 1st deadline also allows suppliers time to purchase any RECs needed to fulfill their respective RPS obligations.
Table VI.C.1. Eligible Tier 1 and Tier 2 Resources
Tier 1 Renewable Sources Tier 2 Renewable Sources
• Solar (“Tier 1 solar”) • Wind • Qualifying Biomass • Methane from a landfill or wastewater
treatment plant • Geothermal • Ocean • Fuel Cell that produces electricity from a Tier
1 Source • Hydroelectric power plant less than 30 MW
Capacity • Poultry litter-to-energy
• Hydroelectric power other than pump storage
generation • Waste-to-energy
Note: Tier 1 RECs may be used to satisfy Tier 2
obligations.
The Generation Attributes Tracking System (“GATS”) operated by PJM – Environmental Information Systems, Inc. is used for crediting RECs to generators and for trading and retiring RECs in supplier accounts. Under COMAR 20.61.01.05G, a supplier that is required to file a report must maintain a GATS account in good standing. The GATS system serves to monitor the generation of the participating units and creates monthly REC reports based on the amount of renewable electricity output from those units. This information is uploaded directly from PJM-interconnected facilities. Facilities that are not interconnected with PJM are required to submit periodic verifications of the amount of 30 Chapters 127 and 128 of the Laws of 2008 repealed the Maryland Renewable Energy Fund and redirected
compliance fees paid into that fund into the Maryland Strategic Energy Investment Fund. 31 These reports have been filed under PUC Article § 7-705 and Section 20.61.04.02 of the Code of
Maryland Regulations.
49
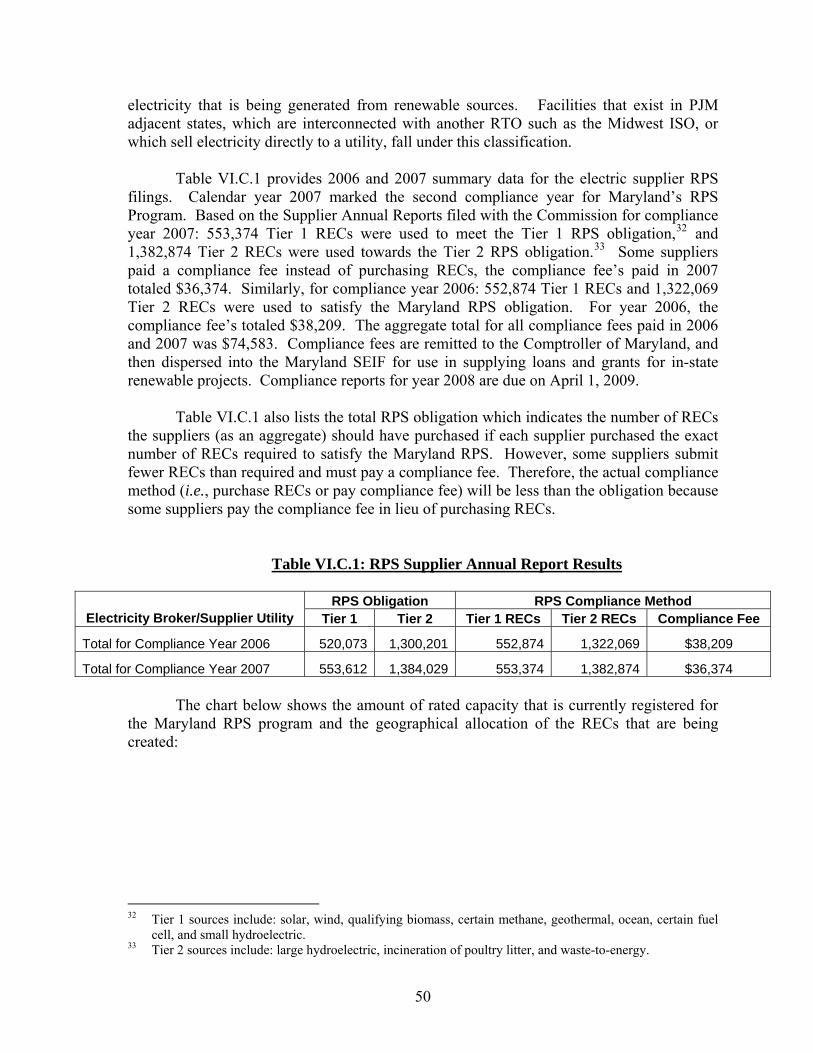
electricity that is being generated from renewable sources. Facilities that exist in PJM adjacent states, which are interconnected with another RTO such as the Midwest ISO, or which sell electricity directly to a utility, fall under this classification. Table VI.C.1 provides 2006 and 2007 summary data for the electric supplier RPS filings. Calendar year 2007 marked the second compliance year for Maryland’s RPS Program. Based on the Supplier Annual Reports filed with the Commission for compliance year 2007: 553,374 Tier 1 RECs were used to meet the Tier 1 RPS obligation,32 and 1,382,874 Tier 2 RECs were used towards the Tier 2 RPS obligation.33 Some suppliers paid a compliance fee instead of purchasing RECs, the compliance fee’s paid in 2007 totaled $36,374. Similarly, for compliance year 2006: 552,874 Tier 1 RECs and 1,322,069 Tier 2 RECs were used to satisfy the Maryland RPS obligation. For year 2006, the compliance fee’s totaled $38,209. The aggregate total for all compliance fees paid in 2006 and 2007 was $74,583. Compliance fees are remitted to the Comptroller of Maryland, and then dispersed into the Maryland SEIF for use in supplying loans and grants for in-state renewable projects. Compliance reports for year 2008 are due on April 1, 2009. Table VI.C.1 also lists the total RPS obligation which indicates the number of RECs the suppliers (as an aggregate) should have purchased if each supplier purchased the exact number of RECs required to satisfy the Maryland RPS. However, some suppliers submit fewer RECs than required and must pay a compliance fee. Therefore, the actual compliance method (i.e., purchase RECs or pay compliance fee) will be less than the obligation because some suppliers pay the compliance fee in lieu of purchasing RECs.
Table VI.C.1: RPS Supplier Annual Report Results
RPS Obligation RPS Compliance Method
Electricity Broker/Supplier Utility Tier 1 Tier 2 Tier 1 RECs Tier 2 RECs Compliance Fee
Total for Compliance Year 2006 520,073 1,300,201 552,874 1,322,069 $38,209
Total for Compliance Year 2007 553,612 1,384,029 553,374 1,382,874 $36,374 The chart below shows the amount of rated capacity that is currently registered for the Maryland RPS program and the geographical allocation of the RECs that are being created:
32 Tier 1 sources include: solar, wind, qualifying biomass, certain methane, geothermal, ocean, certain fuel
cell, and small hydroelectric. 33 Tier 2 sources include: large hydroelectric, incineration of poultry litter, and waste-to-energy.
50
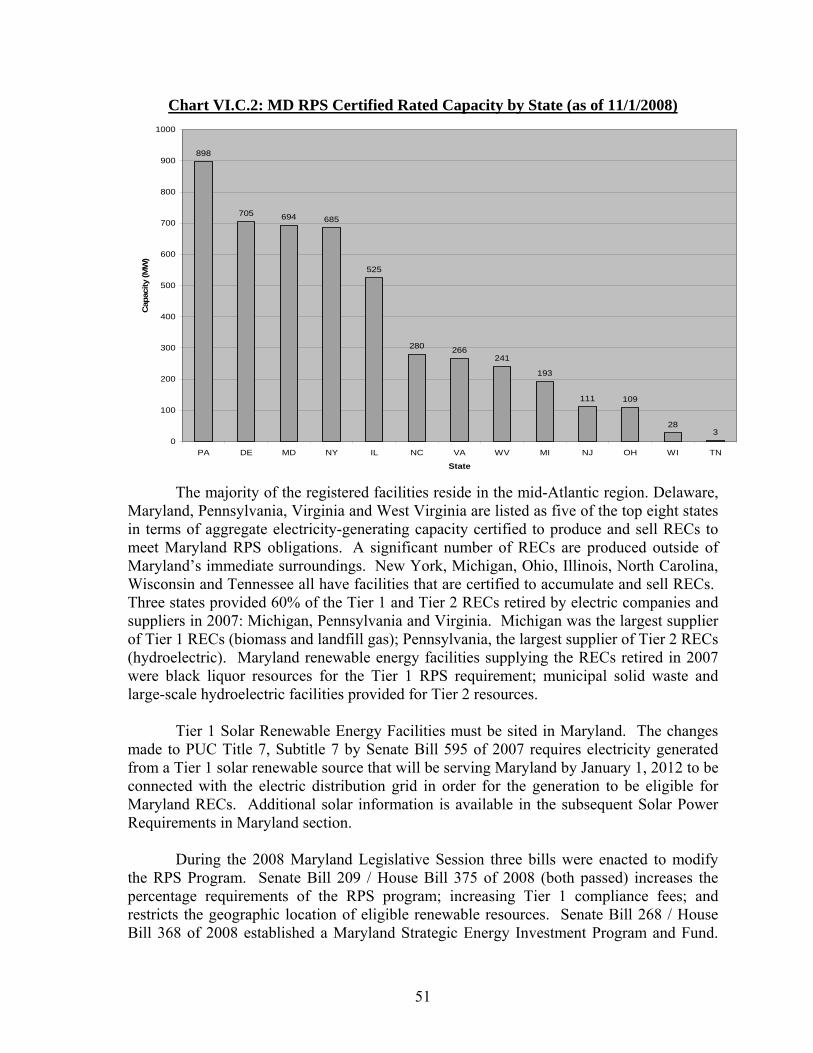
Chart VI.C.2: MD RPS Certified Rated Capacity by State (as of 11/1/2008)
898
705 694 685
525
280 266241
193
111 109
283
0
100
200
300
400
500
600
700
800
900
1000
PA DE MD NY IL NC VA WV MI NJ OH WI TN
State
Cap
acity
(MW
)
The majority of the registered facilities reside in the mid-Atlantic region. Delaware, Maryland, Pennsylvania, Virginia and West Virginia are listed as five of the top eight states in terms of aggregate electricity-generating capacity certified to produce and sell RECs to meet Maryland RPS obligations. A significant number of RECs are produced outside of Maryland’s immediate surroundings. New York, Michigan, Ohio, Illinois, North Carolina, Wisconsin and Tennessee all have facilities that are certified to accumulate and sell RECs. Three states provided 60% of the Tier 1 and Tier 2 RECs retired by electric companies and suppliers in 2007: Michigan, Pennsylvania and Virginia. Michigan was the largest supplier of Tier 1 RECs (biomass and landfill gas); Pennsylvania, the largest supplier of Tier 2 RECs (hydroelectric). Maryland renewable energy facilities supplying the RECs retired in 2007 were black liquor resources for the Tier 1 RPS requirement; municipal solid waste and large-scale hydroelectric facilities provided for Tier 2 resources.
Tier 1 Solar Renewable Energy Facilities must be sited in Maryland. The changes made to PUC Title 7, Subtitle 7 by Senate Bill 595 of 2007 requires electricity generated from a Tier 1 solar renewable source that will be serving Maryland by January 1, 2012 to be connected with the electric distribution grid in order for the generation to be eligible for Maryland RECs. Additional solar information is available in the subsequent Solar Power Requirements in Maryland section. During the 2008 Maryland Legislative Session three bills were enacted to modify the RPS Program. Senate Bill 209 / House Bill 375 of 2008 (both passed) increases the percentage requirements of the RPS program; increasing Tier 1 compliance fees; and restricts the geographic location of eligible renewable resources. Senate Bill 268 / House Bill 368 of 2008 established a Maryland Strategic Energy Investment Program and Fund.
51

The Maryland Renewable Energy Fund is repealed and compliance fees are maintained in the Strategic Energy Investment Fund to support renewable grants and loans. HB 1166 / Senate Bill 348 of 2008 removes poultry litter as a qualifying Tier 2 resource and including poultry litter-to-energy as a qualifying Tier 1 resource. Table VI.C.2. indicates the Tier 1 and Tier 2 REC requirements for years 2008 and 2009. RECs derived from a Tier 1 Solar resource may be applied toward an electricity supplier’s regular Tier 1 or Tier 2 RPS obligation, and regular Tier 1 RECs can be applied toward an electricity supplier’s Tier 2 RPS obligation.
Table VI.C.2: Updated RPS Percentage Requirements
Current RPS (for Year 2008) New RPS (Effective January 1, 2009) Year
Tier 1 Tier 1 Solar
Tier 2 Tier 1* Tier 1 Solar
Tier 2
2007 1.0% 0% 2.5% 1.0% 0% 2.5% 2008 2.005% 0.005% 2.5% 2.005% 0.005% 2.5% 2009 2.01% 0.01% 2.5% 2.01% 0.01% 2.5% 2010 3.025% 0.025% 2.5% 3.025% 0.025% 2.5% 2011 3.04% 0.04% 2.5% 5.0% 0.04% 2.5% 2012 4.06% 0.06% 2.5% 6.5% 0.06% 2.5% 2013 4.10% 0.1% 2.5% 8.2% 0.1% 2.5% 2014 5.15% 0.15% 2.5% 10.3% 0.15% 2.5% 2015 5.25% 0.25% 2.5% 10.5% 0.25% 2.5% 2016 6.35% 0.35% 2.5% 12.7% 0.35% 2.5% 2017 6.55% 0.55% 2.5% 13.1% 0.55% 2.5% 2018 7.90% 0.9% 2.5% 15.8% 0.9% 2.5% 2019 8.7% 1.2% 0% 17.4% 1.2% 0% 2020 9.0% 1.5% 0% 18.0% 1.5% 0% 2021 9.35% 1.85% 0% 18.7% 1.85% 0% 2022 9.5% 2.0% 0% 20.0% 2.0% 0% * Includes the mandatory Tier 1 Solar Requirement. Tier 1 Solar RECs are a sub-set of Tier 1 RECs.
In the next section, Table VI.D.1 provides the changes through 2022 made to the compliance fee to Maryland’s RPS.
D. Solar Power Requirements in Maryland During 2008, the Commission laid the foundation for an active solar market in Maryland. Regulations were enacted which established a small interconnection standard establishing a standard process for interconnection of solar facilities. Regulations were adopted establishing the mechanism for creating renewable energy credits, and tracking sites, and an on-line solar renewable energy credit application form was introduced to the Commission’s website. These initiatives have laid the groundwork for Maryland having an active solar market in the future as envisioned in solar legislation passed in 2007.
52
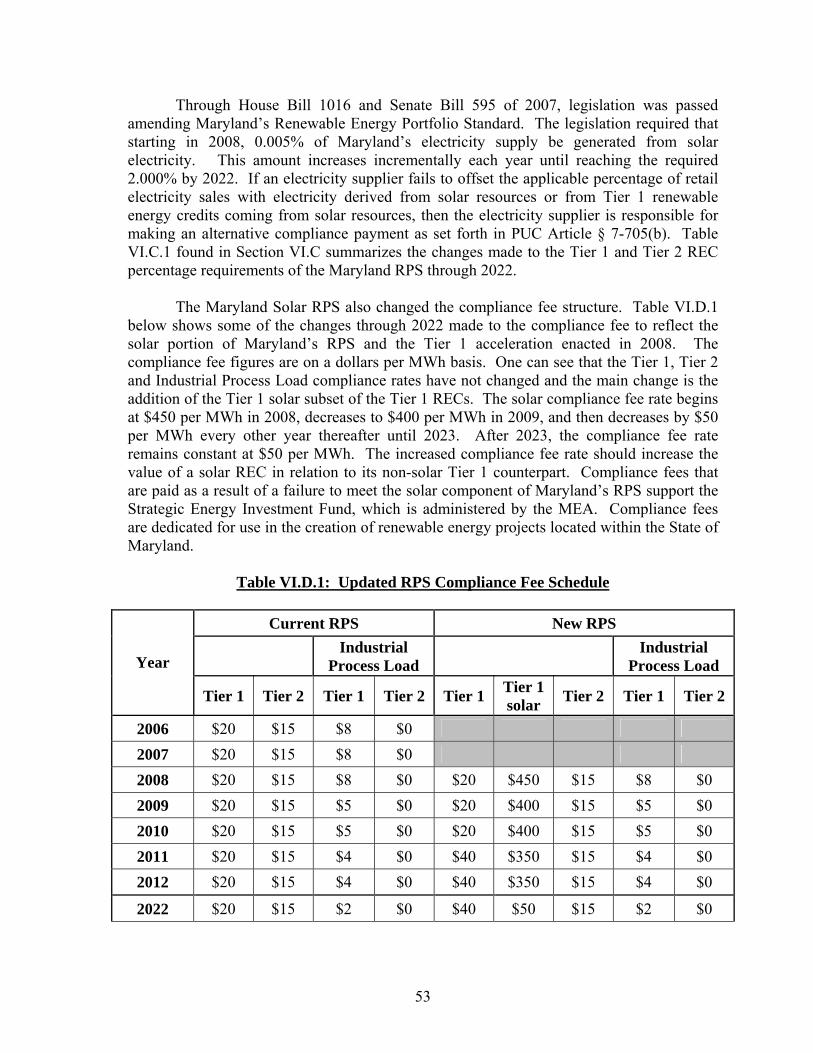
Through House Bill 1016 and Senate Bill 595 of 2007, legislation was passed amending Maryland’s Renewable Energy Portfolio Standard. The legislation required that starting in 2008, 0.005% of Maryland’s electricity supply be generated from solar electricity. This amount increases incrementally each year until reaching the required 2.000% by 2022. If an electricity supplier fails to offset the applicable percentage of retail electricity sales with electricity derived from solar resources or from Tier 1 renewable energy credits coming from solar resources, then the electricity supplier is responsible for making an alternative compliance payment as set forth in PUC Article § 7-705(b). Table VI.C.1 found in Section VI.C summarizes the changes made to the Tier 1 and Tier 2 REC percentage requirements of the Maryland RPS through 2022. The Maryland Solar RPS also changed the compliance fee structure. Table VI.D.1 below shows some of the changes through 2022 made to the compliance fee to reflect the solar portion of Maryland’s RPS and the Tier 1 acceleration enacted in 2008. The compliance fee figures are on a dollars per MWh basis. One can see that the Tier 1, Tier 2 and Industrial Process Load compliance rates have not changed and the main change is the addition of the Tier 1 solar subset of the Tier 1 RECs. The solar compliance fee rate begins at $450 per MWh in 2008, decreases to $400 per MWh in 2009, and then decreases by $50 per MWh every other year thereafter until 2023. After 2023, the compliance fee rate remains constant at $50 per MWh. The increased compliance fee rate should increase the value of a solar REC in relation to its non-solar Tier 1 counterpart. Compliance fees that are paid as a result of a failure to meet the solar component of Maryland’s RPS support the Strategic Energy Investment Fund, which is administered by the MEA. Compliance fees are dedicated for use in the creation of renewable energy projects located within the State of Maryland.
Table VI.D.1: Updated RPS Compliance Fee Schedule
Current RPS New RPS
Industrial Process Load Industrial
Process Load Year
Tier 1 Tier 2 Tier 1 Tier 2 Tier 1 Tier 1 solar Tier 2 Tier 1 Tier 2
2006 $20 $15 $8 $0 2007 $20 $15 $8 $0 2008 $20 $15 $8 $0 $20 $450 $15 $8 $0 2009 $20 $15 $5 $0 $20 $400 $15 $5 $0 2010 $20 $15 $5 $0 $20 $400 $15 $5 $0 2011 $20 $15 $4 $0 $40 $350 $15 $4 $0 2012 $20 $15 $4 $0 $40 $350 $15 $4 $0
2022 $20 $15 $2 $0 $40 $50 $15 $2 $0
53

The intent of Senate Bill 595 is, “[to] improve the State’s use of solar energy”34 by not only establishing Solar REC requirements, but also increasing the allowable size of customer generation. Senate Bill 595 also requires the purchase of Solar RECs via standard contracts and ensures customer rights to the Solar RECs produced by their facilities. The contract requirements vary by the rated capacity of a given solar installation. The Maryland Solar RPS requires contract terms to be a minimum of 15 years when the renewable energy credits are purchased by an electricity supplier directly from the solar electricity generator. For facilities that are greater than 10 kW in rated capacity, the stipulation associated with an electricity supplier purchasing RECs directly from a renewable on-site generator to meet the solar component of the Maryland RPS is that the contract terms for the RECs must be for no less than 15 years.35 This requirement does not apply to an electricity supplier that purchases RECs from a third party intermediary that can purchase and sell RECs without being subject to a minimum 15-year contact term.
An electricity company that purchases solar RECs directly from a solar renewable on-site facility that is less than 10 kW in rated capacity must do so through a contract that provides for an up-front lump sum payment for at least 15-years worth of RECs at a price that is determined by the Commission. The up-front purchase of RECs is intended to aid in financing the construction of this type of solar installation. The current proposed level of payment36 for the RECs is the net present value of the 15-years’ worth of RECs using 80% of the compliance fee schedule, with a discount rate that is equal to the Federal Secondary Credit Interest Rate. Unlike most Tier 1 and Tier 2 RECs that may originate from Commission-certified renewable energy facilities that are located in PJM and PJM adjacent states, the intent of the Maryland solar RPS is for Tier 1 solar RECs to originate from solar renewable energy facilities that are interconnected with the electricity distribution grid serving Maryland.
Tier 1 solar renewable energy facilities will have to be sited in Maryland by January 1, 2012. The changes made to PUC Article Title 7, Subtitle 7 by Senate Bill 595 call for electricity generated from a Tier 1 solar renewable source to be connected with the electric distribution grid that will be serving Maryland as of January 1, 2012 in order for the generation to be eligible for Maryland RECs. Prior to January 1, 2012, Tier 1 solar renewable energy facilities located in PJM are eligible to provide RECs eligible for the Maryland RPS only to the extent that offers for RECs derived from Tier 1 solar renewable energy facilities interconnected with the grid are not made to electricity suppliers sufficient to satisfy compliance with the Maryland RPS. A renewable energy facility has to apply for certification with the Commission to be designated as a Maryland renewable energy facility, prior to its being eligible to create Maryland-eligible RECs. By restricting the footprint and ease of sale of out-of-state Tier 1 solar RECs for compliance with the Maryland RPS, the value of the Tier 1 solar RECs coming from Maryland based Tier 1 solar REFs may increase.
34 Dept. of Legislative Services, Revised Fiscal And Policy Note, Senate Bill 595, May 7, 2007. 35 PUC Article § 7-709. 36 Maryland PSC Rulemaking No. 32.
54
E. Small Generator Interconnection During 2007 and into early 2008, PSC Staff led a Small Generator Interconnection Workshop to develop standards for how generators of various sizes would interconnect with distribution company networks. The workshop was a offshoot of Case No. 9060 which was established to comply with Interconnection Standards under Title VII, Subtitle E. Energy Policy Act of 2005 (16 USC § 2621). The outcome of the working group was a series of standards which enable an electricity customer to install and interconnect small generators to a local utility distribution network. The Commission then established Rule Making 31 to draft COMAR regulations and reach consensus with the Maryland electricity distribution companies. COMAR 20.50.09 is now complete and interconnections are happening at a brisk rate. The Working Group determined that in order to satisfy Section 1254 of the Energy Policy Act of 2005, it would adopt and incorporate the requirements of IEEE 1547 and UL Standard 1741 as the basis for the interconnection process. The Small Generator Working Group greatly simplified the small generator interconnection process in Maryland by standardizing four categories of review. The first three review categories provide for expedited review of an application in order to minimize the cost and time required to interconnect a small generator while allowing a utility to ensure that safety and reliability considerations are addressed. The expedited review procedures have limited the amount of time the electric distribution company can take to review an interconnection request based on timelines that are identical to those recently adopted by FERC for small generator interconnections. The four review categories are summarized briefly below:
Level 1 - 10kW Expedited Review . These systems are inverter based and must be tested to IEEE and UL standards by a nationally recognized test laboratory. Household photovoltaic systems are an example of the type of small generator system that is expected to qualify for Level 1 expedited review.
Level 2 - 10kW to 2 MW Expedited Review. These systems must use equipment
approved by a nationally recognized testing laboratory or must have been previously approved by an electric utility under a study process. Systems in this size range do not have to be inverter based and are expected to use a variety of technologies including photovoltaics, reciprocating engines, micro turbines, fuel cells, small wind generators and combined heat and power units. Level 2 procedures also provide for the interconnection of systems less than 50 kW to area networks.
Level 3 - 10kW to 10 MW Expedited Review. These systems qualify for
expedited review if they use special equipment to ensure they will not export power from the customer premises on to the electric distribution system.
55

The vast majority of small generators that qualify for review under this category are expected to be standby generator facilities that interconnect at distribution system voltages and operate in parallel for more than 100 milliseconds. Net metered small generators are not eligible for a Level 3 Review.
Level 4 - 2MW to 10 MW Study Process. Small generators that do not qualify for
expedited review or have not been accepted under an expedited review already conducted will be evaluated under the procedures spelled out in this category. Because the small generators reviewed in this category are expected to be larger and are expected to use application specific interconnection equipment, there needs to be a more in-depth evaluation of the potential impacts of the small generator on the electric distribution system. For this reason, reviews conducted under a Level 4 evaluation are expected to be more involved and are expected to take more time.
The group was successful at reaching consensus on a standard process as well as agreement on standard forms and documentation that would be used by interconnecting parties. The complete record of the Working Group work papers is available on the PSC web site.37
37 Maryland Public Service Commission, Small Generator Interconnections Working Group.
56
VII. ELECTRIC DISTRIBUTION RELIABILITY IN MARYLAND The Commission is charged with the supervision and regulation of public service companies to promote the adequate delivery of utility services in the State. Adequate, reliable delivery of electricity depends on a well-planned, maintained and operated distribution system. The Commission requires electric distribution companies to invest in appropriate measures to ensure that reliability of the distribution system in the State is maintained. COMAR requires that the largest electric distribution utilities file annual reports showing system reliability, based on nationally-recognized reliability indices. COMAR also requires that all electric distribution utilities have written Operation and Maintenance (O&M) procedures and keep sufficient records to show compliance with their O&M procedures. Commission Engineering Staff continue to review utility records related to O&M procedures to ensure electric utility compliance, monitor distribution system planning, and maintain involvement in a number of other issues related to distribution system reliability.
A. Electric Distribution Reliability Assurance One important way to assure reliability of the electric distribution system is to create and follow procedures for periodic inspection and maintenance of the system equipment. All electric companies serving Maryland have developed written Operation and Maintenance (O&M) procedures, pursuant to COMAR 20.50.02.04. The procedures list the specific inspection and maintenance tasks to be performed and the frequency with which the tasks are to be performed. The six largest electric utilities operating in Maryland are required to file written O&M procedures with the Commission and file annual updates if and when changes in procedures are made. While the procedures vary somewhat from utility to utility, there are many common practices, since the procedures are based on utility experience and accepted good practice within the industry. In substations, periodic attention is typically given to power transformers, various relays and circuit breakers used primarily for equipment protection, devices charged with controlling voltage such as capacitors and regulators, and banks of batteries that provide backup power for the substation. For distribution feeder lines, inspection and maintenance attention is typically focused on the electrical conductors in general, capacitors and other voltage regulators, re-closing circuit breakers (reclosers), electronic monitoring/control devices, vegetation management and support poles for overhead equipment. A recloser is a switch in a distribution circuit that is designed to turn power off and then on again, perhaps several times in short order. This switching sequence is designed to allow something such as an animal or tree branch causing a short circuit on the line to clear itself. Finally, if the short circuit is not cleared after this switching sequence, the recloser will “lock out”--turn the power off and leave it off in order to protect equipment and living things from abnormally
57
high electrical current in the line. This lock-out, of course, represents a service outage and service crews must then be dispatched to make corrections or repairs to restore service. Most electric utilities use infrared imaging technology in performing periodic inspections to identify substation and feeder line equipment that is operating at a temperature higher than the normal range for proper operation. The value in this procedure is that abnormally hot spots in electric conductors or equipment can often be detected and corrected long before they fail due to over heating. The electric distribution system is a large-scale array of electric circuits, and excessive heat is one of the greatest enemies of electric and electronic circuits. Other examples of reliability assurance activity performed by utilities include the ongoing replacement of aged overhead and underground conductor, injections of chemical formulas into existing underground cable to increase its life expectancy, capacitor bank installations for voltage integrity, utility pole maintenance/replacement, and vegetation management, including "danger" tree removals if the utility has permission to do so. As a fairly common term among utility foresters, a danger tree is generally defined as one that poses a heightened threat to the integrity and reliability of an overhead electric line due to its health, condition, surroundings, or other issues that may increase the probability that the tree will uproot, break and fall onto an overhead line, or that its branches will break and fall onto a line. Each utility is required by COMAR to keep sufficient records to give evidence of compliance with its O&M procedures. The Commission’s Engineering Division makes yearly inspection visits to the electric utilities to examine these records, in a continuing effort to assure distribution system reliability. For occasions when a utility fails to show compliance with its O&M procedures, the Engineering Division issues a letter of non-compliance, with expectations that the utility will take remedial actions, usually within 30 days. The activities and procedures discussed so far are designed to maintain distribution system reliability and reduce the numbers of service outages that occur. Service outages cannot be totally eliminated and so another category of reliability assurance is outage mitigation. The Commission's Engineering Division monitors electric utility actions and programs designed to mitigate outages once they occur. Increasingly, fuses, switches and reclosers are being added to distribution system feeder circuits to sectionalize them into smaller protective zones. As an example of the usefulness of this approach, consider a very simple feeder design that starts at the substation and ends two or three miles away, serving customers along the way. For illustrative purposes only, this simple feeder design has a recloser only at the substation, with no reclosers or fuses out along the feeder line. Action of that substation recloser, including the possibility of a lock out with a service outage, would affect every customer on the feeder, even if a disruption or an outage-causing event occurred at the end of a feeder, well downstream of most of the customers on the feeder. If fuses or another recloser are added to this feeder some distance from the substation, then
58

customers on the substation side of this installation would be spared an outage in the event of a short circuit near the end of the feeder. A decrease in the number of customers that are exposed to any given outage results in an overall decrease in the frequency of outages per customer served by the feeder and the system, an important reliability goal. In addition, average, accumulated outage duration per customer is also reduced over a given period, since there can be no outage time associated with an outage that does not occur. A recent refinement in the way reclosers are used in some areas is contributing to the effort to reduce the number of customers exposed to any given service outage. In years passed, reclosers installed on three-phase distribution feeders would typically act on all three phase lines at the same time, switching the power on and off to all phases, even if a problem or short circuit was occurring on only one of the phase lines. While not useful in all situations, utilities are installing more “triple-single” reclosers that are capable of acting on just one of the phases or all three, depending on programming or the situation at hand. Residential customers are typically connected to just one of the phase lines of a three-phase distribution circuit. Using this more selective type of recloser, electric service reliability is in general increased since, as an example, customers connected to the “B” or “C” phase lines of a circuit may not necessarily experience a disturbance or interruption of service due to a problem occurring only on the “A” phase line of the circuit. Automation of distribution feeder devices is increasing, with the potential to reduce both frequency and duration of sustained electric service outages. Much of the activity associated with reclosers is already automatic. However, many switches that are installed on or between feeders require manual operation. Some feeders have connections with other feeders through manually operated switches that are normally off (open), but can be closed so that one of the feeders may temporarily supply part or all of the other if it experiences an outage. To operate the manual switch to restore power takes time and a utility crew. If the operation of such a switch is automated, either with local electronic intelligence or through remote operation from the distribution system control or operations center, service outage time to some customers can be reduced. Substations are key elements in electric distribution systems. They house the transformers used to convert higher level transmission voltages into distribution-level voltages used on distribution circuits originating at the substations. In addition, they contain equipment to regulate distribution circuit voltages within an acceptable range and protective equipment such as circuit breakers. Most of the substations in Maryland now feature two-way electronic communications with the utilities’ headquarters or control center by way of a system generically referred to as SCADA, or Supervisory Control and Data Acquisition. Remote and speedy data acquisition by SCADA of substation operation information such as electrical loading on the various feeders, number of operations counts by reclosers or circuit breakers, and distribution system voltages allows for quick decisions related to system operation, with a positive affect on reliability. In addition, SCADA data can be used to intelligently administer a utility’s equipment maintenance program. Examples of supervisory control through SCADA as related to service reliability include the ability to
59
quickly and remotely reset a substation recloser that has locked out and remotely control voltage regulation equipment within the substation. For several years, the electric utilities have realized that a collaborative effort among members of the electric utility community can be very useful for assuring reliability when severe weather hits hard. As members of Mutual Assistance Groups, the utilities share restoration crew manpower and other resources when outages increase beyond normal levels. Such assistance serves to directly reduce outage duration, one common measure of reliability. In addition to crew sharing, the groups hold conference calls for storm preparation, storm damage assessment, and to discuss overall restoration resource availability. The four large investor-owned electric utilities operating in Maryland are members of the Mid-Atlantic Mutual Assistance group and the Southeastern Electrical Exchange. Another similar group, Maryland Utilities, includes municipal and cooperative electric utilities. These groups and others will continue to be important alliances in the years to come, as effective distribution outage management and storm restoration requires not only a community-wide effort but sometimes also a regional or national effort. Electric utilities serving 40,000 or more Maryland customers are required to file an Annual Reliability Report with the Commission. The reports contain measurements of reliability for the preceding calendar year of each utility distribution system in terms of both the frequency of outage occurrence and outage duration for the average customer served by the utility. Each investor-owned utility also reports the reliability measurements for a group of the least reliable electric feeders in its systems for the year, along with the remedial actions it has taken to improve the reliability of those feeders. The same feeders are not permitted to appear on a utility's least reliable list in any two successive years, a COMAR provision designed to gradually increase over time the reliability of all feeders in the least performing range. The large electric cooperatives report the operating district with the least reliability for the year, along with the remedial actions taken to improve reliability within those districts.
B. Distribution Reliability Issues The most widely-accepted electric distribution system reliability standards are the System Average Interruption Frequency Index (“SAIFI”) and the System Average Interruption Duration Index (“SAIDI”), providing a measure of service outage frequency and service outage duration, respectively. SAIFI is the System Average Interruption Frequency Index. As commonly used, the SAIFI is a number that represents the number of service outages the "average" customer of the system experiences during the course of a year. Similarly, the SAIDI, or System Average Interruption Duration Index, is a number that represents the total accumulated outage time during the course of a year that the average customer of the system experiences. The "system" as referenced by these indices typically consists of every customer served by a given electric utility, but the indices can also be calculated for other systems such as all the customers served by a particular
60

distribution system feeder. The SAIFI and SAIDI indices are the major reliability standards reported by the six largest electric distribution companies in Maryland in their Annual Reliability Report filings. It is impossible to achieve perfect service reliability in an electric distribution system. The SAIFI and SAIDI standards as they are commonly employed to monitor and assess that reliability are also not perfect. Although the standards provide a useful overview of electric utility service reliability, it is important to recognize the imperfections and limitations of the standards when considering reliability. One element of imperfection with the standards is related to the fact that they are averages for the system. Since they do represent averages, SAIFI and SAIDI statistics for an overall distribution system, or for a particular feeder as a system, usually do not and typically cannot reflect the reliability of any individual customer or small group of customers served by those systems. As an example using the SAIFI standard, an individual electric customer may experience no service outages one year, six the next, while the SAIFI for that customer's feeder may have been two outages for both years. Due to averaging, a similar scenario can occur with regard to a small group of customers served by the same feeder, and also can occur with regard to the SAIDI measurement. Electric utilities typically monitor and assess service reliability at the feeder level, or higher, at the overall system level. As noted, COMAR requires remedial action by the utility for the least reliable of its feeders, based generally on rankings using the SAIFI and SAIDI. Due to the complexities of the distribution system and the varied elements affecting its reliability, a utility cannot guarantee a particular level of reliability to customers. Further, the utility cannot provide a completely uniform level of reliability to all customers throughout its overall distribution system, or even to those throughout any given feeder. Attempts to provide an unusually high level of electric service reliability or to provide a completely uniform level of reliability have proven very expensive. Lastly, customers should not be surprised to learn that all the customers of a given utility or feeder cannot receive a level of electric service reliability that is at or above the average level achieved by those systems. A second, important imperfection with the SAIFI and SAIDI standards as they are utilized is related to the weather and the profound and unpredictable affect it can have on those standards for an overall distribution system or for a feeder. The Commission regulations related to the electric utility Annual Reliability Report filings require each of the six largest utilities to report two sets of SAIFI and SAIDI statistics for its overall system for the previous calendar year. One set includes all outage data, regardless of the cause of the outages, and is sometimes called the "all-weather" SAIFI and SAIDI. The other set excludes outage data collected during Major Storms38 so that this set is called the Major Storm Excluded (MSE) SAIFI and SAIDI. The MSE indices attempt to reflect the
38 A Major Storm is specifically defined in COMAR 20.50.01.03. The largest electric utilities are required
by COMAR 20.50.07.07 to file Major Storm Reports with the Commission, so that the period of time for which the associated outage data is excluded from the calculation of MSE reliability indices is known and archived.
61

"normal," day-to-day reliability of an overall distribution system or a feeder, and exclude the worst weather events for which all electric utilities struggle to defend against and mitigate. However, the MSE indices can be and often are influenced by numerous, lesser weather events not severe enough to qualify as Major Storms, so that the MSE reliability indices do not always perfectly reflect the normal, day-to-day reliability of a utility's overall system or a particular feeder. Historically, electric utilities have been expected to and do take measures to defend distribution facilities against the weather, and quickly act to restore service after, or often during, an outage-causing weather event. Still, the weather takes its toll on reliability and will continue to do so. Since the weather is variable and generally unpredictable throughout the various distribution system areas and from year to year, normal, day-to-day reliability as reflected by the MSE SAIFI and SAIDI can likewise vary somewhat from year to year and among the various utilities. Again, attempts to provide unusually high levels of electric service reliability, or to provide a completely uniform level of reliability, have proven very expensive. Such attempts, including placing electric distribution facilities underground, are very much more expensive than overhead distribution design and do not provide the consistent, heightened and entirely uniform levels of reliability that might be expected. As long as the noted imperfections and limitations of the SAIFI and SAIDI standards are taken into account, some general assessment of the trend in a given utility's reliability performance can be made, based on the MSE SAIFI and SAIDI that are reported by that utility over time. As noted, the six largest electric utilities serving Maryland file Annual Reliability Reports containing the MSE SAIFI and SAIDI measures. Among those utilities, three reported MSE SAIFI for 2007 for their overall system that is somewhat better than the five-year average value of that index for each utility, an average that includes 2007 data in addition to that for the previous four years. Two of the utilities reported MSE SAIFI for 2007 that is very slightly worse than the five-year average for each of those utilities. One utility reported MSE SAIFI for 2007 that is appreciably worse (an increase of about 0.4) than the five-year average of that index for that utility. In general, most of the largest Maryland electric distribution utilities are maintaining average service outage frequency for their overall systems at historical levels. The MSE SAIDI statistic as reported by the electric distribution utilities in their Annual Reliability Reports is closely related to the average total time it has taken the utility over the course of a year to restore service after outages. Perhaps the SAIDI is even more negatively influenced by stormy weather than is the SAIFI, since during storms more frequent outages need to be addressed by a finite number of restoration crews. In addition, the weather may delay, inhibit, or even preclude crew response to outages. That said, four of the six utilities reported MSE SAIDI for 2007 for their overall system that is better than their five-year average for that index. Two utilities reported overall system MSE SAIDI for 2007 that is worse than their five-year averages for that index. However, for one of those utilities, it is known that 2007 was a particularly troublesome year with regard to stormy weather that did not qualify as Major Storms. In general, most of the of the largest
62

Maryland electric distribution utilities are maintaining average yearly service outage duration for their overall systems at or better than historical levels. Although some rough comparison of reliability performance between the various electric utilities can be made, extreme caution must be exercised in making detailed comparisons between the utilities because, in addition to the noted limitations of the reliability indices, there are differences in electric utility service areas and the associated approach to system design and operation.
C. Managing Distribution Outages A very important tool developed in recent years for managing electric distribution system outages is the computerized Outage Management System (OMS). When an outage occurs, a fully developed OMS accepts information inputs from several sources, including customers and systems internal to the utility, and uses that information to help develop output information as to the location and type of equipment that needs attention in order to end the outage. This output information can then be used to generate work orders for repairs, or dispatch repair crews by way of a Mobile Dispatch System (MDS) using two-way radio communication. After repairs are made or other actions taken to end the outage, related outage information is entered as additional input to the OMS. The OMS then knows what customers were affected by the outage, usually what caused the outage, and when it started and ended. Typical information inputs to the OMS:
• Customer Information System (CIS): When a customer calls in an outage, the customer interacts with elements within the utility that have access to the CIS such as a Customer Service Representative, an automated Interactive Voice Response (IVR) unit or a High Volume Call Service (HVCS). The CIS contains the customer's address, can identify the distribution system transformer that serves the customer, and passes this information on to the OMS. The OMS then knows, with assistance from the next two listed inputs, the location of the customer, both in terms of electrical position in the system diagram and geographic position.
The traditional CIS function is being transformed as many utilities begin to implement elements of Advanced Metering Infrastructure (AMI). Advanced electric service meters, featuring two-way communications between customer and utility, provide an information channel that both parties can use to make important decisions related to the efficient supply and use of electricity. AMI also promises faster detection of and more accurate utility response to electric service outages, and promises to largely replace the role of outage detection provided by customer calls within the traditional CIS.
• Energy Management System (EMS): The EMS includes an electronic diagram of the electric system showing how elements are connected electrically. The EMS also
63

uses remote monitoring devices such as those of the SCADA system, so that information related to the operational condition of important, major pieces of electric system equipment can be passed on to the OMS.
• Geographic Information System (GIS): The GIS includes a map of key landmarks
such as streets, and it shows the location of important elements of the electric system relative to those landmarks. This relationship is clearly important in the effort to get repair crews to the heart of the matter. In addition to providing information to the OMS, both the EMS electric system diagram and the GIS map can be displayed on computer monitors and are used by dispatchers to direct the efforts of repair crews.
• Mobile Dispatch System (MDS) and Work Management System (WMS): After an
outage is cleared, a work order is closed out within the WMS, or in some cases the repair crew can directly close the outage with, and enter related information directly into, the OMS using the MDS. The WMS or MDS information usually includes the time of restoration and the cause of the outage. After this information input is made, the OMS then contains an archive of important information about the entire history of the outage.
Typical Information outputs from the OMS:
• Information about the type of equipment involved in the outage and its location is passed to the WMS or MDS so that crews can be effectively dispatched to clear the outage.
• Prior to the clearing of an outage, an Estimated Time of Restoration (ETR) and other information can be fed back to the CIS, so customers calling in who are affected by a particular ongoing outage may be kept informed.
• Information concerning outages can be extracted from the OMS in near real-time to feed Internet web-sites containing outage reports or outage maps.
• The OMS can be queried for outage information to be used to generate reports concerned with reliability statistics for the entire distribution system or any part thereof.
The four large investor-owned electric utilities operating in Maryland and the Choptank and SMECO electric cooperatives have implemented OMS, each with functionality developed generally to the extent described above. Improvements and efforts to increase the functionality of the OMS elements are ongoing. As with most computer and software-based systems, the OMS evolves with each new software upgrade, and as utilities learn how to best utilize the systems. The following are summaries of recent or planned activity by the largest electric utilities operating in Maryland to increase the utility of OMS.
64

1. Energy Management System
a. Allegheny AP plans to replace or significantly upgrade its EMS over the next three years, with upgraded hardware and software providing improved functionality and situational awareness of the functioning of the distribution system. Completion of the project is currently planned for early in 2011.
b. BGE At the electric distribution level, BGE plans to replace its current EMS communications computer processor to accommodate future SCADA expansion, to provide increased ability to monitor and control the distribution system. In addition to replacing existing communication hardware that may not be well supported by the manufacturer in the future, the new equipment will reportedly allow unlimited SCADA expansion.
c. Choptank Choptank currently uses power line carrier signals and cellular telephone technology to communicate with its energy management devices in the field from its Denton headquarters, but indicates that communication coverage is incomplete throughout its distribution system. The Cooperative is continuing a gradual migration toward implementing a fiber optic network communications scheme for energy management and other communications functions.
d. DPL and Pepco Pepco and DPL plan to implement a common EMS platform by years’ end 2010, with expected productivity and operations improvements due to use of a common system. The new system would interface with the separate electrical connectivity models of the two utilities.
e. SMECO As customers are added to the system, the electrical connectivity model is now receiving updates on a more frequent basis than in years passed. SMECO recently established a division within its engineering department dedicated to ensuring integrity of data used in support of its engineering and operations efforts. 2. Geographic Information System
a. Allegheny No current plans to make any major changes to its GIS within the next three years.
65
b. BGE
BGE refers to its existing system as the Geospatial Information System, and currently plans to enhance the system in 2010. The utility hopes to expand the use and functionality of the system to improve process standardization, increase integrity and currency of data about its system, reduce the potential for public safety incidents, and improve operational efficiency, among other things. BGE expects this enhancement initiative to continue for several years, with a goal of achieving better integration of the GIS with the OMS, CIS, work management system, mobile operations and its electric distribution system design operations.
c. Choptank In early 2007, Choptank completed a software upgrade of its GIS system and has started to interface GIS with its construction of new facilities to improve workflow and facilities design accuracy.
d. DPL and Pepco Pepco currently uses a GIS platform from ESRI, a GIS and mapping company originally founded as Environmental Systems Research Institute, Inc. Pepco completed an upgrade of its GIS to ESRI version 9.2 last year. DPL currently uses a system from General Electric, GE Smallworld, but also plans to implement ESRI version 9.2 by December of this year. Pepco Holdings Incorporated, the parent company of both utilities, expects efficiency and productivity gains through the use of one standardized system by both utilities.
e. SMECO SMECO completed an upgrade of its ArcFM to version 9.2 and now expects continued vendor support lasting several years. ArcFM is a product of ESRI. 3. Mobile Dispatch System
a. Allegheny AP does not utilize an MDS and currently has not plans to implement a system within the next few years. However, the utility continues with plans to install a related technology, Automated Vehicle Locating Devices (AVL) in each of the vehicles used by linemen, meter-reading personnel, supply chain personnel and meter technicians. Use of the devices will allow the utility’s crew dispatchers and management to track the location of company personnel. The utility expects to realize efficiency gains within the operations and management of each of those operational areas. AP plans to implement the devices in 2009 in the Maryland portion of its service territory.
66
b. BGE
BGE currently uses an MDS. In 2008, the utility completed an assessment of its current and future requirements for mobile technology, including mobile dispatch and other mobile computing applications. BGE hopes to develop remote computing capabilities to enable selected work management and business system applications available on desktop computers to be accessible in remote and field locations. The utility also hopes to expand mobile computing to all BGE and contractor field resources.
c. Choptank Choptank does not utilize an MDS and currently has not plans to implement a system.
d. DPL and Pepco DPL currently uses an MDS software platform called Ventyx Advantex. Late last year, the utility upgraded to Advantex r8.0. Pepco, currently using a different MDS platform than DPL, plans to convert to Advantex r8.0 by December of this year for use in responding to service outages and other trouble with the distribution system. By June of 2009, the utility currently plans to have the new platform in place for electric meter servicing work.
e. SMECO SMECO launched the first phase of its MDS in July 2007, with initial training of service crews and supervisors designated as the utility’s first response task force. For Meter Operations and Credit & Collections service orders, the new MDS was implemented in the first quarter of 2008. SMECO indicated that this implementation has enhanced the functionality of service technicians, metering crews and customer service field technicians, since the MDS directly interfaces with the Cooperative's customer care application. SMECO is currently further training personnel in use of the MDS and testing its functionality to assist with Construction Operations work orders, with plans to implement this phase of the new MDS in November of 2008. 4. Work Management System
a. Allegheny Allegheny uses a WMS; there are no current plans to make any major changes within the next three years.
67

b. BGE
The utility currently uses a computerized work management system. In June 2007 BGE established a team to develop standardized work and asset management processes. The team was also charged with consolidating existing work management applications and data into a single enterprise-wide process for all construction, maintenance and meter work. Detailed design and implementation of the new system began earlier this year. BGE indicated that this new WMS is a foundation to its overall work and asset management initiatives and over the next two years various work streams will be phased in to the system.
c. Choptank Choptank is currently implementing a new work management system with Itron, Inc., called the Interneer Intellect work management system. The system coordinates with the utility’s GIS mapping system and the iVue customer information system.
d. DPL and Pepco Both utilities use Logica WMIS (Work Management Information System), and expect to upgrade to Version 4.0 during 2009 to 2010. The utilities expect that the upgrade will take advantage of improved processes and functionality for the task of work management.
e. SMECO The Cooperative recently implemented a major update of its WMS software to WMIS version 2.10, with new functionality. The utility conducted study and analysis workshops to modify business processes and information flows to take advantage of the added functionality. 5. Outage Management Communications
a. Allegheny AP provides service outage information through its IVR unit, providing calling customers concerned about an outage with an extensive list of the probable causes of the outage. Other capabilities of the IVR include providing estimated times of restoration and call-backs to customers to confirm power restoration. The utility also communicates service outage information by way of a public website at http:www.alleghenypower.com/. Numbers of service outages can be viewed by state, county or city level, and an estimated time of restoration is also given on the website. The utility also maintains a separate website with more detailed outage information for State Regulatory, State Emergency Management and County 911/EMA personnel.
68

b. BGE
In 2008, BGE began plans to upgrade its existing Predictive Dialer System and the first phase of the upgrade is complete, providing increased call capacity. BGE will soon begin phase two of implementation to include two-way customer communication for notification and confirmation of service restoration after an outage. The system can also be used to notify customers of planned power outages. In 2008 BGE completed enhancements of its internet webpage for communicating current numbers of service outages that is accessed from its home page. The outage map on the website was provided with more detail, to show the number of customers without service in any given square-mile grid. During times when BGE is operating in “storm mode,” the outage page also shows the number of customers within each county who have been restored with power since the beginning of the weather event.
c. Choptank Approved for the 2009 Choptank budget is a new radio system for communications during normal service work and outage restoration activity.
d. DPL and Pepco Last year, both utilities updated their web-based outage and work location maps to a data refresh rate of every 10 minutes, up from every 30 minutes. By years' end 2008, each of the utilities plans to replace the two, separate maps with one webpage for each utility that shows both current outage and work crew locations.
e. SMECO SMECO’s web-based service outage map is updated automatically from its OMS at ten-minute intervals and can be accessed from http://www.smeco.coop. Press releases issued by the Cooperative are included on the site.
D. Distribution Planning Process The role of an electric distribution system planner begins with identification of customer needs, both for the near term and for the future. Once identified, those needs are translated into a flexible plan involving the engineering and operations functions necessary to meet those needs. Short term planning typically focuses on system expansion to keep pace with electric load growth and maintenance or improvements related to reliability of the system, with a forecast horizon of a few years. Longer term planning, with a forecast horizon of perhaps 10 to 20 years, may include expectations of new technologies and
69

altered business climate, in addition to looking out for expanded load growth and the reliability of the system. A sampling of the largest electric distribution system projects and programs, ongoing, planned or in development by Maryland's large electric companies, follows. 1. Allegheny
• To serve the Clarksburg Development near Clarksburg, AP is completing an extension of primary under ground cable and associated construction/equipment installation in 2008.
• In 2009, AP plans to complete construction of a new substation to serve new
development near the former Ft. Ritchie U.S. Army base. • In 2010, AP expects to complete construction of a substation to serve the town of
Urbana and surrounding area. AP also expects to complete construction in 2010 of two other substations to serve the areas of Lappans Crossroads and Keedysville.
• Substation capacity upgrades to serve the west and southwest areas of Frederick and
the area south of Mr. Airy are currently planned for completion in 2011. • AP currently plans to complete construction in 2013 of a new substation to serve the
town of Emmitsburg and the surrounding area.
2. BGE
• Scheduled for completion in 2009, BGE plans new substations to serve northwestern Baltimore City, business parks along the Route 43 extension in White Marsh, and Baltimore City's Westside and Business District. Increased capacity is planned in 2009 for existing substations that serve northeastern Prince George's County and northern Calvert County. Various locations in the BGE electric distribution system are expected to receive new distribution equipment with new technology designed to increase service reliability in 2009.
• BGE plans to complete construction of a new substation to serve Fort Meade and the
surrounding area in western Anne Arundel County in 2010. A capacity upgrade is planned for an existing substation serving Annapolis and eastern Anne Arundel County in 2010.
• In 2011, BGE plans to complete construction of two new distribution substations,
one to serve an area in Harford County and one to supply a new business park at Aberdeen Proving Ground. The utility intends to rebuild an existing substation to provide increased capacity to serve northern Baltimore City and the adjacent area in Baltimore County in 2011.
70

• BGE currently expects to complete the construction of three new substations in 2012. The stations are to serve an area near Laurel, the Fallston area, and the Carroll/Calverton area of Baltimore City.
• In 2013, BGE currently plans to complete construction on a new substation to serve
the area of northeastern Baltimore City. 3. Choptank
• Choptank expects to complete a capacity upgrade to a substation near Easton that serves its St. Michaels District by years' end 2008.
• Choptank has plans to construct a new substation near Galena in Kent County to
accommodate load growth along the Route 301 corridor. It is expected to be in service by December 2009.
• In 2010, Choptank expects to complete construction of a substation near Hebron in
Wicomico County to serve load growth on the southwest side of Salisbury. • A new substation to serve the Cambridge area is now planned for 2011. Currently,
most of Choptank's electrical load in Dorchester County is supplied by one substation, one delivery point connected to transmission lines. The addition of the new substation would create a backup delivery point, in addition to providing increased capacity.
4. Delmarva
• In 2010, Delmarva expects to complete a capacity upgrade of the Jacktown substation in the Salisbury area to relieve heavy load on other nearby substations. The project would also involve extending one 12-kilovolt distribution feeder line. The utility also expects in 2010 to complete construction of a new substation, with one 12-kilovolt feeder extension, to serve the southern Talbot County area.
• A substation capacity upgrade along with the extension of one 25 kilovolt feeder is
planned for completion in 2011 to serve the Bishop area. Two feeders serving the Cambridge area are currently scheduled to receive new overhead electric conductor cable in 2011, to increase their capacity and maintain reliable service.
• Delmarva currently plans to complete the construction of two new substations in
2012. One station would serve southwestern Kent County. The project would include the extension of two 25-kilovolt feeders. Another new substation construction project would benefit the Queenstown area and include the extension of one 25 kilo-volt feeder.
• For Cecil County, Delmarva currently plans to complete the construction of a new
substation and extend three 34-kilovolt feeders in 2013.
71

• In 2015, Delmarva currently expects to complete capacity upgrades to two
substations, in the Massey area and in the Centreville area. The utility also plans to complete construction of a new substation and extend one 34 kilo-volt feeder in 2015 to serve western Harford County.
• Delmarva's current plans for 2016 include completion of a substation capacity
upgrade and the extension of two feeders to serve the eastern Cambridge area. 5. Pepco
• Pepco completed a capacity upgrade of a substation and the extension of two 13-kilovolt feeders that serve the Largo, Crain Highway and Oak Grove areas of Prince Georges County in 2008.
• In 2009, Pepco plans to complete a capacity upgrade of a substation serving the
Gaithersburg, Hunting Hill and Shady Grove areas of Montgomery County. • By the close of 2010, Pepco plans to complete construction of a new feeder and the
extension of another to meet the electricity needs of the National Harbor Development and the Gaylord National Hotel and Conference Center. Plans for 2010 also include upgrading a supply feeder serving the Sligo area of Montgomery County.
• A new substation is planned for construction in 2012 to serve the Beltsville area of
Prince Georges County. A capacity upgrade to Pepco’s Colesville substation is planned for 2012 to serve the Colesville, Rossmoor and Fairland areas of Montgomery County. Current plans for 2012 also call for a voltage upgrade for the supply to the Sligo substation.
• Pepco currently plans to complete three new substations in 2013. One substation,
along with six new feeders, would serve the Westphalia Town Center, Melwood and Forrestville areas. Another substation and six new feeders would supply the National Bureau of Standards as well as the Hunting Hill and Shady Grove areas. The third substation and five of its feeders would serve the Fernwood Road area. Current plans for 2013 also call for a capacity upgrade of a substation serving the Colesville, Roosmoor and Fairland areas of Montgomery County
• To accommodate the projected demand for electricity in the Beltsville area, Pepco’s
current plans include the construction of a new substation in 2014. The utility currently plans to increase the capacity of the another substation in 2014, to meet the electricity demand of the Bureau of Standards, Hunting Hill and Shady Grove areas.
72

6. SMECO
• Current projects scheduled for completion before years' end include one new substation with its three feeders to serve the Rt. 210 corridor in southern Prince Georges and Charles Counties. SMECO also expects to complete the construction of three new feeders to serve southern Calvert County, the Rt. 245 corridor and Buck Hewitt Road, both in St. Mary's County, in 2008.
• SMECO plans to complete a capacity upgrade of a substation serving the Waldorf
and St. Charles areas in 2009. The utility also plans to complete the construction of six new feeders in 2009 to serve Route 5, Pegg Road and Patuxent Boulevard in St. Mary's County; Vivian Adams Drive and Saint Charles Parkway in Charles County; and H.G. Trueman Road in Calvert County.
• By early in 2010, SMECO expects to complete construction of a new substation
with three new feeders to serve the Huntington area of Calvert County, according to current plans. The Cooperative also currently plans to finish a capacity upgrade to a substation serving the Waldorf and St. Charles areas in 2010.
73

VIII. MARYLAND ELECTRICITY MARKETS The Electric Customer Choice and Competition Act of 1999 established the legal framework for the restructuring and revised regulation of the electric industry in Maryland. The Electric Act altered the Commission’s role relative to electricity generation and provided that retail electric choice would be available to all customers. Beginning on July 1, 2000, all retail electric customers of IOUs in the State were given the opportunity to choose their electricity supplier. As of July 1, 2003, customers of Maryland’s electric cooperatives have had the right to choose suppliers under a separate schedule adopted by the Commission. Customers of Maryland’s municipal electric utilities will be allowed to choose suppliers on a timetable established in part by the municipal utilities.
A. Status of Retail Electric Choice in Maryland Customers shopping for electricity in Maryland may choose to buy electricity from a competitive supplier or take standard offer service (SOS) from their local electric company. SOS is a utility-supplied service for customers that are unable to or decide not to purchase electricity supplies for a competitive provider. This framework was established by the Electric Customer Choice and Competition Act of 1999. While “customer choice” was introduced for retail supply services, restructuring simultaneously mandated a rate reduction and a cap on the reduced SOS rates. All rate cap reductions have now expired for SOS; in general, the longest rate reductions were provided for residential customers. The residential SOS rates were frozen through 2005 (Pepco and Delmarva Power), 2006 (BGE), and 2008 (Allegheny); non-residential SOS rates remained fixed through mid-2002 for BGE’s large commercial and industrial customers and through mid- or late 2004 for the remaining non-residential customers. The modest level of residential and small commercial shopping may reflect the fact that competitive suppliers have not been able to offer large savings when compared with historically capped and fixed SOS rates provided by the electric utilities. With the expiration of rate caps, the PSC has established a new method of providing utility-supplied SOS service to retail customers based on market rates.
Opening retail markets for competition has attracted competitive suppliers to Maryland. As of December 31, 2008, there are 79 companies licensed to supply electricity services in Maryland. Of the 79 suppliers, 47 are permitted to take title to the electricity that is sold and 32 are only permitted to supply broker services.39 The Commission’s monthly enrollment reports indicate that the shift in load to suppliers has primarily occurred with Commercial and Industrial customers. (See Table VIII.A.1) The total statewide number of distribution service accounts eligible for electric choice, as of October 2008, was 2,203,222 of which 1,971,426 were residential and 231,796 were non-residential. Electric choice has been most successful for large commercial
39 As of December 31, 2008; 100 companies are licensed to supply electricity or natural gas services in
Maryland. Of the 100 licensed companies, 79 companies are licensed to provide electricity supply services or electricity broker services and 51 companies are licensed to provide natural gas services or natural gas broker services. Many companies provide both electricity and natural gas services.
74

compared with residential and smaller non-residential markets in Maryland, as demonstrated by the most recent choice enrollment report. While only 5.1% of total utility distribution customers take service from a competitive energy supplier, 87% of large commercial and industrial customers, have switched. Of the roughly 2.2 million electricity accounts statewide, there were 112,822 customers served by competitive electric suppliers and of those, 57,158 were residential, 30,081 were small C&I, 24,287 were mid-sized C&I, and 1,296 were large C&I customers. Pepco continues to experience the highest degree of supplier participation on a percentage basis with 27,591 (5.8%) residential accounts and 15,826 (31.5%) C&I accounts served by suppliers. Between December 2005 and October 2008, the total number of customers statewide served by electricity suppliers increased from 39,527 to 112,822 customers. The increase, while significant, was principally the result of higher BGE SOS rates. The number of customers served by electricity suppliers in BGE’s service territory increased from 3,932 (October 2005) to 56,683 (October 2008).
Table VIII.A.1: Electric Choice Enrollment in Maryland
Number of Customers Served by Competitive Electricity Suppliers
Utilities Residential Small C&I40
Mid C&I41 Large C&I42 All C&I Total
AP 27 3,563 2,445 108 6,116 6,143 BG&E 28,408 15,366 12,294 615 28,275 56,683
Delmarva 1,132 3,346 2,015 86 5,447 6,579 Pepco 27,591 7,806 7,533 487 15,826 43,417 Total 57,158 30,081 24,287 1,296 55,664 112,822
Percentage of Peak Load Obligation Served by Competitive Electricity Suppliers
Utilities Residential Small C&I Mid C&I Large C&I All C&I Total AP 0.0% 18.5% 55.9% 84.4% 63.7% 29.7%
BG&E 2.7% 18.2% 63.4% 95.8% 72.4% 38.6% Delmarva 0.8% 22.5% 60.8% 95.0% 64.0% 30.8%
Pepco 6.9% 25.4% 65.5% 94.2% 74.2% 42.7% Total 3.3% 20.3% 63.1% 94.2% 71.5% 38.2%
Source: Public Service Commission of Maryland, Electric Choice Enrollment Monthly Report, Month Ending October 2008. The Electric Choice Enrollment Report is updated monthly and can be obtained at the following website: http://www.psc.state.md.us/psc/home.htm.
40 Small C&I customers are commercial or industrial customers with demands less than or equal to 25 kW.
These customers are eligible for "Type I" fixed price utility SOS if they do not switch to a supplier. 41 Mid-sized C&I customers are commercial or industrial customers with demands greater than 25kW, the
level for small C&I service (Type I SOS) but less than 600 kW. These customers are eligible for "Type II" fixed price utility SOS if they do not switch to a supplier. See discussion of Case Nos. 9037 and 9056 to see more information on the Type II customer class.
42 Large C&I customers are commercial or industrial customers with demands equal to or greater than 600 kW. These customers are no longer eligible for “Type III” SOS and receive hourly priced service (based on PJM hourly LMP) if they do not switch to a supplier.
75

The overall demand in peak load obligation served by all electric suppliers at the end of October 2008 was approximately 5,038 MW, of which about 215 MW were residential and 4,823 MW were non-residential. BGE had the highest peak load obligation served by suppliers at approximately 2,794 (38.6%) MW. The total statewide peak load obligation available for choice was 13,186 MW of which 6,439 MW were residential and 6,747 MW were non-residential. Statewide, at the end of October 2008, electric suppliers served 3.3% of eligible residential peak load and 71.5% of eligible non-residential peak load obligation.
B. Standard Offer Service Standard Offer Service is electricity supply service sold by electric utility companies to any customer who does not choose a competitive supplier. The electric companies provide the service by purchasing wholesale power contracts, typically of 2-year lengths, through sealed bid procurements. Since the end of residential price freeze service in July 2004, SOS rates have experienced price increases such that average total annual residential electricity expenses have increased on the order of 80% over pre-restructuring rates for the year beginning June 2008.43 During the 2007 session, the General Assembly passed Senate Bill 40044, legislation that modified some portions of Section 7-510 of the PUC Article to require wholesale power procurements which were “designed to obtain the best price for residential and small commercial customers in light of prevailing market conditions at the time of the procurement and the need to protect these customers against excessive price increases.”45
On August 16, 2007, the Commission docketed Case No. 9117, In the Matter of the Commission’s Investigation of Investor-Owned Electric Companies’ Standard Offer Service for Residential and Small Commercial Customers in Maryland to consider other approaches to supply SOS in a competitive process under this standard. In particular, the Commission directed parties to present testimony that would compare the actively managed portfolio approach of SMECO to the RFP process used by the major IOUs. Additionally, the Commission wanted to consider a Direct Energy Services, LLC proposal to serve Electric Universal Service Program participants on an aggregated basis. On September 25, 2007, the Commission initiated Phase II of the case to consider proposals for procedures to be used to solicit bids for cost-effective energy efficiency and conservation programs and services and to obtain comment on the option of directing electric companies to build, acquire or lease peak-load or other generating plants to avert a potential reliability problem in Maryland. Initial and reply testimony was filed in September 2007 for Phase I and in October 2007 for Phase II. Hearings for both phases were held during October and November 2007. The Commission issued Order No. 82105 on July 3rd, 2008 directing each utility to file an evaluation of procurement plans using contracts of 10-15 years in length. The utilities were directed to file by October 1, 2008. Parties to the Case were filed comments in reply to those plans by December 5th, 2008. The Commission held hearings in mid-December 2008 to consider the plans and comments. 43 Case 9064 Commission Staff Report on SOS, dated June 12, 2008, page 16. 44 Chapter 549, 2007 Maryland Laws. 45 PUC Article § 7-510(c)(4)(ii).
76
On November 14, 2003, the Commission docketed Case Nos. 8985 and 8987 in order to address the SOS procurement issue for SMECO and Choptank, respectively. On September 29, 2004, the Commission issued Order No. 79503 in Case No. 8985 to address SOS for SMECO during the 2005 to 2008 period. The Order permits SMECO to procure power for its SOS service on the wholesale market using a managed portfolio approach for the 2005 through May 31, 2008 period. The Commission subsequently approved extension of the use of SMECO’s portfolio through May 31, 2010 in Order 80839.46 On April 25, 2005, the Commission issued Order No. 79922 in Case No. 8987 to address SOS for Choptank. In this Order, the Commission adopted a settlement regarding continued provision of SOS by Choptank, including continued procurement of full-requirements wholesale service through the Old Dominion Electric Cooperative and a modification of its power cost adjustment mechanism. The original time period during which Choptank will provide SOS was extended by five years, beginning on July 1, 2005, and ending on June 30, 2015.
46 Issued July 14th, 2007.
77

IX. PJM AND REGIONAL ENERGY ISSUES AND EVENTS Recently there have been questions raised with respect to the high costs of wholesale energy costs and whether such costs are truly representative of a “competitive” market. New market approaches, including the Reliability Pricing Model, designed to incent new capacity installations and marginal losses, designed to reflect the locational aspect of transmission losses and to enhance the current economic dispatch approach, have been initiated in market operations. While there are still questions on the success of these efforts, the economic impact of higher capacity prices has been seen in recent wholesale energy bids.
A. Overview of PJM, OPSI, and Reliability First Before discussing major regional issues, it would be useful to begin with an overview of several organizations that play a critical role in the functioning and reliability of the regional wholesale markets. PJM is the RTO that encompasses all of Maryland and to which all of the State’s electric companies belong; OPSI is a recently-formed organization to which the state regulatory bodies of PJM belong; and Reliability First is the reliability organization that includes all of Maryland and almost the entire footprint of PJM. 1. PJM Interconnection, LLC Maryland resides in a portion of a regional electric grid that is operated by PJM. PJM is the largest power grid in North America and also operates the world’s largest competitive wholesale electricity market. PJM was first established as a power pool in 1927 as an association of utilities in Pennsylvania, New Jersey, and Maryland. On March 31, 1997, PJM became an independent entity and, with its own Board of Governors, was renamed PJM Interconnection, LLC. On January 1, 1998, PJM became the first operational independent system operator in the United States and became responsible for the safe and reliable operation of the transmission system in addition to the administration of the competitive wholesale electric power market. Market participants can buy and sell energy, schedule bilateral transactions, and reserve transmission service. In December 2002, FERC awarded PJM full Regional Transmission Organization status. PJM now operates a centrally dispatched competitive wholesale electricity market with more than 450 market buyers, sellers and traders of electricity in region that is comprised of more than 51 million people. The PJM footprint includes all or parts of 14 political jurisdictions including Delaware, Illinois, Indiana, Kentucky, Maryland, Michigan, New Jersey, North Carolina, Ohio, Pennsylvania, Tennessee, Virginia, West Virginia and the District of Columbia. Currently PJM’s electricity market has a generating capacity of about 165,000 MW, 2008 summer peak demand of nearly 138,000 MW, and about 56,250 miles of transmission lines.47 The winter peak load for the 2007-2008 season was about 113,600 MW. PJM projects a 1.5% annual growth rate in summer peak load in the Mid-Atlantic region. The Mid-Atlantic region has continued to experience spikes in locational marginal prices, due either to congestion of the grid or lack of sufficient economical 47 Source: PJM http://www.pjm.com/about/territory-served.html.
78

resources. PJM has at times indicated the possibility of future deliverability problems for central Maryland – a condition that could lead to load shedding and which may be resolved with more generation or transmission.
Map IX.A.1: PJM Zones
Over the last several years the PJM footprint (see Map IX.A.1 above) has expanded dramatically, more than doubling in size as measured by capacity and peak demand. The expansion has been to the west and to the south, so that the PJM footprint includes nearly all of Virginia, eastern North Carolina, and nearly all of northern Illinois inclusive of Chicago. 2. Organization of PJM States, Inc. On May 13, 2005, the Organization of PJM States, Inc., of which the Maryland PSC is a member, was formed. OPSI is a non-profit, 501(c)(4) Delaware corporation. OPSI’s members include all fourteen state regulatory commissions (inclusive of the District of Columbia Public Service Commission) within the PJM footprint. OPSI provides a means for the PJM states to act in concert with one another when it is deemed to be in the common interest of their consumers. According to its articles of incorporation, OPSI will undertake such activities as data collection and dissemination, market monitoring, issue analysis, policy formation, advice and consultation, decision-making and advocacy related to:
• PJM operations; • The electric generation and transmission system serving the PJM States; • FERC matters; and, • The jurisdiction and role of the PJM States to regulate and promote the electric
utilities and systems within their respective boundaries.
Each state commission has a member on the OPSI Board of Directors. Chairman Nazarian of the Commission assumed the OPSI Presidency in 2009. The OPSI executive
79

committee consisting of the president, vice-president, secretary, and treasurer, in conjunction with the Board of Directors sets general policy direction. The Maryland Commission has been an active participant in OPSI and was represented on its executive committee at its inception. Other significant information concerning OPSI is that it is a voluntary organization, addresses regional issues directly related to PJM, and OPSI positions do not bind individual commissions and are not official actions of any member state. The fourteen members are grouped into the following three regions:
• Mid-Atlantic: Delaware, District of Columbia, Maryland, New Jersey, Pennsylvania • West: Illinois, Indiana, Michigan, Ohio, West Virginia • South: Kentucky, North Carolina, Tennessee, Virginia
3. Reliability First Corporation Beginning January 1, 2006, Reliability First Corporation sets reliability standards for PJM, excepting the portions of Virginia and North Carolina in PJM. The SERC Reliability Corporation48 sets reliability standards for those two states and the rest of the Southeast and part of the Midwest. The purpose of these corporations is to ensure the reliability and security of the bulk electric supply systems of the regions through coordinated operations and planning of their generation and transmission facilities. RFC and SERC have oversight over transmission facilities at a voltage level of 230 kV and above within their respective service territories. Reliability First Corporation is the successor organization for areas from three former NERC Regional Reliability Councils: the Mid-Atlantic Area Council, the East Central Area Coordination Agreement, and the Mid-American Interconnected Network organizations. RFC’s primary responsibilities involve monitoring compliance with reliability standards for all owners, operators and users of the bulk electric power system within the region. RFC membership currently consists of 43 regular members and 19 associate members. RFC serves more than 72 million people in an area covering all of the states of Delaware, Indiana, Maryland, Ohio, Pennsylvania, New Jersey, and West Virginia, plus the District of Columbia; and portions of Illinois, Kentucky, Michigan, Tennessee, Virginia, and Wisconsin.
B. PJM Summer Peak Events of 2007 and 2008 Peak demand is a term that is often used to describe a sustained period where it is anticipated that electricity will be required at a significantly higher than average level. Fluctuations in peak demand may occur on various cycles and in this section we will examine peak demand events that occur within a given year. The actual point of peak demand is an hourly period that is representative of the highest point of electricity consumption by the customers.
Utilities plan and build for peak demand in an effort to maintain reliability and the total generation capacity of a grid is scaled to be commensurate with the total peak demand 48 http://www.serc1.org/Application/HomePageView.aspx.
80

with a built-in reserve margin. The margin of error allows for a surge capacity and allows for unforeseen events. Grid operators will usually plan to use the least expensive generating capacity to meet demand and utilize an economic dispatch order in an effort to mitigate the marginal cost of electricity. Like peak demand, the coincident peak is the load or draw on a system that occurs at the hour of the highest load in a given period. PJM publishes coincident peak information49 referred to as 5CP. This is done to assist EDCs in calculating their peak load contributions each summer. Each summer the hourly metered load and load drop estimate data is accumulated for the period spanning June 1 to September 30. The RTO unrestricted loads are then created by adding the load drop estimates to the metered load. After this, the five highest unrestricted daily peaks are identified.
Table IX.B.1: Summer 2007 and Summer 2008 Coincident Peaks and Zone LMP
Summer 2007 Coincident Peaks Zone LMP During the Peak Day Date Hour MW AP BGE DPL PEPCO PJM
Wednesday 8/8/2007 17:00 141,049 $471.48 $1,045.53 $1,031.27 $1,030.20 $675.06 Tuesday 8/7/2007 17:00 134,674 $150.84 $165.10 $150.76 $168.82 $148.52 Monday 7/9/2007 17:00 134,632 $199.62 $174.83 $166.95 $179.42 $142.12 Thursday 8/2/2007 17:00 134,104 $135.96 $140.31 $138.32 $142.07 $143.72
Wednesday 6/27/2007 16:00 131,347 $145.43 $142.37 $126.26 $171.44 $126.12 Summer 2008 Coincident Peaks Zone LMP During the Peak
Day Date Hour MW AP BGE DPL PEPCO PJM
Monday 6/9/2008 17:00 130,792 $258.79 $348.69 $311.69 $358.30 $265.17 Thursday 7/17/2008 17:00 129,790 $160.08 $231.82 $205.24 $239.30 $182.98
Friday 7/18/2008 17:00 129,429 $205.42 $274.84 $230.30 $251.63 $197.57 Monday 7/21/2008 17:00 128,813 $196.60 $212.53 $251.69 $211.89 $199.41 Tuesday 6/10/2008 16:00 128,598 $253.81 $544.55 $482.18 $522.57 $335.04 Over the course of 2008, PJM had summer peak events that were lower than events that occurred in 2007. Table IX.B.1 above shows the summer 2007 and 2008 coincident peaks and the average real time LMP by zone during that time period. The summer 2007 coincident peak occurred on August 8, 2007 at 5:00 PM Eastern Daylight Time. This peak was 141,04950 MW of total load within the PJM region. The summer 2008 peak was 130,79251 MW and occurred on June 9, 2008 at 5:00 PM Eastern Daylight Time.
49 Additional information regarding this process can be found in PJM Manual 19 Load Forecasting and
Analysis. 50 Source: http://www.pjm.com/planning/res-adequacy/downloads/summer-07-peaks-and-5cps.pdf. 51 Source: http://www.pjm.com/planning/res-adequacy/downloads/summer-2008-peaks-and-5cps.pdf
81

The coincident peaks that occurred in the summers of 2007 and 2008 resulted in elevated LMPs in the Maryland zones. Generally the LMP levels for the BGE, Delmarva, Pepco, and Allegheny zones were at or higher than for PJM as a whole.
The maximum peak load experienced in PJM occurred on August 2, 2007 with a peak load of approximately 144,644 MW. PJM was able to meet this peak load with economic generation and load management in the mid-Atlantic region. PJM did not have to load maximum emergency generation nor did PJM require a voltage reduction. Overall, generation and transmission upgrades implemented have been beneficial to Maryland and other portions of eastern PJM. Summer peak events still occur and drive congestion throughout PJM. More transmission upgrades or new electricity generation in eastern PJM will need to be introduced in order to meet the growing load demand in the areas that require electricity imports. The electricity grid is designed to handle peak loads. During average load periods, Southwest MAAC experiences higher LMP levels than surrounding zones and this trend carries over during peak load situations, despite an apparent moderation of the overall LMP pricing levels from 2007 to 2008, during the coincident peaks within the PJM system.
C. Electricity Imports and Exports within PJM States that consume more electricity than they generate are classified as net importers of electricity. As mentioned earlier in this report, Maryland is a large importer of electricity. The 2007 Maryland energy profile shows that the state imports almost 30% of the electricity that it consumes. Table IX.C.1 below shows the net imports for Maryland over the five-year period from 2003-2007, a time period in which net imports have averaged nearly 30% per year. Please note that it is not possible to determine the actual levels of imports into and exports out of Maryland, but it is possible to impute an annual net imports figure adjusted for transmission losses.
Table IX.C.1: Maryland Electricity Net Imports, 2002-2006 Year 2003 2004 2005 2006 2007 5-Yr Avg.Sales + T&D Losses 76,959 72,273 73,835 68,227 70,473 72,353 Generation 52,244 52,053 52,662 48,957 49,968 51,177 Net Imports 24,715 20,190 21,173 19,270 20,505 21,171 Net Import Pct. 32.11% 27.95% 26.68% 28.24% 29.10% 28.82% Source: EIA. All figures in GWh. T&D Losses are assumed to be 8.0% Many other northeastern PJM states are also net importers of electricity. D.C., for example, imports over 99% of its total consumption. D.C., therefore, is for practical purposes completely reliant on electricity exports from other PJM states to satisfy its electricity demand and is an extreme example of a net importing jurisdiction. Several other
82
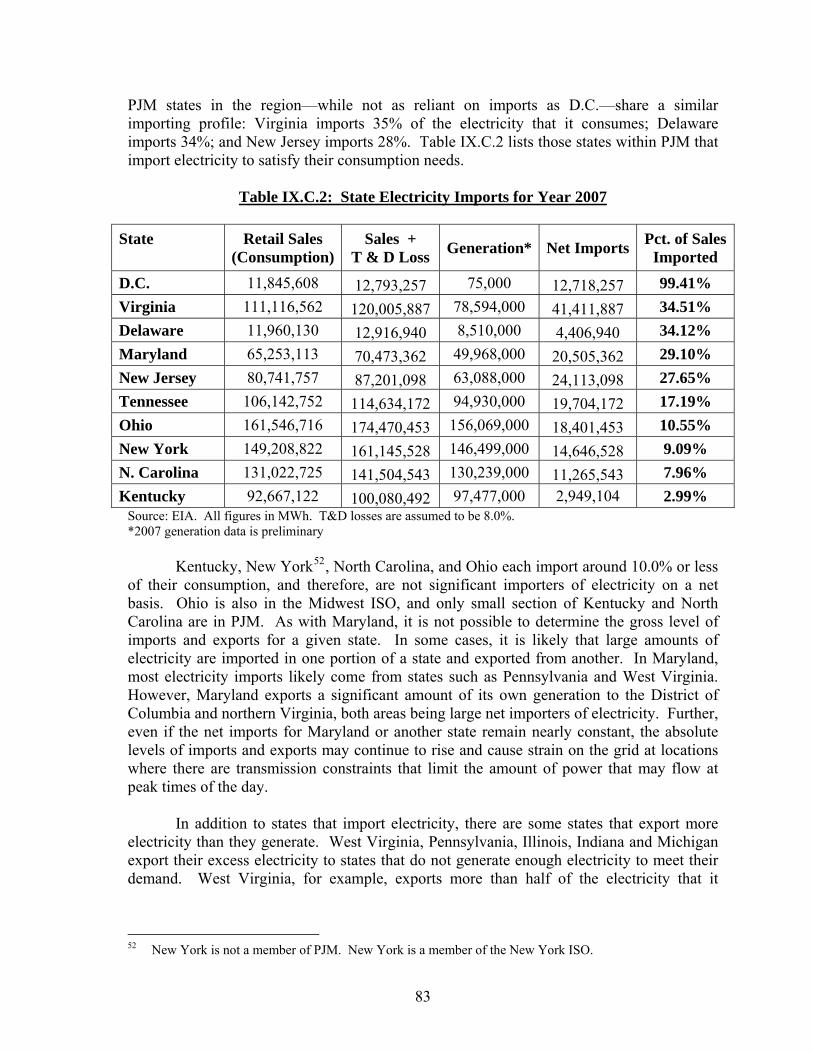
PJM states in the region—while not as reliant on imports as D.C.—share a similar importing profile: Virginia imports 35% of the electricity that it consumes; Delaware imports 34%; and New Jersey imports 28%. Table IX.C.2 lists those states within PJM that import electricity to satisfy their consumption needs.
Table IX.C.2: State Electricity Imports for Year 2007
State
Retail Sales (Consumption)
Sales + T & D Loss Generation* Net Imports Pct. of Sales
Imported D.C. 11,845,608 12,793,257 75,000 12,718,257 99.41% Virginia 111,116,562 120,005,887 78,594,000 41,411,887 34.51% Delaware 11,960,130 12,916,940 8,510,000 4,406,940 34.12% Maryland 65,253,113 70,473,362 49,968,000 20,505,362 29.10% New Jersey 80,741,757 87,201,098 63,088,000 24,113,098 27.65% Tennessee 106,142,752 114,634,172 94,930,000 19,704,172 17.19% Ohio 161,546,716 174,470,453 156,069,000 18,401,453 10.55% New York 149,208,822 161,145,528 146,499,000 14,646,528 9.09% N. Carolina 131,022,725 141,504,543 130,239,000 11,265,543 7.96% Kentucky 92,667,122 100,080,492 97,477,000 2,949,104 2.99%
Source: EIA. All figures in MWh. T&D losses are assumed to be 8.0%. *2007 generation data is preliminary Kentucky, New York52, North Carolina, and Ohio each import around 10.0% or less of their consumption, and therefore, are not significant importers of electricity on a net basis. Ohio is also in the Midwest ISO, and only small section of Kentucky and North Carolina are in PJM. As with Maryland, it is not possible to determine the gross level of imports and exports for a given state. In some cases, it is likely that large amounts of electricity are imported in one portion of a state and exported from another. In Maryland, most electricity imports likely come from states such as Pennsylvania and West Virginia. However, Maryland exports a significant amount of its own generation to the District of Columbia and northern Virginia, both areas being large net importers of electricity. Further, even if the net imports for Maryland or another state remain nearly constant, the absolute levels of imports and exports may continue to rise and cause strain on the grid at locations where there are transmission constraints that limit the amount of power that may flow at peak times of the day. In addition to states that import electricity, there are some states that export more electricity than they generate. West Virginia, Pennsylvania, Illinois, Indiana and Michigan export their excess electricity to states that do not generate enough electricity to meet their demand. West Virginia, for example, exports more than half of the electricity that it
52 New York is not a member of PJM. New York is a member of the New York ISO.
83
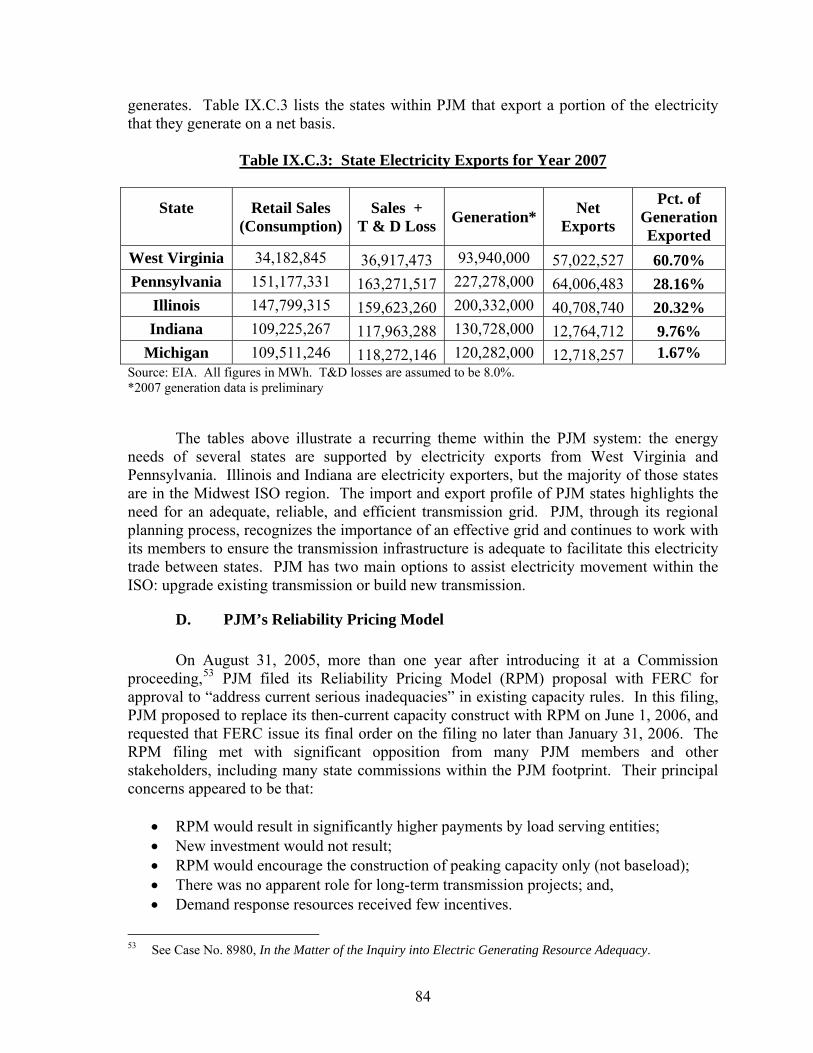
generates. Table IX.C.3 lists the states within PJM that export a portion of the electricity that they generate on a net basis.
Table IX.C.3: State Electricity Exports for Year 2007
State
Retail Sales (Consumption)
Sales + T & D Loss Generation* Net
Exports
Pct. of Generation Exported
West Virginia 34,182,845 36,917,473 93,940,000 57,022,527 60.70% Pennsylvania 151,177,331 163,271,517 227,278,000 64,006,483 28.16%
Illinois 147,799,315 159,623,260 200,332,000 40,708,740 20.32% Indiana 109,225,267 117,963,288 130,728,000 12,764,712 9.76%
Michigan 109,511,246 118,272,146 120,282,000 12,718,257 1.67% Source: EIA. All figures in MWh. T&D losses are assumed to be 8.0%. *2007 generation data is preliminary The tables above illustrate a recurring theme within the PJM system: the energy needs of several states are supported by electricity exports from West Virginia and Pennsylvania. Illinois and Indiana are electricity exporters, but the majority of those states are in the Midwest ISO region. The import and export profile of PJM states highlights the need for an adequate, reliable, and efficient transmission grid. PJM, through its regional planning process, recognizes the importance of an effective grid and continues to work with its members to ensure the transmission infrastructure is adequate to facilitate this electricity trade between states. PJM has two main options to assist electricity movement within the ISO: upgrade existing transmission or build new transmission.
D. PJM’s Reliability Pricing Model
On August 31, 2005, more than one year after introducing it at a Commission proceeding,53 PJM filed its Reliability Pricing Model (RPM) proposal with FERC for approval to “address current serious inadequacies” in existing capacity rules. In this filing, PJM proposed to replace its then-current capacity construct with RPM on June 1, 2006, and requested that FERC issue its final order on the filing no later than January 31, 2006. The RPM filing met with significant opposition from many PJM members and other stakeholders, including many state commissions within the PJM footprint. Their principal concerns appeared to be that:
• RPM would result in significantly higher payments by load serving entities; • New investment would not result; • RPM would encourage the construction of peaking capacity only (not baseload); • There was no apparent role for long-term transmission projects; and, • Demand response resources received few incentives.
53 See Case No. 8980, In the Matter of the Inquiry into Electric Generating Resource Adequacy.
84

The Commission filed comments with FERC on RPM on October 19, 2005. In its
comments, the Commission said, “The Maryland Commission views RPM as a means to an end: a transitional mechanism to secure resource adequacy where it is needed now and to serve as a bridge toward mature electricity markets that do not require regulatory intervention to ensure resource adequacy. Although the MDPSC generally supported moving forward with a next-generation capacity market design, several questions required more in-depth exploration.”
During 2006, FERC managed settlement discussions between all the affected parties
including PJM, state commissions (including the Maryland Commission), and PJM members:
• Over 150 individuals representing more than 65 parties engaged in the discussions; • The final settlement gained broad support across diverse stakeholder interests54; and, • The new capacity market construct would be implemented on June 1, 2007.
Changes to RPM that occurred during settlement discussion included: (1) addition of
explicit performance metrics for generators to deliver energy during peak period hours; (2) a revised demand curve with generally lower capacity reference prices; (3) addition of a Fixed Reserve Requirement (FRR) (opt-out) alternative; (4) inclusion of various market power mitigation provisions; (5) addition of cost of new entry reference price adjustment based on empirical data from actual capacity market activity; and (6) additional integration with the PJM Regional Transmission Expansion Planning Process (RTEPP).
RPM is a forward-looking capacity construct which was designed to replace the prior capacity market structure, the Capacity Credit Market (CCM). The CCM consisted of a bilateral market and a short-term capacity spot market, with an auction market to encompass forward capacity needs. RPM is a capacity construct that uses three-year forward-looking price signals consistent with the PJM RTEP. RPM methodology includes a downward-sloping demand curve (the Variable Resource Requirement) based on both the cost of constructing new generation facilities (the Cost Of New Entry or “CONE”) and the amount of capacity needed to ensure reliability. The three-year forward auction is based on the time needed for new generation to be constructed, under the theory that any expected shortfalls in capacity can be met by building new generation. In that instance that there is excess capacity, the downward sloping demand curve allows for a price that is below CONE, but still sufficient to incent existing resources to bid into the RPM market.
The underlying purpose of RPM is to permit PJM to acquire a level of supply sufficient to reliably meet the needs of consumers within PJM. RPM uses a competitive auction to secure the resources needed to satisfy an LSE’s capacity obligations. Further, RPM provides long-term price signals that encourages investment by creating a more predictable revenue stream. Finally, RPM supports the RTEPP by incenting investment in areas with generation shortfalls and/or transmission constraints. 54 The Maryland PSC participated in the discussions, but abstained in the final vote on the RPM settlement.
85
As an alternative to participating in the RPM auctions, an LSE can meet its capacity requirement by certifying to PJM that the LSE has undertaken a multi-year commitment to completely cover their forecast load over this time period. Under this procurement method, an LSE meets its capacity requirement via bilateral agreements and self-supply resources. In addition, the LSE does not pay RPM capacity prices, nor do the committed supply resources receive RPM capacity prices. For comparison, 129,409.2 MWs of capacity was cleared for the 2007/2008 RPM auction, and for this same period, 22,922.6 MW of capacity obligation was met via the self-supply mechanism.
When fully transitioned, PJM will hold a centralized auction three years in advance
of a given June 1 to May 31 planning year, with several incremental auctions held to fine-tune the process. PJM has held three of the four planned capacity auctions for the 2007/2008 to 2010/2011 Planning Years, with each auction separated by a period of several months in order to effect the transition and set up the initial three-year planning horizon. The first four transitional auctions were held the weeks of April 2, 2007; July 2, 2007; October 1, 2007; and January 21, 2008. The first regular auction was held the week of May 5, 2008 (for 2011/2012). Additionally, the entire PJM footprint was not transitioned at once; instead, regions will be layered-in over time.
PJM has implemented plans to add the LDAs as follows and the results of the first
three RPM auctions are shown in Table IX.D.1 below:
• 2007/2008 and 2008/2009 Planning Years: EMAAC55, SWMAAC56, and the entire RTO;
• 2009/2010 Planning Year: EMAAC, SWMAAC, MAAC57 plus Allegheny (MAAC + AP), and the entire RTO;
• 2011/2012 Planning Year: MAAC, SWMAAC, DPL South, RTO, and RTO less the FRR.
55 The EMAAC LDA, consistently mostly of New Jersey and the Delmarva Peninsula, is the Atlantic
Electric, Delmarva, Jersey Central, PECO, Public Service, and Rockland zones. 56 The SWMAAC LDA consists solely of the BGE and PEPCO zones. 57 MAAC includes all of SWMAAC and EMAAC and three Pennsylvania zones (MedEd, Penelec, and
PPL).
86
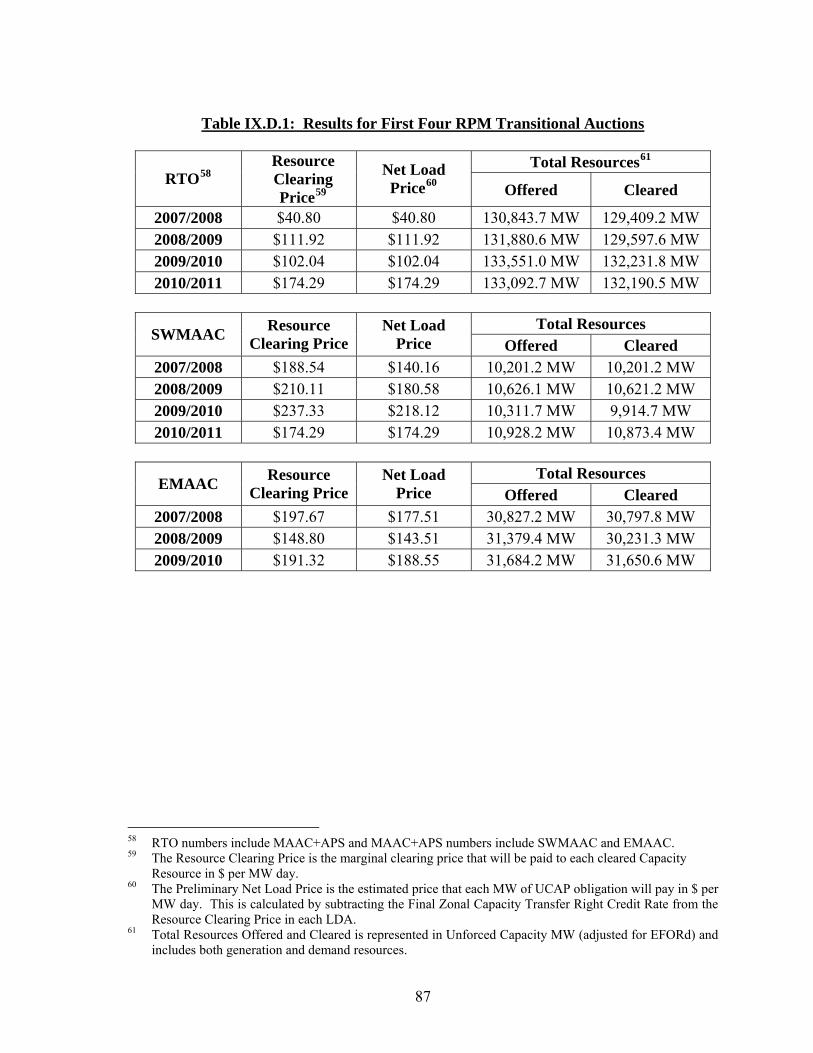
Table IX.D.1: Results for First Four RPM Transitional Auctions
Total Resources61
RTO58Resource Clearing Price59
Net Load Price60 Offered Cleared
2007/2008 $40.80 $40.80 130,843.7 MW 129,409.2 MW 2008/2009 $111.92 $111.92 131,880.6 MW 129,597.6 MW 2009/2010 $102.04 $102.04 133,551.0 MW 132,231.8 MW 2010/2011 $174.29 $174.29 133,092.7 MW 132,190.5 MW
Total Resources
SWMAAC Resource Clearing Price
Net Load Price Offered Cleared
2007/2008 $188.54 $140.16 10,201.2 MW 10,201.2 MW 2008/2009 $210.11 $180.58 10,626.1 MW 10,621.2 MW 2009/2010 $237.33 $218.12 10,311.7 MW 9,914.7 MW 2010/2011 $174.29 $174.29 10,928.2 MW 10,873.4 MW
Total Resources
EMAAC Resource Clearing Price
Net Load Price Offered Cleared
2007/2008 $197.67 $177.51 30,827.2 MW 30,797.8 MW 2008/2009 $148.80 $143.51 31,379.4 MW 30,231.3 MW 2009/2010 $191.32 $188.55 31,684.2 MW 31,650.6 MW
58 RTO numbers include MAAC+APS and MAAC+APS numbers include SWMAAC and EMAAC. 59 The Resource Clearing Price is the marginal clearing price that will be paid to each cleared Capacity
Resource in $ per MW day. 60 The Preliminary Net Load Price is the estimated price that each MW of UCAP obligation will pay in $ per
MW day. This is calculated by subtracting the Final Zonal Capacity Transfer Right Credit Rate from the Resource Clearing Price in each LDA.
61 Total Resources Offered and Cleared is represented in Unforced Capacity MW (adjusted for EFORd) and includes both generation and demand resources.
87
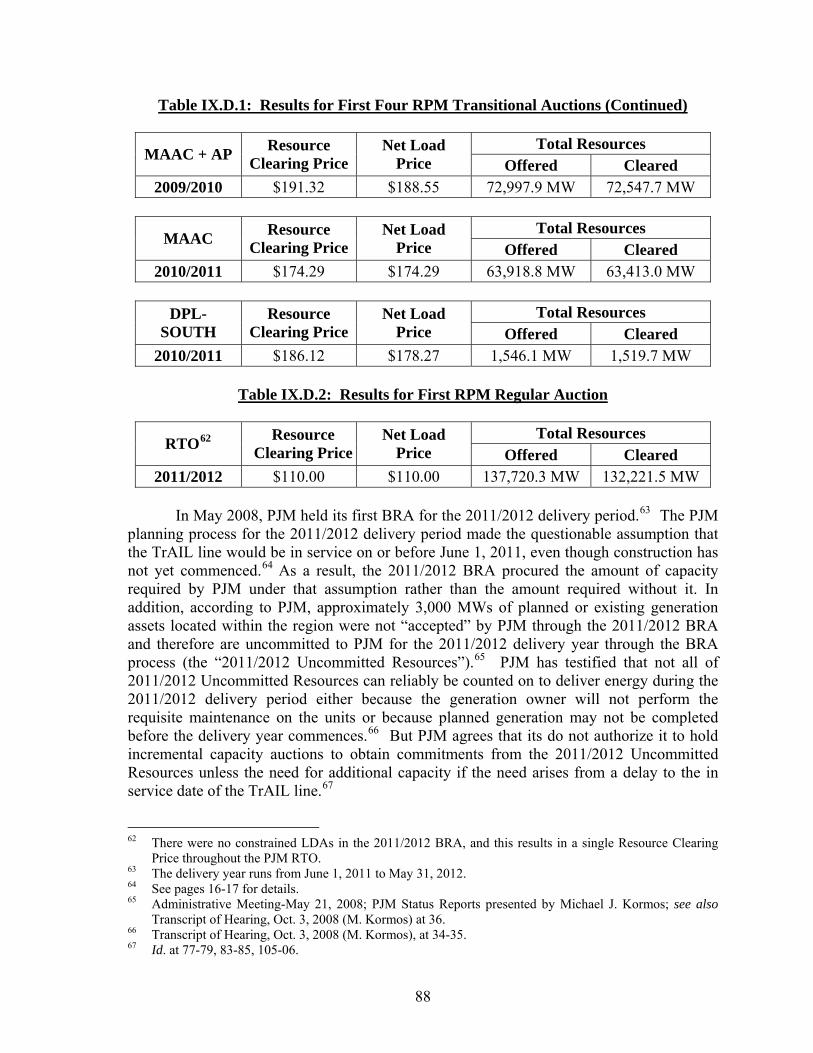
Table IX.D.1: Results for First Four RPM Transitional Auctions (Continued)
Total Resources MAAC + AP Resource
Clearing PriceNet Load
Price Offered Cleared 2009/2010 $191.32 $188.55 72,997.9 MW 72,547.7 MW
Total Resources
MAAC Resource Clearing Price
Net Load Price Offered Cleared
2010/2011 $174.29 $174.29 63,918.8 MW 63,413.0 MW
Total Resources DPL-SOUTH
Resource Clearing Price
Net Load Price Offered Cleared
2010/2011 $186.12 $178.27 1,546.1 MW 1,519.7 MW
Table IX.D.2: Results for First RPM Regular Auction
Total Resources RTO62 Resource
Clearing PriceNet Load
Price Offered Cleared 2011/2012 $110.00 $110.00 137,720.3 MW 132,221.5 MW
In May 2008, PJM held its first BRA for the 2011/2012 delivery period.63 The PJM
planning process for the 2011/2012 delivery period made the questionable assumption that the TrAIL line would be in service on or before June 1, 2011, even though construction has not yet commenced.64
As a result, the 2011/2012 BRA procured the amount of capacity required by PJM under that assumption rather than the amount required without it. In addition, according to PJM, approximately 3,000 MWs of planned or existing generation assets located within the region were not “accepted” by PJM through the 2011/2012 BRA and therefore are uncommitted to PJM for the 2011/2012 delivery year through the BRA process (the “2011/2012 Uncommitted Resources”).65 PJM has testified that not all of 2011/2012 Uncommitted Resources can reliably be counted on to deliver energy during the 2011/2012 delivery period either because the generation owner will not perform the requisite maintenance on the units or because planned generation may not be completed before the delivery year commences.66 But PJM agrees that its do not authorize it to hold incremental capacity auctions to obtain commitments from the 2011/2012 Uncommitted Resources unless the need for additional capacity if the need arises from a delay to the in service date of the TrAIL line.67
62 There were no constrained LDAs in the 2011/2012 BRA, and this results in a single Resource Clearing
Price throughout the PJM RTO. 63 The delivery year runs from June 1, 2011 to May 31, 2012. 64 See pages 16-17 for details. 65 Administrative Meeting-May 21, 2008; PJM Status Reports presented by Michael J. Kormos; see also
Transcript of Hearing, Oct. 3, 2008 (M. Kormos) at 36. 66 Transcript of Hearing, Oct. 3, 2008 (M. Kormos), at 34-35. 67 Id. at 77-79, 83-85, 105-06.
88
Accordingly, at this point, any process for obtaining commitments from the
2011/2012 Uncommitted Resources, or any other resources for that time period, falls to this Commission – hence the Gap RFP case and the other “re-regulation” steps that the Commission has taken to secure additional capacity. Although PJM and its stakeholders are currently evaluating changes in PJM’s tariff that might, after approval by FERC, authorize PJM to conduct incremental auction for reasons other than increasing load forecasts, the timing and outcome of that stakeholder process is unpredictable, and we cannot leave the integrity of Maryland’s electricity supply to these processes.68
E. Demand Response in PJM Markets
Demand Response (DR) in PJM, also known as demand side response, continues to be actively promoted within the wholesale electricity markets. PJM allows DR the opportunity to bid into the Energy, Capacity, Synchronized Reserve, and Regulation markets. While there is a significant level of potential demand side response in the market, it is a relatively small part of what may be available in the transition to a fully functional demand side energy market. “A fully developed demand side program will include retail programs and an active, well-articulated interaction between wholesale and retail markets.”69
PJM has three basic programs: Economic Load Response Program, and Emergency Load Program, and Active Load Management. The former two programs are the core of demand side response programs, while the latter is part of the ancillary services market. The goal is to provide economic incentives for end-use customers to curtail the electricity usage in the circumstances of either peak periods or unexpected outages. 1. Economic Load-Response Program
The Economic Load Response Program is designed to provide an incentive to
customers working with curtailment service providers (CSPs) to reduce consumption when PJM LMPs are high.
On March 15, 2002, PJM submitted filing amendments to the OATT and to the OA
to establish a multi-year economic load response program.70 On May 31, 2002, FERC accepted the economic program, effective June 1, 2002, with a December 1, 2004, sunset provision.71 On October 29, 2004, FERC extended the economic program until December 31, 2007.72 On February 24, 2006, FERC approved changes to the PJM Tariff to permit
68 Id. 69 2007 State of the Market Report, Volume 1: Introduction, March 11, 2008. 70 PJM Tariff Amendments, Docket No. ER02-1326-000 (March 15, 2002). 2006 State of the Market
Report, p. 89. 71 99 DERCII 61,227 (2002). 72 PJM Letter Order, Docket No. ER04-1193-000 (October 29, 2004).
89
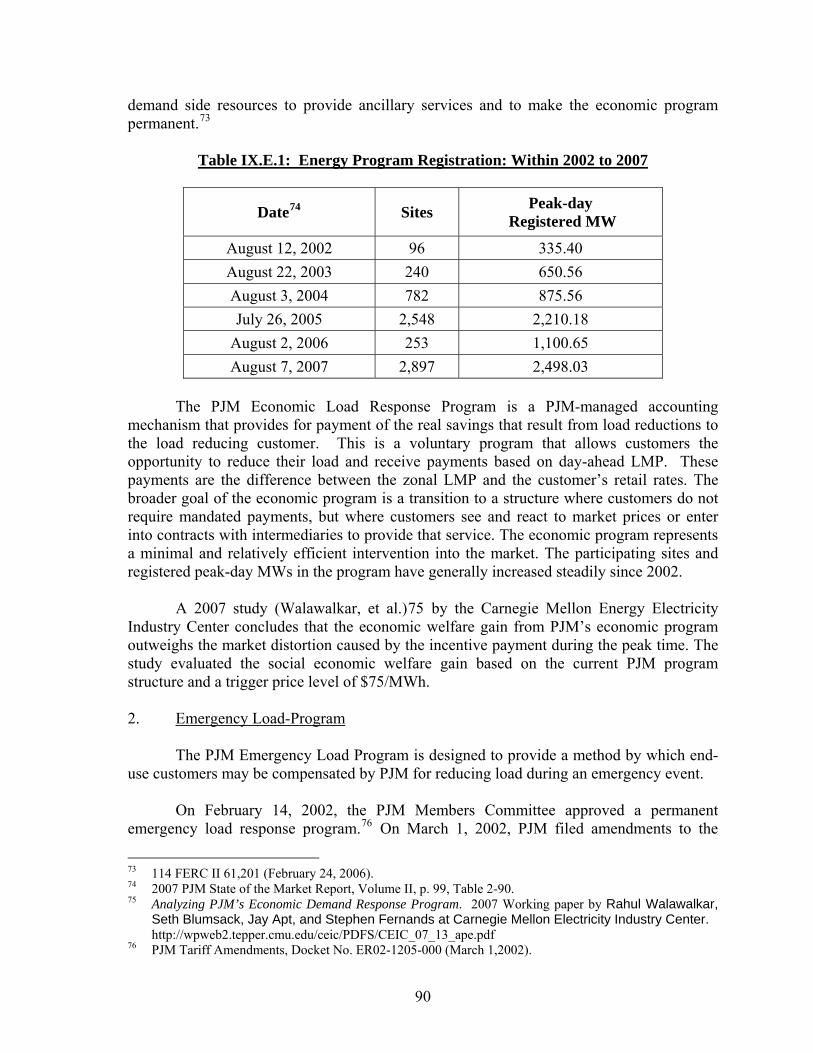
demand side resources to provide ancillary services and to make the economic program permanent.73
Table IX.E.1: Energy Program Registration: Within 2002 to 2007
Date74 Sites Peak-day Registered MW
August 12, 2002 96 335.40 August 22, 2003 240 650.56 August 3, 2004 782 875.56 July 26, 2005 2,548 2,210.18
August 2, 2006 253 1,100.65 August 7, 2007 2,897 2,498.03
The PJM Economic Load Response Program is a PJM-managed accounting
mechanism that provides for payment of the real savings that result from load reductions to the load reducing customer. This is a voluntary program that allows customers the opportunity to reduce their load and receive payments based on day-ahead LMP. These payments are the difference between the zonal LMP and the customer’s retail rates. The broader goal of the economic program is a transition to a structure where customers do not require mandated payments, but where customers see and react to market prices or enter into contracts with intermediaries to provide that service. The economic program represents a minimal and relatively efficient intervention into the market. The participating sites and registered peak-day MWs in the program have generally increased steadily since 2002.
A 2007 study (Walawalkar, et al.)75 by the Carnegie Mellon Energy Electricity
Industry Center concludes that the economic welfare gain from PJM’s economic program outweighs the market distortion caused by the incentive payment during the peak time. The study evaluated the social economic welfare gain based on the current PJM program structure and a trigger price level of $75/MWh. 2. Emergency Load-Program
The PJM Emergency Load Program is designed to provide a method by which end-use customers may be compensated by PJM for reducing load during an emergency event.
On February 14, 2002, the PJM Members Committee approved a permanent
emergency load response program.76 On March 1, 2002, PJM filed amendments to the
73 114 FERC II 61,201 (February 24, 2006). 74 2007 PJM State of the Market Report, Volume II, p. 99, Table 2-90. 75 Analyzing PJM’s Economic Demand Response Program. 2007 Working paper by Rahul Walawalkar,
Seth Blumsack, Jay Apt, and Stephen Fernands at Carnegie Mellon Electricity Industry Center. http://wpweb2.tepper.cmu.edu/ceic/PDFS/CEIC_07_13_ape.pdf
76 PJM Tariff Amendments, Docket No. ER02-1205-000 (March 1,2002).
90

OATT and to the OA to establish a permanent emergency load response program.77 By order dated April 30, 2002, FERC approved the emergency program effective June 1, 2002. Like the economic program, a sunset date for it was set for December 1, 2004.78 On October 29, 2004, FERC extended the program until December 31, 2007, thereby making it coterminous with the economic program.79 On February 24, 2006, FERC approved changes to the PJM Tariff to make the emergency program permanent, including Emergency – Energy Only and Emergency – Full options.80 As a result of implementing RPM in 2007, an Emergency-Capacity Only option was added to the Emergency Program.81
The Emergency – Capacity Only program provides RPM payments for reducing capacity for capacity, and reduction is mandatory. The Emergency – Full program provides both RPM payments and energy payments for reducing capacity, and the reduction is mandatory. The Emergency – Energy Only program provides energy payments to end-use customers for voluntarily reducing load during an emergency event. The energy payment is in the zonal LMP.
Table IX.E.2: Emergency Program Registration: Within 2002 to 2006
Date82 Sites Peak-day Registered MW
August 12, 2002 64 509.3 August 22, 2003 84 475.4 August 3, 2004 3,857 1,395.5 July 26, 2005 3,867 1,455.5
August 2, 2006 4,427 1,081.0
The total MWh of load reductions and the associated payments under the Emergency Program are shown in Table IX.E.3. There was no activity in the program during 2004 because of the mild weather conditions and associated prices. At 3,662 MWh, 2005 had the largest load reduction since the program began. In 2005, payments under the program were $508 per MWh of actual load reduction per peak-day, registered MW. There was no activity in the Emergency Program in calendar year 2006. For 2007 payments were $874 per MWh, which was considerably higher than the previous years.
77 PJM Tariff Amendments, Docket No. ER02-1205-000 (March 1,2002). 78 99 DERCII 61,139 (2002). 79 PJM Interconnection, LLC., Letter Order, Docket No. ER04-1193-000 (October 29, 2004). 80 114 FERC II 61,201 (February 24, 2006). 81 2007 PJM State of the Market Report, Volume II, p. 96. 82 2006 PJM State of the Market Report, Volume II, p. 90, Table 2-55.
91
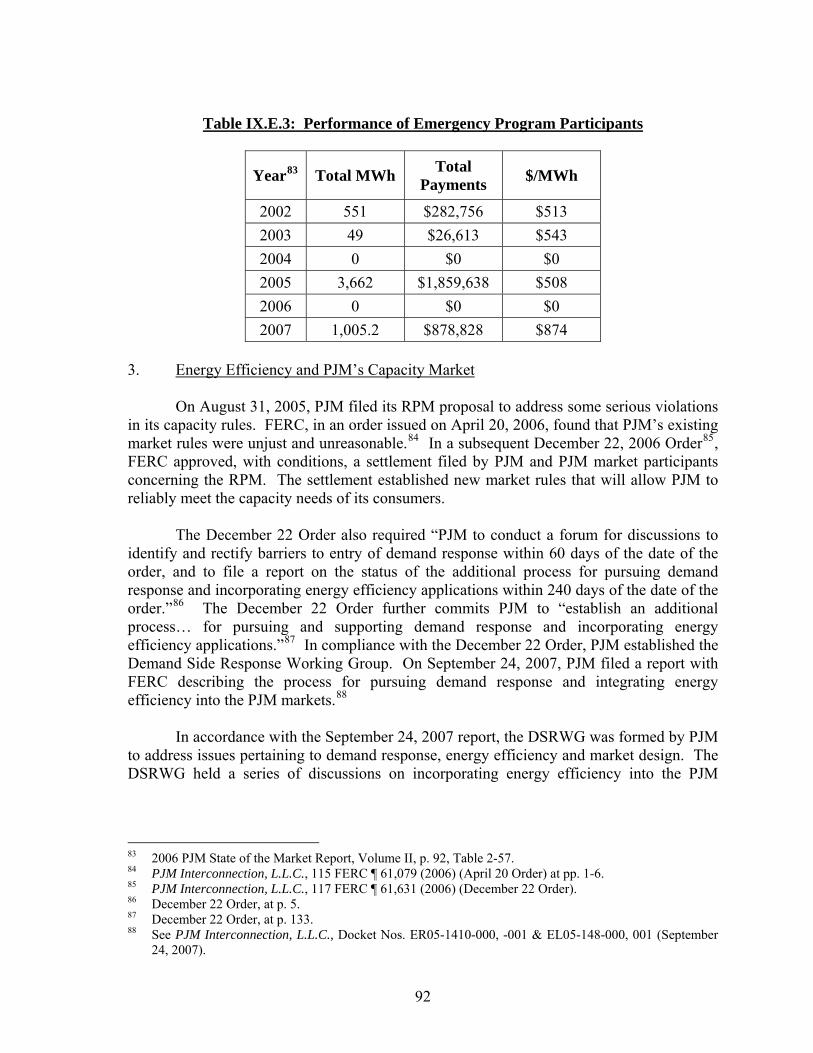
Table IX.E.3: Performance of Emergency Program Participants
Year83 Total MWh Total Payments $/MWh
2002 551 $282,756 $513 2003 49 $26,613 $543 2004 0 $0 $0 2005 3,662 $1,859,638 $508 2006 0 $0 $0 2007 1,005.2 $878,828 $874
3. Energy Efficiency and PJM’s Capacity Market
On August 31, 2005, PJM filed its RPM proposal to address some serious violations in its capacity rules. FERC, in an order issued on April 20, 2006, found that PJM’s existing market rules were unjust and unreasonable.84 In a subsequent December 22, 2006 Order85, FERC approved, with conditions, a settlement filed by PJM and PJM market participants concerning the RPM. The settlement established new market rules that will allow PJM to reliably meet the capacity needs of its consumers.
The December 22 Order also required “PJM to conduct a forum for discussions to
identify and rectify barriers to entry of demand response within 60 days of the date of the order, and to file a report on the status of the additional process for pursuing demand response and incorporating energy efficiency applications within 240 days of the date of the order.”86 The December 22 Order further commits PJM to “establish an additional process… for pursuing and supporting demand response and incorporating energy efficiency applications.”87 In compliance with the December 22 Order, PJM established the Demand Side Response Working Group. On September 24, 2007, PJM filed a report with FERC describing the process for pursuing demand response and integrating energy efficiency into the PJM markets.88
In accordance with the September 24, 2007 report, the DSRWG was formed by PJM
to address issues pertaining to demand response, energy efficiency and market design. The DSRWG held a series of discussions on incorporating energy efficiency into the PJM
83 2006 PJM State of the Market Report, Volume II, p. 92, Table 2-57. 84 PJM Interconnection, L.L.C., 115 FERC ¶ 61,079 (2006) (April 20 Order) at pp. 1-6. 85 PJM Interconnection, L.L.C., 117 FERC ¶ 61,631 (2006) (December 22 Order). 86 December 22 Order, at p. 5. 87 December 22 Order, at p. 133. 88 See PJM Interconnection, L.L.C., Docket Nos. ER05-1410-000, -001 & EL05-148-000, 001 (September
24, 2007).
92

capacity market. The report has identified a list of barriers to energy efficiency89 that PJM and members of the DSRWG have addressed.
PJM is considering three proposals for compensating energy efficiency. All allow energy efficiency to bind in and receive the RPM clearing price, but differ over the length of time an energy efficiency resource would remain eligible. A final vote on these matters is expected at the November 20, 2008 meeting of PJM’s Member’s Committee.
Approximately 80 percent of the typical Maryland ratepayer’s electric bill reflects the wholesale cost of the electricity he or she uses – a cost that, under restructuring, the PSC no longer regulates. But as reported last year, Maryland’s electricity needs have not been satisfied or well-served by the “restructured” electricity markets. Accordingly, the PSC has devoted substantial time, effort and resources to serving as an advocate for Maryland ratepayers at PJM and beforeFERC.
The PSC has focused its efforts over the last year on market rules and pricing issues. Retail electric service and prices in Maryland are affected by prices and practices relating to the provision of generation and transmission at the wholesale level, over which FERC has authority under the Federal Power Act. Currently, suppliers providing generation to serve Maryland load have market-based rate (“MBR”) authority, which means that they are allowed to charge rates that are not subject to FERC’s approval (based upon its determination that the supplier lacks market power or has sufficiently mitigated its market power in the market to be served). Whether they are established by bilateral contract or by the winning bid in a market run by PJM, rates for wholesale generation sold by suppliers with MBR authority must be just and reasonable under the Federal Power Act.
The wholesale electricity markets are not unbridled market environments – they operate according to rules that can be subject to interpretation and judgment in applying them. When the PSC becomes aware of rules that are being interpreted or applied unfairly, it has challenged those rules, and the PSC will continue to do so. During 2008, the PSC filed complaints asking FERC to require PJM to lift the exemptions from offer-capping applicable to certain interfaces and generators, and to provide a remedy for unjust and unreasonable generation capacity prices occurring in the transition to PJM’s Reliability Pricing Model (“RPM”) capacity construct.
There are several other ways to help support competitive wholesale generation
markets. One way to bring more discipline to PJM’s generation markets (and to advance Maryland’s energy conservation goals) is to ensure that energy efficiency and demand response are part of the bidding process. Demand response has been permitted to bid into PJM’s capacity markets, but to date energy efficiency has not. Proposals are pending, and 89 Discussions are focusing on energy efficiency resources for large customers with interval meters. The
report notes that Synapse Energy Economics and PJM will develop a proposal for customers without interval meters. See page 5 of the September 24, 2007 report. Paul Peterson and Doug Hurley of Synapse, in a presentation given at the DSRWG Meeting of July 12, 2007, noted some of the barriers to energy efficiency resources: lack of awareness and information; limited product availability; high transaction costs; split incentives; and regulatory and rule barriers. The report can be found at: http://www.pjm.com/committees/working-groups/dsrwg/downloads/20070712-item-05-dr-principles.pdf.
93

the Commission has participated in FERC proceedings (and PJM stakeholder procedures) on the participation of energy efficiency in PJM’s markets. Ensuring that PJM’s interconnection procedures will not present an undue barrier to the entry of new generation or merchant transmission projects needed to relieve transmission constraints is another way to support competitive markets and help ensure reliable service at reasonable prices; and the PSC has participated in FERC proceedings and PJM stakeholder procedures in an effort to improve the efficiency of this process.
Another important way to enhance competitive generation markets (and help ensure reliable service at reasonable rates) is to have sufficient regulated transmission available (particularly high-voltage, backbone facilities) to support power transfers. The PSC supports rate incentives that will encourage investment in transmission that will bring regional benefits by increasing import capability, relieving congestion, or improving access to markets by renewable generation. But the PSC also is mindful that while the lion’s share of the delivered price for electric service is related to generation, transmission costs are increasing too. The PSC has participated in several incentive pricing proceedings at FERC in connection with transmission investments by various PJM transmission owners. The PSC consistently has opposed incentive treatment in connection with investments that are needed to ensure local reliability in the transmission owner’s distribution territory, since electric companies generally are required to provide reliable service by state statute (as in Maryland).
Even if the transmission investment provides regional benefits, the PSC believes that the incentives must be reasonably connected to the risks involved. Investments in transmission needed to support PJM’s markets do not carry a large risk; and PJM’s transmission owners have developed much experience and expertise by building transmission facilities for years. Hence, the PSC has opposed large return on equity (“ROE”) adders on new transmission investments, unless warranted by sheer magnitude of the project or the utility’s use of new technology. This is particularly true if the transmission owner seeks recovery of abandonment costs and construction work in progress (“CWIP”).
So far, a FERC majority has awarded incentive ROEs that the PSC opposed as unwarranted in several proceedings, almost always with two of five Commissioners dissenting; and the PSC is seeking rehearing of the FERC majority’s orders. Additionally, the PSC has participated in formulary rate proceedings filed by PJM transmission owners outside Maryland. Participation in such proceedings is necessary not only in terms of establishing FERC precedent, but also because Maryland shares some of these transmission costs under PJM’s current transmission rate design. Finally, the allocation of the costs of transmission investment in PJM affects Maryland ratepayers, and the PSC is participating in a judicial review proceeding in support of FERC’s order establishing PJM’s rate design.
The PSC will continue to play an informed and aggressive role in advocating for Maryland’s energy interests in the PJM shareholder process and other PJM fora, and before FERC.
94

X. FEDERAL AND NATIONAL ENERGY ISSUES IMPACTING MARYLAND
A. NERC Report to FERC on 2008 Summer Operations and Standards Compliance
NERC has three reliability reports: a Long-Term Reliability Assessment, a Winter Reliability Assessment, and a Summer Reliability Assessment90. The Long-Term Reliability Assessment views electric reliability for a ten-year period and the Winter and the Summer Reliability Assessments predict electric reliability for each coming season, respectively. These reports are based on the analysis, data and information submitted by the eight Regional Reliability Organizations to assess current and future electricity demand, and the adequacy of the bulk power system to meet that demand. Related issues, such as power generation, transmission, fuel delivery and demand side options, are factored into the assessment reports. The 2008 Summer Reliability Assessment Report is discussed below. 2008 Summer Reliability Assessment Report The 2008 Summer Assessment represented NERC’s independent judgment of the reliability and adequacy of the bulk power system on North America for the upcoming summer peak demand period. NERC’s report identified areas of concern. The NERC’s Assessment summary consisted of six major areas. They were:
• Progress since summer 2007. Several of the reliability issues and concerns highlighted in NERC’s 2007 Summer Reliability Assessment were being addressed in 2008 Summer Assessment. Transmission investments in the Southeast totaling more than $1.1 billion in 2007 and nearly $1.5 billion projected for 2008 were improving reliability in the region. Reliability in the Boston, Southwest Connecticut and Greater Connecticut areas had improved with the addition of transmission and both supply and demand-side resources. Texas had increased existing generation resources resulting in higher capacity margins.
Capacity margin adequate. Net capacity margins for the U.S. increased by 1.9
percent over last summer’s assessment, but net capacity margins in Canada had a slight decrease of 1 percent. These changes were small and might be influenced by the changes in NERC’s capacity categories.91 Capacity margins, reflecting existing resources reasonably anticipated to operate and deliver power to or into the region along with firm capacity purchases, appear adequate92 for the 2008 summer months. 90 The Long-Term Reliability Assessment: http://www.nerc.com/files/LTRA2008.pdf. The Winter Reliability Assessment: http://www.nerc.com/files/winter2007-08.pdf
The Summer Reliability Assessment report was published in May, 2008: http://www.nerc.com/files/summer2008.pdf
91 The definitions of capacity categories were modified in 2008 (See Resources, Demand and Capacity Section in 2008 Summer Reliability Assessment); as a result, capacity margins may not be directly comparable to those cited in previous reports.
92 NERC defines the reliability of the interconnected bulk power system in terms of two basic and functional aspects: adequacy and operating reliability.
95

• Coal inventories below average. Coal inventories were at healthy levels at the
beginning of 2008, with the average for all eastern U.S. generators at 51.6 days of average burn. However, the inventory levels differed for different coal types. Inventories of western coal from the Powder River Basin were unusually high entering 2008 at 64 days of average burn. Inventories of northern Appalachia coal already fell to relatively low levels (36.8 days) by the beginning of 2008 as this coal entered the export market earlier than any other thermal coal. Inventories of central Appalachia coal, the largest eastern coal region, were at a healthy 52 days of average burn entering 2008, but fell quickly in the first two months of 2008, dropping to 48 days of burn. If the world coal market continues at its recent highs, it was possible that eastern power generators would see coal inventories drop during the summer of 2008. Reliability concerns were not expected as a result of this shift, but NERC would closely monitor these levels over the summer months to ensure adequate inventories exist to meet peak demands.
• Natural gas supply is healthy. The outlook for U.S. natural gas supply was healthy
heading into the 2008 summer season on all fronts. North America will also benefit from the addition of six new LNG regasification terminals coming online through 2008, with additions of global LNG liquefaction plants lagging somewhat. While the U.S.’s ability to attract LNG imports will partially depend on relative global prices, U.S. imports of LNG are likely to rise moderately in 2008, possibly by as much as 0.5 to 1.0 BCFD93 compared to last year, potentially reaching the 3.0 BCFD mark with peak deliveries likely occurring in the summer months.
• Demand Response reduces demand and provides ancillary service. NERC
completed studies in 2007 on demand-side management and load forecasting resulting in more detailed data on forecasted demand-side management resources.
• Wind Resources contribute to capacity. Wind resources are growing in importance
as many areas of North America see new facilities come online. This growth is supported by state and provincial Renewable Portfolio Standards (RPS), which generally require utilities to increase the proportion of energy generated by renewable resources to up to 30 percent of their resource mix over the next five to 15 years. Further, U.S. Federal renewable tax credits concentrated on encouraging wind plant construction has fortified interest in development of renewable energy.
The Reliability First Corporation (“RFC”), including PJM and Midwest ISO (“MISO”), first time reported respective PJM and MISO summer reliability assessment. The reserve margin for the PJM RTO was 29,200 MW, which was 21.8 percent of the net internal demand and was greater than the reserve requirement of 15.0 percent, which was 20,100 MW.
93 BCFD is abbreviation of billion cubic feet per day
96

APPENDIX
The Appendix contains a compilation of data provided by Maryland’s electric companies, including the number of customers, sales by customer class, and typical utility bills, as well as forecasted peak demand and electricity sales over the next fifteen years, by utility. It also includes a list of all licensed electricity and natural gas suppliers and brokers in Maryland, renewable energy projects, planned transmission enhancements, and power purchase agreements for each utility.
97

Table A-1: Utilities Providing Retail Electric Service in Maryland
Utility Service Territory
A&N Electric Cooperative Smith Island in Somerset County
Anne Arundel County, Baltimore City, Baltimore County and portions of the following counties: Calvert, Carroll, Howard, Harford, Montgomery, and Prince George's.
Baltimore Gas & Electric Company
Town of Berlin Town of Berlin.
Choptank Electric Cooperative Portions of the Eastern Shore.
Major portions of ten counties primarily on the Eastern Shore. Delmarva Power & Light Company
Easton Utilities Commission City of Easton.
Hagerstown Municipal Electric Light Plant City of Hagerstown.
Potomac Edison Company Parts of western Maryland.
Major portions of Montgomery and Prince George's Counties. Potomac Electric Power Company
Somerset Rural Electric Cooperative Northwestern corner of Garrett County.
Charles and St. Mary's Counties; portions of Calvert and Prince George's Counties. Southern Maryland Electric Cooperative
Thurmont Municipal Light Company Town of Thurmont
Town of Williamsport
Town of Williamsport
Source: Table 1 in Company data responses to the Commission’s 2008 data request for the Ten-Year Plan.
98

99
Table A-2: Number of Customers by Customer Class (As of December 31, 2007)
System-wide Maryland
2,420,550
Utility/Co. Residen-tial
Commer-cial Industrial Other
Sales for
Resale Total Residen-
tial Commer-
cial Industrial Other Sales
for Resale
Total
Berlin 1,933 285 114 20 0 2,352 1,933 285 114 20 0 2,352
BGE 1,103,104 116,747 5,455 n/a 0 1,225,306 1,103,104 116,747 5,455 n/a 0 1,225,306
Choptank 46,628 4,610 19 384 0 51,641 46,628 4,610 19 384 0 51,641
DPL 456,364 61,152 554 683 0 518,753 171,950 25,481 259 275 0 197,965
Easton 8,092 2,155 0 89 0 10,336 8,092 2,155 0 89 0 10,336
Hagerstown 15,325 2,190 126 4 0 17,645 15,325 2,190 126 4 0 17,645
PE/AP 414,898 56,733 6,174 763 6 478,574 217,508 26,981 2,804 344 3 247,640
PEPCO 686,636 73,319 12 134 0 760,101 471,466 46,690 11 101 0 518,268
SMECO 131,564 12,923 6 234 0 144,727 131,564 12,923 6 234 0 144,727
Somerset 12,041 1,114 0 0 0 13,155 754 39 0 0 0 793
Thurmont 2,473 335 12 45 0 2,865 2,473 335 12 45 0 2,865
Williamsport 866 64 36 46 0 1,012 866 64 36 46 0 1,012
Total 2,879,924 331,627 12,508 2,402 6 3,226,467 2,171,663 238,500 8,842 1,542 3
Source: Table 2 in Company data responses to the Commission's 2008 data request for the Ten-Year Plan. Note: A&N did not provide a response to the Commission’s data request. Note: Some totals may not sum due to rounding.

100
Table A-3: Sales by Customer Class (As of December 31, 2007; GWh)
System-Wide Maryland
65,900
Utility/Co. Residen-tial
Commer-cial
Indus-trial Other
Sales for
Resale Total Residen-
tial Commer-
cial Indus-
trial Other Sales
for Resale
Total
Berlin 24 3 13 0 0 40 24 3 13 0 0 40 BGE 13,364 16,284 3,462 0 0 33,114 13,364 16,284 3,462 0 0 33,114
Choptank 670 208 78 1 0 957 670 208 78 1 0 957 DPL 5,380 5,540 2,868 48 0 13,836 2,179 1,755 461 12 0 4,407
Easton 109 155 0 12 0 276 109 155 12 0 276 Hagerstown 156 67 125 8 0 355 156 67 125 8 0 355
PE/AP 6,517 3,583 3,425 24 773 14,322 3,379 2,069 1,577 12 483 7,520 PEPCO 8,110 17,970 709 731 0 27,520 6,136 8,750 449 316 0 15,651 SMECO 2,156 1,107 198 4 0 3,465 2,156 1,107 198 4 3,465
Somerset 118 45 0 0 0 163 7 1 0 0 0 7 Thurmont 39 16 31 1 0 87 39 16 31 1 0 87
Williamsport 10 1 8 1 0 20 10 1 8 1 0 20
Total 36,653 44,979 10,916 829 773 94,155 28,228 30,416 6,401 366 483
Source: Table 3 in Company data responses to the Commission's 2008 data request for the Ten-Year Plan. Note: A&N did not provide a response to the Commission’s data request.

101
Table A-4: Typical Monthly Utility Bills in Maryland, (Winter 2008)
Source: Table 8 in Company data responses to the Commission's 2008 data request for the Ten-Year Plan. Note: A&N did not provide a response to the Commission’s data request N/A: Data are not available.
Energy Use (kWh) Typical Bill ($) Revenue ($/kWh)
Utility/Co. Residential Commercial Industrial Residential Commercial Industrial Residential Commercial Industrial
A&N N/A N/A N/A N/A N/A N/A N/A N/A N/A
Berlin 1,000 6,000 125,000 160.13 1,187.61 15,427.66 0.16 0.20 0.12
BGE 750 12,500 200,000 107.00 1,514.00 2,847.00 0.14 0.12 0.01
Choptank 750 12,500 200,000 101.19 1,534.91 21,876.55 0.14 0.12 0.11
DPL 750 12,500 200,000 114.57 2,047.02 29,614.97 0.15 0.16 0.15
Easton 750 12,500 N/A 96.00 1,601.24 N/A 0.13 0.13 N/A
Hagerstown 750 12,500 200,000 kWh - 500 kW 73.63 1,69.43 19,284.12 0.10 0.11 0.10
PE/AP 1,620 3,821 15,180 144.40 402.80 1,456.46 0.09 0.11 0.10
PEPCO 750 12,500 200,000 112.72 1,550.54 22,163.99 0.14 0.12 0.11
SMECO 750 12,500 200,000 108.11 2,010.63 30,029.38 0.15 0.16 0.15
Somerset 691 1,515 None 69.57 152.85 None 0.10 0.10 None
Thurmont 750 12,500 200,000 79.30 1,269.47 18,051.42 0.10 0.10 0.09
Williamsport 900 1,800 20,000 kWh - 60 kW 88.18 176.39 1,952.75 0.098 0.10 0.10

5
22
22 23 23 23 24 24 25 25 25 26 26 26 27 27
1.50%
23.16%
102
Table A-5(a): System-Wide Peak Demand Forecast (Net of DSM Programs: MW)
Year BGE Berlin Chopt- ank DPL Easton Hagers-
town PE/AP Pepco SMECO SOMER-SET
Thur- mont
2008 7,137 4 223 4,191 67 74 3,003 7,054 748 43 2009 6,977 4 227 4,271 68 75 3,147 7,131 800 44 2010 6,888 4 235 4,345 70 76 3,200 7,192 820 44 2011 6,761 4 244 4,419 71 77 3,246 7,241 840 45 2012 6,580 4 250 4,491 73 77 3,303 7,301 861 46 2013 6,505 4 262 4,578 74 78 3,349 7,386 881 46 2014 6,431 4 272 4,651 76 79 3,402 7,455 898 47 2015 6,464 4 283 4,724 77 80 3,459 7,516 917 48 2016 6,542 5 296 4,817 79 80 3,518 7,610 935 49 2017 6,622 5 303 4,913 80 81 3,578 7,711 953 49 2018 6,706 5 317 4,990 82 82 3,639 7,818 970 50 2019 6,784 5 328 5,093 83 83 3,704 7,928 986 51 2020 6,868 5 340 5,179 84 84 3,770 8,031 1,003 52 2021 6,956 6 351 5,278 86 85 3,830 8,124 1,019 53 2022 7,051 6 363 5,383 87 85 3,894 8,233 1,035 54
Change (2008-2022) -86 2 140 1,192 20 11 891 1,179 287 11
Percentage Change -1.20% 58.33% 62.78% 28.44% 30.45% 14.80% 29.67% 16.71% 38.37% 25.29%
Annual Growth Rate -0.09% 3.34% 3.54% 1.80% 1.92% 0.99% 1.87% 1.11% 2.35% 1.62%
Source: Table 4 in Company data responses to the Commission's 2008 data request for the Ten-Year Plan. Note: A&N did not provide a response to the Commission’s data request.

103
Table A-5(b): Maryland Peak Demand Forecast (Net of DSM Programs; MW)
Year BGE Berlin Choptank DPL Easton Hagers-town PE/AP Pepco SMECO Thur-
mont Williams-
port Total
2008 7,137 4 223 1,060 67 74 1,584 3,555 748 22 5 14,479 2009 6,977 4 227 1,076 68 75 1,634 3,582 800 22 5 14,471 2010 6,888 4 235 1,089 70 76 1,655 3,597 820 23 5 14,461 2011 6,761 4 244 1,102 71 77 1,675 3,605 840 23 5 14,407 2012 6,580 4 250 1,114 73 77 1,708 3,620 861 23 5 14,316 2013 6,505 4 262 1,130 74 78 1,732 3,647 881 24 5 14,343 2014 6,431 4 272 1,142 76 79 1,757 3,665 898 24 6 14,354 2015 6,464 4 283 1,154 77 80 1,788 3,677 917 25 6 14,474 2016 6,542 5 296 1,177 79 80 1,719 3,724 935 25 6 14,587 2017 6,622 5 303 1,201 80 81 1,850 3,775 953 25 6 14,901 2018 6,706 5 317 1,221 82 82 1,882 3,829 970 26 6 15,125 2019 6,784 5 328 1,247 83 83 1,916 3,885 986 26 6 15,349
1,555
15,573 15,794 16,034
0.73%
10.74%
2020 6,868 5 340 1,269 84 84 1,951 3,936 1,003 26 6 2021 6,956 6 351 1,294 86 85 1,982 3,983 1,019 27 6 2022 7,051 6 363 1,320 87 85 2,015 4,038 1,035 27 6
Change (2008-2022) -86 2 140 260 20 11 431 483 287 5 1
Percentage Change -1.20% 58.33% 62.78% 24.53% 30.45% 14.80% 27.21% 13.59% 38.37% 23.16% 23.32%
Annual Growth Rate -0.09% 3.34% 3.54% 1.58% 1.92% 0.99% 1.73% 0.91% 2.35% 1.50% 1.51%
Source: Table 4 in Company data responses to the Commission's 2008 data request for the Ten-Year Plan. Notes: BGE reports reductions in peak demand from 2008 to 2014, due to the utility’s conservation programs. Peak demand (net of DSM measures) then begins to increase in 2015 through 2022. However, 2022 forecasted peak demand (net of DSM measures) is forecasted to be less than 2008 levels for BGE, resulting in a reduction of overall peak demand in the service territory for the 2008 to 2022 time period. Table A-5(c) provides gross peak demand for all utility service territories. The EmPOWER Maryland Energy Efficiency Act of 2008 requires electric companies to provide cost effective demand response programs designed to achieve specific electricity savings and demand reductions for specified year through 2015 A&N did not provide a response to the Commission’s data request.
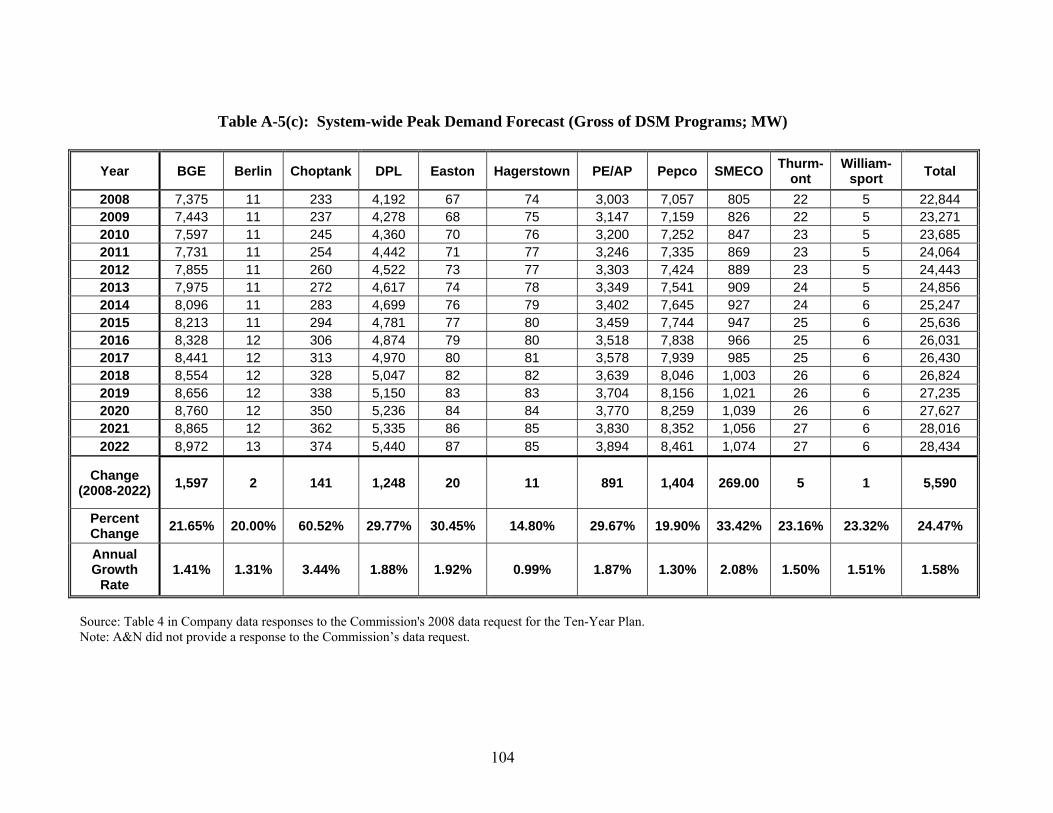
104
Table A-5(c): System-wide Peak Demand Forecast (Gross of DSM Programs; MW)
Year BGE Berlin Choptank DPL Easton Hagerstown PE/AP Pepco SMECO Thurm-ont
William-sport Total
2008 7,375 11 233 4,192 67 74 3,003 7,057 805 22 5 22,844 2009 7,443 11 237 4,278 68 75 3,147 7,159 826 22 5 23,271 2010 7,597 11 245 4,360 70 76 3,200 7,252 847 23 5 23,685 2011 7,731 11 254 4,442 71 77 3,246 7,335 869 23 5 24,064 2012 7,855 11 260 4,522 73 77 3,303 7,424 889 23 5 24,443 2013 7,975 11 272 4,617 74 78 3,349 7,541 909 24 5 24,856 2014 8,096 11 283 4,699 76 79 3,402 7,645 927 24 6 25,247 2015 8,213 11 294 4,781 77 80 3,459 7,744 947 25 6 25,636 2016 8,328 12 306 4,874 79 80 3,518 7,838 966 25 6 26,031 2017 8,441 12 313 4,970 80 81 3,578 7,939 985 25 6 26,430
26,824 2018 8,554 12 328 5,047 82 82 3,639 8,046 1,003 26 6 27,235 2019 8,656 12 338 5,150 83 83 3,704 8,156 1,021 26 6 27,627 2020 8,760 12 350 5,236 84 84 3,770 8,259 1,039 26 6 28,016 28,434
5,590
1.58%
24.47%
2021 8,865 12 362 5,335 86 85 3,830 8,352 1,056 27 6 2022 8,972 13 374 5,440 87 85 3,894 8,461 1,074 27 6
Change (2008-2022) 1,597 2 141 1,248 20 11 891 1,404 269.00 5 1
Percent Change 21.65% 20.00% 60.52% 29.77% 30.45% 14.80% 29.67% 19.90% 33.42% 23.16% 23.32%
Annual Growth
Rate 1.41% 1.31% 3.44% 1.88% 1.92% 0.99% 1.87% 1.30% 2.08% 1.50% 1.51%
Source: Table 4 in Company data responses to the Commission's 2008 data request for the Ten-Year Plan. Note: A&N did not provide a response to the Commission’s data request.
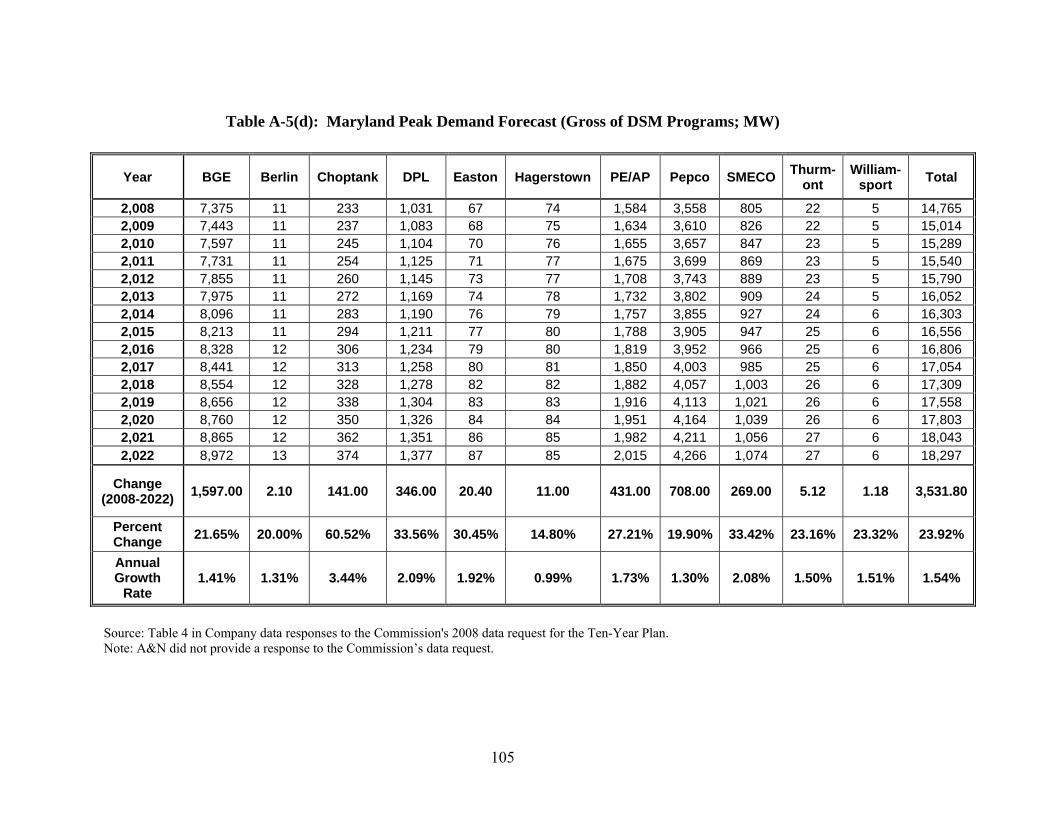
105
Table A-5(d): Maryland Peak Demand Forecast (Gross of DSM Programs; MW)
Year BGE Berlin Choptank DPL Easton Hagerstown PE/AP Pepco SMECO Thurm-ont
William-sport Total
2,008 7,375 11 233 1,031 67 74 1,584 3,558 805 22 5 14,765 2,009 7,443 11 237 1,083 68 75 1,634 3,610 826 22 5 15,014 2,010 7,597 11 245 1,104 70 76 1,655 3,657 847 23 5 15,289 2,011 7,731 11 254 1,125 71 77 1,675 3,699 869 23 5 15,540 2,012 7,855 11 260 1,145 73 77 1,708 3,743 889 23 5 15,790 2,013 7,975 11 272 1,169 74 78 1,732 3,802 909 24 5 16,052 2,014 8,096 11 283 1,190 76 79 1,757 3,855 927 24 6 16,303 2,015 8,213 11 294 1,211 77 80 1,788 3,905 947 25 6 16,556 2,016 8,328 12 306 1,234 79 80 1,819 3,952 966 25 6 16,806 2,017 8,441 12 313 1,258 80 81 1,850 4,003 985 25 6 17,054
17,309 2,018 8,554 12 328 1,278 82 82 1,882 4,057 1,003 26 6 17,558 2,019 8,656 12 338 1,304 83 83 1,916 4,113 1,021 26 6 17,803 2,020 8,760 12 350 1,326 84 84 1,951 4,164 1,039 26 6 18,043 18,297
1.54%
23.92%
2,021 8,865 12 362 1,351 86 85 1,982 4,211 1,056 27 6 2,022 8,972 13 374 1,377 87 85 2,015 4,266 1,074 27 6
Change (2008-2022) 1,597.00 2.10 141.00 346.00 20.40 11.00 431.00 708.00 269.00 5.12 1.18 3,531.80
Percent Change 21.65% 20.00% 60.52% 33.56% 30.45% 14.80% 27.21% 19.90% 33.42% 23.16% 23.32%
Annual Growth
Rate 1.41% 1.31% 3.44% 2.09% 1.92% 0.99% 1.73% 1.30% 2.08% 1.50% 1.51%
Source: Table 4 in Company data responses to the Commission's 2008 data request for the Ten-Year Plan. Note: A&N did not provide a response to the Commission’s data request.
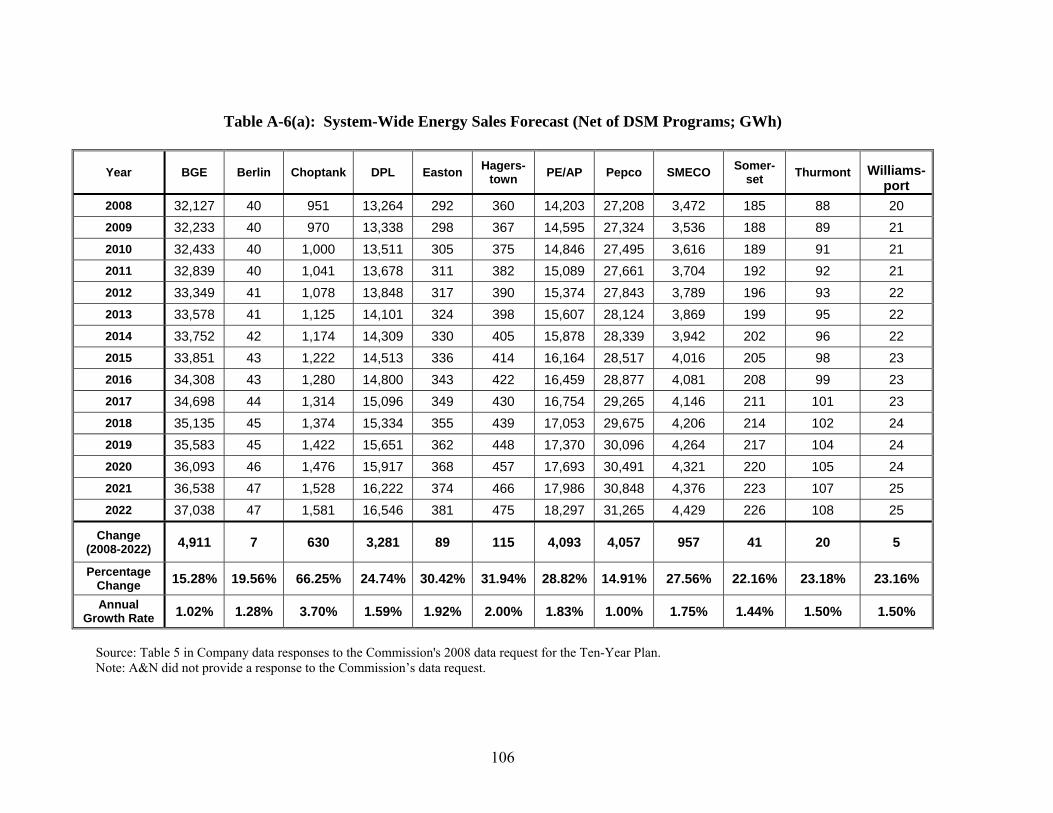
5
23.16%
1.50%
21 21 22 22 22 23 23 23 24 24 24 25 25
20 21
106
Table A-6(a): System-Wide Energy Sales Forecast (Net of DSM Programs; GWh)
Year BGE Berlin Choptank DPL Easton Hagers-town PE/AP Pepco SMECO Somer-
set Thurmont Williams-port
2008 32,127 40 951 13,264 292 360 14,203 27,208 3,472 185 88 2009 32,233 40 970 13,338 298 367 14,595 27,324 3,536 188 89 2010 32,433 40 1,000 13,511 305 375 14,846 27,495 3,616 189 91 2011 32,839 40 1,041 13,678 311 382 15,089 27,661 3,704 192 92 2012 33,349 41 1,078 13,848 317 390 15,374 27,843 3,789 196 93 2013 33,578 41 1,125 14,101 324 398 15,607 28,124 3,869 199 95 2014 33,752 42 1,174 14,309 330 405 15,878 28,339 3,942 202 96 2015 33,851 43 1,222 14,513 336 414 16,164 28,517 4,016 205 98 2016 34,308 43 1,280 14,800 343 422 16,459 28,877 4,081 208 99 2017 34,698 44 1,314 15,096 349 430 16,754 29,265 4,146 211 101 2018 35,135 45 1,374 15,334 355 439 17,053 29,675 4,206 214 102 2019 35,583 45 1,422 15,651 362 448 17,370 30,096 4,264 217 104 2020 36,093 46 1,476 15,917 368 457 17,693 30,491 4,321 220 105 2021 36,538 47 1,528 16,222 374 466 17,986 30,848 4,376 223 107 2022 37,038 47 1,581 16,546 381 475 18,297 31,265 4,429 226 108
Change (2008-2022) 4,911 7 630 3,281 89 115 4,093 4,057 957 41 20
Percentage Change 15.28% 19.56% 66.25% 24.74% 30.42% 31.94% 28.82% 14.91% 27.56% 22.16% 23.18%
Annual Growth Rate 1.02% 1.28% 3.70% 1.59% 1.92% 2.00% 1.83% 1.00% 1.75% 1.44% 1.50%
Source: Table 5 in Company data responses to the Commission's 2008 data request for the Ten-Year Plan. Note: A&N did not provide a response to the Commission’s data request.
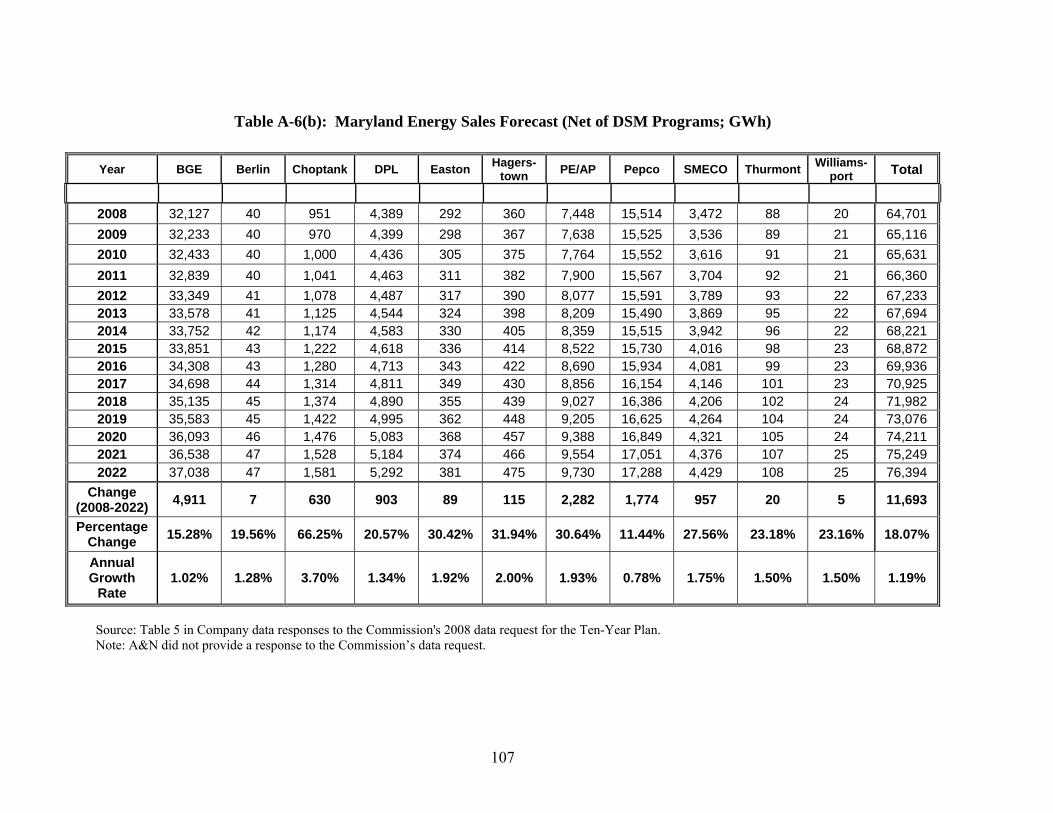
Table A-6(b): Maryland Energy Sales Forecast (Net of DSM Programs; GWh)
Year BGE Berlin Choptank DPL Easton Hagers-town PE/AP Pepco SMECO Thurmont Williams-
port Total
2008 32,127 40 951 4,389 292 360 7,448 15,514 3,472 88 20 64,701 2009 32,233 40 970 4,399 298 367 7,638 15,525 3,536 89 21 65,116 2010 32,433 40 1,000 4,436 305 375 7,764 15,552 3,616 91 21 65,631 2011 32,839 40 1,041 4,463 311 382 7,900 15,567 3,704 92 21 66,360 2012 33,349 41 1,078 4,487 317 390 8,077 15,591 3,789 93 22 67,233 2013 33,578 41 1,125 4,544 324 398 8,209 15,490 3,869 95 22 67,694 2014 33,752 42 1,174 4,583 330 405 8,359 15,515 3,942 96 22 68,221 2015 33,851 43 1,222 4,618 336 414 8,522 15,730 4,016 98 23 68,872 2016 34,308 43 1,280 4,713 343 422 8,690 15,934 4,081 99 23 69,936 2017 34,698 44 1,314 4,811 349 430 8,856 16,154 4,146 101 23 70,925 2018 35,135 45 1,374 4,890 355 439 9,027 16,386 4,206 102 24 71,982 2019 35,583 45 1,422 4,995 362 448 9,205 16,625 4,264 104 24 73,076 2020 36,093 46 1,476 5,083 368 457 9,388 16,849 4,321 105 24 74,211 2021 36,538 47 1,528 5,184 374 466 9,554 17,051 4,376 107 25 75,249 2022 37,038 47 1,581 5,292 381 475 9,730 17,288 4,429 108 25 76,394
Change (2008-2022) 4,911 7 630 903 89 115 2,282 1,774 957 20 5 11,693
Percentage Change 15.28% 19.56% 66.25% 20.57% 30.42% 31.94% 30.64% 11.44% 27.56% 23.18% 23.16% 18.07%
Annual Growth
Rate 1.02% 1.28% 3.70% 1.34% 1.92% 2.00% 1.93% 0.78% 1.75% 1.50% 1.50% 1.19%
Source: Table 5 in Company data responses to the Commission's 2008 data request for the Ten-Year Plan. Note: A&N did not provide a response to the Commission’s data request.
107

Table A-7: Licensed Electric Suppliers and Brokers & Natural Gas Suppliers and Brokers (As of 12/31/2008)
Company Electricity Supplier
License No.
Electricity Broker
License No.
Natural Gas Supplier
License No.
Natural Gas Broker
License No.
Affiliated Power Purchasers, Inc. IR-279 Allegheny Power Purchasers, Inc. IR-229 IR-229 America PowerNet Management IR-604 AOBA Alliance, Inc. IR-267 IR-375 API, INK IR-1399 ARS International, Inc. IR-1181 BGE Home Products and Services d/b/a BGE Commercial Building Systems
IR-228 IR-311
Blue Star Energy Services IR-757 BOC Energy Services IR-753 Bollinger Energy Corporation IR-265 IR-322 BP Energy Company IR-676 BTU Energy IR-864 Choice Energy Services IR-682 Clean Currents, LLC IR-980 Co-eXprise, Inc. IR-879 IR-879 Colonial Energy, Inc. IR-606 Commerce Energy, Inc. IR-639 IR-737 Compass Energy Services IR-652 Competitive Energy Services, MD IR-895 IR-895 ConocoPhillips Company IR-1359 Consolidation Edison Solutions IR-603 Constellation Energy Projects & Services Group IR-239 Constellation New Energy, Inc. IR-500 IR-500 IR-522 IR-522
108
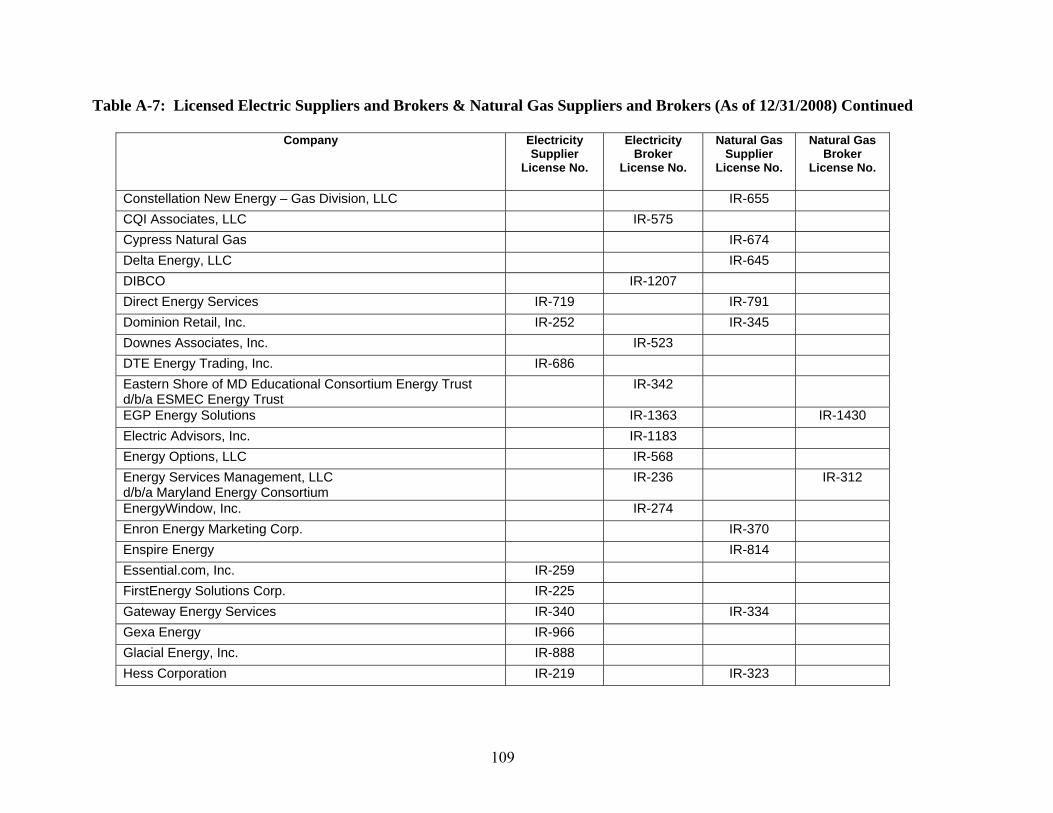
Table A-7: Licensed Electric Suppliers and Brokers & Natural Gas Suppliers and Brokers (As of 12/31/2008) Continued
Company Electricity Supplier
License No.
Electricity Broker
License No.
Natural Gas Supplier
License No.
Natural Gas Broker
License No.
Constellation New Energy – Gas Division, LLC IR-655 CQI Associates, LLC IR-575 Cypress Natural Gas IR-674 Delta Energy, LLC IR-645 DIBCO IR-1207 Direct Energy Services IR-719 IR-791 Dominion Retail, Inc. IR-252 IR-345 Downes Associates, Inc. IR-523 DTE Energy Trading, Inc. IR-686 Eastern Shore of MD Educational Consortium Energy Trust d/b/a ESMEC Energy Trust
IR-342
EGP Energy Solutions IR-1363 IR-1430 Electric Advisors, Inc. IR-1183 Energy Options, LLC IR-568 Energy Services Management, LLC d/b/a Maryland Energy Consortium
IR-236 IR-312
EnergyWindow, Inc. IR-274 Enron Energy Marketing Corp. IR-370 Enspire Energy IR-814 Essential.com, Inc. IR-259 FirstEnergy Solutions Corp. IR-225 Gateway Energy Services IR-340 IR-334 Gexa Energy IR-966 Glacial Energy, Inc. IR-888 Hess Corporation IR-219 IR-323
109

Table A-7: Licensed Electric Suppliers and Brokers & Natural Gas Suppliers and Brokers (As of 12/31/2008) Continued
Company Electricity Supplier
License No.
Electricity Broker
License No.
Natural Gas Supplier
License No.
Natural Gas Broker
License No.
Horizon Power & Light IR-704 Houston Energy Services Company, LLC. IR-403 Hudson Energy Services IR-1114 IR-1120 Integrys Energy Services IR-951 Liberty Power Corporation IR-607 Liberty Power, DE IR-962 Liberty Power Holdings IR-957 Liberty Power, Maryland IR-793 Long Distance Consultants, LLC IR-1455 Marathon Oil Company IR-364 Market Direct d/b/a MD Energy IR-614 MeadWestvaco Energy Services, LLC IR-669 Metromedia Energy, Inc. IR-355 Metromedia Power, Inc. IR-867 MidAmerican Energy Co. IR-798 Mid-Atlantic Aggregation Group Independent Consortium, LLC IR-234 IR-234 Mid-Atlantic Renewables IR-856 Mitchell Energy Management Services IR-1371 Mona Building Technologies, LLC IR-257 MRDB Holdings IR-930 IR-1000 MxEnergy.com, Inc. IR-327 National Energy Consortium IR-928 IR-928 Natures Current IR-1352 IR-1436
110
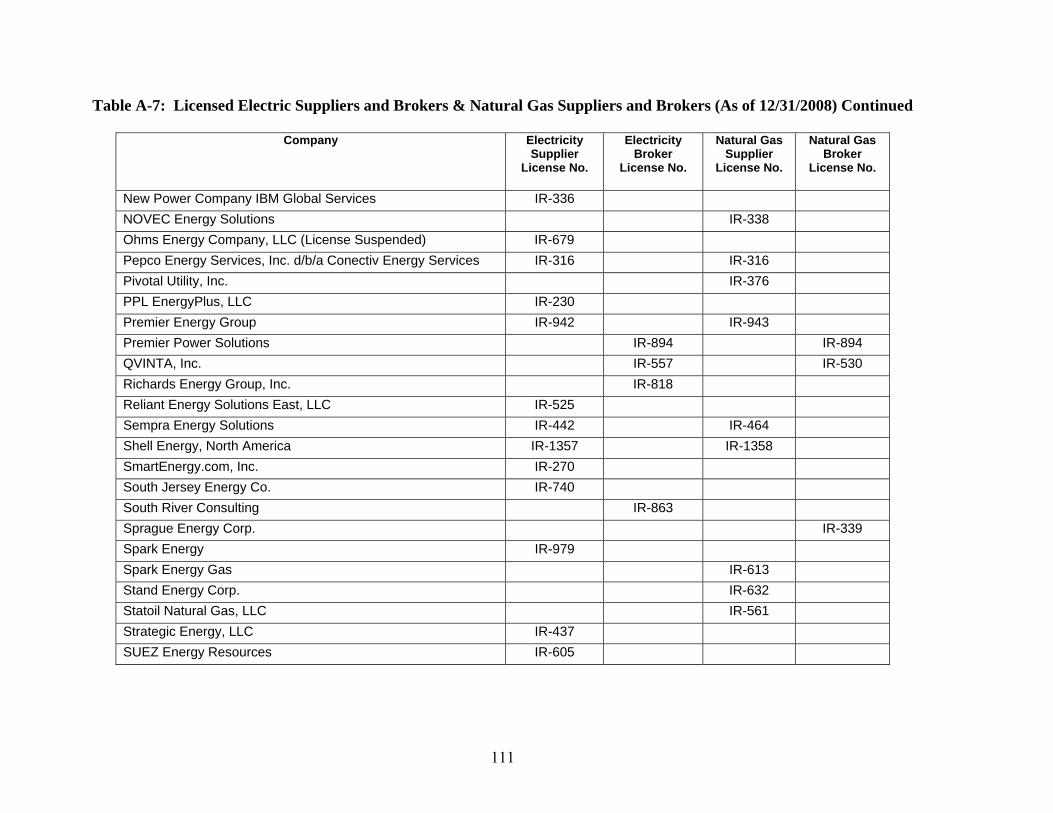
Table A-7: Licensed Electric Suppliers and Brokers & Natural Gas Suppliers and Brokers (As of 12/31/2008) Continued
Company Electricity Supplier
License No.
Electricity Broker
License No.
Natural Gas Supplier
License No.
Natural Gas Broker
License No.
New Power Company IBM Global Services IR-336 NOVEC Energy Solutions IR-338 Ohms Energy Company, LLC (License Suspended) IR-679 Pepco Energy Services, Inc. d/b/a Conectiv Energy Services IR-316 IR-316 Pivotal Utility, Inc. IR-376 PPL EnergyPlus, LLC IR-230 Premier Energy Group IR-942 IR-943 Premier Power Solutions IR-894 IR-894 QVINTA, Inc. IR-557 IR-530 Richards Energy Group, Inc. IR-818 Reliant Energy Solutions East, LLC IR-525 Sempra Energy Solutions IR-442 IR-464 Shell Energy, North America IR-1357 IR-1358 SmartEnergy.com, Inc. IR-270 South Jersey Energy Co. IR-740 South River Consulting IR-863 Sprague Energy Corp. IR-339 Spark Energy IR-979 Spark Energy Gas IR-613 Stand Energy Corp. IR-632 Statoil Natural Gas, LLC IR-561 Strategic Energy, LLC IR-437 SUEZ Energy Resources IR-605
111
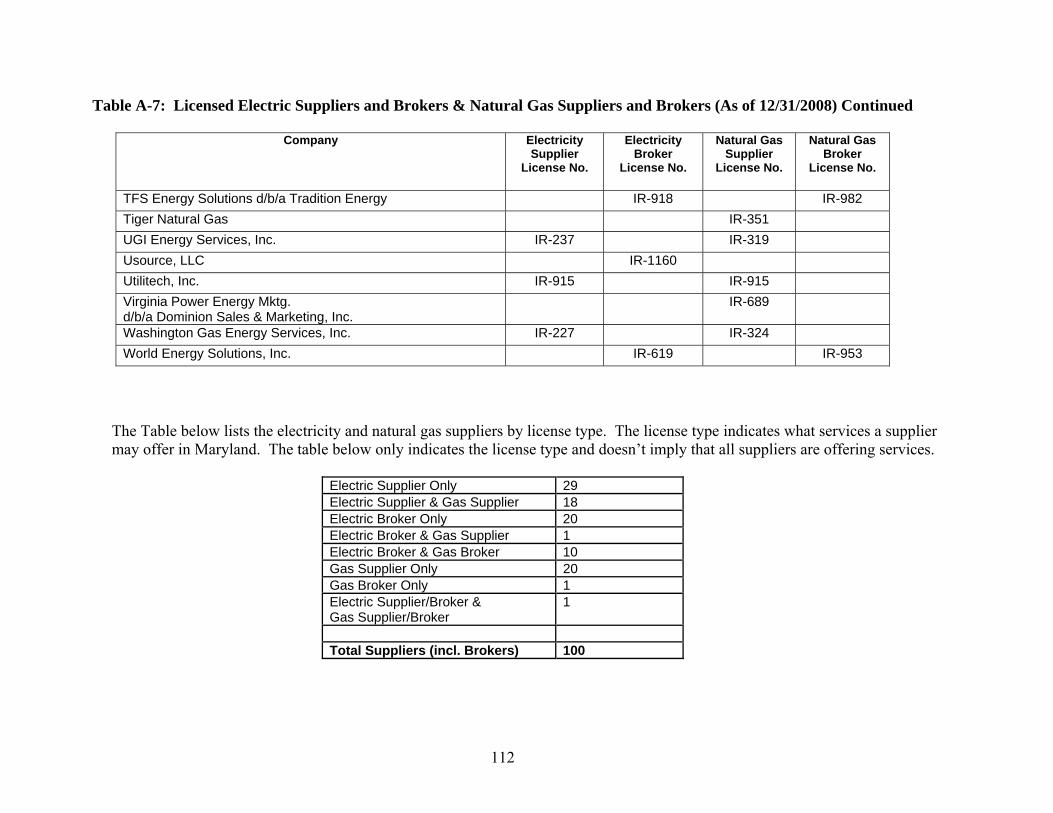
Table A-7: Licensed Electric Suppliers and Brokers & Natural Gas Suppliers and Brokers (As of 12/31/2008) Continued
Company Electricity Supplier
License No.
Electricity Broker
License No.
Natural Gas Supplier
License No.
Natural Gas Broker
License No.
TFS Energy Solutions d/b/a Tradition Energy IR-918 IR-982 Tiger Natural Gas IR-351 UGI Energy Services, Inc. IR-237 IR-319 Usource, LLC IR-1160 Utilitech, Inc. IR-915 IR-915 Virginia Power Energy Mktg. d/b/a Dominion Sales & Marketing, Inc.
IR-689
Washington Gas Energy Services, Inc. IR-227 IR-324 World Energy Solutions, Inc. IR-619 IR-953
The Table below lists the electricity and natural gas suppliers by license type. The license type indicates what services a supplier may offer in Maryland. The table below only indicates the license type and doesn’t imply that all suppliers are offering services.
Electric Supplier Only 29 Electric Supplier & Gas Supplier 18 Electric Broker Only 20 Electric Broker & Gas Supplier 1 Electric Broker & Gas Broker 10 Gas Supplier Only 20 Gas Broker Only 1 Electric Supplier/Broker & Gas Supplier/Broker
1
Total Suppliers (incl. Brokers) 100
112
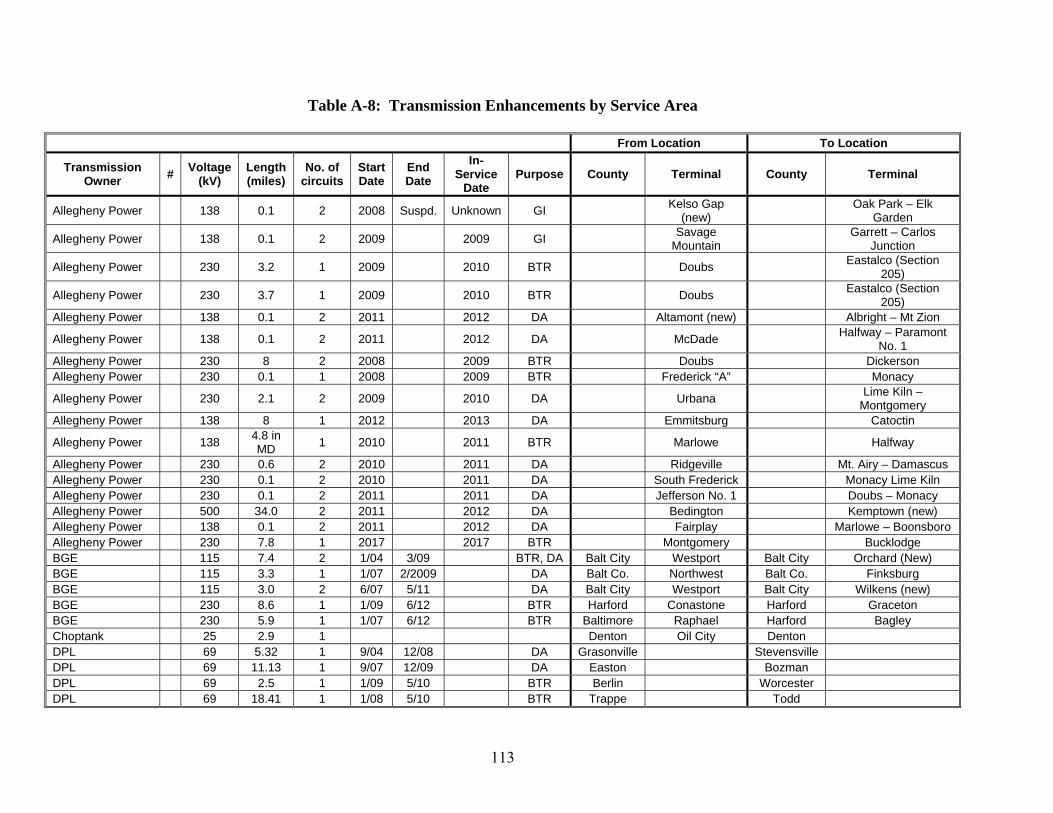
Table A-8: Transmission Enhancements by Service Area
From Location To Location
Transmission Owner # Voltage
(kV) Length (miles)
No. of circuits
Start Date
End Date
In-Service
Date Purpose County Terminal County Terminal
Allegheny Power 138 0.1 2 2008 Suspd. Unknown GI Kelso Gap (new) Oak Park – Elk
Garden
Allegheny Power 138 0.1 2 2009 2009 GI Savage Mountain Garrett – Carlos
Junction Eastalco (Section
205) Allegheny Power 230 3.2 1 2009 2010 BTR Doubs
Eastalco (Section 205) Allegheny Power 230 3.7 1 2009 2010 BTR Doubs
Allegheny Power 138 0.1 2 2011 2012 DA Altamont (new) Albright – Mt Zion Halfway – Paramont
No. 1 Allegheny Power 138 0.1 2 2011 2012 DA McDade
Allegheny Power 230 8 2 2008 2009 BTR Doubs Dickerson Allegheny Power 230 0.1 1 2008 2009 BTR Frederick “A” Monacy
Lime Kiln – Montgomery Allegheny Power 230 2.1 2 2009 2010 DA Urbana
Allegheny Power 138 8 1 2012 2013 DA Emmitsburg Catoctin
Allegheny Power 138 4.8 in MD 1 2010 2011 BTR Marlowe Halfway
Allegheny Power 230 0.6 2 2010 2011 DA Ridgeville Mt. Airy – Damascus Allegheny Power 230 0.1 2 2010 2011 DA South Frederick Monacy Lime Kiln Allegheny Power 230 0.1 2 2011 2011 DA Jefferson No. 1 Doubs – Monacy Allegheny Power 500 34.0 2 2011 2012 DA Bedington Kemptown (new) Allegheny Power 138 0.1 2 2011 2012 DA Fairplay Marlowe – Boonsboro Allegheny Power 230 7.8 1 2017 2017 BTR Montgomery Bucklodge BGE 115 7.4 2 1/04 3/09 BTR, DA Balt City Westport Balt City Orchard (New) BGE 115 3.3 1 1/07 2/2009 DA Balt Co. Northwest Balt Co. Finksburg BGE 115 3.0 2 6/07 5/11 DA Balt City Westport Balt City Wilkens (new) BGE 230 8.6 1 1/09 6/12 BTR Harford Conastone Harford Graceton BGE 230 5.9 1 1/07 6/12 BTR Baltimore Raphael Harford Bagley Choptank 25 2.9 1 Denton Oil City Denton DPL 69 5.32 1 9/04 12/08 DA Grasonville Stevensville DPL 69 11.13 1 9/07 12/09 DA Easton Bozman DPL 69 2.5 1 1/09 5/10 BTR Berlin Worcester DPL 69 18.41 1 1/08 5/10 BTR Trappe Todd
113

Table A-8: Transmission Enhancements by Service Area (Continued) From Location To Location
Transmission Owner # Voltage
(kV) Length (miles)
No. of circuits
Start Date
End Date
In-Service
Date Purpose County Terminal County Terminal
DPL 138 12.98 1 1/10 5/12 BTR Easton Wye Mills DPL 69 12 1 1/09 5/12 DA McCleans Lynch DPL 69 12 1 1/09 5/12 DA McCleans Chestertown DPL 69 4.42 1 1/12 5/13 BTR Vienna Sharptown
DPL 69 2.61 1 1/12 5/13 BTR Ocean Bay Maridel
DPL 138 13.73 1 9/11 5/14 BTR Vienna Nelson DPL 138 24 1 1/11 5/14 BTR Church Wye Mills
DPL 69 2.61 1 1/12 5/13 BTR Ocean Bay Maridel
DPL 500 43 1 1/09 5/13 BTR Calvert Vienna DPL 230 18.7 1 1/10 5/13 BTR Vienna Loretto DPL 230 9.51 1 1/10 5/13 BTR Loretto Piney Grove DPL 500 35 1 1/09 5/13 BTR Vienna Indian River
PEPCO 230 Bus Upgrade 1 1/09 5/10 BTR Burtonsville Sandy Springs
PEPCO 230 10.7 2 1/09 5/11 BTR Dickerson Quince Orchard PEPCO 230 5.34 2 1/09 12/11 BTR Ritchie Benning PEPCO 230 6.42 4 1/09 5/12 BTR Burches Hill Palmers Cornor PEPCO 230 10.13 1 1/13 5/13 BTR Dickerson Quince Orchard PEPCO 500 33 1 1/10 5/13 BTR Possum Point Burches Hill PEPCO 500 19 1 1/10 5/13 BTR Burches Hill Chalk Point PEPCO 500 20 1 1/10 5/13 BTR Chalk Point Calvert Cliffs SMECO 230 20 2 2012 2013 DA Calvert Holland Cliff Sw. St. Calvert So. Calvert Sw. St. SMECO 230 10 2 2014 2015 BTR Calvert So. Calvert Sw. St. St. Mary’s Hewit Road Sw. St.
Purpose Codes: BTR – Baseline transmission reliability GI – Accommodate for generator interconnection DA – Distribution Adequacy TCA – Transmission Customer Adequacy OTH – Other AT – Asset Transfer from Government RLC – Relocation COR – Contingency Overload and/or Reliability
114
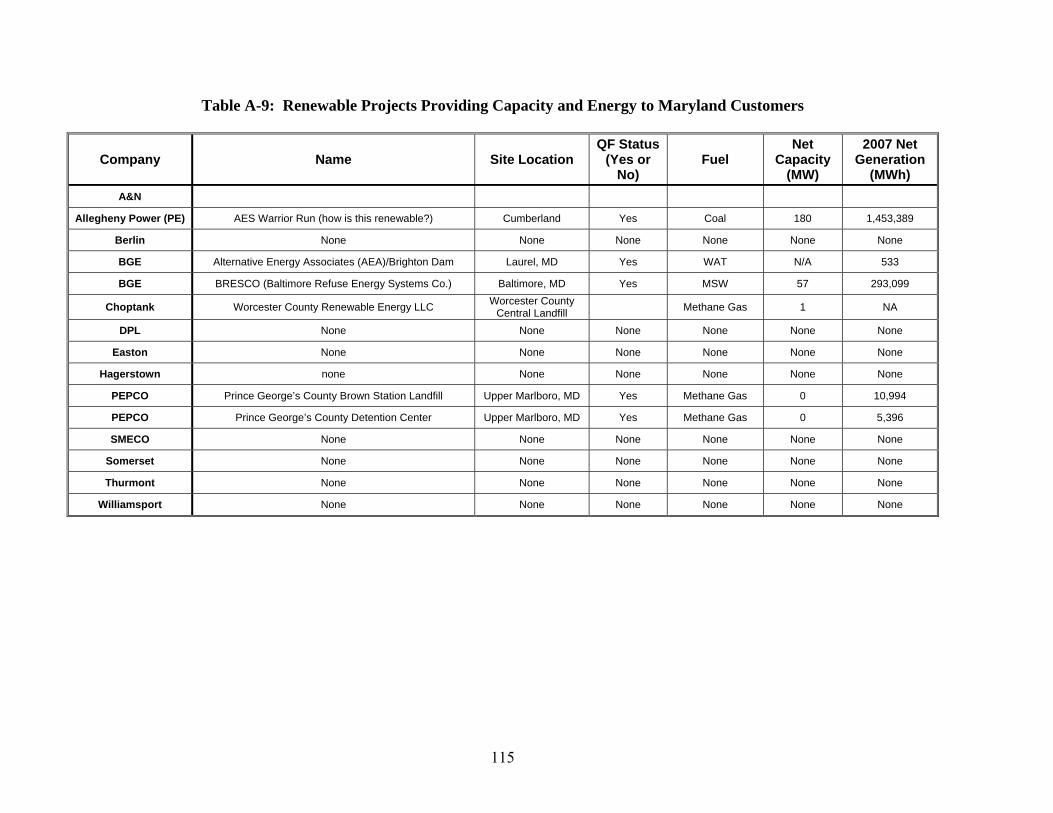
Table A-9: Renewable Projects Providing Capacity and Energy to Maryland Customers
Company Name Site Location QF Status
(Yes or No)
Fuel Net
Capacity (MW)
2007 Net Generation
(MWh) A&N
Allegheny Power (PE) AES Warrior Run (how is this renewable?) Cumberland Yes Coal 180 1,453,389
Berlin None None None None None None
BGE Alternative Energy Associates (AEA)/Brighton Dam Laurel, MD Yes WAT N/A 533
BGE BRESCO (Baltimore Refuse Energy Systems Co.) Baltimore, MD Yes MSW 57 293,099
Choptank Worcester County Renewable Energy LLC Worcester County Central Landfill Methane Gas 1 NA
DPL None None None None None None
Easton None None None None None None
Hagerstown none None None None None None
PEPCO Prince George’s County Brown Station Landfill Upper Marlboro, MD Yes Methane Gas 0 10,994
PEPCO Prince George’s County Detention Center Upper Marlboro, MD Yes Methane Gas 0 5,396
SMECO None None None None None None
Somerset None None None None None None
Thurmont None None None None None None
Williamsport None None None None None None
115

Table A-11: Comparison of Residential Demand Response Programs in Maryland
Issue BGE Pepco Delmarva SMECO
Total Number of Res. Customers approx. 1.1 million approx. 471,000 approx. 171,000 approx. 132,000 Total Eligible Res. Customers 900,000 396,000 91,130 approx. 112,000 Total Expected to Participate 450,000 (50%) 166,000 (42%) 54,000 (59%) 37,000 (33%) Benefit to Cost Ratio 7.0/1.0 3.1 2.9 2.13 B/C ratio TRC/All Ratepayers Test Only TRC/All Ratepayers Test Only non-traditional B/C calculation Net Bill Impact/Non-Participants Initial average Bill decrease Initial average Bill decrease Average Bill increases Initial average Bill increases $0.04 per Month - further $0.38 per Month - further $0.02 per Month in 2011 $0.07 per Month in 2008 Bill decreases thereafter Bill decreases thereafter Bill decreases after 2011 Bill decreases thereafter Net Bill Impact/Participants Initial average Bill decreases Initial average Bill decrease Initial average Bill decreases Initial average Bill decreases $10.46 per month - additional Bill $5.18 per month - additional Bill $4.99 per month $3.80 per month -additional Bill decreases thereafter decreases thereafter decreases thereafter Maximum Surcharge $2.35 / Month $0.81 / month $0.58 / month $2.62 / month Cost/Device Thermostat/Switch $276 Average per device $300 Average per device $300 Average per device NA -- Bundled contract w/Comverge (two-way Communication) (two-way communications) (two-way communications) (two-way communication) Utility Incentives Tiered Structure as Per PSC Tiered Structure as Per PSC Tiered Structure as Per PSC None Requested Letter Order of 12/27/07 Letter Order of 4/18/08 Letter Order of 4/18/08 Load Reduction/Device 1.38 kW 1.23 kW 1.23 kW 1.25 kW Estimated Capacity Savings 605 MW 206 MW 67 MW 50 MW Estimated Direct Energy Savings $42 million $18.3 million $5.7 million $9 million 15-year NPV 15-year NPV 15-year NPV 10-year NPV* Net Savings $965 million $225 million $45 million $24 million 15-year NPV 15-year NPV 15-year NPV 10-year NPV* Proposed Customer Incentives $50/$75/$100 for cycling $40/$60/$80 for cycling $40/$60/$80 for cycling $25 for Direct Load Control Switch options 50%/75%/100% options 50%/75%/100% options 50%/75%/100% $50 for Smart Thermostat
* SMECO's contract with Comverge is for 10 years.
116