ten year outlook wyoming economic forecast: 2003 to …eadiv.state.wy.us/wef/outlook2003.pdf · ten...
TRANSCRIPT

Ten Year Outlook
Wyoming Economic Forecast: 2003 to 2012
Economic Analysis Division Department of Administration and Information
http://eadiv.state.wy.us

Ten Year Outlook Wyoming Economic Forecast: 2003 to 2012
Wyoming Department of Administration and Information Earl Kabeiseman, Director
Economic Analysis Division Buck McVeigh, Administrator
Prepared by: Wenlin Liu, Ph.D.
July 2003
Copyright 2003 by the Wyoming Department of Administration and Information, Economic Analysis Division
Economic Analysis Division 1807 Capitol Ave, Suite 206
Cheyenne, WY 82002 Phone: (307) 777-7504
Fax: (307) 632-1819 Email: [email protected] http://eadiv.state.wy.us

- i -
Contents Page Executive Summary - - - - - - - - - iii National Economic Trends - - - - - - - - 1 Characteristics of Wyoming’s Economy - - - - - - - 3 Wyoming Employment Trend - - - - - - - - 4 Mining Industry - - - - - - - - - 5 Construction - - - - - - - - - - 7 Retail Sales - - - - - - - - - 8 Services - - - - - - - - - - 9 Tourism - - - - - - - - - - 10 Government - - - - - - - - - - 11 Population and Components - - - - - - - - 12 Migration - - - - - - - - - - 14 Age Cohorts - - - - - - - - - - 15 Income and Wages - - - - - - - - - 16

- ii -
Figures and Tables Page Figure 1. Non-Agr Wage and Salary Employment for Wyoming and U.S. - - - 2
Figure 2. Full and Part-Time Employment by Industry: 2000 - - - - 3
Figure 3. State and Local Government Revenue: 2000 - - - - - 3
Figure 4. Non-Agr Wage and Salary Employment by Industry for Wyoming - - 4
Figure 5. Wyoming Mining Employment - - - - - - 5
Figure 6. Wyoming Coal Production and Prices - - - - - - 5
Figure 7. Wyoming Oil Production and Prices - - - - - - 6
Figure 8. Wyoming Natural Gas Production and Prices - - - - - 6
Figure 9. Wyoming Residential Building Permits and Valuation - - - - 7
Figure 10. Single Family House Price Index - - - - - - 7
Figure 11. Wyoming Auto and Non-Auto Taxable Retail Sales - - - - 8
Figure 12. Wyoming Services Employment by Sub-sector - - - - 9
Figure 13. Yellowstone and Grand Teton National Park Visitation - - - 10
Figure 14. Government Employment in Wyoming - - - - - 11
Figure 15. Wyoming Population and Net Migration - - - - - 12
Figure 16. Number of Births and Deaths in Wyoming - - - - - 12
Figure 17. Net Migration between Wyoming and Selected States - - - - 13
Figure 18. Population Distribution by Age - - - - - - 14
Figure 19. Percent Change of Population - - - - - - 14
Figure 20. Median Age for Wyoming and U.S. - - - - - - 15
Figure 21. Wyoming Population Trend by Age: 1970 to 2010 - - - - 15
Figure 22. Per Capita Income for Wyoming and U.S.: 1977 to 2012 - - - 16
Figure 23. Wyoming Average Wage Per Job 1975, 1981, 1987, and 2001 - - - 17
Table 1. National Economic Forecast - - - - - - - 18
Table 2. Non-Agricultural Wage and Salary Employment by Industry - - - 19
Table 3. Population and Demographics - - - - - - - 20
Table 4. Labor Force and Unemployment - - - - - - 20
Table 5. Personal Income and Earnings - - - - - - - 21
Table 6. Wage and Salary Disbursements by Industry - - - - - 22
Table 7. Average Annual Wage per Job by Industry - - - - - 23

- iii -
Executive Summary Since the brief recession in 2001, the U.S. economy has been continuing to shed workers. Total nonfarm payrolls slipped by nearly 20,000 in May 2003, the fourth consecutive month with no job growth. Business spending continues to be quite slow, and many state and local governments are facing financial difficulties. The real Gross Domestic Product (GDP) is probably still growing, but at a very slow pace. However, with many uncertainties resolved, particularly the war with Iraq, oil prices have come down somewhat. Debt and equity markets are strengthening, and consumer confidence is rebounding. The national economy is expected to soon find its footing and gradually pick up speed over the second half of this year and next year, and start to reach long-term average growth by 2005. Wyoming’s economy has been growing steadily since 1987, hardly affected by the national recessions in the early 1990s and 2000s. Due to the nature of the state’s economy such as high mineral production, low manufacturing, and small and sparsely distributed population, the above phenomenon is not surprising. Through the 1990s, Wyoming’s economy added 34,000 jobs, for an annual growth rate of 1.8 percent, slightly higher than the national average of 1.6 percent. Growth was strong in the early years of the decade, slowed in the middle and late 1990s, and then accelerated from 1999 to 2001. The job market has been flat in the first five months of 2003, and is expected to grow only 0.6 percent throughout the year, the slowest pace since Wyoming’s recession in the mid 1980s. The non-farm wage and salary employment will average just 1.0 percent growth over the forecast horizon to a level at 272,050 jobs. The pace is less than that experienced during the state’s recent expansion. Most of the employment growth will be in the non-goods producing sectors. The service sector adds the largest number of jobs, at 1.9 percent annually and retail trade is anticipated to rise about 1.5 percent. As a natural gas and coal-producing state with substantial mineral reserves, Wyoming is well positioned to benefit economically and financially from coal’s rebirth and higher natural gas prices. However, total mining jobs are expected to decrease slightly from the recent peak in 2001 and hold between 18,000 and 19,000 over the forecasting years due to continuing improvement in productivity. Construction is projected to be the strongest goods-producing industry expanding over 1.0 percent per year. Wyoming’s population recorded an annual growth rate of 0.9 percent between decennial census 1990 and 2000. The Cowboy State experienced net inmigration in the early 1990s but net outmigration in late 1990s and early 2000s. Net migration has changed direction again, toward positive, since 2001 with over 2,600 more persons moving into the state than moving out between July 2001 and July 2002. This demographic trend seems to be continuing this year as Wyoming residents choose to stay in the state due to the high unemployment rates in other parts of the country. However, young workers are projected to leave the state again in search of better job markets, as the national and regional economies recover. Therefore, from 2004 on, the average annual net inmigration for the state is only a few hundred. Due to a larger proportion of the baby-boomer generation (born between 1946 and 1962), Wyoming’s population is aging rapidly. In 2000, the median age of 36.2 in the state passed the national average of 35.3. It will be particularly intensified in about ten years as this age cohort reaches retirement, which will create possible labor shortages and increased demand for health and social services. Largely driven by the mining industry, the increase of personal income in the state was one of the fastest in the nation during the past two years. Wyoming’s Per Capita Income (PCI) reached $30,753, close to the nation’s $31,030, in 2002. Total personal income in Wyoming is forecasted to grow 4.6 annually, slightly trailing the national rate of 4.8 percent.

- 1 -
National Economic Trends
The entire global economy has been continuing to struggle recently. Economies ranging from Germany to Japan, to much of Latin and South America are engulfed in recession or extremely slow growth. Severe Acute Respiratory Syndrome (SARS) dealt a powerful blow to growth in Southeast Asia – mostly through domestic consumption and the tourism industry. Looking to the near future, recovery will be uneven. It will be the U.S. economy that will drive conditions in North America and act as a strong influence on Southeast Asia, where SARS effect will be transitory, and dissipate as activity picks up during the second half of the year and the disease is contained. However, the expansion in South America will be tepid, and the economies in Japan and the euro zone may tend to stabilize rather than increase. The astonishing performance of the U.S. economy in the 1990s was probably the best and the longest expansion decade in history. After a brief economic recession in 2001, the U.S. economy appeared to be recovering, but has come to a virtual standstill again. Real Gross Domestic Product (GDP) is barely growing. Employment and industrial production have declined, retail sales are weak, and income gain is moderating. Weak conditions in the manufacturing production, commercial construction, travel, distribution, and investment banking industries have continued. Growing industries are showing in housing, public construction, healthcare, defense, and mortgage banking. Overall, output gains have not been sufficient to generate any net job gains. After losing 1.75 million jobs in 2001, the economy created no jobs last year or the first half of this year. Both unemployment and underemployment are high and continue to rise. The number of unemployed and those who have fallen out of the labor force, but want a job, has risen from 7% to 9% of the total labor force over the past two years. The number of workers with part-time jobs who would prefer full-time jobs has risen by 1 million over the same period to 3% of the labor force. The number of self-employed is also rising rapidly due to the difficulties of obtaining preferred jobs in larger businesses. Regionally, economic recovery remains muted nearly everywhere, from coast to coast. The areas showing expansions are southeast Florida, Arizona, and a handful of smaller western states that benefit from rising commodity prices and stable local tourism. Wyoming’s southern neighbor, Colorado, has witnessed considerable declines recently in its broad telecommunication industry, compounding weaknesses in air transport and electronics manufacturing. The Midwest’s continued cutbacks in manufacturing jobs and lackluster house-price apprecia tion contribute to their weak economic trend. Adding the recent climb of natural gas prices, rising energy bills are taking a toll on the household budget and corporate profits. For consumers, tough job markets during an economic recovery are weighing on spending decisions. As long as business investment and consumer spending do not improve, the U.S. economy will be at risk of unraveling back into recession. Historical experience shows that every recession since World War II except 1960, was preceded by a sizable jump in global oil prices. The recession in 2001 began after oil prices spiked. The good news is that the U.S. is less energy dependent in today’s economy due to a large service and information oriented business sector. Despite the poor current economic data, expectation of recovery is strong. The stock market has rallied, with prices up strongly for cyclical and technology stocks. Business confidence has completely recovered from the effects of Iraqi War. Consumer expectations are sharply improving from a decade-low number in March 2003. In addition, the recent passage of the tax relief bill will provide a much needed boost to the struggling economy. The most important benefit from a current weaker dollar is the U.S. manufacturers, who have been hurt from global competition. Lower corporate bond yields have also ignited to fund renewed expansion.

- 2 -
Overall, the national economy is expected to continue to experience slow growth in 2003 similar to the past year as businesses’ reluctance to invest continues. However, the sources of growth in the coming year may shift significantly. Consumers have been the main drivers behind the economy’s growth, as home sales and mortgage refinancing continues to set new records, and auto sales remain high. Businesses have remained stable. Payrolls and investment spending are no longer falling. Profit margins have stabilized due to strong productivity gains. Computer hardware and software purchased around Y2K are nearing obsolescence and will need replacment. The housing market remained one of the few bright spots in the economy due to low mortgage rates. Potential home buyers may view houses as an attractive investment compared with the turbulent stock market. Household leverage is growing rapidly, resulting in increased financial stress. Both bankruptcy and mortgage foreclosure rates are high. The high volume of home and vehicle purchases in recent years will constrain future sales once the current extraordinarily low interest rates are raised. The U.S. economy is barely skirting a recession at present. There is still a probability that the recovery will fail to rebound and sink back into recession. The high heating and electricity costs for many homes and slow economic growth for businesses can only increase the chance of recession. However, with uncertainty over the war with Iraq lessened and business productivity rises, the national economy is expected to recover at a moderate pace, picking up speed slowly over the second half of the year. Gross Domestic Product (GDP) has increased since fourth quarter 2001 after a brief recession. However, the annual rate of increase slowed down to 1.4 percent in the fourth quarter of 2002, after increasing 4.0 percent in the third quarter. In 2003, the national economy will remain sluggish, and the inflation-adjusted GDP increases 2.3 percent. By 2004, the GDP is expected to return to its long term average growth rate of around 4 percent. The national payroll employment decreased 0.9 percent in 2002, which was the first contraction since 1991. For 2003, we anticipate it to be 131,100 million, an increase of only 0.2 percent. The U.S unemployment rate reached 5.8 percent in 2002, the highest since 1995. It has remained high in recent quarters, and is projected to increase to an annual average rate of 6.0 percent in 2003. The low inflation rate has been extremely stable in the past decade mostly due to increased productivity and inexpensive imports from foreign countries. The Consumer Price Index (CPI) increased only 1.6 percent in 2002, and will increase 2.3 percent in 2003. Regardless the concern, there will be little chance of either price deflation or accelerated inflation in the near future.
'76 '78 '80 '82 '84 '86 '88 '90 '92 '94 '96 '98 '00 '02 '04 '06 '08 '10 '12100
120
140
160
180
200
220
240
260
280
Wyo
min
g E
mp
loym
ent
(in
th
ou
san
ds)
60,000
70,000
80,000
90,000
100,000
110,000
120,000
130,000
140,000
150,000
160,000
U.S
. Em
plo
ymen
t (in th
ou
sand
s)
Wyoming US
Figure 1. Non-Agr Wage and Salary Employment for Wyoming and U.S.(Number of jobs)

- 3 -
Characteristics of Wyoming’s Economy For most economic indicators, Wyoming’s economy does not mirror that of the nation. As a matter of fact, Wyoming is one of the least diversified states in the nation. According to Economy.Com, only 23 percent of employment volatility in the state is due to U.S. fluctuation. Given the fact that Wyoming’s economy relies on commodities to a great scale, the conclusion above is not surprising. In 2000, the employment in the mining industry consisted of 5.8 percent of total state’s employment (ranked #1 in the nation) compared to a mere 0.5 percent for the national average. The proportion of manufacturing jobs in the state is only 4.1 percent, with a concentration in wood product, petroleum refineries, and chemical manufacturing. Nearly 20 percent of payroll employment is with Federal, state, and local government. This proportion was the second highest in the country. The main reason for this is due to the sparsely distributed population. After all, Wyoming is the only state with a population of less than half a million. Its density of 5 persons per square mile is the second lowest in U.S., just higher than Alaska. The employment by industry component does not tell the whole story about the reliance on mining. In terms of Gross State Product (GSP) which measures total value of goods and services produced in the state, mining contributed 24 percent in 2000. Nationwide, The mining industry contribution to the gross domestic product was only 1.4 percent during the same year. Until public finance is reviewed, there is still a lack of complete understanding on the magnitude of Wyoming’s dependence on the mining industry. Of the $638 million state general fund in fiscal year 2002, 18.4 percent was from mineral severance tax; 14.2 percent is interest income from the Permanent Wyoming Mineral Trust Fund (PWMTF); and 5.4 percent is from mining industry sales and use tax collections. In 2001, all
U.S. Wyoming
Figure 2. Full and Part-Time Employment by Industry: 2000
Source: U.S. Bureau of Economic Analysis
TCPU=Transportation, Communication, and Public Utilities
FIRE = Finance, Insurance, and Real Estate
Agr3.1%
Mining0.5%
Construction5.7%
Manufacturing11.4%
TCPU4.9%
W trade4.5%
Retl trade16.3%
FIRE8.1%
Services31.8%
Gov't13.6%
Agr5.5% Mining
5.8%Construction7.6%
Manufacturing4.1%
TCPU5.2%
W trade2.7%
Retl trade17.6%FIRE
7.0%
Services25.3%
Gov't19.2%
Fed Revenue25.1%
Property Tax7.4%
Fees/Charges16.4%Sales Tax
12.9%
Severance Tax7.7%
Min Prod. Prop Tax7.1%
Other Taxes7.2%
Misc.4.3%
Interest11.9% Fed Revenue
18.9%
Property Tax16.2%
Fees/Charges14.5%
Sales Tax14.0%
Personal Inc. Tax13.7%
Corporate Inc. Tax2.3%
Other Taxes10.4%
Misc.5.4%
Interest4.6%
Figure 3. State and Local Government Revenue: 2000
Wyoming All States
Source: U.S. Census Bureau

- 4 -
state and locally assessed property valuation totaled $11.2 billion, of which the mineral production accounted for over 60 percent. Wyoming does not impose individual and corporate income tax, and imposes a low residential property tax. Instead, the mineral industry fills up the revenue gap. According to the analysis from Wyoming Taxpayers Association based on U.S. Census Bureau’s data, Wyoming relies more heavily on Federal revenue than other states. Over $890 million (including $309 million from mineral royalty and lease bonus payment) made up 25 percent of fiscal year (FY) 2000 state and local revenue compared to the 19 percent nationwide. Wyoming public entities obtained over $423 million in interest in FY 2000, or nearly 12 percent of all revenue. Average interest income is only 4.6 percent of revenue for all states. Property taxes are the most important tax in the country, primarily imposed at the local level to fund local functions such as public schools. Different from most other states, the major portion of Wyoming’s property tax is a gross products tax levied on mineral production. This proportion amounted to 7.1 percent of total revenue. Wyoming also imposes a severance tax on mineral production. The $275 million severance taxes for FY 2000 made up 7.7 percent of total state and local revenue. Despite the seemingly small impact the national economy has on Wyoming’s economy, many economic activities are occurring concurrently throughout the country, and they are commonly affected by economic variables such as interest rates, financial markets, and prices. For example, the low interest rates in recent years equally promoted Wyoming’s housing and motor sales. On the other hand, the performance of the national economy has had a direct impact on the state’s economy in various ways. During the national recession of the early 1990s, many people migrated out of California and eastern states into Wyoming, which boosted the states’ population and employment considerably. However, in the second half of the 1990s, that trend was reversed – more people moved out of Wyoming because diverse and high paying jobs could be easily found in other parts of the nation due to the national economic recovery. Wyoming’s Employment Trend Despite the decline in U. S. employment, Wyoming is one of a few states to post positive gains in payroll jobs in 2002, and the labor markets have remained well-insulated from the weak national economy. In fact, Wyoming has not experienced an employment decline since the energy bust of the 1980s. However, the 1.1 percent job growth for 2002 was much slower than the increases experienced from 1999 to 2001, over 2 percent. This slow down was mostly caused by job losses in mining,
Figure 4. Non-Agr Wage and Salary Employment by Industry for Wyoming
TCPU=Transportation, communications, and public utilities
FIRE = Finance, Insurance, and real estate
1975 1977 1979 1981 1983 1985 1987 1989 1991 1993 1995 1997 1999 2001 2003 2005 2007 2009 20110
20
40
60
80
100
120
140
160
180
200
220
240
260
280
0
20
40
60
80
100
120
140
160
180
200
220
240
260
280Government Services FIRERetail TradeWholesale TradeTCPUManufacturing Construction Mining
number of jobs (in thousand)

- 5 -
manufacturing, and retail trade sectors. The second largest sector, services, added the most jobs – 1,500 in 2002. Since Wyoming’s economy is not overly exposed to the industries that are shedding the most jobs nationwide such as information and communications industries, the slowdown is expected to be brief. The state’s manufacturing industry accounts for less than 5 percent of total employment, leaving it less vulnerable to the national manufacturing cycles. For 2003, Wyoming’s economy will grow moderately, but continue to outperform the U.S. and other states in the western region. Starting in 2004, the U.S. economy will subsequently rebound briskly as commodity prices drop and consumer confidence rises, Wyoming’s job growth will be slower than the national average. After it experienced the exceptionally low unemployment rate of below 4 percent in both 2000 and 2001, the 4.2 percent rate shown in 2002 for the state was still well below the national average of 5.8 percent. It is expected to continue to be no greater than 4.5 percent during the forecast period in Wyoming. Wyoming’s near-term outlook is for average growth supported by increased natural gas mining. Although mining jobs are expected to slow to more sustainable levels, the increased demand for the state’s natural resources from national markets will help provide a steady source of mining jobs and revenues for the state. Outside of the mining industry, however, the state’s future prospects will be somewhat limited by a job market that fails to attract high-growth job opportunities. Although migration has recently reversed to a positive trend, many younger workers will be tempted to move to other states with more versatile job opportunities as soon as those economies recover. Mining Industry The mining sector is a significant economic player and also a major revenue player in Wyoming’s recent history. After it experienced the boom in the late 1970s, the following bust in the 1980s, and slow and steady declines in the 1990s, the mining sector has demonstrated strong growth since 2000. In 1981, mining jobs peaked at 38,500, and it consisted of over 17 percent of Wyoming’s total employment. However, by 1999, the number shrank to only 15,900. However, the employment increased a mighty 8.1 percent in 2000, 13.4 percent in 2001, and is holding up well in 2003 as mining prices rebound. The outlook for future revenue and jobs from the state’s mining industry looks strong. Demand for natural gas is expected to increase as rising oil prices may cause more companies to look for cheaper sources of energy. Since the coalbed methane boom that began in the mid-1990s, Rocky Mountain energy producers have been a victim of their
1975 1977 1979 1981 1983 1985 1987 1989 1991 1993 1995 1997 1999 20010
5,000
10,000
15,000
20,000
25,000
30,000
35,000
40,000
0
5,000
10,000
15,000
20,000
25,000
30,000
35,000
40,000
Other Mining Oil and gas extraction Coal mining
Figure 5. Wyoming Mining Employment: 1975 - 2001
Source: Wyoming Department of Employment
1981 1983 1985 1987 1989 1991 1993 1995 1997 1999 200150
100
150
200
250
300
350
400
mill
ion
s o
f sh
ort
ton
s
5.0
6.0
7.0
8.0
9.0
10.0
11.0
12.0
dollars per short ton
Production Price
Figure 6. Wyoming Coal Production and Prices
Source: Wyoming Geological Survey

- 6 -
own success due to over production and low capability of transportation. As a result, a bottleneck effectively trapped much of the gas in the region, thus keeping prices down locally. Indeed, the difference in natural gas prices between the Rockies and national index recently reached a record imbalance of $4.12 per 1,000 cubic feet. Even though the Rockies recent price of $5 is the highest since a sudden spike two years ago, it lags well behind national averages. Pipelines cannot carry enough gas to more lucrative markets in the eastern and western United States, thus costing the state millions of dollars in lost revenues, taxes, and royalties. In anticipation of increased demand of natural gas and low-sulfur coal, Federal regulators approved a $1.5 billion rail line into the Powder River Basin in 2002, making for easier transportation of Wyoming natural resources to Midwest utilities. Wyoming may also benefit from the demise of a proposal to drill for oil in Alaska’s Arctic National Wildlife Refuge. The Bureau of Land Management has identified five mineral rich locations in the Rockies for potential drilling, which includes the Powder River and Green River Basins. Colorado Interstate Gas recently announced that it will build a new pipeline to transport Wyoming natural gas to the Midwest, where there is growing demand for power generation. As a $1.3 billion pipeline expansion shipping natural gas from southwest Wyoming, through Utah and Nevada, into Southern California, the opening of the Kern River expansion recently relieved a constraint and helped to raise the value of Wyoming natural gas by 30 percent. The pipeline has the capacity to deliver 1.7 billion cubic feet of gas a day. In addition, the natural gas in the Pinedale anti-cline represents a world class gas field, and Shell Rocky spends hundreds of millions of dollars on the project. Much of the fluctuation in mining jobs was in oil and gas extraction due to the boom and bust of oil and natural gas prices. Despite the gradual coal price declines and tremendous production boost (more than tripled in the past 20 years), the employment directly associated with coal mining decreased in the 1980s, but was very stable in the 1990s around 4,700 jobs. For the forecasting years, the mining jobs will remain flat because the productivity is expected to continue to rise. Any job gains in the mining industry will have to be from the oil and gas sub-sector. Oil production in the state has been suffering a steady decline since 1985, mostly due to lower prices. The cost of drilling in Wyoming is too high for oil companies to make a profit. Despite the price recovery of near and
1981 1983 1985 1987 1989 1991 1993 1995 1997 1999 200140
50
60
70
80
90
100
110
120
130
140
mill
ions
of b
arre
ls
5
10
15
20
25
30
do
llars per b
arrel
Production Price
Figure 7. Wyoming Oil Production and Prices
Source: Wyoming Geo;ogical Survey
1981 1983 1985 1987 1989 1991 1993 1995 1997 1999 2001200
400
600
800
1,000
1,200
1,400
1,600
bill
ion
s o
f cu
bic
feet
0.0
1.0
2.0
3.0
4.0
5.0
6.0
7.0
do
llars per M
CF
Production Price
Figure 8. Wyoming Natural Gas Production and Prices
Source: Wyoming Geological Survey

- 7 -
above $20 per barrel in 1991, 1996, and again since 2000, oil production failed to increase or even stabilize. Instead, it continued the downward trend. The only contributor to the change of employment in the mining sector is the natural gas industry. In terms of finance, Wyoming is one of few states in the nation without deficit woes in recent fiscal periods, thanks to the revenue boost from the mining industry. In fact, Wyoming’s mineral severance tax revenue from natural gas peaked to nearly $267 million in fiscal year 2001 as production boomed, more than triple the amount in fiscal year 1999. However, the revenue collections came down as fast as it went up in fiscal year 2002 as prices dropped. With natural gas prices projected to remain high, and thus increase of production, the overall mining employment will hold to approximately 19,000 in the near future, and slowly reduce to around 18,000 by 2012. The state benefits from increased mining activity in many ways. First, increased demand for oil, natural gas, and coal means increased mineral production revenue and sales and use tax collections for both state and local governments. In addition, increased demand for mining employment trickles down the economy through increased per capita income and therefore increased levels of consumer spending. This is because mining job salaries are over twice as much as average for all industries. On the other hand, the state’s economy and revenue also fluctuate violently along with the rise and fall of mining prices. Construction Nationally, the construction, real estate and housing industries are among the few economic engines that have demonstrated any signs of growth over the past year. As the fastest growing sector in the 1990s, the construction industry in Wyoming added 7,100 jobs, and recorded a staggering annual average of 5.2 percent. Again for 2002, construction remains the strongest industry in the state, expanding by 3.2 percent due to historically low interest rates. The substantial job growth in the general building and specialty trades sub-sectors is directly caused by the residential construction boom. From 1992 to 2002, residential home permits averaged nearly 1,800 units per year, compared to an annual range of 500 to 800 units during the period of 1987 to 1991. Meanwhile, Wyoming’s home price is getting stronger after a slow pace in the second half of the 1990s. The 6.7 percent home price appreciation between 2001 and 2002 was close to the national average of 7.2 percent, and was one of the highest in the western U.S. The state’s strong personal income growth in the past several years has certainly contributed
1985 19861987 1988 19891990 19911992 19931994 19951996 19971998 19992000 200120020
400
800
1,200
1,600
2,000
2,400
2,800
num
ber
of u
nits
$0
$50
$100
$150
$200
$250
$300
$350
millio
ns o
f do
llars
Units Valuation
Figure 9. WY Residential Building Permits and Valuation
Source: U.S. Census Bureau
19851986 1987198819891990 1991199219931994 199519961997 1998199920002001 20020
20
40
60
80
100
120
140
160
180
200
220
240
260
280
300
0
20
40
60
80
100
120
140
160
180
200
220
240
260
280
300
U.S. Wyoming
Figure 10. Single Family House Price Index (1980 = 100)
Source: Office of Federal Housing Enterprise Oversight

- 8 -
to housing price increases. The employment boost from residential construction helped to offset the weakness in infrastructure and nonresidential building. Record-low mortgage rates continue to drive permit purchasing activities in Wyoming. The number of residential permits recorded in April 2003, 293, was the highest monthly number since Wyoming’s recession in the 1980s. Positive net migration trends and record low interest rates have increased the demand for housing and prompted homebuilders to boost the stock of housing in response. Despite the healthy home price appreciation, housing remains one of the region’s most affordable, which has also helped attract and keep Wyoming residents. Thus far, there are no indications that the housing market is oversupplied, allowing it to continue as a strong driver for the state’s economy. However, the lack of pent-up demand for housing combined with the negative wealth effect of a falling stock market are expected to weaken the demand for housing in the coming year and slow the rate of house price increases. The current extremely low mortgage rate will be raised as soon as the economy starts to recover. In addition, due to the tremendous amount of new homes put into place during the past 10 years, and the slow increase of households, new permits for the forecasting period will fall to an average of 1,600 per year. Despite the general malaise of the commercial construction industry, there are a few plans for large scale construction projects. Besides the potential railroad line and natural gas pipeline construction, at least one prison facility is expected to be constructed in the next few years. Other possible projects include a new coal-fired power plant and miscellaneous school maintenance. Overall, the job growth in the construction industry is expected to continue, albeit at a slower rate of less than 2 percent annually. Total employment in construction will surpass the mining industry for the first time in 2005, and 2,150 new jobs are expected be created by 2012. Retail Sales As the third largest sector in Wyoming’s economy, the retail trade industry experienced fast job growth in the first half of the 1990s, averaging over 3 percent each year. However, it has slowed down to only 1 percent annually since then, largely due to out migration from the state. In fact, the retail trade industry lost 200 jobs in 2002, which was the first decline since 1987. There has been a fierce battle nationally for retail market share resulting in numerous closures, consolidations and bankruptcies by struggling retailers while others expand rapidly to seize market share. Likewise the Wyoming retail industry has been turbulent too. For instance in the Cheyenne area, Lowe’s opened both a retail store and a distribution center in 2002. The Sierra Trading Post, a mail order store, continued to expand its presence. However, one Burger King and an Albertson’s franchise were recently closed.
FY91 FY92 FY93 FY94 FY95 FY96 FY97 FY98 FY99 FY00 FY01 FY02$0
$500
$1,000
$1,500
$2,000
$2,500
$3,000
$3,500
$4,000
$4,500
$5,000
$0
$500
$1,000
$1,500
$2,000
$2,500
$3,000
$3,500
$4,000
$4,500
$5,000
Auto SalesNon-Auto Retail Sales
Figure 11. Wyoming Auto and Non-Auto Taxable Retail Sales
(in millions of dollar)

- 9 -
The effect from the zero percent financing offered from automobile manufactures immediately after the 9/11 tragedy, is fading after the 2001 peak. It appears that consumers who would have bought a new vehicle in early 2001 had already purchased one. Between job uncertainty and absence of highly appealing special offers, new car sales fell off significantly. High energy prices are definitely picking consumers’ pocket from spending on other goods. This decline in consumer expectations is reflected in the retail sales data. The non-auto taxable retail sales were up 3.3 percent in fiscal year 2001 and 3.4 percent in fiscal year 2002 respectively, in comparison to the previous year. For the first eleven months of fiscal year 2003 (July 2002 to May 2003), the taxable retail sales were up only 1.9 percent from the same period in fiscal year 2002, while the average increase rate for the fiscal year 1991 to 2000 period was 7.3 percent. The increase in automobile sales in the state has almost come to a virtual stall since late 2001. The fiscal 2003 year-to-date sales were nearly 5 percent lower than the same period in the previous fiscal year, while the annual increases were 16.1 percent and 9.7 percent for FY 2001 and FY 2002 respectively. Recently, the retail trade industry in Wyoming has behaved in a similar fashion with the national trend - dragging by the low consumer confidence and job anxiety. The retail trade jobs are projected to continue growing at a rate slightly faster than the overall economy. By 2012, employment is forecasted to reach 54,040, an annual growth rate of 1.3 percent. Services Similar to the nation, the service industry grew continually in the state, even during the 1980s recession. The upward pace accelerated in the 1990s, at an annual rate of 3.7 percent. Despite the slow down of the economy, service industry employment still increased 2.6 percent in 2002 to 59,200 total jobs. Business services grew the fastest, and the number of jobs in 2001 more than doubled the 1990 level. The main factor behind the boom was the rise of information technology in the 1990s, including computer programming, system design, data processing, and other computer related services. The fast increase in services such as consumer credit reporting agencies, and adjustment and collection agencies also contributed to the expansion of business services. Social services, and engineering, accounting and management services also increased significantly, at 87.5 and 77.3 percent, respectively during the same period. The health care industry, with 11,500 jobs in 2001, is the largest sub-sector, and it grew nearly 43 percent. This industry is largely unaffected by a downturn in the larger economy and an aging population will almost ensure continued demand for it. Both social and health service industries will continue to face increased shortages of professional staff along with demands of an aging population.
1990 1991 1992 1993 1994 1995 1996 1997 1998 1999 2000 20010
5
10
15
20
25
30
35
40
45
50
55
60
Nu
mb
er o
f jo
bs
(in
th
ou
san
ds)
0
5
10
15
20
25
30
35
40
45
50
55
60
Other Services*Engineer. & Mgnt ServicesMembership Org.Social ServicesHealth ServicesAuto. & Misc. RepairBusiness ServicesPersonal ServicesHotels & Lodging Places
Figure 12. Wyoming Services Employment by Sub-Sector
Source: Wyoming Department of Employment
* Other Services include Amusement, Legal, Educational, Private Households, and Other Miscellaneous Services such as authors, lectures, and weather forecasters.

- 10 -
Wyoming’s population is to age more rapidly than the U.S. as a whole. Governments need to be prepared financially for the coming years because health care needs for the elderly population is more costly than for the younger persons. The service sector is forecasted to be the fastest growing industry, both in terms of growth rate and total number of new jobs. It is expected to overtake the government sector to become the largest industrial sector by 2008. All sub-sectors within the service sector are projected to increase with business, social, and health services as the main drivers. Despite the structural difference between Wyoming’s and the national economies, the growing pace in the service industry is similar for both. The service industry was and will be the fastest growing sector in the national economy as it continues to undergo a structural shift from a goods producing to a service producing economy. The service sector in Wyoming is expected to add 11,030 jobs in the next 10 years, and this will be 46 percent of total new jobs created in the state. It is the only sector with a projected annual growth rate of close to 2 percent. Tourism Wyoming’s over $1 billion travel and tourism industry is an important part of the overall economy, particularly for the Northwest Region of the state. The primary attractions to tourists are the world’s oldest national park, Yellowstone National Park, and the scenic Grand Teton National Park. Each year, millions of people from all over the world visit these areas. However, tourism itself is not classified as an independent or separate economic sector. Instead, its economic effect crosses many Retail Trade and Services related sub-sectors such as Restaurant, and Hotel and Lodging. Unfortunately, most jobs directly connected with tourism are lower paying occupations by nature. For fiscal year 2002, out of county residents, i.e. travelers accounted for over two thirds of the $546 million taxable sales transaction occurring inside Teton County. The lodging sales alone in Teton County totaled $79 million in fiscal year 1995. The lodging tax has since been revoked. Looking at the trend for the past 20 years, except a few years of solid increases immediately before and after the big forest fire in 1988, the total number of visitations to Yellowstone Park has been quite stagnant, steadily hovering around 3 million for the past decade. In contrast, the total national population grew rather fast at an annual rate of 1.2 percent during the same 10 year period. Note: the lower shift of visitation in Grand Teton Park from 1983 to 1992 was purely caused by the change of statistical gathering procedures. Given the fact that most visitors to Wyoming’s national parks are not via air, the effect from 9/11 was much less severe compared to other states. The lodging tax collections in Park County still managed a 0.4 percent increase between July 2001 and June 2002, and has recovered well as evidenced by the nearly 10 percent increase during the period of July 2002-May 2003 compared with a year earlier. The number of Yellowstone Park visitors also increased from 2.8 million in 2001
1979 1981 1983 1985 1987 1989 1991 1993 1995 1997 1999 20010
0.4
0.8
1.2
1.6
2
2.4
2.8
3.2
3.6
mill
ion
s o
f p
erso
ns
0
0.4
0.8
1.2
1.6
2
2.4
2.8
3.2
3.6
Yellowstone Teton
Figure 13. Yellowstone and Grand Teton National Park Visitation
Source: National Park Service

- 11 -
to approximately 3 million in 2002. Despite the concerns that the uncertain geopolitical environment would stifle tourism activity at national parks, there is no significant difference in the number of reservations at Grand Teton and Yellowstone from last year, thus promising the state valuable tourism dollars. In addition, the end of the war in Iraq has also helped bring down gasoline prices, a vital component to national park travel in Wyoming. Looking into the future, travel and tourism for Wyoming may not deviate significantly from the past trend of an extremely slow increase. However, there are at least a few factors which could provide an advantage to the state’s tourism industry. First, the 9/11 event may shift preferences for Americans’ leisure activities. People may choose to allocate more of their vacation time and income to scenery related trips. Secondly, the baby-boom generation (born between 1946 and 1962) is starting to retire or will retire in just a few years, and the elderly population probably is more interested in natural amenities than the younger persons. Finally, if residents in Teton County elect to pass the lodging tax imposition again, the local government would be able to have the financial flexibility for extra travel promotions and tourism related facility maintenances to compete for potential travelers. However, the jobs created in the tourism industry are mostly seasonal, and low-paying, offering little in the way of long-term growth for the state. Government As the largest employment sector for Wyoming, government jobs are one of the mainstays in the state’s economy, particularly in the Southeast region. It also serves as a big stabilizer to the overall economy. During Wyoming’s economic bust period of 1980s, government employment only experienced a one year decline in 1986, while the state’s total employment suffered 18 percent contraction from 1981 to 1987. Due to the nature of a sparsely distributed population, state and local governments have to hire a relatively large number of employees to serve the residents, from public schools, fire districts, to road maintenance. It is not surprising to see the rate of Wyoming’s state and local government full-time employees was the highest in the country in 2001, at 819 per 10,000 population, while the national average was 539 employees. Other states with higher state/local government employee rates were also states with large land areas and low population such as Alaska, New Mexico, and Nebraska. The lower rates of government employees are in states with high population density such as Pennsylvania and Florida. The government sector contributed 62,600 jobs in 2002 to Wyoming’s economy. However, it was one of the slowest growing industries in recent years and will remain so in the near future. From 1990 to 2002, the government sector in Wyoming created 7,300 jobs for an annual growth rate of 1 percent, compared with the 1.9 percent for the state as a whole. Nearly 90 percent of the new jobs added were in local government, which includes K-12 education and hospitals. State government experienced only a slight increase while Federal government recorded a minor decline during the same period.
1980 1982 1984 1986 1988 1990 1992 1994 1996 1998 2000 20020
5
10
15
20
25
30
35
40
45
50
55
60
65
70
thou
sand
s of
jobs
0
5
10
15
20
25
30
35
40
45
50
55
60
65
70
Local State Federal
Figure 14. Government Employment in Wyoming
Source: Wyoming Department of Employment

- 12 -
Over the forecast period, the government sector is expected to add 3,600 new jobs, for a total of 66,060 jobs in 2012. Most of the growth is projected to occur in local government, with similar slow growth rates for Federal and state government. Population and Components Population change is a function of three processes referred to as the demographic processes. These are births, deaths, and migration B involving births into a population, deaths from a population, and migration either into or out of a population. It is of vital importance to understand the sources of population change because the determinants of the processes of natural increase (combined effects of births and deaths) and migration are quite different. Both births and deaths are physiological and biological processes. Migration is a behavior involving people moving from one area to another often as a result of processes in employment, income, and other socioeconomic changes. Although deaths and births impact a population by decreasing or increasing its size, their effects on other nondemographic and socioeconomic factors are usually long-term. Migration, on the other hand, has a more immediate impact on an area. It is more likely to involve young adults in their family formation ages, reducing demands for products and services in areas with net outmigration and creating instant demands for goods and services necessary to establish a residence in areas with patterns of net inmigration. From 1990 to 2000, Wyoming=s total population increased 8.9 percent in comparison to the national increase of 13.2 percent. Slow and steady population growth is expected throughout the 10 year forecast
1970 1972 1974 1976 1978 1980 1982 1984 1986 1988 1990 1992 1994 1996 1998 20000
1,000
2,000
3,000
4,000
5,000
6,000
7,000
8,000
9,000
10,000
11,000
12,000
Births Deaths
Figure 16. Number of Births and Deaths in Wyoming: 1970 to 2001
Source: Wyoming Department of Health
1976 1978 1980 1982 1984 1986 1988 1990 1992 1994 1996 1998 2000 2002 2004 2006 2008 2010 2012300,000
325,000
350,000
375,000
400,000
425,000
450,000
475,000
500,000
525,000
550,000
Po
pu
lati
on
-30,000
-25,000
-20,000
-15,000
-10,000
-5,000
0
5,000
10,000
15,000
20,000
Net M
igration
Population Net Migration
Wyoming Population and Net Migration: 1976-2012
(net migration = inmigration - outmigration)

- 13 -
period. Total population in Wyoming is projected to increase 5,000 persons this year, and around 2,000 per year with an annual growth rate of approximately 0.5 percent thereafter. The number of residents in the state is expected to surpass half a million in 2003, reaching nearly 523,500 by 2012. Figure 17. Net Migration Between Wyoming and Selected States: 1991- 2002
Source: U.S. Internal Revenue Services The number of births in Wyoming steadily declined throughout the 1990s, from 6,974 in 1990 to 6,254 in 2000. However, death numbers climbed during the 10 year period. The lowest death number was recorded in 1991, at 3,152, and the highest level totaled 4,038 in 1999. It was the first time that the death occurrences in Wyoming passed 4,000. As a result, the net gain in population from this natural change
-700
-600
-500
-400
-300
-200
-100
0
100
91/92 92/93 93/94 94/95 95/96 96/97 97/98 98/99 99/00 00/01 01/02
Arizona
0
500
1000
1500
2000
91/92 92/93 93/94 94/95 95/96 96/97 97/98 98/99 99/00 00/01 01/02
California
-1000
-800
-600
-400
-200
0
200
91/92 92/93 93/94 94/95 95/96 96/97 97/98 98/99 99/00 00/01 01/02
Colorado
-350
-300
-250
-200
-150
-100
-50
0
91/92 92/93 93/94 94/95 95/96 96/97 97/98 98/99 99/00 00/01 01/02
Idaho
-100
-50
0
50
100
150
200
91/92 92/93 93/94 94/95 95/96 96/97 97/98 98/99 99/00 00/01 01/02
North Dakota
-500
-400
-300
-200
-100
0
100
200
300
91/92 92/93 93/94 94/95 95/96 96/97 97/98 98/99 99/00 00/01 01/02
Texas
-300
-200
-100
0
100
200
300
91/92 92/93 93/94 94/95 95/96 96/97 97/98 98/99 99/00 00/01 01/02
Utah
-400
-300
-200
-100
0
100
200
300
91/92 92/93 93/94 94/95 95/96 96/97 97/98 98/99 99/00 00/01 01/02
Nevada

- 14 -
declined to around 2,000 in recent years from the level of 3,780 in 1990. During the forecasting period, births are expected to remain relatively steady around 6,200, while death numbers will slowly increase to nearly 4,800 by 2012. Migration Both in-migration and out-migration numbers in recent years were between 20,000 and 25,000 annually for the state. In the early 1990s, the national economy was performing poorly, as was the economy in California, due partially to the cut backs in the defense industry. Thus, many Californians relocated into neighboring states and in the Rocky Mountain region. As a result, the population in Wyoming grew more than 1 percent each year from 1991 to 1995. The annual net in -migration exceeded 4,000 persons during these years. However, as the overall national economy, and the economy in California, became stronger, the number of Californian out-migrants diminished. Net in-migration (in-migration minus out- migration) to Wyoming from California amounted to only 111 persons during the period of 1996-97, and it has not passed 500 since then, compared to the 1993-94 level of 1,820. The Cowboy State has been experiencing net out-migration since 1995, increasing to over 2,000 in the late 1990s. These out-migrants mainly moved to western states (Colorado, Utah, Idaho, Arizona, and Texas) whose economies grew faster than Wyoming’s. Consequently, the growth of total population in the state from 1995 to 2000 averaged less than 0.25 percent annually, which was attributed to natural increases. As Wyoming’s economy has been growing faster in recent years than in the late 1990s, and both the national and regional economies have been growing slowly, the net migration to Wyoming is reversed to positive again since 2002. However, many younger residents will migrate out of the state again as soon as the national and
-30 -20 -10 0 10 20 30 40 50 60 70
< 5
5-910-14
15-1920-24
25-2930-34
35-3940-44
45-4950-5455-59
60-6465-69
70-7475-79
80-8485 &over
Median age
Total
U.S Wyoming
Figure 19. Percent Change of Population by Age: 1990 to 2000
Source: U.S. Census Bureau
85&+
80-84
75-79
70-74
65-69
60-64
55-59
50-54
45-49
40-44
35-39
30-34
25-29
20-24
15-19
10-14
5-9
< 5
85&+
80-84
75-79
70-74
65-69
60-64
55-59
50-54
45-49
40-44
35-39
30-34
25-29
20-24
15-19
10-14
5-9
< 5
9 8 7 6 5 4 3 2 1 0 1 2 3 4 5 6 7 8 9
W Y US
1990 Census 2000 Census
Figure 18. Population Distribution by Age Group: %
Source: U.S. Census Bureau

- 15 -
regional economies recover. Net migration is forecasted to be not much higher than zero. This means that the number of people moving into the state is only slightly higher than the number of people moving out of the state. The net inmigration level will not surpass 1,000 until the end of the forecasting period. Age Cohorts The age composition of a population affects many other characteristics, from fertility rates to the nature of the demand for goods and services. Age is often measured by the use of simple percentage distributions and the median years of age. During the period from 1990 to 2000, the median age in Wyoming increased so rapidly that the value of 36.2 in 2000 was nearly one year older than the U.S. median age of 35.3. However, the state’s median age of 32.1 was below the national average of 32.9 in 1990. The state has experienced a substantial decrease in juvenile population. The population of persons less than 15 years of age dropped nearly 10 percent, compared to the nationa l figure which increased by 12.5 percent. However, the state’s population between 15 and 24 years of age jumped over 20 percent, while it rose only 6.6 percent for the U.S. The Wyoming=s median aged cohort (age 30-39) showed tremendous shrinkage of 19 percent between the two decennial census periods. For all 5-year incremental age groups, population 45 years and on, the population grew faster in the state with an overall increase rate of 37.6 percent compared to the nation’s 24.9 percent. Throughout the forecast period, the pre-school population (age 0-4) is expected to grow at 0.5 percent annually, though the rate of increase will be fading all the way out to 2012. The 5-19 year age group has declined since 1996, resulting in the continuous drop of K-12 school enrollments in the state, from the 1996 level of 98,777 to 87,897 in 2001. This decline in school age population is projected to continue through 2008, stabilizing at 111,270 by 2012. Both the young adult group (age 20-24) and the main labor force participating cohort (age 25-44) are expected to decline by approximately 2,200 and 1,800 persons, respectively, for the next 10 years. The older aged working group (age 45-64) and retired group (age 65 and over) are projected to continue to increase rapidly at an annual rate of 1.0 and 2.3 percent, respectively, during the forecast period. By 2012, the proportion of persons aging 65 and over will reach 14.3 percent, from the 11.7 percent level in 2000. The examination of the forecast data suggests that growth rates in the labor force will slow substantially in the coming years with rates of growth among middle-aged workers exceeding those for younger workers if significant net inmigration to the state does not occur.
1950 1960 1970 1980 1990 2000 201020
24
28
32
36
40
20
24
28
32
36
40
U.S. Wyoming
Figure 20. Median Age
Source: U.S. Census Bureau and Wyoming Economic Analysis Division
Figure 21. Wyoming Population by Age Group
0
100,000
200,000
300,000
400,000
500,000
600,000
1970 1980 1990 2000 2010
65 & over
45 - 64
25 - 44
18 - 24
< 18

- 16 -
The continued aging of both the state and national population is evident, though it will be more severe for the state because the proportion of the baby-boomer population (age 40-54) was larger in Wyoming (23.6%) than the nation (21.4%) in 2000. For near-term market and service analyses, it is important to recognize that, between now and 2010, the population of Wyoming might be best characterized as middle-aged rather than Aold@. After 2010, the beginning edge of the baby-boom generation (born between 1946 to 1962) will reach retirement age. As this generation enters retirement, the population as a result will age rapidly. The aging of the population is thus a long-term process. The increase in both the middle-aged workers of the next decade and the elderly aged population thereafter may have substantial impacts on goods and services. The middle -aged householders are likely to be in their peak earning years. The older population will require increased health related products and social services, and will generally demand different forms and types of services than that of a middle -aged population. Those in the public sector will need to be alert to such shifts in order to effectively serve these clientele . The private sector will likely need to focus their products and services toward those being purchased and monitored by public-service entities as the baby boom generation ages. Other factors such as further reductions in the levels of mortality, particularly at older ages, continued low rates of fertility, a continuation of relatively high rates of international immigration, and a continuing diversity of household types will certainly impact life dimensions of residents as well, and thus will need to be recognized by policy makers. Income and Wages Total Personal Income (TPI) measures all of the income received by the residents of an area, including wage and salaries, dividends, interest, rent (DIR), and transfer payments such as social security income. TPI is a good indicator of purchasing power for an area because it includes all sources of income, while consumer consumption makes up approximately two-thirds of the total economy. From 1990 to 2002, TPI increased by 86.6 percent, from $8.2 billion to $15.3 billion. The average annual growth rate for Wyoming’s TPI was 5.4 percent compared with the average inflation rate of 2.8 percent. Personal income has grown faster since 1996, registering at 6.4 percent per year, due to coalbed methane exploration. Wyoming’s Per Capita Income (PCI) showed particularly strong increases at 6.1 and 4.4 percent, respectively, compared to the national average of 2.2 and 1.9 percent during 2001 and 2002. In fact, Wyoming’s PCI of $30,753 in 2002 was close to the national average of $31,030. The PCI rank for the state was raised to 18th in the nation in 2002 from 35th in 1996. Ever since the U.S. PCI passed that of Wyoming in 1984, the gap has been running around $2,000 until 2001. The largest component of TPI is earnings by place of work, at $10.3 billion in 2002, which includes wage and salary, and proprietor income. However, “earning by place of work” was the slowest growing
1977 1979 1981 1983 1985 1987 1989 1991 1993 1995 1997 1999 2001 2003 2005 2007 2009 2011$2,000
$6,000
$10,000
$14,000
$18,000
$22,000
$26,000
$30,000
$34,000
$38,000
$42,000
$46,000
$50,000
$2,000
$6,000
$10,000
$14,000
$18,000
$22,000
$26,000
$30,000
$34,000
$38,000
$42,000
$46,000
$50,000
U.S. Wyoming
Figure 22. Per Capita Personal Income for US and Wyoming
Source: Economy.Com and Wyoming Economic Analysis Division

- 17 -
component, increasing by 79.3 percent during the 12-year period. Both the DIR and transfer payments more than doubled to $3.9 billion and $1.9 billion in 2002, respectively. Total personal income is projected to increase by 4.2 percent annually to $23.0 billion by the end of the forecasting period. The earning by place of work increases faster than DRI and transfer payments due to the expected slow financial market and low inflation. Real dollar personal income increases by 2.1 percent annually to reach $17.0 billion. Inflation as measured by the U.S. Bureau of Labor Statistics Consumer Price Index (CPI-U) is forecasted to increase at an annual average rate of 2.3 percent. While Wyoming’s average wage per job increased over 50 percent from the recession years of mid 1980s to 2001, the growth varied across industries. The wage in the farm sector jumped over 150 percent compared to state and local government’s less than 40 percent expansion during the same period. The wage difference among industries is also remarkable. By 2001, the average mining job was paid $52,611 annually, more than triple the wage in retail trade, and more than double average payroll in services. This disparity is expected to continue because different job skills and experiences are required from one industry to another.
Total Farm
Agr. S
ervice
s M
ining
Constru
ction
Manufac
turingTCPU*
Wholes
ale tra
de
Retail tr
adeFIRE*
Serv
ices
Federal, ci
vilian
State an
d local$0
$5,000
$10,000
$15,000
$20,000
$25,000
$30,000
$35,000
$40,000
$45,000
$50,000
$55,000
$0
$5,000
$10,000
$15,000
$20,000
$25,000
$30,000
$35,000
$40,000
$45,000
$50,000
$55,000
1975 1981 1987 2001
Figure 23. Wyoming Average Wage Per Job: 1975, 1981, 1987, 2001
Source: U.S. Bureau of Economic Analysis
* TCPU = Transportation, communications, and public utilities; FIRE = Finance, insurance, and real estate

Table 1. National Economic Forecast
1998 1999 2000 2001 2002 2003 2004 2005 2006 2007 2008 2009 2010 2011 2012
Gross Domestic Product (billions) $8,781.5 $9,274.3 $9,824.7 $10,082.1 $10,445.7 $10,857.6 $11,415.4 $11,989.7 $12,639.4 $13,258.9 $13,888.3 $14,544.7 $15,221.5 $15,931.3 $16,648.1
% change 5.6 5.6 5.9 2.6 3.6 3.9 5.1 5.0 5.4 4.9 4.7 4.7 4.7 4.7 4.5
Gross Domestic Product (1996 dollars) $8,508.9 $8,858.9 $9,191.4 $9,214.6 $9,440.2 $9,653.5 $10,003.1 $10,312.5 $10,670.3 $10,988.0 $11,299.1 $11,614.3 $11,936.6 $12,267.6 $12,594.8
% change 4.3 4.1 3.8 0.3 2.4 2.3 3.6 3.1 3.5 3.0 2.8 2.8 2.8 2.8 2.7
Total Personal Income (billions) $7,426.0 $7,786.5 $8,406.6 $8,685.4 $8,948.1 $9,276.6 $9,705.8 $10,207.0 $10,718.0 $11,236.2 $11,777.6 $12,354.0 $12,963.6 $13,605.1 $14,279.2
% change 7.0 4.9 8.0 3.3 3.0 3.7 4.6 5.2 5.0 4.8 4.8 4.9 4.9 4.9 5.0
Per Capita Income ($) $26,920 $27,905 $29,787 $30,441 $31,030 $31,886 $33,072 $34,484 $35,906 $37,330 $38,807 $40,374 $42,023 $43,747 $45,543
% change 5.8 3.7 6.7 2.2 1.9 2.8 3.7 4.3 4.1 4.0 4.0 4.0 4.1 4.1 4.1
Non-Wage Income (billions) $3,233.2 $3,316.1 $3,570.2 $3,734.7 $3,924.3 $4,054.7 $4,165.1 $4,330.2 $4,519.6 $4,709.6 $4,905.5 $5,107.6 $5,321.7 $5,546.7 $5,779.6
% change 6.1 2.6 7.7 4.6 5.1 3.3 2.7 4.0 4.4 4.2 4.2 4.1 4.2 4.2 4.2
Population (millions) 275.85 279.04 282.22 285.32 288.37 290.93 293.47 295.99 298.50 301.00 303.50 305.99 308.49 311.00 313.53
% change 1.2 1.2 1.1 1.1 1.1 0.9 0.9 0.9 0.8 0.8 0.8 0.8 0.8 0.8 0.8
Non-Agr. Employment (millions) 125.85 128.90 131.72 131.92 130.78 131.09 133.46 135.99 137.94 139.73 141.50 143.31 145.11 146.92 148.73
% change 2.6 2.4 2.2 0.2 -0.9 0.2 1.8 1.9 1.4 1.3 1.3 1.3 1.3 1.2 1.2
Unemployment Rate (%) 4.5 4.2 4.0 4.8 5.8 6.0 5.7 5.4 5.2 5.2 5.1 5.0 5.0 5.0 5.0
% change -8.9 -6.3 -5.1 19.2 21.3 4.2 -5.0 -6.1 -2.8 -1.4 -1.0 -1.5 -0.5 0.0 0.0
Consumer Price Index (1982-84=100) 163.0 166.6 172.2 177.1 179.9 184.0 187.8 192.5 197.2 201.8 206.5 211.2 216.0 220.8 225.7
% change 1.5 2.2 3.4 2.8 1.6 2.3 2.0 2.5 2.4 2.3 2.3 2.3 2.3 2.2 2.2
Retail Sales (billions) $2,634.6 $2,865.6 $3,055.5 $3,170.6 $3,271.0 $3,399.2 $3,546.2 $3,705.2 $3,896.4 $4,061.3 $4,234.9 $4,414.1 $4,600.6 $4,791.4 $4,987.5
% change 4.9 8.8 6.6 3.8 3.2 3.9 4.3 4.5 5.2 4.2 4.3 4.2 4.2 4.1 4.1
Personal Bankruptcies 1,398,155 1,281,748 1,218,519 1,451,957 1,539,194 1,504,373 1,399,274 1,385,523 1,459,017 1,487,115 1,520,093 1,555,747 1,597,675 1,629,208 1,653,645
% change 3.6 -8.3 -4.9 19.2 6.0 -2.3 -7.0 -1.0 5.3 1.9 2.2 2.3 2.7 2.0 1.5
Mortgage Originations (billions) $1,529.0 $1,200.9 $1,047.4 $2,058.9 $2,612.9 $2,541.3 $1,217.6 $1,222.1 $1,291.9 $1,368.7 $1,435.3 $1,483.3 $1,533.1 $1,584.2 $1,636.5
% change 78.4 -21.5 -12.8 96.6 26.9 -2.7 -52.1 0.4 5.7 5.9 4.9 3.4 3.4 3.3 3.3
Housing Starts (millions) 1.62 1.65 1.57 1.60 1.71 1.61 1.49 1.56 1.61 1.57 1.55 1.54 1.54 1.56 1.58
% change 9.9 1.6 -4.5 1.9 6.8 -6.0 -7.2 4.5 3.0 -2.5 -1.4 -0.5 0.3 1.1 1.4
Median Price of Single-Family Homes (Ths.) $127,956 $132,967 $138,435 $146,464 $157,793 $167,079 $170,645 $173,813 $178,585 $185,317 $192,241 $199,226 $206,512 $214,078 $221,871
% change 5.4 3.9 4.1 5.8 7.7 5.9 2.1 1.9 2.7 3.8 3.7 3.6 3.7 3.7 3.6
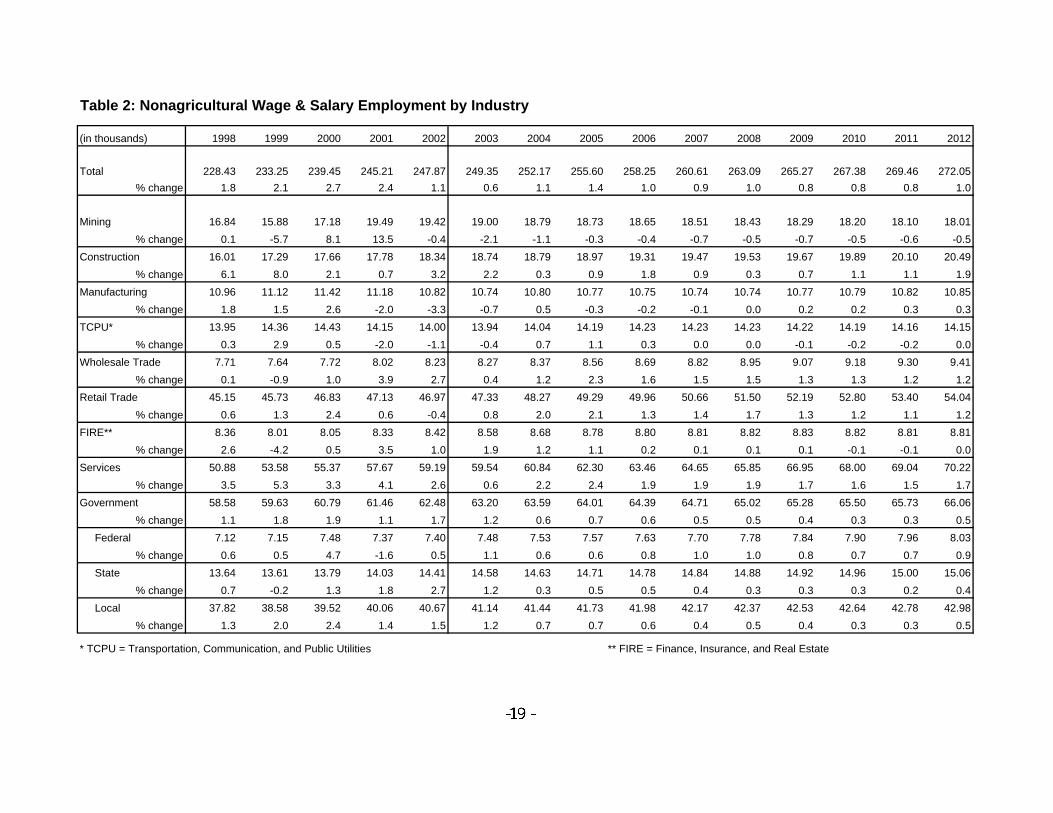
Table 2: Nonagricultural Wage & Salary Employment by Industry
(in thousands) 1998 1999 2000 2001 2002 2003 2004 2005 2006 2007 2008 2009 2010 2011 2012
Total 228.43 233.25 239.45 245.21 247.87 249.35 252.17 255.60 258.25 260.61 263.09 265.27 267.38 269.46 272.05
% change 1.8 2.1 2.7 2.4 1.1 0.6 1.1 1.4 1.0 0.9 1.0 0.8 0.8 0.8 1.0
Mining 16.84 15.88 17.18 19.49 19.42 19.00 18.79 18.73 18.65 18.51 18.43 18.29 18.20 18.10 18.01
% change 0.1 -5.7 8.1 13.5 -0.4 -2.1 -1.1 -0.3 -0.4 -0.7 -0.5 -0.7 -0.5 -0.6 -0.5
Construction 16.01 17.29 17.66 17.78 18.34 18.74 18.79 18.97 19.31 19.47 19.53 19.67 19.89 20.10 20.49
% change 6.1 8.0 2.1 0.7 3.2 2.2 0.3 0.9 1.8 0.9 0.3 0.7 1.1 1.1 1.9
Manufacturing 10.96 11.12 11.42 11.18 10.82 10.74 10.80 10.77 10.75 10.74 10.74 10.77 10.79 10.82 10.85
% change 1.8 1.5 2.6 -2.0 -3.3 -0.7 0.5 -0.3 -0.2 -0.1 0.0 0.2 0.2 0.3 0.3
TCPU* 13.95 14.36 14.43 14.15 14.00 13.94 14.04 14.19 14.23 14.23 14.23 14.22 14.19 14.16 14.15
% change 0.3 2.9 0.5 -2.0 -1.1 -0.4 0.7 1.1 0.3 0.0 0.0 -0.1 -0.2 -0.2 0.0
Wholesale Trade 7.71 7.64 7.72 8.02 8.23 8.27 8.37 8.56 8.69 8.82 8.95 9.07 9.18 9.30 9.41
% change 0.1 -0.9 1.0 3.9 2.7 0.4 1.2 2.3 1.6 1.5 1.5 1.3 1.3 1.2 1.2
Retail Trade 45.15 45.73 46.83 47.13 46.97 47.33 48.27 49.29 49.96 50.66 51.50 52.19 52.80 53.40 54.04
% change 0.6 1.3 2.4 0.6 -0.4 0.8 2.0 2.1 1.3 1.4 1.7 1.3 1.2 1.1 1.2
FIRE** 8.36 8.01 8.05 8.33 8.42 8.58 8.68 8.78 8.80 8.81 8.82 8.83 8.82 8.81 8.81
% change 2.6 -4.2 0.5 3.5 1.0 1.9 1.2 1.1 0.2 0.1 0.1 0.1 -0.1 -0.1 0.0
Services 50.88 53.58 55.37 57.67 59.19 59.54 60.84 62.30 63.46 64.65 65.85 66.95 68.00 69.04 70.22
% change 3.5 5.3 3.3 4.1 2.6 0.6 2.2 2.4 1.9 1.9 1.9 1.7 1.6 1.5 1.7
Government 58.58 59.63 60.79 61.46 62.48 63.20 63.59 64.01 64.39 64.71 65.02 65.28 65.50 65.73 66.06
% change 1.1 1.8 1.9 1.1 1.7 1.2 0.6 0.7 0.6 0.5 0.5 0.4 0.3 0.3 0.5
Federal 7.12 7.15 7.48 7.37 7.40 7.48 7.53 7.57 7.63 7.70 7.78 7.84 7.90 7.96 8.03
% change 0.6 0.5 4.7 -1.6 0.5 1.1 0.6 0.6 0.8 1.0 1.0 0.8 0.7 0.7 0.9
State 13.64 13.61 13.79 14.03 14.41 14.58 14.63 14.71 14.78 14.84 14.88 14.92 14.96 15.00 15.06
% change 0.7 -0.2 1.3 1.8 2.7 1.2 0.3 0.5 0.5 0.4 0.3 0.3 0.3 0.2 0.4
Local 37.82 38.58 39.52 40.06 40.67 41.14 41.44 41.73 41.98 42.17 42.37 42.53 42.64 42.78 42.98
% change 1.3 2.0 2.4 1.4 1.5 1.2 0.7 0.7 0.6 0.4 0.5 0.4 0.3 0.3 0.5
* TCPU = Transportation, Communication, and Public Utilities ** FIRE = Finance, Insurance, and Real Estate

Table 3. Population and Demographics
(in thousands) 1998 1999 2000 2001 2002 2003 2004 2005 2006 2007 2008 2009 2010 2011 2012
Total Population 491.38 492.27 494.00 493.75 498.70 503.66 506.52 508.78 511.14 513.10 515.23 516.83 518.55 520.77 523.48
% change 0.3 0.2 0.4 0.0 1.0 1.0 0.6 0.4 0.5 0.4 0.4 0.3 0.3 0.4 0.5
Population: 00-04 30.92 30.65 30.95 31.10 31.57 32.02 32.31 32.54 32.73 32.88 33.01 33.09 33.14 33.19 33.25
% change -0.9 -0.9 1.0 0.5 1.5 1.4 0.9 0.7 0.6 0.5 0.4 0.2 0.2 0.2 0.2
Population: 05-19 118.12 116.26 114.46 112.89 112.56 112.38 112.12 111.75 111.59 111.53 111.61 111.51 111.23 111.18 111.27
% change -0.9 -1.6 -1.5 -1.4 -0.3 -0.2 -0.2 -0.3 -0.1 -0.1 0.1 -0.1 -0.2 0.0 0.1
Population: 20-24 33.12 33.37 33.47 33.61 33.93 34.19 34.01 33.64 33.26 32.69 32.14 31.90 31.78 31.72 31.75
% change 0.6 0.8 0.3 0.4 1.0 0.8 -0.5 -1.1 -1.1 -1.7 -1.7 -0.7 -0.4 -0.2 0.1
Population: 25-44 141.33 139.02 138.68 136.66 136.18 135.91 135.22 134.68 134.19 133.77 133.64 133.31 133.42 133.89 134.41
% change -1.7 -1.6 -0.2 -1.5 -0.3 -0.2 -0.5 -0.4 -0.4 -0.3 -0.1 -0.2 0.1 0.4 0.4
Population: 45-64 111.54 116.06 118.72 121.21 124.96 128.35 130.95 133.18 135.29 136.92 137.65 138.27 138.72 139.17 137.96
% change 4.0 4.1 2.3 2.1 3.1 2.7 2.0 1.7 1.6 1.2 0.5 0.4 0.3 0.3 -0.9
Population: 65 & over 56.36 56.92 57.72 58.28 59.49 60.81 61.91 62.98 64.08 65.32 67.18 68.76 70.26 71.62 74.84
% change 1.2 1.0 1.4 1.0 2.1 2.2 1.8 1.7 1.7 1.9 2.9 2.3 2.2 1.9 4.5
Net Migration -1.87 -1.87 -0.96 -2.05 2.65 2.66 0.66 0.06 0.36 0.07 0.33 -0.10 0.02 0.62 1.11
% change 46.7 0.2 -48.6 112.6 -229.4 0.2 -75.3 -90.9 502.7 -81.8 400.8 -129.7 -118.0 3,430.7 78.0
Households 192.10 192.67 193.61 194.03 194.87 197.21 198.87 200.14 201.40 202.84 204.41 205.85 207.28 208.66 210.61
% change 1.0 0.3 0.5 0.2 0.4 1.2 0.8 0.6 0.6 0.7 0.8 0.7 0.7 0.7 0.9
Table 4. Labor Force and Unemployment
(Thousands) 1998 1999 2000 2001 2002 2003 2004 2005 2006 2007 2008 2009 2010 2011 2012
Civilian Labor Force 256.56 262.06 268.06 272.40 270.28 271.15 272.99 274.58 276.20 277.76 279.38 280.86 282.10 283.31 284.79
% change 2.1 2.1 2.3 1.6 -0.8 0.3 0.7 0.6 0.6 0.6 0.6 0.5 0.4 0.4 0.5
Number Employed 244.28 249.33 257.70 260.60 258.94 259.19 261.56 263.56 265.21 266.61 268.06 269.40 270.38 271.38 272.47
% change 2.4 2.1 3.4 1.1 -0.6 0.1 0.9 0.8 0.6 0.5 0.5 0.5 0.4 0.4 0.4
Number Unemployed 12.28 12.73 10.37 10.71 11.34 11.96 11.43 11.02 10.99 11.15 11.31 11.46 11.71 11.93 12.33
% change -3.7 3.7 -18.6 3.3 5.9 5.5 -4.4 -3.6 -0.3 1.4 1.5 1.3 2.2 1.9 3.3
Unemployment Rate 4.78 4.86 3.87 3.93 4.20 4.41 4.19 4.01 3.98 4.01 4.05 4.08 4.15 4.21 4.33

Table 5. Total Personal Income and Earnings
(Millions of Dollars unless noted.) 1998 1999 2000 2001 2002 2003 2004 2005 2006 2007 2008 2009 2010 2011 2012
Total Personal Income 12,129.75 12,854.50 13,717.00 14,544.00 15,336.73 15,881.66 16,460.89 17,173.81 17,925.47 18,682.91 19,477.66 20,295.11 21,146.82 22,038.44 23,020.56
% change 6.1 6.0 6.7 6.0 5.5 3.6 3.6 4.3 4.4 4.2 4.3 4.2 4.2 4.2 4.5
Real Personal Income (1996 Dollars) 11,772.89 12,274.58 12,772.98 13,274.49 13,810.40 14,035.30 14,285.80 14,607.09 14,942.99 15,264.17 15,597.00 15,925.19 16,270.47 16,625.06 17,036.73
% change 5.0 4.3 4.1 3.9 4.0 1.6 1.8 2.2 2.3 2.1 2.2 2.1 2.2 2.2 2.5
Population (Thousands) 491.38 492.27 494.00 493.75 498.70 503.66 506.52 508.78 511.14 513.10 515.23 516.83 518.55 520.77 523.48
% change 0.3 0.2 0.4 0.0 1.0 1.0 0.6 0.4 0.5 0.4 0.4 0.3 0.3 0.4 0.5
Per Capita Personal Income (Dollars) 24,685 26,112 27,767 29,456 30,753 31,533 32,498 33,755 35,070 36,412 37,804 39,268 40,781 42,319 43,976
% change 5.8 5.8 6.3 6.1 4.4 2.5 3.1 3.9 3.9 3.8 3.8 3.9 3.9 3.8 3.9
Real Per Capita Pers Income (96 Dollars) 23,959 24,934 25,856 26,885 27,693 27,867 28,204 28,710 29,235 29,749 30,272 30,813 31,377 31,924 32,545
% change 4.7 4.1 3.7 4.0 3.0 0.6 1.2 1.8 1.8 1.8 1.8 1.8 1.8 1.7 1.9
Median Household Income (Dollars) 35,250 37,395 39,629 39,719 41,294 42,175 43,296 44,771 46,283 47,731 49,200 50,738 52,329 53,971 55,642
% change 5.5 6.1 6.0 0.2 4.0 2.1 2.7 3.4 3.4 3.1 3.1 3.1 3.1 3.1 3.1
Derivation of Total Pers Income: 1998 1999 2000 2001 2002 2003 2004 2005 2006 2007 2008 2009 2010 2011 2012
Earnings by Place of Work 7,905.25 8,469.25 9,015.25 9,644.75 10,250.94 10,755.89 11,443.67 12,062.76 12,652.36 13,238.84 13,853.15 14,493.39 15,160.06 15,857.02 16,625.35
% change 4.4 7.1 6.4 7.0 6.3 4.9 6.4 5.4 4.9 4.6 4.6 4.6 4.6 4.6 4.8
less: Contributions for Social Insurance 493.25 513.00 538.25 581.50 620.49 642.51 673.98 705.85 736.06 766.60 798.74 832.50 867.54 904.05 944.33
% change 6.2 4.0 4.9 8.0 6.7 3.5 4.9 4.7 4.3 4.1 4.2 4.2 4.2 4.2 4.5
plus: Residence Adjustment -19.25 -22.75 -33.50 -36.50 -36.66 -25.08 -26.46 -27.83 -29.09 -30.37 -31.70 -33.13 -34.61 -36.17 -37.86
% change 14.9 18.2 47.3 9.0 0.4 -31.6 5.5 5.2 4.6 4.4 4.4 4.5 4.5 4.5 4.7
equals: Net Earnings by Place of Residence 7,392.75 7,933.50 8,443.50 9,026.75 9,593.79 10,088.30 10,743.24 11,329.09 11,887.21 12,441.87 13,022.72 13,627.76 14,257.92 14,916.80 15,643.15
% change 4.2 7.3 6.4 6.9 6.3 5.2 6.5 5.5 4.9 4.7 4.7 4.6 4.6 4.6 4.9
plus: Dividends, Interest & Rents 3,264.50 3,401.50 3,673.00 3,788.25 3,861.89 3,799.57 3,688.38 3,766.16 3,887.53 4,009.11 4,134.54 4,259.23 4,386.58 4,518.49 4,665.51
% change 12.6 4.2 8.0 3.1 1.9 -1.6 -2.9 2.1 3.2 3.1 3.1 3.0 3.0 3.0 3.3
plus: Transfer Payments 1,472.00 1,519.75 1,600.25 1,729.25 1,881.30 1,993.79 2,029.28 2,078.56 2,150.73 2,231.93 2,320.41 2,408.11 2,502.33 2,603.16 2,711.89
% change 2.1 3.2 5.3 8.1 8.8 6.0 1.8 2.4 3.5 3.8 4.0 3.8 3.9 4.0 4.2
Components of Earnings: 1998 1999 2000 2001 2002 2003 2004 2005 2006 2007 2008 2009 2010 2011 2012
Wages & Salaries 5,991.50 6,332.00 6,771.25 7,250.75 7,600.20 7,894.98 8,315.15 8,749.86 9,169.95 9,598.93 10,053.36 10,530.86 11,029.74 11,551.90 12,130.77
% change 5.3 5.7 6.9 7.1 4.8 3.9 5.3 5.2 4.8 4.7 4.7 4.7 4.7 4.7 5.0
Income: Other Labor 733.00 765.75 823.00 892.00 980.64 1,065.88 1,135.54 1,194.83 1,252.15 1,310.67 1,372.63 1,437.76 1,505.79 1,577.57 1,658.08
% change 1.8 4.5 7.5 8.4 9.9 8.7 6.5 5.2 4.8 4.7 4.7 4.7 4.7 4.8 5.1
Proprietors Income 1,180.75 1,371.50 1,421.00 1,502.00 1,670.10 1,795.04 1,992.98 2,118.07 2,230.26 2,329.24 2,427.16 2,524.77 2,624.52 2,727.55 2,836.50
% change 1.3 16.2 3.6 5.7 11.2 7.5 11.0 6.3 5.3 4.4 4.2 4.0 4.0 3.9 4.0

Table 6. Wage and Salary Disbursements by Industry
(Millions of Dallars) 1998 1999 2000 2001 2002 2003 2004 2005 2006 2007 2008 2009 2010 2011 2012
Total 5,991.50 6,332.00 6,771.25 7,250.75 7,600.20 7,894.98 8,315.15 8,749.86 9,169.95 9,598.93 10,053.36 10,530.86 11,029.74 11,551.90 12,130.77
% change 5.3 5.7 6.9 7.1 4.8 3.9 5.3 5.2 4.8 4.7 4.7 4.7 4.7 4.7 5.0
Mining 793.78 783.71 941.02 1,025.47 1,072.80 1,056.03 1,102.97 1,145.62 1,186.79 1,225.92 1,267.74 1,310.52 1,358.07 1,407.44 1,461.68
% change -0.1 -1.3 20.1 9.0 4.6 -1.6 4.4 3.9 3.6 3.3 3.4 3.4 3.6 3.6 3.9
Construction 452.22 525.04 556.48 603.78 624.67 629.11 641.42 672.82 709.16 741.64 771.70 806.74 846.43 888.47 939.60
% change 11.7 16.1 6.0 8.5 3.5 0.7 2.0 4.9 5.4 4.6 4.1 4.5 4.9 5.0 5.8
Manufacturing 353.00 358.50 391.00 398.50 388.52 450.97 483.73 507.43 531.16 556.62 583.00 613.65 645.79 680.73 718.53
% change 6.6 1.6 9.1 1.9 -2.5 16.1 7.3 4.9 4.7 4.8 4.7 5.3 5.2 5.4 5.6
TCPU* 582.25 607.00 617.25 615.50 633.84 628.28 654.36 682.83 704.95 726.10 747.94 770.12 792.14 814.92 840.43
% change 6.2 4.3 1.7 -0.3 3.0 -0.9 4.2 4.3 3.2 3.0 3.0 3.0 2.9 2.9 3.1
Wholesale Trade 238.88 244.25 258.45 286.24 294.65 303.22 317.97 337.05 354.13 372.26 391.90 411.80 432.87 454.69 478.29
% change 5.1 2.2 5.8 10.8 2.9 2.9 4.9 6.0 5.1 5.1 5.3 5.1 5.1 5.0 5.2
Retail Trade 649.12 682.50 711.55 745.01 772.11 798.04 844.05 893.04 935.98 983.01 1,037.55 1,090.60 1,144.82 1,201.31 1,263.03
% change 7.3 5.1 4.3 4.7 3.6 3.4 5.8 5.8 4.8 5.0 5.5 5.1 5.0 4.9 5.1
FIRE** 260.75 289.50 265.50 292.00 303.39 324.52 341.02 356.00 367.57 379.71 392.81 406.74 420.68 435.38 451.64
% change 6.2 11.0 -8.3 10.0 3.9 7.0 5.1 4.4 3.3 3.3 3.4 3.5 3.4 3.5 3.7
Services 1,036.35 1,152.42 1,246.93 1,370.07 1,440.91 1,520.30 1,636.62 1,759.48 1,874.52 1,996.43 2,124.90 2,260.34 2,400.06 2,548.26 2,710.72
% change 8.3 11.2 8.2 9.9 5.2 5.5 7.7 7.5 6.5 6.5 6.4 6.4 6.2 6.2 6.4
Government 1,402.50 1,462.75 1,543.00 1,666.75 1,802.00 1,905.64 2,001.07 2,090.28 2,185.82 2,281.95 2,383.87 2,489.90 2,598.60 2,709.66 2,833.46
% change 4.2 4.3 5.5 8.0 8.1 5.8 5.0 4.5 4.6 4.4 4.5 4.4 4.4 4.3 4.6
Agr. & Millitary 222.65 226.33 240.07 247.43 267.32 278.86 291.95 305.31 319.87 335.29 351.95 370.45 390.28 411.04 433.39
% change -2.6 1.7 6.1 3.1 8.0 4.3 4.7 4.6 4.8 4.8 5.0 5.3 5.4 5.3 5.4
* TCPU = Transportation, Communication, and Public Utilities ** FIRE = Finance, Insurance, and Real Estate

Table 7. Average Annual Wage Per Job by Industry
(in dollars) 1998 1999 2000 2001 2002 2003 2004 2005 2006 2007 2008 2009 2010 2011 2012
Total 24,629 25,537 26,582 27,843 28,823 29,795 31,062 32,281 33,520 34,807 36,149 37,595 39,106 40,684 42,360
% change 3.4 3.7 4.1 4.7 3.5 3.4 4.3 3.9 3.8 3.8 3.9 4.0 4.0 4.0 4.1
Mining 47,132 49,341 54,790 52,611 55,251 55,569 58,710 61,169 63,637 66,213 68,802 71,654 74,632 77,776 81,159
% change -0.2 4.7 11.0 -4.0 5.0 0.6 5.7 4.2 4.0 4.0 3.9 4.1 4.2 4.2 4.3
Construction 28,250 30,364 31,514 33,968 34,058 33,567 34,132 35,468 36,726 38,083 39,504 41,011 42,564 44,192 45,866
% change 5.3 7.5 3.8 7.8 0.3 -1.4 1.7 3.9 3.5 3.7 3.7 3.8 3.8 3.8 3.8
Manufacturing 32,212 32,225 34,249 35,634 35,918 41,979 44,782 47,107 49,391 51,805 54,260 56,971 59,834 62,896 66,223
% change 4.8 0.0 6.3 4.0 0.8 16.9 6.7 5.2 4.8 4.9 4.7 5.0 5.0 5.1 5.3
TCPU* 41,738 42,275 42,766 43,498 45,274 45,074 46,621 48,124 49,551 51,018 52,549 54,168 55,831 57,557 59,388
% change 5.9 1.3 1.2 1.7 4.1 -0.4 3.4 3.2 3.0 3.0 3.0 3.1 3.1 3.1 3.2
Wholesale Trade 30,990 31,964 33,493 35,706 35,787 36,678 37,992 39,373 40,732 42,197 43,787 45,420 47,132 48,911 50,820
% change 5.0 3.1 4.8 6.6 0.2 2.5 3.6 3.6 3.5 3.6 3.8 3.7 3.8 3.8 3.9
Retail Trade 14,377 14,926 15,193 15,806 16,439 16,860 17,485 18,116 18,735 19,406 20,145 20,897 21,680 22,495 23,372
% change 6.6 3.8 1.8 4.0 4.0 2.6 3.7 3.6 3.4 3.6 3.8 3.7 3.7 3.8 3.9
FIRE** 31,196 36,150 32,981 35,040 36,047 37,845 39,293 40,556 41,786 43,109 44,530 46,078 47,688 49,395 51,241
% change 3.6 15.9 -8.8 6.2 2.9 5.0 3.8 3.2 3.0 3.2 3.3 3.5 3.5 3.6 3.7
Services 20,370 21,507 22,518 23,758 24,343 25,534 26,899 28,240 29,538 30,883 32,268 33,760 35,294 36,910 38,601
% change 4.6 5.6 4.7 5.5 2.5 4.9 5.3 5.0 4.6 4.6 4.5 4.6 4.5 4.6 4.6
Government 23,944 24,529 25,382 27,120 28,840 30,151 31,467 32,657 33,944 35,265 36,662 38,139 39,671 41,224 42,890
% change 3.1 2.4 3.5 6.8 6.3 4.5 4.4 3.8 3.9 3.9 4.0 4.0 4.0 3.9 4.0
* TCPU = Transportation, Communication, and Public Utilities ** FIRE = Finance, Insurance, and Real Estate