temporally resolved gc-ms-based metabolic profiling of herbicide
TRANSCRIPT
ORIGINAL ARTICLE
Temporally resolved GC-MS-based metabolic profilingof herbicide treated plants treated reveals that changes in polarprimary metabolites alone can distinguish herbicides of differingmode of action
Sandra Trenkamp Æ Peter Eckes Æ Marco Busch ÆAlisdair R. Fernie
Received: 17 October 2008 / Accepted: 1 December 2008 / Published online: 13 December 2008
� The Author(s) 2008. This article is published with open access at Springerlink.com
Abstract We conducted a comprehensive metabolic
phenotyping of primary metabolism of photosynthetic
tissue of Arabidopsis thaliana following spray treatment
with a number of commercially used herbicides using a
well established gas-chromatography mass-spectrometry
profiling method. Applying this technique we were able to
identify and quantify in excess of 80 polar metabolites
and based on a combination of co-elution with standards
and prediction from the mass spectra a similar number of
lipophillic components within two chromatographic runs.
The herbicides selected were glufosinate, sulcotrione,
AE944 [N2-(1-ethyl-3-phenylpropyl)-6-(1-fluoro-1-methyl-
ethyl)-1,3,5-triazine-2,4-diamine], foramsulfuron, benfure-
sate and glyphosate. We determined causal changes in the
metabolite profiles by following their time-dependent
changes using a serial sampling strategy. The resultant
profiles were compared both by looking at the largest
changes in a metabolite by metabolite manner and by per-
formance of statistical analyses. These data revealed that
analysis of the polar metabolites allows clear separation of
the compounds under test. This finding is discussed in the
context of current strategies for agrochemical discovery.
Keywords Herbicide � Mode of action � GC-MS �Metabolic profiling
1 Introduction
Agrochemicals are compounds that specifically control or
arrest growth of weeds and pests. They have played an
important role in the large increase of crop productivity
achieved over the last 50 years (Lein et al. 2004). Until
recently the first step in agrochemical discovery was to take
a collection of chemicals, apply each to a small population
of representative pests, and assess their efficacy by visual
inspection. Testing of chemicals for efficacy on whole
plants is direct and integrates several important attributes of
a crop protectant including its uptake, transport, metabolism
and ability to inhibit an important target protein (Lein et al.
2004). Commercially used herbicides act on a total of about
20 biochemically distinct and commercially relevant modes
of action (Menne and Kocher 2007). Following the initial
identification of lead chemicals, exploration and optimiza-
tion of their structure is accompanied by research into their
mode of action (Ott et al. 2003; Lein et al. 2004). In the
search for more efficacious herbicides, knowledge con-
cerning the biochemical mode of action is desirable for a
number of reasons. Firstly, it facilitates access to advanced
tools like such as ultra-high-throughput screening. Sec-
ondly, it can allow the determination of whether a novel
analog shares the mode of action of its parent molecule.
Thirdly, it is important in the classification and prioritiza-
tion of the modes of action of novel leads found by
biological screening. The commercial value of such find-
ings is obviously far greater if the researcher avoids
involving well-exploited targets for which novel com-
pounds are not needed or targets historically associated with
Electronic supplementary material The online version of thisarticle (doi:10.1007/s11306-008-0149-8) contains supplementarymaterial, which is available to authorized users.
S. Trenkamp � A. R. Fernie (&)
Max-Planck-Institut fur Molekulare Pflanzenphysiologie,
Am Muhlenberg 1, 14476 Potsdam-Golm, Germany
e-mail: [email protected]
P. Eckes � M. Busch
Bayer CropScience AG, Industriepark Hochst, 65926 Frankfurt
am Main, Germany
123
Metabolomics (2009) 5:277–291
DOI 10.1007/s11306-008-0149-8

undesired side-effects (Petroff 1988; Aranibar et al. 2001;
Fiehn et al. 2000; Sauter et al. 1991).
For these purposes investigations at the level of the
metabolite have been demonstrated to represent effective
diagnostic approaches. Indeed, one of the earliest applica-
tions of metabolic profiling in plants was the observation
by Sauter and co-workers (Sauter et al. 1991), that barley
plants treated with sub-lethal doses of various herbicides
displayed different GC-MS metabolite profiles depending
on the mode of action of the chemicals applied. In this
study they compared the profiles of acetyl CoA carboxyl-
ase (ACC) and acetolactate synthase (ALS) inhibitors on
the basis of visual comparison of metabolite profiles of
plants treated with these herbicides. This study thus indi-
cated the possibility that the mode of action of herbicides
might be diagnosed by the analysis of reflective patterns of
metabolite composition. Targetted GC-MS profiling of
very long chain fatty acids in yeast expressing very long
chain fatty acid elongases in the presence of, amongst
others, the herbicides oxyacetamide and chloroacetanilide
has also been used as a method of narrowing down the
precise herbicidal mode of action (Trenkamp et al. 2004).
Recently, a sophisticated broad range analysis of the mode
of action has been carried out by Ott and colleagues, who
used a combination of NMR-based metabolic profiling and
bioinformatics to classify herbicides with unknown modes
of action (Ott et al. 2003). This study illustrated a similar
diagnostic power following the statistical analysis of pro-
ton NMR (1H-NMR) spectra to that which has been
effectively used for non-invasive diagnosis of coronary
disease (Brindle et al. 2002).
Another technology that has been successfully applied in
the study of herbicide action is direct-infusion Fourier
transform ion cyclotron resonance mass spectrometry
(FT-ICR-MS), this technique was used by Oikawa et al.
(2006) to profile metabolic changes following the growth of
Arabidopsis plants for 1 week on agar containing sub-lethal
levels of herbicides of varying mode of action. This study
revealed that the herbicide treated samples were clearly
distinguishable from non-treated samples and showed that
in some instances the target site of inhibition could be
retroactively located, but perhaps more importantly estab-
lished an impressive bioinformatics resource to facilitate
the use of FT-ICR-MS, which is by nature difficult to use
(Iijima et al. 2008; Fernie et al. 2004; Aharoni et al. 2002),
as a metabolomics tool. Here, we describe a similar set of
experiments although our strategy differs somewhat in
approach in two important ways. First, we utilized a well
established GC-MS based metabolic profiling approach and
secondly we applied herbicide by spraying and harvested
plants at various time points post-treatment in order to
evaluate the time-dependency of the metabolic response to
inhibition of the herbicide targets. For this purpose we took
a total of six partly commercial herbicides of known mode
of action and compared the metabolic response of Arabid-
opsis to each of the chemicals. The relative efficacy of this
method is discussed as is the possibility to adapt it into a
high-throughput screening technology.
2 Methods
2.1 Chemicals
Herbicides were used from commercial sources (Riedel de
Haen) or supplied by Bayer CropScience AG, Frankfurt
with a minimum purity of 95%. The herbicides were dis-
solved in Dimethylsulfoxide (Sigma Aldrich) to 100 lg/ll
to provide stock solutions. To provide spray solutions
herbicide stock solutions were diluted in 800 ll 0.2%
Agrotin supplemented with 16 ll EC-premixture/Diace-
tonalcohol 1:6 to the predefined desired concentrations
(Eckes and Busch 2007; EC-premixture comprises 5%
phenylsulfonate CA70, 7% Emulsogen EL360, 40%
Isophorone and 48% methyloleate).
2.2 Experimental design
Fifteen Arabidopsis thaliana seeds (ecotype Col0 obtained
from the Nottingham Arabidopsis Stock Center), were
sown on soil using 11 cm plastic pots and grown under
short day conditions (9 h 75 lE/m2s and 15 h darkness at
21�C) for 28 days. At day 14, plants were picked to result
in ten evenly distributed plants. On day 28, plants were
transferred to long-day conditions (16 h 75 lE/m2s at
21�C, 8 h darkness at 19�C). Following an adaptation
period of 6 days, plants were evenly sprayed at a defined
timepoint on day 34 with 800 ll of spray solutions con-
taining herbicides as described above. Controls were
treated similarly with spray solution devoid of herbicide.
At timepoints 1, 3, 6, 12 and 24 h following spray appli-
cations rosettes of two pots each were harvested and pooled
independently and immediately frozen in liquid nitrogen
prior to storage at -70�C until further processing.
2.3 Metabolic profiling
Metabolite extraction was carried out on the exactly as
described previously (Roessner et al. 2001; Schauer et al.
2006). 100 mg of Arabidopsis were homogenized by
grinding in liquid nitrogen. Derivatization and GC-MS
analysis were carried out as described previously (Lisec
et al. 2006). The GC-MS system was comprised of a CTC
CombiPAL autosampler, an Agilent 6890N gas chro-
matograph and a LECO Pegasus III TOF-MS running in
EI? mode. Metabolites were identified in comparison to
278 S. Trenkamp et al.
123

database entries of authentic standards (Kopka et al. 2005;
Schauer et al. 2005). Evaluation of non-polar metabolites
was carried out following the method of Fiehn et al.
(2000), since authentic chemical standards were not run for
every metabolite the metabolite identity should be regarded
as putative rather than exact for these metabolites.
2.4 Statistical analysis
The term significant is used in the text only when the
change in question has been confirmed to be significant
(P \ 0.05) with the t-test using the algorithm embedded in
Microsoft Excel. Principal component analysis (PCA) was
performed on the data sets obtained from metabolite pro-
filing with the software package TMEV (Saeed et al. 2003)
using the default weighted covariance-estimation function.
Further ICA analysis was performed using MetaGeneAlyse
(Scholz et al. 2004). In this software (available at
http://metagenealyse.mpimp-golm.mpg.de) ICA was per-
formed following a PCA preprocessing step to optimize the
outcome of the analysis. The data was log10-transformed
and normalized to the mean of the entire sample set for
each metabolite before the analysis. This transformation
reduces the influence of rare high-measurement values, but
does not change the discrimination in the data set.
3 Results
3.1 Experimental design
Herbicide treatments in the field are generally performed
either by foliar spraying or by soil application. For the
purposes of this study we decided to assess the effects of
application by spraying since this represents the common
method of application for the herbicides selected for these
experiments. We decided to evaluate the effects of several
herbicides of known mode of action, using a highly stan-
dardized growth and treatment cycle summarized in
Fig. 1a. Given that we are looking at a short-term response
to the herbicides we decided to adopt a serial sampling
approach (harvesting plant material at 1, 3, 6, 12 and 24 h
post-treatment), in order to follow the kinetics of the
metabolic response to the herbicide. The herbicides we
chose to study were glufosinate, sulcotrione, AE 944
[N2-(1-ethyl-3-phenylpropyl)-6-(1-fluoro-1-methylethyl)-
1,3,5-triazine-2,4-diamine], foramsulfuron, benfuresate and
glyphosate representing inhibitors of glutamine synthetase,
4-Hydroxyphenylpyruvate dioxygenase (4-HPPD), cellu-
lose biosynthesis (exact target unknown; Kiedaisch et al.
2003) acetolactate synthase (ALS), very long chain fatty
acid biosynthesis (VLCFA), and 5-enolpyruvylshikimate-
3-phosphate synthase (EPSPS), respectively.
3.2 Metabolic response of Arabidopsis to glufosinate
treatment
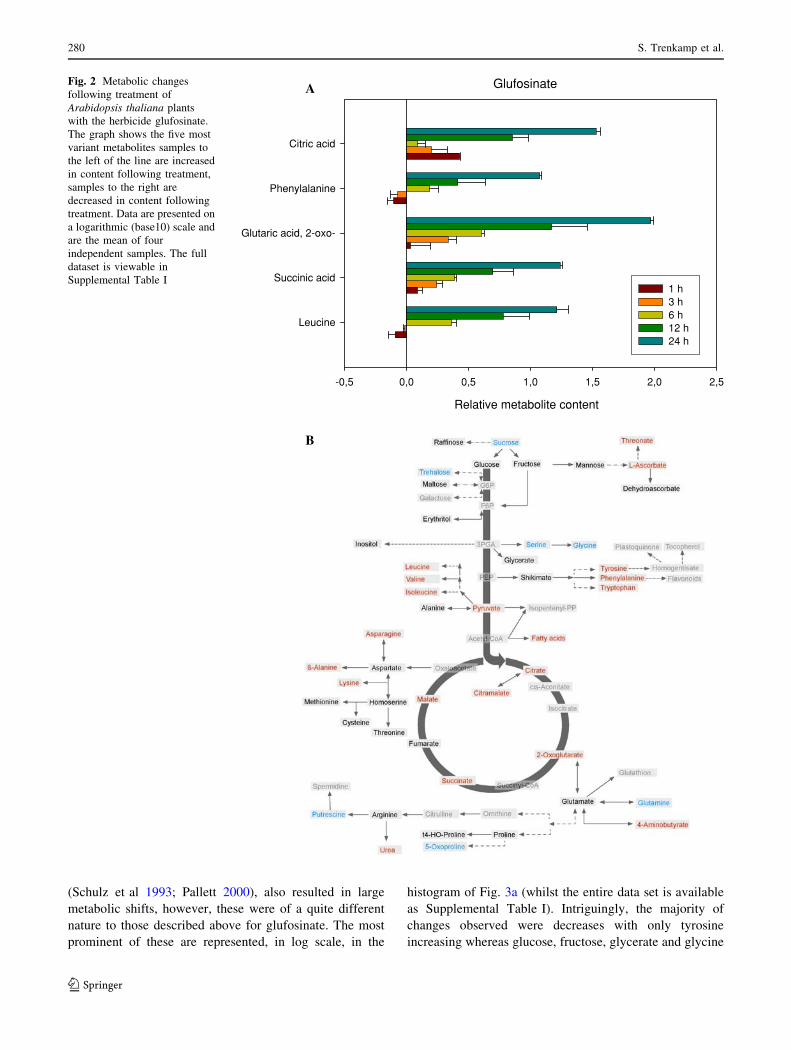
Treatment of Arabidopsis with the glutamine synthetase
inhibitor glufosinate resulted in dramatic metabolic chan-
ges. The most prominent of these are represented, in log
scale, in the histogram of Fig. 2a whilst the entire data set
is available as Supplemental Table I. This study revealed
that treatment with glufosinate resulted in a dramatic
accumulation of the TCA cycle intermediate 2-oxoglutar-
ate which reached 124% of the control level after 1 h,
222% after 3 h, 402% after 6 h, 2239% after 12 h and an
incredible 9416% after 24 h. In addition, there were large
increases in the concentrations of succinate and citrate, the
branched chain amino acid leucine and the aromatic amino
acid phenylalanine. Looking at the pathway map to identify
the metabolites changing after 24 h revealed that the TCA
cycle associated metabolites malate and citramalate also
increased as did aspartate, b-alanine and lysine as well as
other members of the branched chain and aromatic amino
acid families, the fatty acids, metabolites of ascorbate
metabolism and c-aminobutyric acid (GABA) and urea. In
contrast, sucrose and trehalose and serine and glycine were
significantly lower 24 h after treatment as were putrescine,
5-oxoproline and glutamine (Fig. 2b).
3.3 Metabolic response of Arabidopsis to sulcotrione
treatment
Application of the 4-HPPD inhibitor sulcotrione which is
known to block plastoquinone and tocopherol biosynthesis
day 0
day 5
day 10
day 15
day 20
day 25
day 30
day 35
Seeding and Culture under Short Day Conditions
Picking
Removal of Lid
Switch to Long Day Conditions
Spraying with Herbicide
Analysis
Fig. 1 Overview of the standardized experimental treatment and
growthconditions of the Arabidopsis thaliana (Col0) plants up until
the herbicide application
Temporally resolved GC-MS-based metabolic profiling of herbicide treated plants 279
123
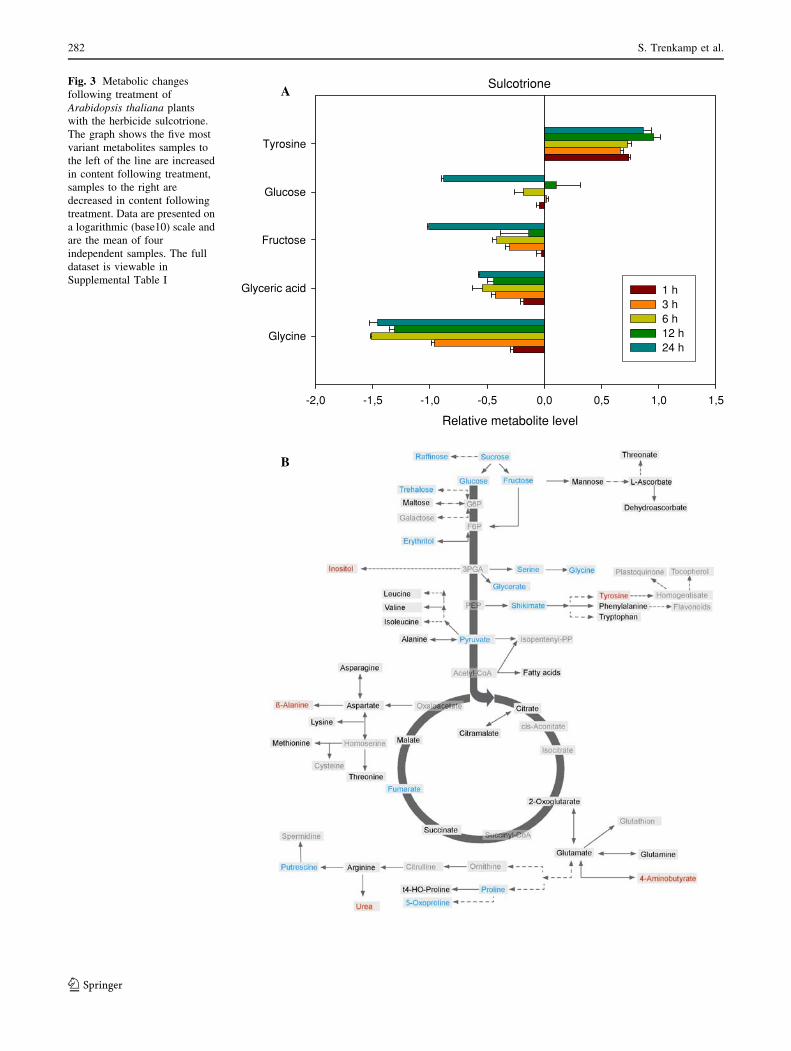
(Schulz et al 1993; Pallett 2000), also resulted in large
metabolic shifts, however, these were of a quite different
nature to those described above for glufosinate. The most
prominent of these are represented, in log scale, in the
histogram of Fig. 3a (whilst the entire data set is available
as Supplemental Table I). Intriguingly, the majority of
changes observed were decreases with only tyrosine
increasing whereas glucose, fructose, glycerate and glycine
Glufosinate
Relative metabolite content
-0,5 0,0 0,5 1,0 1,5 2,0 2,5
Leucine
Succinic acid
Glutaric acid, 2-oxo-
Phenylalanine
Citric acid
1 h 3 h 6 h 12 h 24 h
A
B
Fig. 2 Metabolic changes
following treatment of
Arabidopsis thaliana plants
with the herbicide glufosinate.
The graph shows the five most
variant metabolites samples to
the left of the line are increased
in content following treatment,
samples to the right are
decreased in content following
treatment. Data are presented on
a logarithmic (base10) scale and
are the mean of four
independent samples. The full
dataset is viewable in
Supplemental Table I
280 S. Trenkamp et al.
123
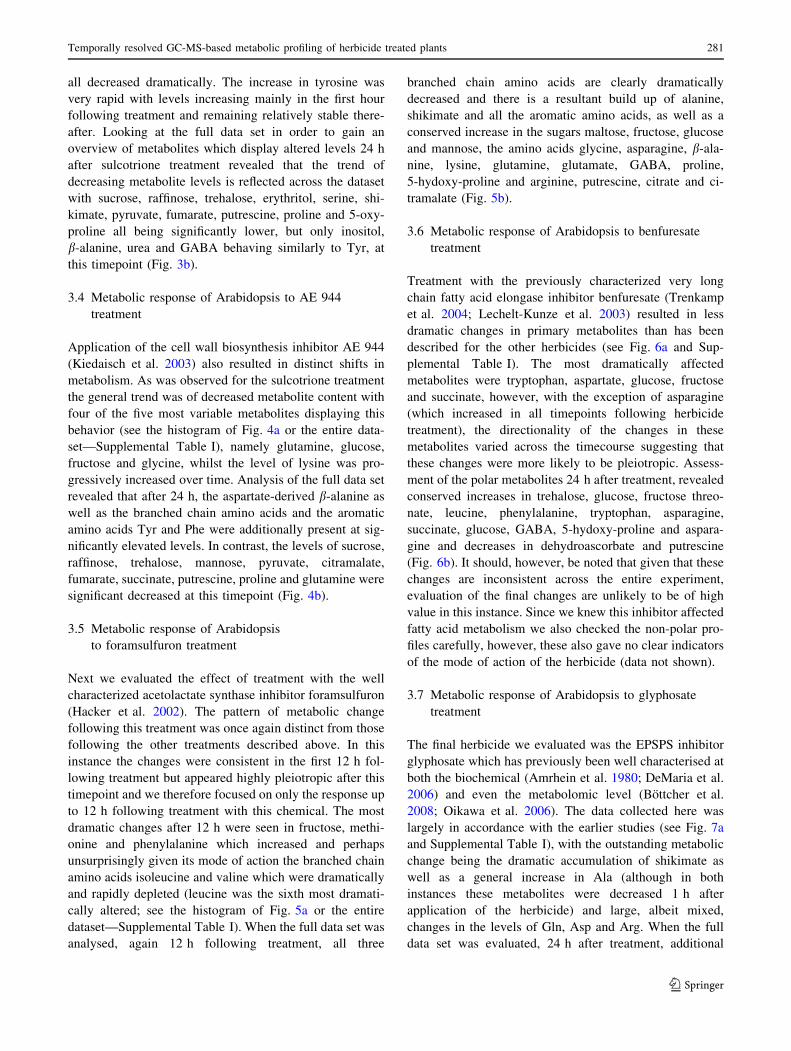
all decreased dramatically. The increase in tyrosine was
very rapid with levels increasing mainly in the first hour
following treatment and remaining relatively stable there-
after. Looking at the full data set in order to gain an
overview of metabolites which display altered levels 24 h
after sulcotrione treatment revealed that the trend of
decreasing metabolite levels is reflected across the dataset
with sucrose, raffinose, trehalose, erythritol, serine, shi-
kimate, pyruvate, fumarate, putrescine, proline and 5-oxy-
proline all being significantly lower, but only inositol,
b-alanine, urea and GABA behaving similarly to Tyr, at
this timepoint (Fig. 3b).
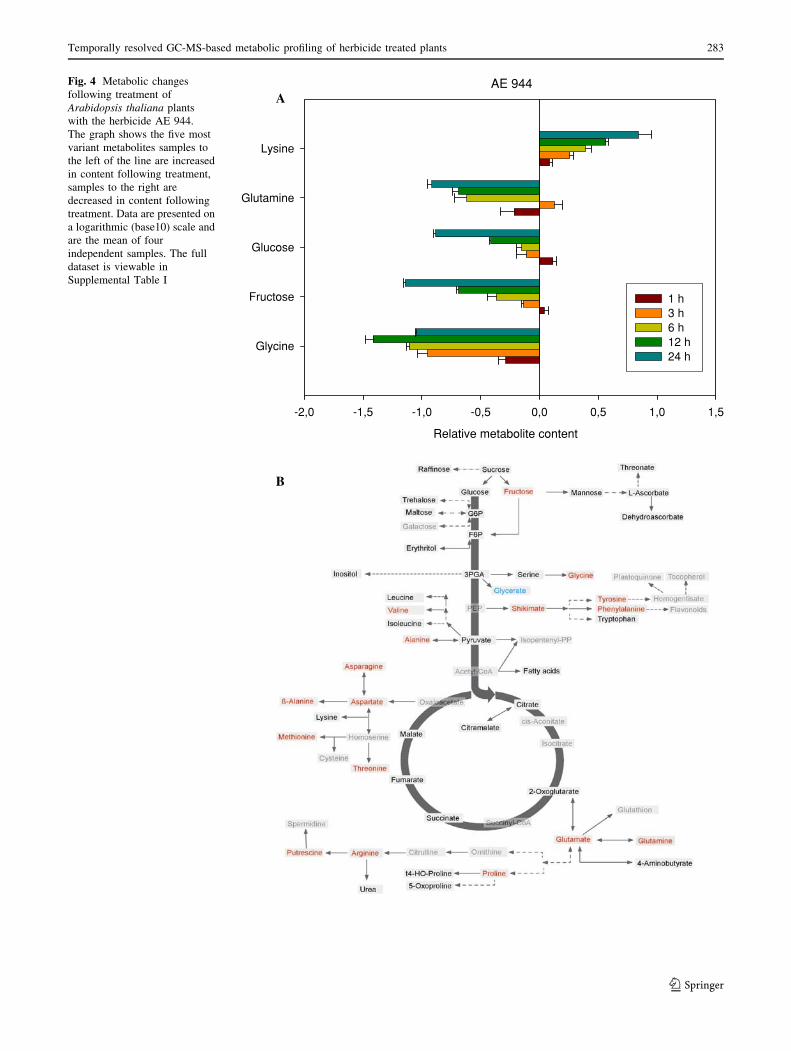
3.4 Metabolic response of Arabidopsis to AE 944
treatment
Application of the cell wall biosynthesis inhibitor AE 944
(Kiedaisch et al. 2003) also resulted in distinct shifts in
metabolism. As was observed for the sulcotrione treatment
the general trend was of decreased metabolite content with
four of the five most variable metabolites displaying this
behavior (see the histogram of Fig. 4a or the entire data-
set—Supplemental Table I), namely glutamine, glucose,
fructose and glycine, whilst the level of lysine was pro-
gressively increased over time. Analysis of the full data set
revealed that after 24 h, the aspartate-derived b-alanine as
well as the branched chain amino acids and the aromatic
amino acids Tyr and Phe were additionally present at sig-
nificantly elevated levels. In contrast, the levels of sucrose,
raffinose, trehalose, mannose, pyruvate, citramalate,
fumarate, succinate, putrescine, proline and glutamine were
significant decreased at this timepoint (Fig. 4b).
3.5 Metabolic response of Arabidopsis
to foramsulfuron treatment
Next we evaluated the effect of treatment with the well
characterized acetolactate synthase inhibitor foramsulfuron
(Hacker et al. 2002). The pattern of metabolic change
following this treatment was once again distinct from those
following the other treatments described above. In this
instance the changes were consistent in the first 12 h fol-
lowing treatment but appeared highly pleiotropic after this
timepoint and we therefore focused on only the response up
to 12 h following treatment with this chemical. The most
dramatic changes after 12 h were seen in fructose, methi-
onine and phenylalanine which increased and perhaps
unsurprisingly given its mode of action the branched chain
amino acids isoleucine and valine which were dramatically
and rapidly depleted (leucine was the sixth most dramati-
cally altered; see the histogram of Fig. 5a or the entire
dataset—Supplemental Table I). When the full data set was
analysed, again 12 h following treatment, all three
branched chain amino acids are clearly dramatically
decreased and there is a resultant build up of alanine,
shikimate and all the aromatic amino acids, as well as a
conserved increase in the sugars maltose, fructose, glucose
and mannose, the amino acids glycine, asparagine, b-ala-
nine, lysine, glutamine, glutamate, GABA, proline,
5-hydoxy-proline and arginine, putrescine, citrate and ci-
tramalate (Fig. 5b).
3.6 Metabolic response of Arabidopsis to benfuresate
treatment
Treatment with the previously characterized very long
chain fatty acid elongase inhibitor benfuresate (Trenkamp
et al. 2004; Lechelt-Kunze et al. 2003) resulted in less
dramatic changes in primary metabolites than has been
described for the other herbicides (see Fig. 6a and Sup-
plemental Table I). The most dramatically affected
metabolites were tryptophan, aspartate, glucose, fructose
and succinate, however, with the exception of asparagine
(which increased in all timepoints following herbicide
treatment), the directionality of the changes in these
metabolites varied across the timecourse suggesting that
these changes were more likely to be pleiotropic. Assess-
ment of the polar metabolites 24 h after treatment, revealed
conserved increases in trehalose, glucose, fructose threo-
nate, leucine, phenylalanine, tryptophan, asparagine,
succinate, glucose, GABA, 5-hydoxy-proline and aspara-
gine and decreases in dehydroascorbate and putrescine
(Fig. 6b). It should, however, be noted that given that these
changes are inconsistent across the entire experiment,
evaluation of the final changes are unlikely to be of high
value in this instance. Since we knew this inhibitor affected
fatty acid metabolism we also checked the non-polar pro-
files carefully, however, these also gave no clear indicators
of the mode of action of the herbicide (data not shown).
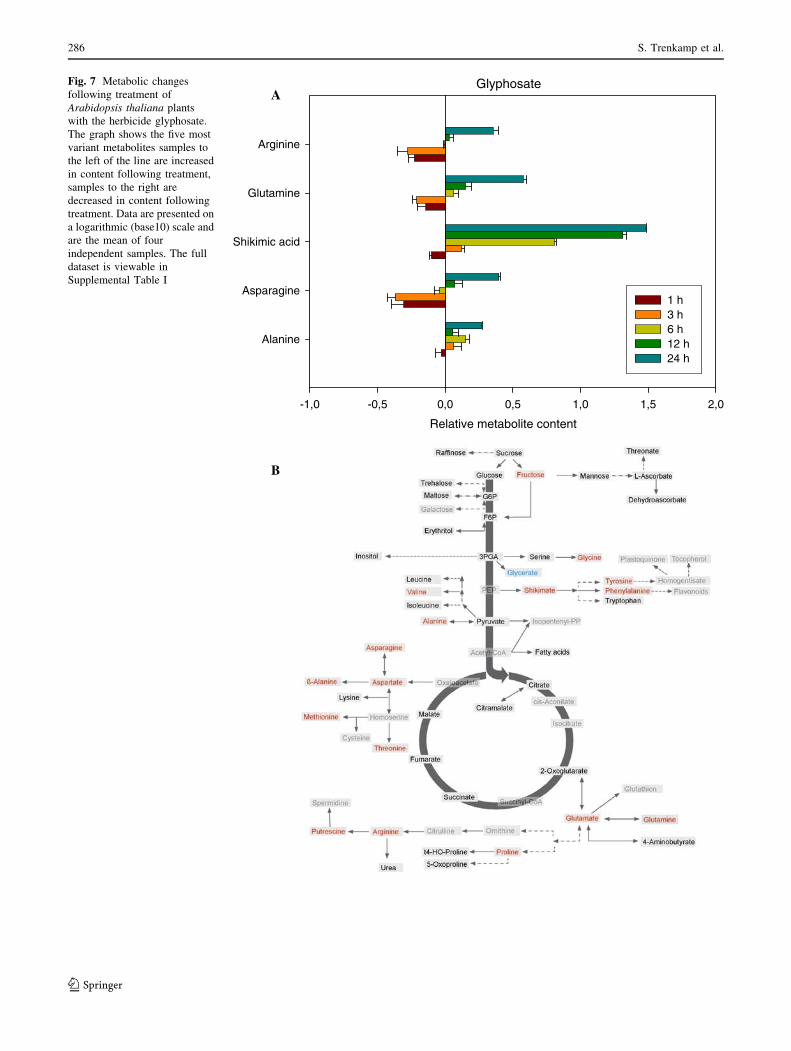
3.7 Metabolic response of Arabidopsis to glyphosate
treatment
The final herbicide we evaluated was the EPSPS inhibitor
glyphosate which has previously been well characterised at
both the biochemical (Amrhein et al. 1980; DeMaria et al.
2006) and even the metabolomic level (Bottcher et al.
2008; Oikawa et al. 2006). The data collected here was
largely in accordance with the earlier studies (see Fig. 7a
and Supplemental Table I), with the outstanding metabolic
change being the dramatic accumulation of shikimate as
well as a general increase in Ala (although in both
instances these metabolites were decreased 1 h after
application of the herbicide) and large, albeit mixed,
changes in the levels of Gln, Asp and Arg. When the full
data set was evaluated, 24 h after treatment, additional
Temporally resolved GC-MS-based metabolic profiling of herbicide treated plants 281
123
Sulcotrione
Relative metabolite level
-2,0 -1,5 -1,0 -0,5 0,0 0,5 1,0 1,5
Glycine
Glyceric acid
Fructose
Glucose
Tyrosine
1 h 3 h 6 h 12 h 24 h
A
B
Fig. 3 Metabolic changes
following treatment of
Arabidopsis thaliana plants
with the herbicide sulcotrione.
The graph shows the five most
variant metabolites samples to
the left of the line are increased
in content following treatment,
samples to the right are
decreased in content following
treatment. Data are presented on
a logarithmic (base10) scale and
are the mean of four
independent samples. The full
dataset is viewable in
Supplemental Table I
282 S. Trenkamp et al.
123
AE 944
Relative metabolite content
-2,0 -1,5 -1,0 -0,5 0,0 0,5 1,0 1,5
Glycine
Fructose
Glucose
Glutamine
Lysine
1 h 3 h 6 h 12 h 24 h
A
B
Fig. 4 Metabolic changes
following treatment of
Arabidopsis thaliana plants
with the herbicide AE 944.
The graph shows the five most
variant metabolites samples to
the left of the line are increased
in content following treatment,
samples to the right are
decreased in content following
treatment. Data are presented on
a logarithmic (base10) scale and
are the mean of four
independent samples. The full
dataset is viewable in
Supplemental Table I
Temporally resolved GC-MS-based metabolic profiling of herbicide treated plants 283
123

increases were observed in levels of fructose, glycine,
tyrosine, phenylalanine, valine, asparagine, aspartate,
b-alanine, methionine, tyrosine, glutamate, glutamine,
praline, arginine and putrescine. By contrast, the levels of
glycerate were significantly decreased at this time point
(Fig. 7b).
Foramsulfuron
Relative metabolite level
-1,5 -1,0 -0,5 0,0 0,5 1,0 1,5
Valine
Isoleucine
Methionine
Phenylalanine
Fructose
1 h 3 h 6 h 12 h 24 h
A
B
Fig. 5 Metabolic changes
following treatment of
Arabidopsis thaliana plants
with the herbicide
formasulfuron. The graph shows
the five most variant metabolites
samples to the left of the line are
increased in content following
treatment, samples to the right
are decreased in content
following treatment. Data are
presented on a logarithmic
(base10) scale and are the mean
of four independent samples.
The full dataset is viewable in
Supplemental Table I
284 S. Trenkamp et al.
123

Benfuresate
Relative metabolite level
-0,4 -0,2 0,0 0,2 0,4 0,6 0,8 1,0 1,
Succinic acid
Asparagine
Fructose
Glucose
Tryptophan
1 h 3 h 6 h 12 h 24 h
A
B
Fig. 6 Metabolic changes
following treatment of
Arabidopsis thaliana plants
with the herbicide benfuresate.
The graph shows the five most
variant metabolites samples to
the left of the line are increased
in content following treatment,
samples to the right are
decreased in content following
treatment. Data are presented on
a logarithmic (base10) scale and
are the mean of four
independent samples. The full
dataset is viewable in
Supplemental Table I
Temporally resolved GC-MS-based metabolic profiling of herbicide treated plants 285
123
Glyphosate
Relative metabolite content
-1,0 -0,5 0,0 0,5 1,0 1,5 2,0
Alanine
Asparagine
Shikimic acid
Glutamine
Arginine
1 h 3 h 6 h 12 h 24 h
A
B
Fig. 7 Metabolic changes
following treatment of
Arabidopsis thaliana plants
with the herbicide glyphosate.
The graph shows the five most
variant metabolites samples to
the left of the line are increased
in content following treatment,
samples to the right are
decreased in content following
treatment. Data are presented on
a logarithmic (base10) scale and
are the mean of four
independent samples. The full
dataset is viewable in
Supplemental Table I
286 S. Trenkamp et al.
123
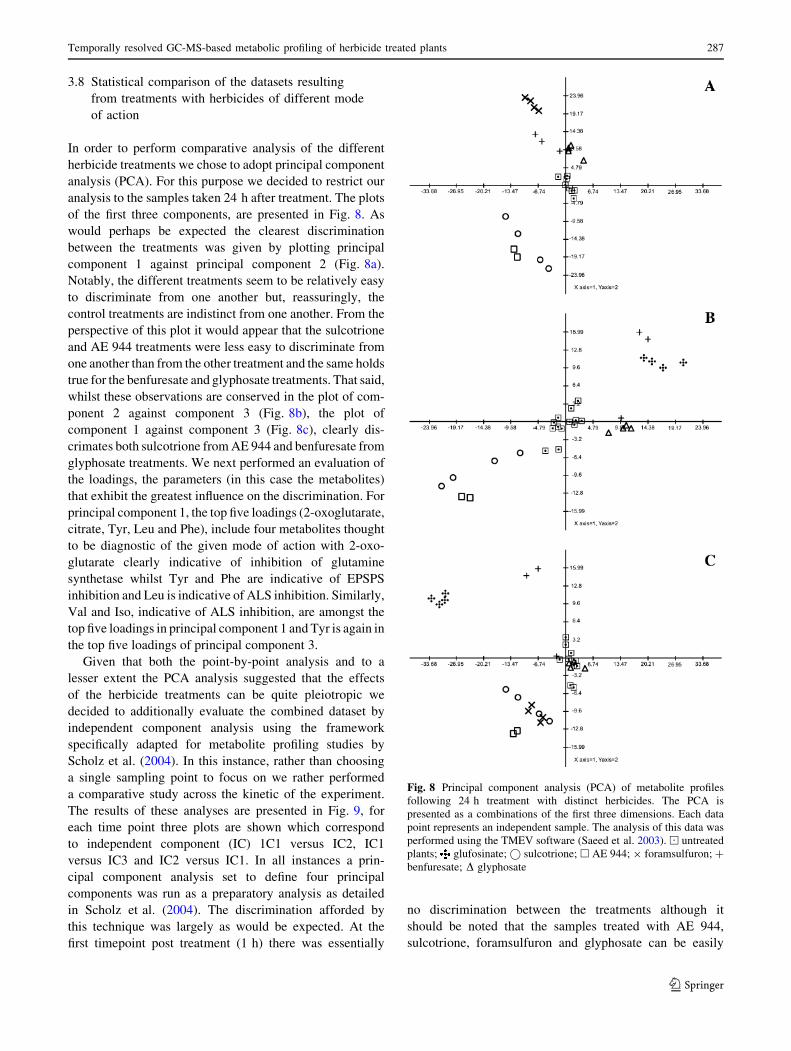
3.8 Statistical comparison of the datasets resulting
from treatments with herbicides of different mode
of action
In order to perform comparative analysis of the different
herbicide treatments we chose to adopt principal component
analysis (PCA). For this purpose we decided to restrict our
analysis to the samples taken 24 h after treatment. The plots
of the first three components, are presented in Fig. 8. As
would perhaps be expected the clearest discrimination
between the treatments was given by plotting principal
component 1 against principal component 2 (Fig. 8a).
Notably, the different treatments seem to be relatively easy
to discriminate from one another but, reassuringly, the
control treatments are indistinct from one another. From the
perspective of this plot it would appear that the sulcotrione
and AE 944 treatments were less easy to discriminate from
one another than from the other treatment and the same holds
true for the benfuresate and glyphosate treatments. That said,
whilst these observations are conserved in the plot of com-
ponent 2 against component 3 (Fig. 8b), the plot of
component 1 against component 3 (Fig. 8c), clearly dis-
crimates both sulcotrione from AE 944 and benfuresate from
glyphosate treatments. We next performed an evaluation of
the loadings, the parameters (in this case the metabolites)
that exhibit the greatest influence on the discrimination. For
principal component 1, the top five loadings (2-oxoglutarate,
citrate, Tyr, Leu and Phe), include four metabolites thought
to be diagnostic of the given mode of action with 2-oxo-
glutarate clearly indicative of inhibition of glutamine
synthetase whilst Tyr and Phe are indicative of EPSPS
inhibition and Leu is indicative of ALS inhibition. Similarly,
Val and Iso, indicative of ALS inhibition, are amongst the
top five loadings in principal component 1 and Tyr is again in
the top five loadings of principal component 3.
Given that both the point-by-point analysis and to a
lesser extent the PCA analysis suggested that the effects
of the herbicide treatments can be quite pleiotropic we
decided to additionally evaluate the combined dataset by
independent component analysis using the framework
specifically adapted for metabolite profiling studies by
Scholz et al. (2004). In this instance, rather than choosing
a single sampling point to focus on we rather performed
a comparative study across the kinetic of the experiment.
The results of these analyses are presented in Fig. 9, for
each time point three plots are shown which correspond
to independent component (IC) 1C1 versus IC2, IC1
versus IC3 and IC2 versus IC1. In all instances a prin-
cipal component analysis set to define four principal
components was run as a preparatory analysis as detailed
in Scholz et al. (2004). The discrimination afforded by
this technique was largely as would be expected. At the
first timepoint post treatment (1 h) there was essentially
no discrimination between the treatments although it
should be noted that the samples treated with AE 944,
sulcotrione, foramsulfuron and glyphosate can be easily
Fig. 8 Principal component analysis (PCA) of metabolite profiles
following 24 h treatment with distinct herbicides. The PCA is
presented as a combinations of the first three dimensions. Each data
point represents an independent sample. The analysis of this data was
performed using the TMEV software (Saeed et al. 2003). ) untreated
plants; glufosinate;� sulcotrione; h AE 944; 9 foramsulfuron; ?
benfuresate; D glyphosate
Temporally resolved GC-MS-based metabolic profiling of herbicide treated plants 287
123

spotted in the Plot of IC2 versus IC3 at this timepoint.
Three and six hours after treatment the separation of
samples treated with these three herbicides was even
clearer being obvious in all three plots. Twenty-four
hours after treatment the glufosinate treated samples
could additionally be clearly discriminated. The ben-
furesate samples were never clearly separable from the
control samples—even when the analysis of lipophillic
compounds was taken into consideration (data not
shown).
4 Discussion
To combat crop losses to pests or weeds comprehensive
strategies have recently been adopted including saturation
Fig. 9 Independent component
analysis (ICA) of metabolite
profiles of distinct herbicide
treatments following different
treatment timespans. Separate
ICA are presented for each
timepoint. The analysis of this
data was performed on the basis
of the first four principal
components using the
MetGenAlyse software (Scholz
et al. 2004). ) untreated plants;
glufosinate; � sulcotrione;
h AE 944; 9 foramsulfuron; ?
benfuresate; D glyphosate
288 S. Trenkamp et al.
123

transgenesis approaches to search for suitable herbicidal
targets (Lein et al. 2004) as well as the application of
genomics level screening methodologies such as transcript
(Eckes nad Busch 2007; Yip et al. 1992; Raghavan et al.
2006), or metabolic profiling (Ott et al. 2003; Oikawa et al.
2006). Whilst the work described by Oikawa et al. observed
the effects of herbicides supplied via the growth media over a
longer time period, we favored a system by which plants
were grown under very highly standardized conditions and
then sprayed at a highly controlled developmental stage.
Post-application plant material was also harvested at set
times in a carefully controlled manner. The reasons for tak-
ing this approach were two-fold. Firstly, especially given our
interest in changes at the level of the single metabolites
themselves, we wanted to adopt as strict a procedure as
possible in order to minimize pleiotropic or secondary
effects that were not a direct consequence of the herbicide
treatment. Secondly, application by spray was much more
appropriate for the herbicides that we chose to work with
here since this is the manner by which they are predomi-
nantly applied in the field. This approach allowed us to do
two things. Firstly, we were able to demonstrate that simply
measuring the polar phase of a simple ethanol extract by GC-
MS produced data that enabled us to discriminate the her-
bicide treated samples from wild type in all the experiments.
Intriguingly this was also true for the statistical tools PCA
and ICA. That the treatments could be discriminated from
one another using this approach was reassuring but perhaps
not so surprising. Such discrimination had previously been
demonstrated using similar statistical approaches following
FT-ICR-MS analysis (Oikawa et al. 2006) and following
machine learning approaches on the smaller metabolite data
sets produced by NMR analysis (Ott et al. 2003). However,
given the low unit cost of a standard GC-MS run (Stitt and
Fernie 2003), these results highlight the potential of the
approach taken here for high-throughput screening of novel
agrochemicals.
The time-dependent sampling approach described here
allowed us to identify metabolites that responded rapidly
to the effects of the various herbicides. For several of the
herbicides this strategy was highly effective. Of particular
note are the five most effected metabolites following
treatment with foramsulfuron, glufosinate and glyphosate
with all three treatments showing metabolic changes
previously characterized following these treatments
(Gaston et al. 2003; Ray 1984; Servaites et al. 1987;
Barsch et al. 2006; Bottcher et al. 2008), within a very
short timeframe. Indeed after 24 h those plants treated
with foramsulfuron displayed a metabolic profile that was
not consistent with the mode of action—most probably
due to a combination of pleiotropic and adaptive effects.
Similarly the consistent increase in tryptophan in samples
treated with sulcotrione is in accordance with its action as
a 4-HPPD inhibitor (Pallett 2000) and likewise the
accumulation of sugars following the treatment with AE
944 are what would be anticipated from a cell wall bio-
synthesis inhibitor (Kiedaisch et al. 2003). When taken
together these five examples provide strong evidence that
time-dependent metabolite profiling by GC-MS can aid in
the identification of the mode of action of herbicides. The
fact that many compounds with herbicidal activity exert
their effects through the disruption of primary metabolism
renders it likely that the coverage afforded by GC-MS
approaches (Fernie et al. 2004) will be suitable for the
detection of many different classes of herbicides. As a
caveat to this statement it should be noted that the
metabolite profiles following treatment with benfuresate
provided little clue to its mode of action. Perhaps sur-
prisingly, this was also true following GC-MS profiling of
the lipophilic metabolites of samples collected following
this treatment. That said further studies are probably
required on compounds of similar mode of action to
benfuresate in order to evaluate if there are metabolites
diagnostic of very long chain fatty acid elongase inhibi-
tion present within the subset of metabolites accessible by
this method.
In summary, in this article we have shown that a time
dependent approach for GC-MS profiling based on serial
sampling following herbicidal spray is likely to have high
utility in aiding the process of mode of action identifi-
cation of agrochemicals. The advantage of this approach
is that it allows the discrimination of early and adaptive
responses and is therefore more likely to facilitate a
correct identification of the metabolic pathway or process
that the herbicide is working on. Metabolic profiling of
herbicide treated samples is also likely to be increasingly
important given increasing public awareness with respect
to crop safety issues (Catchpole et al. 2005; Shepherd
et al. 2005). It should be noted that this approach has
clear limitations, for example it was unable to provide
useful clues to the mode of action of the very long chain
fatty acid elongase inhibitor benfuresate and for certain
other classes of herbicides—for example those that effect
hormonal aspects of plant function. It, therefore, seems
likely that for certain compound classes specific proto-
cols, such as those used for determination of very long
chain fatty acid elongase inhibitors (Trenkamp et al.
2004), are likely to retain their utility. That said, the fact
that the identification of the mode of action of some of
the inhibitors was facile on the basis of the behaviour of
diagnostic metabolites suggests that this approach will
likely play an important role in the acceleration of novel
herbicide mode of action discoveries.
Acknowledgement We thank Nicolas Schauer for help in the early
stages of this project, Sonia Osario-Algar for help with the figures and
Temporally resolved GC-MS-based metabolic profiling of herbicide treated plants 289
123

Corinna van Almsick and Franka Hubner for plant cultivation and
spray application
Open Access This article is distributed under the terms of the
Creative Commons Attribution Noncommercial License which per-
mits any noncommercial use, distribution, and reproduction in any
medium, provided the original author(s) and source are credited.
References
Aharoni, A., de Vos, R. C. H., Verhoeven, H. A., Maliepaard, C. A.,
Kruppa, G., Bino, R., et al. (2002). Non-targeted metabolome
analysis by use of Fourier Transform Ion Cyclotron Mass
Spectrometry. OMICS, 6, 217–234. doi:10.1089/153623102602
56882.
Amrhein, N., Schab, J., & Steinrucken, H. C. (1980). The mode of
action of glyphosate. Naturwissenschaft, 67, 356–357. doi:
10.1007/BF01106593.
Aranibar, N., Singh, B. K., Stockton, G. W., & Ott, K. H. (2001).
Automated mode of action detection by metabolic profiling.
Biochemical and Biophysical Research Communications, 286,
150–155. doi:10.1006/bbrc.2001.5350.
Barsch, A., Carvalho, H. G., Cullimore, J. V., & Niehaus, K. (2006).
GC-MS profiling implies three independent ways of ammonium
assimilation in Medicago truncatula root nodules. Journal ofBiotechnology, 127, 79–83. doi:10.1016/j.jbiotec.2006.06.007.
Bottcher, C., Centeno, D., Freitag, J., Hofgen, R., Kohl, K., Kopka, J.,
et al. (2008). Teaching (and learning from) metabolomics: The
2006 PlantMetaNet ETNA Metabolomics research school.
Physiologia Plantarum, 132, 136–144.
Brindle, J. T., Antti, H., Holmes, E., Tranter, G., Nicholson, J. K.,
Bethell, H. W. L., et al. (2002). Rapid and non-invasive
diagnosis of the presence and severity of coronary heart disease
using H-1-NMR-based metabonomics. Nature Medicine, 8,
1439–1444. doi:10.1038/nm802.
Catchpole, G. S., Beckmann, M., Enot, D. P., Mondhe, M., Zywicki,
B., Taylor, J., et al. (2005). Hierarchical metabolomics demon-
strates substantial composition similarity between genetically
modified and conventional potato crops. Proceedings of theNational Academy of Sciences of the United States of America,102, 14458–14462. doi:10.1073/pnas.0503955102.
DeMaria, N., Becerril, J. M., Garcia-Plazaola, J. I., Hernandez, A., De
Felipe, M. R., & Fernandez-Pascual, M. (2006). New insights on
glyphosate mode of action in nodular metabolism: role of
shikimate accumulation. Journal of Agricultural and FoodChemistry, 54, 2621–2628. doi:10.1021/jf058166c.
Eckes, P., & Busch, M. (2007). Fast identification of the mode of
action of herbicides by DNA chips. In W. Kramer & U. Schirmer
(Eds.), Modern crop protection compounds (pp. 1161–1174).
Weinheim, Germany: Wiley.
Fernie, A. R., Trethewey, R. N., Krotzky, A., & Willmitzer, L.
(2004). Metabolite profiling: From diagnostics to systems
biology. Nature Reviews. Molecular Cell Biology, 5, 763–769.
doi:10.1038/nrm1451.
Fiehn, O., Kopka, J., Dormann, P., Altmann, T., Trethewey, R. N., &
Willmitzer, L. (2000). Metabolic profiling for plant functional
genomics. Nature Biotechnology, 18, 1157–1161. doi:10.1038/
81137.
Gaston, S., Ribas-Carbo, M., Busquets, S., Berry, J. A., Zabalaza, A.,
& Royuela, M. (2003). Changes in mitochondrial electron
partitioning in response to herbicides inhibiting branched chain
amino acid biosynthesis in soybean. Plant Physiology, 133,
1351–1359. doi:10.1104/pp.103.027805.
Hacker, E., Bieringer, H., Willms, L., Schnabel, G., Koecher, H.,
Hagenteister, H., et al. (2002). Foramsulfuron plus safener—a
new technology for weed control in maize. Journal of PlantDiseases and Protection, 18(Special Issue), 747–756.
Iijima, Y., Nakamura, Y., Ogata, Y., Tanaka, K., Sakurai, N., Suda,
K., et al. (2008). Metabolite annotations based on the integration
of mass spectral information. The Plant Journal, 54, 949–962.
doi:10.1111/j.1365-313X.2008.03434.x.
Kiedaisch, B. M., Blanton, R. L., & Haigler, C. H. (2003).
Characterisation of a novel cellulose synthesis inhibitor. Planta,217, 922–930. doi:10.1007/s00425-003-1071-y.
Kopka, J., Schauer, N., Krueger, S., Birkmeyer, C., Usadel, B.,
Bergmuller, E., et al. (2005). [email protected]: the Golm
Metabolome Database. Bioinformatics (Oxford, England), 21,
1635–1638. doi:10.1093/bioinformatics/bti236.
Lechelt-Kunze, C., Meissner, R. C., Drewes, M., & Tietjen, K.
(2003). Flufenacet herbicide treatment phenocopies the fiddle-
head mutant in Arabidopsis thaliana. Pest Management Science,59, 847–856. doi:10.1002/ps.714.
Lein, W., Bornke, F., Reindl, A., Erhardt, T., Stitt, M., & Sonnewald,
U. (2004). Target-based discovery of novel herbicides. CurrentOpinion in Plant Biology, 7, 219–225. doi:10.1016/j.pbi.2004.
01.001.
Lisec, J., Schauer, N., Kopka, J., Willmitzer, L., & Fernie, A. R.
(2006). Gas chromatrography mass spectrometry-based metab-
olite profiling in plants. Nature Protocols, 1, 387–396. doi:
10.1038/nprot.2006.59.
Menne, H., & Kocher, H. (2007). HRAC classification of herbicides
and resistance development. In W. Kramer & U. Schirmer
(Eds.), Modern crop protection compounds (pp. 5–26). NY:
Wiley.
Oikawa, A., Nakamura, Y., Ogura, T., Kimura, A., Suzuki, H.,
Sakarai, N., et al. (2006). Clarification of pathway-specific
inhibition by Fourier transform ion cyclotron resonance/mass
spectrometry-based metabolic phenotyping studies. Plant Phys-iology, 142, 398–413. doi:10.1104/pp.106.080317.
Ott, K. H., Aranibar, N., Singh, B. J., & Stockton, G. W. (2003).
Metabononics classifies pathways affected by bioactive com-
pounds. Artificial neural network classification of NMR spectra
of plant extracts. Phytochemistry, 62, 971–985. doi:10.1016/
S0031-9422(02)00717-3.
Pallett, K. E. (2000). Mode of action of isoxaflutole—a case study of
an emerging target site. In A. H. Cobb & R. C. Kirkwood (Eds.),
Herbicides and their mechanisms of action (pp. 215–238).
Sheffield: Sheffield Academic Press.
Petroff, O. A. C. (1988). Biological 1HNMR spectroscopy. Compar-ative Biochemistry and Physiology, 90B, 249–260.
Raghavan, C., Ong, E. K., Dalling, M. J., & Stevenson, T. W. (2006).
Regulation of genes associated with auxin, ethylene and ABA
pathways by 2-4-dichlorophenoxyacetic acid in Arabidopsis.
Functional and Integrative Genomics, 6, 60–70. doi:10.1007/
s10142-005-0012-1.
Ray, T. B. (1984). Site of action of chlorsulfon. Plant Physiology,133, 1351–1359.
Roessner, U., Luedemann, A., Brust, D., Fiehn, O., Linke, T.,
Willmitzer, L., et al. (2001). Metabolite profiling allows
comprehensive phenotyping of genetically or environmentally
modified plant systems. The Plant Cell, 13, 11–29.
Saeed, A. I., Sharov, V., White, J., Li, J., Liang, W., Bhagabati, N.,
et al. (2003). TM4: A free open-source system for microarray
data management and analysis. BioTechniques, 34, 374–378.
Sauter, H., Lauer, M., & Fritsch, H. (1991). Metabolic profiling of
plants—a new diagnostic technique. In D. R. Baker, J. G.
Fenyes, & M. K. Moberg (Eds.), Synthesis and chemistry ofAgrochemicals II. ACS Symposium Series 443 (pp. 288–299).
Washington, DC: American Chemical Society.
290 S. Trenkamp et al.
123
Schauer, N., Semel, Y., Roessner, U., Gur, A., Balbo, I., Carrari, F.,
et al. (2006). Comprehensive metabolic profiling and phenotyp-
ing of interspecific introgression lines for tomato improvement.
Nature Biotechnology, 24, 447–454. doi:10.1038/nbt1192.
Schauer, N., Steinhauser, D., Strelkov, S., Schomburg, D., Allison,
G., Moritz, T., et al. (2005). GC-MS libraries for the rapid
identification of metabolites in complex biological samples.
FEBS Letters, 579, 1332–1337. doi:10.1016/j.febslet.2005.01.
029.
Scholz, M., Gatzek, S., Sterling, A., Fiehn, O., & Selbig, J. (2004).
Metabolic fingerprinting: Detecting biological features by inde-
pendent component analysis. Bioinformatics, 20, 2447–2454.
Schulz, A., Ort, O., Beyer, P., & Kleinig, H. (1993). SC-0051, a 2-
benzoyl-cyclohexane-1, 3-dione bleaching herbicide, is a potent
inhibitor of the enzyme 4-hydroxyphenylpyruvate dioxygenase.
FEBS Letters, 319, 162–166. doi:10.1016/0014-5793(93)80013-K.
Servaites, J. C., Tucci, M. A., & Geiger, D. R. (1987). Glyphosate
effects on carbon assimilation, ribulose bisphosphate carboxyl-
ase activity, and metabolite levels in sugar beet leaves. PlantPhysiology, 85, 370–374.
Stitt, M., & Fernie, A. R. (2003). From measurements of metabolites to
metabolomics an ‘‘on the fly’’ perspective illustrated by recent
studies of carbon-nitrogen interactions. Current Opinion in Bio-technology, 14, 136–144. doi:10.1016/S0958-1669(03)00023-5.
Shepherd, L. V. T., McNicol, J. W., Razzo, R., Taylor, M. A., Davies,
H. V., & McNicol, J. W. (2005). Assessing the potential for
unintended effects in genetically modified potatoes perturbed in
metabolic and developmental processes. Targeted analaysis of
key nutrients and anti-nutrients. Transgenic Research, 15, 409–
425. doi:10.1007/s11248-006-0012-5.
Trenkamp, S., Martin, W., & Tietjen, K. (2004). Specific and
differential inhibition of very-long chain fatty acid elongases
from Arabidopsis thaliana by different herbicides. Proceedingsof the National Academy of Sciences of the United States ofAmerica, 101, 11903–11908. doi:10.1073/pnas.0404600101.
Yip, W. K., Moore, T., & Yang, S. F. (1992). Differential
accumulation of transcripts for four tomato 1-aminocyclopro-
pane-1-carboxylate synthase homologs under various conditions.
Proceedings of the National Academy of Sciences of the UnitedStates of America, 89, 2475–2479. doi:10.1073/pnas.89.6.2475.
Temporally resolved GC-MS-based metabolic profiling of herbicide treated plants 291
123