temporal evolution of the laser-induced plasma...
TRANSCRIPT

Temporal evolution of the laser-induced plasma generated by IR CO2pulsed laser on carbon targetsJ. J. Camacho, L. Díaz, M. Santos, L. J. Juan, and J. M. L. Poyato Citation: J. Appl. Phys. 106, 033306 (2009); doi: 10.1063/1.3190542 View online: http://dx.doi.org/10.1063/1.3190542 View Table of Contents: http://jap.aip.org/resource/1/JAPIAU/v106/i3 Published by the American Institute of Physics. Related ArticlesCharacteristics of a cylindrical collector mirror for laser-produced xenon plasma soft X-rays and improvement ofmirror lifetime by buffer gas Rev. Sci. Instrum. 83, 123110 (2012) Coherent microwave radiation from a laser induced plasma Appl. Phys. Lett. 101, 264105 (2012) Evidence for ultra-fast heating in intense-laser irradiated reduced-mass targets Phys. Plasmas 19, 122708 (2012) Ablation driven by hot electrons generated during the ignitor laser pulse in shock ignition Phys. Plasmas 19, 122705 (2012) Dynamics of femto- and nanosecond laser ablation plumes investigated using optical emission spectroscopy J. Appl. Phys. 112, 093303 (2012) Additional information on J. Appl. Phys.Journal Homepage: http://jap.aip.org/ Journal Information: http://jap.aip.org/about/about_the_journal Top downloads: http://jap.aip.org/features/most_downloaded Information for Authors: http://jap.aip.org/authors
Downloaded 24 Jan 2013 to 161.111.22.141. Redistribution subject to AIP license or copyright; see http://jap.aip.org/about/rights_and_permissions

Temporal evolution of the laser-induced plasma generated by IR CO2pulsed laser on carbon targets
J. J. Camacho,1,a� L. Díaz,2 M. Santos,2 L. J. Juan,1 and J. M. L. Poyato1
1Departamento de Química-Física Aplicada, Facultad de Ciencias, Universidad Autónoma de Madrid,Cantoblanco, 28049 Madrid, Spain2Instituto de Estructura de la Materia, CFMAC, CSIC, Serrano 121, 28006 Madrid, Spain
�Received 22 May 2009; accepted 2 July 2009; published online 5 August 2009�
Time-resolved optical emission analysis was carried out for the plasma plume, produced byhigh-power tunable IR CO2 pulsed laser ablation of graphite, at �=10.591 �m and in a regime ofrelatively high laser fluences �123–402 J /cm2�. Wavelength-dispersed spectra of the plasma plume,at medium-vacuum conditions �4 Pa� and at 9.0 mm from the target, show ionized species �C+, C2+,C3+, C4+, N2
+ , N+, and O+�, neutral atoms �C, H, N, and O�, and neutral diatomic molecules �C2,CN, OH, CH, and N2�. In this work, we focus our attention on the temporal evolution of differentatomic/ionic and molecular species over a broad spectral range from 190 to 1000 nm. The resultsshow a faster decay for ionic fragments than for neutral atomic and molecular species. The velocityand kinetic energy distributions for different species were obtained from time-of-flightmeasurements using time-resolved optical emission spectroscopy. Possible mechanisms for theproduction of these distributions are discussed. Excitation temperature, electron density, andvibrational temperature in the laser-induced plasma were estimated from the analysis of spectraldata at various times from the laser pulse incidence. © 2009 American Institute of Physics.�DOI: 10.1063/1.3190542�
I. INTRODUCTION
When a powerful focused laser beam interacts with atarget, an intense plasma or spark �brilliant flash� is created.This laser-induced breakdown �LIB� region develops a shockwave into the ambient medium. Laser ablated plasmas arecurrently a topic of considerable interest. Pulsed laser abla-tion �PLA� of graphite is an effective method for the produc-tion of a wide variety of carbon-related materials such asdiamondlike carbon, carbon nanotubes, carbon nitride, andhigh fullerene carbon molecules.1–7 The structure and prop-erties of the prepared materials depend strongly on the con-ditions under which the graphite target is ablated and thematerials are prepared. In this way, information on theprogress of the plasma plume and the transport of the ablatedspecies will be of significant importance in understanding themechanisms of deposited films. Due to the many experimen-tal parameters involved in the PLA, an exhaustive investiga-tion of the plasma plume would involve the processing of animpressive number of records. To investigate the plume ex-pansion process and gas-phase reactions, several diagnostictechniques have been employed in the past years. Because ofthe transient features of the plume created by PLA, opticalemission spectroscopy �OES� technique with time and spaceresolution is especially appropriate to obtain informationabout the behaviors of the ablation created species in spaceand time as well as the dynamics of the plume evolution.This technique with temporal resolution has been used bymany researchers to investigate the graphite ablationplume.8–25 The wavelength and spatially resolved measure-
ments of emission spectra of the CO2 laser ablation plume atthe carbon target have been reported recently by us.26,27
The present paper is aimed at discussing thermochemicalprocesses produced by a high-power IR CO2 pulsed laser ongraphite target and at evaluating laser ablation inducedchanges, which are of fundamental importance in establish-ing the mechanisms responsible for the plasma emission. Inthis work we present some new results obtained from thetime-resolved spectroscopic analysis of the PLA plume. Wediscuss the dynamics of the plume expansion and formationof different atomic, ionic, and molecular species for differentdelay times with respect to the beginning of the laser pulse.The velocity and kinetic distributions for different species�C, C+, C2+, C3+, C2, CN, and N2
+ � were obtained from thetime-of-flight �TOF� measurements using time-resolvedOES. Line intensities from single ionized carbon were usedfor determining electron temperature, and Stark-broadenedprofiles of some lines were employed to calculate electrondensity. Estimates of excitation and vibrational temperaturesand electron density are reported at various times elapsedafter firing the laser pulse. Although OES gives only partialinformation about the plasma particles, this diagnostic tech-nique helped us to draw a picture of the plasma in terms ofthe emitting chemical species, to evaluate their possiblemechanisms of excitation and formation, and to study therole of gas-phase reactions in the plasma expansion process.
II. EXPERIMENTAL
The experimental setup used in this study is presented inFig. 1, and has been partially described in Refs. 26 and 27. Atransverse excitation atmospheric �TEA�-CO2 laser �Lumon-ics model K-103� operating on an 8:8:84 mixture ofa�FAX: �34914974512. Electronic mail: [email protected].
JOURNAL OF APPLIED PHYSICS 106, 033306 �2009�
0021-8979/2009/106�3�/033306/11/$25.00 © 2009 American Institute of Physics106, 033306-1
Downloaded 24 Jan 2013 to 161.111.22.141. Redistribution subject to AIP license or copyright; see http://jap.aip.org/about/rights_and_permissions

CO2:N2:He, respectively, was used in the experiment. TheCO2 laser irradiation of carbon target was carried out usingthe 10P�20� line at �=10.591 �m. The temporal shape ofthe TEA-CO2 laser pulse �see Fig. 2�, monitored with a pho-ton drag detector �Rofin Sinar 7415�, consisted in a promi-nent spike of a full width at half maximum �FWHM��64 ns followed by a long lasting tail of lower energy andabout 3 �s duration. The primary laser beam was angularlydefined and attenuated by a diaphragm of 17.5 mm diameterbefore entering to the cell. The pulsed CO2 laser beam wasperpendicularly focused with a NaCl lens of 24 cm focallength onto the target surface. The CO2 laser energy wasmeasured in front of the lens with a Lumonics 20D pyroelec-tric detector through a Tektronix TDS 540 digital oscillo-
scope. The focused radius of the laser beam was measured atthe target position with a pyroelectric array detector DeltaDevelopment Mark IV. The measured focused-spot area was7.85�10−3 cm2. The measured maximum laser energy was3160 mJ, leading to an estimated power of 49.5 MW, inten-sity �power density or irradiance� of 6.31 GW cm−2, fluenceof 402 J cm−2, photon flux of 3.4�1029 photon cm−2 s−1,and electric field of 1.63 MV cm−1 on the target surface. Thelaser intensity was varied using several calibrated CaF2 at-tenuators. The high purity graphite target ��99.99%� wasplaced in a low-vacuum Pyrex cell of 4.5 cm diameter and43 cm length equipped with a NaCl window for the laserbeam and two quartz windows for optical access. The cellwas evacuated with the aid of a rotary pump, to a base pres-sure of 4 Pa that was measured by a mechanical gauge. Thelight emitted from the laser-induced plasma was opticallyimaged 1:1, at right angles to the normal of the target sur-face, by a quartz lens �focal length 4 cm, f-number= f /2.3�onto the entrance slit of the spectrometer. The distance be-tween the plasma axis and the entrance slit was 16 cm.
Two spectrometers were used: a 1/8 m Oriel spectrom-eter �10 �m slit and grating of 1200 grooves mm−1� in thespectral region 2000–10 500 Å at a resolution of �1.3 Å infirst order; and a 0.32 m ISA Jobin Yvon Spex �modelHR320� spectrometer �adjustable slit and holographic gratingof 2400 grooves mm−1� in the spectral region 1900–7500 Åat a resolution of �0.10 Å in first order. A 1024�1024matrix of 13�13 �m2 individual pixels intensified charge-coupled device �ICCD� �Andor iStar DH-734�, with thermo-electric cooling working at −20 °C, was attached to the exitfocal plane of the spectrographs and used to detect the opti-cal emissions from the laser-induced plasma. For synchroni-zation, the CO2 laser was operated at the internal triggermode and the ICCD detector was operated in external andgate modes. The external trigger signal generated by the laserwas fed directly into the back of the ICCD detector head.The total insertion delay �or propagation delay� is the totallength of time taken for the external trigger pulse to travelthrough the digital delay generator and gater so that theICCD will switch on. This insertion delay time was45�2 ns. The time jitter between the laser and the fastICCD detector gate was about �2 ns. The delay time td is thetime interval between the arrival of the laser pulse on thetarget and the activation of the ICCD detector. The gatewidth delay time tw is the time interval during which theplasma emission is monitored by the ICCD. Both parameterswere adjusted by the digital delay generator of the ICCDdetector �see Fig. 2�. The square box represents the gatewidth time tw. The resolution of the gate pulse delay time andthe gate pulse width time was 25 ps. The CO2 laser pulsepicked up with the photon drag detector triggered a StanfordDG 535 pulse generator through the scope and this pulse wasused as an external trigger in the ICCD camera. The laserpulse and the gate monitor output were displayed in a Tek-tronix TDS 540 digital oscilloscope. In this way, by using theoutput of the photon drag detector, the Tektronix TDS 540digital oscilloscope, the Stanford DG 535 delay pulse gen-
FIG. 1. �Color online� Schematic of the experimental setup of the time gatedICCD for PLA diagnostics.
FIG. 2. �Color online� A schematic overview of the temporal history of LIBcarbon plasma. Here td is the gate delay time and tw is the gate width timeduring which the plasma emission is monitored. The inserts illustrate somespectra observed at different delay and width times. The temporal shape ofthe CO2 laser pulse �recorded with the aid of the photon drag detector� isalso shown.
033306-2 Camacho et al. J. Appl. Phys. 106, 033306 �2009�
Downloaded 24 Jan 2013 to 161.111.22.141. Redistribution subject to AIP license or copyright; see http://jap.aip.org/about/rights_and_permissions
erator, and the gate monitor output of the ICCD camera, thegate width time tw and the gate delay time td could be ad-justed without insertion time.
The intensity response of the detection system was cali-brated with a standard �Osram No. 6438, 6.6 A, 200 W�halogen lamp and Hg/Ar pencil lamp. Several �Cu/Ne, Fe/Ne, and Cr/Ar� hollow cathode lamps �HCLs� were used forthe spectral wavelength calibration of the spectrometers.
III. RESULTS AND DISCUSSION
When a high-power laser pulse is focused on a solidsurface the target becomes ablated. If the laser irradiance inthe focal volume surpasses the breakdown threshold of thesystem formed by the vaporized atoms and residual gas, abreakdown, characterized by a brilliant flash of light accom-panied by a distinctive cracking noise, is produced. At thetop of Fig. 1 we show an image of LIB plasma in graphiteinduced by a single CO2 laser pulse. The plume size lengthwas around 14 cm. The laser was focused on a point at thecenter of the target. The observations of the LIB geometryduring the experiments indicate that the actual plasma regionwas not entirely spherical, but slightly elongated in the di-rection of the laser beam propagation. The CO2 laser pulseremains in the focal volume after the plasma formation forsome significant fraction of its duration and the plasmaformed can be heated to very high temperatures and pres-sures by inverse bremsstrahlung absorption. Since plasmasabsorb radiation much more strongly than ordinary mater,plasmas can block transmission of incoming laser light to asignificant degree; a phenomenon known as “plasmashielding.”28 The high temperatures and pressures producedby plasma absorption can lead to thermal expansion of theplasma at high velocities, producing an audible acoustic sig-nature, shock waves, and cavitation effects. The plasma alsotends to expand back along the beam path toward the laser, aphenomenon known as “moving breakdown.” The shockwave heats up the surrounding gas, which is instantaneouslytransformed in strongly ionized plasma.
A. Time-resolved emission spectra for laser-inducedcarbon plasma
All the experimental measurements were taken with thecarbon target at the focal point of the NaCl lens and focusingthe plasma plume at a constant distance of 9.0 mm from thetarget surface along the plasma expansion direction. Eachfiring of the laser produces a single LIB spectrum. Two dif-ferent types of spectra were recorded: time integrated andtime resolved. In the acquisition of time-integrated spectra, agood signal-to-noise ratio has been obtained averaging eachspectrum over several successive laser pulses. Typically thesignals from 20 laser pulses were averaged and integratedover the entire emission time. In time-resolved measure-ments, the delay td and width tw times were varied. It wasverified that the plasma emission was reproducible overmore than seven ablation events by recording the same spec-trum several times. The temporal history of LIB carbonplasma is illustrated schematically in Fig. 2. The time for thebeginning of the CO2 laser pulse was considered as the ori-
gin of the time scale �t=0�. Inserts illustrate some emissionspectra recorded at different delay and width times. The tem-poral shape of the CO2 laser pulse is also shown.
The LIB spectra of carbon were measured at differentdelay and width times. In a first set of experimental measure-ments, the spectra were obtained at low resolution in thespectral region 200–1000 nm. These spectra �not shown� re-produce particular emission of carbon plasma in a medium-vacuum air atmosphere.26,27 From all these spectra we canobserve that the intensity of ionic species �C+, C2+, C3+, N+,and O+� increases up to �1 �s and decays rapidly at highdelay times. Above �4 �s these species are not observed.The band emission of molecular species as C2, CN, and OHslightly increase up to �4 �s and decrease for high delaytime, being observed up to �15 �s in accordance with themolecule. On the other hand we can see that the line inten-sity of atomic carbon increases up to �1 �s and slowlydecays at high delay times, being observed up to �30 �s.
In order to get more insight into laser ablation of graph-ite and to understand the LIB dynamics, we have scanned inthe UV-visible spectral region with higher resolution �seeSec. II�. As an example some results for the spectral region4640–4750 Å are shown in Figs. 3–5. Figures 3�a� and 3�b�compare two high-resolution spectra. The spectral range waschosen in order to detect both double and triple ionized car-bon species and C2 diatomic molecule. The data acquisitionwas performed by averaging the signal over �a� 20 succes-sive laser shots �td=0 �s and tw�30 �s� and �b� 7 succes-sive laser shots �td=4 �s and tw=0.02 �s�. The intensitiesof the emission of ionized C2+�1s22s3p 3P2,1,0
0
→1s22s3s 3S1� around 4650 Å, and C3+ around 4658.3 Å areconsiderably higher, in the spectrum of Fig. 3�a�, than theC2 �d−a� swan �v=+1 sequence emission. On the otherhand, the intensities of the C2 �d−a� swan �v=+1 sequenceare similar in both experiments �Figs. 3�a� and 3�b��. Figures4 and 5 show the typical temporal sequence of laser-inducedcarbon plasma. At early times �td�0.02 �s� emissions fromC2+ and C3+ are easily detected between 4645 and 4670 Å�see inset within Fig. 4�a��. As seen in Fig. 4�b� during theinitial stages after the laser pulse �td�0.04 �s�, C2+ emis-sions dominate the spectrum. As time evolves �0.04 �s� td�1.5 �s�, C3+ emissions dominate the spectrum. As thedelay is increased up to 2.5 �s �1.5 �s� td�2.5 �s� againC2+ emissions dominate the spectrum. These ionic lines de-crease quickly for higher delay times, being detected up to�3 �s. Some oxygen and nitrogen ionic lines were alsoobserved in the spectra at the gate delay from 0.02 to 1 �sand its emission intensities remain approximately constant inthis time interval �see Fig. 4�a��. They vanish after a delay of�1.5 �s. This shows that the air was ionized by the CO2
laser pulse and by the collisions with the laser-inducedplasma. During the time period up to �0.5 �s, no apparentC2 emissions were observed. As can be seen from Fig. 5, theC2 �d−a; �v=1 band sequence� emissions were clearly ob-served from �2 �s. The C2 emission intensities increaselightly with increasing td, reach a maximum at �5 �s, andthen decrease as the time is further increased.
Figure 6 displays the temporal evolution of the LIBplasma in the spectral region 2425–2570 Å. At early times
033306-3 Camacho et al. J. Appl. Phys. 106, 033306 �2009�
Downloaded 24 Jan 2013 to 161.111.22.141. Redistribution subject to AIP license or copyright; see http://jap.aip.org/about/rights_and_permissions

�td2 �s�, the predominant emitting species areC�2s22p�2P0�3s 1P1
0→2s22p2 1S0� resonance line at 2478.6Å, C+�2p3 2D3/2,5/2
0 →2s2p2 2P1/2,3/2� with two lines at2509.1 and 2512.1 Å, and C3+ with lines at 2524.4 and2530.0 Å. The spectra were recorded with a gate width of 20ns. One can see that immediately after the peak laser pulse�td0.1 �s�, the plasma emission spectrum consists in thepreviously mentioned weak lines of C, C+, and C3+, whichincrease with time. When the delay �0.1� td�1 �s� in-creases such lines steeply enhance as a consequence of theexpansion and heating of the plasma. At longer times �1 td4 �s�, the ion lines of C+ and C3+ significantly de-crease in intensity as a consequence of the expansion andcooling of the plasma plume and its recombination intoground state ions. At longer times �td4 �s� the carbonionic lines disappear while the C neutral line becomes stron-ger and then decays over a much longer period.
Figure 7 shows time-resolved OES from laser-inducedcarbon plasma observed in the region 3830–3960 Å moni-tored at 10, 3, 0.5, 0.05, and 0 �s gate delays for a fixed gatewidth time of 20 ns and time-integrated spectrum �td=0 �sand tw�40 �s�. This last time-integrated spectrum was av-
eraged over 20 laser pulses in order to reduce standard de-viation. At early times �td0.5 �s�, the predominant emit-ting species are several lines of C+ and the v�=0−v�=0 bandof N2
+ �B 2�u+-X 2�g
+� at �3915 Å. Also a very weak emis-sion from CN �B 2�+-X 2�+; �v=0 sequence� is observed.At td=0.5 �s, the 0-0 band of N2
+ practically disappears.When the delay increases �0.5� td�3 �s�, the emission in-tensities of CN rovibrational lines are slightly enhanced as aconsequence of the expansion and heating of the plasma. Atlonger times �td3 �s�, the ion lines of C+ significantlydecrease in intensity as a consequence of the expansion andcooling of the plasma plume and its recombination intoground state ions. Moreover, the CN molecular bands de-crease being observed up to �12 �s.
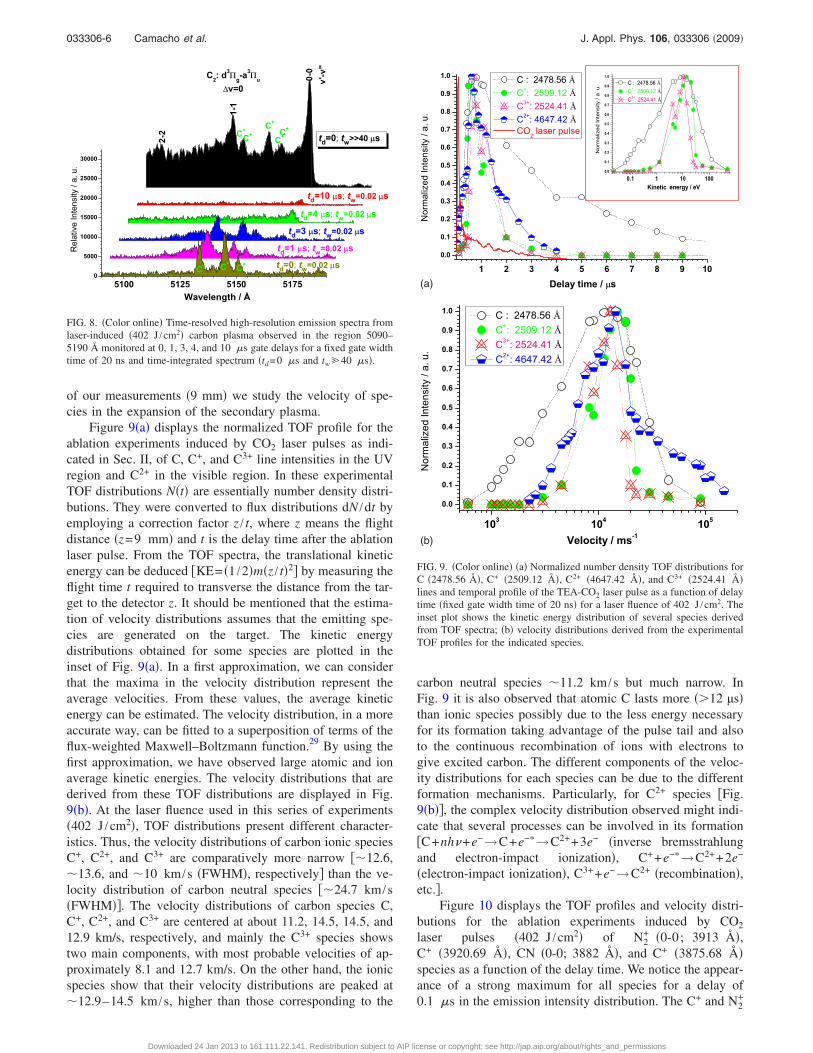
Figure 8 shows time-resolved OES from laser-inducedcarbon plasma observed in the region 5090–5190 Å moni-tored at 0, 1, 3, 4, and 10 �s gate delays for a fixed gatewidth time of 20 ns and time-integrated spectrum �td=0 �sand tw�40 �s�. This last time-integrated spectrum was av-eraged over 20 laser pulses. At early times �td3 �s�, the
(b)
(a)
FIG. 3. �Color online� ��a� and �b�� Measured high-resolution PLA�402 J /cm2� of graphite emission spectra observed in the region 4645–4750Å. The data acquisition was performed by averaging the signal over �a� 20successive laser shots with td=0 �s and tw�30 �s, and �b� 7 successivelaser shots with td=4 �s and tw=0.02 �s. The assignments of some ioniclines of C2+ and C3+ and molecular bands of C2 are indicated. The insert in�a� illustrates the angular spin-orbit structure of one triplet of C2+ line.
(b)
(a)
FIG. 4. �Color online� ��a� and �b�� Time-resolved high-resolution emissionspectra from laser-induced carbon plasma �402 J /cm2� observed in the re-gions �a� 4645–4720 Å monitored at 40 ns delay time and �b� 4645–4670 Åmonitored at 20, 30, 100, and 500 ns gate delay times for a fixed gate widthtime of 20 ns. The inset in �a� displays the spectrum of the first 20 ns afterincidence of the laser pulse.
033306-4 Camacho et al. J. Appl. Phys. 106, 033306 �2009�
Downloaded 24 Jan 2013 to 161.111.22.141. Redistribution subject to AIP license or copyright; see http://jap.aip.org/about/rights_and_permissions

predominant emitting species is C+ detected by several lines.Also a very weak emission from C2 �d 3�g-a 3�u; �v=0sequence� is observed. At td�4 �s, the C+ lines practicallydisappear. When the delay �0.5� td�4 �s� increases C2
rovibrational lines enhance. At longer times �td4 �s�, theC2 rovibrational lines decrease, being observed up to�15 �s.
B. TOF and velocity
Space- and time-resolved OES measurements could beused to estimate plasma expansion rate. To obtain additionaltime-resolved information about the optical emission of theplasma, resolved spectra have been recorded at different de-lay times at a distance of 9.0 mm from the carbon target. Thetemporal evolution of spectral atomic, ionic, and molecularline intensities at a constant distance from the target can beused to construct the TOF profile. TOF studies of the emis-sion provide fundamental information regarding the timetaken for a particular species to evolve after the laser-induced plasma has been formed. Specifically, this techniquegives an indication of the velocity of the emitted species.29 Arough estimation of the velocity for the different species inthe plume can be inferred from the time-resolved spectra byplotting the intensities of selected emission lines versus thedelay time, and then calculating the velocity by dividing thedistance from the target by the time where the emissionpeaks. This method for the determination of plasma velocityshould be used with care due to the superposition of bothexpansion and forward movements of the plasma plume. Weassume a plasma model consisting of two plasmas:30 a pri-mary plasma that acts as an initial explosion energy sourceand emits an intense continuum emission background for ashort time just above the surface of the target, and a second-ary plasma that expands with time around the primaryplasma. The secondary plasma is formed by excitation fromthe shock wave, emitting atomic, ionic, and molecular bandswith low background signal. Taking into account the distance
(a)
(b)
FIG. 6. �Color online� Time-resolved high-resolution emission spectra fromlaser-induced �402 J /cm2� carbon plasma observed in the region 2425–2570 Å monitored at 0.1, 0.2, 0.4, 0.6, 0.8, 1, 2, 3, 4, and 5 �s gate delaysfor a fixed gate width time of 20 ns.
FIG. 7. �Color online� Time-resolved high-resolution emission spectra fromlaser-induced �402 J /cm2� carbon plasma observed in the region 3830–3960 Å monitored at 10, 3, 0.5, 0.05, and 0 �s gate delays for a fixed gatewidth time of 20 ns and time-integrated spectrum �td=0 �s and tw
�40 �s�.
FIG. 5. �Color online� Time-resolved high-resolution emission spectra fromlaser-induced carbon plasma �402 J /cm2� observed in the region 4645–4750 Å monitored at 2, 3, 5, and 10 �s gate delays for a fixed gate widthtime of 20 ns.
033306-5 Camacho et al. J. Appl. Phys. 106, 033306 �2009�
Downloaded 24 Jan 2013 to 161.111.22.141. Redistribution subject to AIP license or copyright; see http://jap.aip.org/about/rights_and_permissions
of our measurements �9 mm� we study the velocity of spe-cies in the expansion of the secondary plasma.
Figure 9�a� displays the normalized TOF profile for theablation experiments induced by CO2 laser pulses as indi-cated in Sec. II, of C, C+, and C3+ line intensities in the UVregion and C2+ in the visible region. In these experimentalTOF distributions N�t� are essentially number density distri-butions. They were converted to flux distributions dN /dt byemploying a correction factor z / t, where z means the flightdistance �z=9 mm� and t is the delay time after the ablationlaser pulse. From the TOF spectra, the translational kineticenergy can be deduced �KE= �1 /2�m�z / t�2� by measuring theflight time t required to transverse the distance from the tar-get to the detector z. It should be mentioned that the estima-tion of velocity distributions assumes that the emitting spe-cies are generated on the target. The kinetic energydistributions obtained for some species are plotted in theinset of Fig. 9�a�. In a first approximation, we can considerthat the maxima in the velocity distribution represent theaverage velocities. From these values, the average kineticenergy can be estimated. The velocity distribution, in a moreaccurate way, can be fitted to a superposition of terms of theflux-weighted Maxwell–Boltzmann function.29 By using thefirst approximation, we have observed large atomic and ionaverage kinetic energies. The velocity distributions that arederived from these TOF distributions are displayed in Fig.9�b�. At the laser fluence used in this series of experiments�402 J /cm2�, TOF distributions present different character-istics. Thus, the velocity distributions of carbon ionic speciesC+, C2+, and C3+ are comparatively more narrow ��12.6,�13.6, and �10 km /s �FWHM�, respectively� than the ve-locity distribution of carbon neutral species ��24.7 km /s�FWHM��. The velocity distributions of carbon species C,C+, C2+, and C3+ are centered at about 11.2, 14.5, 14.5, and12.9 km/s, respectively, and mainly the C3+ species showstwo main components, with most probable velocities of ap-proximately 8.1 and 12.7 km/s. On the other hand, the ionicspecies show that their velocity distributions are peaked at�12.9–14.5 km /s, higher than those corresponding to the
carbon neutral species �11.2 km /s but much narrow. InFig. 9 it is also observed that atomic C lasts more �12 µs�than ionic species possibly due to the less energy necessaryfor its formation taking advantage of the pulse tail and alsoto the continuous recombination of ions with electrons togive excited carbon. The different components of the veloc-ity distributions for each species can be due to the differentformation mechanisms. Particularly, for C2+ species �Fig.9�b��, the complex velocity distribution observed might indi-cate that several processes can be involved in its formation�C+nh +e−→C+e−�→C2++3e− �inverse bremsstrahlungand electron-impact ionization�, C++e−�→C2++2e−
�electron-impact ionization�, C3++e−→C2+ �recombination�,etc.�.
Figure 10 displays the TOF profiles and velocity distri-butions for the ablation experiments induced by CO2
laser pulses �402 J /cm2� of N2+ �0-0; 3913 �,
C+ �3920.69 �, CN �0-0; 3882 �, and C+ �3875.68 �species as a function of the delay time. We notice the appear-ance of a strong maximum for all species for a delay of0.1 �s in the emission intensity distribution. The C+ and N2
+
FIG. 8. �Color online� Time-resolved high-resolution emission spectra fromlaser-induced �402 J /cm2� carbon plasma observed in the region 5090–5190 Å monitored at 0, 1, 3, 4, and 10 �s gate delays for a fixed gate widthtime of 20 ns and time-integrated spectrum �td=0 �s and tw�40 �s�.
(b)
(a)
FIG. 9. �Color online� �a� Normalized number density TOF distributions forC �2478.56 �, C+ �2509.12 �, C2+ �4647.42 �, and C3+ �2524.41 �lines and temporal profile of the TEA-CO2 laser pulse as a function of delaytime �fixed gate width time of 20 ns� for a laser fluence of 402 J /cm2. Theinset plot shows the kinetic energy distribution of several species derivedfrom TOF spectra; �b� velocity distributions derived from the experimentalTOF profiles for the indicated species.
033306-6 Camacho et al. J. Appl. Phys. 106, 033306 �2009�
Downloaded 24 Jan 2013 to 161.111.22.141. Redistribution subject to AIP license or copyright; see http://jap.aip.org/about/rights_and_permissions

emission tails extend up to �4 �s. We observe the appear-ance of a delayed CN�B-X� very weak maximum��10 �s� in the emission intensity. The CN�B-X� emissiontail extends up to �15 �s. The enhanced excitation at sucha long time from the onset of the ablation laser pulse sup-ports the idea that CN is mainly excited by collisions withthe ablated carbon atoms and molecules with N2 �C2
�+N2
→2CN� ; C�+N2→CN�+1 /2N2� . The velocity distribu-tions of C+ and N2
+ ionic species are comparatively narrowerthan the velocity distribution of C and CN neutral species,which are nearly equal when properly scaled.
The emission intensity temporal profile or number den-sity TOF distributions and velocity distributions for the ab-lation experiments induced by CO2 laser pulses �402 J /cm2�from C2 �d−a ; 0-0 ; 5163 Å�, C2 �d−a ; 1-1 ; 5129 Å�,and singly ionize carbon line at 5143.49 Å are presented inFig. 11. The inset plots in Fig. 11�a� illustrate some spectraobserved at different delay times. The electronic excitationprobability in the plume is determined by the density of en-ergetic collisions and thereby the emission intensity of C2 ata given time and position in the plume corresponds to thedensity of the electronically excited molecules. However, the
density also depends on processes such as down cascade andfragmentation of Cn species, with n2, in addition to colli-sion frequency. Although the radiative emission lifetime ofthe d 3�g state is as short as �0.1 �s,31 the optical emissionfrom the excited state persists even 15 �s after the arrival ofthe CO2 laser pulse due to collisional excitation of moleculesin the plume �C�+C→C2
�� . The temporal evolutions of theC2 �d−a ; 0-0 ; 5163 Å� and C2 �d−a ; 1-1 ; 5129 Å�transitions show that both emissions are most enhanced at4 �s. The enhanced excitation at such a long from the onsetof the ablation laser pulse supports the idea that C2 is notdirectly excited by the laser-irradiated surface but by the col-lisions with the ablated carbon atoms and ions and/or elec-trons. Thus, the temporal evolution provides informationabout the collision process of the carbon neutrals with theablated species. From Fig. 11�a�, we notice the appearance ofa C+ �5143.49 Å� intense maximum ��0.1 �s� and a de-layed maximum ��2 �s� in the emission intensity distribu-tion. The C+ emission tail extends up to �4 �s. We alsoobserve the appearance of a C2 �d−a� weak maximum ��1µs� and a delayed intense maximum ��4 �s� in the emis-
(b)
(a)
FIG. 10. �Color online� �a� Number density TOF distributions forN2
+ �0-0; 3913 � , C+ �3920.69 �, CN �0-0; 3882 �, andC+ �3875.68 � lines as a function of delay time �fixed gate width time of20 ns� for a laser fluence of �402 J /cm2�. �b� Velocity distributions derivedfrom the experimental TOF profiles for the indicated species.
(b)
(a)
FIG. 11. �Color online� �a� Number density TOF distributions for C2 �d−a ; 0-0 ; 5163 Å�, C2 �d−a ; 1-1 ; 5129 Å�, and C+ �5143.49 Å� linesas a function of delay time �fixed gate width time of 20 ns�. The inset plotsillustrate some spectra observed at different delay times. �b� Velocity distri-butions derived from the experimental TOF profiles for the indicatedspecies.
033306-7 Camacho et al. J. Appl. Phys. 106, 033306 �2009�
Downloaded 24 Jan 2013 to 161.111.22.141. Redistribution subject to AIP license or copyright; see http://jap.aip.org/about/rights_and_permissions
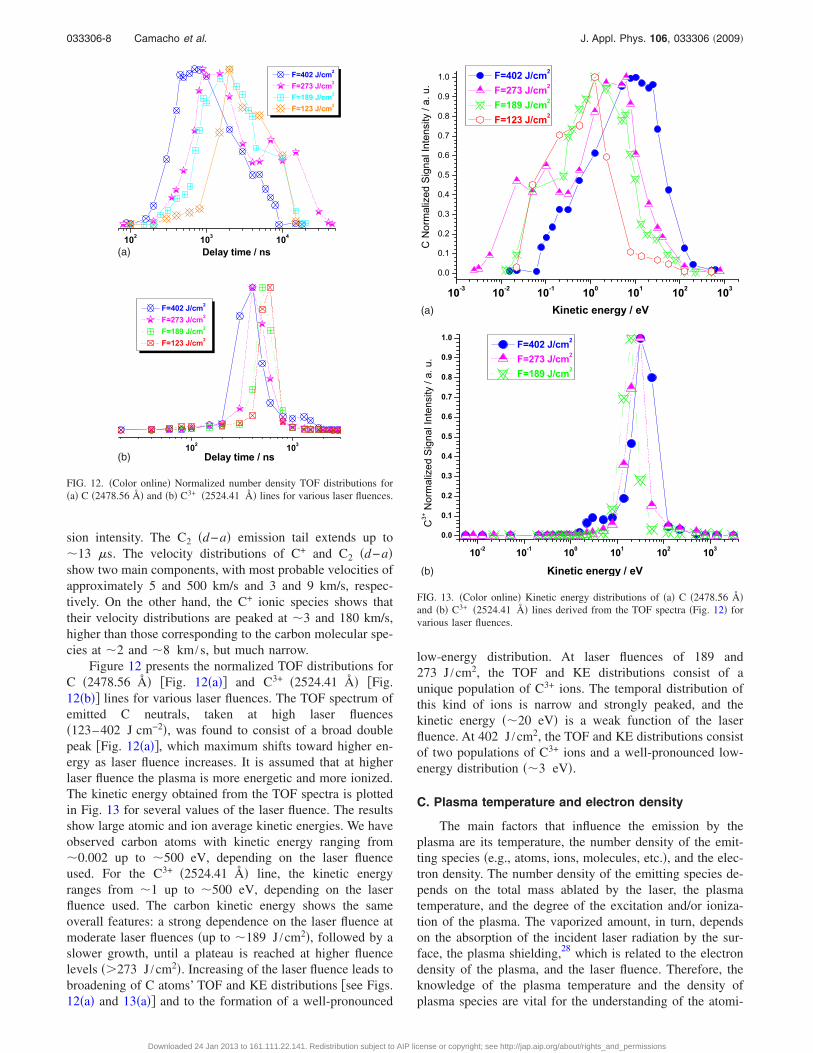
sion intensity. The C2 �d−a� emission tail extends up to�13 �s. The velocity distributions of C+ and C2 �d−a�show two main components, with most probable velocities ofapproximately 5 and 500 km/s and 3 and 9 km/s, respec-tively. On the other hand, the C+ ionic species shows thattheir velocity distributions are peaked at �3 and 180 km/s,higher than those corresponding to the carbon molecular spe-cies at �2 and �8 km /s, but much narrow.
Figure 12 presents the normalized TOF distributions forC �2478.56 Å� �Fig. 12�a�� and C3+ �2524.41 Å� �Fig.12�b�� lines for various laser fluences. The TOF spectrum ofemitted C neutrals, taken at high laser fluences�123–402 J cm−2�, was found to consist of a broad doublepeak �Fig. 12�a��, which maximum shifts toward higher en-ergy as laser fluence increases. It is assumed that at higherlaser fluence the plasma is more energetic and more ionized.The kinetic energy obtained from the TOF spectra is plottedin Fig. 13 for several values of the laser fluence. The resultsshow large atomic and ion average kinetic energies. We haveobserved carbon atoms with kinetic energy ranging from�0.002 up to �500 eV, depending on the laser fluenceused. For the C3+ �2524.41 Å� line, the kinetic energyranges from �1 up to �500 eV, depending on the laserfluence used. The carbon kinetic energy shows the sameoverall features: a strong dependence on the laser fluence atmoderate laser fluences �up to �189 J /cm2�, followed by aslower growth, until a plateau is reached at higher fluencelevels �273 J /cm2�. Increasing of the laser fluence leads tobroadening of C atoms’ TOF and KE distributions �see Figs.12�a� and 13�a�� and to the formation of a well-pronounced
low-energy distribution. At laser fluences of 189 and273 J /cm2, the TOF and KE distributions consist of aunique population of C3+ ions. The temporal distribution ofthis kind of ions is narrow and strongly peaked, and thekinetic energy ��20 eV� is a weak function of the laserfluence. At 402 J /cm2, the TOF and KE distributions consistof two populations of C3+ ions and a well-pronounced low-energy distribution ��3 eV�.
C. Plasma temperature and electron density
The main factors that influence the emission by theplasma are its temperature, the number density of the emit-ting species �e.g., atoms, ions, molecules, etc.�, and the elec-tron density. The number density of the emitting species de-pends on the total mass ablated by the laser, the plasmatemperature, and the degree of the excitation and/or ioniza-tion of the plasma. The vaporized amount, in turn, dependson the absorption of the incident laser radiation by the sur-face, the plasma shielding,28 which is related to the electrondensity of the plasma, and the laser fluence. Therefore, theknowledge of the plasma temperature and the density ofplasma species are vital for the understanding of the atomi-
(b)
(a)
FIG. 12. �Color online� Normalized number density TOF distributions for�a� C �2478.56 � and �b� C3+ �2524.41 � lines for various laser fluences.
(b)
(a)
FIG. 13. �Color online� Kinetic energy distributions of �a� C �2478.56 �and �b� C3+ �2524.41 � lines derived from the TOF spectra �Fig. 12� forvarious laser fluences.
033306-8 Camacho et al. J. Appl. Phys. 106, 033306 �2009�
Downloaded 24 Jan 2013 to 161.111.22.141. Redistribution subject to AIP license or copyright; see http://jap.aip.org/about/rights_and_permissions

zation, excitation, and ionization processes occurring in theplasma. For plasma in local thermodynamic equilibrium�LTE�, the population density of atomic and ionic electronicstates is described by a Boltzmann distribution. The condi-tions satisfying this assumption of LTE require the radiativedepopulation rates to be negligible compared to the colli-sional depopulation rates. This essentially implies that anexcited state must have a higher probability of de-excitationby collisions than by spontaneous emission. For opticallythin plasma, the reabsorption effects of plasma emission arenegligible. So, the emitted spectral line intensity is a measureof the population of the corresponding energy level of thiselement in the plasma. For LTE plasma, the temperature canbe calculated from the relative intensities of several atomicor ionic lines by32
ln� Iki�ki
gkAki� = C −
Ek
kBT, �1�
where Iki is the emissivity in W m−3 sr−1 of the emitted k→ i spectral line, �ki is the wavelength, gk=2Jk+1 is thestatistical weight, Aki is the Einstein transition probability ofspontaneous emission, Ek /kB is the normalized energy of theupper electronic level, C=ln�hcNk /4�Q�T�� �Q�T� is thepartition function�, and T is the temperature. In LTE all tem-peratures are assumed to be equal, i.e., Te�Tion�Tplasma.The Boltzmann method implies the assumption of LTE, butgiven the high electron density in our plasmas �see further�,this assumption seems to be satisfied at least during the first5 �s of the plasma lifetime. The emitted spectral line inten-sity from a given state of excitation can be used to evaluatethe plasma temperature. By plotting the left hand side of Eq.�1� versus the excited level energy Ek, the plasma tempera-ture can be obtained from the slope of the obtained straightline. The plasma temperature was determined from the emis-sion line intensities of several C+ lines observed in the laser-induced plasma of carbon target for a delay time of 1 �s and0.02 �s gate width. The spectral lines’ wavelengths, ener-gies of the upper levels, statistical weights, and transitionprobabilities used for these lines were obtained from NIST.33
The obtained excitation temperature was 26 000�3000 K.An example showing a plot of Eq. �1� and relevant param-eters involved in the calculation of excitation temperaturecan be found in our previous paper.26 Real plasmas provide,even in the worst cases, just an approximation to LTE. How-ever, their spatial inhomogeneity is very large as concernsthe temperature and number density distributions of the dif-ferent species. Consequently, the LTE occurs only within avery small volume of the plasma.
Spectral lines are always broadened, partly due to thefinite resolution of the used spectrometer and partly to intrin-sic physical causes. The principal physical causes of spectralline broadening are the Doppler and Stark broadening. TheDoppler broadening is due to the thermal motion of the emit-ting atoms or ions. For a Maxwellian velocity distributionthe line shape is Gaussian, and the FWHM may be estimatedas �in �: ��FWHM
D=7.16�10−7��T /M�1/2 , being � thewavelength in Å, T the temperature of the emitters in K, andM the atomic mass in amu. Stark line broadening from col-lisions of charged species is the primary mechanism influ-
encing the emission spectra in these experiments. The elec-tron number density can be obtained from the Starkbroadening of the emission lines. This is because Starkbroadening results from Coulomb interactions between theradiator and the charged particles present in the plasma. Bothions and electrons induce Stark broadening, but electrons areresponsible for the major part because of their higher relativevelocities. The electrons in the plasma can perturb the energylevels of the individual ions, which broaden the emissionlines originating from these excited levels. Stark broadeningof well-isolated lines in the plasma is, thus, useful for esti-mating the electron number densities provided that the Starkbroadening coefficients have been measured or calculated.The line profile for Stark broadened is well described by aLorentzian function. Since the instrumental line broadeningexhibits Gaussian shape, the Stark linewidth ��FWHM
S canbe extracted from the measured linewidth ��observed by sub-tracting the instrumental and Doppler line broadening��instrument: ��FWHM
S=��observed−��instrument−��FWHMD . In
our case ��instrument was 0.1 Å nm �determined by measuringthe FWHM of the Cu and Ne lines emitted by a HCL�. In ourexperiments, for C+ lines, the Doppler linewidths are 0.09–0.14 Å at 26 000 K. The width of the Stark broadening spec-tral line depends on the electron density ne. Both the linearand the quadratic Stark effect are encountered in spectros-copy. For a non-H-like line, the electron density ne �in cm−3�could be determined from the FWHM of the line from theapproximated formula34
��FWHMS = 2W ne
1016 , �2�
where W is the electron-impact parameter �Stark broadeningvalue�. The carbon ionic multiplet line at �3920 Å wasidentified as a candidate for electron-density measurements.Figure 14 shows the 3920 Å carbon ionic line with sufficientresolution to measure the FWHM at eight different time de-lays. All the data points were fitted with Lorentzian functionto determine the Stark linewidth. By substituting these valuesin Eq. �2� and the corresponding value of Stark broadening
FIG. 14. �Color online� Stark-broadened profiles of the C+ line at 3920 Å atdifferent delay times for a fixed gate width time of 0.02 �s.
033306-9 Camacho et al. J. Appl. Phys. 106, 033306 �2009�
Downloaded 24 Jan 2013 to 161.111.22.141. Redistribution subject to AIP license or copyright; see http://jap.aip.org/about/rights_and_permissions
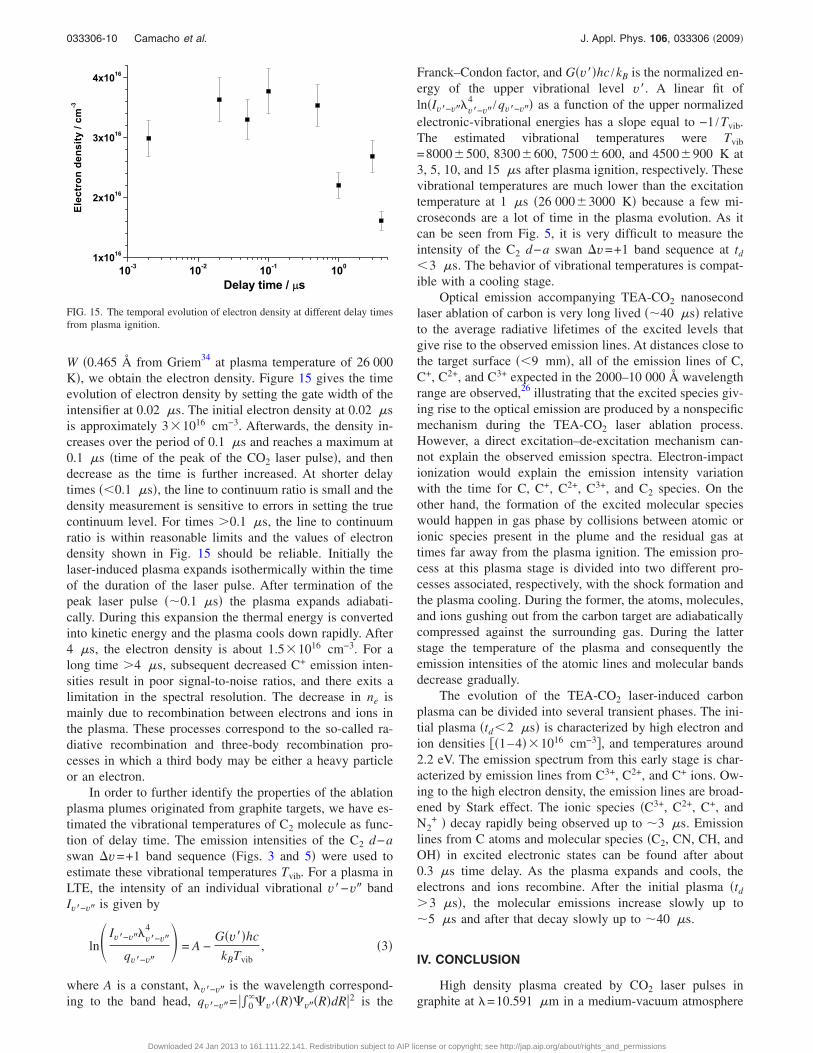
W �0.465 Å from Griem34 at plasma temperature of 26 000K�, we obtain the electron density. Figure 15 gives the timeevolution of electron density by setting the gate width of theintensifier at 0.02 �s. The initial electron density at 0.02 �sis approximately 3�1016 cm−3. Afterwards, the density in-creases over the period of 0.1 �s and reaches a maximum at0.1 �s �time of the peak of the CO2 laser pulse�, and thendecrease as the time is further increased. At shorter delaytimes �0.1 �s�, the line to continuum ratio is small and thedensity measurement is sensitive to errors in setting the truecontinuum level. For times 0.1 �s, the line to continuumratio is within reasonable limits and the values of electrondensity shown in Fig. 15 should be reliable. Initially thelaser-induced plasma expands isothermically within the timeof the duration of the laser pulse. After termination of thepeak laser pulse ��0.1 �s� the plasma expands adiabati-cally. During this expansion the thermal energy is convertedinto kinetic energy and the plasma cools down rapidly. After4 �s, the electron density is about 1.5�1016 cm−3. For along time 4 �s, subsequent decreased C+ emission inten-sities result in poor signal-to-noise ratios, and there exits alimitation in the spectral resolution. The decrease in ne ismainly due to recombination between electrons and ions inthe plasma. These processes correspond to the so-called ra-diative recombination and three-body recombination pro-cesses in which a third body may be either a heavy particleor an electron.
In order to further identify the properties of the ablationplasma plumes originated from graphite targets, we have es-timated the vibrational temperatures of C2 molecule as func-tion of delay time. The emission intensities of the C2 d−aswan �v=+1 band sequence �Figs. 3 and 5� were used toestimate these vibrational temperatures Tvib. For a plasma inLTE, the intensity of an individual vibrational v�−v� bandIv�−v� is given by
ln Iv�−v��v�−v�4
qv�−v� = A −
G�v��hc
kBTvib, �3�
where A is a constant, �v�−v� is the wavelength correspond-ing to the band head, qv�−v�= ��0
��v��R��v��R�dR�2 is the
Franck–Condon factor, and G�v��hc /kB is the normalized en-ergy of the upper vibrational level v�. A linear fit ofln�Iv�−v��v�−v�
4 /qv�−v�� as a function of the upper normalizedelectronic-vibrational energies has a slope equal to −1 /Tvib.The estimated vibrational temperatures were Tvib
=8000�500, 8300�600, 7500�600, and 4500�900 K at3, 5, 10, and 15 �s after plasma ignition, respectively. Thesevibrational temperatures are much lower than the excitationtemperature at 1 �s �26 000�3000 K� because a few mi-croseconds are a lot of time in the plasma evolution. As itcan be seen from Fig. 5, it is very difficult to measure theintensity of the C2 d−a swan �v=+1 band sequence at td
3 �s. The behavior of vibrational temperatures is compat-ible with a cooling stage.
Optical emission accompanying TEA-CO2 nanosecondlaser ablation of carbon is very long lived ��40 �s� relativeto the average radiative lifetimes of the excited levels thatgive rise to the observed emission lines. At distances close tothe target surface �9 mm�, all of the emission lines of C,C+, C2+, and C3+ expected in the 2000–10 000 Å wavelengthrange are observed,26 illustrating that the excited species giv-ing rise to the optical emission are produced by a nonspecificmechanism during the TEA-CO2 laser ablation process.However, a direct excitation–de-excitation mechanism can-not explain the observed emission spectra. Electron-impactionization would explain the emission intensity variationwith the time for C, C+, C2+, C3+, and C2 species. On theother hand, the formation of the excited molecular specieswould happen in gas phase by collisions between atomic orionic species present in the plume and the residual gas attimes far away from the plasma ignition. The emission pro-cess at this plasma stage is divided into two different pro-cesses associated, respectively, with the shock formation andthe plasma cooling. During the former, the atoms, molecules,and ions gushing out from the carbon target are adiabaticallycompressed against the surrounding gas. During the latterstage the temperature of the plasma and consequently theemission intensities of the atomic lines and molecular bandsdecrease gradually.
The evolution of the TEA-CO2 laser-induced carbonplasma can be divided into several transient phases. The ini-tial plasma �td2 �s� is characterized by high electron andion densities ��1–4��1016 cm−3�, and temperatures around2.2 eV. The emission spectrum from this early stage is char-acterized by emission lines from C3+, C2+, and C+ ions. Ow-ing to the high electron density, the emission lines are broad-ened by Stark effect. The ionic species �C3+, C2+, C+, andN2
+ � decay rapidly being observed up to �3 �s. Emissionlines from C atoms and molecular species �C2, CN, CH, andOH� in excited electronic states can be found after about0.3 �s time delay. As the plasma expands and cools, theelectrons and ions recombine. After the initial plasma �td
3 �s�, the molecular emissions increase slowly up to�5 �s and after that decay slowly up to �40 �s.
IV. CONCLUSION
High density plasma created by CO2 laser pulses ingraphite at �=10.591 �m in a medium-vacuum atmosphere
FIG. 15. The temporal evolution of electron density at different delay timesfrom plasma ignition.
033306-10 Camacho et al. J. Appl. Phys. 106, 033306 �2009�
Downloaded 24 Jan 2013 to 161.111.22.141. Redistribution subject to AIP license or copyright; see http://jap.aip.org/about/rights_and_permissions
�4 Pa� has been investigated by spectroscopic measurementsin UV-vis-NIR spectral range. The investigation has beencarried out in a regime of relatively high laser fluences�123–402 J /cm2�. The emission observed at 9.0 mm fromthe target is due to the relaxation of excited atomic C, N, O,and H; ionic fragments C+, C2+, C3+, and C4+; and molecularbands of C2, CN, OH, CH, and N2
+ . The characteristics ofthe spectral emission intensities for some species have beeninvestigated as a function of the delay time after the plasmaformation. The velocity and kinetic energy distributions fordifferent species were obtained from TOF measurements us-ing time-resolved optical emission spectroscopy. All theionic lines follow the time profile of the laser pulse lastinguntil 3 or 4 �s. A different behavior of atomic C and mo-lecular species can be observed, possibly due to the tail ofthe pulse and the continuous recombination of ions withelectrons to give excited carbon. Taking into account thenumber density TOF distributions of neutral carbon and itsionic species, we suggest that the ionic species come fromthe ionization of the neutral C formed at the target surface bythe initial part of the laser pulse. Decreasing of the laserfluence will drive to a weaker plume formation and conse-quently to a decrease in its absorption and screening off ofthe target from the later part of the pulse. At low laser flu-ences, we think that we are detecting ionic species formedboth at the target surface and in the nascent plume. The tem-perature measurements have been performed by Boltzmanndiagram method using C+ lines, while electron-density esti-mations were made using the Stark broadening method.Time-resolved studies of electron density and temperatureshave been carried out using emission lines of C+. Estimatesof vibrational temperatures of C2 electronically excited spe-cies at various times after plasma formation are made. Theformation of excited molecular species is produced in gasphase by collisions between atomic or ionic species presentin the plume and the residual gas, at times far away from theplasma formation �td0.4 �s�.
ACKNOWLEDGMENTS
We gratefully acknowledge the support received in partby the DGICYT �Spain� Project Nos. MEC: CTQ2007-60177/BQU and MEC: CTQ2008-05393/BQU for this re-search.
1H. W. Kroto, J. R. Heath, S. C. O’Brien, R. F. Curl, and R. E. Smalley,Nature �London� 318, 162 �1985�.
2W. Kratschmer, L. D. Lamb, F. Fostiropoulos, and D. R. Huffman, Nature
�London� 347, 354 �1990�.3H. Koinuma, M. S. Kim, T. Asakwa, and M. Yoshimoto, Fullerene Sci.Technol. 4, 599 �1996�.
4J. Bulir, M. Novotny, M. Jelinek, J. Lancok, Z. Zelinger, and M. Trchova,Diamond Relat. Mater. 11, 1223 �2002�.
5T. Ikegami, F. Nakanishi, M. Uchiyama, and K. Ebihara, Thin Solid Films457, 7 �2004�.
6M. N. R. Ashfold, F. Claeyssens, G. M. Fuge, and S. J. Henley, Chem.Soc. Rev. 33, 23 �2004�.
7G. Meijer and D. S. Bethane, J. Chem. Phys. 93, 7800 �1990�.8C. Wulker, W. Theobald, and F. P. Schafer, Phys. Rev. E 50, 4920 �1994�.9Z. Andreic, D. Gracin, V. Henc-Bartilic, H. J. Kunze, F. Ruh, and L.Aschke, Phys. Scr. 53, 339 �1996�.
10S. S. Harilal, R. C. Issac, C. V. Bindhu, V. P. N. Nampoori, and C. P. G.Vallabhan, Jpn. J. Appl. Phys., Part 1 36, 134 �1997�.
11A. V. Demyanenko, V. S. Letokhov, A. A. Puretskii, and E. A. Ryabov,Quantum Electron. 27, 983 �1997�.
12K. H. Wong, T. Y. Tou, and K. S. Low, J. Appl. Phys. 83, 2286 �1998�.13J. Hermann, C. Vivien, A. P. Carricato, and C. Boulmer-Leborgne, Appl.
Surf. Sci. 129, 645 �1998�.14C. Vivien, J. Hermann, A. Perrone, C. Boulmer-Leborgne, and A. Luches,
J. Phys. D 31, 1263 �1998�.15S. Arepalli, P. Nikolaev, W. Holmes, and C. D. Scott, Appl. Phys. A:
Mater. Sci. Process. 69, 1 �1999�.16Y. K. Choi, H. S. Im, and K. W. Jung, Bull. Korean Chem. Soc. 20, 1501
�1999�.17S. M. Park and K. H. Lee, Appl. Surf. Sci. 178, 37 �2001�.18S. Acquaviva and M. L. Giorgi, J. Phys. B 35, 795 �2002�.19T. Sakka, K. Saito, and Y. H. Ogata, Appl. Surf. Sci. 197, 246 �2002�.20S. Abdelli-Messaci, J. T. Kerdja, A. Bendib, and S. Malek, J. Phys. D:
Appl. Phys. 35, 2772 �2002�.21C. S. Ake, H. Sobral, E. Sterling, and M. Villagran-Muniz, Appl. Phys. A:
Mater. Sci. Process. 79, 1345 �2004�.22H. S. Park, S. H. Nam, and S. M. Park, J. Appl. Phys. 97, 113103 �2005�.23W.-O. Siew, K. H. Wong, S. S. Yap, and T. Y. Tou, IEEE Trans. Plasma
Sci. 33, 176 �2005�.24Z. S. Gong, J. Sun, N. Xu, Z. F. Ying, Y. F. Lu, D. Yu, and J. D. Wu,
Diamond Relat. Mater. 16, 124 �2007�.25E. Vors, C. Gallou, and L. Salmon, Spectrochim. Acta, Part B 63, 1198
�2008�.26J. J. Camacho, L. Diaz, M. Santos, D. Reyman, and J. M. L. Poyato, J.
Phys. D 41, 105201 �2008�.27J. J. Camacho, M. Santos, L. Díaz, and J. M. L. Poyato, Appl. Phys. A:
Mater. Sci. Process. 94, 373 �2009�.28B. Le Drogoff, J. Margot, M. Chaker, M. Sabsabi, O. Barthélemy, T. W.
Johnston, S. Laville, F. Vidal, and V. Y. Kaenel, Spectrochim. Acta, Part B56, 987 �2001�.
29M. Rossa, C. A. Rinaldi, and J. C. Ferrero, J. Appl. Phys. 105, 63306�2009�.
30K. Kagawa and S. Yokoi, Spectrochim. Acta, Part B 37, 789 �1982�.31S. Arepalli, C. D. Scott, P. Nikolaev, and R. E. Smalley, Chem. Phys. Lett.
320, 26 �2000�.32V. N. Rai and S. N. Thakur, in Laser-Induced Breakdown Spectroscopy,
edited by J. P. Singh and S. N. Thakur �Elsevier, Amsterdam, 2007�.33NIST Atomic Spectra Database online at http://physics.nist.gov/
PhysRefData/ASD/index.html.34H. R. Griem, Spectral Line Broadening by Plasmas �Academic, New
York, 1974�.
033306-11 Camacho et al. J. Appl. Phys. 106, 033306 �2009�
Downloaded 24 Jan 2013 to 161.111.22.141. Redistribution subject to AIP license or copyright; see http://jap.aip.org/about/rights_and_permissions