templeton growth fund, inc. annual report
TRANSCRIPT

ANNUAL REPORT AND SHAREHOLDER LETTER
TEMPLETON GROWTH FUND, INC.August 31, 2021
Sign up for electronic delivery at franklintempleton.com/edelivery
Not FDIC Insured May Lose Value No Bank Guarantee
franklintempleton.com Not part of the annual report 1
SHAREHOLDER LETTERDear Shareholder:
During the 12 months ended August 31, 2021, the global economic recovery was supported by continued monetary and fiscal stimulus measures, easing novel coronavirus (COVID-19) pandemic restrictions and the development of treatments and vaccines. During parts of the period, geopolitical tensions and surges of COVID-19 cases in certain regions pressured global stock prices, but economic growth in the U.S. and China and continued accommodative monetary policy by the U.S. Federal Reserve supported equities for the period as a whole. Asian and global emerging market equities trimmed some gains near period-end after the Chinese government imposed additional regulation on some businesses. In this environment, global developed and emerging market stocks, as measured by the MSCI All Country World Index-NR (net of tax withholding when dividends are paid), posted a +28.64% total return for the period.1
We are committed to our long-term perspective and disciplined investment approach as we conduct a rigorous, fundamental analysis of securities with a regular emphasis on investment risk management.
Historically, patient investors have achieved rewarding results by evaluating their goals, diversifying their assets globally and maintaining a disciplined investment program, all hallmarks of the Templeton investment philosophy. We continue to recommend investors consult financial professionals and review their portfolios to design a long-term strategy and portfolio allocation that meet their individual needs, goals and risk tolerance.
Templeton Growth Fund’s annual report includes more detail about prevailing conditions and a discussion about investment decisions during the period. Please remember all securities markets fluctuate, as do mutual fund share prices.
We thank you for investing with Franklin Templeton, welcome your questions and comments, and look forward to serving your investment needs in the years ahead.
Sincerely,
Alan BartlettChief Investment OfficerTempleton Equity Group
This letter reflects our analysis and opinions as of August 31, 2021, unless otherwise indicated. The information is not a complete analysis of every aspect of any market, country, industry, security or fund. Statements of fact are from sources considered reliable.
1. Source: Morningstar. See www.franklintempletondatasources.com for additional data provider information.

franklintempleton.comAnnual Report2
ContentsAnnual ReportTempleton Growth Fund, Inc. ................................................3Performance Summary..........................................................8Your Fund’s Expenses .........................................................11Financial Highlights and Statement of Investments.............12Financial Statements ...........................................................20Notes to Financial Statements.............................................24Report of Independent Registered Public Accounting Firm ........................................................34Tax Information ....................................................................35Board Members and Officers...............................................36Shareholder Information ......................................................41
Visit franklintempleton.com for fund updates, to access your account, or to find helpful financial planning tools.
3franklintempleton.com Annual Report
ANNUAL REPORT
Templeton Growth Fund, Inc.This annual report for Templeton Growth Fund, Inc. covers the fiscal year ended August 31, 2021.
Your Fund’s Goals and Main InvestmentsThe Fund seeks long-term capital growth. Under normal market conditions, the Fund invests primarily in the equity securities of companies located anywhere in the world, including developing markets.
Performance OverviewThe Fund’s Class A shares posted a +20.80% cumulative total return for the 12 months under review. In comparison, the Fund’s new benchmark, the MSCI All Country World Index (ACWI)-NR, which measures stock performance in global developed and emerging markets, posted a +28.64% cumulative total return for the same period.1 The Fund’s prior benchmark, the MSCI ACWI, posted a +29.18% cumulative total return.1 The investment manager believes that the actual withholding rates for the Fund are closer to the assumptions of the MSCI ACWI-NR. For the 10-year period ended August 31, 2021, the Fund’s Class A shares posted a +102.53% cumulative total return, compared with the MSCI ACWI-NR’s +190.88% and the MSCI ACWI’s +206.61% cumulative total returns for the same period.1 Please note index performance information is provided for reference and we do not attempt to track the index but rather undertake investments on the basis of fundamental research. You can find more performance data in the Performance Summary beginning on page 8.
Performance data represent past performance, which does not guarantee future results. Investment return and principal value will fluctuate, and you may have a gain or loss when you sell your shares. Current performance may differ from figures shown. For most recent month-end performance, go to franklintempleton.com or call (800) 342-5236.
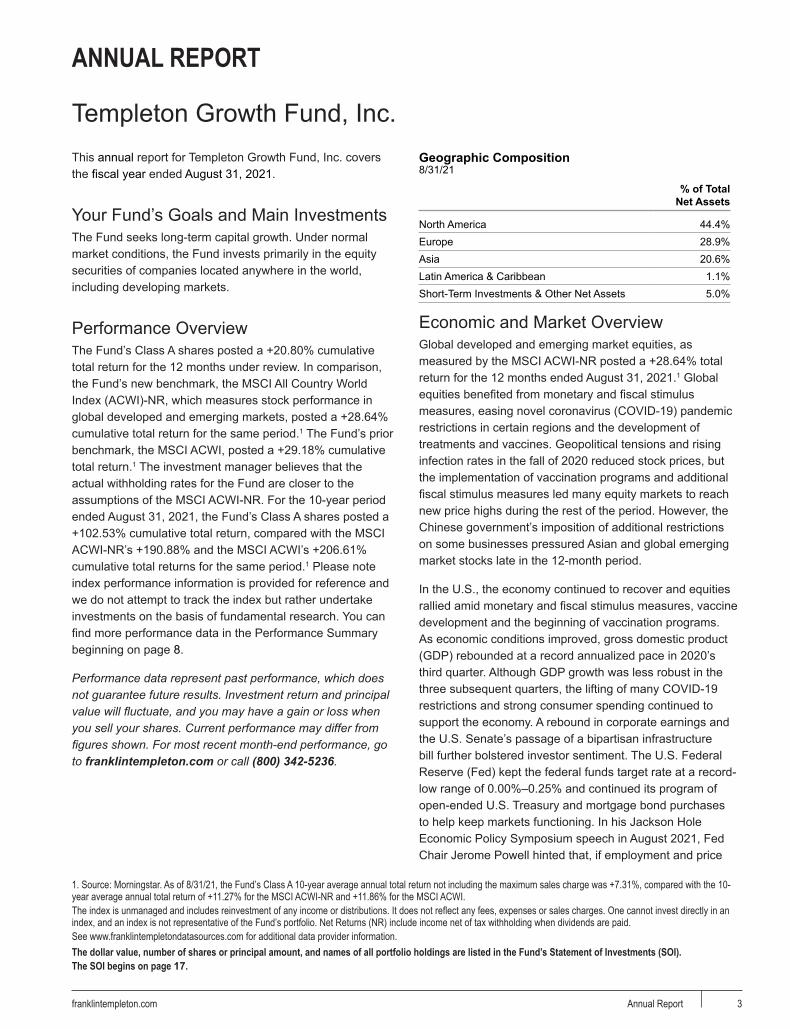
Geographic Composition8/31/21
% of Total Net Assets
North America 44.4% Europe 28.9% Asia 20.6% Latin America & Caribbean 1.1% Short-Term Investments & Other Net Assets 5.0%
Economic and Market OverviewGlobal developed and emerging market equities, as measured by the MSCI ACWI-NR posted a +28.64% total return for the 12 months ended August 31, 2021.1 Global equities benefited from monetary and fiscal stimulus measures, easing novel coronavirus (COVID-19) pandemic restrictions in certain regions and the development of treatments and vaccines. Geopolitical tensions and rising infection rates in the fall of 2020 reduced stock prices, but the implementation of vaccination programs and additional fiscal stimulus measures led many equity markets to reach new price highs during the rest of the period. However, the Chinese government’s imposition of additional restrictions on some businesses pressured Asian and global emerging market stocks late in the 12-month period.
In the U.S., the economy continued to recover and equities rallied amid monetary and fiscal stimulus measures, vaccine development and the beginning of vaccination programs. As economic conditions improved, gross domestic product (GDP) rebounded at a record annualized pace in 2020’s third quarter. Although GDP growth was less robust in the three subsequent quarters, the lifting of many COVID-19 restrictions and strong consumer spending continued to support the economy. A rebound in corporate earnings and the U.S. Senate’s passage of a bipartisan infrastructure bill further bolstered investor sentiment. The U.S. Federal Reserve (Fed) kept the federal funds target rate at a record-low range of 0.00%–0.25% and continued its program of open-ended U.S. Treasury and mortgage bond purchases to help keep markets functioning. In his Jackson Hole Economic Policy Symposium speech in August 2021, Fed Chair Jerome Powell hinted that, if employment and price
1. Source: Morningstar. As of 8/31/21, the Fund’s Class A 10-year average annual total return not including the maximum sales charge was +7.31%, compared with the 10-year average annual total return of +11.27% for the MSCI ACWI-NR and +11.86% for the MSCI ACWI.The index is unmanaged and includes reinvestment of any income or distributions. It does not reflect any fees, expenses or sales charges. One cannot invest directly in an index, and an index is not representative of the Fund’s portfolio. Net Returns (NR) include income net of tax withholding when dividends are paid.See www.franklintempletondatasources.com for additional data provider information.The dollar value, number of shares or principal amount, and names of all portfolio holdings are listed in the Fund’s Statement of Investments (SOI).The SOI begins on page 17.

TEMPLETON GROWTH FUND, INC.
4 franklintempleton.comAnnual Report
conditions progressed as expected, the Fed would begin reducing its bond purchases later in 2021; however, such reduction would not be intended as a signal for the beginning of interest-rate increases. He also indicated that the Fed viewed inflation as partially transitory, and that further employment progress was needed before the Fed would consider raising the range for the federal funds target rate.
The economic recovery in the eurozone was relatively weak, as quarter-over-quarter GDP growth rebounded in 2020’s third quarter but slightly contracted over the subsequent two quarters, before returning to growth in 2021’s second quarter. GDP growth rates were mostly sluggish among the region’s largest economies amid renewed lockdowns, delays in COVID-19 vaccine distribution and weak consumer spending. Nevertheless, the fastest rate of business activity growth in more than a decade helped European developed market equities, as measured by the MSCI Europe Index-NR, to post a +29.18% total return for the 12 months under review.1
Asian developed and emerging market equities, as measured by the MSCI All Country Asia Index-NR, posted a +18.42% total return for the 12-month period.1 China’s economic recovery helped the region rebound, although the country’s quarter-over-quarter GDP growth in 2021’s first and second quarters was slower than 2020’s last two quarters, pressured by higher commodity prices. Asian equity markets experienced heightened volatility toward period-end due to inflation concerns and rising COVID-19 infection rates in some countries. Unexpected regulatory changes by the Chinese government, which negatively impacted education- and technology-related businesses, led some foreign investors to shift capital away from China.
Global emerging market stocks, as measured by the MSCI Emerging Markets Index-NR, posted a +21.12% total return for the 12 months under review.1 Generally improving economic activity, increasing oil prices and U.S. dollar weakness supported global emerging market equities. During the latter part of the period, higher COVID-19 cases in some countries, limited vaccine rollouts and concerns about rising interest rates and higher inflation amid rising commodity prices dampened investor enthusiasm in global emerging market equities.
Investment StrategyOur investment strategy employs a bottom-up, value-oriented, long-term approach. We focus on the market price of a company’s securities relative to our evaluation of the company’s long-term earnings, asset value and cash flow potential. Our analysis includes an assessment of the
potential impacts of material environmental, social and governance (ESG) factors on the long-term risk and return profile of a company. We also consider the company’s price/earnings ratio, price/cash flow ratio, profit margins and liquidation value.
In addition, the Fund may, from time to time, engage in currency-related derivatives to seek to hedge (protect) against currency risks. The Fund also may, from time to time, engage in equity-related derivatives, such as buying and selling (writing) put and call options on individual securities (including exchange-traded funds) and indexes, and engaging in equity futures and equity index futures, for various purposes including enhancing Fund returns, increasing liquidity, gaining exposure to individual securities and particular markets in more efficient or less expensive ways, generating additional income for the Fund and/or hedging risks relating to changes in certain equity markets.
Top 10 Industries8/31/21
% of Total Net Assets
a
Hotels, Restaurants & Leisure 8.4%
Chemicals 5.3%
Pharmaceuticals 4.8%
Machinery 4.8%
IT Services 4.5%
Oil, Gas & Consumable Fuels 4.3%
Specialty Retail 3.9%
Health Care Providers & Services 3.9%
Household Durables 3.9%
Health Care Equipment & Supplies 3.7%

TEMPLETON GROWTH FUND, INC.
5franklintempleton.com Annual Report
Top 10 Holdings8/31/21
Company Industry, Country
% of Total Net Assets
a a
Samsung Electronics Co. Ltd. 2.6%Technology Hardware, Storage & Peripherals,
South KoreaWalt Disney Co. (The) 2.3%Entertainment, United StatesAlbemarle Corp. 2.3%Chemicals, United StatesSysco Corp. 2.2%Food & Staples Retailing, United StatesAnheuser-Busch InBev SA/NV 2.2%Beverages, BelgiumRoche Holding AG 2.1%Pharmaceuticals, SwitzerlandE.ON SE 2.1%Multi-Utilities, GermanyMarathon Petroleum Corp. 2.1%Oil, Gas & Consumable Fuels, United StatesMedtronic plc 2.0%Health Care Equipment & Supplies, United
StatesBooking Holdings, Inc. 1.9%Hotels, Restaurants & Leisure, United States
Top 10 Countries8/31/21
a% of Total
Net Assetsa a
United States 44.4%
Japan 11.9%
United Kingdom 10.9%
Germany 8.2%
China 3.8%
Belgium 3.4%
South Korea 2.6%
Switzerland 2.1%
France 2.0%
Hong Kong 1.8%
Manager’s DiscussionThe Templeton Growth Fund delivered double-digit absolute gains, but trailed its benchmark MSCI ACWI-NR during the 12 months under review. Value was the top performing factor style during the period, buoyed by positive news about COVID-19 vaccines in November 2020, which sparked a rebound in economically-sensitive stocks that had come under pressure amid pandemic-related lockdowns. The quality factor was also in favor during the year, particularly late in the period amid concerns about new COVID-19 variants and slowing economic data.
At the sector level, a significant overweighting in consumer discretionary detracted from relative performance. U.S. budget retailer Dollar Tree was the sector’s biggest detractor, declining after management downgraded guidance on rising costs and higher price sensitivity among consumers. We believe such headwinds are temporary. In our view, Dollar Tree is a well-managed company belonging to a select group of retailers with a long track record of consistent sales and earnings growth. We believe the company is poised to continue this trajectory given various strategic initiatives designed to boost same-store sales and margins, such as the rollout of multi-price point offerings and ongoing store renovations. As a budget retailer, Dollar Tree should, in our opinion, offer downside protection in the event of a recession scenario, and remains relatively shielded from e-commerce threats. The stock continues to trade at a discount to historical earnings multiples and represents a core long-term holding for the Fund’s portfolio.
An underweighting and stock selection in the financials sector also hurt relative performance. We have largely avoided banks—particularly in Europe—due to concerns about regulatory pressures, a flatter yield curve and a potential credit cycle, all of which could pressure sector profits over our investment horizon. However, the combination of rising bond yields and improving risk appetite following the positive vaccine news last year helped banks rebound in the latter half of the period. The Fund’s relative weakness in the sector was primarily attributable to lack of exposure, as there were no financials holdings among the 10 biggest absolute detractors.
Other notable relative detractors during the period included stock selection in the health care and communication services sector. In health care, French pharmaceuticals firm Sanofi was a significant detractor. Shares have been pressured by concerns about sales volumes amid pandemic-related lockdowns and, more recently, a difficult setback with the firm’s COVID-19 vaccine. We exited the position during the period in favor of what we believe to be better risk-reward opportunities elsewhere. In communication services, shares of U.S. mobile operator Verizon Communications negatively impacted performance. The stock’s defensive profile was broadly out of favor with investors who took a more risk-on posture as the period progressed and expectations for economic reopening improved. We believe Verizon remains an attractive core defensive holding for the portfolio. Although the U.S. wireless industry is competitive, mature and subject to periods of deflationary discounting and promotions, we think Verizon’s more pure-play wireless business has less financial risk, as data demand growth should be resilient across various economic cycles. In our
TEMPLETON GROWTH FUND, INC.
6 franklintempleton.comAnnual Report
view, the firm enjoys a strong competitive position with a decent balance sheet, modest valuation and core business that should remain a solid free cash flow generator.
Elsewhere, Canadian precious metals firm Wheaton Precious Metals hurt relative returns due to higher (albeit still negative) real interest rates reducing demand for precious metals, which offer no yield. This stock has been a strong performer in previous years and remains a core holding given what we view as its attractive asset-lite, high-margin, cash-generative business model and exposure to world-class mining assets via its financing arrangements with primarily base metals miners to purchase precious metals byproduct. Wheaton has proven to be very adept at generating value from such arrangements, and has a portfolio offering significant upside optionality in the event of higher precious metals prices or successful mine expansion efforts by its producing partners.
The Fund’s cash allocation also negatively impacted performance in a rising market environment. While the portfolio manager decreased our cash position over the course of the period, we continue to keep some cash on hand for downside protection given elevated market risks as well as a source of dry powder should additional opportunities emerge.
Turning to contributors, stock selection in the materials sector boosted relative performance. The sector was responsible for three of the top four contributors: Luxembourg-based steel-maker ArcelorMittal, U.S. copper miner Freeport-McMoRan and U.S. lithium miner Albemarle. All three benefited from a strong combination of supply constraints and robust demand. While supply constraints during the year were largely COVID-related, structural deficits do appear to be emerging in some markets like copper and lithium, which should help support prices. Meanwhile, on the demand side, these stocks are benefiting from both cyclical demand improvements related to the reopening trade as well as longer-term structural demand improvements relating to energy efficiency, electrification and the transition to a more sustainable future.
Stock selection among information technology holdings also contributed to relative returns. South Korean semiconductor and consumer electronics manufacturer Samsung Electronics was the sector’s top contributor. The company has benefited from surging demand for semiconductors across the industrial value chain. During the period, management offered investors positive guidance which foresaw continued strength in the memory business attributable to new smartphone launches, broader adoption
of 5G and healthy demand from server and PC companies. We continue to think highly of Samsung’s diversified revenue base and cash-rich balance sheet, which is being used to enhance shareholder value through dividends, buybacks and potentially accretive acquisitions. In our view, the stock remains undervalued for a global technology leader with a wide range of growth-oriented businesses. Other notable contributors in the sector included Dutch chipmaker NXP Semiconductors and U.S. software firm EPAM Systems (not held at period-end).
From a regional standpoint, stock selection in North America was primarily responsible for the Fund’s relative underperformance. Stock selection in Europe and Asia also hurt relative returns. In Europe, outperformance in Denmark and the Netherlands was offset by weakness in Germany and the U.K., while in Asia, outperformance in China and South Korea was offset by underperformance in Japan.
We remain aware of heightened global political and economic risks, and have sought to prepare for them by owning what we consider high-quality, defensive stocks with attractive valuation profiles. Yet we also understand that current bullish conditions can persist, and that positive near-term catalysts remain in the form of earnings upgrades, impending fiscal stimulus, continued share buybacks, elevated equity inflows and the potential for an improvement in COVID-19 statistics. For these reasons, we remain sensibly diversified, with exposures also spanning cyclical and economically sensitive stocks that we believe offer valuation support and positive beta to potential future value rallies. The result is a balanced portfolio full of stocks with diverse value drivers whose common characteristic is material undervaluation relative to our assessment of their long-term fundamental earnings capability.
Thank you for your continued participation in Templeton Growth Fund. We look forward to serving your future investment needs.
Peter M. Moeschter, CFAHerbert J. Arnett, Jr.Christopher James Peel, CFAWarren Pustam, CFA
Portfolio Management Team
The foregoing information reflects our analysis, opinions and portfolio holdings as of August 31, 2021, the end of the reporting period. The way we implement our main investment strategies and the resulting portfolio holdings may change depending on factors such as market and
CFA® is a trademark owned by CFA Institute.
TEMPLETON GROWTH FUND, INC.
7franklintempleton.com Annual Report
economic conditions. These opinions may not be relied upon as investment advice or an offer for a particular security. The information is not a complete analysis of every aspect of any market, country, industry, security or the Fund. Statements of fact are from sources considered reliable, but the investment manager makes no representation or warranty as to their completeness or accuracy. Although historical performance is no guarantee of future results, these insights may help you understand our investment management philosophy.

Performance Summary as of August 31, 2021
TEMPLETON GROWTH FUND, INC.
8 franklintempleton.comAnnual Report
The performance table and graphs do not reflect any taxes that a shareholder would pay on Fund dividends, capital gain distributions, if any, or any realized gains on the sale of Fund shares. Total return reflects reinvestment of the Fund’s dividends and capital gain distributions, if any, and any unrealized gains or losses. Your dividend income will vary depending on dividends or interest paid by securities in the Fund’s portfolio, adjusted for operating expenses of each class. Capital gain distributions are net profits realized from the sale of portfolio securities.
Performance as of 8/31/21Cumulative total return excludes sales charges. Average annual total return includes maximum sales charges. Sales charges will vary depending on the size of the investment and the class of share purchased. The maximum is 5.50% and the minimum is 0%. Class A: 5.50% maximum initial sales charge; Advisor Class: no sales charges. For other share classes, visit franklintempleton.com.
Share ClassCumulative
Total Return1Average Annual
Total Return2
–
A3
1-Year +20.80% +14.16%5-Year +38.06% +5.46%10-Year +102.53% +6.71%
Advisor1-Year +21.06% +21.06%5-Year +39.75% +6.92%10-Year +107.67% +7.58%
Performance data represent past performance, which does not guarantee future results. Investment return and principal value will fluctuate, and you may have a gain or loss when you sell your shares. Current performance may differ from figures shown. For most recent month-end performance, go to franklintempleton.com or call (800) 342-5236.
See page 10 for Performance Summary footnotes.

TEMPLETON GROWTH FUND, INC.PERFORMANCE SUMMARY
9franklintempleton.com Annual Report
Total Return Index Comparison for a Hypothetical $10,000 InvestmentTotal return represents the change in value of an investment over the periods shown. It includes any applicable maximum sales charge, Fund expenses, account fees and reinvested distributions. The unmanaged index includes reinvestment of any income or distributions. It differs from the Fund in composition and does not pay management fees or expenses. One cannot invest directly in an index.
Class A (9/1/11–8/31/21)
$5,000
$10,000
$15,000
$20,000
$25,000
$30,000
$35,000
$30,661 $29,088
$19,141
9/11 8/13 8/15 8/17 8/19 8/21
Templeton Growth FundTempleton Growth Fund MSCI ACWI-NR4MSCI ACWI-NR4 MSCI ACWI4MSCI ACWI4
Advisor Class (9/1/11–8/31/21)
$5,000
$10,000
$15,000
$20,000
$25,000
$30,000
$35,000
$30,661 $29,088
$20,767
9/11 8/13 8/15 8/17 8/19 8/21
Templeton Growth FundTempleton Growth Fund MSCI ACWI-NR4MSCI ACWI-NR4 MSCI ACWI4MSCI ACWI4
See page 10 for Performance Summary footnotes.

TEMPLETON GROWTH FUND, INC.PERFORMANCE SUMMARY
10 franklintempleton.comAnnual Report
Distributions (9/1/20–8/31/21)
Share ClassNet Investment
Income
A $0.2309C $0.0342R $0.1721R6 $0.3034Advisor $0.2854
Total Annual Operating Expenses5
Share Class
A 1.06%Advisor 0.81%
Each class of shares is available to certain eligible investors and has different annual fees and expenses, as described in the prospectus.
All investments involve risks, including possible loss of principal. Special risks are associated with foreign investing, including currency fluctuations, economic instability and political developments; investments in emerging markets involve heightened risks related to the same factors. Because the Fund may invest its assets in companies in a specific region, including Europe, it is subject to greater risks of adverse developments in that region and/or the surrounding regions than a fund that is more broadly diversified geographically. Political, social or economic disruptions in the region, even in countries in which the Fund is not invested, may adversely affect the value of securities held by the Fund. Current political uncertainty concerning the economic consequences of the departure of the U.K. from the European Union may increase market volatility. Derivatives involve costs and can create economic leverage which may result in significant volatility and cause the Fund to participate in losses (and enable gains) on an amount that exceeds the Fund’s initial investment. In addition, securities issued by small- and mid-capitalization companies have historically experienced more price volatility than larger-company stocks, especially over the short term and may involve additional risks. Events such as the spread of deadly diseases, disasters, and financial, political or social disruptions, may heighten risks and adversely affect performance. The Fund’s prospectus also includes a description of the main investment risks.
1. Cumulative total return represents the change in value of an investment over the periods indicated.2. Average annual total return represents the average annual change in value of an investment over the periods indicated. Return for less than one year, if any, has not been annualized.3. Prior to 9/10/18, these shares were offered at a higher initial sales charge of 5.75%, thus actual returns (with sales charges) would have differed. Average annual total returns (with sales charges) have been restated to reflect the current maximum initial sales charge of 5.50%.4. Source: Morningstar. The MSCI ACWI is a free float-adjusted, market capitalization-weighted index designed to measure equity market performance of global developed and emerging markets. Net Returns (NR) include income net of tax withholding when dividends are paid.5. Figures are as stated in the Fund’s current prospectus and may differ from the expense ratios disclosed in the Your Fund’s Expenses and Financial Highlights sections in this report. In periods of market volatility, assets may decline significantly, causing total annual Fund operating expenses to become higher than the figures shown. See www.franklintempletondatasources.com for additional data provider information.
Your Fund’s Expenses
TEMPLETON GROWTH FUND, INC.
11franklintempleton.com Annual Report
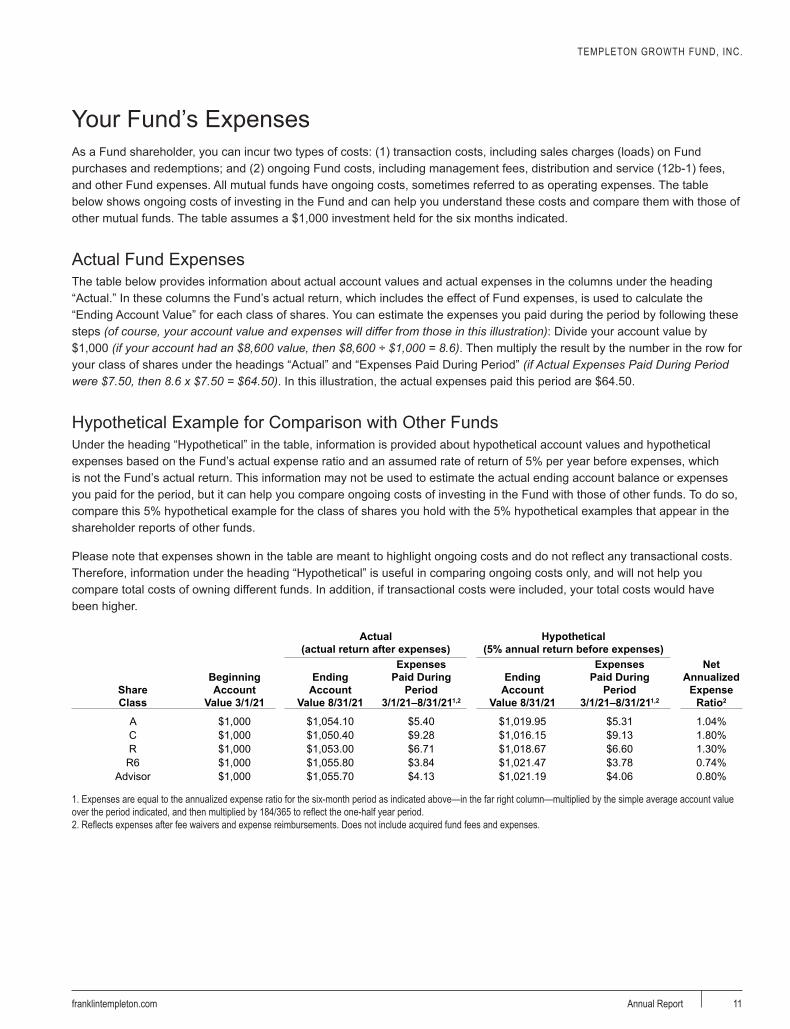
As a Fund shareholder, you can incur two types of costs: (1) transaction costs, including sales charges (loads) on Fund purchases and redemptions; and (2) ongoing Fund costs, including management fees, distribution and service (12b-1) fees, and other Fund expenses. All mutual funds have ongoing costs, sometimes referred to as operating expenses. The table below shows ongoing costs of investing in the Fund and can help you understand these costs and compare them with those of other mutual funds. The table assumes a $1,000 investment held for the six months indicated.
Actual Fund ExpensesThe table below provides information about actual account values and actual expenses in the columns under the heading “Actual.” In these columns the Fund’s actual return, which includes the effect of Fund expenses, is used to calculate the “Ending Account Value” for each class of shares. You can estimate the expenses you paid during the period by following these steps (of course, your account value and expenses will differ from those in this illustration): Divide your account value by $1,000 (if your account had an $8,600 value, then $8,600 ÷ $1,000 = 8.6). Then multiply the result by the number in the row for your class of shares under the headings “Actual” and “Expenses Paid During Period” (if Actual Expenses Paid During Period were $7.50, then 8.6 x $7.50 = $64.50). In this illustration, the actual expenses paid this period are $64.50.
Hypothetical Example for Comparison with Other FundsUnder the heading “Hypothetical” in the table, information is provided about hypothetical account values and hypothetical expenses based on the Fund’s actual expense ratio and an assumed rate of return of 5% per year before expenses, which is not the Fund’s actual return. This information may not be used to estimate the actual ending account balance or expenses you paid for the period, but it can help you compare ongoing costs of investing in the Fund with those of other funds. To do so, compare this 5% hypothetical example for the class of shares you hold with the 5% hypothetical examples that appear in the shareholder reports of other funds.
Please note that expenses shown in the table are meant to highlight ongoing costs and do not reflect any transactional costs. Therefore, information under the heading “Hypothetical” is useful in comparing ongoing costs only, and will not help you compare total costs of owning different funds. In addition, if transactional costs were included, your total costs would have been higher.
Actual (actual return after expenses)
Hypothetical (5% annual return before expenses)
Share Class
Beginning Account
Value 3/1/21
Ending Account
Value 8/31/21
Expenses Paid During
Period 3/1/21–8/31/211,2
Ending Account
Value 8/31/21
Expenses Paid During
Period 3/1/21–8/31/211,2
a
Net Annualized
Expense Ratio2
A $1,000 $1,054.10 $5.40 $1,019.95 $5.31 1.04%C $1,000 $1,050.40 $9.28 $1,016.15 $9.13 1.80%R $1,000 $1,053.00 $6.71 $1,018.67 $6.60 1.30%
R6 $1,000 $1,055.80 $3.84 $1,021.47 $3.78 0.74%Advisor $1,000 $1,055.70 $4.13 $1,021.19 $4.06 0.80%
1. Expenses are equal to the annualized expense ratio for the six-month period as indicated above—in the far right column—multiplied by the simple average account value over the period indicated, and then multiplied by 184/365 to reflect the one-half year period.2. Reflects expenses after fee waivers and expense reimbursements. Does not include acquired fund fees and expenses.
TEMPLETON GROWTH FUND, INC.
Financial Highlights
franklintempleton.comAnnual Report The accompanying notes are an integral part of these financial statements.12
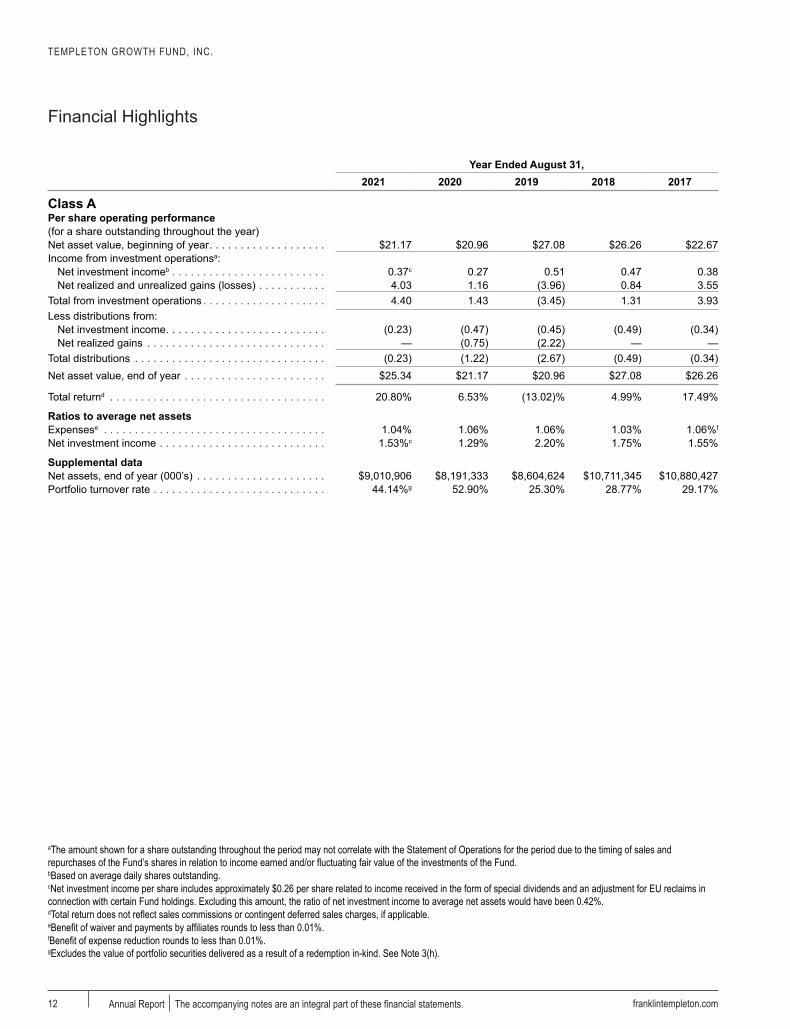
aYear Ended August 31,
2021 2020 2019 2018 2017
Class APer share operating performance(for a share outstanding throughout the year)Net asset value, beginning of year . . . . . . . . . . . . . . . . . . . $21.17 $20.96 $27.08 $26.26 $22.67Income from investment operationsa:
Net investment incomeb . . . . . . . . . . . . . . . . . . . . . . . . . 0.37c 0.27 0.51 0.47 0.38Net realized and unrealized gains (losses) . . . . . . . . . . . 4.03 1.16 (3.96) 0.84 3.55
Total from investment operations . . . . . . . . . . . . . . . . . . . . 4.40 1.43 (3.45) 1.31 3.93Less distributions from:
Net investment income . . . . . . . . . . . . . . . . . . . . . . . . . . (0.23) (0.47) (0.45) (0.49) (0.34)Net realized gains . . . . . . . . . . . . . . . . . . . . . . . . . . . . . — (0.75) (2.22) — —
Total distributions . . . . . . . . . . . . . . . . . . . . . . . . . . . . . . . (0.23) (1.22) (2.67) (0.49) (0.34)Net asset value, end of year . . . . . . . . . . . . . . . . . . . . . . . $25.34 $21.17 $20.96 $27.08 $26.26
Total returnd . . . . . . . . . . . . . . . . . . . . . . . . . . . . . . . . . . . 20.80% 6.53% (13.02)% 4.99% 17.49%
Ratios to average net assetsExpensese . . . . . . . . . . . . . . . . . . . . . . . . . . . . . . . . . . . . 1.04% 1.06% 1.06% 1.03% 1.06%f
Net investment income . . . . . . . . . . . . . . . . . . . . . . . . . . . 1.53%c 1.29% 2.20% 1.75% 1.55%
Supplemental dataNet assets, end of year (000’s) . . . . . . . . . . . . . . . . . . . . . $9,010,906 $8,191,333 $8,604,624 $10,711,345 $10,880,427Portfolio turnover rate . . . . . . . . . . . . . . . . . . . . . . . . . . . . 44.14%g 52.90% 25.30% 28.77% 29.17%
aThe amount shown for a share outstanding throughout the period may not correlate with the Statement of Operations for the period due to the timing of sales and repurchases of the Fund’s shares in relation to income earned and/or fluctuating fair value of the investments of the Fund.bBased on average daily shares outstanding.cNet investment income per share includes approximately $0.26 per share related to income received in the form of special dividends and an adjustment for EU reclaims in connection with certain Fund holdings. Excluding this amount, the ratio of net investment income to average net assets would have been 0.42%.dTotal return does not reflect sales commissions or contingent deferred sales charges, if applicable.eBenefit of waiver and payments by affiliates rounds to less than 0.01%.fBenefit of expense reduction rounds to less than 0.01%.gExcludes the value of portfolio securities delivered as a result of a redemption in-kind. See Note 3(h).

TEMPLETON GROWTH FUND, INC.FINANCIAL HIGHLIGHTS
franklintempleton.com The accompanying notes are an integral part of these financial statements. Annual Report 13
aYear Ended August 31,
2021 2020 2019 2018 2017
Class CPer share operating performance(for a share outstanding throughout the year)Net asset value, beginning of year . . . . . . . . . . . . . . . . . . . $20.71 $20.56 $26.31 $25.52 $22.04Income from investment operationsa:
Net investment incomeb . . . . . . . . . . . . . . . . . . . . . . . . . 0.19c 0.11 0.25 0.26 0.19Net realized and unrealized gains (losses) . . . . . . . . . . . 3.95 1.12 (3.78) 0.81 3.45
Total from investment operations . . . . . . . . . . . . . . . . . . . . 4.14 1.23 (3.53) 1.07 3.64Less distributions from:
Net investment income . . . . . . . . . . . . . . . . . . . . . . . . . . (0.03) (0.33) — (0.28) (0.16)Net realized gains . . . . . . . . . . . . . . . . . . . . . . . . . . . . . — (0.75) (2.22) — —
Total distributions . . . . . . . . . . . . . . . . . . . . . . . . . . . . . . . (0.03) (1.08) (2.22) (0.28) (0.16)Net asset value, end of year . . . . . . . . . . . . . . . . . . . . . . . $24.82 $20.71 $20.56 $26.31 $25.52
Total returnd . . . . . . . . . . . . . . . . . . . . . . . . . . . . . . . . . . . 19.93% 5.70% (13.68)% 4.20% 16.61%
Ratios to average net assetsExpensese . . . . . . . . . . . . . . . . . . . . . . . . . . . . . . . . . . . . 1.79% 1.82% 1.81% 1.78% 1.81%f
Net investment income . . . . . . . . . . . . . . . . . . . . . . . . . . . 0.80%c 0.54% 1.45% 1.00% 0.80%
Supplemental dataNet assets, end of year (000’s) . . . . . . . . . . . . . . . . . . . . . $111,870 $125,500 $152,392 $554,889 $594,594Portfolio turnover rate . . . . . . . . . . . . . . . . . . . . . . . . . . . . 44.14%g 52.90% 25.30% 28.77% 29.17%
aThe amount shown for a share outstanding throughout the period may not correlate with the Statement of Operations for the period due to the timing of sales and repurchases of the Fund’s shares in relation to income earned and/or fluctuating fair value of the investments of the Fund.bBased on average daily shares outstanding.cNet investment income per share includes approximately $0.26 per share related to income received in the form of special dividends and an adjustment for EU reclaims in connection with certain Fund holdings. Excluding this amount, the ratio of net investment income to average net assets would have been (0.31)%.dTotal return does not reflect sales commissions or contingent deferred sales charges, if applicable.eBenefit of waiver and payments by affiliates rounds to less than 0.01%.fBenefit of expense reduction rounds to less than 0.01%.gExcludes the value of portfolio securities delivered as a result of a redemption in-kind. See Note 3(h).

TEMPLETON GROWTH FUND, INC.FINANCIAL HIGHLIGHTS
franklintempleton.comAnnual Report The accompanying notes are an integral part of these financial statements.14
aYear Ended August 31,
2021 2020 2019 2018 2017
Class RPer share operating performance(for a share outstanding throughout the year)Net asset value, beginning of year . . . . . . . . . . . . . . . . . . . $20.93 $20.75 $26.81 $26.00 $22.45Income from investment operationsa:
Net investment incomeb . . . . . . . . . . . . . . . . . . . . . . . . . 0.30c 0.21 0.44 0.40 0.31Net realized and unrealized gains (losses) . . . . . . . . . . . 3.99 1.14 (3.91) 0.83 3.52
Total from investment operations . . . . . . . . . . . . . . . . . . . . 4.29 1.35 (3.47) 1.23 3.83Less distributions from:
Net investment income . . . . . . . . . . . . . . . . . . . . . . . . . . (0.17) (0.42) (0.37) (0.42) (0.28)Net realized gains . . . . . . . . . . . . . . . . . . . . . . . . . . . . . — (0.75) (2.22) — —
Total distributions . . . . . . . . . . . . . . . . . . . . . . . . . . . . . . . (0.17) (1.17) (2.59) (0.42) (0.28)Net asset value, end of year . . . . . . . . . . . . . . . . . . . . . . . $25.05 $20.93 $20.75 $26.81 $26.00
Total return . . . . . . . . . . . . . . . . . . . . . . . . . . . . . . . . . . . . 20.49% 6.24% (13.21)% 4.73% 17.18%
Ratios to average net assetsExpensesd . . . . . . . . . . . . . . . . . . . . . . . . . . . . . . . . . . . . 1.29% 1.31% 1.31% 1.28% 1.31%e
Net investment income . . . . . . . . . . . . . . . . . . . . . . . . . . . 1.29%c 1.04% 1.95% 1.50% 1.30%
Supplemental dataNet assets, end of year (000’s) . . . . . . . . . . . . . . . . . . . . . $60,867 $56,912 $62,515 $88,560 $99,389Portfolio turnover rate . . . . . . . . . . . . . . . . . . . . . . . . . . . . 44.14%f 52.90% 25.30% 28.77% 29.17%
aThe amount shown for a share outstanding throughout the period may not correlate with the Statement of Operations for the period due to the timing of sales and repurchases of the Fund’s shares in relation to income earned and/or fluctuating fair value of the investments of the Fund.bBased on average daily shares outstanding.cNet investment income per share includes approximately $0.26 per share related to income received in the form of special dividends and an adjustment for EU reclaims in connection with certain Fund holdings. Excluding this amount, the ratio of net investment income to average net assets would have been 0.18%.dBenefit of waiver and payments by affiliates rounds to less than 0.01%.eBenefit of expense reduction rounds to less than 0.01%.fExcludes the value of portfolio securities delivered as a result of a redemption in-kind. See Note 3(h).
TEMPLETON GROWTH FUND, INC.FINANCIAL HIGHLIGHTS
franklintempleton.com The accompanying notes are an integral part of these financial statements. Annual Report 15
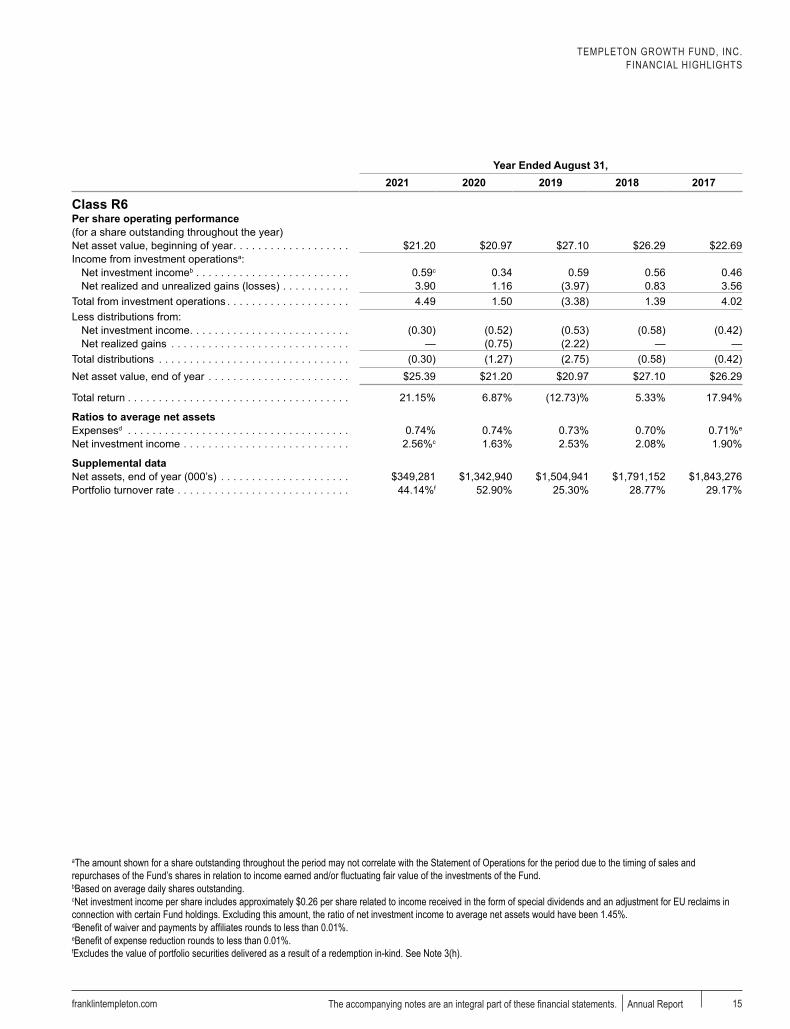
aYear Ended August 31,
2021 2020 2019 2018 2017
Class R6Per share operating performance(for a share outstanding throughout the year)Net asset value, beginning of year . . . . . . . . . . . . . . . . . . . $21.20 $20.97 $27.10 $26.29 $22.69Income from investment operationsa:
Net investment incomeb . . . . . . . . . . . . . . . . . . . . . . . . . 0.59c 0.34 0.59 0.56 0.46Net realized and unrealized gains (losses) . . . . . . . . . . . 3.90 1.16 (3.97) 0.83 3.56
Total from investment operations . . . . . . . . . . . . . . . . . . . . 4.49 1.50 (3.38) 1.39 4.02Less distributions from:
Net investment income . . . . . . . . . . . . . . . . . . . . . . . . . . (0.30) (0.52) (0.53) (0.58) (0.42)Net realized gains . . . . . . . . . . . . . . . . . . . . . . . . . . . . . — (0.75) (2.22) — —
Total distributions . . . . . . . . . . . . . . . . . . . . . . . . . . . . . . . (0.30) (1.27) (2.75) (0.58) (0.42)Net asset value, end of year . . . . . . . . . . . . . . . . . . . . . . . $25.39 $21.20 $20.97 $27.10 $26.29
Total return . . . . . . . . . . . . . . . . . . . . . . . . . . . . . . . . . . . . 21.15% 6.87% (12.73)% 5.33% 17.94%
Ratios to average net assetsExpensesd . . . . . . . . . . . . . . . . . . . . . . . . . . . . . . . . . . . . 0.74% 0.74% 0.73% 0.70% 0.71%e
Net investment income . . . . . . . . . . . . . . . . . . . . . . . . . . . 2.56%c 1.63% 2.53% 2.08% 1.90%
Supplemental dataNet assets, end of year (000’s) . . . . . . . . . . . . . . . . . . . . . $349,281 $1,342,940 $1,504,941 $1,791,152 $1,843,276Portfolio turnover rate . . . . . . . . . . . . . . . . . . . . . . . . . . . . 44.14%f 52.90% 25.30% 28.77% 29.17%
aThe amount shown for a share outstanding throughout the period may not correlate with the Statement of Operations for the period due to the timing of sales and repurchases of the Fund’s shares in relation to income earned and/or fluctuating fair value of the investments of the Fund.bBased on average daily shares outstanding.cNet investment income per share includes approximately $0.26 per share related to income received in the form of special dividends and an adjustment for EU reclaims in connection with certain Fund holdings. Excluding this amount, the ratio of net investment income to average net assets would have been 1.45%.dBenefit of waiver and payments by affiliates rounds to less than 0.01%.eBenefit of expense reduction rounds to less than 0.01%.fExcludes the value of portfolio securities delivered as a result of a redemption in-kind. See Note 3(h).

TEMPLETON GROWTH FUND, INC.FINANCIAL HIGHLIGHTS
franklintempleton.comAnnual Report The accompanying notes are an integral part of these financial statements.16
aYear Ended August 31,
2021 2020 2019 2018 2017
Advisor ClassPer share operating performance(for a share outstanding throughout the year)Net asset value, beginning of year . . . . . . . . . . . . . . . . . . . $21.24 $21.01 $27.15 $26.33 $22.73Income from investment operationsa:
Net investment incomeb . . . . . . . . . . . . . . . . . . . . . . . . . 0.42c 0.32 0.57 0.54 0.45Net realized and unrealized gains (losses) . . . . . . . . . . . 4.05 1.17 (3.98) 0.83 3.55
Total from investment operations . . . . . . . . . . . . . . . . . . . . 4.47 1.49 (3.41) 1.37 4.00Less distributions from:
Net investment income . . . . . . . . . . . . . . . . . . . . . . . . . . (0.29) (0.51) (0.51) (0.55) (0.40)Net realized gains . . . . . . . . . . . . . . . . . . . . . . . . . . . . . — (0.75) (2.22) — —
Total distributions . . . . . . . . . . . . . . . . . . . . . . . . . . . . . . . (0.29) (1.26) (2.73) (0.55) (0.40)Net asset value, end of year . . . . . . . . . . . . . . . . . . . . . . . $25.42 $21.24 $21.01 $27.15 $26.33
Total return . . . . . . . . . . . . . . . . . . . . . . . . . . . . . . . . . . . . 21.06% 6.79% (12.79)% 5.24% 17.78%
Ratios to average net assetsExpensesd . . . . . . . . . . . . . . . . . . . . . . . . . . . . . . . . . . . . 0.80% 0.81% 0.81% 0.78% 0.81%e
Net investment income . . . . . . . . . . . . . . . . . . . . . . . . . . . 1.76%c 1.54% 2.45% 2.00% 1.80%
Supplemental dataNet assets, end of year (000’s) . . . . . . . . . . . . . . . . . . . . . $429,251 $377,028 $427,371 $533,358 $523,263Portfolio turnover rate . . . . . . . . . . . . . . . . . . . . . . . . . . . . 44.14%f 52.90% 25.30% 28.77% 29.17%
aThe amount shown for a share outstanding throughout the period may not correlate with the Statement of Operations for the period due to the timing of sales and repurchases of the Fund’s shares in relation to income earned and/or fluctuating fair value of the investments of the Fund.bBased on average daily shares outstanding.cNet investment income per share includes approximately $0.26 per share related to income received in the form of special dividends and an adjustment for EU reclaims in connection with certain Fund holdings. Excluding this amount, the ratio of net investment income to average net assets would have been 0.66%.dBenefit of waiver and payments by affiliates rounds to less than 0.01%.eBenefit of expense reduction rounds to less than 0.01%.fExcludes the value of portfolio securities delivered as a result of a redemption in-kind. See Note 3(h).

TEMPLETON GROWTH FUND, INC.
Statement of Investments, August 31, 2021
franklintempleton.com The accompanying notes are an integral part of these financial statements. Annual Report 17
a a Industry Shares a Value a
Common Stocks 95.0% Belgium 3.4%Anheuser-Busch InBev SA/NV . . . . . . Beverages 3,529,667 $216,473,227Umicore SA . . . . . . . . . . . . . . . . . . . . Chemicals 1,897,404 124,847,663
341,320,890
Brazil 1.1%Wheaton Precious Metals Corp. . . . . . Metals & Mining 2,313,196 104,279,969
China 3.8%Gree Electric Appliances, Inc. of Zhuhai,
A . . . . . . . . . . . . . . . . . . . . . . . . . . . Household Durables 11,988,185 76,268,967NXP Semiconductors NV . . . . . . . . . . Semiconductors & Semiconductor Equipment 621,127 133,623,052
aProsus NV . . . . . . . . . . . . . . . . . . . . . Internet & Direct Marketing Retail 638,864 56,546,985Yum China Holdings, Inc. . . . . . . . . . . Hotels, Restaurants & Leisure 1,746,474 107,512,939
373,951,943
France 2.0%Danone SA . . . . . . . . . . . . . . . . . . . . . Food Products 1,318,314 96,266,833Pernod Ricard SA . . . . . . . . . . . . . . . . Beverages 481,673 101,391,676
197,658,509
Germany 8.3%adidas AG . . . . . . . . . . . . . . . . . . . . . . Textiles, Apparel & Luxury Goods 272,580 96,693,606
aContinental AG . . . . . . . . . . . . . . . . . . Auto Components 994,738 133,674,857E.ON SE . . . . . . . . . . . . . . . . . . . . . . . Multi-Utilities 15,871,597 209,394,076Fresenius Medical Care AG & Co. KGaA Health Care Providers & Services 1,994,473 153,348,457Infineon Technologies AG . . . . . . . . . . Semiconductors & Semiconductor Equipment 2,623,085 111,680,321Siemens AG . . . . . . . . . . . . . . . . . . . . Industrial Conglomerates 705,225 116,988,220
821,779,537
Hong Kong 1.8%AIA Group Ltd. . . . . . . . . . . . . . . . . . . Insurance 15,217,831 181,710,800
Japan 11.9%Fujitsu Ltd. . . . . . . . . . . . . . . . . . . . . . IT Services 851,084 156,673,502Honda Motor Co. Ltd. . . . . . . . . . . . . . Automobiles 3,785,412 114,571,711Isuzu Motors Ltd. . . . . . . . . . . . . . . . . Automobiles 4,270,400 53,983,282Komatsu Ltd. . . . . . . . . . . . . . . . . . . . Machinery 6,045,300 147,038,131Kyocera Corp. . . . . . . . . . . . . . . . . . . . Electronic Equipment, Instruments &
Components 977,477 60,766,838Makita Corp. . . . . . . . . . . . . . . . . . . . . Machinery 1,757,963 100,989,335Mitsubishi Electric Corp. . . . . . . . . . . . Electrical Equipment 8,725,900 119,292,715Nexon Co. Ltd. . . . . . . . . . . . . . . . . . . Entertainment 4,093,616 74,662,001Nitori Holdings Co. Ltd. . . . . . . . . . . . . Specialty Retail 271,547 50,807,893Panasonic Corp. . . . . . . . . . . . . . . . . . Household Durables 11,938,468 142,725,271Sony Group Corp. . . . . . . . . . . . . . . . . Household Durables 1,605,460 165,997,149
1,187,507,828
Luxembourg 1.0%ArcelorMittal SA . . . . . . . . . . . . . . . . . Metals & Mining 2,946,457 98,819,918
Macau 0.5%aGalaxy Entertainment Group Ltd. . . . . Hotels, Restaurants & Leisure 8,282,618 53,104,485
a
Norway 1.2%Equinor ASA . . . . . . . . . . . . . . . . . . . . Oil, Gas & Consumable Fuels 5,569,497 118,033,248
South Korea 2.6%Samsung Electronics Co. Ltd. . . . . . . . Technology Hardware, Storage & Peripherals 3,974,204 262,515,948

TEMPLETON GROWTH FUND, INC.STATEMENT OF INVESTMENTS
franklintempleton.comAnnual Report The accompanying notes are an integral part of these financial statements.18
a a Industry Shares a Value a
Common Stocks (continued) Switzerland 2.1%Roche Holding AG . . . . . . . . . . . . . . . Pharmaceuticals 525,103 $210,846,312
United Kingdom 10.9%AstraZeneca plc . . . . . . . . . . . . . . . . . Pharmaceuticals 896,297 104,819,869BAE Systems plc . . . . . . . . . . . . . . . . Aerospace & Defense 14,622,483 114,244,060BP plc . . . . . . . . . . . . . . . . . . . . . . . . . Oil, Gas & Consumable Fuels 25,993,909 105,754,740Burberry Group plc . . . . . . . . . . . . . . . Textiles, Apparel & Luxury Goods 3,890,852 99,631,713
aCompass Group plc . . . . . . . . . . . . . . Hotels, Restaurants & Leisure 6,775,324 139,982,969aInterContinental Hotels Group plc . . . . Hotels, Restaurants & Leisure 1,755,301 112,157,490aInternational Consolidated Airlines
Group SA . . . . . . . . . . . . . . . . . . . . . Airlines 33,502,759 73,457,348aRolls-Royce Holdings plc . . . . . . . . . . Aerospace & Defense 74,576,604 117,613,251Unilever plc . . . . . . . . . . . . . . . . . . . . . Personal Products 2,421,064 134,766,348
aWhitbread plc . . . . . . . . . . . . . . . . . . . Hotels, Restaurants & Leisure 1,884,678 83,229,212
1,085,657,000
United States 44.4%Albemarle Corp. . . . . . . . . . . . . . . . . . Chemicals 958,158 226,834,325American Express Co. . . . . . . . . . . . . Consumer Finance 893,842 148,342,018
aBooking Holdings, Inc. . . . . . . . . . . . . Hotels, Restaurants & Leisure 83,142 191,199,163BorgWarner, Inc. . . . . . . . . . . . . . . . . . Auto Components 2,474,987 105,632,445Comcast Corp., A . . . . . . . . . . . . . . . . Media 2,466,927 149,693,130
aDollar Tree, Inc. . . . . . . . . . . . . . . . . . Multiline Retail 1,608,666 145,648,620DuPont de Nemours, Inc. . . . . . . . . . . Chemicals 2,402,057 177,800,259
aDXC Technology Co. . . . . . . . . . . . . . . IT Services 4,255,808 156,273,270Freeport-McMoRan, Inc. . . . . . . . . . . . Metals & Mining 2,372,557 86,337,349Honeywell International, Inc. . . . . . . . . Industrial Conglomerates 389,811 90,401,069
aHyatt Hotels Corp., A . . . . . . . . . . . . . . Hotels, Restaurants & Leisure 713,676 52,519,417Johnson & Johnson . . . . . . . . . . . . . . Pharmaceuticals 940,452 162,820,455
aLaboratory Corp. of America Holdings . Health Care Providers & Services 330,533 100,277,101Lear Corp. . . . . . . . . . . . . . . . . . . . . . Auto Components 579,183 92,634,529Marathon Petroleum Corp. . . . . . . . . . Oil, Gas & Consumable Fuels 3,524,559 208,900,612Medtronic plc . . . . . . . . . . . . . . . . . . . Health Care Equipment & Supplies 1,494,673 199,508,952Public Service Enterprise Group, Inc. . Multi-Utilities 874,390 55,908,497Ross Stores, Inc. . . . . . . . . . . . . . . . . Specialty Retail 1,401,259 165,909,066Southern Co. (The) . . . . . . . . . . . . . . . Electric Utilities 1,656,068 108,853,350
aSouthwest Airlines Co. . . . . . . . . . . . . Airlines 2,581,275 128,495,869Stanley Black & Decker, Inc. . . . . . . . . Machinery 309,280 59,774,546Starbucks Corp. . . . . . . . . . . . . . . . . . Hotels, Restaurants & Leisure 782,450 91,930,050Sysco Corp. . . . . . . . . . . . . . . . . . . . . Food & Staples Retailing 2,761,922 219,987,087TJX Cos., Inc. (The) . . . . . . . . . . . . . . Specialty Retail 2,310,746 168,037,449
aT-Mobile US, Inc. . . . . . . . . . . . . . . . . Wireless Telecommunication Services 726,011 99,478,027United Parcel Service, Inc., B . . . . . . . Air Freight & Logistics 470,909 92,123,928UnitedHealth Group, Inc. . . . . . . . . . . . Health Care Providers & Services 313,563 130,526,870Verizon Communications, Inc. . . . . . . . Diversified Telecommunication Services 1,854,061 101,973,355Visa, Inc., A . . . . . . . . . . . . . . . . . . . . . IT Services 605,021 138,610,311
aWalt Disney Co. (The) . . . . . . . . . . . . . Entertainment 1,263,858 229,137,455Westinghouse Air Brake Technologies
Corp. . . . . . . . . . . . . . . . . . . . . . . . . Machinery 1,890,045 169,707,141Zimmer Biomet Holdings, Inc. . . . . . . . Health Care Equipment & Supplies 1,125,177 169,282,880
4,424,558,595
Total Common Stocks (Cost $7,195,236,255) . . . . . . . . . . . . . . . . . . . . . . . . . . . . . . . . . . . . 9,461,744,982

TEMPLETON GROWTH FUND, INC.STATEMENT OF INVESTMENTS
franklintempleton.com The accompanying notes are an integral part of these financial statements. Annual Report 19
a a Industry Shares a Valuea a a a a a
Escrows and Litigation Trusts 0.0%a,bHemisphere Properties India Ltd.,
Escrow Account . . . . . . . . . . . . . . . . 104,748 $—
Total Escrows and Litigation Trusts (Cost $–) . . . . . . . . . . . . . . . . . . . . . . . . . . . . . . . . . . . —
Total Long Term Investments (Cost $7,195,236,255) . . . . . . . . . . . . . . . . . . . . . . . . . . . . . 9,461,744,982
Short Term Investments 2.3%
a a
Principal Amount* a Value
a a a a a a
Time Deposits 2.3%Canada 1.7%National Bank of Canada, 0.05%,
9/01/21 . . . . . . . . . . . . . . . . . . . . . . 100,000,000 100,000,000Royal Bank of Canada, 0.03%, 9/01/21 65,700,000 65,700,000
165,700,000
France 0.6%BNP Paribas SA, 0.06%, 9/01/21. . . . . 45,000,000 45,000,000Credit Agricole Corporate and
Investment Bank SA, 0.05%, 9/01/21 20,000,000 20,000,000
65,000,000
Total Time Deposits (Cost $230,700,000) . . . . . . . . . . . . . . . . . . . . . . . . . . . . . . . . . . . . . . . 230,700,000
a a a a a
Total Short Term Investments (Cost $230,700,000) . . . . . . . . . . . . . . . . . . . . . . . . . . . . . . . 230,700,000a a a
Total Investments (Cost $7,425,936,255) 97.3% . . . . . . . . . . . . . . . . . . . . . . . . . . . . . . . . . . $9,692,444,982Other Assets, less Liabilities 2.7% . . . . . . . . . . . . . . . . . . . . . . . . . . . . . . . . . . . . . . . . . . . . . 269,730,520
Net Assets 100.0% . . . . . . . . . . . . . . . . . . . . . . . . . . . . . . . . . . . . . . . . . . . . . . . . . . . . . . . . . . . $9,962,175,502aa a
* The principal amount is stated in U.S. dollars unless otherwise indicated.a Non-income producing.b Fair valued using significant unobservable inputs. See Note 9 regarding fair value measurements.
TEMPLETON GROWTH FUND, INC.FINANCIAL STATEMENTS
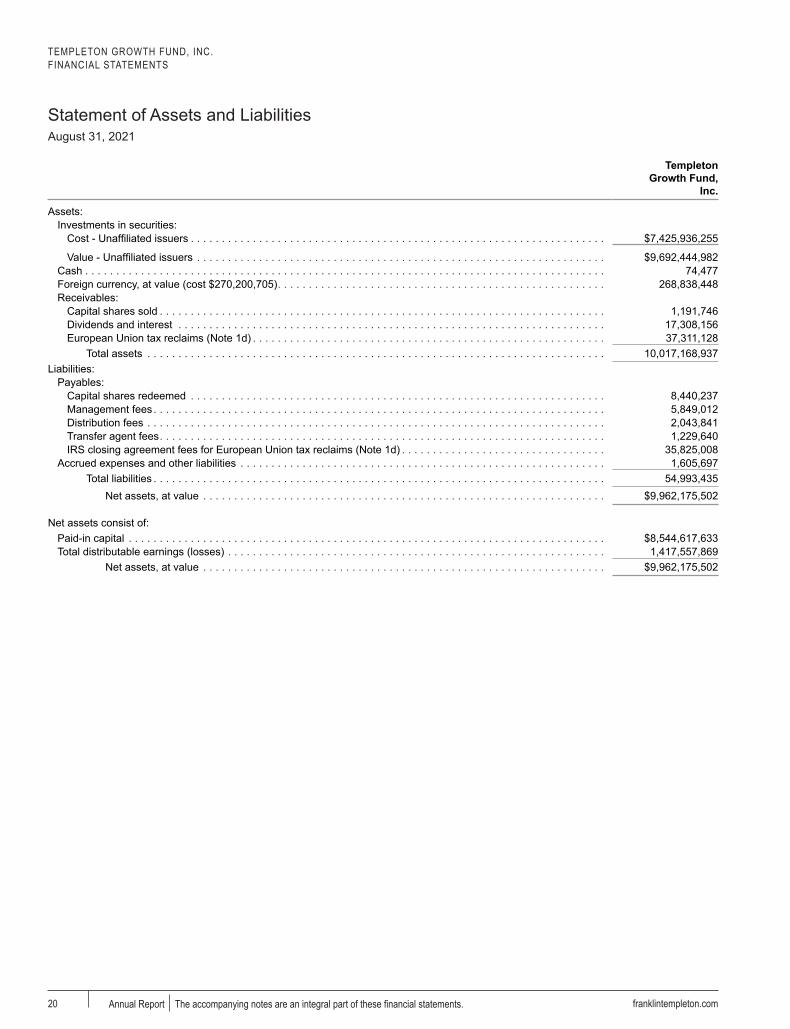
Statement of Assets and LiabilitiesAugust 31, 2021
franklintempleton.comAnnual Report The accompanying notes are an integral part of these financial statements.20
Templeton Growth Fund,
Inc.
Assets:Investments in securities:
Cost - Unaffiliated issuers . . . . . . . . . . . . . . . . . . . . . . . . . . . . . . . . . . . . . . . . . . . . . . . . . . . . . . . . . . . . . . . . . . . $7,425,936,255
Value - Unaffiliated issuers . . . . . . . . . . . . . . . . . . . . . . . . . . . . . . . . . . . . . . . . . . . . . . . . . . . . . . . . . . . . . . . . . . $9,692,444,982Cash . . . . . . . . . . . . . . . . . . . . . . . . . . . . . . . . . . . . . . . . . . . . . . . . . . . . . . . . . . . . . . . . . . . . . . . . . . . . . . . . . . . . 74,477Foreign currency, at value (cost $270,200,705) . . . . . . . . . . . . . . . . . . . . . . . . . . . . . . . . . . . . . . . . . . . . . . . . . . . . . 268,838,448Receivables:
Capital shares sold . . . . . . . . . . . . . . . . . . . . . . . . . . . . . . . . . . . . . . . . . . . . . . . . . . . . . . . . . . . . . . . . . . . . . . . . 1,191,746Dividends and interest . . . . . . . . . . . . . . . . . . . . . . . . . . . . . . . . . . . . . . . . . . . . . . . . . . . . . . . . . . . . . . . . . . . . . 17,308,156European Union tax reclaims (Note 1d) . . . . . . . . . . . . . . . . . . . . . . . . . . . . . . . . . . . . . . . . . . . . . . . . . . . . . . . . . 37,311,128
Total assets . . . . . . . . . . . . . . . . . . . . . . . . . . . . . . . . . . . . . . . . . . . . . . . . . . . . . . . . . . . . . . . . . . . . . . . . . . 10,017,168,937Liabilities:
Payables:Capital shares redeemed . . . . . . . . . . . . . . . . . . . . . . . . . . . . . . . . . . . . . . . . . . . . . . . . . . . . . . . . . . . . . . . . . . . 8,440,237Management fees . . . . . . . . . . . . . . . . . . . . . . . . . . . . . . . . . . . . . . . . . . . . . . . . . . . . . . . . . . . . . . . . . . . . . . . . . 5,849,012Distribution fees . . . . . . . . . . . . . . . . . . . . . . . . . . . . . . . . . . . . . . . . . . . . . . . . . . . . . . . . . . . . . . . . . . . . . . . . . . 2,043,841Transfer agent fees . . . . . . . . . . . . . . . . . . . . . . . . . . . . . . . . . . . . . . . . . . . . . . . . . . . . . . . . . . . . . . . . . . . . . . . . 1,229,640IRS closing agreement fees for European Union tax reclaims (Note 1d) . . . . . . . . . . . . . . . . . . . . . . . . . . . . . . . . . 35,825,008
Accrued expenses and other liabilities . . . . . . . . . . . . . . . . . . . . . . . . . . . . . . . . . . . . . . . . . . . . . . . . . . . . . . . . . . . 1,605,697Total liabilities . . . . . . . . . . . . . . . . . . . . . . . . . . . . . . . . . . . . . . . . . . . . . . . . . . . . . . . . . . . . . . . . . . . . . . . . . 54,993,435
Net assets, at value . . . . . . . . . . . . . . . . . . . . . . . . . . . . . . . . . . . . . . . . . . . . . . . . . . . . . . . . . . . . . . . . . $9,962,175,502
Net assets consist of:Paid-in capital . . . . . . . . . . . . . . . . . . . . . . . . . . . . . . . . . . . . . . . . . . . . . . . . . . . . . . . . . . . . . . . . . . . . . . . . . . . . . $8,544,617,633Total distributable earnings (losses) . . . . . . . . . . . . . . . . . . . . . . . . . . . . . . . . . . . . . . . . . . . . . . . . . . . . . . . . . . . . . 1,417,557,869
Net assets, at value . . . . . . . . . . . . . . . . . . . . . . . . . . . . . . . . . . . . . . . . . . . . . . . . . . . . . . . . . . . . . . . . . $9,962,175,502

TEMPLETON GROWTH FUND, INC.FINANCIAL STATEMENTS
Statement of Assets and Liabilities (continued)
August 31, 2021
franklintempleton.com The accompanying notes are an integral part of these financial statements. Annual Report 21
Templeton Growth Fund,
Inc.
Class A:Net assets, at value . . . . . . . . . . . . . . . . . . . . . . . . . . . . . . . . . . . . . . . . . . . . . . . . . . . . . . . . . . . . . . . . . . . . . . . $9,010,906,057Shares outstanding . . . . . . . . . . . . . . . . . . . . . . . . . . . . . . . . . . . . . . . . . . . . . . . . . . . . . . . . . . . . . . . . . . . . . . . . 355,615,736Net asset value per sharea . . . . . . . . . . . . . . . . . . . . . . . . . . . . . . . . . . . . . . . . . . . . . . . . . . . . . . . . . . . . . . . . . . $25.34Maximum offering price per share (net asset value per share ÷ 94.50%) . . . . . . . . . . . . . . . . . . . . . . . . . . . . . . . . $26.81
Class C:Net assets, at value . . . . . . . . . . . . . . . . . . . . . . . . . . . . . . . . . . . . . . . . . . . . . . . . . . . . . . . . . . . . . . . . . . . . . . . $111,870,465Shares outstanding . . . . . . . . . . . . . . . . . . . . . . . . . . . . . . . . . . . . . . . . . . . . . . . . . . . . . . . . . . . . . . . . . . . . . . . . 4,508,117Net asset value and maximum offering price per sharea . . . . . . . . . . . . . . . . . . . . . . . . . . . . . . . . . . . . . . . . . . . . . $24.82
Class R:Net assets, at value . . . . . . . . . . . . . . . . . . . . . . . . . . . . . . . . . . . . . . . . . . . . . . . . . . . . . . . . . . . . . . . . . . . . . . . $60,866,986Shares outstanding . . . . . . . . . . . . . . . . . . . . . . . . . . . . . . . . . . . . . . . . . . . . . . . . . . . . . . . . . . . . . . . . . . . . . . . . 2,430,155Net asset value and maximum offering price per share . . . . . . . . . . . . . . . . . . . . . . . . . . . . . . . . . . . . . . . . . . . . . $25.05
Class R6:Net assets, at value . . . . . . . . . . . . . . . . . . . . . . . . . . . . . . . . . . . . . . . . . . . . . . . . . . . . . . . . . . . . . . . . . . . . . . . $349,281,442Shares outstanding . . . . . . . . . . . . . . . . . . . . . . . . . . . . . . . . . . . . . . . . . . . . . . . . . . . . . . . . . . . . . . . . . . . . . . . . 13,755,415Net asset value and maximum offering price per share . . . . . . . . . . . . . . . . . . . . . . . . . . . . . . . . . . . . . . . . . . . . . $25.39
Advisor Class:Net assets, at value . . . . . . . . . . . . . . . . . . . . . . . . . . . . . . . . . . . . . . . . . . . . . . . . . . . . . . . . . . . . . . . . . . . . . . . $429,250,552Shares outstanding . . . . . . . . . . . . . . . . . . . . . . . . . . . . . . . . . . . . . . . . . . . . . . . . . . . . . . . . . . . . . . . . . . . . . . . . 16,886,320Net asset value and maximum offering price per share . . . . . . . . . . . . . . . . . . . . . . . . . . . . . . . . . . . . . . . . . . . . . $25.42
aRedemption price is equal to net asset value less contingent deferred sales charges, if applicable.
TEMPLETON GROWTH FUND, INC.FINANCIAL STATEMENTS
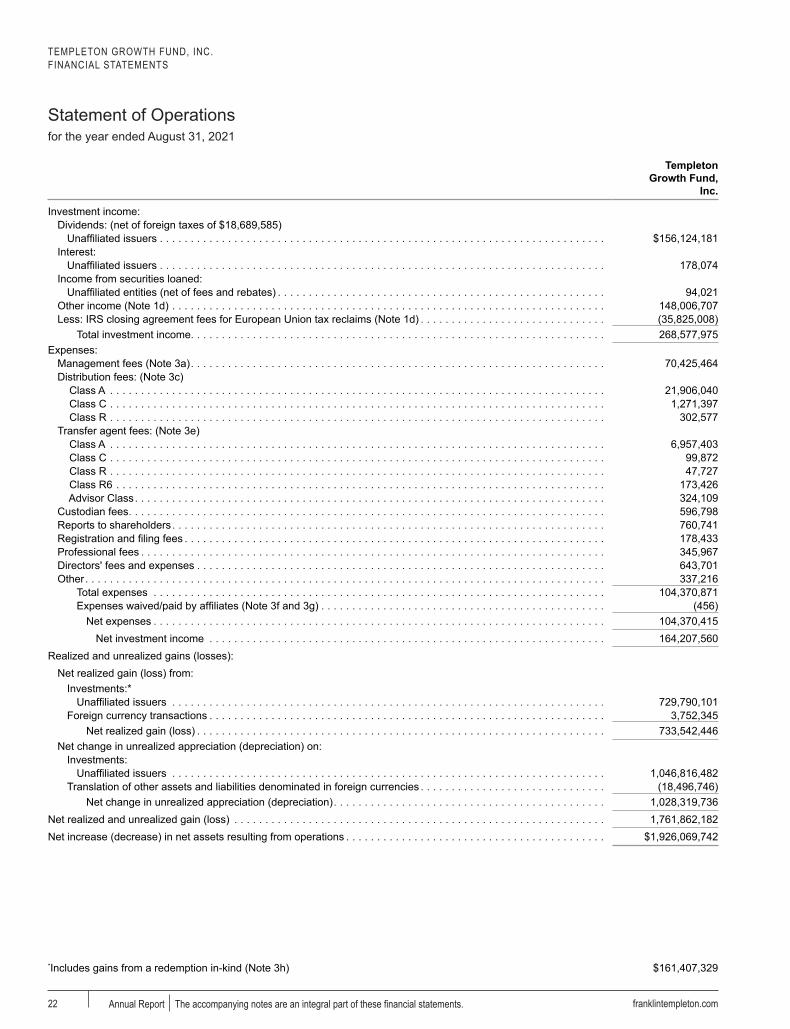
Statement of Operationsfor the year ended August 31, 2021
franklintempleton.comAnnual Report The accompanying notes are an integral part of these financial statements.22
Templeton Growth Fund,
Inc.
Investment income:Dividends: (net of foreign taxes of $18,689,585)
Unaffiliated issuers . . . . . . . . . . . . . . . . . . . . . . . . . . . . . . . . . . . . . . . . . . . . . . . . . . . . . . . . . . . . . . . . . . . . . . . . $156,124,181Interest:
Unaffiliated issuers . . . . . . . . . . . . . . . . . . . . . . . . . . . . . . . . . . . . . . . . . . . . . . . . . . . . . . . . . . . . . . . . . . . . . . . . 178,074Income from securities loaned:
Unaffiliated entities (net of fees and rebates) . . . . . . . . . . . . . . . . . . . . . . . . . . . . . . . . . . . . . . . . . . . . . . . . . . . . . 94,021Other income (Note 1d) . . . . . . . . . . . . . . . . . . . . . . . . . . . . . . . . . . . . . . . . . . . . . . . . . . . . . . . . . . . . . . . . . . . . . . 148,006,707Less: IRS closing agreement fees for European Union tax reclaims (Note 1d) . . . . . . . . . . . . . . . . . . . . . . . . . . . . . . (35,825,008)
Total investment income . . . . . . . . . . . . . . . . . . . . . . . . . . . . . . . . . . . . . . . . . . . . . . . . . . . . . . . . . . . . . . . . . . . 268,577,975Expenses:
Management fees (Note 3a) . . . . . . . . . . . . . . . . . . . . . . . . . . . . . . . . . . . . . . . . . . . . . . . . . . . . . . . . . . . . . . . . . . . 70,425,464Distribution fees: (Note 3c) Class A . . . . . . . . . . . . . . . . . . . . . . . . . . . . . . . . . . . . . . . . . . . . . . . . . . . . . . . . . . . . . . . . . . . . . . . . . . . . . . . . 21,906,040 Class C . . . . . . . . . . . . . . . . . . . . . . . . . . . . . . . . . . . . . . . . . . . . . . . . . . . . . . . . . . . . . . . . . . . . . . . . . . . . . . . . 1,271,397 Class R . . . . . . . . . . . . . . . . . . . . . . . . . . . . . . . . . . . . . . . . . . . . . . . . . . . . . . . . . . . . . . . . . . . . . . . . . . . . . . . . 302,577Transfer agent fees: (Note 3e) Class A . . . . . . . . . . . . . . . . . . . . . . . . . . . . . . . . . . . . . . . . . . . . . . . . . . . . . . . . . . . . . . . . . . . . . . . . . . . . . . . . 6,957,403 Class C . . . . . . . . . . . . . . . . . . . . . . . . . . . . . . . . . . . . . . . . . . . . . . . . . . . . . . . . . . . . . . . . . . . . . . . . . . . . . . . . 99,872 Class R . . . . . . . . . . . . . . . . . . . . . . . . . . . . . . . . . . . . . . . . . . . . . . . . . . . . . . . . . . . . . . . . . . . . . . . . . . . . . . . . 47,727 Class R6 . . . . . . . . . . . . . . . . . . . . . . . . . . . . . . . . . . . . . . . . . . . . . . . . . . . . . . . . . . . . . . . . . . . . . . . . . . . . . . . 173,426 Advisor Class . . . . . . . . . . . . . . . . . . . . . . . . . . . . . . . . . . . . . . . . . . . . . . . . . . . . . . . . . . . . . . . . . . . . . . . . . . . . 324,109Custodian fees . . . . . . . . . . . . . . . . . . . . . . . . . . . . . . . . . . . . . . . . . . . . . . . . . . . . . . . . . . . . . . . . . . . . . . . . . . . . . 596,798Reports to shareholders . . . . . . . . . . . . . . . . . . . . . . . . . . . . . . . . . . . . . . . . . . . . . . . . . . . . . . . . . . . . . . . . . . . . . . 760,741Registration and filing fees . . . . . . . . . . . . . . . . . . . . . . . . . . . . . . . . . . . . . . . . . . . . . . . . . . . . . . . . . . . . . . . . . . . . 178,433Professional fees . . . . . . . . . . . . . . . . . . . . . . . . . . . . . . . . . . . . . . . . . . . . . . . . . . . . . . . . . . . . . . . . . . . . . . . . . . . 345,967Directors' fees and expenses . . . . . . . . . . . . . . . . . . . . . . . . . . . . . . . . . . . . . . . . . . . . . . . . . . . . . . . . . . . . . . . . . . 643,701Other . . . . . . . . . . . . . . . . . . . . . . . . . . . . . . . . . . . . . . . . . . . . . . . . . . . . . . . . . . . . . . . . . . . . . . . . . . . . . . . . . . . . 337,216
Total expenses . . . . . . . . . . . . . . . . . . . . . . . . . . . . . . . . . . . . . . . . . . . . . . . . . . . . . . . . . . . . . . . . . . . . . . . . . 104,370,871Expenses waived/paid by affiliates (Note 3f and 3g) . . . . . . . . . . . . . . . . . . . . . . . . . . . . . . . . . . . . . . . . . . . . . . (456)
Net expenses . . . . . . . . . . . . . . . . . . . . . . . . . . . . . . . . . . . . . . . . . . . . . . . . . . . . . . . . . . . . . . . . . . . . . . . . . 104,370,415Net investment income . . . . . . . . . . . . . . . . . . . . . . . . . . . . . . . . . . . . . . . . . . . . . . . . . . . . . . . . . . . . . . . . 164,207,560
Realized and unrealized gains (losses):Net realized gain (loss) from:
Investments:* Unaffiliated issuers . . . . . . . . . . . . . . . . . . . . . . . . . . . . . . . . . . . . . . . . . . . . . . . . . . . . . . . . . . . . . . . . . . . . . . 729,790,101
Foreign currency transactions . . . . . . . . . . . . . . . . . . . . . . . . . . . . . . . . . . . . . . . . . . . . . . . . . . . . . . . . . . . . . . . . 3,752,345Net realized gain (loss) . . . . . . . . . . . . . . . . . . . . . . . . . . . . . . . . . . . . . . . . . . . . . . . . . . . . . . . . . . . . . . . . . . 733,542,446
Net change in unrealized appreciation (depreciation) on:Investments:
Unaffiliated issuers . . . . . . . . . . . . . . . . . . . . . . . . . . . . . . . . . . . . . . . . . . . . . . . . . . . . . . . . . . . . . . . . . . . . . . 1,046,816,482Translation of other assets and liabilities denominated in foreign currencies . . . . . . . . . . . . . . . . . . . . . . . . . . . . . . (18,496,746)
Net change in unrealized appreciation (depreciation) . . . . . . . . . . . . . . . . . . . . . . . . . . . . . . . . . . . . . . . . . . . . 1,028,319,736Net realized and unrealized gain (loss) . . . . . . . . . . . . . . . . . . . . . . . . . . . . . . . . . . . . . . . . . . . . . . . . . . . . . . . . . . . . 1,761,862,182Net increase (decrease) in net assets resulting from operations . . . . . . . . . . . . . . . . . . . . . . . . . . . . . . . . . . . . . . . . . . $1,926,069,742
*Includes gains from a redemption in-kind (Note 3h) $161,407,329

TEMPLETON GROWTH FUND, INC.FINANCIAL STATEMENTS
Statements of Changes in Net Assets
franklintempleton.com The accompanying notes are an integral part of these financial statements. Annual Report 23
Templeton Growth Fund, Inc.Year Ended
August 31, 2021Year Ended
August 31, 2020
Increase (decrease) in net assets:Operations:
Net investment income . . . . . . . . . . . . . . . . . . . . . . . . . . . . . . . . . . . . . . . . . . . . . . . . . $164,207,560 $138,922,117Net realized gain (loss) . . . . . . . . . . . . . . . . . . . . . . . . . . . . . . . . . . . . . . . . . . . . . . . . . 733,542,446 (1,648,621,538)Net change in unrealized appreciation (depreciation) . . . . . . . . . . . . . . . . . . . . . . . . . . . 1,028,319,736 2,176,684,560
Net increase (decrease) in net assets resulting from operations . . . . . . . . . . . . . . . . 1,926,069,742 666,985,139Distributions to shareholders: Class A . . . . . . . . . . . . . . . . . . . . . . . . . . . . . . . . . . . . . . . . . . . . . . . . . . . . . . . . . . . . . (86,973,881) (484,955,431) Class C . . . . . . . . . . . . . . . . . . . . . . . . . . . . . . . . . . . . . . . . . . . . . . . . . . . . . . . . . . . . . (190,023) (7,391,161) Class R . . . . . . . . . . . . . . . . . . . . . . . . . . . . . . . . . . . . . . . . . . . . . . . . . . . . . . . . . . . . . (450,648) (3,414,509) Class R6 . . . . . . . . . . . . . . . . . . . . . . . . . . . . . . . . . . . . . . . . . . . . . . . . . . . . . . . . . . . . (18,346,054) (86,672,195) Advisor Class . . . . . . . . . . . . . . . . . . . . . . . . . . . . . . . . . . . . . . . . . . . . . . . . . . . . . . . . (4,890,382) (24,230,750)Total distributions to shareholders . . . . . . . . . . . . . . . . . . . . . . . . . . . . . . . . . . . . . . . . . . (110,850,988) (606,664,046)Capital share transactions: (Note 2) Class A . . . . . . . . . . . . . . . . . . . . . . . . . . . . . . . . . . . . . . . . . . . . . . . . . . . . . . . . . . . . . (745,855,966) (464,763,137) Class C . . . . . . . . . . . . . . . . . . . . . . . . . . . . . . . . . . . . . . . . . . . . . . . . . . . . . . . . . . . . . (36,651,009) (26,723,960) Class R . . . . . . . . . . . . . . . . . . . . . . . . . . . . . . . . . . . . . . . . . . . . . . . . . . . . . . . . . . . . . (6,773,560) (6,021,736) Class R6 . . . . . . . . . . . . . . . . . . . . . . . . . . . . . . . . . . . . . . . . . . . . . . . . . . . . . . . . . . . . (1,137,838,574) (169,111,293) Advisor Class . . . . . . . . . . . . . . . . . . . . . . . . . . . . . . . . . . . . . . . . . . . . . . . . . . . . . . . . (19,636,940) (51,831,499)Total capital share transactions . . . . . . . . . . . . . . . . . . . . . . . . . . . . . . . . . . . . . . . . . . . . (1,946,756,049) (718,451,625)
Net increase (decrease) in net assets . . . . . . . . . . . . . . . . . . . . . . . . . . . . . . . . . . . (131,537,295) (658,130,532)Net assets:
Beginning of year . . . . . . . . . . . . . . . . . . . . . . . . . . . . . . . . . . . . . . . . . . . . . . . . . . . . . . . 10,093,712,797 10,751,843,329End of year . . . . . . . . . . . . . . . . . . . . . . . . . . . . . . . . . . . . . . . . . . . . . . . . . . . . . . . . . . . $9,962,175,502 $10,093,712,797
TEMPLETON GROWTH FUND, INC.
Notes to Financial Statements
24 franklintempleton.comAnnual Report
1.OrganizationandSignificantAccountingPolicies
Templeton Growth Fund, Inc. (Fund) is registered under the Investment Company Act of 1940 (1940 Act) as an open-end management investment company and applies the specialized accounting and reporting guidance in U.S. Generally Accepted Accounting Principles (U.S. GAAP). The Fund offers five classes of shares: Class A, Class C, Class R, Class R6 and Advisor Class. Effective August 2, 2021, Class C shares automatically convert to Class A shares after they have been held for 8 years. Prior to August 2, 2021, Class C shares converted to Class A shares after a 10-year holding period. Each class of shares may differ by its initial sales load, contingent deferred sales charges, voting rights on matters affecting a single class, its exchange privilege and fees due to differing arrangements for distribution and transfer agent fees.
The following summarizes the Fund's significant accounting policies.
a. Financial Instrument Valuation The Fund's investments in financial instruments are carried at fair value daily. Fair value is the price that would be received to sell an asset or paid to transfer a liability in an orderly transaction between market participants on the measurement date. The Fund calculates the net asset value (NAV) per share each business day as of 4 p.m. Eastern time or the regularly scheduled close of the New York Stock Exchange (NYSE), whichever is earlier. Under compliance policies and procedures approved by the Fund's Board of Directors (the Board), the Fund's administrator has responsibility for oversight of valuation, including leading the cross-functional Valuation Committee (VC). The Fund may utilize independent pricing services, quotations from securities and financial instrument dealers, and other market sources to determine fair value.
Equity securities listed on an exchange or on the NASDAQ National Market System are valued at the last quoted sale price or the official closing price of the day, respectively. Foreign equity securities are valued as of the close of trading on the foreign stock exchange on which the security is primarily traded, or as of 4 p.m. Eastern time. The value is then converted into its U.S. dollar equivalent at the foreign exchange rate in effect at 4 p.m. Eastern time on the day that the value of the security is determined. Over-the-counter (OTC) securities are valued within the range of the most recent quoted bid and ask prices. Securities that trade
in multiple markets or on multiple exchanges are valued according to the broadest and most representative market. Certain equity securities are valued based upon fundamental characteristics or relationships to similar securities.
Investments in open-end mutual funds are valued at the closing NAV. Investments in time deposits are valued at cost, which approximates fair value.
The Fund has procedures to determine the fair value of financial instruments for which market prices are not reliable or readily available. Under these procedures, the Fund primarily employs a market-based approach which may use related or comparable assets or liabilities, recent transactions, market multiples, book values, and other relevant information for the investment to determine the fair value of the investment. An income-based valuation approach may also be used in which the anticipated future cash flows of the investment are discounted to calculate fair value. Discounts may also be applied due to the nature or duration of any restrictions on the disposition of the investments. Due to the inherent uncertainty of valuations of such investments, the fair values may differ significantly from the values that would have been used had an active market existed.
Trading in securities on foreign securities stock exchanges and OTC markets may be completed before 4 p.m. Eastern time. In addition, trading in certain foreign markets may not take place on every Fund's business day. Events can occur between the time at which trading in a foreign security is completed and 4 p.m. Eastern time that might call into question the reliability of the value of a portfolio security held by the Fund. As a result, differences may arise between the value of the Fund's portfolio securities as determined at the foreign market close and the latest indications of value at 4 p.m. Eastern time. In order to minimize the potential for these differences, an independent pricing service may be used to adjust the value of the Fund's portfolio securities to the latest indications of fair value at 4 p.m. Eastern time. At August 31, 2021, certain securities may have been fair valued using these procedures, in which case the securities were categorized as Level 2 inputs within the fair value hierarchy (referred to as “market level fair value”). See the Fair Value Measurements note for more information.
When the last day of the reporting period is a non-business day, certain foreign markets may be open on those days that the Fund's NAV is not calculated, which could result in differences between the value of the Fund's portfolio

TEMPLETON GROWTH FUND, INC.NOTES TO FINANCIAL STATEMENTS
25franklintempleton.com Annual Report
securities on the last business day and the last calendar day of the reporting period. Any security valuation changes due to an open foreign market are adjusted and reflected by the Fund for financial reporting purposes.
b. Foreign Currency Translation Portfolio securities and other assets and liabilities denominated in foreign currencies are translated into U.S. dollars based on the exchange rate of such currencies against U.S. dollars on the date of valuation. The Fund may enter into foreign currency exchange contracts to facilitate transactions denominated in a foreign currency. Purchases and sales of securities, income and expense items denominated in foreign currencies are translated into U.S. dollars at the exchange rate in effect on the transaction date. Portfolio securities and assets and liabilities denominated in foreign currencies contain risks that those currencies will decline in value relative to the U.S. dollar. Occasionally, events may impact the availability or reliability of foreign exchange rates used to convert the U.S. dollar equivalent value. If such an event occurs, the foreign exchange rate will be valued at fair value using procedures established and approved by the Board.
The Fund does not separately report the effect of changes in foreign exchange rates from changes in market prices on securities held. Such changes are included in net realized and unrealized gain or loss from investments in the Statement of Operations.
Realized foreign exchange gains or losses arise from sales of foreign currencies, currency gains or losses realized between the trade and settlement dates on securities transactions and the difference between the recorded amounts of dividends, interest, and foreign withholding taxes and the U.S. dollar equivalent of the amounts actually received or paid. Net unrealized foreign exchange gains and losses arise from changes in foreign exchange rates on foreign denominated assets and liabilities other than investments in securities held at the end of the reporting period.
c. Securities LendingThe Fund participates in an agency based securities lending program to earn additional income. The Fund receives collateral in the form of cash and/or U.S. Government and Agency securities against the loaned securities in an amount equal to at least 102% of the fair value of the loaned securities. Collateral is maintained over the life of the loan in an amount not less than 100% of the fair value of loaned securities, as determined at the close of Fund business each day; any additional collateral required due to changes in security values is delivered to the Fund on the next business day. Any cash collateral received is deposited into a joint cash account with other funds and is used to invest in a money market fund managed by Franklin Advisers, Inc., an affiliate of the Fund. The Fund may receive income from the investment of cash collateral, in addition to lending fees and rebates paid by the borrower. Income from securities loaned, net of fees paid to the securities lending agent and/or third-party vendor, is reported separately in the Statement of Operations. The Fund bears the market risk with respect to any cash collateral investment, securities loaned, and the risk that the agent may default on its obligations to the Fund. If the borrower defaults on its obligation to return the securities loaned, the Fund has the right to repurchase the securities in the open market using the collateral received. The securities lending agent has agreed to indemnify the Fund in the event of default by a third party borrower. At August 31, 2021, the Fund had no securities on loan.
d. Income and Deferred Taxes It is the Fund's policy to qualify as a regulated investment company under the Internal Revenue Code. The Fund intends to distribute to shareholders substantially all of its taxable income and net realized gains to relieve it from federal income and excise taxes. As a result, no provision for U.S. federal income taxes is required.
The Fund may be subject to foreign taxation related to income received, capital gains on the sale of securities and certain foreign currency transactions in the foreign jurisdictions in which it invests. Foreign taxes, if any, are recorded based on the tax regulations and rates that exist in the foreign markets in which the Fund invests. When a capital gain tax is determined to apply, the Fund records an estimated deferred tax liability in an amount that would be payable if the securities were disposed of on the valuation date.
1.OrganizationandSignificantAccountingPolicies (continued)
a. Financial Instrument Valuation (continued)
TEMPLETON GROWTH FUND, INC.NOTES TO FINANCIAL STATEMENTS
26 franklintempleton.comAnnual Report
As a result of several court cases, in certain countries across the European Union, the Fund filed additional tax reclaims for previously withheld taxes on dividends earned in those countries (EU reclaims). Income recognized, if any, for EU reclaims is reflected as other income in the Statement of Operations and any related receivable, if any, is reflected as European Union tax reclaims in the Statement of Assets and Liabilities. When uncertainty exists as to the ultimate resolution of these proceedings, the likelihood of receipt of these EU reclaims, and the potential timing of payment, no amounts are reflected in the financial statements. For U.S. income tax purposes, EU reclaims received by the Fund, if any, reduce the amount of foreign taxes Fund shareholders can use as tax deductions or credits on their income tax returns. In the event that EU reclaims received by the Fund during a fiscal year exceed foreign withholding taxes paid by the Fund, and the Fund previously passed through to its shareholders foreign taxes incurred by the Fund to be used as a credit or deduction on a shareholder’s income tax return, the Fund will enter into a closing agreement with the Internal Revenue Service (IRS) in order to pay the associated tax liability on behalf of the Fund's shareholders. During the fiscal year ended August 31, 2021, the Fund received EU reclaims in excess of the foreign taxes paid during the year. The Fund determined to enter into a closing agreement with the IRS and recorded the estimated fees as a reduction to income, as reflected in the Statement of Operations.
The Fund may recognize an income tax liability related to its uncertain tax positions under U.S. GAAP when the uncertain tax position has a less than 50% probability that it will be sustained upon examination by the tax authorities based on its technical merits. As of August 31, 2021, the Fund has determined that no tax liability is required in its financial statements related to uncertain tax positions for any open tax years (or expected to be taken in future tax years). Open tax years are those that remain subject to examination and are based on the statute of limitations in each jurisdiction in which the Fund invests.
e. Security Transactions, Investment Income, Expenses and DistributionsSecurity transactions are accounted for on trade date. Realized gains and losses on security transactions are determined on a specific identification basis. Interest income and estimated expenses are accrued daily. Amortization of premium and accretion of discount on debt securities are included in interest income. Dividend income is recorded on the ex-dividend date except for certain dividends from securities where the dividend rate is not available. In such cases, the dividend is recorded as soon as the information is received by the Fund. Distributions to shareholders are recorded on the ex-dividend date. Distributable earnings are determined according to income tax regulations (tax basis) and may differ from earnings recorded in accordance with U.S. GAAP. These differences may be permanent or temporary. Permanent differences are reclassified among capital accounts to reflect their tax character. These reclassifications have no impact on net assets or the results of operations. Temporary differences are not reclassified, as they may reverse in subsequent periods.
Realized and unrealized gains and losses and net investment income, excluding class specific expenses, are allocated daily to each class of shares based upon the relative proportion of net assets of each class. Differences in per share distributions by class are generally due to differences in class specific expenses.
f. Accounting EstimatesThe preparation of financial statements in accordance with U.S. GAAP requires management to make estimates and assumptions that affect the reported amounts of assets and liabilities at the date of the financial statements and the amounts of income and expenses during the reporting period. Actual results could differ from those estimates.
g.GuaranteesandIndemnificationsUnder the Fund's organizational documents, its officers and directors are indemnified by the Fund against certain liabilities arising out of the performance of their duties to the Fund. Additionally, in the normal course of business, the Fund enters into contracts with service providers that contain general indemnification clauses. The Fund's maximum exposure under these arrangements is unknown as this would involve future claims that may be made against the Fund that have not yet occurred. Currently, the Fund expects the risk of loss to be remote.
1.OrganizationandSignificantAccountingPolicies (continued)
d. Income and Deferred Taxes (continued)
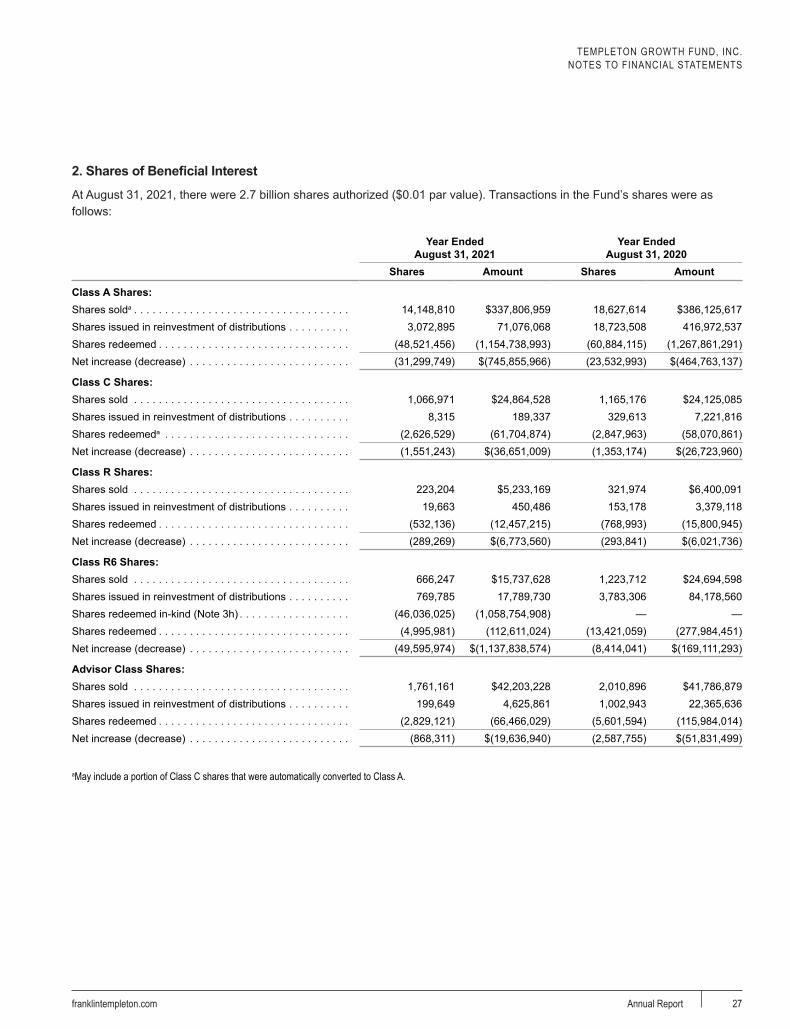
TEMPLETON GROWTH FUND, INC.NOTES TO FINANCIAL STATEMENTS
27franklintempleton.com Annual Report
2.SharesofBeneficialInterest
At August 31, 2021, there were 2.7 billion shares authorized ($0.01 par value). Transactions in the Fund’s shares were as follows:
Year Ended August 31, 2021
Year Ended August 31, 2020
Shares Amount Shares Amount
Class A Shares:Shares solda . . . . . . . . . . . . . . . . . . . . . . . . . . . . . . . . . . . 14,148,810 $337,806,959 18,627,614 $386,125,617Shares issued in reinvestment of distributions . . . . . . . . . . 3,072,895 71,076,068 18,723,508 416,972,537Shares redeemed . . . . . . . . . . . . . . . . . . . . . . . . . . . . . . . (48,521,456) (1,154,738,993) (60,884,115) (1,267,861,291)Net increase (decrease) . . . . . . . . . . . . . . . . . . . . . . . . . . (31,299,749) $(745,855,966) (23,532,993) $(464,763,137)
Class C Shares:Shares sold . . . . . . . . . . . . . . . . . . . . . . . . . . . . . . . . . . . 1,066,971 $24,864,528 1,165,176 $24,125,085Shares issued in reinvestment of distributions . . . . . . . . . . 8,315 189,337 329,613 7,221,816Shares redeemeda . . . . . . . . . . . . . . . . . . . . . . . . . . . . . . (2,626,529) (61,704,874) (2,847,963) (58,070,861)Net increase (decrease) . . . . . . . . . . . . . . . . . . . . . . . . . . (1,551,243) $(36,651,009) (1,353,174) $(26,723,960)
Class R Shares:Shares sold . . . . . . . . . . . . . . . . . . . . . . . . . . . . . . . . . . . 223,204 $5,233,169 321,974 $6,400,091Shares issued in reinvestment of distributions . . . . . . . . . . 19,663 450,486 153,178 3,379,118Shares redeemed . . . . . . . . . . . . . . . . . . . . . . . . . . . . . . . (532,136) (12,457,215) (768,993) (15,800,945)Net increase (decrease) . . . . . . . . . . . . . . . . . . . . . . . . . . (289,269) $(6,773,560) (293,841) $(6,021,736)
Class R6 Shares:Shares sold . . . . . . . . . . . . . . . . . . . . . . . . . . . . . . . . . . . 666,247 $15,737,628 1,223,712 $24,694,598Shares issued in reinvestment of distributions . . . . . . . . . . 769,785 17,789,730 3,783,306 84,178,560Shares redeemed in-kind (Note 3h) . . . . . . . . . . . . . . . . . . (46,036,025) (1,058,754,908) — —Shares redeemed . . . . . . . . . . . . . . . . . . . . . . . . . . . . . . . (4,995,981) (112,611,024) (13,421,059) (277,984,451)Net increase (decrease) . . . . . . . . . . . . . . . . . . . . . . . . . . (49,595,974) $(1,137,838,574) (8,414,041) $(169,111,293)
Advisor Class Shares:Shares sold . . . . . . . . . . . . . . . . . . . . . . . . . . . . . . . . . . . 1,761,161 $42,203,228 2,010,896 $41,786,879Shares issued in reinvestment of distributions . . . . . . . . . . 199,649 4,625,861 1,002,943 22,365,636Shares redeemed . . . . . . . . . . . . . . . . . . . . . . . . . . . . . . . (2,829,121) (66,466,029) (5,601,594) (115,984,014)Net increase (decrease) . . . . . . . . . . . . . . . . . . . . . . . . . . (868,311) $(19,636,940) (2,587,755) $(51,831,499)
aMay include a portion of Class C shares that were automatically converted to Class A.
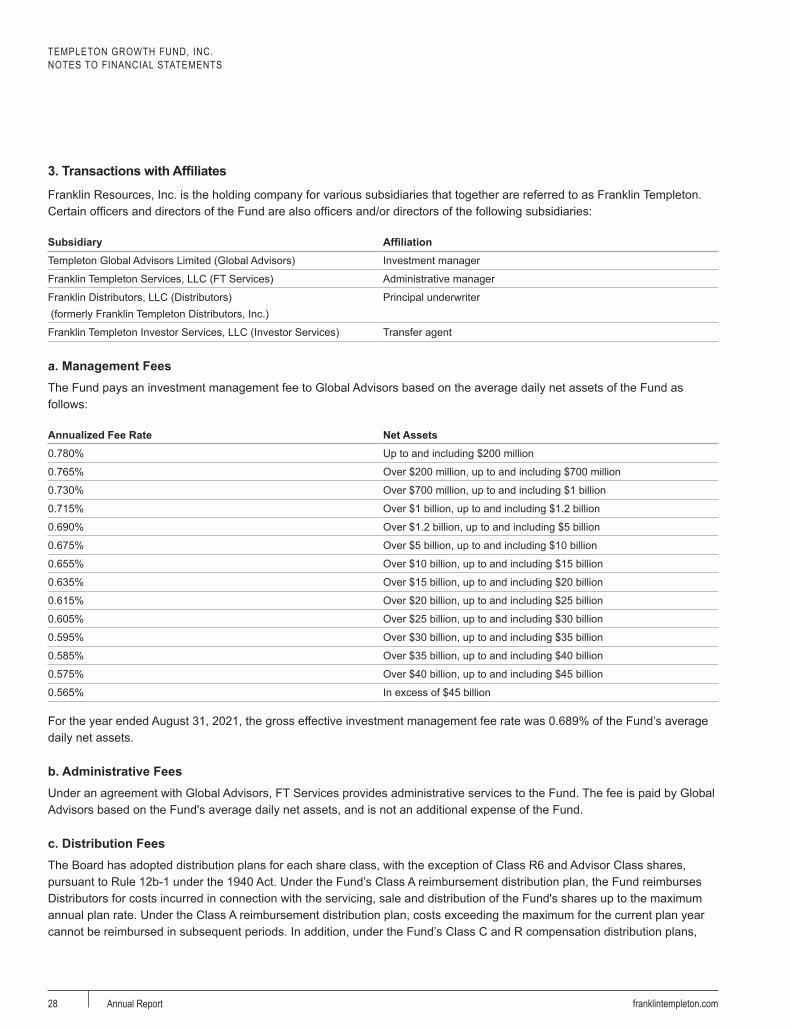
TEMPLETON GROWTH FUND, INC.NOTES TO FINANCIAL STATEMENTS
28 franklintempleton.comAnnual Report
3.TransactionswithAffiliates
Franklin Resources, Inc. is the holding company for various subsidiaries that together are referred to as Franklin Templeton. Certain officers and directors of the Fund are also officers and/or directors of the following subsidiaries:
Subsidiary AffiliationTempleton Global Advisors Limited (Global Advisors) Investment manager
Franklin Templeton Services, LLC (FT Services) Administrative manager
Franklin Distributors, LLC (Distributors) (formerly Franklin Templeton Distributors, Inc.)
Principal underwriter
Franklin Templeton Investor Services, LLC (Investor Services) Transfer agent
a. Management FeesThe Fund pays an investment management fee to Global Advisors based on the average daily net assets of the Fund as follows:
Annualized Fee Rate Net Assets0.780% Up to and including $200 million
0.765% Over $200 million, up to and including $700 million
0.730% Over $700 million, up to and including $1 billion
0.715% Over $1 billion, up to and including $1.2 billion
0.690% Over $1.2 billion, up to and including $5 billion
0.675% Over $5 billion, up to and including $10 billion
0.655% Over $10 billion, up to and including $15 billion
0.635% Over $15 billion, up to and including $20 billion
0.615% Over $20 billion, up to and including $25 billion
0.605% Over $25 billion, up to and including $30 billion
0.595% Over $30 billion, up to and including $35 billion
0.585% Over $35 billion, up to and including $40 billion
0.575% Over $40 billion, up to and including $45 billion
0.565% In excess of $45 billion
For the year ended August 31, 2021, the gross effective investment management fee rate was 0.689% of the Fund’s average daily net assets.
b. Administrative FeesUnder an agreement with Global Advisors, FT Services provides administrative services to the Fund. The fee is paid by Global Advisors based on the Fund's average daily net assets, and is not an additional expense of the Fund.
c. Distribution FeesThe Board has adopted distribution plans for each share class, with the exception of Class R6 and Advisor Class shares, pursuant to Rule 12b-1 under the 1940 Act. Under the Fund’s Class A reimbursement distribution plan, the Fund reimburses Distributors for costs incurred in connection with the servicing, sale and distribution of the Fund's shares up to the maximum annual plan rate. Under the Class A reimbursement distribution plan, costs exceeding the maximum for the current plan year cannot be reimbursed in subsequent periods. In addition, under the Fund’s Class C and R compensation distribution plans,
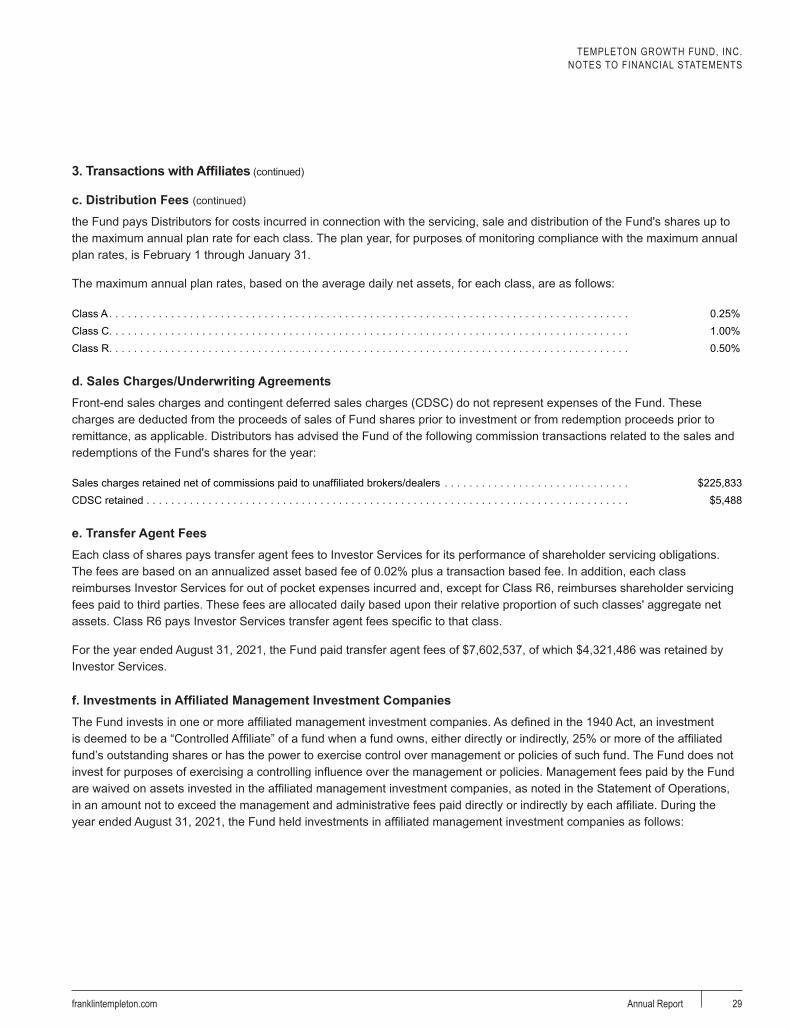
TEMPLETON GROWTH FUND, INC.NOTES TO FINANCIAL STATEMENTS
29franklintempleton.com Annual Report
the Fund pays Distributors for costs incurred in connection with the servicing, sale and distribution of the Fund's shares up to the maximum annual plan rate for each class. The plan year, for purposes of monitoring compliance with the maximum annual plan rates, is February 1 through January 31.
The maximum annual plan rates, based on the average daily net assets, for each class, are as follows:
Class A . . . . . . . . . . . . . . . . . . . . . . . . . . . . . . . . . . . . . . . . . . . . . . . . . . . . . . . . . . . . . . . . . . . . . . . . . . . . . . . . . . . . 0.25%Class C . . . . . . . . . . . . . . . . . . . . . . . . . . . . . . . . . . . . . . . . . . . . . . . . . . . . . . . . . . . . . . . . . . . . . . . . . . . . . . . . . . . . 1.00%Class R . . . . . . . . . . . . . . . . . . . . . . . . . . . . . . . . . . . . . . . . . . . . . . . . . . . . . . . . . . . . . . . . . . . . . . . . . . . . . . . . . . . . 0.50%
d. Sales Charges/Underwriting AgreementsFront-end sales charges and contingent deferred sales charges (CDSC) do not represent expenses of the Fund. These charges are deducted from the proceeds of sales of Fund shares prior to investment or from redemption proceeds prior to remittance, as applicable. Distributors has advised the Fund of the following commission transactions related to the sales and redemptions of the Fund's shares for the year:
Sales charges retained net of commissions paid to unaffiliated brokers/dealers . . . . . . . . . . . . . . . . . . . . . . . . . . . . . . $225,833CDSC retained . . . . . . . . . . . . . . . . . . . . . . . . . . . . . . . . . . . . . . . . . . . . . . . . . . . . . . . . . . . . . . . . . . . . . . . . . . . . . . $5,488
e. Transfer Agent FeesEach class of shares pays transfer agent fees to Investor Services for its performance of shareholder servicing obligations. The fees are based on an annualized asset based fee of 0.02% plus a transaction based fee. In addition, each class reimburses Investor Services for out of pocket expenses incurred and, except for Class R6, reimburses shareholder servicing fees paid to third parties. These fees are allocated daily based upon their relative proportion of such classes' aggregate net assets. Class R6 pays Investor Services transfer agent fees specific to that class.
For the year ended August 31, 2021, the Fund paid transfer agent fees of $7,602,537, of which $4,321,486 was retained by Investor Services.
f.InvestmentsinAffiliatedManagementInvestmentCompaniesThe Fund invests in one or more affiliated management investment companies. As defined in the 1940 Act, an investment is deemed to be a “Controlled Affiliate” of a fund when a fund owns, either directly or indirectly, 25% or more of the affiliated fund’s outstanding shares or has the power to exercise control over management or policies of such fund. The Fund does not invest for purposes of exercising a controlling influence over the management or policies. Management fees paid by the Fund are waived on assets invested in the affiliated management investment companies, as noted in the Statement of Operations, in an amount not to exceed the management and administrative fees paid directly or indirectly by each affiliate. During the year ended August 31, 2021, the Fund held investments in affiliated management investment companies as follows:
3.TransactionswithAffiliates (continued)
c. Distribution Fees (continued)

TEMPLETON GROWTH FUND, INC.NOTES TO FINANCIAL STATEMENTS
30 franklintempleton.comAnnual Report
aa
Value at Beginning
of Year Purchases SalesRealized Gain
(Loss)
Net Change in
Unrealized Appreciation
(Depreciation)
Value at End of Year
Number of Shares Held
at End of Year
Investment Income
a a a a a a a a
Templeton Growth Fund, Inc.Non-Controlled Affiliates
Income from securities
loaned
Institutional Fiduciary Trust - Money Market Portfolio, 0.01% . . $— $83,625,000 $(83,625,000) $— $— $—
— $—
Total Affiliated Securities . . . . $— $83,625,000 $(83,625,000) $— $— $— $—
g. Waiver and Expense ReimbursementsInvestor Services has contractually agreed in advance to waive or limit its fees so that the Class R6 transfer agent fees do not exceed 0.03% based on the average net assets of the class until December 31, 2021.
h.OtherAffiliatedtransactionsDuring the year ended August 31, 2021, the Franklin Global Allocation Fund (formerly Franklin Founding Funds Allocation Fund) (Allocation Fund), a series of the Franklin Fund Allocator Series, repositioned to a direct investment fund and subsequently fully redeemed out of the Fund. As a result, on January 29, 2021, the Fund delivered portfolio securities and cash that were transferred in-kind to the Allocation Fund, which included $161,407,329 of net realized gains. As such gains are not taxable to the Fund and are not distributed to remaining shareholders, they are reclassified from accumulated net realized gains to paid-in capital.
4. Income Taxes
For tax purposes, capital losses may be carried over to offset future capital gains.
At August 31, 2021, the capital loss carryforwards were as follows:
Capital loss carryforwards not subject to expiration:Long term . . . . . . . . . . . . . . . . . . . . . . . . . . . . . . . . . . . . . . . . . . . . . . . . . . . . . . . . . . . . . . . . . . . . . . . . . . . . . . . . 1,032,619,499
During the year ended August 31, 2021 the Fund utilized $557,114,885 of capital loss carryforwards.
The tax character of distributions paid during the years ended August 31, 2021 and 2020, was as follows:
2021 2020
Distributions paid from:Ordinary income . . . . . . . . . . . . . . . . . . . . . . . . . . . . . . . . . . . . . . . . . . . . . . . . . . . . . . . . . . $110,850,988 $255,043,908Long term capital gain . . . . . . . . . . . . . . . . . . . . . . . . . . . . . . . . . . . . . . . . . . . . . . . . . . . . . . — 351,620,138
$110,850,988 $606,664,046
3.TransactionswithAffiliates (continued)
f.InvestmentsinAffiliatedManagementInvestmentCompanies(continued)

TEMPLETON GROWTH FUND, INC.NOTES TO FINANCIAL STATEMENTS
31franklintempleton.com Annual Report
At August 31, 2021, the cost of investments, net unrealized appreciation (depreciation) and undistributed ordinary income for income tax purposes were as follows:
Cost of investments . . . . . . . . . . . . . . . . . . . . . . . . . . . . . . . . . . . . . . . . . . . . . . . . . . . . . . . . . . . . . . . . . . . . . . . . . . $7,432,951,897
Unrealized appreciation . . . . . . . . . . . . . . . . . . . . . . . . . . . . . . . . . . . . . . . . . . . . . . . . . . . . . . . . . . . . . . . . . . . . . . . . $2,408,426,947Unrealized depreciation . . . . . . . . . . . . . . . . . . . . . . . . . . . . . . . . . . . . . . . . . . . . . . . . . . . . . . . . . . . . . . . . . . . . . . . . (148,933,862)Net unrealized appreciation (depreciation) . . . . . . . . . . . . . . . . . . . . . . . . . . . . . . . . . . . . . . . . . . . . . . . . . . . . . . . . . . $2,259,493,085
Distributable earnings:Undistributed ordinary income . . . . . . . . . . . . . . . . . . . . . . . . . . . . . . . . . . . . . . . . . . . . . . . . . . . . . . . . . . . . . . . . . . . $161,554,356
Differences between income and/or capital gains as determined on a book basis and a tax basis are primarily due to foreign currency transactions, EU reclaims, corporate actions and gains realized on in-kind shareholder redemptions.
5. Investment Transactions
Purchases and sales of investments (excluding short term securities and in-kind transactions) for the year ended August 31, 2021, aggregated $4,137,474,960 and $4,517,707,010, respectively. Sales of investments excludes in-kind transactions of $901,254,942.
6. Concentration of Risk
Investing in foreign securities may include certain risks and considerations not typically associated with investing in U.S. securities, such as fluctuating currency values and changing local, regional and global economic, political and social conditions, which may result in greater market volatility. Political and financial uncertainty in many foreign regions may increase market volatility and the economic risk of investing in foreign securities. In addition, certain foreign securities may not be as liquid as U.S. securities.
7. Novel Coronavirus Pandemic
The global outbreak of the novel coronavirus disease, known as COVID-19, has caused adverse effects on many companies, sectors, nations, regions and the markets in general, and may continue for an unpredictable duration. The effects of this pandemic may materially impact the value and performance of the Fund, its ability to buy and sell fund investments at appropriate valuations and its ability to achieve its investment objectives.
8. Credit Facility
The Fund, together with other U.S. registered and foreign investment funds (collectively, Borrowers), managed by Franklin Templeton, are borrowers in a joint syndicated senior unsecured credit facility totaling $2.675 billion (Global Credit Facility) which matures on February 4, 2022. This Global Credit Facility provides a source of funds to the Borrowers for temporary and emergency purposes, including the ability to meet future unanticipated or unusually large redemption requests.
Under the terms of the Global Credit Facility, the Fund shall, in addition to interest charged on any borrowings made by the Fund and other costs incurred by the Fund, pay its share of fees and expenses incurred in connection with the implementation and maintenance of the Global Credit Facility, based upon its relative share of the aggregate net assets of all of the Borrowers, including an annual commitment fee of 0.15% based upon the unused portion of the Global Credit Facility. These fees are reflected in other expenses in the Statement of Operations. During the year ended August 31, 2021, the Fund did not use the Global Credit Facility.
4. Income Taxes (continued)

TEMPLETON GROWTH FUND, INC.NOTES TO FINANCIAL STATEMENTS
32 franklintempleton.comAnnual Report
9. Fair Value Measurements
The Fund follows a fair value hierarchy that distinguishes between market data obtained from independent sources (observable inputs) and the Fund's own market assumptions (unobservable inputs). These inputs are used in determining the value of the Fund's financial instruments and are summarized in the following fair value hierarchy:
• Level 1 – quoted prices in active markets for identical financial instruments
• Level 2 – other significant observable inputs (including quoted prices for similar financial instruments, interest rates, prepayment speed, credit risk, etc.)
• Level 3 – significant unobservable inputs (including the Fund's own assumptions in determining the fair value of financial instruments)
The input levels are not necessarily an indication of the risk or liquidity associated with financial instruments at that level.
A summary of inputs used as of August 31, 2021, in valuing the Fund's assets carried at fair value, is as follows:
Level 1 Level 2 Level 3 Total
Templeton Growth Fund, Inc.Assets:
Investments in Securities:Common Stocks:
Belgium . . . . . . . . . . . . . . . . . . . . . . . . . . . . . $— $341,320,890 $— $341,320,890Brazil . . . . . . . . . . . . . . . . . . . . . . . . . . . . . . . 104,279,969 — — 104,279,969China . . . . . . . . . . . . . . . . . . . . . . . . . . . . . . . 241,135,991 132,815,952 — 373,951,943France . . . . . . . . . . . . . . . . . . . . . . . . . . . . . . — 197,658,509 — 197,658,509Germany . . . . . . . . . . . . . . . . . . . . . . . . . . . . — 821,779,537 — 821,779,537Hong Kong . . . . . . . . . . . . . . . . . . . . . . . . . . . — 181,710,800 — 181,710,800Japan . . . . . . . . . . . . . . . . . . . . . . . . . . . . . . . — 1,187,507,828 — 1,187,507,828Luxembourg . . . . . . . . . . . . . . . . . . . . . . . . . . — 98,819,918 — 98,819,918Macau . . . . . . . . . . . . . . . . . . . . . . . . . . . . . . — 53,104,485 — 53,104,485Norway . . . . . . . . . . . . . . . . . . . . . . . . . . . . . . — 118,033,248 — 118,033,248South Korea . . . . . . . . . . . . . . . . . . . . . . . . . . — 262,515,948 — 262,515,948Switzerland . . . . . . . . . . . . . . . . . . . . . . . . . . . — 210,846,312 — 210,846,312United Kingdom . . . . . . . . . . . . . . . . . . . . . . . 134,766,348 950,890,652 — 1,085,657,000United States . . . . . . . . . . . . . . . . . . . . . . . . . 4,424,558,595 — — 4,424,558,595
Escrows and Litigation Trusts . . . . . . . . . . . . . . . — — —a —Short Term Investments . . . . . . . . . . . . . . . . . . . — 230,700,000 — 230,700,000
Total Investments in Securities . . . . . . . . . . . $4,904,740,903 $4,787,704,079b $— $9,692,444,982
a Includes securities determined to have no value at August 31, 2021.b Includes foreign securities valued at $4,557,004,079, which were categorized as Level 2 as a result of the application of market level fair value procedures. See the Financial Instrument Valuation note for more information.
10. New Accounting Pronouncements
In March 2020, the Financial Accounting Standards Board (FASB) issued Accounting Standards Update (ASU) No. 2020-04, Reference Rate Reform (Topic 848) – Facilitation of the Effects of Reference Rate Reform on Financial Reporting. In January 2021, the FASB issued ASU No. 2021-01, with further amendments to Topic 848. The amendments in the ASUs provide optional temporary accounting recognition and financial reporting relief from the effect of certain types of contract modifications due to the planned discontinuation of the London Interbank Offered Rate (LIBOR) and other interbank-offered based reference rates as of the end of 2021 and 2023. The ASUs are effective for certain reference rate-related contract modifications that occur during the period March 12, 2020 through December 31, 2022. Management has reviewed the requirements and believes the adoption of these ASUs will not have a material impact on the financial statements.

TEMPLETON GROWTH FUND, INC.NOTES TO FINANCIAL STATEMENTS
33franklintempleton.com Annual Report
11. Subsequent Events
The Fund has evaluated subsequent events through the issuance of the financial statements and determined that no events have occurred that require disclosure.

TEMPLETON GROWTH FUND, INC.
Report of Independent Registered Public Accounting Firm
34 franklintempleton.comAnnual Report
To the Board of Directors and Shareholders of Templeton Growth Fund, Inc.
Opinion on the Financial Statements
We have audited the accompanying statement of assets and liabilities, including the statement of investments, of Templeton Growth Fund, Inc. (the "Fund") as of August 31, 2021, the related statement of operations for the year ended August 31, 2021, the statements of changes in net assets for each of the two years in the period ended August 31, 2021, including the related notes, and the financial highlights for each of the five years in the period ended August 31, 2021 (collectively referred to as the “financial statements”). In our opinion, the financial statements present fairly, in all material respects, the financial position of the Fund as of August 31, 2021, the results of its operations for the year then ended, the changes in its net assets for each of the two years in the period ended August 31, 2021 and the financial highlights for each of the five years in the period ended August 31, 2021 in conformity with accounting principles generally accepted in the United States of America.
Basis for Opinion
These financial statements are the responsibility of the Fund’s management. Our responsibility is to express an opinion on the Fund’s financial statements based on our audits. We are a public accounting firm registered with the Public Company Accounting Oversight Board (United States) (PCAOB) and are required to be independent with respect to the Fund in accordance with the U.S. federal securities laws and the applicable rules and regulations of the Securities and Exchange Commission and the PCAOB.
We conducted our audits of these financial statements in accordance with the standards of the PCAOB. Those standards require that we plan and perform the audit to obtain reasonable assurance about whether the financial statements are free of material misstatement, whether due to error or fraud.
Our audits included performing procedures to assess the risks of material misstatement of the financial statements, whether due to error or fraud, and performing procedures that respond to those risks. Such procedures included examining, on a test basis, evidence regarding the amounts and disclosures in the financial statements. Our audits also included evaluating the accounting principles used and significant estimates made by management, as well as evaluating the overall presentation of the financial statements. Our procedures included confirmation of securities owned as of August 31, 2021 by correspondence with the custodian and brokers; when replies were not received from brokers, we performed other auditing procedures. We believe that our audits provide a reasonable basis for our opinion.
PricewaterhouseCoopers LLP
San Francisco, CaliforniaOctober 19, 2021
We have served as the auditor of one or more investment companies in the Franklin Templeton Group of Funds since 1948.
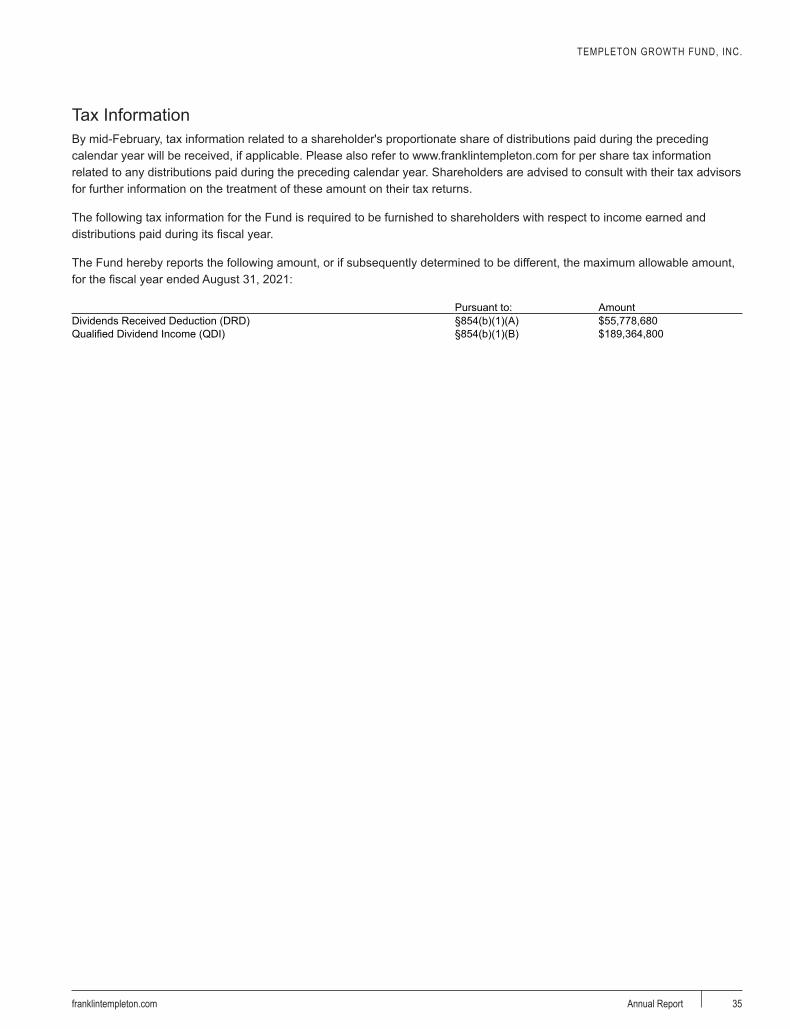
TEMPLETON GROWTH FUND, INC.
Tax Information
35franklintempleton.com Annual Report
By mid-February, tax information related to a shareholder's proportionate share of distributions paid during the preceding calendar year will be received, if applicable. Please also refer to www.franklintempleton.com for per share tax information related to any distributions paid during the preceding calendar year. Shareholders are advised to consult with their tax advisors for further information on the treatment of these amount on their tax returns.
The following tax information for the Fund is required to be furnished to shareholders with respect to income earned and distributions paid during its fiscal year.
The Fund hereby reports the following amount, or if subsequently determined to be different, the maximum allowable amount, for the fiscal year ended August 31, 2021:
Pursuant to: AmountDividends Received Deduction (DRD) §854(b)(1)(A) $55,778,680Qualified Dividend Income (QDI) §854(b)(1)(B) $189,364,800

TEMPLETON GROWTH FUND, INC.
Board Members and Officers
36 franklintempleton.comAnnual Report
The name, year of birth and address of the officers and board members, as well as their affiliations, positions held with the Fund, principal occupations during at least the past five years and number of U.S. registered portfolios overseen in the Franklin Templeton fund complex, are shown below. Generally, each board member serves until that person’s successor is elected and qualified.
Independent Board Members
Name, Year of Birth and Address Position
Length of Time Served
Number of Portfolios in Fund Complex Overseen by Board Member*
Other Directorships Held During at Least the Past 5 Years
Harris J. Ashton (1932) Director Since 1992 122 Bar-S Foods (meat packing company) (1981-2010).300 S.E. 2nd Street
Fort Lauderdale, FL 33301-1923
Principal Occupation During at Least the Past 5 Years:Director of various companies; and formerly, Director, RBC Holdings, Inc. (bank holding company) (until 2002); and President, Chief Executive Officer and Chairman of the Board, General Host Corporation (nursery and craft centers) (until 1998).
Ann Torre Bates (1958) Director Since 2008 29 Ares Capital Corporation (specialty finance company) (2010-present), United Natural Foods, Inc. (distributor of natural, organic and specialty foods) (2013-present), formerly, Allied Capital Corporation (financial services) (2003-2010), SLM Corporation (Sallie Mae) (1997-2014) and Navient Corporation (loan management, servicing and asset recovery) (2014-2016).
300 S.E. 2nd Street Fort Lauderdale, FL 33301-1923
Principal Occupation During at Least the Past 5 Years:Director of various companies; and formerly, Executive Vice President and Chief Financial Officer, NHP Incorporated (manager of multifamily housing) (1995-1997); and Vice President and Treasurer, US Airways, Inc. (until 1995).
Mary C. Choksi (1950) Director Since 2016 123 Omnicom Group Inc. (advertising and marketing communications services) (2011-present) and White Mountains Insurance Group, Ltd. (holding company) (2017-present); and formerly, Avis Budget Group Inc. (car rental) (2007-2020).
300 S.E. 2nd Street Fort Lauderdale, FL 33301-1923
Principal Occupation During at Least the Past 5 Years:Director of various companies; and formerly, Founder and Senior Advisor, Strategic Investment Group (investment management group) (2015-2017); Founding Partner and Senior Managing Director, Strategic Investment Group (1987-2015); Founding Partner and Managing Director, Emerging Markets Management LLC (investment management firm) (1987-2011); and Loan Officer/Senior Loan Officer/Senior Pension Investment Officer, World Bank Group (international financial institution) (1977-1987).
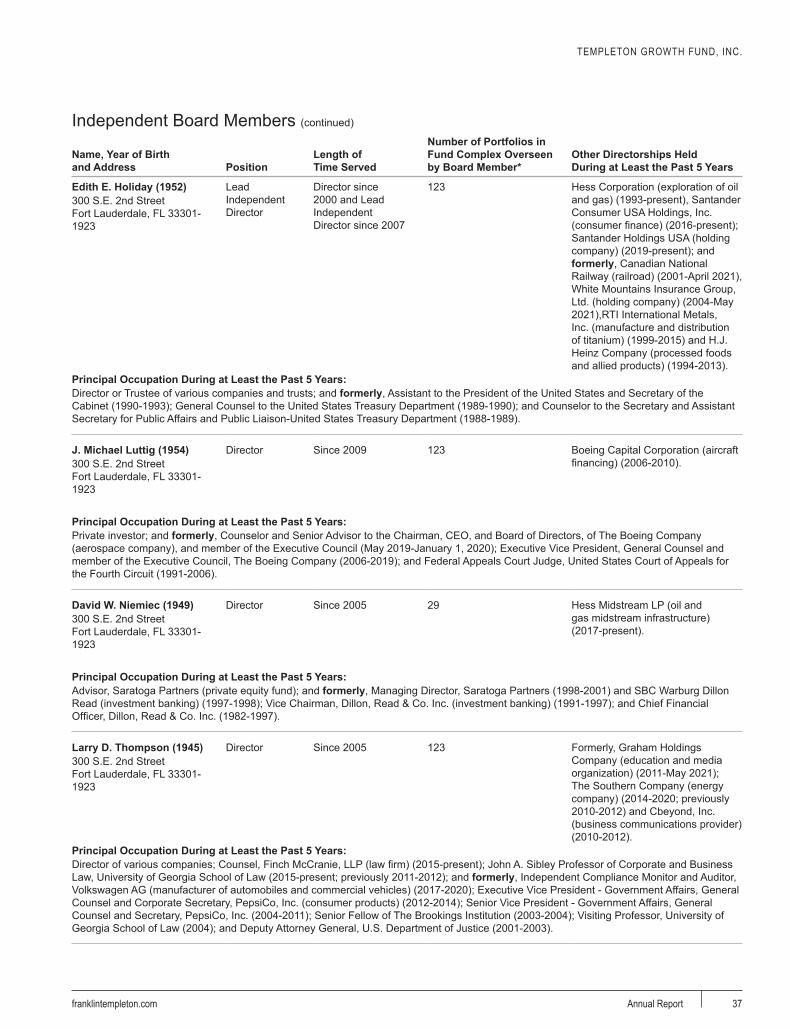
TEMPLETON GROWTH FUND, INC.
37franklintempleton.com Annual Report
Name, Year of Birth and Address Position
Length of Time Served
Number of Portfolios in Fund Complex Overseen by Board Member*
Other Directorships Held During at Least the Past 5 Years
Edith E. Holiday (1952) LeadIndependent Director
Director since 2000 and Lead Independent Director since 2007
123 Hess Corporation (exploration of oil and gas) (1993-present), Santander Consumer USA Holdings, Inc. (consumer finance) (2016-present); Santander Holdings USA (holding company) (2019-present); and formerly, Canadian National Railway (railroad) (2001-April 2021), White Mountains Insurance Group, Ltd. (holding company) (2004-May 2021),RTI International Metals, Inc. (manufacture and distribution of titanium) (1999-2015) and H.J. Heinz Company (processed foods and allied products) (1994-2013).
300 S.E. 2nd Street Fort Lauderdale, FL 33301-1923
Principal Occupation During at Least the Past 5 Years:Director or Trustee of various companies and trusts; and formerly, Assistant to the President of the United States and Secretary of the Cabinet (1990-1993); General Counsel to the United States Treasury Department (1989-1990); and Counselor to the Secretary and Assistant Secretary for Public Affairs and Public Liaison-United States Treasury Department (1988-1989).
J. Michael Luttig (1954) Director Since 2009 123 Boeing Capital Corporation (aircraft financing) (2006-2010).300 S.E. 2nd Street
Fort Lauderdale, FL 33301-1923
Principal Occupation During at Least the Past 5 Years:Private investor; and formerly, Counselor and Senior Advisor to the Chairman, CEO, and Board of Directors, of The Boeing Company (aerospace company), and member of the Executive Council (May 2019-January 1, 2020); Executive Vice President, General Counsel and member of the Executive Council, The Boeing Company (2006-2019); and Federal Appeals Court Judge, United States Court of Appeals for the Fourth Circuit (1991-2006).
David W. Niemiec (1949) Director Since 2005 29 Hess Midstream LP (oil and gas midstream infrastructure) (2017-present).
300 S.E. 2nd Street Fort Lauderdale, FL 33301-1923
Principal Occupation During at Least the Past 5 Years:Advisor, Saratoga Partners (private equity fund); and formerly, Managing Director, Saratoga Partners (1998-2001) and SBC Warburg Dillon Read (investment banking) (1997-1998); Vice Chairman, Dillon, Read & Co. Inc. (investment banking) (1991-1997); and Chief Financial Officer, Dillon, Read & Co. Inc. (1982-1997).
Larry D. Thompson (1945) Director Since 2005 123 Formerly, Graham Holdings Company (education and media organization) (2011-May 2021); The Southern Company (energy company) (2014-2020; previously 2010-2012) and Cbeyond, Inc. (business communications provider) (2010-2012).
300 S.E. 2nd Street Fort Lauderdale, FL 33301-1923
Principal Occupation During at Least the Past 5 Years:Director of various companies; Counsel, Finch McCranie, LLP (law firm) (2015-present); John A. Sibley Professor of Corporate and Business Law, University of Georgia School of Law (2015-present; previously 2011-2012); and formerly, Independent Compliance Monitor and Auditor, Volkswagen AG (manufacturer of automobiles and commercial vehicles) (2017-2020); Executive Vice President - Government Affairs, General Counsel and Corporate Secretary, PepsiCo, Inc. (consumer products) (2012-2014); Senior Vice President - Government Affairs, General Counsel and Secretary, PepsiCo, Inc. (2004-2011); Senior Fellow of The Brookings Institution (2003-2004); Visiting Professor, University of Georgia School of Law (2004); and Deputy Attorney General, U.S. Department of Justice (2001-2003).
Independent Board Members (continued)
TEMPLETON GROWTH FUND, INC.
38 franklintempleton.comAnnual Report
Name, Year of Birth and Address Position
Length of Time Served
Number of Portfolios in Fund Complex Overseen by Board Member*
Other Directorships Held During at Least the Past 5 Years
Constantine D. Tseretopoulos (1954)
Director Since 2000 19 None
300 S.E. 2nd Street Fort Lauderdale, FL 33301-1923
Principal Occupation During at Least the Past 5 Years:Physician, Chief of Staff, owner and operator of the Lyford Cay Hospital (1987-present); director of various nonprofit organizations; and formerly, Cardiology Fellow, University of Maryland (1985-1987); and Internal Medicine Resident, Greater Baltimore Medical Center (1982-1985).
Robert E. Wade (1946) Director Since 2006 29 El Oro Ltd (investments) (2003-2019).300 S.E. 2nd Street
Fort Lauderdale, FL 33301-1923
Principal Occupation During at Least the Past 5 Years:Attorney at law engaged in private practice as a sole practitioner (1972-2008) and member of various boards.
Interested Board Members and Officers
Name, Year of Birth and Address Position
Length of Time Served
Number of Portfolios in Fund Complex Overseen by Board Member*
Other Directorships Held During at Least the Past 5 Years
**Gregory E. Johnson (1961)
Director Since 2007 134 None
One Franklin ParkwaySan Mateo, CA 94403-1906
Principal Occupation During at Least the Past 5 Years:Executive Chairman, Chairman of the Board and Director, Franklin Resources, Inc.; officer and/or director or trustee, as the case may be, of some of the other subsidiaries of Franklin Resources, Inc. and of 39 of the investment companies in Franklin Templeton; Vice Chairman, Investment Company Institute; and formerly, Chief Executive Officer (2013-2020) and President (1994-2015), Franklin Resources, Inc.
**Rupert H. Johnson, Jr. (1940)
Chairman of the Board, Director and Vice President
Chairman of the Board and Director since 2013 and Vice President since 1996
123 None
One Franklin ParkwaySan Mateo, CA 94403-1906
Principal Occupation During at Least the Past 5 Years:Director (Vice Chairman), Franklin Resources, Inc.; Director, Franklin Advisers, Inc.; and officer and/or director or trustee, as the case may be, of some of the other subsidiaries of Franklin Resources, Inc. and of 37 of the investment companies in Franklin Templeton.
Alan T. Bartlett (1970) President and Chief Executive Officer – Investment Management
Since 2019 Not Applicable Not ApplicableLyford Cay Nassau, Bahamas
Principal Occupation During at Least the Past 5 Years:President and Director, Templeton Global Advisors Limited; Chief Investment Officer of Templeton Global Equity Group; officer of five of the investment companies in Franklin Templeton; Chairman of the Board, Goodhart Partners; and formerly, Chief Executive Officer, Goodhart Partners (2009-2019).
Independent Board Members (continued)
TEMPLETON GROWTH FUND, INC.
39franklintempleton.com Annual Report
Name, Year of Birth and Address Position
Length of Time Served
Number of Portfolios in Fund Complex Overseen by Board Member*
Other Directorships Held During at Least the Past 5 Years
Alison E. Baur (1964) Vice President Since 2012 Not Applicable Not ApplicableOne Franklin ParkwaySan Mateo, CA 94403-1906
Principal Occupation During at Least the Past 5 Years:Deputy General Counsel, Franklin Templeton; and officer of some of the other subsidiaries of Franklin Resources, Inc. and of 44 of the investment companies in Franklin Templeton.
Breda M. Beckerle (1958) Chief Compliance Officer
Since 2020 Not Applicable Not Applicable280 Park Avenue New York, NY 10017
Principal Occupation During at Least the Past 5 Years:Chief Compliance Officer, Fiduciary Investment Management International, Inc., Franklin Advisers, Inc., Franklin Mutual Advisers, LLC, Franklin Templeton Institutional, LLC; and officer of 39 of the investment companies in Franklin Templeton.
Steven J. Gray (1955) Vice President Since 2009 Not Applicable Not ApplicableOne Franklin ParkwaySan Mateo, CA 94403-1906
Principal Occupation During at Least the Past 5 Years:Senior Associate General Counsel, Franklin Templeton; Vice President, FASA, LLC; Assistant Secretary, Franklin Distributors, LLC; and officer of 44 of the investment companies in Franklin Templeton.
Matthew T. Hinkle (1971) Chief Executive Officer – Finance and Administration
Since 2017 Not Applicable Not ApplicableOne Franklin ParkwaySan Mateo, CA 94403-1906
Principal Occupation During at Least the Past 5 Years:Senior Vice President, Franklin Templeton Services, LLC; officer of 44 of the investment companies in Franklin Templeton; and formerly, Vice President, Global Tax (2012-April 2017) and Treasurer/Assistant Treasurer, Franklin Templeton (2009-2017).
Susan Kerr (1949) Vice President – AML Compliance
Since July 2021 Not Applicable Not Applicable620 Eighth Avenue New York, NY 10018
Principal Occupation During at Least the Past 5 Years:Senior Compliance Analyst, Global Compliance, Franklin Templeton; Chief Anti-Money Laundering Compliance Officer, Legg Mason & Co. or its affiliates; Anti Money Laundering Compliance Officer; Senior Compliance Officer, LMIS; and officer of 41 of the investment companies in Franklin Templeton.
NavidJ.Tofigh(1972) Vice President Since 2015 Not Applicable Not ApplicableOne Franklin ParkwaySan Mateo, CA 94403-1906
Principal Occupation During at Least the Past 5 Years:Associate General Counsel and officer of 44 of the investment companies in Franklin Templeton.
Craig S. Tyle (1960) Vice President Since 2005 Not Applicable Not ApplicableOne Franklin ParkwaySan Mateo, CA 94403-1906
Principal Occupation During at Least the Past 5 Years:General Counsel and Executive Vice President, Franklin Resources, Inc.; and officer of some of the other subsidiaries of Franklin Resources, Inc. and of 44 of the investment companies in Franklin Templeton.
Interested Board Members and Officers (continued)

TEMPLETON GROWTH FUND, INC.
40 franklintempleton.comAnnual Report
Name, Year of Birth and Address Position
Length of Time Served
Number of Portfolios in Fund Complex Overseen by Board Member*
Other Directorships Held During at Least the Past 5 Years
Lori A. Weber (1964) Vice President and Secretary
Vice President since 2011 and Secretary since 2013
Not Applicable Not Applicable300 S.E. 2nd StreetFort Lauderdale, FL 33301-1923
Principal Occupation During at Least the Past 5 Years:Senior Associate General Counsel, Franklin Templeton; Assistant Secretary, Franklin Resources, Inc.; Vice President and Secretary, Templeton Investment Counsel, LLC; and officer of 44 of the investment companies in Franklin Templeton.
Ryan R. Wheeler (1985) Interim ChiefFinancial Officer,Chief AccountingOfficer andTreasurer
Since October 2021 Not Applicable Not Applicable300 S.E. 2nd StreetFort Lauderdale, FL 33301-1923
Principal Occupation During at Least the Past 5 Years:Director, Fund Administration & Reporting; officer of 15 of the investment companies in Franklin Templeton; and formerly, Director, SeniorManager and Manager PricewaterhouseCoopers, LLC (2014-January 2021).
*We base the number of portfolios on each separate series of the U.S. registered investment companies within the Franklin Templeton fund complex. These portfolios have a common investment manager or affiliated investment managers.**Gregory E. Johnson is considered to be an interested person of the Fund under the federal securities laws due to his position as an officer and director of Franklin Resources, Inc. (Resources), which is the parent company of the Fund’s investment manager and distributor. Rupert H. Johnson, Jr. is considered to be an interested person of the Fund under the federal securities laws due to his position as an officer and director and major shareholder of Resources.Note 1: Rupert H. Johnson, Jr. is the uncle of Gregory E. Johnson.Note 2: Officer information is current as of the date of this report. It is possible that after this date, information about officers may change.
The Sarbanes-Oxley Act of 2002 and Rules adopted by the U.S. Securities and Exchange Commission require the Fund to disclose whether the Fund’s Audit Committee includes at least one member who is an audit committee financial expert within the meaning of such Act and Rules. The Fund’s Board has determined that there is at least one such financial expert on the Audit Committee and has designated each of Ann Torre Bates and David W. Niemiec as an audit committee financial expert. The Board believes that Ms. Bates and Mr. Niemiec qualify as such an expert in view of their extensive business background and experience. Ms. Bates has served as a member of the Fund Audit Committee since 2008. She currently serves as a director of Ares Capital Corporation (2010-present) and United Natural Foods, Inc. (2013-present) and was formerly a director of Navient Corporation from 2014 to 2016, SLM Corporation from 1997 to 2014 and Allied Capital Corporation from 2003 to 2010, Executive Vice President and Chief Financial Officer of NHP Incorporated from 1995 to 1997 and Vice President and Treasurer of US Airways, Inc. until 1995. Mr. Niemiec has served as a member of the Fund Audit Committee since 2005, currently serves as an Advisor to Saratoga Partners and was formerly its Managing Director from 1998 to 2001 and serves as a director of Hess Midstream LP (2017-present). Mr. Niemiec was formerly a director of Emeritus Corporation from 1999 to 2010 and OSI Pharmaceuticals, Inc. from 2006 to 2010, Managing Director of SBC Warburg Dillon Read from 1997 to 1998, and was Vice Chairman from 1991 to 1997 and Chief Financial Officer from 1982 to 1997 of Dillon, Read & Co. Inc. As a result of such background and experience, the Board believes that Ms. Bates and Mr. Niemiec have each acquired an understanding of generally accepted accounting principles and financial statements, the general application of such principles in connection with the accounting estimates, accruals and reserves, and analyzing and evaluating financial statements that present a breadth and level of complexity of accounting issues generally comparable to those of the Fund, as well as an understanding of internal controls and procedures for financial reporting and an understanding of audit committee functions. Ms. Bates and Mr. Niemiec are independent Board members as that term is defined under the applicable U.S. Securities and Exchange Commission Rules and Releases.The Statement of Additional Information (SAI) includes additional information about the board members and is available, without charge, upon request. Shareholders may call (800) DIAL BEN/342-5236 to request the SAI.
Interested Board Members and Officers (continued)
TEMPLETON GROWTH FUND, INC.
Shareholder Information
41franklintempleton.com Annual Report
Liquidity Risk Management Program-Funds no HLIMEach Fund has adopted and implemented a written Liquidity Risk Management Program (the “LRMP”) as required by Rule 22e-4 under the Investment Company Act of 1940 (the “Liquidity Rule”). The LRMP is designed to assess and manage each Fund’s liquidity risk, which is defined as the risk that the Fund could not meet requests to redeem shares issued by the Fund without significant dilution of remaining investors’ interests in the Fund. In accordance with the Liquidity Rule, the LRMP includes policies and procedures that provide for: (1) assessment, management, and review (no less frequently than annually) of each Fund’s liquidity risk; (2) classification of each Fund’s portfolio holdings into one of four liquidity categories (Highly Liquid, Moderately Liquid, Less Liquid, and Illiquid); (3) for Funds that do not primarily hold assets that are Highly Liquid, establishing and maintaining a minimum percentage of the Fund’s net assets in Highly Liquid investments (called a “Highly Liquid Investment Minimum” or “HLIM”); and (4) prohibiting the Fund’s acquisition of Illiquid investments that would result in the Fund holding more than 15% of its net assets in Illiquid assets. The LRMP also requires reporting to the Securities and Exchange Commission (“SEC”) (on a non-public basis) and to the Board if the Fund’s holdings of Illiquid assets exceed 15% of the Fund’s net assets. Funds with HLIMs must have procedures for addressing HLIM shortfalls, including reporting to the Board and, with respect to HLIM shortfalls lasting more than seven consecutive calendar days, reporting to the SEC (on a non-public basis).
The Director of Liquidity Risk within the Investment Risk Management Group (the “IRMG”) is the appointed Administrator of the LRMP. The IRMG maintains the Investment Liquidity Committee (the “ILC”) to provide oversight and administration of policies and procedures governing liquidity risk management for FT products and portfolios. The ILC includes representatives from Franklin Templeton’s Risk, Trading, Global Compliance, Investment Compliance, Investment Operations, Valuation Committee, Product Management and Global Product Strategy.
In assessing and managing each Fund’s liquidity risk, the ILC considers, as relevant, a variety of factors, including the Fund’s investment strategy and the liquidity of its portfolio investments during both normal and reasonably foreseeable stressed conditions; its short and long-term cash flow projections; and its cash holdings and access to other funding sources including the Funds’ interfund lending
facility and line of credit. Classification of the Fund’s portfolio holdings in the four liquidity categories is based on the number of days it is reasonably expected to take to convert the investment to cash (for Highly Liquid and Moderately Liquid holdings) or sell or dispose of the investment (for Less Liquid and Illiquid investments), in current market conditions without significantly changing the investment’s market value.
Each Fund primarily holds liquid assets that are defined under the Liquidity Rule as "Highly Liquid Investments," and therefore is not required to establish an HLIM. Highly Liquid Investments are defined as cash and any investment reasonably expected to be convertible to cash in current market conditions in three business days or less without the conversion to cash significantly changing the market value of the investment.
At meetings of the Funds’ Board of Trustees held in May 2021, the Program Administrator provided a written report to the Board addressing the adequacy and effectiveness of the program for the year ended December 31, 2020. The Program Administrator report concluded that (i.) the LRMP, as adopted and implemented, remains reasonably designed to assess and manage each Fund’s liquidity risk; (ii.) the LRMP, including the Highly Liquid Investment Minimum (“HLIM”) where applicable, was implemented and operated effectively to achieve the goal of assessing and managing each Fund’s liquidity risk; and (iii.) each Fund was able to meet requests for redemption without significant dilution of remaining investors’ interests in the Fund.
Proxy Voting Policies and ProceduresThe Fund’s investment manager has established Proxy Voting Policies and Procedures (Policies) that the Fund uses to determine how to vote proxies relating to portfolio securities. Shareholders may view the Fund’s complete Policies online at franklintempleton.com. Alternatively, shareholders may request copies of the Policies free of charge by calling the Proxy Group collect at (954) 527-7678 or by sending a written request to: Franklin Templeton Companies, LLC, 300 S.E. 2nd Street, Fort Lauderdale, FL 33301, Attention: Proxy Group. Copies of the Fund’s proxy voting records are also made available online at franklintempleton.com and posted on the U.S. Securities and Exchange Commission’s website at sec.gov and reflect the most recent 12-month period ended June 30.

TEMPLETON GROWTH FUND, INC.SHAREHOLDER INFORMATION
42 franklintempleton.comAnnual Report
Quarterly Statement of InvestmentsThe Fund files a complete statement of investments with the U.S. Securities and Exchange Commission for the first and third quarters for each fiscal year as an exhibit to its report on Form N-PORT. Shareholders may view the filed Form N-PORT by visiting the Commission’s website at sec.gov. The filed form may also be viewed and copied at the Commission’s Public Reference Room in Washington, DC. Information regarding the operations of the Public Reference Room may be obtained by calling (800) SEC-0330.
Householding of Reports and ProspectusesYou will receive, or receive notice of the availability of, the Fund’s financial reports every six months. In addition, you will receive as an annual updated summary prospectus (detail prospectus available upon request). To reduce Fund expenses, we try to identify related shareholders in a household and send only one copy of the financial reports (to the extent received by mail) and summary prospectus. This process, called “householding,” will continue indefinitely unless you instruct us otherwise. If you prefer not to have these documents householded, please call us at (800)632-2301. At any time you may view current prospectuses/summary prospectuses and financial reports on our website. If you choose, you may receive these documents through electronic delivery.

101 A 10/21© 2021 Franklin Templeton Investments. All rights reserved.
Authorized for distribution only when accompanied or preceded by a summary prospectus and/or prospectus. Investors should carefully consider a fund’s investment goals, risks, charges and expenses before investing. A prospectus contains this and other information; please read it carefully before investing.
To help ensure we provide you with quality service, all calls to and from our service areas are monitored and/or recorded.
Annual Report and Shareholder LetterTempleton Growth Fund, Inc.
Investment Manager Distributor Shareholder ServicesTempleton Global Advisors Limited
Franklin Distributors, LLC(800) DIAL BEN® / 342-5236franklintempleton.com
(800) 632-2301